Embed Size (px)
Citation preview
Supplementary Materials for
Personalized cancer vaccine effectively mobilizes antitumor T cell
immunity in ovarian cancer
Janos L. Tanyi, Sara Bobisse, Eran Ophir, Sandra Tuyaerts, Annalisa Roberti,
Raphael Genolet, Petra Baumgartner, Brian J. Stevenson, Christian Iseli,
Denarda Dangaj, Brian Czerniecki, Aikaterini Semilietof, Julien Racle,
Alexandra Michel, Ioannis Xenarios, Cheryl Chiang, Dimitri S. Monos,
Drew A. Torigian, Harvey L. Nisenbaum, Olivier Michielin, Carl H. June,
Bruce L. Levine, Daniel J. Powell Jr., David Gfeller, Rosemarie Mick, Urania Dafni,
Vincent Zoete, Alexandre Harari, George Coukos, Lana E. Kandalaft*
*Corresponding author. Email: [email protected]
Published 11 April 2018, Sci. Transl. Med. 10, eaao5931 (2018)
DOI: 10.1126/scitranslmed.aao5931
This PDF file includes:
Materials and Methods
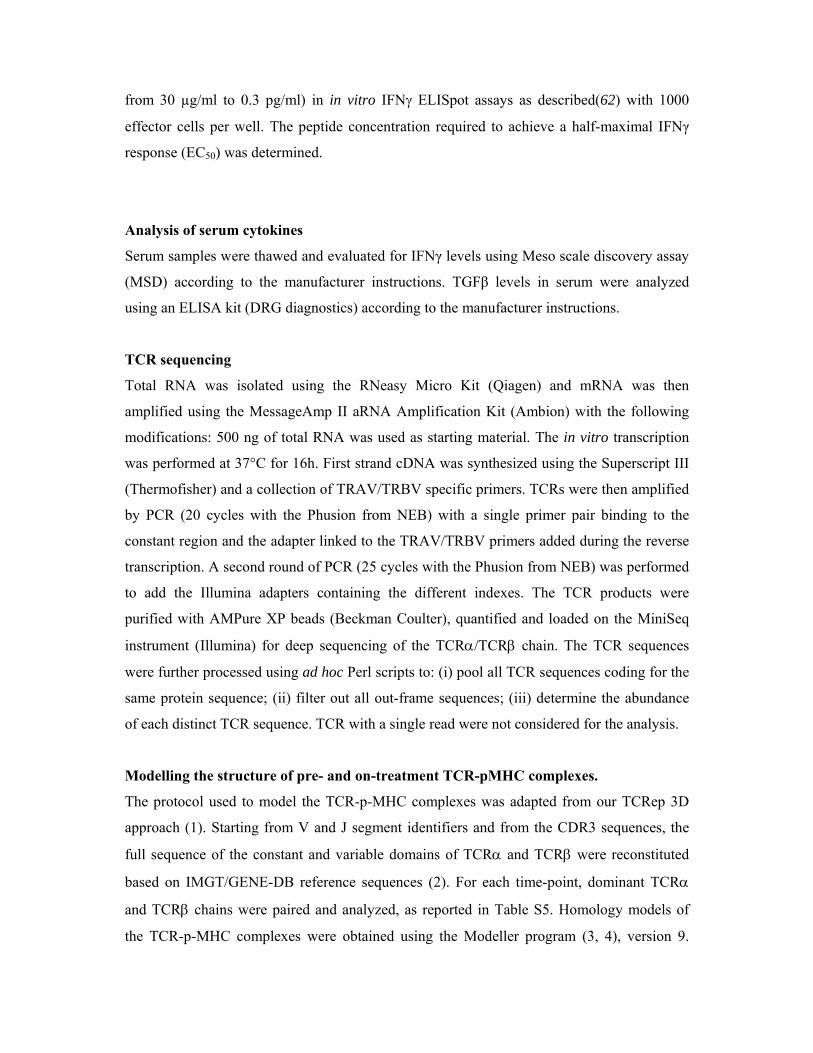
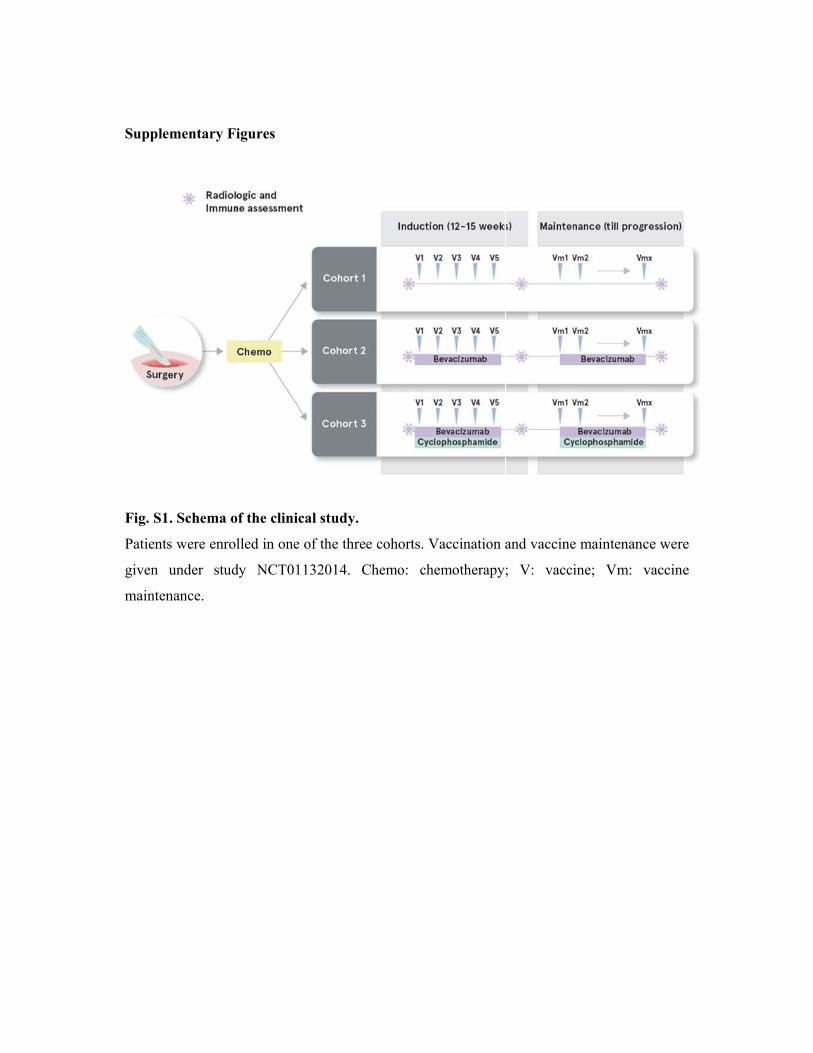
Fig. S1. Schema of the clinical study.
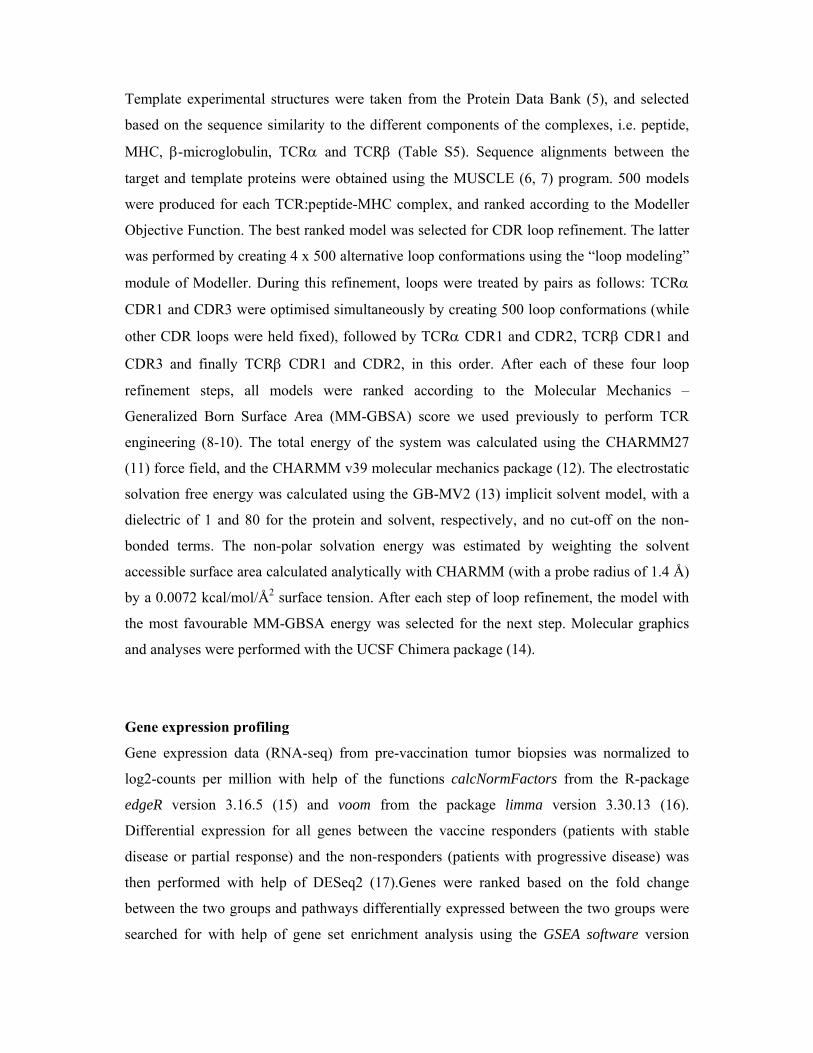
Fig. S2. Analysis of DC vaccine product.
Fig. S3. Immune response in patient CTE-0017.
Fig. S4. Immune competency of patients.
Fig. S5. Clinical response does not depend on prevaccination T cell gene
expression.
Fig. S6. Validation of CD8+ T cell responses against neoepitopes and wild-type
peptides.
Fig. S7. Representative example of the gating strategy applied for intracellular
cytokine staining analyses.
Fig. S8. TCRα V-J segments recombination landscape of sorted HHAT
neoepitope-specific CD8+ T lymphocytes.
Table S1. Adverse events detected in cohorts 1 to 3
Table S2. Comparative parameters in immune responder and nonresponder
patients.
Table S3. Gene set enrichment analysis between clinical responders and
nonresponders does not find immune-related pathways differentiating both groups
of patients before the vaccination.
www.sciencetranslationalmedicine.org/cgi/content/full/10/436/eaao5931/DC1

Table S4. Description of validated HLA class I neoepitopes identified.
Table S5. Protein Data Bank entries used as templates to model the TCRα, TCRβ,
MHC, β-microglobulin, and the peptide epitope.
Table S6. Molecular interactions between the peptide epitope (KQWLVWLFL)
and MHC HLA-A*0206, as predicted by homology modeling.
Table S7. Molecular interactions between the TCR and pMHC, as predicted by
homology modeling.
References (61–66)
Materials and methods
Characterization of OCDC vaccine product
Frozen DC vaccine products from several patients were thawed and directly stained with a
panel of markers to characterize their maturation: CD14-BV510 (Biolegend, 301842),
CD11c-BV711 (BD, 563130), HLA-DR-ECD (BC, IM3636), HLA-A,B,C-PerCP-Cy5.5
(Biolegend, 311420), CD40-BV605 (Biolegend, 334335), CD80-PE-Cy7 (BD, 561135),
CD83-FITC (BC, IM2410), CCR7-APC-Cy7 (Biolegend, 353211) and Zombie UV fixable
Viability Kit (Biolegend, 423108). The samples were acquired at the BD Fortessa instrument,
the data analysed with FlowJo v10.2 and the graphs were done with GraphPad Prism v7.03.
Detection of T-cell responses to whole-tumor antigen
To quantify T-cell responses against whole-tumor antigen, we interrogated peripheral blood
T cells against autologous activated DCs previously pulsed with autologous oxidized tumor
lysate, i.e. cryopreserved OCDC vaccine aliquots. Dissociated autologous tumor cells were
depleted from CD45+ cells using anti-CD45 magnetic cell sorting (Miltenyi) and were also
used as targets in downstream functional assays to activate PBL, when available. Responder
T cells were quantified using IFNγ ELISpot kits (Diaclone), according to the manufacturer's
instructions. In brief, cryopreserved PBMC were thawed and rested overnight in RPMI
supplemented with 8% human serum, (Biowest). Cryopreserved OCDC vaccine aliquots or
dissociated autologous tumor cells were thawed on the following day and plated with
250,000 PBMC per well in 10:1 PBMC/DC ratio or 100,000 PBMC per well in 1:1
PBMC/tumor cell ratio. PBMC used in these assay were freshly thawed cryopreserved cells
and were not expanded in vitro. Twenty-four hours later, the spots were developed and
counted automatically using the Bioreader 6000 (BioSys). Background reactivity was
determined using PBMC plus media alone and was subsequently subtracted in calculating
responding cells. For intracellular cytokine staining, cryopreserved PBMC were thawed and
rested overnight in RPMI supplemented with 8% human serum. Cryopreserved DCs were
thawed on the following day and plated with the PBMC in 1:10 PBMC/DC ratio. Following
co-incubation for 24 hours, ICS was performed as detailed above.
In vitro identification of neo-epitope specific T cells
Candidate neo-epitope peptides with a predicted binding affinity of ≤500 nM, and their wild-
type non-mutant predicted peptides were synthesized (at >90% HPLC purity) at the Protein
and Peptide Chemistry Facility (PPCF), University of Lausanne. Candidate peptides were
screened for T-cell recognition either as pools of ≤50 peptides or individually following
deconvolution of pool peptide reactivities. Cryopreserved PBMCs were thawed and used to
isolate CD3+CD8+ and CD3+CD4+ T cells using Dynabeads FlowComp Human kits
(Invitrogen), according to the manufacturer’s instructions. CD8+ T-cells were co-incubated in
p96-well plates (100,000 per well with ≥ 6 wells per condition) in RPMI supplemented with
8% human serum, (Biowest) with autologous irradiated CD8+- and CD4+-depleted PBMCs
and 1µg/mL of synthetic peptides at 1:1 ratio. Medium was initially supplemented with 20
IU/mL human recombinant interleukin 2 (IL-2, a generous gift by GlaxoSmithKline to Dr.
Daniel Speiser) and replaced after 48 hours with fresh medium containing 100 IU/mL IL-2.
On day 12, expanded T cells were collected and tested for peptide reactivity in standard IFN
Enzyme-Linked ImmunoSpot (ELISpot) and intracellular cytokine staining assays (see
below). Cross-reactivity to wild-type peptides was assessed to define T-cell specificity, and
peptide-MHC multimers were used to confirm specificity and class-I HLA restriction. CD4+
blasts were generated by stimulating isolated CD3+CD4+ T cells in RPMI supplemented with
8% human serum, PHA (1 μg/mL) and IL-2 (150 U/mL), and used as antigen-presenting cells
for T-cell reactivity analysis (61). When larger number of cells were requested, e.g. prior to a
cell sorting with multimers, positive cell cultures were further enriched by multiple
stimulation rounds. T-cell reactivity was validated by ≥ 2 independent experiments.
For IFN ELISpot, to assess the reactivity of T cells against candidate mutant
peptides, in-vitro stimulated CD8+ T cells were plated (0.5-1x10⁵ cells per well) and re-
challenged for 16 hours in triplicates with autologous CD4+ blasts (1:1 ratio) in the presence
of peptide pools or single peptides at a final concentration of 1µg/mL. ELISpot assays were
performed using pre-coated 96-well ELISpot plates (Mabtech), following the manufacturer’s
instructions. Spot-forming units were counted using a Bioreader-6000-E automated counter
(BioSys). Positive conditions were defined as having more spots than negative control wells
(no peptide) plus 3-times the standard deviation.
For intracellular cytokine staining, in-vitro stimulated T cells were plated with
peptide-pulsed autologous CD4+ blasts in a 1:1 ratio and Golgiplug (BD biosciences, USA)
was added 2 hours later to the co-cultures. After 16-18 hours of re-stimulation with
peptide(s), ≥2x10⁶ cells were harvested and stained with anti-CD3, anti-CD8, anti-CD4, anti-
IL-2, anti-TNFα, anti-IFNγ (BD biosciences) and with viability dye (Life technologies). Flow
cytometry was performed using LSR Fortessa (BD biosciences) and analyzed with FlowJo v9
(TreeStar) and SPICE 4.2.3 (developed by Mario Roederer, Vaccine Research Center,
NIAID, NIH), as described elsewhere(62, 63). The number of lymphocyte-gated events
ranged between 105 and 106 in the flow cytometry experiments shown. Background reactivity
was determined using PBMCs plus media alone, and was subsequently subtracted in
calculating responding cells.
In all patients, PBMCs were interrogated after a first round of in vitro stimulation
using peptide pool(s), to assess presence or absence of neo-epitope reactivity. A repeat single
round of in vitro stimulation was performed with fresh PBMCs in order to confirm reactivity
against specific peptides that were part of the original pool(s); to calculate the specific
frequency of neoepitope-specific T cells; and test their cross-reactivity against the wild-type
control peptide(s). For certain tumors, we needed a second round of in vitro stimulation to
confirm flow cytometry experiments (i.e. peptide-MHC multimer binding or intracellular
cytokine staining, both requiring large number of cells) and assessment of cross-reactivity
with native (wild-type) peptides. For assays such as avidity measurements and TCR
sequencing, T cells were sorted after the second round of in vitro stimulation with the
cognate peptide, and expanded as described below. Importantly, quantitative analyses related
to the frequencies of neo-epitope specific CD8 T cells were consistently performed with cells
obtained after one in vitro stimulation.
Assessment of the cytolytic ability of tumor-specific T cells in vitro and in vivo
NOD.Cg-Prkdcscid
Il2rgtm1WjlTg(HLA-A2.1)1Enge/SzJ mice (NSG; Jackson Laboratory) were
bred and maintained under pathogen-free conditions under animal protocols approved by the
Veterinary Service of Canton Vaud. All mice received β-estradiol (8.5 mg/ml) diluted in
drinking water during the course of the experiments. Patient-derived xenografts (PDX) were
generated from 2x10⁶ dissociated tumor cells depleted of human CD45+ cells (Miltenyi) in
25% Matrigel and grafted subcutaneously into NSG mice. PDX tumors were propagated in
mice every 3 months. We generated tumor cell lines for the in vitro killing assays by
dissociating PDX tumors using type IV collagenase (1 mg/mL, Life Technologies), dispase 1
(1 U/ml, STEMCELL Technologies) and Dnase I (10 μg/mL, Sigma) in DMEM with 10%
FBS (Gibco; Life Technologies). Cryopreserved PBMC were thawed and stimulated for 10
days with CD3/CD28 beads (Miltenyi) in 1:1 bead/T-cell ratio in the presence of 150 U/ml
IL-2 (gift of GlaxoSmithKline). For the in vitro 51Cr-release killing assay, autologous tumor
cells were labeled with 51Cr. 1000 51Cr-labeled tumor cells were co-cultured for 4 hours with
CD3/CD28-expanded T cells at the ratios indicated in the figure legend, in the presence or
absence of 20μg/ml of anti-HLA-A,B,C w6/32 blocking antibody (Ebioscience USA). At the
end of the co-culture, supernatant was collected and analyzed for radio-reactivity using
Topcount Instrument (Perkin Elmer, USA). The percent of specific lysis was calculated as:
100× [(experimental-spontaneous release)/(total-spontaneous release)]. To test the in vivo
specificity of the anti-tumor T cells, PDX tumors were resected from the mice, dissociated
enzymatically, and 1x10⁶ dissociated tumor cells were injected subcutaneously into new NSG
mice either alone or together with 7x10⁶ autologous CD3/CD28-expanded T cells. Tumor
dimensions were longitudinally measured with calipers, and tumor volumes calculated as V =
(length × width2)/2, where length is greatest longitudinal diameter and width is greatest
transverse diameter.
Labelling, sorting and expansion of neo-epitope specific T-cells
PE-labeled multimers were manufactured in-house at the Lausanne Ludwig Institute branch
and used for T-cell staining as previously reported(64). Briefly, ≥2x10⁶ T cells were
incubated with multimers for 45 minutes at 4°C, washed, then stained with anti-CD8
antibody (APC, Biolegend), and finally stained for dead-cell exclusion with L/D stain kit
(Life Technologies) according to the manufacturer’s instructions. Multimer-positive cells
were sorted using a FACSAria IIu (Beckton Dickinson; purity >95%) and used for TCR
sequencing immediately after sorting or expanded using a rapid expansion protocol (REP).
To this end, cells were plated in p96-well plates and stimulated with irradiated feeder cells
(PBMC from 2 healthy donors) in RPMI supplemented with 8% human serum, PHA (1
μg/mL) and IL-2 (150 U/mL). Fresh medium was replaced every 2-3 days. At the end of the
REP, the purity of multimer-positive cells was >95%.
Cloning of neo-epitope specific T-cells
Neo-epitope (HHAT) specific CD8 T cells from patient CTE-0013 were sorted by flow
cytometry using PE-labeled multimer (TCmetrix), cloned by limiting dilution and expanded
in RPMI-1640 medium supplemented with 8% human serum, 150 U/mL recombinant human
IL-2, 1 μg/mL phytohemagglutinin (PHA), and irradiated (30 Gy) allogeneic PBMCs as
feeder cells as described (65).
Functional avidity analysis
Peptide stimulations were performed as described above. Functional avidity of neo-epitope-
specific CD8 T-cell responses was assessed by performing limiting peptide dilutions (ranging
from 30 µg/ml to 0.3 pg/ml) in in vitro IFN ELISpot assays as described(62) with 1000
effector cells per well. The peptide concentration required to achieve a half-maximal IFNγ
response (EC50) was determined.
Analysis of serum cytokines
Serum samples were thawed and evaluated for IFNγ levels using Meso scale discovery assay
(MSD) according to the manufacturer instructions. TGFβ levels in serum were analyzed
using an ELISA kit (DRG diagnostics) according to the manufacturer instructions.
TCR sequencing
Total RNA was isolated using the RNeasy Micro Kit (Qiagen) and mRNA was then
amplified using the MessageAmp II aRNA Amplification Kit (Ambion) with the following
modifications: 500 ng of total RNA was used as starting material. The in vitro transcription
was performed at 37°C for 16h. First strand cDNA was synthesized using the Superscript III
(Thermofisher) and a collection of TRAV/TRBV specific primers. TCRs were then amplified
by PCR (20 cycles with the Phusion from NEB) with a single primer pair binding to the
constant region and the adapter linked to the TRAV/TRBV primers added during the reverse
transcription. A second round of PCR (25 cycles with the Phusion from NEB) was performed
to add the Illumina adapters containing the different indexes. The TCR products were
purified with AMPure XP beads (Beckman Coulter), quantified and loaded on the MiniSeq
instrument (Illumina) for deep sequencing of the TCR/TCR chain. The TCR sequences
were further processed using ad hoc Perl scripts to: (i) pool all TCR sequences coding for the
same protein sequence; (ii) filter out all out-frame sequences; (iii) determine the abundance
of each distinct TCR sequence. TCR with a single read were not considered for the analysis.
Modelling the structure of pre- and on-treatment TCR-pMHC complexes.
The protocol used to model the TCR-p-MHC complexes was adapted from our TCRep 3D
approach (1). Starting from V and J segment identifiers and from the CDR3 sequences, the
full sequence of the constant and variable domains of TCR and TCR were reconstituted
based on IMGT/GENE-DB reference sequences (2). For each time-point, dominant TCR
and TCR chains were paired and analyzed, as reported in Table S5. Homology models of
the TCR-p-MHC complexes were obtained using the Modeller program (3, 4), version 9.
Template experimental structures were taken from the Protein Data Bank (5), and selected
based on the sequence similarity to the different components of the complexes, i.e. peptide,
MHC, -microglobulin, TCR and TCR (Table S5). Sequence alignments between the
target and template proteins were obtained using the MUSCLE (6, 7) program. 500 models
were produced for each TCR:peptide-MHC complex, and ranked according to the Modeller
Objective Function. The best ranked model was selected for CDR loop refinement. The latter
was performed by creating 4 x 500 alternative loop conformations using the “loop modeling”
module of Modeller. During this refinement, loops were treated by pairs as follows: TCR
CDR1 and CDR3 were optimised simultaneously by creating 500 loop conformations (while
other CDR loops were held fixed), followed by TCR CDR1 and CDR2, TCR CDR1 and
CDR3 and finally TCR CDR1 and CDR2, in this order. After each of these four loop
refinement steps, all models were ranked according to the Molecular Mechanics –
Generalized Born Surface Area (MM-GBSA) score we used previously to perform TCR
engineering (8-10). The total energy of the system was calculated using the CHARMM27
(11) force field, and the CHARMM v39 molecular mechanics package (12). The electrostatic
solvation free energy was calculated using the GB-MV2 (13) implicit solvent model, with a
dielectric of 1 and 80 for the protein and solvent, respectively, and no cut-off on the non-
bonded terms. The non-polar solvation energy was estimated by weighting the solvent
accessible surface area calculated analytically with CHARMM (with a probe radius of 1.4 Å)
by a 0.0072 kcal/mol/Å2 surface tension. After each step of loop refinement, the model with
the most favourable MM-GBSA energy was selected for the next step. Molecular graphics
and analyses were performed with the UCSF Chimera package (14).
Gene expression profiling
Gene expression data (RNA-seq) from pre-vaccination tumor biopsies was normalized to
log2-counts per million with help of the functions calcNormFactors from the R-package
edgeR version 3.16.5 (15) and voom from the package limma version 3.30.13 (16).
Differential expression for all genes between the vaccine responders (patients with stable
disease or partial response) and the non-responders (patients with progressive disease) was
then performed with help of DESeq2 (17).Genes were ranked based on the fold change
between the two groups and pathways differentially expressed between the two groups were
searched for with help of gene set enrichment analysis using the GSEA software version

3.0(65, 66). All pathways found in the “Canonical pathways” gene sets (version 6.1) were
tested for enrichment and only those with an FDR below 0.1 are reported in Table S3.
Supple
Fig. S1
Patients
given u
mainten
mentary Fi
. Schema o
s were enrol
under stud
nance.
igures
of the clinic
lled in one
dy NCT011
cal study.
of the three
132014. C
e cohorts. V
hemo: che
Vaccination a
emotherapy
and vaccine
; V: vacc
e maintenan
ine; Vm:
nce were
vaccine
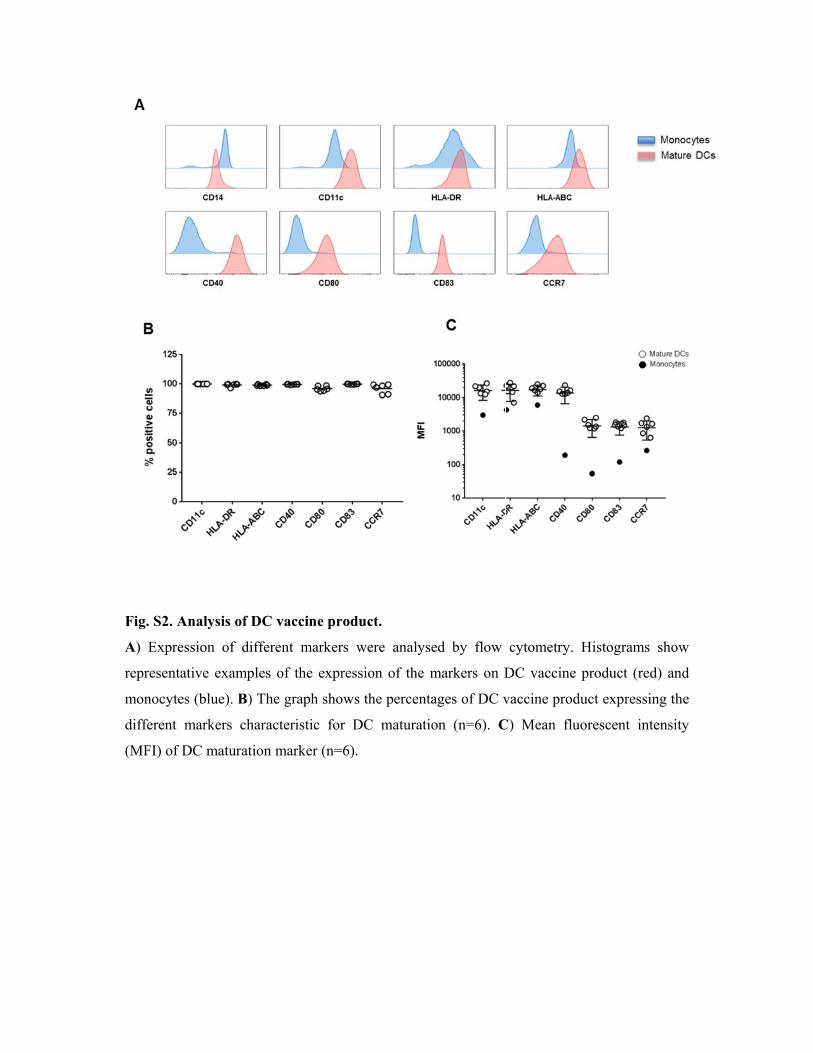
Fig. S2
A) Exp
represen
monocy
differen
(MFI) o
. Analysis o
pression of
ntative exam
ytes (blue).
nt markers
of DC matur
of DC vacc
different m
mples of th
B) The grap
characteris
ration mark
cine produc
markers we
he expressio
ph shows th
stic for DC
ker (n=6).
ct.
ere analysed
on of the m
he percentag
C maturatio
d by flow
markers on D
ges of DC v
n (n=6). C
cytometry.
DC vaccine
vaccine pro
C) Mean flu
Histogram
e product (r
duct expres
uorescent i
ms show
red) and
ssing the
intensity
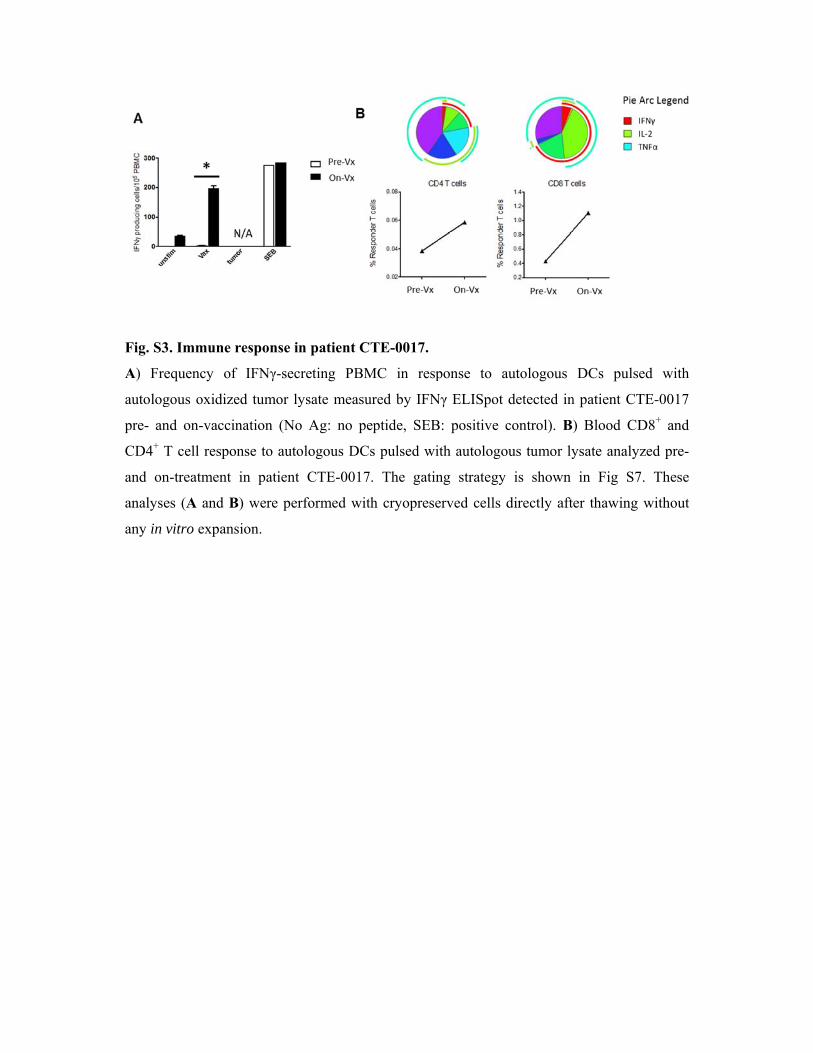
Fig. S3
A) Fre
autolog
pre- an
CD4+ T
and on
analyse
any in v
. Immune r
equency of
gous oxidize
nd on-vaccin
T cell respo
n-treatment
es (A and B
vitro expans
response in
f IFNγ-secr
ed tumor ly
nation (No
nse to auto
in patient
B) were perf
sion.
n patient CT
reting PBM
ysate measu
Ag: no pe
logous DCs
CTE-0017
formed with
TE-0017.
MC in resp
ured by IFN
eptide, SEB
s pulsed wi
. The gatin
h cryoprese
ponse to a
Nγ ELISpot
B: positive c
ith autologo
ng strategy
erved cells
autologous
detected in
control). B
ous tumor ly
y is shown
directly aft
DCs pulse
n patient CT
) Blood CD
ysate analyz
in Fig S7
er thawing
ed with
TE-0017
D8+ and
zed pre-
7. These
without
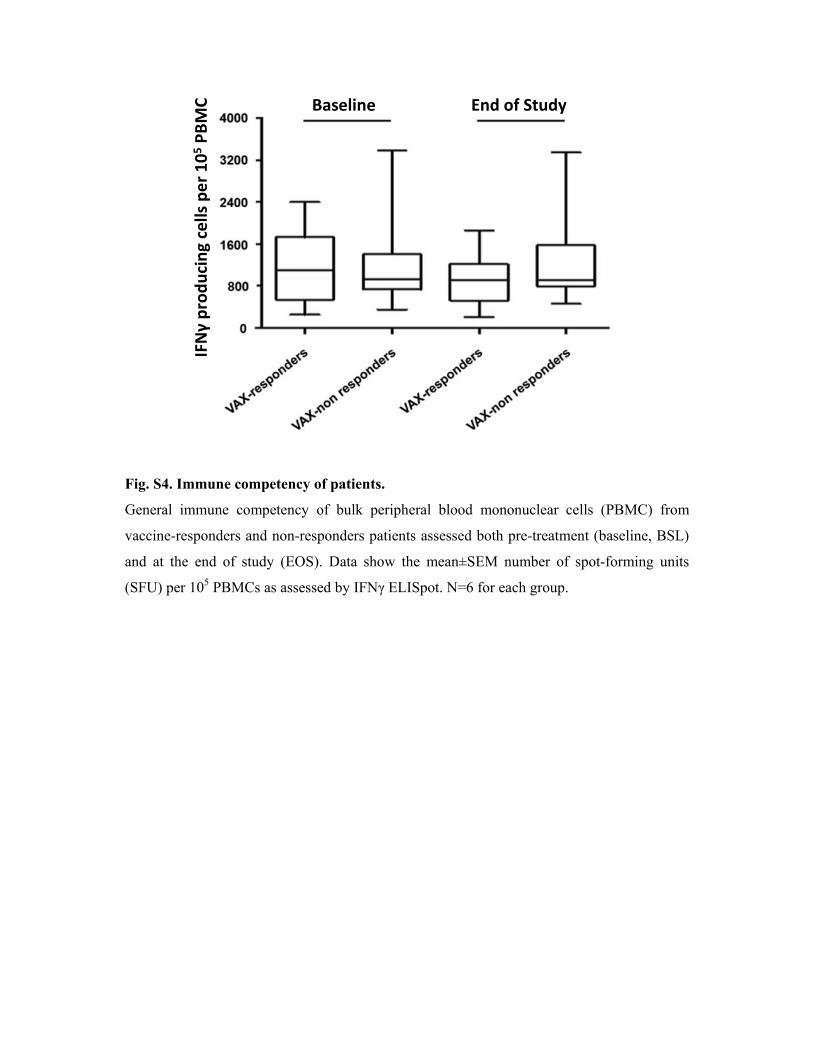
Fig. S4. Immune competency of patients.
General immune competency of bulk peripheral blood mononuclear cells (PBMC) from
vaccine-responders and non-responders patients assessed both pre-treatment (baseline, BSL)
and at the end of study (EOS). Data show the mean±SEM number of spot-forming units
(SFU) per 105 PBMCs as assessed by IFNγ ELISpot. N=6 for each group.
Baseline End of Study
IFNγ producing cells
per 1
05 PBMC
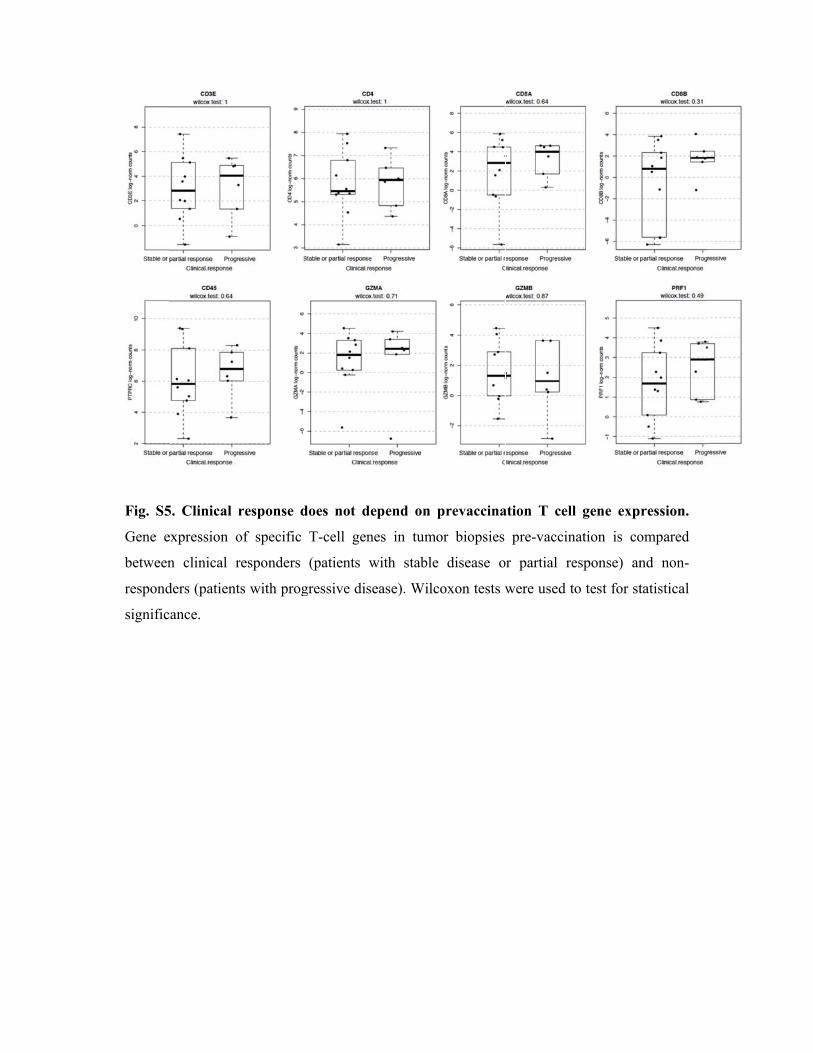
Fig. S5
Gene e
between
respond
signific
5. Clinical
expression o
n clinical r
ders (patient
cance.
response d
of specific
responders
ts with prog
does not de
T-cell gen
(patients w
gressive dis
epend on p
nes in tumo
with stable
sease). Wilc
prevaccina
or biopsies
disease o
coxon tests w
ation T cell
pre-vaccin
r partial re
were used t
l gene exp
nation is co
esponse) an
to test for st
ression.
ompared
nd non-
tatistical
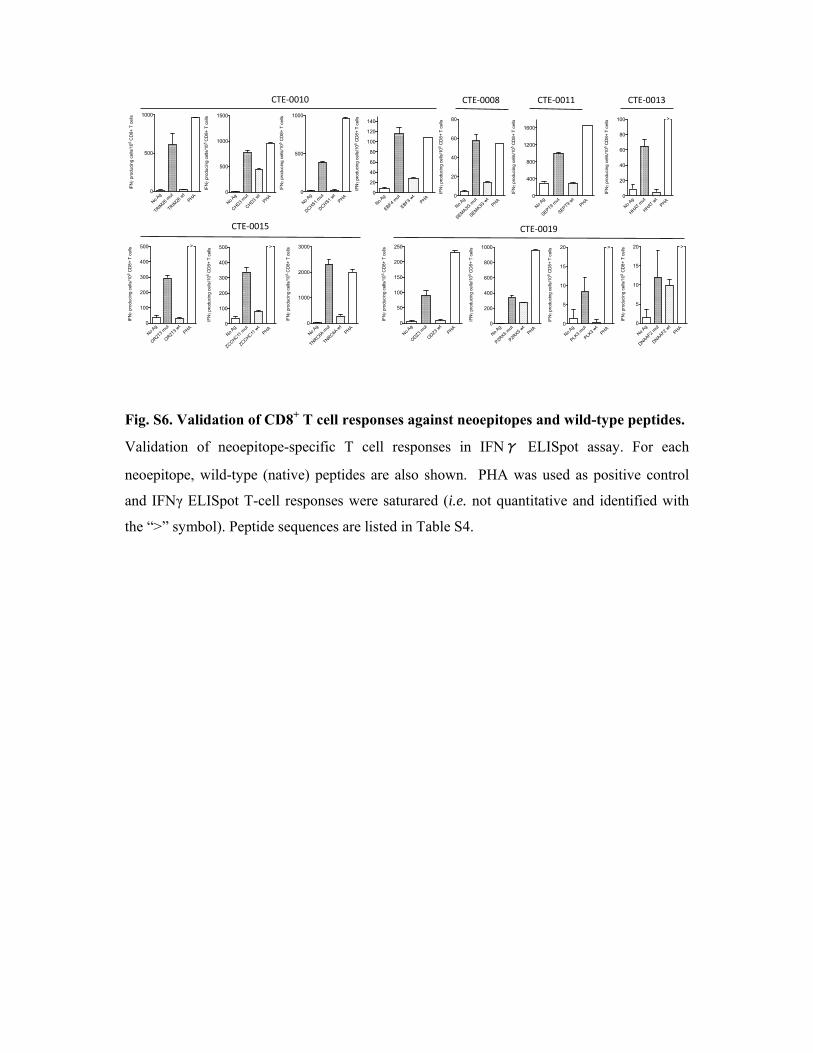
Fig. S6. Validation of CD8+ T cell responses against neoepitopes and wild-type peptides.
Validation of neoepitope-specific T cell responses in IFNγ ELISpot assay. For each
neoepitope, wild-type (native) peptides are also shown. PHA was used as positive control
and IFNγ ELISpot T-cell responses were saturared (i.e. not quantitative and identified with
the “>” symbol). Peptide sequences are listed in Table S4.
No Ag
SEMA3G
mut
SEMA3G
wt
PHA 0
20
40
60
80
IFN
prod
ucin
g ce
lls/1
05 C
D8+
T c
ells
CTE‐0008
No Ag
TRIM26
mut
TRIM26
wt
PHA 0
500
1000
IFN
prod
uci
ng
cells
/10
5 C
D8+
T c
ells
No Ag
CHD3 m
ut
CHD3 wt
PHA 0
500
1000
1500
IFN
prod
uci
ng
cells
/10
5 C
D8+
T c
ells
No Ag
DCHS1 m
ut
DCHS1 wt
PHA 0
500
1000
IFN
prod
ucin
g ce
lls/1
05 C
D8+
T c
ells
No Ag
EBF4 m
ut
EBF4 wt
PHA 0
20
40
60
80
100
120
140
IFN
prod
ucin
g ce
lls/1
05 C
D8
+ T
cel
ls
CTE‐0010
No Ag
OR2T3
mut
OR2T
3 wt
PHA 0
100
200
300
400
500
IFN
prod
ucin
g c
ells
/105
CD
8+
T c
ells
>
No Ag
ZCCHC11 m
ut
ZCCHC11 w
t
PHA 0
100
200
300
400
500
IFN
prod
uci
ng c
ells
/105
CD
8+ T
cel
ls
>
No Ag
TNRC6A m
ut
TNRC6A w
t
PHA 0
1000
2000
3000
IFN
prod
ucin
g ce
lls/1
05 C
D8+
T c
ells
No Ag
SEPT9 m
ut
SEPT9 wt
PHA 0
400
800
1200
1600
IFN
prod
ucin
g ce
lls/1
05 C
D8
+ T
cel
ls
CTE‐0011
No Ag
HHAT m
ut
HHAT wt
PHA 0
20
40
60
80
100
IFN
prod
ucin
g c
ells
/105
CD
8+
T c
ells
>
CTE‐0013
CTE‐0015 CTE‐0019
No Ag
ODZ3 m
ut
ODZ3 wt
PHA 0
50
100
150
200
250
IFN
pro
duci
ng c
ells
/10
5 C
D8+
T c
ells
No Ag
P2RX5
mut
P2RX5
wt
PHA 0
200
400
600
800
1000
IFN
prod
ucin
g ce
lls/1
05
CD
8+ T
cel
ls
No Ag
PLK3
mut
PLK3
wt
PHA 0
5
10
15
20
IFN
prod
ucin
g ce
lls/1
05 C
D8+
T c
ells >
No Ag
DNAAF2 m
ut
DNAAF2 wt
PHA 0
5
10
15
20
IFN
prod
ucin
g ce
lls/1
05 C
D8
+ T
cel
ls >
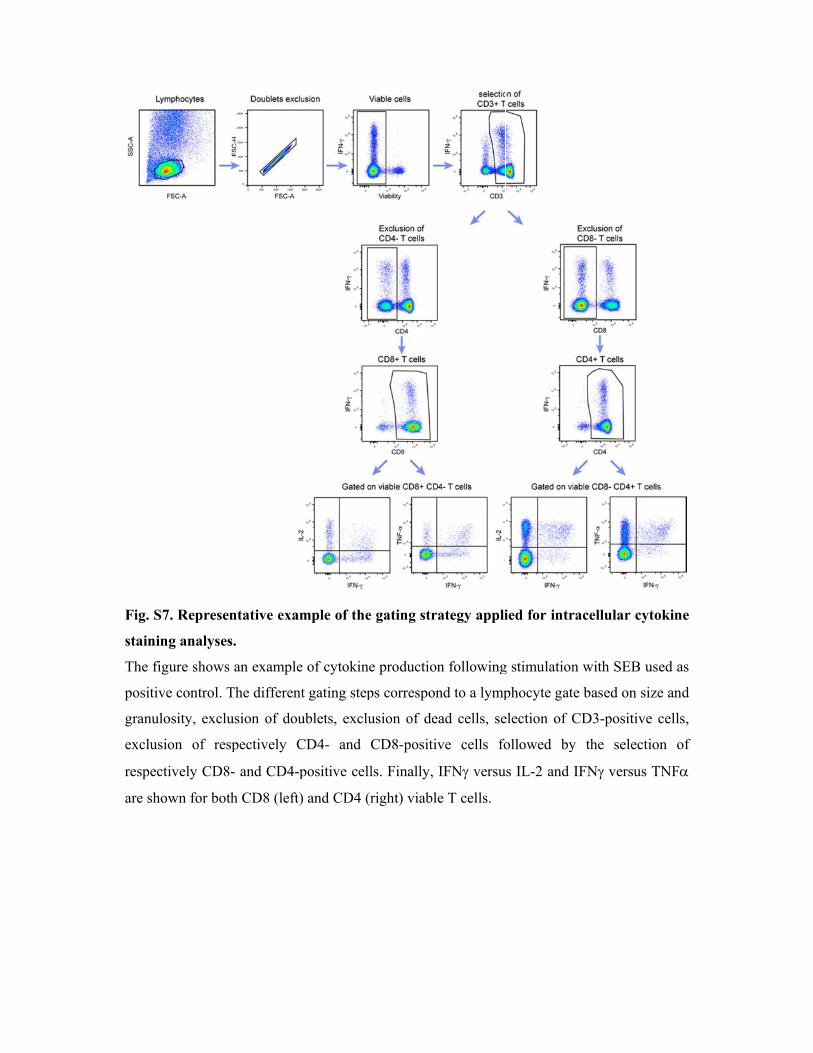
Fig. S7
staining
The figu
positive
granulo
exclusio
respecti
are show
. Represen
g analyses.
ure shows a
e control. Th
osity, exclus
on of resp
ively CD8-
wn for both
ntative exam
an example
he different
sion of dou
pectively C
and CD4-p
h CD8 (left)
mple of the
of cytokine
t gating step
ublets, exclu
CD4- and C
positive cell
and CD4 (r
e gating stra
e production
ps correspon
usion of de
CD8-positiv
ls. Finally,
right) viable
ategy appli
n following
nd to a lymp
ad cells, se
ve cells fo
IFN versu
e T cells.
ied for intr
g stimulation
phocyte gat
election of C
ollowed by
us IL-2 and
racellular c
n with SEB
te based on
CD3-positiv
y the selec
IFN versu
cytokine
used as
size and
ve cells,
ction of
us TNF
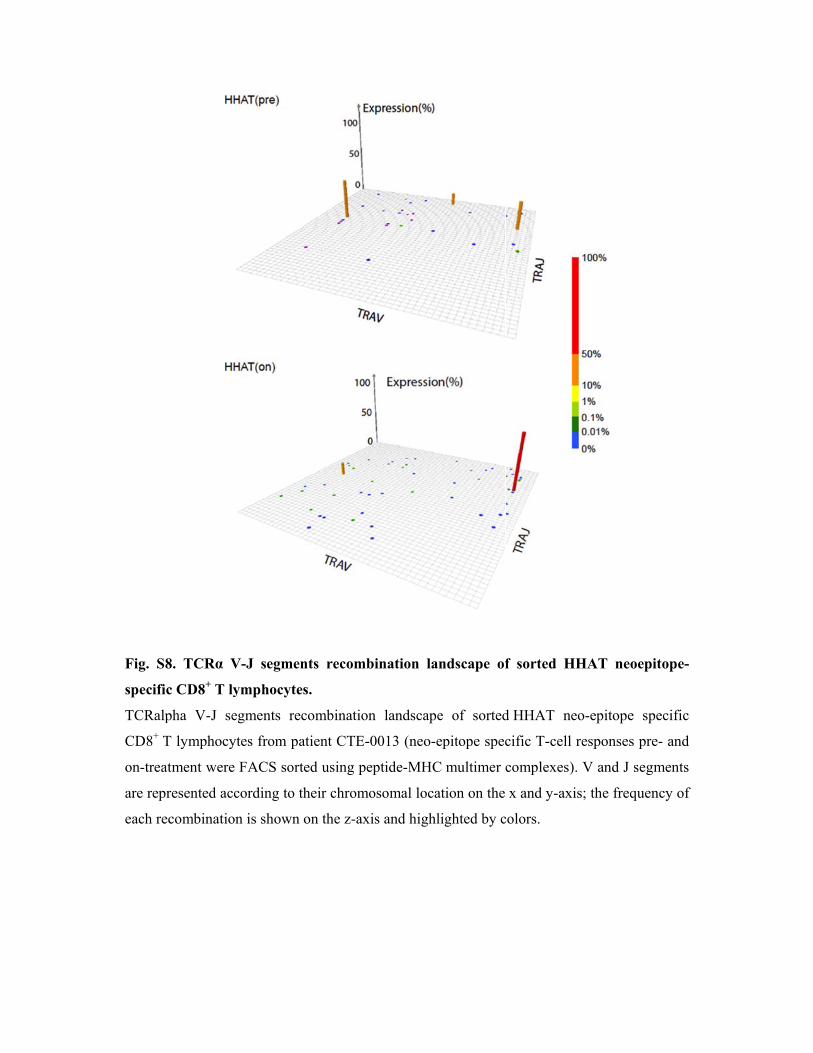
Fig. S8
specific
TCRalp
CD8+ T
on-treat
are repr
each rec
8. TCRα V
c CD8+ T ly
pha V-J se
T lymphocyt
tment were
resented acc
combination
V-J segmen
ymphocytes
egments rec
tes from pa
FACS sort
cording to th
n is shown
nts recomb
s.
combination
atient CTE-0
ed using pe
heir chromo
on the z-axi
bination la
n landscape
0013 (neo-e
eptide-MHC
osomal loca
is and highl
ndscape of
e of sorted
epitope spec
C multimer c
ation on the
lighted by c
f sorted H
d HHAT ne
cific T-cell
complexes)
x and y-ax
colors.
HHAT neoe
eo-epitope
responses p
). V and J se
is; the frequ
epitope-
specific
pre- and
egments
uency of
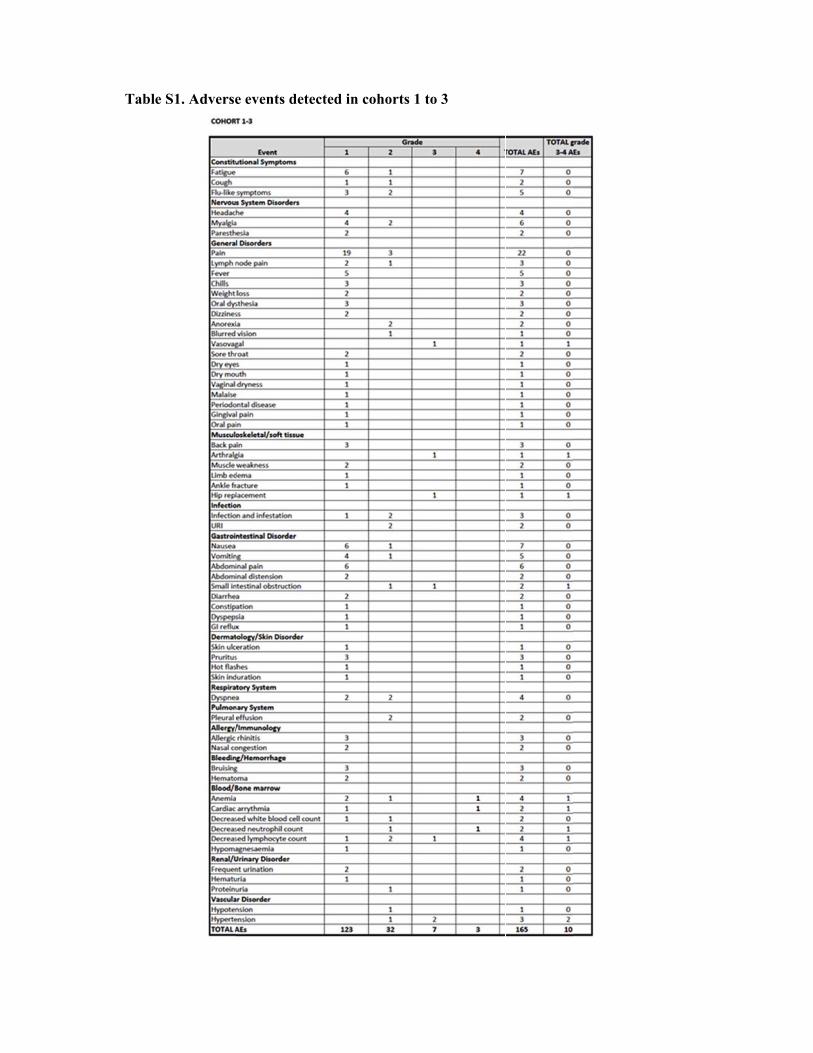
Table SS1. Adversee events detected in coohorts 1 to 3
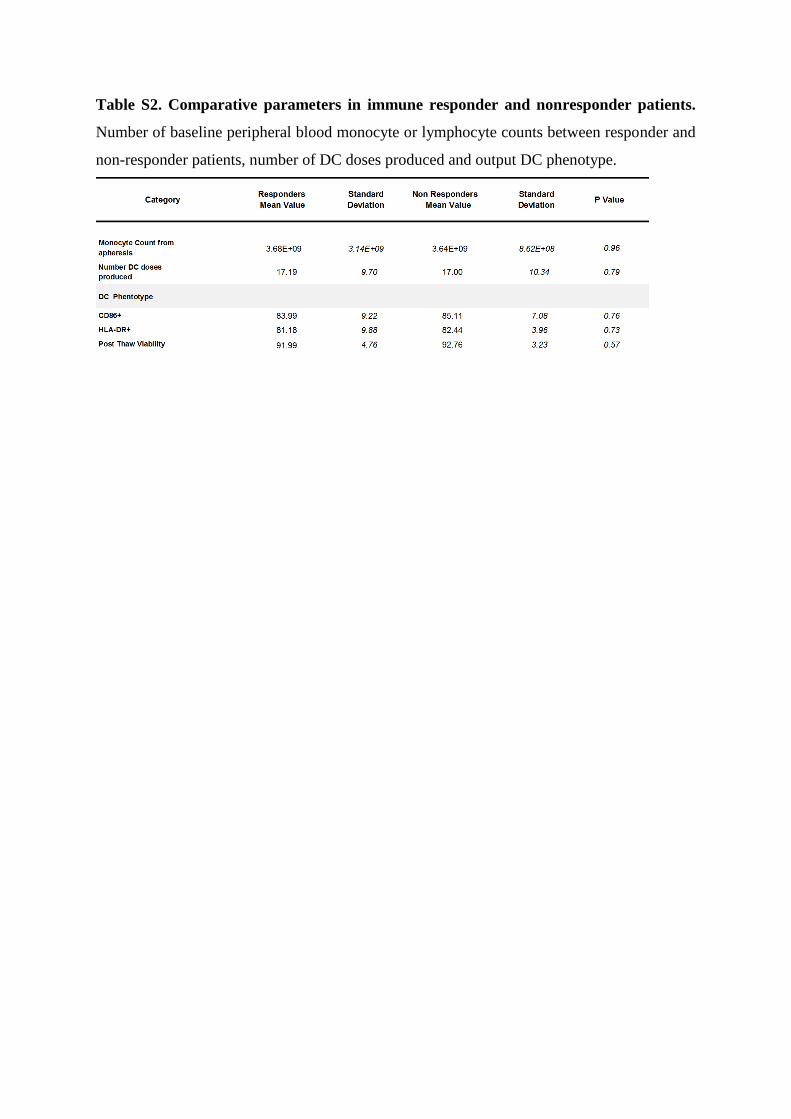
Table S2. Comparative parameters in immune responder and nonresponder patients.
Number of baseline peripheral blood monocyte or lymphocyte counts between responder and
non-responder patients, number of DC doses produced and output DC phenotype.
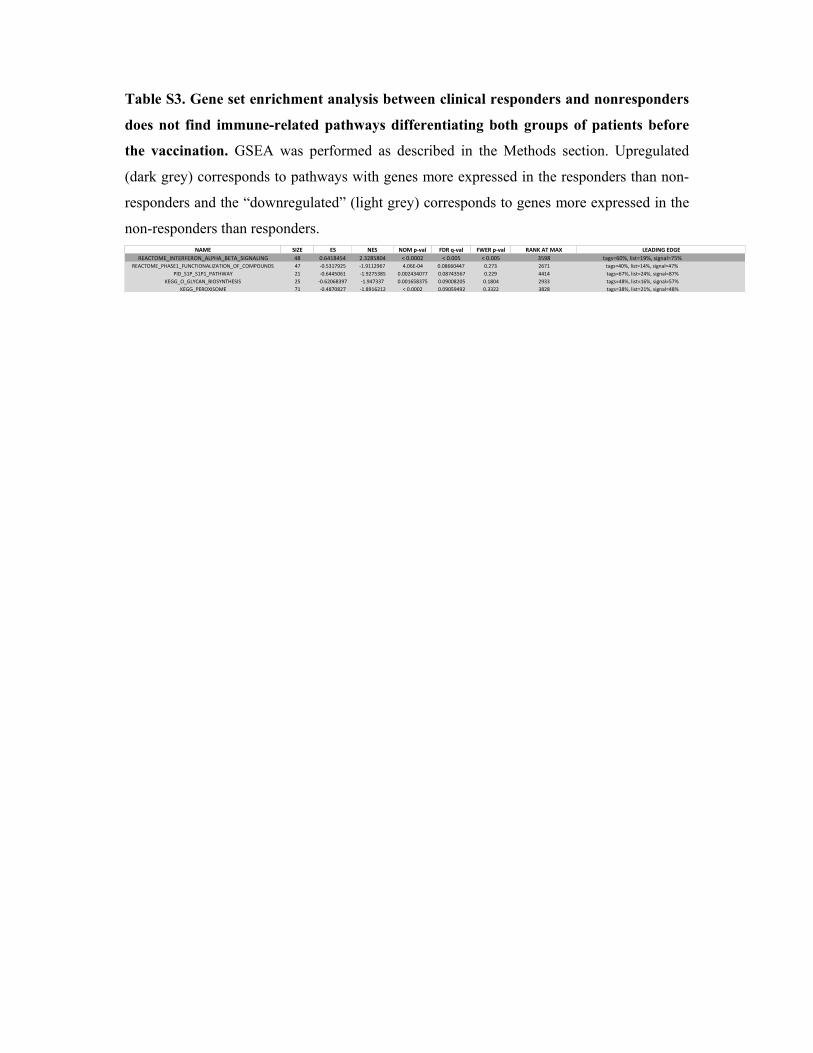
Table S3. Gene set enrichment analysis between clinical responders and nonresponders
does not find immune-related pathways differentiating both groups of patients before
the vaccination. GSEA was performed as described in the Methods section. Upregulated
(dark grey) corresponds to pathways with genes more expressed in the responders than non-
responders and the “downregulated” (light grey) corresponds to genes more expressed in the
non-responders than responders.
NAME SIZE ES NES NOM p‐val FDR q‐val FWER p‐val RANK AT MAX
REACTOME_INTERFERON_ALPHA_BETA_SIGNALING 48 0.6418454 2.3285804 < 0.0002 < 0.005 < 0.005 3598 tags=60%, list=19%, signal=75%REACTOME_PHASE1_FUNCTIONALIZATION_OF_COMPOUNDS 47 ‐0.5317925 ‐1.9112967 4.06E‐04 0.08660447 0.273 2671 tags=40%, list=14%, signal=47%
PID_S1P_S1P1_PATHWAY 21 ‐0.6445061 ‐1.9275385 0.002434077 0.08743567 0.229 4414 tags=67%, list=24%, signal=87%KEGG_O_GLYCAN_BIOSYNTHESIS 25 ‐0.62068397 ‐1.947337 0.001658375 0.09008205 0.1804 2933 tags=48%, list=16%, signal=57%
KEGG_PEROXISOME 71 ‐0.4870827 ‐1.8916212 < 0.0002 0.09059492 0.3322 3828 tags=38%, list=21%, signal=48%
LEADING EDGE
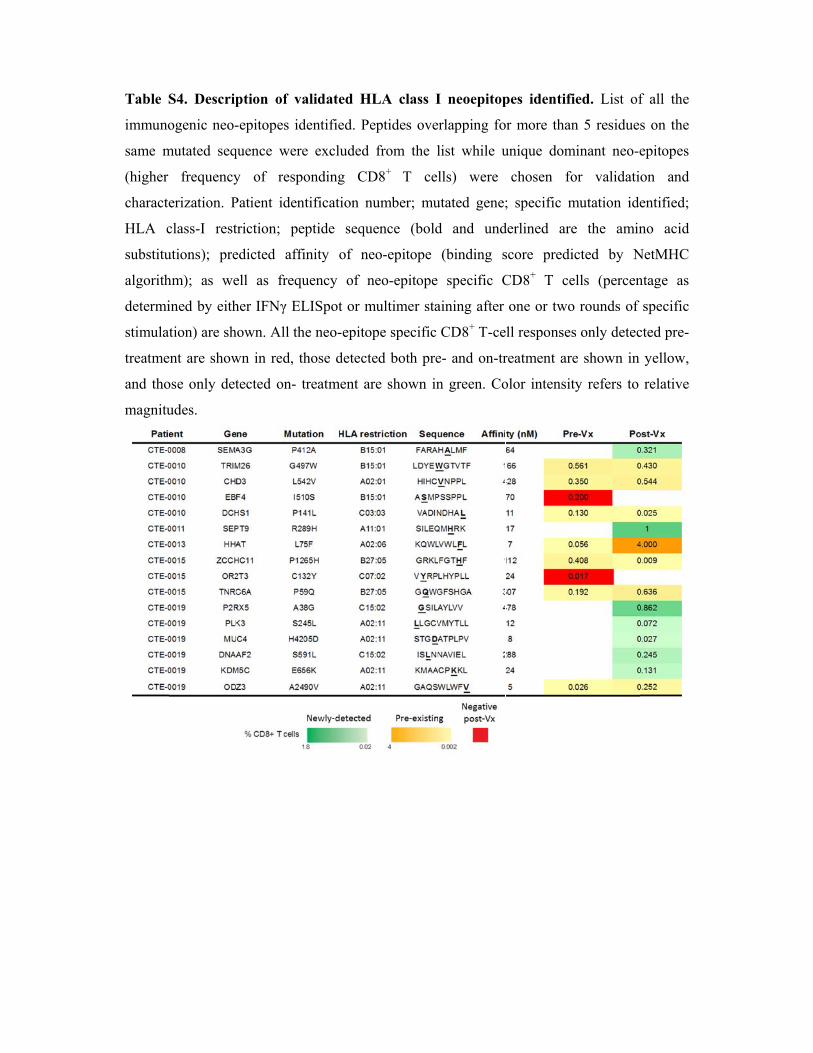
Table S
immuno
same m
(higher
characte
HLA c
substitu
algorith
determi
stimulat
treatme
and tho
magnitu
S4. Descrip
ogenic neo-
mutated seq
frequency
erization. P
class-I rest
utions); pre
hm); as we
ined by eith
tion) are sh
ent are show
ose only det
udes.
ption of va
-epitopes id
quence were
y of respo
Patient iden
triction; pe
edicted affi
ell as frequ
her IFNγ EL
hown. All th
wn in red, th
tected on- t
alidated H
dentified. Pe
e excluded
onding CD
ntification n
eptide sequ
inity of ne
uency of n
LISpot or m
he neo-epito
hose detect
treatment ar
HLA class I
eptides ove
from the l
D8+ T cel
number; mu
uence (bold
eo-epitope
neo-epitope
multimer sta
ope specific
ted both pre
re shown in
I neoepitop
rlapping fo
list while u
lls) were
utated gene;
d and und
(binding s
specific C
aining after
CD8+ T-ce
e- and on-tr
n green. Co
pes identifi
or more than
unique dom
chosen fo
; specific m
derlined are
score predi
CD8+ T ce
one or two
ell responses
reatment are
olor intensit
ied. List of
n 5 residue
minant neo-e
or validati
mutation ide
e the amin
icted by N
ells (percen
o rounds of
s only detec
e shown in
ty refers to
f all the
s on the
epitopes
on and
entified;
no acid
NetMHC
ntage as
specific
cted pre-
yellow,
relative
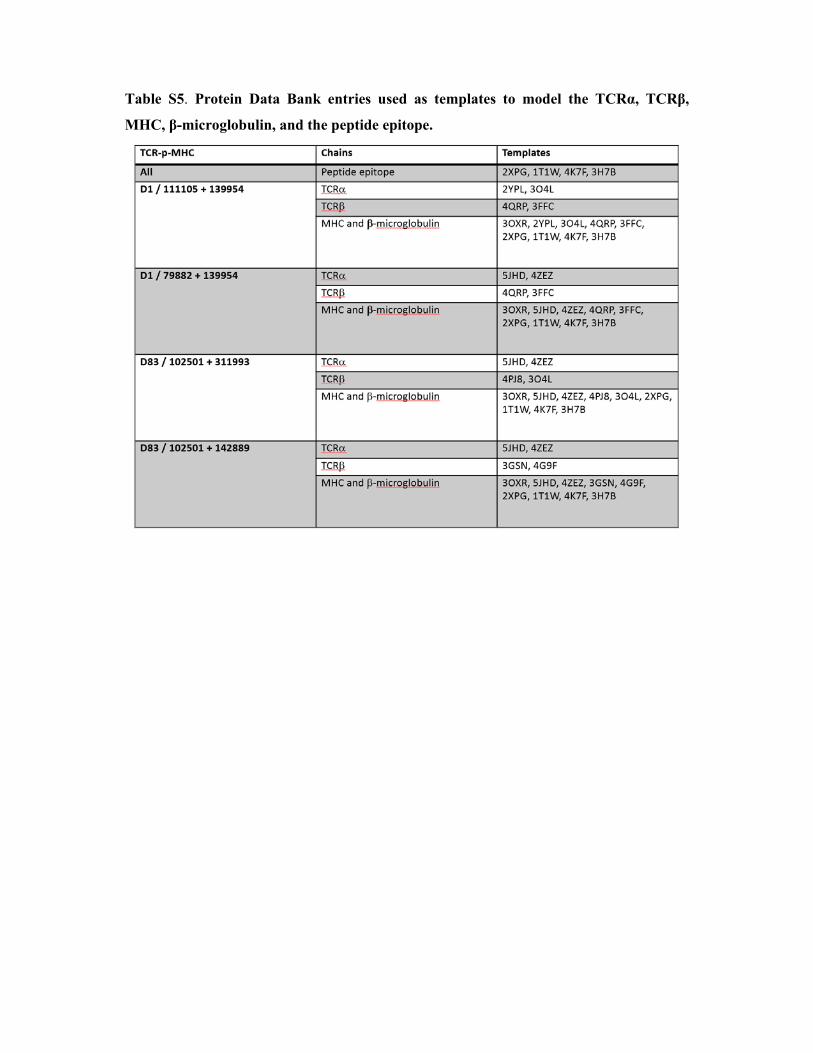
Table S5. Protein Data Bank entries used as templates to model the TCRα, TCRβ,
MHC, β-microglobulin, and the peptide epitope.
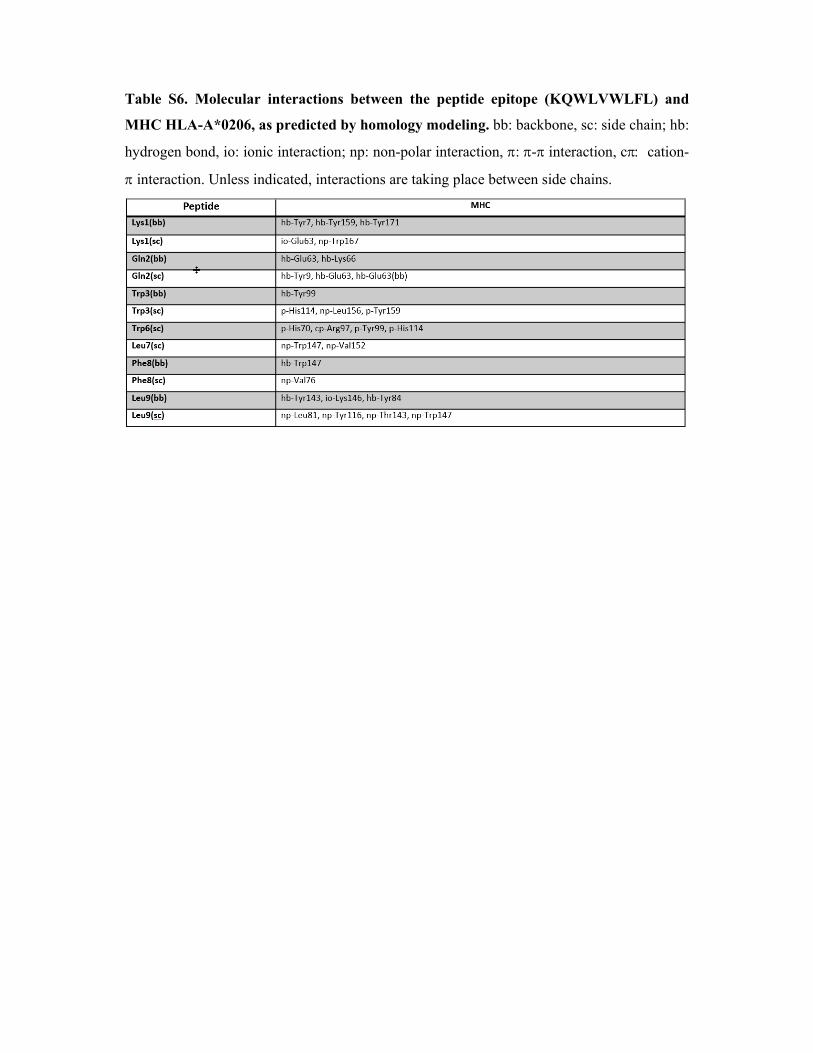
Table S6. Molecular interactions between the peptide epitope (KQWLVWLFL) and
MHC HLA-A*0206, as predicted by homology modeling. bb: backbone, sc: side chain; hb:
hydrogen bond, io: ionic interaction; np: non-polar interaction, :-interaction, c cation-
interaction. Unless indicated, interactions are taking place between side chains.
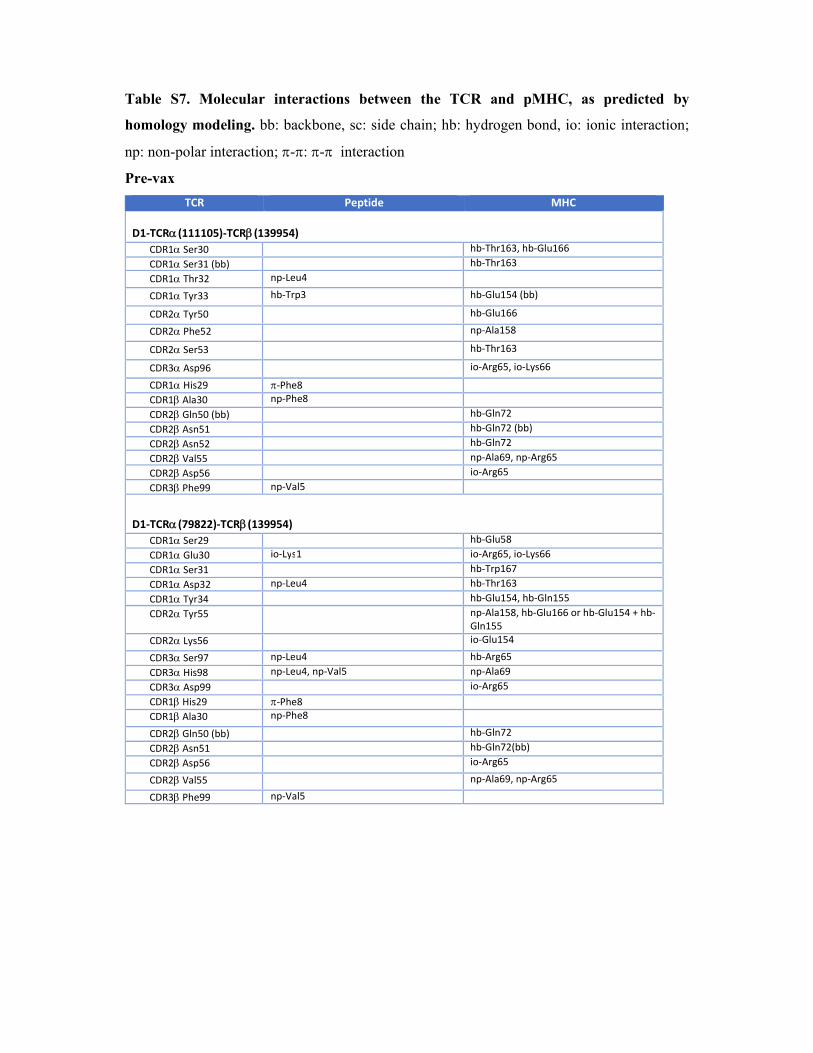
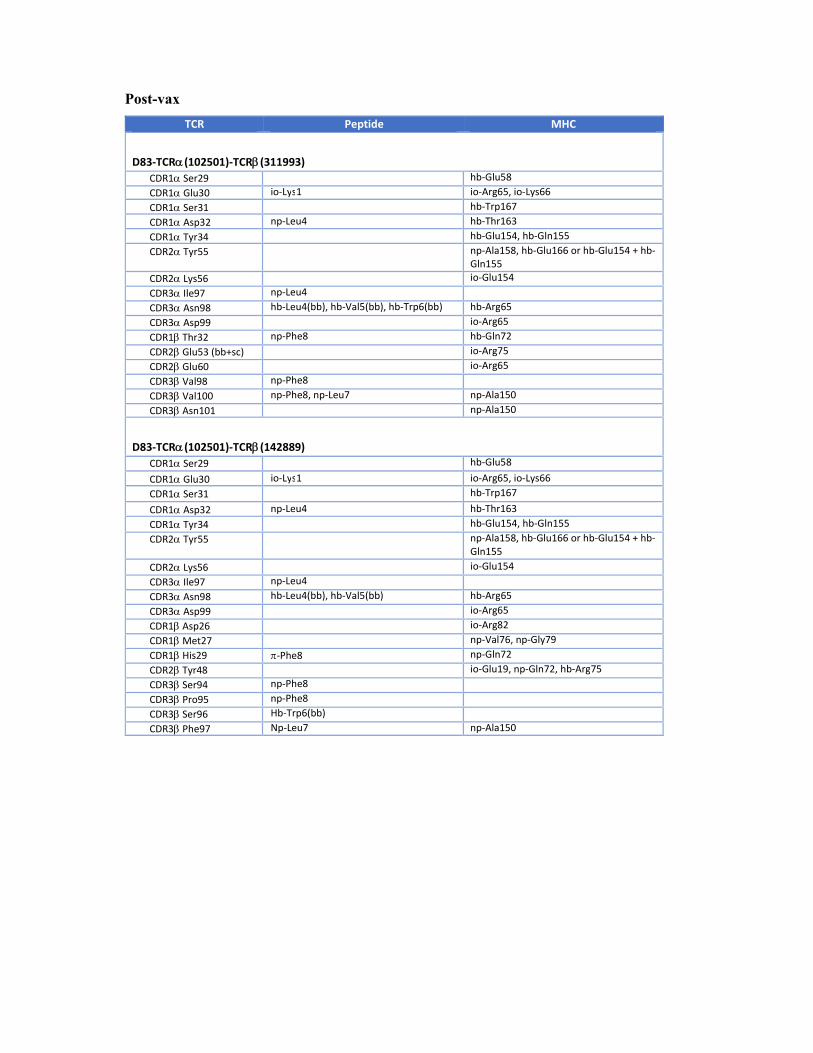
Table S7. Molecular interactions between the TCR and pMHC, as predicted by
homology modeling. bb: backbone, sc: side chain; hb: hydrogen bond, io: ionic interaction;
np: non-polar interaction; -: - interaction
Pre-vax
TCR Peptide MHC
D1‐TCR(111105)‐TCR(139954) CDR1 Ser30 hb‐Thr163, hb‐Glu166 CDR1 Ser31 (bb) hb‐Thr163 CDR1 Thr32 np‐Leu4
CDR1 Tyr33 hb‐Trp3 hb‐Glu154 (bb)
CDR2 Tyr50 hb‐Glu166
CDR2 Phe52 np‐Ala158
CDR2 Ser53 hb‐Thr163
CDR3 Asp96 io‐Arg65, io‐Lys66
CDR1 His29 ‐Phe8 CDR1 Ala30 np‐Phe8 CDR2 Gln50 (bb) hb‐Gln72 CDR2 Asn51 hb‐Gln72 (bb) CDR2 Asn52 hb‐Gln72 CDR2 Val55 np‐Ala69, np‐Arg65 CDR2 Asp56 io‐Arg65 CDR3 Phe99 np‐Val5
D1‐TCR(79822)‐TCR(139954) CDR1 Ser29 hb‐Glu58 CDR1 Glu30 io‐Lys1 io‐Arg65, io‐Lys66 CDR1 Ser31 hb‐Trp167 CDR1 Asp32 np‐Leu4 hb‐Thr163 CDR1 Tyr34 hb‐Glu154, hb‐Gln155 CDR2 Tyr55 np‐Ala158, hb‐Glu166 or hb‐Glu154 + hb‐
Gln155 CDR2 Lys56 io‐Glu154
CDR3 Ser97 np‐Leu4 hb‐Arg65 CDR3 His98 np‐Leu4, np‐Val5 np‐Ala69 CDR3 Asp99 io‐Arg65 CDR1 His29 ‐Phe8 CDR1 Ala30 np‐Phe8
CDR2 Gln50 (bb) hb‐Gln72 CDR2 Asn51 hb‐Gln72(bb) CDR2 Asp56 io‐Arg65
CDR2 Val55 np‐Ala69, np‐Arg65
CDR3 Phe99 np‐Val5
Post-vax
TCR Peptide MHC
D83‐TCR(102501)‐TCR(311993) CDR1 Ser29 hb‐Glu58 CDR1 Glu30 io‐Lys1 io‐Arg65, io‐Lys66 CDR1 Ser31 hb‐Trp167 CDR1 Asp32 np‐Leu4 hb‐Thr163 CDR1 Tyr34 hb‐Glu154, hb‐Gln155 CDR2 Tyr55 np‐Ala158, hb‐Glu166 or hb‐Glu154 + hb‐
Gln155 CDR2 Lys56 io‐Glu154 CDR3 Ile97 np‐Leu4 CDR3 Asn98 hb‐Leu4(bb), hb‐Val5(bb), hb‐Trp6(bb) hb‐Arg65 CDR3 Asp99 io‐Arg65 CDR1 Thr32 np‐Phe8 hb‐Gln72 CDR2 Glu53 (bb+sc) io‐Arg75 CDR2 Glu60 io‐Arg65 CDR3 Val98 np‐Phe8 CDR3 Val100 np‐Phe8, np‐Leu7 np‐Ala150 CDR3 Asn101 np‐Ala150
D83‐TCR(102501)‐TCR(142889) CDR1 Ser29 hb‐Glu58 CDR1 Glu30 io‐Lys1 io‐Arg65, io‐Lys66 CDR1 Ser31 hb‐Trp167 CDR1 Asp32 np‐Leu4 hb‐Thr163 CDR1 Tyr34 hb‐Glu154, hb‐Gln155 CDR2 Tyr55 np‐Ala158, hb‐Glu166 or hb‐Glu154 + hb‐
Gln155 CDR2 Lys56 io‐Glu154 CDR3 Ile97 np‐Leu4 CDR3 Asn98 hb‐Leu4(bb), hb‐Val5(bb) hb‐Arg65 CDR3 Asp99 io‐Arg65 CDR1 Asp26 io‐Arg82 CDR1 Met27 np‐Val76, np‐Gly79 CDR1 His29 ‐Phe8 np‐Gln72 CDR2 Tyr48 io‐Glu19, np‐Gln72, hb‐Arg75 CDR3 Ser94 np‐Phe8 CDR3 Pro95 np‐Phe8 CDR3 Ser96 Hb‐Trp6(bb) CDR3 Phe97 Np‐Leu7 np‐Ala150