Embed Size (px)
Citation preview

www.sciencemag.org/cgi/content/full/science.1255904/DC1
Supplementary Materials for
Immune dysregulation in human subjects with heterozygous germline
mutations in CTLA4
Hye Sun Kuehn, Weiming Ouyang, Bernice Lo, Elissa K. Deenick, Julie E. Niemela, Danielle T. Avery, Jean-Nicolas Schickel, Dat Q. Tran, Jennifer Stoddard, Yu Zhang,
David M. Frucht, Bogdan Dumitriu, Phillip Scheinberg, Les R. Folio, Cathleen A. Frein, Susan Price, Christopher Koh, Theo Heller, Christine M. Seroogy, Anna Huttenlocher, V. Koneti Rao, Helen C. Su, David Kleiner, Luigi D. Notarangelo, Yajesh Rampertaap,
Kenneth N. Olivier, Joshua McElwee, Jason Hughes, Stefania Pittaluga, Joao B. Oliveira, Eric Meffre, Thomas A. Fleisher,* Steven M. Holland, Michael J. Lenardo,* Stuart G. Tangye,
Gulbu Uzel* *Corresponding author. E-mail: [email protected] (T.A.F.); [email protected] (M.J.L.); [email protected] (G.U.)
Published 11 September 2014 on Science Express DOI: 10.1126/science.1255904
This PDF file includes: Materials and Methods
Supplementary Text
Figs. S1 to S10
Tables S1 to S3
References

2
Materials and Methods Human subjects and therapy
All patients or their guardians provided informed consent in accordance with the Declaration of Helsinki under institutional review board−approved protocols of the National Institute of Allergy and Infectious Diseases. Blood from healthy donors and patients was obtained under approved protocols, which also allow for the collection and use of patients’ family history and pedigrees for publication. All procedures were based on standard of care and established clinical guidelines were followed.
Histology From each patient the available histological material and immunohistochemical
stains were reviewed. All biopsies were fixed in formalin and paraffin embedded, after deparaffinization, the slides were stained with the following monoclonal antibodies against CD20, CD3, CD4 and CD8 (Dakoa, Carpinteria, CA) using an automated system as previously described (29). The diagnostic panel for classical Hodgkin lymphoma included also CD30, CD15, PAX-5 and EBV by in situ hybridization.
DNA Sequencing Genomic DNA was extracted from peripheral blood and was submitted to either of
the following methods 1) whole exome capture (Agilent SureSelect 38 Mbp) followed by SOLiD next-generation sequencing (Life technologies); or 2) whole exome capture (SureSelect Human All Exon 50Mb Kit, Agilent Technologies) followed by HiSeq next-generation sequencing (Illumina). DNA sequencing of CTLA4 by the Sanger method was performed to confirm all variants detected by whole exome sequencing and to screen family members and an initial cohort of 23 patients (selected based on hypogammaglobulinemia, CD4 lymphopenia, and infiltration of at least one non-lymphoid organ [brain, lungs and gastrointestinal tract] with lymphocytic aggregates). The Sanger sequencing was carried out using purified PCR products amplified by CTLA4-exon specific primers and GoTaq Hot Start Polymerase (Promega); PCR products were directly sequenced using BigDye Terminators (version 1.1) and analyzed on a 3130xL Genetic Analyzer (Applied Biosystems).
Bioinformatics analysis of whole exome sequencing data Reads with an average coverage of 50 to 100-fold were mapped to the hg19 human
genome reference using the Burrows-Wheeler Aligner with default parameters. The alignment was subjected to GATK base quality score recalibration and indel realignment; followed by SNP and INDEL discovery and genotyping using the GATK Unified Genotyper and VCFtools with standard hard filtering parameters (qual>30; depth>30; RMS mapping quality-Phred score>20; variant confidence/quality by depth>5) (30,31). To prioritize genetic variants, we implemented tools in the ANNOVAR package (32), including gene/amino acid annotation, functional prediction scores (SIFT, PolyPhen, LRT, MutationTaster), conservation scores (PhyloP and GERP++), and allele frequencies per the NCBI dbSNP database, The 1000 Genomes Project, and the NHLBI GO Exome Sequencing Project (ESP5400). Only novel non-synonymous, nonsense, indel, and splicing variants were considered further. Variants in segmental duplication regions were

3
also excluded. Exomic variants were finally prioritized based on clinical correlation. We used Genedistiller 2 (33) to highlight genes associated with immune response and molecular function.
All of the CTLA4 variants in this report are absent from the SNP databases, including the NCBI dbSNP 138 database, the 1000 Genomes Project, and the NHLBI GO Exome Sequencing Project (ESP5400). Moreover, there are no known naturally occurring null, nonsense, frameshift, or splice variants in human CTLA4.
CTLA4, despite harboring one coding site that may be subject to positive selection (rs231775), has fewer nonsynonymous substitutions compared to synonymous substitutions (dN/dS < 1) indicating that, like other T cell regulatory genes, it evolved under purifying selection (34). Although there are twelve nonsynonymous SNPs (table 3S), only one of these [rs231775, CTLA4 c.49A>G, p.T17A; MAF G=0.45] is common. This SNP has been reported to be a complex disease susceptibility variant associated with either susceptibility to thyroid-associated orbitopathy, or systemic lupus erythematosus, insulin dependent diabetes mellitus, and celiac disease. Nonetheless, nucleotide conservation scores for this SNP are low (GERP=-2.84, PhyloP=-0.514, SiPhy=4.36) and all of the functional algorithms in our analysis predict this variant to be tolerated. We have identified 3 healthy controls among our known laboratory donors carrying this SNP (c.49A>G, p.T17A). None of these controls have the multi-system autoimmunity characteristic of the CTLA-4 haplo-insufficient patients described in our manuscript. Expression of CTLA-4 in Treg cells and proliferation by T cells from these controls is comparable to our other controls (fig. S9).
The eleven other missense SNPs of the coding sequence are rare or of unknown frequency. Some of these SNPs have relatively higher nucleotide conservation scores, but they are mostly predicted to be tolerated. In order to biochemically verify that these are benign as predicted, we have made constructs of tagged versions of CTLA4 encoded by the variant alleles to asses CTLA-4 expression and T cell function. All 12 single nucleotide variants’ expression and T cell function was almost same as in wild type control, suggesting that 12 SNPs are biochemically benign as predicted (fig. S10).
Common noncoding SNPs have also been described to be complex disease susceptibility variants, including the following: 1) NM_001037631.2 c.*1421G>A (3'UTR, dbSNP rs3087243, MAF A=0.32), which has been associated with susceptibility to Grave's Disease, Hashimoto thyroiditis, and celiac disease; and 2) NC_000002.12 g.203829153G>T (dbSNP rs231735, MAF G=0.40), which has been associated with rheumatoid arthritis and allergic rhinitis. It is noteworthy that SNP association studies have produced conflicting results, and selection of CTLA4 susceptibility variants differs among ethnic groups. For example, nucleotide diversity and neutrality tests revealed a site-specific significant excess of polymorphisms over divergence for SNP rs231735 in some ethnic groups, but not others.
For cohort analysis, VAAST 2.0 was used to search for other putative disease-causing genetic variants (either identical variants or different variants within the same gene) common to all affected individuals harboring CTLA4 mutations. Briefly, annotated variants from affected individuals were merged by simple union into a target file. Loci of potentially low variant quality (probable false positives) were removed by filtering out variants present in multiple WES datasets from individuals with unrelated phenotypes. The background file (1KGv3_CG_Div_NHLBI_dbSNP_RefSeq. cdr) contained variants

4
from 1057 genomes from the 1000 genome project, 54 genomes from Complete Genomics Diversity Panel, 184 Danish exams, and 9 genomes from 10Gen dataset. Candidate-gene prioritization analysis was performed using the likelihood ratio test under the dominant-inheritance model requiring complete penetrance but not locus homogeneity. We restricted the expected allele frequency of putative disease-causing variants within the control genomes to 0.1% or lower. Variants in each gene were scored as a group. The significance level was assessed with individual permutation tests. This VAAST analysis revealed that there were no other common putative disease-causing genetic variants among the affected individuals harboring CTLA4 mutations (35).
Cell culture Peripheral blood mononuclear cells (PBMCs) were isolated by the use of Ficoll
separation (Lonza). PBMCs were cultured in RPMI 1640 with 10% fetal bovine serum (Gibco), 2 mM L-glutamine, penicillin 100 U/mL, and 100 µg/mL streptomycin (Gibco) at 37°C in a humidified 5% CO2 incubator.
Evaluation of cell proliferation PBMCs, either freshly isolated or thawed from liquid nitrogen−stored samples, were
incubated with CellTrace violet Cell Proliferation Kit or CellTrace™ CFSE Cell Proliferation Kit (1µM; Invitrogen). After 20 minutes, 10 volumes of RPMI/10% fetal bovine serum (FBS) were added, and the cells were centrifuged and washed twice more with RPMI/10% FBS. A total of 1 × 10⁵ cells were seeded into 96-well plates, stimulated with anti-CD3 antibody or anti-CD28 antibody (1 µg/mL each, eBioscience) as indicated in the figures, and cultured for 3-4 days. For transfection, PBMCs (3 × 10⁶ cells /sample) were transfected with 300 nM control (commercial siRNA universal control#1 from Sigma) or CTLA4 siRNA (5’-GCAUCACUUGGGAUUAAUA-3’) or indicated plasmid using Amaxa Human T-cell Nucleofector kit (Program U-014). 8-16 hours after transfection, 5 × 10⁵ cells were collected and knockdown efficiency (50-75%) was evaluated using real time PCR. After knockdown, medium was replaced with fresh complete medium and then stained with either CellTrace violet proliferation dye or CFSE as described. After incubation for 48h-72h with anti-CD3 (1µg/ml) (48h for CD25 expression and 72h for proliferation), cells were stained with Fluorochrome-conjugated CD4, CD8 or CD25 antibodies (BD Biosciences) for 30 minutes at 4°C (dark). Cells were washed with PBS twice, and cells were analyzed by flow cytometry (Becton Dickinson FACSCanto II).
For the overexpression experiment, patient PBMCs (6x10⁶ cells/sample) were transfected with 2 µg/ml control vector (pDsRed-Express-N1, Clontech) or full-length CTLA4-DsRed-N1vector. After 15-18 hrs, cells were stained with CFSE and stimulated with anti-CD3 and anti-CD28 antibodies (1µg/mL each) for 6-7 days.
For the in vitro treatment with CTLA-4-Ig, patient PBMCs were stained with CFSE and stimulated with anti-CD3 antibodies (0.5 µg/mL) in the presence (+) or absence (-) of 100 µg/mL CTLA-4-Ig for 3 days.
For the B cell proliferation, enriched CD19+ cells (HD1 and A.I.1) using CD19 negative selection kit (StemCell Technologies) or total PBMCs (HD2, HD3, A.II.1, C.II.1, and D.II.1) were labeled with CFSE or CellTrace Violet (1 µM) and stimulated
5
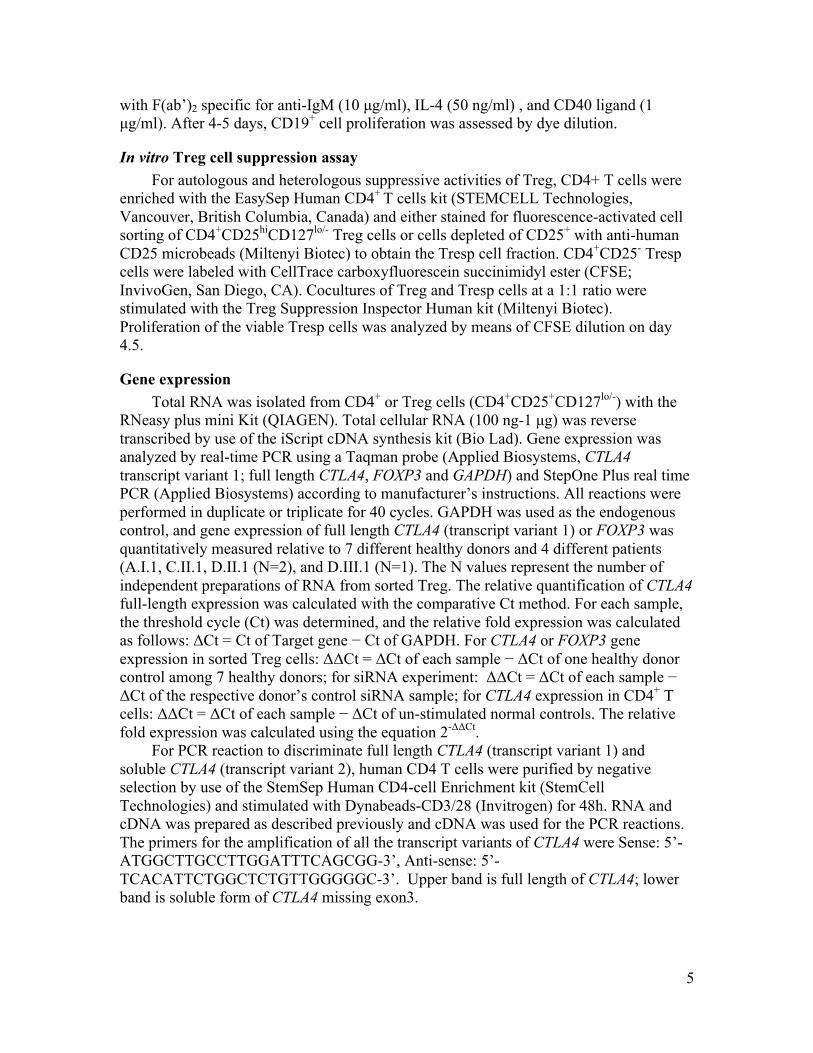
with F(ab’)2 specific for anti-IgM (10 µg/ml), IL-4 (50 ng/ml) , and CD40 ligand (1 µg/ml). After 4-5 days, CD19+ cell proliferation was assessed by dye dilution.
In vitro Treg cell suppression assay For autologous and heterologous suppressive activities of Treg, CD4+ T cells were
enriched with the EasySep Human CD4+ T cells kit (STEMCELL Technologies, Vancouver, British Columbia, Canada) and either stained for fluorescence-activated cell sorting of CD4+CD25hiCD127lo/- Treg cells or cells depleted of CD25+ with anti-human CD25 microbeads (Miltenyi Biotec) to obtain the Tresp cell fraction. CD4+CD25- Tresp cells were labeled with CellTrace carboxyfluorescein succinimidyl ester (CFSE; InvivoGen, San Diego, CA). Cocultures of Treg and Tresp cells at a 1:1 ratio were stimulated with the Treg Suppression Inspector Human kit (Miltenyi Biotec). Proliferation of the viable Tresp cells was analyzed by means of CFSE dilution on day 4.5.
Gene expression Total RNA was isolated from CD4+ or Treg cells (CD4+CD25+CD127lo/-) with the
RNeasy plus mini Kit (QIAGEN). Total cellular RNA (100 ng-1 µg) was reverse transcribed by use of the iScript cDNA synthesis kit (Bio Lad). Gene expression was analyzed by real-time PCR using a Taqman probe (Applied Biosystems, CTLA4 transcript variant 1; full length CTLA4, FOXP3 and GAPDH) and StepOne Plus real time PCR (Applied Biosystems) according to manufacturer’s instructions. All reactions were performed in duplicate or triplicate for 40 cycles. GAPDH was used as the endogenous control, and gene expression of full length CTLA4 (transcript variant 1) or FOXP3 was quantitatively measured relative to 7 different healthy donors and 4 different patients (A.I.1, C.II.1, D.II.1 (N=2), and D.III.1 (N=1). The N values represent the number of independent preparations of RNA from sorted Treg. The relative quantification of CTLA4 full-length expression was calculated with the comparative Ct method. For each sample, the threshold cycle (Ct) was determined, and the relative fold expression was calculated as follows: ΔCt = Ct of Target gene − Ct of GAPDH. For CTLA4 or FOXP3 gene expression in sorted Treg cells: ΔΔCt = ΔCt of each sample − ΔCt of one healthy donor control among 7 healthy donors; for siRNA experiment: ΔΔCt = ΔCt of each sample − ΔCt of the respective donor’s control siRNA sample; for CTLA4 expression in CD4+ T cells: ΔΔCt = ΔCt of each sample − ΔCt of un-stimulated normal controls. The relative fold expression was calculated using the equation 2-ΔΔCt.
For PCR reaction to discriminate full length CTLA4 (transcript variant 1) and soluble CTLA4 (transcript variant 2), human CD4 T cells were purified by negative selection by use of the StemSep Human CD4-cell Enrichment kit (StemCell Technologies) and stimulated with Dynabeads-CD3/28 (Invitrogen) for 48h. RNA and cDNA was prepared as described previously and cDNA was used for the PCR reactions. The primers for the amplification of all the transcript variants of CTLA4 were Sense: 5’-ATGGCTTGCCTTGGATTTCAGCGG-3’, Anti-sense: 5’-TCACATTCTGGCTCTGTTGGGGGC-3’. Upper band is full length of CTLA4; lower band is soluble form of CTLA4 missing exon3.

6
FACS analysis For surface staining, PBMCs (1-5 × 10⁵ cells per sample) were washed with PBS,
and then incubated for 30 min at 4 °C (in the dark) with appropriate fluorochrome-labeled monoclonal antibodies or their isotype-matched control antibodies diluted in 100 µl FACS staining buffer (5% FBS in PBS). For intracellular staining, PBMCs were fixed and permeabilized after surface staining using FoxP3 staining kit (eBioscience) following the manufacturer’s instructions, and then incubated with anti-FoxP3 and anti-CD152 for 30 min on ice. All samples were acquired and analyzed by flow cytometry (Becton Dickinson FACSCanto II or LSRII) and FlowJo software (TreeStar).
The following validated antibodies were used for flow cytometry: anti-CD3 (SK7), anti-CD4 (RPA-T4), anti-CD8 (RPA-T8), anti-CD19 (SJ25C1), anti-CD20 (L27), anti-CD21 (B-ly4), anti-CD25 (2A3), anti-CD62L (SK11), anti-CD95 (DX2), anti-CD152 (BNI3) (BD Bioscience); anti-CD10 (CB-CALLA), anti-CD45RA (H100), anti-FoxP3 (236A/E7), anti-PD1 (J105) (eBioscience); anti-CD3 (OKT3), anti-CD4 (OKT4), anti-CD25 (BC96), anti-CD127 (A019C5), anti-helios (22F6), anti-CD45RO (UCHL1) (Biolegend)
B-cell phenotyping. Total PBMCs were labeled with mAbs against CD19 (SJ25C1; Leu12), CD20 (2H7; Leu16), CD27 (L128) and CD21 (Bly4), together with mAbs specific for IgM (G20-127), IgD (IA6-2), IgG (G18-145), IgA (G20-359), CD10 (HI10a), CD95 (DX2), PD-1 (J105), BAFF-R (8A7), TACI (1A1), CXCR3 (1C6), CXCR4 (12G5) or CXCR5 (RF8B2). CD19+CD20+CD27- B cells were then subdivided into CD21+ or CD21lo subsets and expression of these surface molecules determined. All FACS analyses were performed using Flow Jo (Treestar).
In vitro culture of naïve and CD19hiCD21lo B cells PBMCs were labeled with mAbs against CD20, CD27, CD10, CD21 and IgG.
CD20+CD10-CD27-IgG- B cells were then identified and delineated into CD21lo or CD21+ subsets, and then isolated by cell sorting (FACS ARIA III). CD21lo and CD21+ B cells from normal donors as well as CTLA-4 deficient patients were cultured (5 – 10 x 103 cells/well) with CD40L plus IL-21. Secretion of IgM, IgG and IgA was determined by Ig heavy-chain specific ELISA after 10 days of culture.
Statistical Analysis When indicated, data were analyzed using Student’s t test or non-parametric Mann-
Whitney test utilizing the GraphPad Prism software (GraphPad). The differences were considered significant when P < 0.05.

7
Supplementary Text
Clinical and laboratory presentation of the patients
A.I.1 was found to have significantly low immunoglobulin levels and total lymphocyte counts when he presented with pneumonia and 20lbs weight loss at age 40. He had few inflammatory lung lesions, mild bronchiectasis, enteropathy and developed anemia and thrombocytopenia secondary to clonally expanded γδ-CD8+ T (large granular lymphocyte, LGL) cells infiltrating and suppressing the bone marrow. When he became transfusion dependent, two treatment courses of CampathTM (alemtuzumab, anti -CD52, Cambridge Massachusetts), was given under a study protocol, which failed to control the clonally expanding T cells. A treatment approach using sirolimus and corticosteroids controlled the clonal population and bone marrow suppression caused by LGL but failed to treat his worsening enteropathy which was characterized by transepithelial T cell infiltrate, mucosal and submucosal aggregates of T and B cells forming germinal centers, mild cryptitis without crypt abscesses and resulting severe diarrhea. He died with central line infection and Klebsiella pneumonia sepsis.
A.II.1 patient is currently a 22-year-old female, who presented at age 2 with autoimmune thrombocytopenia and enteropathy and now has hypogammaglobulinemia and lymphopenia mostly affecting T cells. At age 9, a left parietal lobe brain lesion was discovered when she developed seizures. At the same time her chest CT revealed scattered pulmonary nodules. Biopsy from both brain and lung lesions showed inflammatory tissue with lymphocytic predominance (loosely organized inflammatory tissue and non-caseating granuloma respectively). At age 13, her thrombocytopenia and enteropathy persisted along with hypogammaglobulinemia and progressive T and B cell lymphopenia. A trial of sirolimus caused her thrombocytopenia to resolve and improved her GI symptoms. At age 22, while she remains on sirolimus, intermittent low dose steroid pulses, and intravenous immunoglobulin (IVIG) infusions, her major problem remains lymphocytic enteropathy and chronic diarrhea.
B.I.1 is a 38 year-old patient with a history of occasional sinusitis, upper respiratory
infections, and childhood peptic ulcer disease with pyloric obstruction requiring dilatation. He was initially diagnosed as common variable immunodeficiency with a lymphoproliferative disorder. He has been treated with rituximab since developing autoimmune hemolytic anemia and thrombocytopenia at age 28. His chest CT showed pulmonary nodules (right panel). Shortly afterwards, following a CT scan done to evaluate his head injury, multiple bilateral cerebral enhancing lesions, which were visualized and followed periodic by brain MRI for the last 4 years with no specific therapy. Biopsy of one of these lesions showed T cell lymphohystiocytic infiltrates primarily with polyclonal T cells.
Patient C.II.1 is currently a 19-year-old male, diagnosed with nodular sclerosing
Hodgkin lymphoma at 10 years old, remains in remission after chemotherapy and

8
radiotherapy. At 14 years, he had diffuse lymphadenopathy and splenomegaly, a recurrence of lymphoma was ruled out and his lymphoproliferation was controlled with corticosteroids. Coincidental with his enlarged nodes and spleen, patient developed autoimmune hemolytic anemia, and at age 15 he was diagnosed with autoimmune thrombocytopenia. He had lymphopenia with low CD3+ and CD4+ T cells. Both hemolytic anemia and autoimmune thrombocytopenia failed to respond to treatment with rituximab and short course of sirolimus, but responded to high dose corticosteroids. At age 17, he developed chronic non-infectious diarrhea, which resulted in a 100lb weight loss, responded favorably to corticosteroids. Most recent GI biopsy revealed lymphocytic infiltrates with transepithelial T cells, and mucosal and submucosal aggregates of T and B cells forming germinal centers. He currently has chronic autoimmune thrombocytopenia with autoimmune enteropathy despite treatment with sirolimus and corticosteroids, and remains EBV viremic.
Patient D.II.1 is a 46-year-old male with a history of psoriasis since childhood. He
developed lymphadenopathy and autoimmune hemolytic anemia at age 10, which prompted the removal of his spleen at 14 years old. Four years post-splenectomy he had an additional episode of hemolytic anemia and was found to have pulmonary infiltrates at this time. In his early 20s, he suffered from ocular allergies and developed a retinal detachment at age 24. At age 27, he had persistent diarrhea, which resolved after treatment with prednisone. At this time he was also noted to have ground glass opacities in both lungs. Over the years his interstitial lung disease has progressed with increasing ground glass changes in both lung bases and nodular densities in the upper lobes. He was treated with MMF, azathioprine and tacrolimus in addition to steroids, without much benefit. He was recently started on sirolimus. At age 46, when he developed chronic non-infectious diarrhea, endoscopic biopsy revealed increased intraepithelial and lamina propria lymphocytes. He also had cervical, mediastinal, perihilar and axillary lymphadenopathy, which prompted multiple biopsies, pathology revealed follicular hyperplasia each time.
Patient D.III.1 is a 11-year old-male with a history of eczema, food allergies, atopy
,lymphadenopathy and chronic constipation as a young child, At age 6, he developed severe autoimmune hemolytic anemia (hemoglobin 6.4) and was found to have lymphopenia and low CD4+ T cells and low CD 19+ B cells. Extensive warts developed in both hands as noted at age 8. At age 9, he presented with seizures and aphasia leading to diagnosis of infiltrative brain lesion by MRI. An LP was significant for CSF pleocytosis. He was treated with high dose steroids and tapered off steroids slowly over 6 months. Follow up MRI scan done at age 11years showed recurrence of brain lesions. He was started on sirolimus in January 2014, which controlled the progression of CNS disease.

9
CD8!H&E! CD3!
H&E! EBER!
A.I.1!
A.I.1!
A!
B!
C!
D!
CD20!
A.I.1!
A.II.1!
B.I.1!
C.II.1!

10
Fig. S1. Images and Clinical phenotype of patients.
(A) Patient A.I.1: Non-lymphoid organ pathology due to infiltrating lymphocytes. Top left, Computerized Tomography (CT) scan of the abdomen showing diffuse bowel wall thickening with fluid filled small and proximal large bowel due to immune enteropathy. Top middle, CT scan of the chest showing granuloma type inflammatory lesion adjacent to the chest wall. Top right, para-axial image, reconstructed along left lower lobe showing mild bronchiectasis. Bottom panel, left, bowel biopsy (CD20, magnification 10x) shows a submucosal lymphoid aggregation. Middle and right, bone marrow biopsy (hematoxylin and eosin (H & E), CD3, and CD8 staining as indicated, magnification 20x) shows a normocellular marrow for age with an interstitial lymphocytic infiltrate composed of CD3/CD8 positive T–cells consistent with T-cell large granular lymphocytic proliferation. (B) Patient A.II.1: CT scan of the chest, under rapamycin treatment, showing significant improvement in pulmonary paranchymal inflammatory lesions as compared to her pre-treatment lung CT shown in Fig 1A. (C) Patient B.I.1: Left panel, MRI of the brain, post axial T1 image demonstrating increased signal in right frontal lobe. Middle panel, sinus CT showing L maxillary opacification and sinusitis. Right panel, chest CT is showing multiple bilateral faint ground glass infiltrates. (D) Patient C.II.1: Left panel, Hepatomegaly. Middle and right panels: Lymph node biopsy H&E-stained section, 100x) showing typical features of classical Hodgkin lymphoma with a cluster of Reed-Sternberg and Hodgkin cells in an inflammatory background. In situ hybridization for Epstein-Barr virus (EBV)(100x) using EBER probe show large Reed-Stenberg cells positive for EBV. (E) Histological section from a duodenal biopsy from a healthy donor (HD) and patient C.II.1 stained for CD3 (brown cells) showing an increased number of transepithelial T cells within the villi (top panels). Immunohistochemical stains of this duodenal biopsy for CD20 and CD3 characterizing a prominent nodular lymphoid infiltrate forming a reactive follicle surrounded by CD3 positive T cells (C.II.1) (bottom panels). A similar infiltrate was present in all the gastrointestinal biopsy specimens obtained from affected patients but not healthy donors. (F) Patient D.II.1, axial and sagittal CT scan of the chest showing peripheral stacked cysts (honeycomb-like), severe fibrosis in the non-dependent RML and bilateral scattered ground glass and nodular opacities. (G) Patient D.III.1, MRI image demonstrating brain lesion.
E!
D.II.1!
F!
D.III.1!
HD (CD3)! C.II.1 (CD3)!
C.II.1(CD20)! C.II.1 (CD3)!
G!F!
11
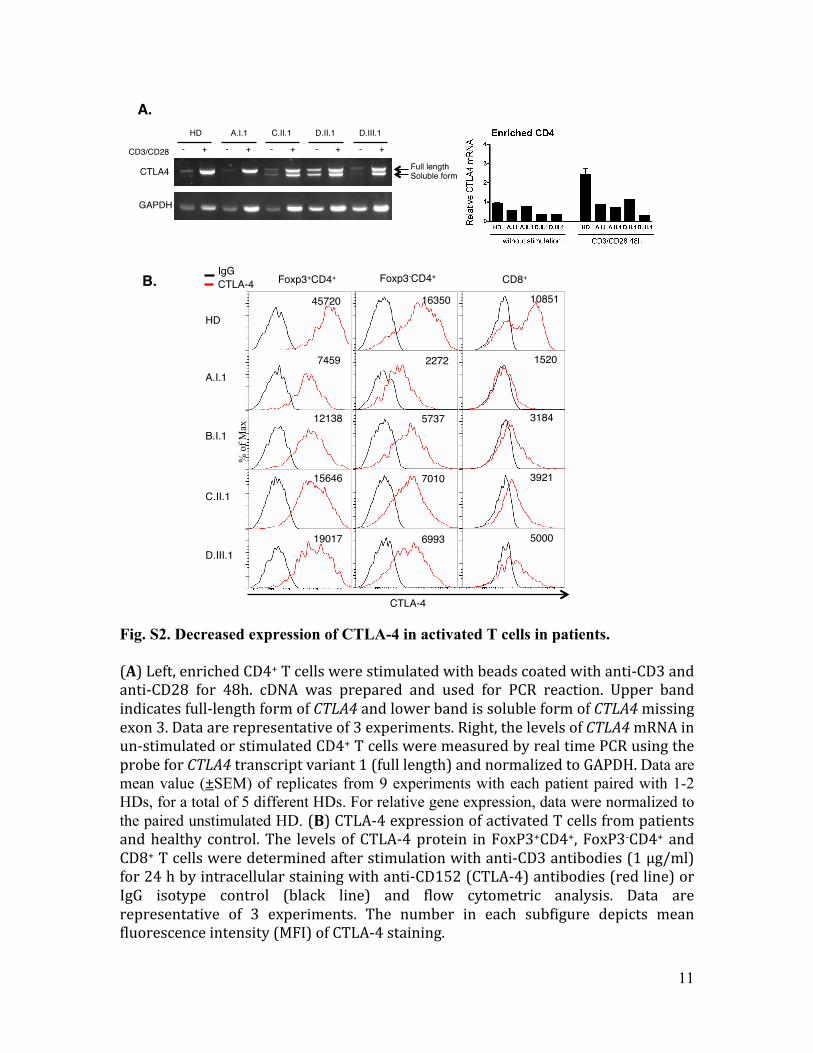
Fig. S2. Decreased expression of CTLA-4 in activated T cells in patients. (A) Left, enriched CD4+ T cells were stimulated with beads coated with anti-‐CD3 and anti-‐CD28 for 48h. cDNA was prepared and used for PCR reaction. Upper band indicates full-‐length form of CTLA4 and lower band is soluble form of CTLA4 missing exon 3. Data are representative of 3 experiments. Right, the levels of CTLA4 mRNA in un-‐stimulated or stimulated CD4+ T cells were measured by real time PCR using the probe for CTLA4 transcript variant 1 (full length) and normalized to GAPDH. Data are mean value (±SEM) of replicates from 9 experiments with each patient paired with 1-2 HDs, for a total of 5 different HDs. For relative gene expression, data were normalized to the paired unstimulated HD. (B) CTLA-‐4 expression of activated T cells from patients and healthy control. The levels of CTLA-‐4 protein in FoxP3+CD4+, FoxP3-‐CD4+ and CD8+ T cells were determined after stimulation with anti-‐CD3 antibodies (1 µg/ml) for 24 h by intracellular staining with anti-‐CD152 (CTLA-‐4) antibodies (red line) or IgG isotype control (black line) and flow cytometric analysis. Data are representative of 3 experiments. The number in each subfigure depicts mean fluorescence intensity (MFI) of CTLA-‐4 staining.
A. !HD! A.I.1! C.II.1! D.II.1! D.III.1!
-! +! -! +! -! +! -! +! -! +!CD3/CD28!
CTLA4!
GAPDH!
B. !
Full length!Soluble form!
HD!
A.I.1!
B.I.1!
C.II.1!
D.III.1!
IgG!CTLA-4! Foxp3+CD4+! Foxp3-CD4+! CD8+!
% o
f Max
45720!
7459!
12138!
15646!
19017!
10851!
1520!
3184!
3921!
5000!
16350!
2272!
5737!
7010!
6993!
CTLA-4!

12
A! C!
Helios!
B!
Patie
nt !
HD!
FoxP
3!
CD127! CD45RO!
HD!D.II.1!
Treg! Treg!
D!
!"#"$%
&"''"$%
("''"$%
)"'"$%
% o
f Max!
Fig. S3. Abnormal Treg function and phenotype. (A) Percent (%) of FoxP3+ among CD4+ T cells from 10 healthy donors and 5 patients (A.I.1, A.II.1, B.I.1, C.II.1, D.II.1). Data indicate the mean of replicate samples for indicated patients (A.I.1 (N=4), A.II.1 (N=1), B.I.1 (N=3), C.II.1 (N=3), D.II.1 (N=3)). The N values represent number of replicates for the indicated patient. The horizontal lines represent the mean ± S.D. from healthy donors or patients. (B) Left panel, Helios and FoxP3 staining on CD3+CD4+ cells from a healthy donor and a representative of 4 patients tested (A.I.1, B.I.1, C.II.1, and D.II.1). Right panel, histogram displaying expression levels of CD127, and CD45RO on Treg cells (CD4+CD25+127-) from a representative patient (solid gray) and a healthy donor (bold). (C) For the quantification of FOXP3 mRNA, RNA from 7 different healthy donors and 4 patients were prepared from sorted Treg (CD4+CD25+CD127lo) cells then real time PCR was performed using FOXP3 and GAPDH Taqman probes. Data are mean value of replicates from 2 experiments. For relative gene expression, all data were normalized to the same HD. The horizontal lines indicate the mean values from healthy donors or patients. (D) Gating strategy for sorting Treg cells of indicated patient (A.I.1, B.I.1, C.II.1, and D.II.1) and paired healthy donors and from within the CD3+CD4+ gate. These sorted cells were used for the Treg suppression assay as shown in Fig 2C.

13
Fig. S4. T cell Phenotype in D.I.1. (A) Protein expression of CTLA-4 in Treg cells from a healthy donor (HD), D.I.1, and D.II.1. The levels of intracellular CTLA-4 expression in Treg cells (CD4+CD25+FoxP3+). The numbers in the upper right corner depict mean fluorescence intensity (MFI) of anti-CD152 (CTLA-4) staining. (B) Expression of FoxP3 and CD25 in CD4+ FoxP3+ T cells from a healthy donor and indicated patient. (C) Proliferation of PBMCs obtained from a healthy donor or indicated patient. Total PBMCs were stained with CellTrace Violet (1 µM) and stimulated with (black line) or without (solid gray) anti-CD3 and anti-CD28 antibodies (1 µg/mL) for 3 days. Data are representative of two experiments.
HD!
D.II.1 !D.I.1 !
6250!
IgG!
1244 ! 2726!
CTLA-4!
A!
% o
f Max!
C! HD! D.II.1! D.I.1!
CD8+!
CD4+!
Cellltrace Violet!
% o
f Max!
B!
CD25!
CD4!FoxP
3!
HD! D.II.1! D.I.1!10.1%! 13.8%! 8.6%!
1.4! 8.7!
84! 5.9!
5.9! 7.9!
77.1! 9.1!
1.7! 7!
86.6! 4.8!
68 83.5 87.5
61.5 90.6 85.5

14
Fig. S5. Role of CTLA-4 in activation and proliferation. (A) Total PBMCs were activated with anti-CD3 antibodies (1 µg/mL) with or without IL-2 (100 U/ml) for 24h. After activation, surface CD25 expression on CD4+ T cells was analyzed by flow cytometry (HD1 and HD2 are paired healthy donor controls for A.I.1 and A.II.1 (anti-CD3) and HD3 is paired healthy donor for D.II.1 (anti-CD3 with IL-2). Filled gray color indicates CD25 expression on unstimulated cells and black line indicates CD25 expression on stimulated cells. (B-C) Reconstitution of wild type CTLA-4 in patient cells. Patient C.II.1 or D.II.1 PBMCs were transfected with control vector (pDsRed-N1) or CTLA-4-DsRed-N1 vector and then stimulated with indicated antibodies (1 µg/mL each) for 6-7 days. Surface expression of CTLA-4 on unstimulated DsRed+ cells from D.II.1 (for Fig 3C) 3 days post-transfection and C.II.1 (right) 7 days post-transfection are shown (B). Proliferation of DsRed+ CD4 and CD8 patient C.II.1 T cells are shown (C).
87.9
81.7
64.3
58.8
95.374.8
CD25!
% o
f Max!
HD! Patients!A.I.1!
A.II.1!
D.II.1!
HD1!
HD2!
HD3!
A!
B! Empty vector!WT CTLA-4!
Empty vector!WT CTLA-4!
% o
f Max!
D.II.1! C.II.1!
CTLA-4!
Empty Vector! WT CTLA-4!
CD
3!
CD
4+!
CD
8+!
CFSE!
% o
f Max!
CD
3/C
D28
! CD
4+!
CD
8+!
C! C.II.1!
4279
7993
54
21 13
25

15
Fig. S6. Increased apoptosis in patient T cells PBMCs from healthy donors and indicated patient were labeled with antibodies against CD4, CD8, and CD95. Expression of CD95 on CD4+ and CD8+ T cells was analyzed by flow cytometry (top panels). Total PBMCs were cultured in 10% FBS/RPMI with or without stimulation (1 µg/mL of anti-CD3 and CD28 antibodies). After 24-72h (24h for A.II.1, 72h for C.II.1), cells were stained with VAD-FMK-FITC (5 µM), or Annexin-V then analyzed by flow cytometry (middle and bottom panels). Filled gray indicates IgG isotype control. Data are representative of two experiments.
CD4+! CD8+!
Annexin V!
CD95!CD95!
CD4+! CD8+!
Active Caspase (FMK-VAD)!
(-)!
CD3/CD28! !
HDPatient A.II.1!C.II.1!
% o
f Max!
% o
f Max!
% o
f Max!

16
Fig. S7. Reduced CTLA-4 expression on B cells and increased B cell apoptosis in CTLA-4 patients. (A) Total PBMCs were stimulated with (+) or without (-) anti-CD3 and anti-CD28 antibodies (1µg/mL) for 48-72h, stained with CD152 (CTLA-4) and CD19. Surface expression of CTLA-4 on CD19+ B cells from two patients (C.II.1 and D.II.1) was analyzed by flow cytometry. Data are representative of two experiments. (B) Total PBMCs were cultured in complete medium for 24 hours and stained with Annexin-V and CD19 or (C) VAD-FMK-FITC (5 µM), CD19, and CD21. The expression of Annexin-V or VAD-FMK on CD19+ cells was determined by flow cytometry analysis. Annexin-V staining data shown are representative of 3 experiments with a total of 3 patients (A.I.1, A.II.1, C.II.1) and 3 healthy donors. VAD-FMK staining data shown are representative of 2 experiments with a total of 3 patients (B.I.1, C.II.1, D.II.1).
B!
Active Caspase (FMK-VAD)!AnnexinV
HDC.II.1
Annexin V!
HD!
C.II.1!CD21hi!IgG!
% o
f Max!
% o
f Max!
C!
A!HD (-)!HD (+)!
IgG!
Patient (-)!Patient (+)!
CTLA-4!
D.II.1!C.II.1!
% o
f Max!
HD! C.II.1!CD21lo!

17
Fig. S8. Phenotype of CD21lo B cells in the patients. (A) PBMCs from healthy donors and indicated patient were labeled with antibodies against CD19, CD20, CD21 and CD27 as well as against BAFF-R, TACI, CD95, CXCR5, CXCR4, CXCR3 and PD-1. Expression of these markers on CD19hiCD21lo and CD21+ cells in the population of CD20+CD27- B cells was determined. CD21lo B cell subset showed increased CD22, CD95, and PD-1 regulatory receptors, a specific profile of chemokine and cytokine receptors, including increased CXCR3, CCR7, and CCR9 but decreased CXCR4 and IL4-R with no CXCR5, and specific changes in receptors associated with B-cell differentiation such as decreased CD38 and BAFF-R but increased TACI. (B) Naïve and CD19hiCD21lo B cells were sorted from the peripheral blood of 3 healthy donors, patients, A.I.1 and D.II.1 and then cultured with CD40L plus IL-21. After 10 days, secretion of IgM, IgG and IgA was determined by Ig heavy chain-specific ELISAs. Data are expressed as the mean ± SEM from 3 healthy donors (HD) and the mean value for each patient.
2.8! 21!
12! 65!
83! 0.6!
16! 1.1!
11! 30!
13! 46!
33! 20!
18! 29!
1.0! 15!
5.6! 78!
71! 5.9!
17! 6.3!
10! 50!
8.2! 31!
21! 29!
19! 31!
4.2! 93!
0.3! 2.9!
14! 2.0!
68! 17!
3.0! 58!
11! 28!
9.5! 59!
23! 8.6!
0.3! 2.3!
7.7! 90!
51! 1.5!
44! 3.5!
3.5! 3.6!
16! 77!
21! 3.4!
21! 55!
1.6! 2.8!
15! 81!
23! 2.4!
74! 0.8!
15! 14!
10! 62!
22! 3.7!
31! 43!
7.3! 86!
3.4! 3.8!
0! 1!
98! 1!
12! 72!
9.5! 6.5!
1.5! 5!
45! 49!
9! 84!
2.5! 5!
14! 3.6!
81! 0.8!
15! 77!
7.5! 0.9!
15! 55!
29! 1.9!
TACI! BAFFR! CD95! CXCR5! CXCR4! PD1! CXCR3!
HD!
A.I.1!
C.II.1!
D.II.1!
CD21!
A!
B!

18
Fig. S9. CTLA-4 expression and T cell proliferation in healthy donors with common c.49A>G SNP. (A) Intracellular CTLA-4 expression in Treg cells (CD4+CD25+FoxP3+) from healthy donors (HD) with WT CTLA4 or with common SNP (c.49A>G). The numbers in the upper right corner depict mean fluorescence intensity (MFI) for CD152 (CTLA-4) staining. Data are mean ± SEM from 4 HD with WT CTLA4 or 3 HD with c.49A>G or the mean value from two patients (C.II.1, D.II.1). (B) Proliferation of PBMCs obtained from HD with or without c.49A>G SNP. Total PBMCs were stained with CellTrace Violet (1 µM) and stimulated with anti-CD3 and anti-CD28 antibodies (1 µg/mL) for 3 days (black line). Solid gray peak shows unstimulated cells. Data are mean ± SEM from 4 HD with WT CTLA4 or 3 HD with c.49A>G or the mean value from two patients (C.II.1, D.II.1). Combined data are from 3 independent experiments. Proliferation data shown are representative of 3 experiments. ns, non-significant (unpaired t-test).
0 102 103 104 105
% o
f Max
0 102 103 104 105
0 102 103 104 105
% o
f Max
0 102 103 104 105 0 102 103 104 105
0 102 103 104 105 0 102 103 104 105
0 102 103 104 105
% o
f Max
0 102 103 104 105
CTLA-4IgG
4703 2675 2352 2386
2795 2838 2121
927 996
CTLA-4!
WT!
c.49A>G! (Heterozygous)!
Patients!
Celltrace Violet!
WT!
Patients!
Celltrace Violet!
WT!
Patients!
A!
B!
c.49A>G! (Heterozygous)!
c.49A>G! (Heterozygous)!
% o
f Max
73.8
% o
f Max
71.2 73.4
% o
f Max
89.5 84.7
62.6 69.9
54.4
69.8
% o
f Max
61.8 60.8
% o
f Max
93.1 92.1
72.2 74.4
63.1
% o
f Max
71.5 65.3
CD
4+C
D25
+FoxP3+!
CD
4+!
CD
8+!
WT 49A>G Patients0
1000
2000
3000
4000
5000ns
WT 49A>G Patients40
50
60
70
80
90
100 ns
WT 49A>G Patients40
50
60
70
80
90
100 ns
19
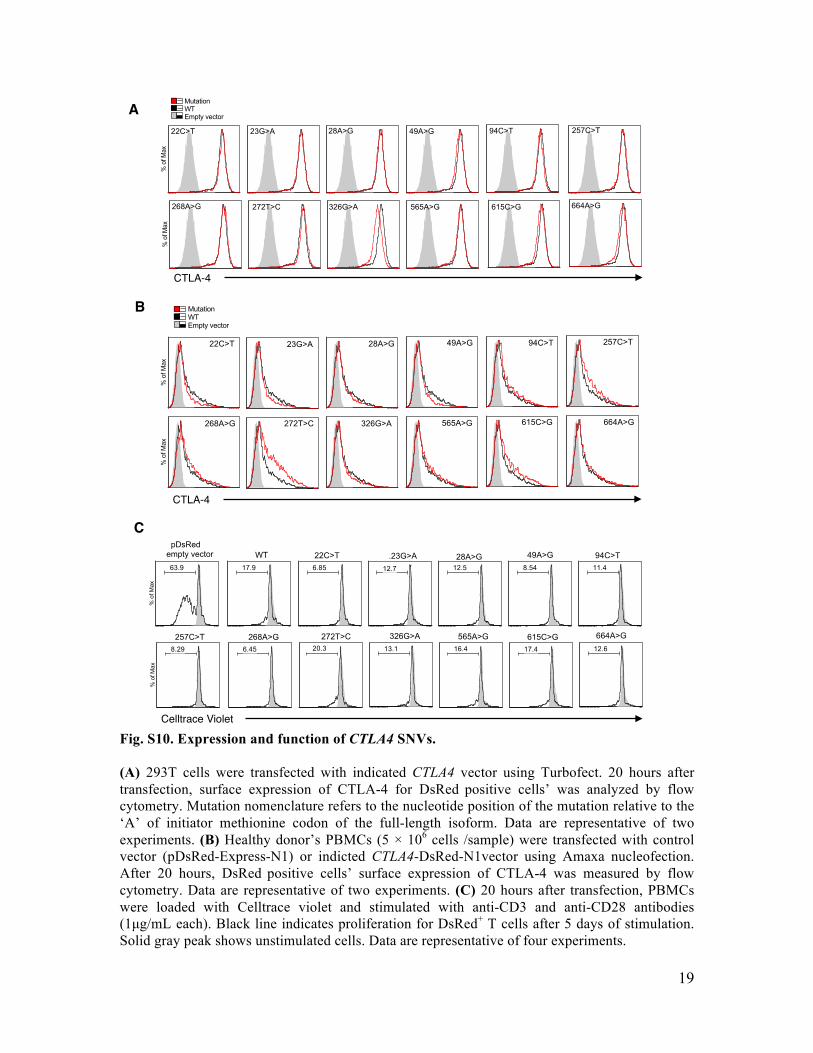
Fig. S10. Expression and function of CTLA4 SNVs. (A) 293T cells were transfected with indicated CTLA4 vector using Turbofect. 20 hours after transfection, surface expression of CTLA-4 for DsRed positive cells’ was analyzed by flow cytometry. Mutation nomenclature refers to the nucleotide position of the mutation relative to the ‘A’ of initiator methionine codon of the full-length isoform. Data are representative of two experiments. (B) Healthy donor’s PBMCs (5 × 10⁶ cells /sample) were transfected with control vector (pDsRed-Express-N1) or indicted CTLA4-DsRed-N1vector using Amaxa nucleofection. After 20 hours, DsRed positive cells’ surface expression of CTLA-4 was measured by flow cytometry. Data are representative of two experiments. (C) 20 hours after transfection, PBMCs were loaded with Celltrace violet and stimulated with anti-CD3 and anti-CD28 antibodies (1µg/mL each). Black line indicates proliferation for DsRed+ T cells after 5 days of stimulation. Solid gray peak shows unstimulated cells. Data are representative of four experiments.
CTLA-4!
CTLA-4!
A!
B!
C!
% o
f Max
63.9 17.9 6.85 12.7 12.5 8.54 11.4
% o
f Max
8.29 6.45 20.3 13.1 16.4 17.4 12.6
22C>T .23G>A 28A>G 49A>G 94C>T pDsRedempty vector WT
257C>T 268A>G 272T>C 326G>A 565A>G 615C>G 664A>G
Celltrace Violet!
% o
f Max
% o
f Max
MutationWTEmpty vector
22C>T 23G>A 28A>G 49A>G 94C>T 257C>T
268A>G 272T>C 326G>A 565A>G 615C>G 664A>G
% o
f Max
% o
f Max
MutationWTEmpty vector
22C>T 23G>A 28A>G 49A>G 94C>T 257C>T
268A>G 272T>C 326G>A 565A>G 615C>G 664A>G

20
Table S1. Clinical and Laboratory Features: Demographic data, clinical features and immunolical laboratory features of CTLA-4 haploinsufficient patients. Since all the lymphocyte immune phenotyping data provided from patients A.I.1, A.II.1, and D.II.1 were not obtained at the same time, different colors and symbols are used to indicate different times studies were done (For patient A.I.1 * 2012, †2009, ‡2008 and for patient A.II.1 § 2011, ¶2009, **2006, and for patient D.II.1 #2011, ^2013). More detailed clinical course provided with supplementary manuscript. N.A: not available
Clinical and laboratory Features Patients A.I.1 43y, M A.II.1 22y, F B.I.1 38y, M C.II.1 23y, M D.I.1 77y, F D.II.1 46y, M D.III.1 11y, M Mutations c.151C>T,
p.R51X c.151C>T, p.R51X
c.75delG, p.L28Ffs*44
c.458-1G>C c.567+5G>C c.567+5G>C c.567+5G>C
Organs with inflammatory infiltrates Lung, Gut Brain, Lung, Gut Brain, Lung Lung, Gut None Lung, Gut Brain, Lung, Gut
Autoimmune Cytopenias Thrombocytopenia Neutropenia
Thrombocytopenia Thrombocytopenia Thrombocytopenia Neutropenia
None Thrombocytopenia Hemolytic anemia
Thrombocytopenia Hemolytic anemia
Myeloproliferative Problems Large Granular Lymphocytosis
None None EBV+ Hodgkinʼs Lymphoma
None None None
Immunoglobulin Levels
Overall IgG, M, A, E IgG, M, A, E IgG, M, A, E IgG IgE IgM, IgE IgG, M, A IgG (642-1739 μg/μl) 378 240 211 647 1200 1020 521
IgM (34-342 μg/μl) < 6 33 24 97 67 26 23
IgA (91-499 μg/μl) <7 63 27 173 288 145 31
IgE (0-90 μg/μl) <1 <1 <1.0 8.8 111 336 32.3
Specific Antibody response
Anti-Pneumococcal Antibodies NA 19/23+ 6/23+ NA 11/23+ 11/23+ 8/23 +
Tetanus IgG > 0.15IU/ml 0.62 0.68 1.49 2.46 1.04
Diphtheria IgG Protective Protective Protective Protective Protective
Varicella Protective Protective Protective Protective Protective
Autoantibodies
AUTOANTIBODIES
ANA (0-0.9): + 2.2 EU Anti-histone (<1.0): + 1.2 Anti-intrinsic factor: + 1.2 Coombs: +
ANA (0-0.9): + 1.6 EU Anti-histone (<1.0): +12.2 Antimitochondial ab (<0.1): + 0.3 Thyroid peroxidase (0-35): 53.5IU/L Anti-proteinase 3 (0-10): +12.3 Units
ANA: Negative ANA: + 3.2 EU Negative Coombs: + Coombs: +
A.I.1 43y, M A.II.1 22y, F B.I.1 38y, M C.II.1 23y, M D.I.1 77y, F D.II.1 46y, M D.III.1 11y, M MARKER NORMAL VALUES Cells /μl %
Cells /μl % Cells /μl % Cells /μl % Cells /μl % Cells /μl % Cells /μl % Cells /μl %
CD3 714-2266 60-83.7
*278 ‡706
75.2 84.5
§146 ¶273 **395
66.5 82.8 60.2
759 85.3 648 68.7 1637 77.2 #1134 ^1206
63 81.5
775 84.2
CD4/CD3 359-1565 31.9-62.2
113 357
30.5 42.8
66 146 52
29.8 44.3 7.9
506 56.9 472 50.7 1204 56.8 918 946
51 63.9
388 42.2
CD4/45RA+/62L+ 102-1041 11.2-34.8 9 2.4 10 4.6 84 9.4 107 11.5 515 24.3 259 17.5 215 23.4 CD4/45RA-/62L+ 162-614 7.6-37.7 54 14.6 31 14.1 373 41.9 303 32.6 558 26.3 539 36.4 146 15.9 CD4/45RA-/62L- 42-225 2.3-15.6 49 13.3 21 9.5 49 5.5 60 6.5 131 6.2 145 9.8 25 2.7 CD4/45RA+/62L- 0-29 0.0-1.5 1 0.2 3 1.5 1 0.1 1 0.1 0 0 3 0.2 1 0.1 CD8/CD3
178-853 11.3-34.8 143 315
38.7 37.7
63 109 319
28.6 33.1 48.6
206 23.1 120 12.9 386 18.2 144 163
8 11
236 25.7
CD8/45RA+/62L+ 85-568 5.7-19.7 15 4.1 38 17.2 131 14.7 75 8.1 167 7.9 120 8.1 194 21.1 CD8/45RA-/62L+ 25-180 1.5-10.3 11 3.1 6 2.6 53 6 26 2.8 131 6.2 33 2.2 14 1.5
CD8/45RA-/62L- 24-175 1.1-9.2 18 5 5 2.3 13 1.5 7 0.8 59 2.8 6 0.4 5 0.5
CD8/45RA+/62L- 11-172 0.7-7.8 98 26.5 14 6.4 8 0.9 11 1.2 30 1.4 3 0.2 24 2.6
T4/T8 RATIO 1.11-5.87 0.79 1.04 2.46 3.93 3.12 6.4 1.64
DNT 18-185 1.3-9.2 21 †87
5.7 5.3
13 17
6 5.2
45 5 52 5.6 23 1.1 59 5.3 149 16.2
DNT αβ 6-23 0.3-1.3 38 2.3 10 3 37 4.2 35 3.8 11 0.5 43 2.4 47 5.1
DNT γδ 4-151 0.3-7.6 64 3.9 7 2.1 7 0.8 12 1.3 4 0.2 4 0.2 102 11.1
NK 126-729 6.2-34.6 91 107
24.5 12.8
36 16.4 61 6.9 60 6.5 252 11.9 423 23.5 87 9.5
NKT 29-299 2.2-12.4 1 33
0.2 4
17 7.7 20 2.2 65 7.0 98 4.6 9 0.5 159 17.3
CD20
59-329 3.0-19.0 0 26
0 3.1
38 22 69
17.1 6.6 10.5
69 7.8 224 24.1 237 11.2 241 147
13.4 9.9
57 6.2
CD19 61-321 3.3-19.3 28 3.3 73 11.1 72 8.1 224 24.1 237 11.2 243 13.5 57 6.2
CD20/CD27 12-68 0.8-3.6 8 1 1 18
0.3 2.8
2 0.2 16 1.7 25 1.2 5 0.3 4 0.4
CD20/CD5 14-159 0.7-9.7 13 1.6 35 5.4 47 5.3 104 11.2 N.A N.A 72 4 29 3.2
CD20/IgG 4-49 0.2-2.2 N.A N.A 6 0.9 1 0.1 6 0.6 13 0.6 34 2.3 1 0.1
CD20/IgD/IgM 50-278 2.3-16.9 N.A N.A 65 9.9 69 7.7 216 23.2 208 9.8 107 7.2 55 6

21
(+) CD3/CD28 (48h)! Full length! Soluble form!
Healthy donor! 31/31 (100 %)! 0/31 (0%)!
A.I.1 (c.151C>T)! 103/103(100%)!5 among 103 have!151C>T mutation!
0/103 (0%)!
D.II.1 (c.567+5G>C) ! 11/23 (47.8%)! 12/23 (52.2%)!
D.III.1 (c.567+5G>C) ! 23/51 (45.1%)! 28/51 (54.9%)!
Table S2. CTLA4 cDNA analysis of Family A and D. We have performed detailed CTLA4 cDNA analysis of Family D by cloning and sequencing. Enriched CD4+ T cells were stimulated with beads coated with anti-CD3 and anti-CD28 for 48 hours. CTLA4 cDNA was then amplified by PCR as described in Fig. S2A. Resulting PCR products were cloned into a pGEM-T vector and sequenced to evaluate the mutation or ratio of full-length vs soluble form of CTLA4. Healthy donor control and patient A.I.1, who carries a nonsense mutation resulting in a premature stop in exon 2, expressed the full-length isoform after stimulation. However, D.II.1 and D.III.1, who both carry the intronic splice site mutation (c.567+5 G>C), expressed the full-length and soluble CTLA-4 isoforms equally and there were no additional aberrantly spliced isoforms that encode a potentially functional protein with transmembrane domain.

22
!"#$%&'(&)*+,-,.,-/&
%,.010,2 345/ #$% /.56788.0 9888:;89;<5+ !"#$% =<>0!<10,2(0./<./&
?..,@0<10,2. #'A3%%;BC('=
%%;BC=?D ED3 F3 F? A?3CFF
D<!0<>&#=F ED GHD%II %*4>,% #0%*4 @<!!
+.;J9KK7 @*+;L;8MKJ;K9M F0../2./
$FB887;9MNM&@NMO?PGQ&$%B887;87N;&5N39K?R&$FB8898JK6J9N;&@NMO?PGQ&$%B8898J;K;8N9&5N39K? 8NJ6OMM7 8NM7 8NM7;
9888GQ&;*01&;&<>>/>/Q&@>S.1/+Q&T+/US/2@4Q&*<5-<5Q&.S"-011/+
3*4+,0!V<..,@0<1/!&,+"01,5<1*4Q&.4.1/-0@&>S5S.&/+41*/-<1,.S.Q&02.S>02&!/5/2!/21&!0<"/1/.&-/>>01S.Q&@/>0<@&!0./<./ 3 W W $ % E 3 3 3 V;NXM V8N79M MNJ6 V8NX9;79
+.KMX8XM68 @*+;L;8MKJKMKX F0../2./
$FB887;9MNM&@N697)PGQ&$%B887;87N;&5N%;87YR&$FB8898JK6J9N;&@N787)PGQ&$%B8898J;K;8N9&5N%96O? $? 8N8887 8N8887
9888G&Z&@>S.1/+ $? ( % W ( $ $? 3 3 3 9NMJ 8NKK9 ;NX;K ;N96;KX7
+.9JX;KOKJ6 @*+;L;8MKJ;6XX F0../2./
$FB887;9MNM&@N;JGP?Q&$%B887;87N;&5NDX[R&$FB8898JK6J9N;&@N;JGP?Q&$%B8898J;K;8N9&5NDX[ 8N888;J9 8N888O 8N888O
9888G&Z&@>S.1/+ $? ( ( % $ $ E 3 3 3 MN;M 8NXO7 98N9J ;N6OMM7;
+.9MMOXX8KK @*+;L;8MKJ77;7 F0../2./
$FB887;9MNM&@NJ;6GP?Q&$%B887;87N;&5NG98OHR&$FB8898JK6J9N;&@NJ;6GP?Q&$%B8898J;K;8N9&5NG98OH 8N88897M $? $? @>S.1/+ $? 3 W W $ $ $ 3 3 3 JNM9 9N9KM 7N9OX 9NJ98XO9
+.;89KKXOJ7 @*+;L;8MKJ;6XK F0../2./
$FB887;9MNM&@N;;)P3Q&$%B887;87N;&5NDX\R&$FB8898JK6J9N;&@N;;)P3Q&$%B8898J;K;8N9&5NDX\ 8N8888KK $? $? @>S.1/+ $? ( ( ( $ $ E 3 3 3 JN6M 8N7J9 KN9K; ;N88O6O
+.9867MM; @*+;L;8MKJ7MK9 F0../2./
$FB887;9MNM&@N;K;3P)Q&$%B887;87N;&5NFO93R&$FB8898JK6J9N;&@N;K;3P)Q&$%B8898J;K;8N9&5NFO93 $? $? $?
@>S.1/+&Z&*<5-<5 $? 3 W W $ $ $ 3 3 3 8N9MX 8N899 JNOOX V9N;67JK
+.JK8MMJ7M6 @*+;L;8MKJ7M6K F0../2./
$FB887;9MNM&@N;6X?PGQ&$%B887;87N;&5NFO8=R&$FB8898JK6J9N;&@N;6X?PGQ&$%B8898J;K;8N9&5NFO8= 8N8888KK $? $? $? $? 3 W W $ $ E 3 3 3 ;N7J 8NK7J JN;;M V9N9O8KO
+.J6KK68JXX @*+;L;8MKJK7;K F0../2./
$FB887;9MNM&@N66M?PGQ&$%B887;87N;&5N';;;=R&$FB8898JK6J9N;&@N];O?PG $? $? $? $? $? 3 % W ( ( $ 3 3 3 7N7K ;N996 KNX99 9NOM9997
+.9OOO9;O;7 @*+;L;8MKJ6;8X F0../2./
$FB887;9MNM&@N767?PGQ$%B887;87N;&&5NF9XO=R&$FB8898JK6J9N;&@NM7KI77;?PG $? $? $? $? $? 3 W W $ ( $ 3 3 3 7N;; 9NOX6 XNX8J 9N6J6OX6
+.JK68JXKO6 @*+;L;8MKJ7M76 F0../2./
$FB887;9MNM&@N;7K)P3Q&$%B887;87N;&5N?X6=R&$FB8898JK6J9N;&@N;7K)P3Q&$%B8898J;K;8N9&5N?X6= 8N8888KK $? $? $? $? 3 ( ( ( ( F 3 3 3 7N;7 ;NMMM 9KNX9 ;N8M7;X7
+.9M67M9X79 @*+;L;8MKJ;6OJ F0../2./
$FB887;9MNM&@N;X?PGQ&$%B887;87N;&5N^98HR&$FB8898JK6J9N;&@N;X?PGQ&$%B8898J;K;8N9&5N^98H 8N8888KK $? $? $? $? 3 W W $ $ E 3 3 3 V9NO; V8N;8M 6N98K V8N9OO99
+.J6O76K6J8 @*+;L;8MKJ;K7O F0../2./
$FB887;9MNM&@NOM)P3Q&$%B887;87N;&5N%J;#R&$FB8898JK6J9N;&@NOM)P3Q&$%B8898J;K;8N9&5N%J;#& 8N8888KK $? $? $? $? 3 ( ( $ ( E 3 3 3 7N;7 ;NOM9 ON7O9 9N9OO7;J
+.J8XK;MJ @*+;L;8MKJXO9O J_`3D
$FB887;9MNML@N]9JXMGP?R&$FB8898JK6J9N;&@N]9M;9GP?& $? $? 8NJ;M
9888GQ&@>S.1/+Q&T+/US/2@4Q&*<5-<5Q&.S"-011/+
G+<a/_.&(0./<./Q&C<.*0-,1,&1*4+,0!010.Q&@/>0<@&!0./<./ $? $? $? $? $? $? $? $? $? $? $? $? $?
+.;J9KJ7 @*+;L;8M6OJXK6 '21/+:/20@&b)(;Xc!0.1YO8;M8dQ)3E?Mc!0.1YJX6J7de
$)B88888;N9;&:N;8JX;O97JGP3&c@*+;L;8M6OJXK6d $? 8N6 8NJOO
9888GQ&;*01&;<>>/>/Q&@>S.1/+Q&T+/US/2@4Q&*<5-<5Q&.S"-011/+
D*/S-<1,0!&<+1*+010.Q&<>>/+:0@&+*02010. $? $? $? $? $? $? $? $? $? $? $? $? V8NK;9M;
)3E?M&1+<2.@+051f5+,1/02&'(.L&$FB887;9MNM&c9OKK&"<./.df$%B887;87N;&cTS>>V>/2:1*&0.,T,+-dR&$FB8898JK6J9N;&c7;7&"<./.df$%B8898J;K;8N9&c.,>S">/&0.,T,+-d$?Y&2,1&<a<0><">/g#$%&(?3?W?#H#g/.56788.0&b$CEW'&Gh&Hi,-/&#/US/2@02:&%+,j/@1e&T+/US/2@49888:;89;<5+&b9888&G/2,-/.e&T+/US/2@4gA`$)3'h$?E&%DH(')3'h$#g#'A3L&(b/>/1/+0,S.eR&3b,>/+<1/!e%%;BC=?D&b%,>45*/2;&F/2!<>0<2&!0./<./e&<2!&%%;BC('=&b%,>4%*/2;&@,-5>/i&5*/2,145/eL&(&5+,"<">4B!<-<:02:R&%&5,..0">4B!<-<:02:R&W&"/20:2ED3L&(b/>/1/+0,S.eR&$b/S1+<>eR&`b2k2,l2eF3&bFS1<10,23<.1/+eL&(&!0./<./B@<S.02:&5/+&<>:,+01*-R&?&!0./<./B@<S.02:&5/+&/i1/+2<>&02T,R&$&5,>4-,+5*0.-&c5/+&<>:,+01*-dR&%&5,>4-,+5*0.-&b5/+&/i1/+2<>&02T,eF?&bFS1<10,2?../..,+eL&5+/!0@1/!&TS2@10,2<>&*0:*R&-/!0S-Q&5+/!0@1/!&2,2VTS2@10,2<>&>,lR&2/S1+<>g$`)EHh3'(H&%h#'3'h$&)h$#HD=?3'h$gA?3CFF&bAS2@10,2<>&?2<>4.0.&1*+,S:*&C0!!/2&F<+k,a&F,!/>.e&(&5+/!0@1.&@<2@/+&<..,@0<1/!&!+0a/+&-S1<10,2.&3&5+/!0@1.&,1*/+&!0./<./&@<S.02:&,+&5S1<10a/&2/S1+<>&-S1<10,2.&<2!&@<2@/+&<..,@0<1/!&5<../2:/+&-S1<10,2.D<!0<>#=F&bF/1<#=Fe&<2!&ED&bF/1<EDe&<>:,+01*-.&5+/!0@1&F/2!/>0<2&"S1&2,1&@,-5>/i&!0./<./&a<+0<21.&V&(b/>/1/+0,S.eR&3b,>/+<1/!eGHD%II&bG/2,-0@&Ha,>S10,2<+4&D<1/&%+,T0>02:e&.@,+/&1*+/.*,>!&,T&;&,+&:+/<1/+&02!0@<1/.&1+S>4&@,2.1+<02/!&.01/.%*4>,%&"<./l0./&5+0-<1/&@,2./+a<10,2&.@,+/.&+<2:/&T+,-&V9M&1,&I6&*0:*/+&.@,+/.&02!0@<1/&*0:*/+&@,2./+a<10,2�%*4&b#'1/V.5/@0T0@&%Cm>,:/2/10@&<2<>4.0.e&*0:*/+&.@,+/.&02!0@<1/&*0:*/+&@,2./+a<10,2gh3CHD&3hhE#g)?((L&\*,>/V:/2,-/&),-"02/!&?22,1<10,2V(/5/2!/21&(/5>/10,2&b)?((e&)V.@,+/R&"<./!&,2&@,2./+a<10,2&-/[email protected]&TS2@10,2<>&:/2,-0@&!<1<R&1+<2.@+051&02T,+-<10,2Q&5+,1/02V>/a/>&.@,+/.R&*0:*/+&)V.@,+/.&02!0@<1/&1*<1&<&a<+0<21&0.&>0k/>4&1,&"/&1,&"/&!/>/1/+0,S.
!"#$%&'(()()&*%)+,)#-. /"$"#*$%0'1"-2
Table S3. Bioinformatics analysis of dbSNP 138 CTLA4 SNPs. Bioinformatics analysis using various bioinformatics algorithms was performed to predict the possible functional consequences of the CTLA4 SNPs that are listed in NCBI dbSNP build 138.

23
AUTHOR CONTRIBUTIONS H.S.K. performed experiments, analyzed data, and wrote the manuscript. W.O. performed experiments, analyzed data, and wrote the manuscript. B.L. performed experiments, analyzed data, and wrote the manuscript. E.K.D. performed experiments and analyzed data. J.E.N. performed genomic DNA sequencing analysis, bioinformatics analysis for whole exome sequencing experiments, and candidate gene discovery. D.T.A. performed experiments. J.N.S. performed experiments and analyzed data H.H.W performed experiments and analyzed data D.Q.T. performed experiments and analyzed data. J.S. performed experiments, genomic DNA sequencing analysis, and data analysis. Y. Z. performed genomic DNA sequencing analysis, bioinformatics analysis for whole exome sequencing experiments, and candidate gene discovery. D.M.F. supervised research and data analysis. B.D. evaluated patients and collected data. P.S. evaluated patients and collected data. L.R.F. evaluated and prepared data from clinical imaging studies. C.A.F. evaluated patients and collected data. S. Pr. evaluated patients and collected data. C.K. evaluated patients and collected data. T.H. evaluated patients and collected data. C.M.S. evaluated patients and collected data. A.H. evaluated patients and collected data. V. K. R. evaluated patients, provided patient care and collected data. H.C.S. evaluated patients and collected data. D.K. performed histological analyses of patient samples L.D.N evaluated patients and collected data, provided advice Y.R. performed experiments. K.N.O. evaluated patients and collected data. J.M. performed genomic DNA sequencing analysis, bioinformatics analysis for whole exome sequencing experiments, and candidate gene discovery. J.H. performed genomic DNA sequencing analysis and bioinformatics analysis for whole exome sequencing experiments. S.Pi. performed histological analyses of patient samples, prepared the manuscript J.B.O planned and supervised whole exome sequencing experiments. E.M. performed experiments and analyzed data, provided advice. T.A.F. supervised research and data analysis and provided advice. S.M.H. supervised research and data analysis and provided advice. M.J.L planned and supervised research and data analysis, and prepared manuscript. S.G.T. planned and supervised experiments, analyzed data and prepared manuscript. G.U. coordinated research, supervised and planned experimental work, analyzed data and prepared the manuscript. All authors discussed and revised the manuscript.

1
References
1. J. A. Bluestone, H. Auchincloss, G. T. Nepom, D. Rotrosen, E. W. St. Clair, L. A.
Turka, The Immune Tolerance Network at 10 years: Tolerance research at the
bedside. Nat. Rev. Immunol. 10, 797–803 (2010). Medline doi:10.1038/nri2869
2. C. C. Goodnow, Multistep pathogenesis of autoimmune disease. Cell 130, 25–35
(2007). Medline doi:10.1016/j.cell.2007.06.033
3. S. Sakaguchi, T. Yamaguchi, T. Nomura, M. Ono, Regulatory T cells and immune
tolerance. Cell 133, 775–787 (2008). Medline doi:10.1016/j.cell.2008.05.009
4. S. Z. Josefowicz, L. F. Lu, A. Y. Rudensky, Regulatory T cells: Mechanisms of
differentiation and function. Annu. Rev. Immunol. 30, 531–564 (2012). Medline
doi:10.1146/annurev.immunol.25.022106.141623
5. C. Benoist, D. Mathis, Treg cells, life history, and diversity. Cold Spring Harb.
Perspect. Biol. 4, a007021 (2012). Medline doi:10.1101/cshperspect.a007021
6. B. T. Fife, J. A. Bluestone, Control of peripheral T-cell tolerance and autoimmunity
via the CTLA-4 and PD-1 pathways. Immunol. Rev. 224, 166–182 (2008).
Medline doi:10.1111/j.1600-065X.2008.00662.x
7. L. Chen, D. B. Flies, Molecular mechanisms of T cell co-stimulation and co-inhibition.
Nat. Rev. Immunol. 13, 227–242 (2013). Medline doi:10.1038/nri3405
8. K. Wing, Y. Onishi, P. Prieto-Martin, T. Yamaguchi, M. Miyara, Z. Fehervari, T.
Nomura, S. Sakaguchi, CTLA-4 control over Foxp3+ regulatory T cell function.
Science 322, 271–275 (2008). Medline doi:10.1126/science.1160062
9. O. S. Qureshi, Y. Zheng, K. Nakamura, K. Attridge, C. Manzotti, E. M. Schmidt, J.
Baker, L. E. Jeffery, S. Kaur, Z. Briggs, T. Z. Hou, C. E. Futter, G. Anderson, L.
S. Walker, D. M. Sansom, Trans-endocytosis of CD80 and CD86: A molecular
basis for the cell-extrinsic function of CTLA-4. Science 332, 600–603 (2011).
Medline doi:10.1126/science.1202947

2
10. M. F. Krummel, J. P. Allison, CTLA-4 engagement inhibits IL-2 accumulation and
cell cycle progression upon activation of resting T cells. J. Exp. Med. 183, 2533–
2540 (1996). Medline doi:10.1084/jem.183.6.2533
11. E. A. Tivol, F. Borriello, A. N. Schweitzer, W. P. Lynch, J. A. Bluestone, A. H.
Sharpe, Loss of CTLA-4 leads to massive lymphoproliferation and fatal
multiorgan tissue destruction, revealing a critical negative regulatory role of
CTLA-4. Immunity 3, 541–547 (1995). Medline doi:10.1016/1074-
7613(95)90125-6
12. P. Waterhouse, J. M. Penninger, E. Timms, A. Wakeham, A. Shahinian, K. P. Lee, C.
B. Thompson, H. Griesser, T. W. Mak, Lymphoproliferative disorders with early
lethality in mice deficient in Ctla-4. Science 270, 985–988 (1995). Medline
doi:10.1126/science.270.5238.985
13. C. A. Chambers, T. J. Sullivan, J. P. Allison, Lymphoproliferation in CTLA-4-
deficient mice is mediated by costimulation-dependent activation of CD4+ T cells.
Immunity 7, 885–895 (1997). Medline doi:10.1016/S1074-7613(00)80406-9
14. G. Herrero-Beaumont, M. J. Martínez Calatrava, S. Castañeda, Mecanismo de acción
de abatacept: Concordancia con su perfil clínico. Reumatol. Clin. 8, 78–83 (2012).
Medline doi:10.1016/j.reuma.2011.08.002
15. M. K. Callahan, J. D. Wolchok, J. P. Allison, Anti-CTLA-4 antibody therapy:
Immune monitoring during clinical development of a novel immunotherapy.
Semin. Oncol. 37, 473–484 (2010). Medline
doi:10.1053/j.seminoncol.2010.09.001
16. H. Ueda, J. M. Howson, L. Esposito, J. Heward, H. Snook, G. Chamberlain, D. B.
Rainbow, K. M. Hunter, A. N. Smith, G. Di Genova, M. H. Herr, I. Dahlman, F.
Payne, D. Smyth, C. Lowe, R. C. Twells, S. Howlett, B. Healy, S. Nutland, H. E.
Rance, V. Everett, L. J. Smink, A. C. Lam, H. J. Cordell, N. M. Walker, C.
Bordin, J. Hulme, C. Motzo, F. Cucca, J. F. Hess, M. L. Metzker, J. Rogers, S.
Gregory, A. Allahabadia, R. Nithiyananthan, E. Tuomilehto-Wolf, J. Tuomilehto,
P. Bingley, K. M. Gillespie, D. E. Undlien, K. S. Rønningen, C. Guja, C. Ionescu-

3
Tîrgovişte, D. A. Savage, A. P. Maxwell, D. J. Carson, C. C. Patterson, J. A.
Franklyn, D. G. Clayton, L. B. Peterson, L. S. Wicker, J. A. Todd, S. C. Gough,
Association of the T-cell regulatory gene CTLA4 with susceptibility to
autoimmune disease. Nature 423, 506–511 (2003). Medline
doi:10.1038/nature01621
17. P. Attia, G. Q. Phan, A. V. Maker, M. R. Robinson, M. M. Quezado, J. C. Yang, R.
M. Sherry, S. L. Topalian, U. S. Kammula, R. E. Royal, N. P. Restifo, L. R.
Haworth, C. Levy, S. A. Mavroukakis, G. Nichol, M. J. Yellin, S. A. Rosenberg,
Autoimmunity correlates with tumor regression in patients with metastatic
melanoma treated with anti-cytotoxic T-lymphocyte antigen-4. J. Clin. Oncol. 23,
6043–6053 (2005). Medline doi:10.1200/JCO.2005.06.205
18. G. Q. Phan, J. C. Yang, R. M. Sherry, P. Hwu, S. L. Topalian, D. J.
Schwartzentruber, N. P. Restifo, L. R. Haworth, C. A. Seipp, L. J. Freezer, K. E.
Morton, S. A. Mavroukakis, P. H. Duray, S. M. Steinberg, J. P. Allison, T. A.
Davis, S. A. Rosenberg, Cancer regression and autoimmunity induced by
cytotoxic T lymphocyte-associated antigen 4 blockade in patients with metastatic
melanoma. Proc. Natl. Acad. Sci. U.S.A. 100, 8372–8377 (2003). Medline
doi:10.1073/pnas.1533209100
19. D. Quandt, H. Hoff, M. Rudolph, S. Fillatreau, M. C. Brunner-Weinzierl, A new role
of CTLA-4 on B cells in thymus-dependent immune responses in vivo. J.
Immunol. 179, 7316–7324 (2007). Medline doi:10.4049/jimmunol.179.11.7316
20. D. A. Kaminski, C. Wei, Y. Qian, A. F. Rosenberg, I. Sanz, Advances in human B
cell phenotypic profiling. Front. Immunol. 3, 302 (2012). Medline
doi:10.3389/fimmu.2012.00302
21. M. Rakhmanov, B. Keller, S. Gutenberger, C. Foerster, M. Hoenig, G. Driessen, M.
van der Burg, J. J. van Dongen, E. Wiech, M. Visentini, I. Quinti, A. Prasse, N.
Voelxen, U. Salzer, S. Goldacker, P. Fisch, H. Eibel, K. Schwarz, H. H. Peter, K.
Warnatz, Circulating CD21low B cells in common variable immunodeficiency
resemble tissue homing, innate-like B cells. Proc. Natl. Acad. Sci. U.S.A. 106,
13451–13456 (2009). Medline doi:10.1073/pnas.0901984106

4
22. I. Isnardi, Y. S. Ng, L. Menard, G. Meyers, D. Saadoun, I. Srdanovic, J. Samuels, J.
Berman, J. H. Buckner, C. Cunningham-Rundles, E. Meffre, Complement
receptor 2/CD21- human naive B cells contain mostly autoreactive unresponsive
clones. Blood 115, 5026–5036 (2010). Medline doi:10.1182/blood-2009-09-
243071
23. K. Warnatz, A. Denz, R. Dräger, M. Braun, C. Groth, G. Wolff-Vorbeck, H. Eibel,
M. Schlesier, H. H. Peter, Severe deficiency of switched memory B cells
(CD27+IgM–IgD–) in subgroups of patients with common variable
immunodeficiency: A new approach to classify a heterogeneous disease. Blood
99, 1544–1551 (2002). Medline doi:10.1182/blood.V99.5.1544
24. C. C. Goodnow, R. Brink, E. Adams, Breakdown of self-tolerance in anergic B
lymphocytes. Nature 352, 532–536 (1991). Medline doi:10.1038/352532a0
25. S. Moir, J. Ho, A. Malaspina, W. Wang, A. C. DiPoto, M. A. O’Shea, G. Roby, S.
Kottilil, J. Arthos, M. A. Proschan, T. W. Chun, A. S. Fauci, Evidence for HIV-
associated B cell exhaustion in a dysfunctional memory B cell compartment in
HIV-infected viremic individuals. J. Exp. Med. 205, 1797–1805 (2008). Medline
doi:10.1084/jem.20072683
26. T. Kinnunen, N. Chamberlain, H. Morbach, J. Choi, S. Kim, J. Craft, L. Mayer, C.
Cancrini, L. Passerini, R. Bacchetta, H. D. Ochs, T. R. Torgerson, E. Meffre,
Accumulation of peripheral autoreactive B cells in the absence of functional
human regulatory T cells. Blood 121, 1595–1603 (2013). Medline
doi:10.1182/blood-2012-09-457465
27. S. Price, P. A. Shaw, A. Seitz, G. Joshi, J. Davis, J. E. Niemela, K. Perkins, R. L.
Hornung, L. Folio, P. S. Rosenberg, J. M. Puck, A. P. Hsu, B. Lo, S. Pittaluga, E.
S. Jaffe, T. A. Fleisher, V. K. Rao, M. J. Lenardo, Natural history of autoimmune
lymphoproliferative syndrome associated with FAS gene mutations. Blood 123,
1989–1999 (2014). Medline doi:10.1182/blood-2013-10-535393

5
28. M. E. Conley, J. L. Casanova, Discovery of single-gene inborn errors of immunity by
next generation sequencing. Curr. Opin. Immunol. 30, 17–23 (2014). Medline
doi:10.1016/j.coi.2014.05.004
29. H. S. Kuehn, J. E. Niemela, A. Rangel-Santos, M. Zhang, S. Pittaluga, J. L. Stoddard,
A. A. Hussey, M. O. Evbuomwan, D. A. Priel, D. B. Kuhns, C. L. Park, T. A.
Fleisher, G. Uzel, J. B. Oliveira, Loss-of-function of the protein kinase Cδ
(PKCδ) causes a B-cell lymphoproliferative syndrome in humans. Blood 121,
3117–3125 (2013). Medline doi:10.1182/blood-2012-12-469544
30. A. McKenna, M. Hanna, E. Banks, A. Sivachenko, K. Cibulskis, A. Kernytsky, K.
Garimella, D. Altshuler, S. Gabriel, M. Daly, M. A. DePristo, The Genome
Analysis Toolkit: A MapReduce framework for analyzing next-generation DNA
sequencing data. Genome Res. 20, 1297–1303 (2010). Medline
doi:10.1101/gr.107524.110
31. M. A. DePristo, E. Banks, R. Poplin, K. V. Garimella, J. R. Maguire, C. Hartl, A. A.
Philippakis, G. del Angel, M. A. Rivas, M. Hanna, A. McKenna, T. J. Fennell, A.
M. Kernytsky, A. Y. Sivachenko, K. Cibulskis, S. B. Gabriel, D. Altshuler, M. J.
Daly, A framework for variation discovery and genotyping using next-generation
DNA sequencing data. Nat. Genet. 43, 491–498 (2011). Medline
doi:10.1038/ng.806
32. K. Wang, M. Li, H. Hakonarson, ANNOVAR: Functional annotation of genetic
variants from high-throughput sequencing data. Nucleic Acids Res. 38, e164
(2010). Medline doi:10.1093/nar/gkq603
33. D. Seelow, J. M. Schwarz, M. Schuelke, GeneDistiller—distilling candidate genes
from linkage intervals. PLOS ONE 3, e3874 (2008). Medline
doi:10.1371/journal.pone.0003874
34. D. Forni, R. Cagliani, U. Pozzoli, M. Colleoni, S. Riva, M. Biasin, G. Filippi, L. De
Gioia, F. Gnudi, G. P. Comi, N. Bresolin, M. Clerici, M. Sironi, A 175 million
year history of T cell regulatory molecules reveals widespread selection, with

6
adaptive evolution of disease alleles. Immunity 38, 1129–1141 (2013). Medline
doi:10.1016/j.immuni.2013.04.008
35. H. Hu, C. D. Huff, B. Moore, S. Flygare, M. G. Reese, M. Yandell, VAAST 2.0:
Improved variant classification and disease-gene identification using a
conservation-controlled amino acid substitution matrix. Genet. Epidemiol. 37,
622–634 (2013). Medline doi:10.1002/gepi.21743