Embed Size (px)
Citation preview
www.sciencetranslationalmedicine.org/cgi/content/full/5/213/213ra164/DC1
Supplementary Materials for
HIV-1 Vpr Induces Adipose Dysfunction in Vivo Through Reciprocal Effects on PPAR/GR Co-Regulation
Neeti Agarwal, Dinakar Iyer, Sanjeet G. Patel, Rajagopal V. Sekhar, Terry M. Phillips,
Ulrich Schubert, Toni Oplt, Eric D. Buras, Susan L. Samson, Jacob Couturier, Dorothy E. Lewis, Maria C. Rodriguez-Barradas, Farook Jahoor, Tomoshige Kino, Jeffrey B. Kopp,
Ashok Balasubramanyam*
*Corresponding author. E-mail: [email protected]
Published 27 November 2013, Sci. Transl. Med. 5, 213ra164 (2013) DOI: 10.1126/scitranslmed.3007148
The PDF file includes:
Fig. S1. Plasma Vpr levels in mice injected with sVpr. Fig. S2. Expression of adiponectin and aP2 in PGF and IF of Vpr-Tg. Fig. S3. Gating strategy for flow cytometry. Fig. S4. Vpr does not block differentiation genes in 3T3-L1 72 hours after differentiation induction. Fig. S5. Hyperglycemia and hypertriglyceridemia in Vpr-Tg. Fig. S6. Paracrine effect of Vpr. Table S1. Vpr in human liver and adipose tissue. Table S2. Palmitate flux in a second line of Vpr-Tg. Table S3. Twenty-four–hour calorimetry. Table S4. Mouse weight and food intake in Vpr-Tg and sVpr-treated mice. Table S5. Primer sequences for ChIP qPCR. Reference (49)
Supplementary Figure S1: Plasma Vpr levels in mice injected with sVpr.
* **
** *
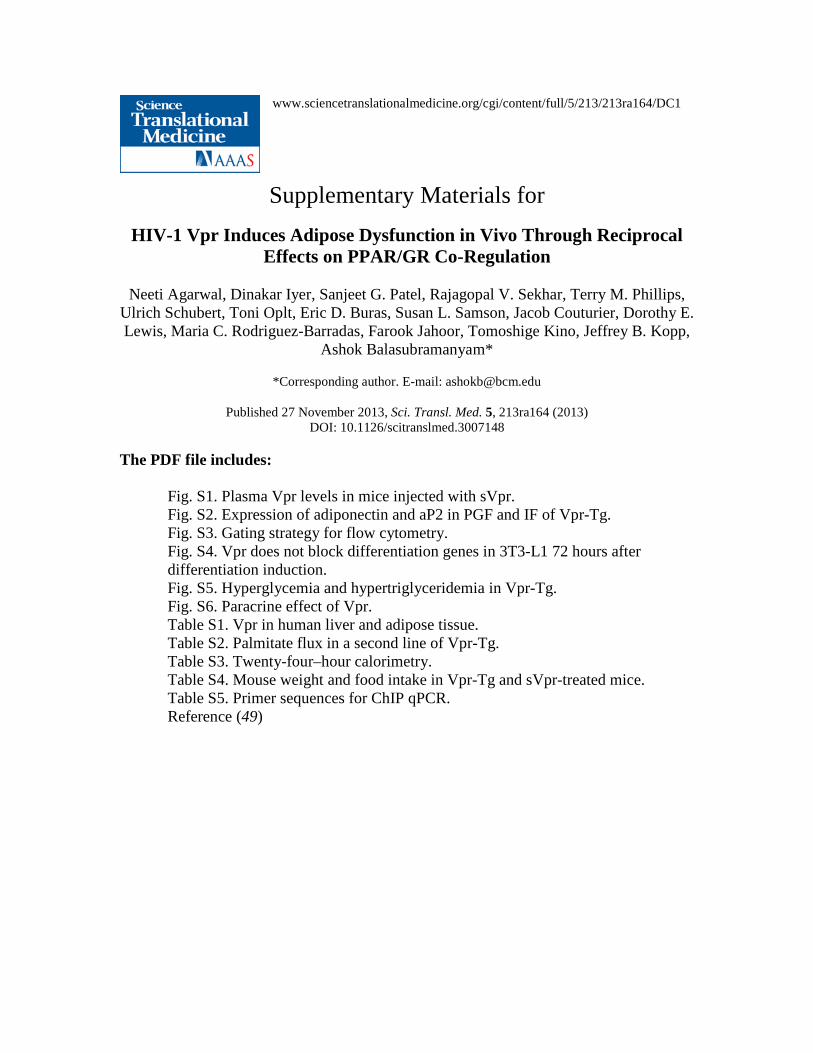
Supplementary Figure S2: Expression of adiponectin and aP2 in PGF and IF of Vpr–Tg. A. Reduced AdipoQ (P = 0.02) and ap2 (P = 0.009) mRNA expression in inguinal fat (IF) of Vpr-Tg compared to WT mice ; rosiglitazone treatment had no effect. N=8 per group. B. Reduced AdipoQ (P = 0.01) and ap2 (P = 0.03) mRNA expression in perigonadal fat (PGF) of Vpr-Tg compared to WT mice ; rosiglitazone treatment had no effect. N=8 per group. *P < 0.05, **P < 0.01
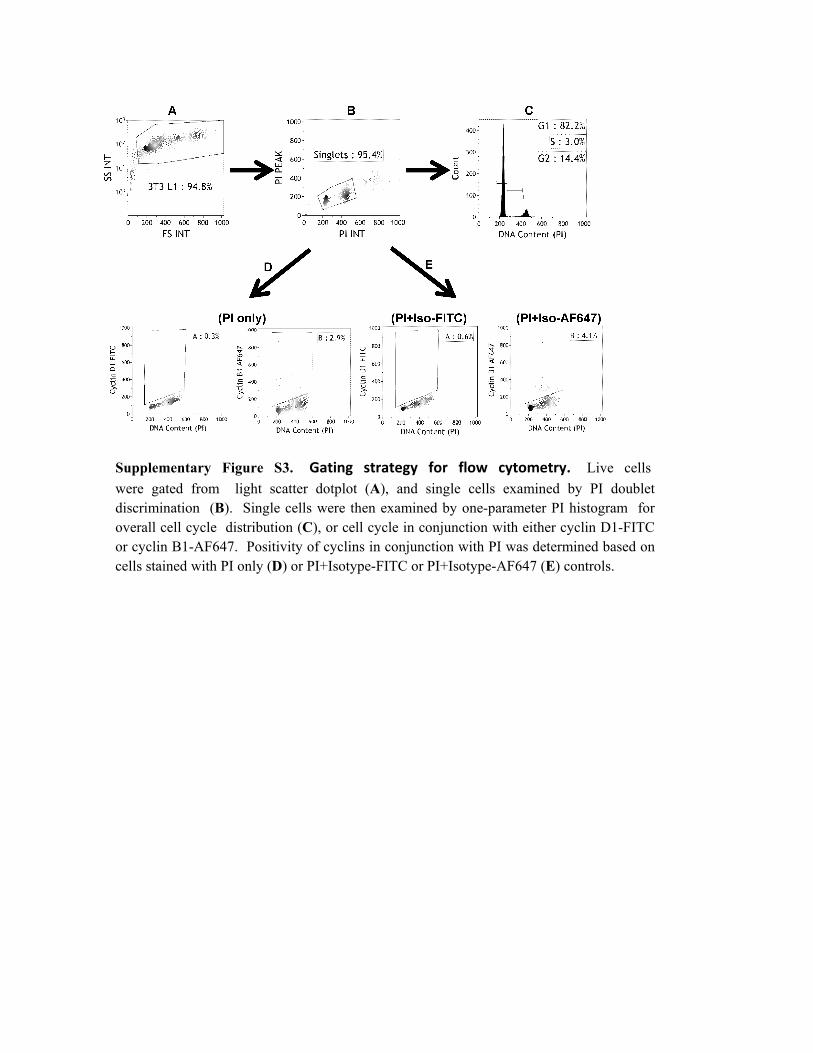
Supplementary Figure S3. ating strategy for flow cytometry. Live cells were gated from light scatter dotplot (A), and single cells examined by PI doublet discrimination (B). Single cells were then examined by one-parameter PI histogram for overall cell cycle distribution (C), or cell cycle in conjunction with either cyclin D1-FITC or cyclin B1-AF647. Positivity of cyclins in conjunction with PI was determined based on cells stained with PI only (D) or PI+Isotype-FITC or PI+Isotype-AF647 (E) controls.
G
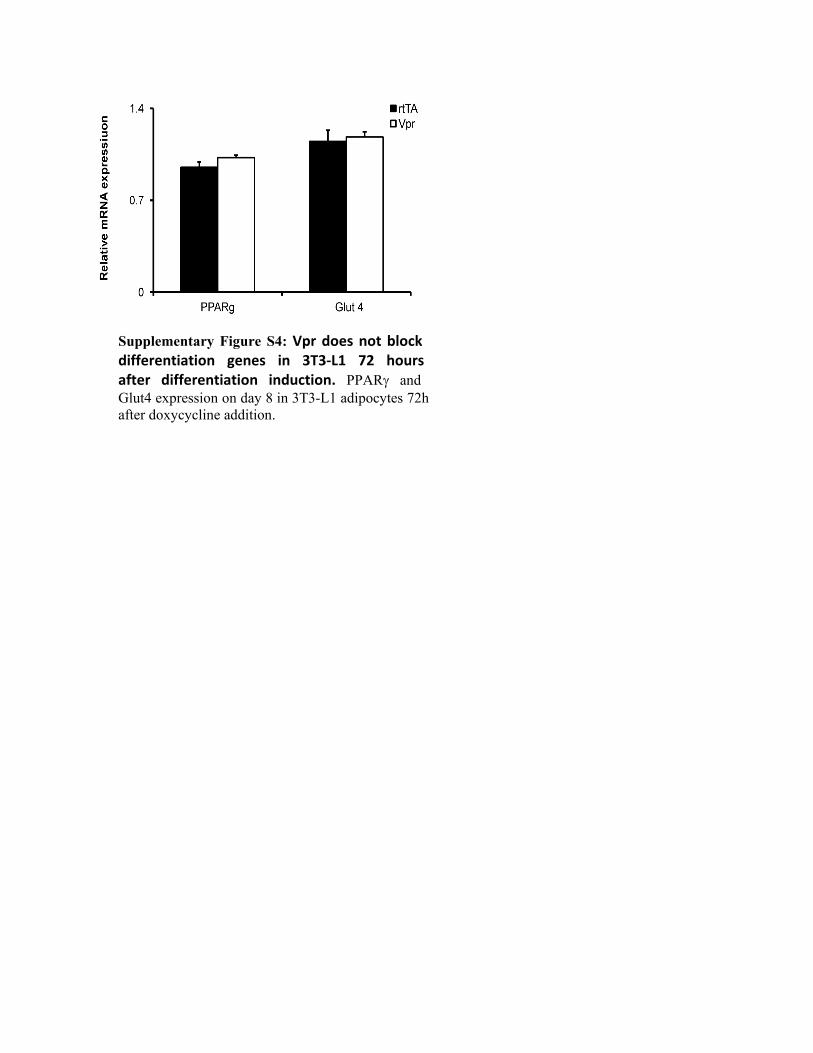
Supplementary Figure S4: Vpr does not block differentiation genes in 3T3-L1 72 hours
differentiation induction. PPARγ and -L1 adipocytes 72h
after doxycycline addition.Glut4 expression on day 8 in 3T3after
AKT
AKT-p(S473)
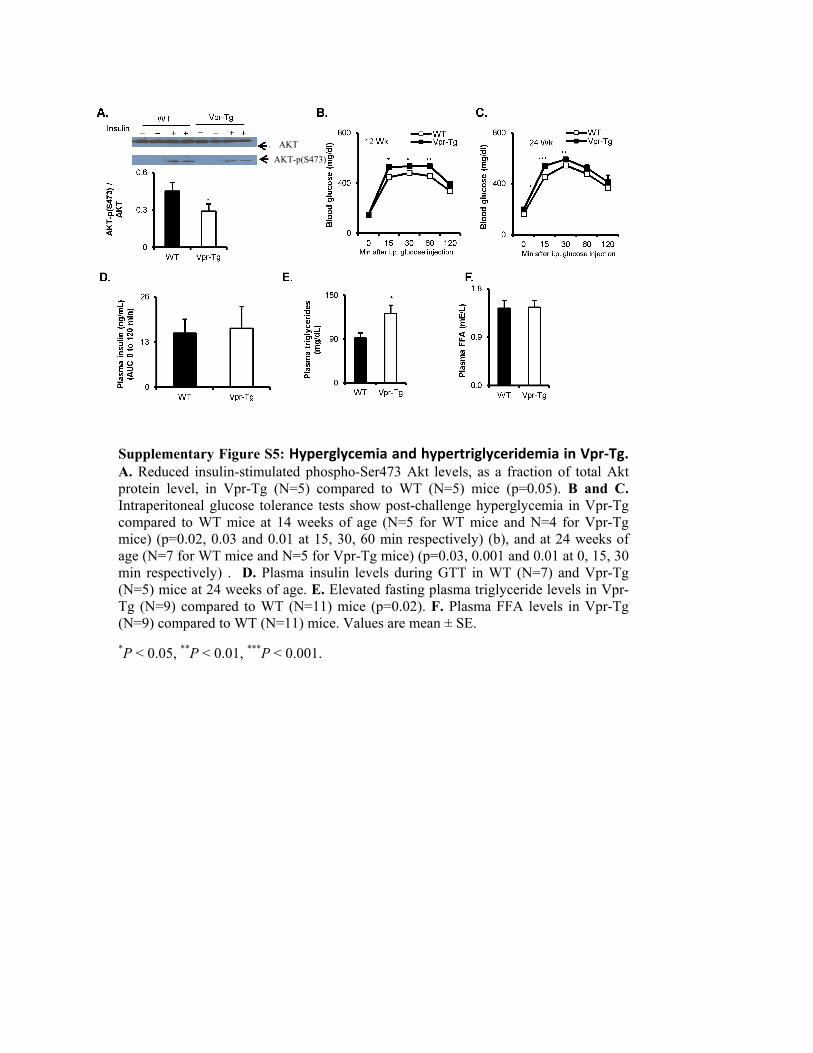
Supplementary Figure S5: Hyperglycemia and hypertriglyceridemia in Vpr-Tg. A. Reduced insulin-stimulated phospho-Ser473 Akt levels, as a fraction of total Akt protein level, in Vpr-Tg (N=5) compared to WT (N=5) mice (p=0.05). B and C. Intraperitoneal glucose tolerance tests show post-challenge hyperglycemia in Vpr-Tg compared to WT mice at 14 weeks of age (N=5 for WT mice and N=4 for Vpr-Tg mice) (p=0.02, 0.03 and 0.01 at 15, 30, 60 min respectively) (b), and at 24 weeks of age (N=7 for WT mice and N=5 for Vpr-Tg mice) (p=0.03, 0.001 and 0.01 at 0, 15, 30 min respectively) . D. Plasma insulin levels during GTT in WT (N=7) and Vpr-Tg (N=5) mice at 24 weeks of age. E. Elevated fasting plasma triglyceride levels in Vpr-Tg (N=9) compared to WT (N=11) mice (p=0.02). F. Plasma FFA levels in Vpr-Tg (N=9) compared to WT (N=11) mice. Values are mean ± SE. *P < 0.05, **P < 0.01, ***P < 0.001.
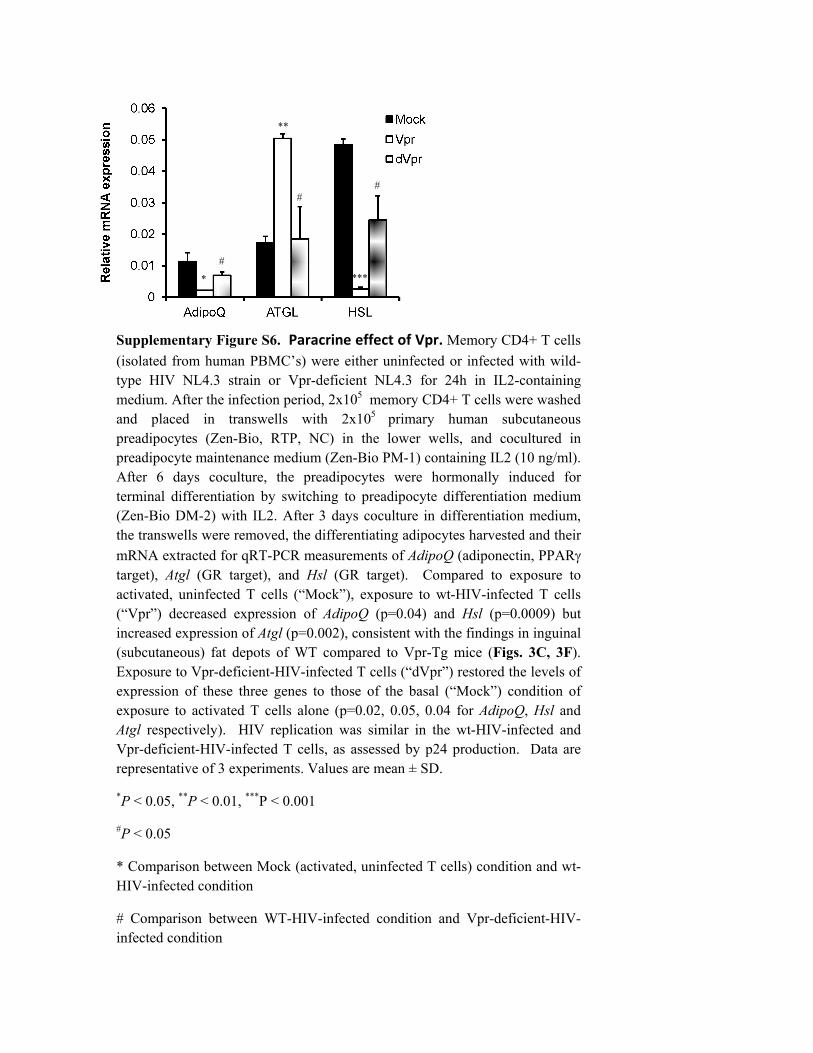
Supplementary Figure S6. Paracrine effect of Vpr. Memory CD4+ T cells (isolated from human PBMC’s) were either uninfected or infected with wild-type HIV NL4.3 strain or Vpr-deficient NL4.3 for 24h in IL2-containing medium. After the infection period, 2x10⁵ memory CD4+ T cells were washed and placed in transwells with 2x10⁵ primary human subcutaneous preadipocytes (Zen-Bio, RTP, NC) in the lower wells, and cocultured in preadipocyte maintenance medium (Zen-Bio PM-1) containing IL2 (10 ng/ml). After 6 days coculture, the preadipocytes were hormonally induced for terminal differentiation by switching to preadipocyte differentiation medium (Zen-Bio DM-2) with IL2. After 3 days coculture in differentiation medium, the transwells were removed, the differentiating adipocytes harvested and their mRNA extracted for qRT-PCR measurements of AdipoQ (adiponectin, PPARγ target), Atgl (GR target), and Hsl (GR target). Compared to exposure to activated, uninfected T cells (“Mock”), exposure to wt-HIV-infected T cells (“Vpr”) decreased expression of AdipoQ (p=0.04) and Hsl (p=0.0009) but increased expression of Atgl (p=0.002), consistent with the findings in inguinal (subcutaneous) fat depots of WT compared to Vpr-Tg mice (Figs. 3C, 3F). Exposure to Vpr-deficient-HIV-infected T cells (“dVpr”) restored the levels of expression of these three genes to those of the basal (“Mock”) condition of exposure to activated T cells alone (p=0.02, 0.05, 0.04 for AdipoQ, Hsl and Atgl respectively). HIV replication was similar in the wt-HIV-infected and Vpr-deficient-HIV-infected T cells, as assessed by p24 production. Data are representative of 3 experiments. Values are mean ± SD.
*P < 0.05, **P < 0.01, ***P < 0.001
#P < 0.05
* Comparison between Mock (activated, uninfected T cells) condition and wt-HIV-infected condition
# Comparison between WT-HIV-infected condition and Vpr-deficient-HIV-infected condition
*
#
**
#
***
#
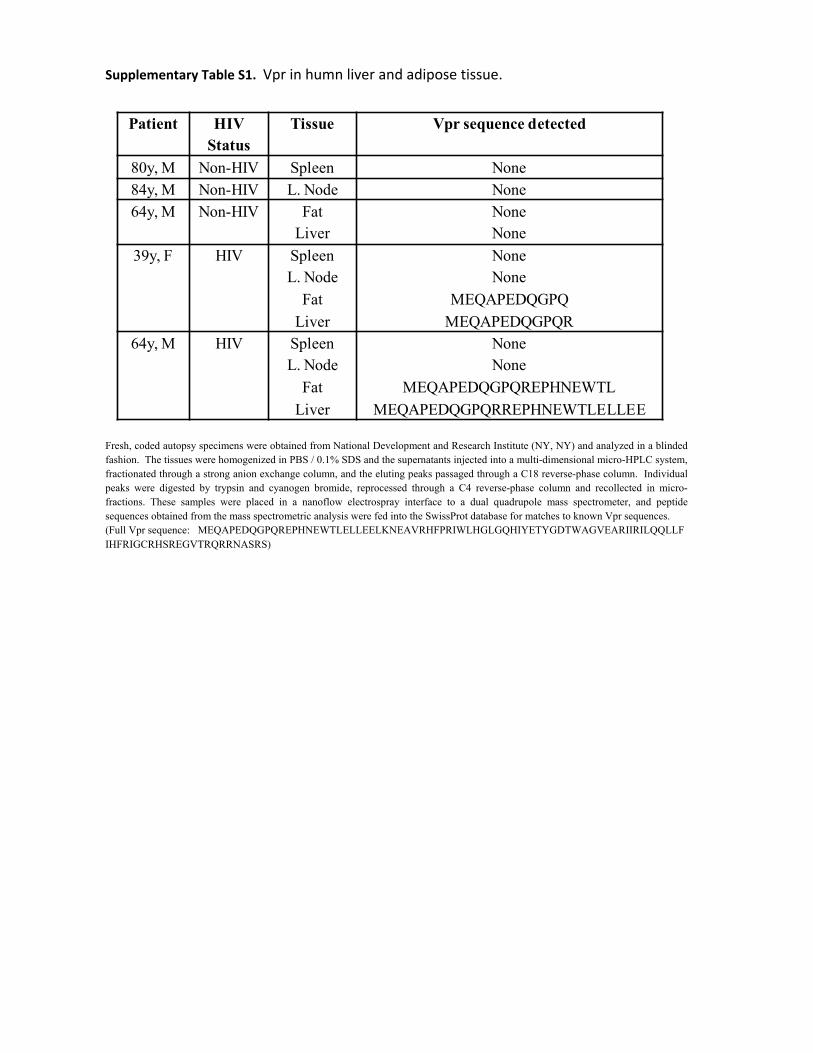
Supplementary Table S1. Vpr in humn liver and adipose tissue.
Patient HIV Status
Tissue Vpr sequence detected
80y, M Non-HIV Spleen None84y, M Non-HIV L. Node None64y, M Non-HIV Fat
LiverNoneNone
39y, F HIV SpleenL. Node
FatLiver
NoneNone
MEQAPEDQGPQMEQAPEDQGPQR
64y, M HIV SpleenL. Node
FatLiver
NoneNone
MEQAPEDQGPQREPHNEWTLMEQAPEDQGPQRREPHNEWTLELLEE
Fresh, coded autopsy specimens were obtained from National Development and Research Institute (NY, NY) and analyzed in a blinded fashion. The tissues were homogenized in PBS / 0.1% SDS and the supernatants injected into a multi-dimensional micro-HPLC system, fractionated through a strong anion exchange column, and the eluting peaks passaged through a C18 reverse-phase column. Individual peaks were digested by trypsin and cyanogen bromide, reprocessed through a C4 reverse-phase column and recollected in micro-fractions. These samples were placed in a nanoflow electrospray interface to a dual quadrupole mass spectrometer, and peptide sequences obtained from the mass spectrometric analysis were fed into the SwissProt database for matches to known Vpr sequences. (Full Vpr sequence: MEQAPEDQGPQREPHNEWTLELLEELKNEAVRHFPRIWLHGLGQHIYETYGDTWAGVEARIIRILQQLLF IHFRIGCRHSREGVTRQRRNASRS)
WT (SE) N Vpr-Tg
(SE) N P
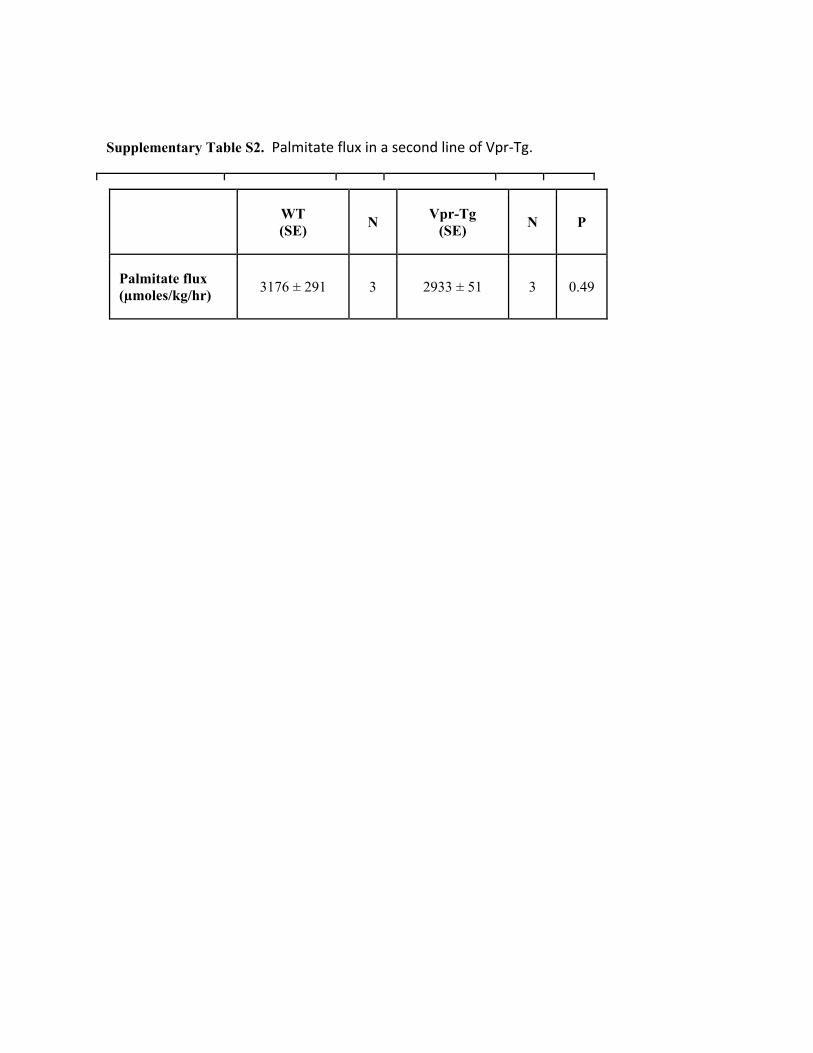
Palmitate flux (µmoles/kg/hr) 3176 ± 291 3 2933 ± 51 3 0.49
Supplementary Table S2. Palmitate flux in a second line of Vpr-Tg.
WT (SE) N Vpr-Tg
(SE) N P
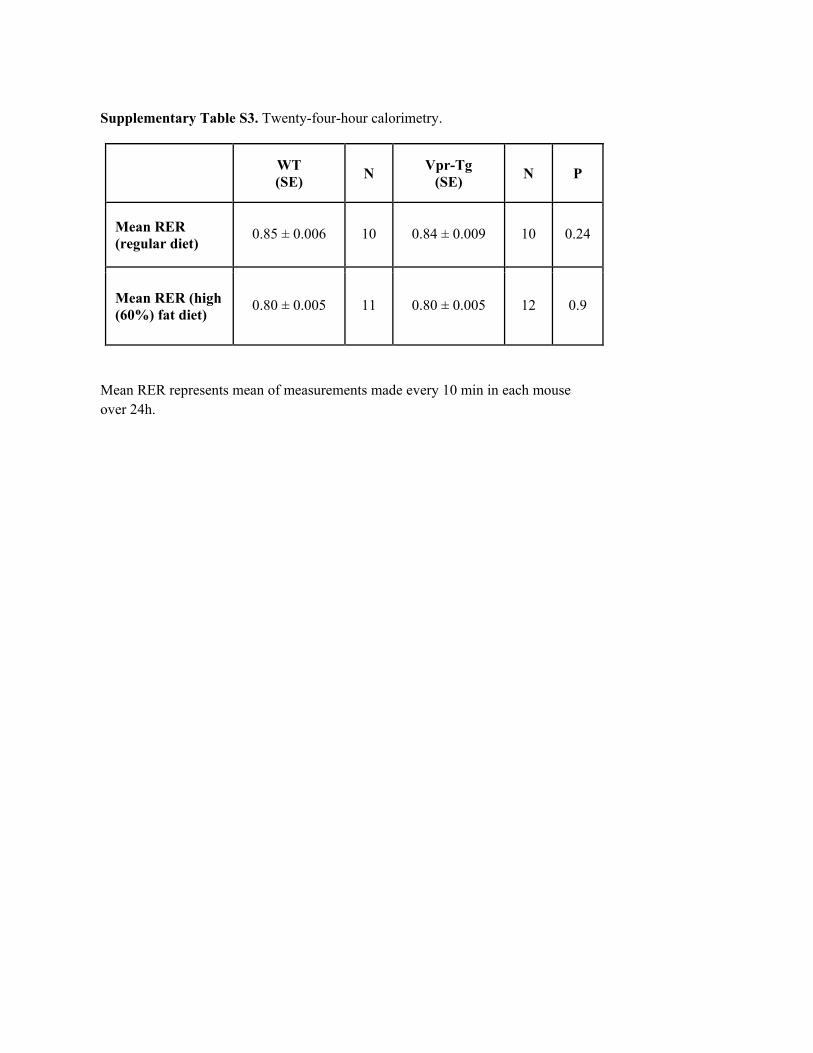
Mean RER (regular diet)
0.85 ± 0.006 10 0.84 ± 0.009 10 0.24
Mean RER (high (60%) fat diet)
0.80 ± 0.005 11 0.80 ± 0.005 12 0.9
Supplementary Table S3. calorimetry. Twenty-four-hour
Mean RER represents mean of measurements made every 10 min in each mouse over 24h.
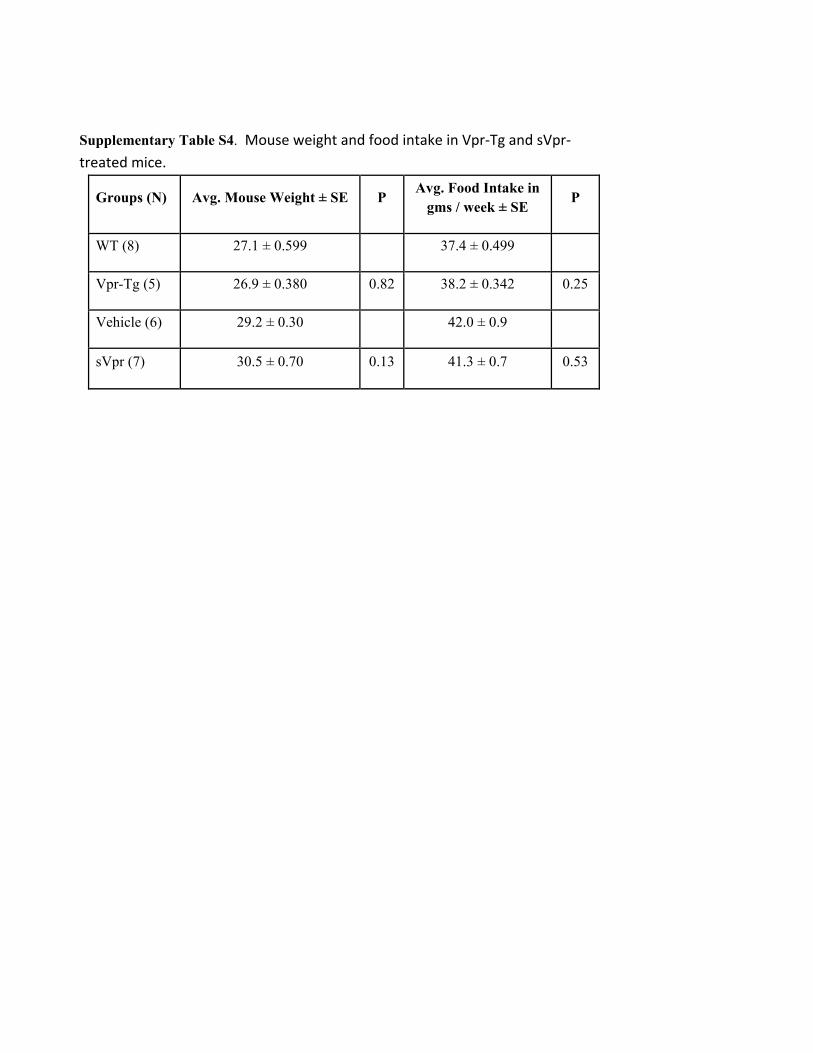
Groups (N) Avg. Mouse Weight ± SE P Avg. Food Intake in
gms / week ± SE P
WT (8) 27.1 ± 0.599
37.4 ± 0.499
Vpr-Tg (5) 26.9 ± 0.380 0.82 38.2 ± 0.342 0.25
Vehicle (6) 29.2 ± 0.30
42.0 ± 0.9
sVpr (7) 30.5 ± 0.70 0.13 41.3 ± 0.7 0.53
Supplementary Table S4. Mouse weight and food intake in Vpr-Tg and sVpr-treated mice.
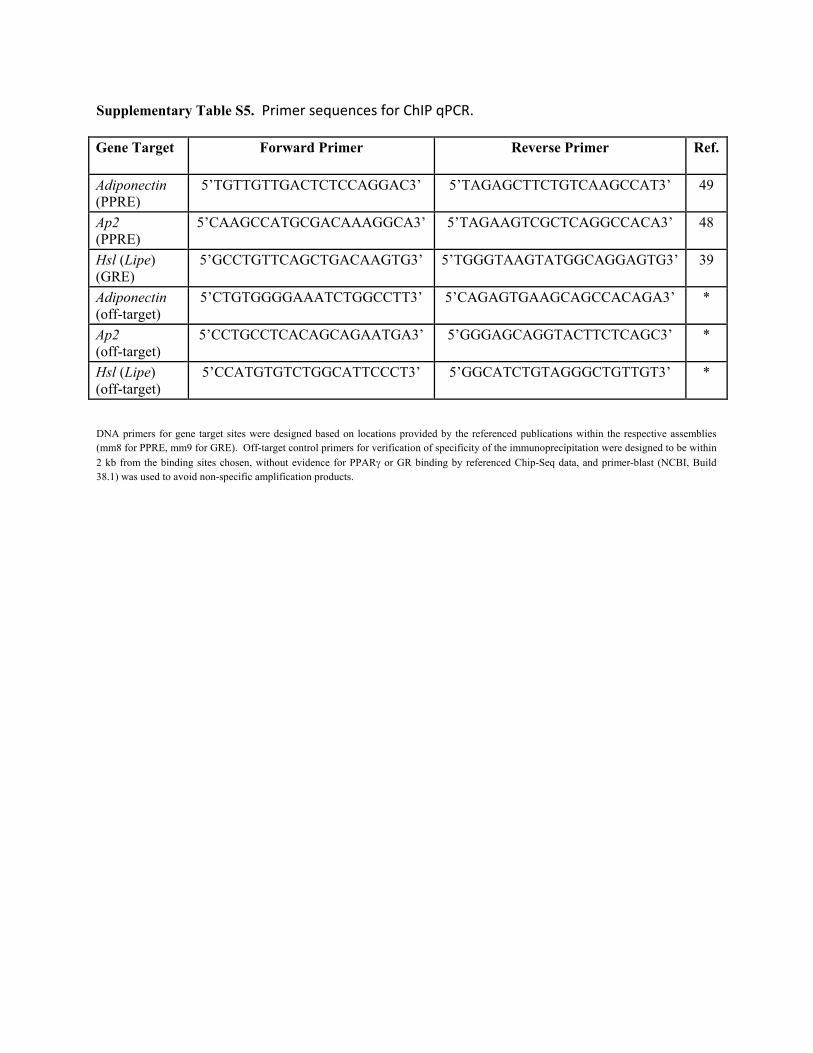
Gene Target Forward Primer Reverse Primer Ref.
Adiponectin (PPRE)
5’TGTTGTTGACTCTCCAGGAC3’ 5’TAGAGCTTCTGTCAAGCCAT3’ 49
Ap2 (PPRE)
5’CAAGCCATGCGACAAAGGCA3’ 5’TAGAAGTCGCTCAGGCCACA3’ 48
Hsl (Lipe) (GRE)
5’GCCTGTTCAGCTGACAAGTG3’ 5’TGGGTAAGTATGGCAGGAGTG3’ 39
Adiponectin (off-target)
5’CTGTGGGGAAATCTGGCCTT3’ 5’CAGAGTGAAGCAGCCACAGA3’ *
Ap2 (off-target)
5’CCTGCCTCACAGCAGAATGA3’ 5’GGGAGCAGGTACTTCTCAGC3’ *
Hsl (Lipe) (off-target)
5’CCATGTGTCTGGCATTCCCT3’ 5’GGCATCTGTAGGGCTGTTGT3’ *
Supplementary Table S5. Primer sequences for ChIP qPCR.
DNA primers for gene target sites were designed based on locations provided by the referenced publications within the respective assemblies (mm8 for PPRE, mm9 for GRE). Off-target control primers for verification of specificity of the immunoprecipitation were designed to be within 2 kb from the binding sites chosen, without evidence for PPARγ or GR binding by referenced Chip-Seq data, and primer-blast (NCBI, Build 38.1) was used to avoid non-specific amplification products.


![[Supplementary materials]](https://img.pdfslide.net/doc/110x75/56816583550346895dd82b8a/supplementary-materials-56cd0e37cc26b.jpg)