Embed Size (px)
Citation preview

Supplementary Online Contents
Supplemental Table 1. Study patients in 26 centers
Institution Entry (n)
Analysis (n)
CT scanner
1 Hiroshima University 719 708 GE VCT 642 Kindai University 332 319 GE VCT64
3 Shin-Koga Hospital 300 296 GE VCT64
4 Juntendo University 275 270 Toshiba Aquilion64
5 Hiroshima General Hospital 169 160 GE VCT64
6 Kure Kyosai Hospital 115 114 Siemens DEFINITION
7 Megumino Hospital 108 105 Siemens DEFINITION
8 Fujisawa City Hospital 101 98 GE VCT64
9 Tsuchiya General Hospital 109 96 GE VCT64
10 Takase Clinic 97 94 Toshiba Aquilion ONE
11 Atomic Bomb Casualty Council Health Management & Promotion Center
82 82 GE VCT64
12 Yokkaichi Hazu Medical Center 76 67 Toshiba Aquilion ONE
13 Hiroshima City Asa Hospital 78 69 Siemens DEFINITION
14 Kokura Memorial Hospital 85 59 GE VCT64
15 Uwajima City Hospital 53 49 GE VCT64
16 Nippon University 50 50 Toshiba Aquilion ONE
17 Tokyo Medical University 100 40 GE VCT64
18 Kyorin University 53 39 Siemens DEFINITION
19 Shizuoka Prefecture General Hospital
43 35 GE VCT 64
20 Osaka Ekiseikai Hospital 32 22 Siemens DEFINITION
21 Yamaguchi University 16 14 Siemens DEFINITION
22 Mitsui Memorial Hospital 8 6 Toshiba Aquilion ONE
23 Ehime University 6 5 Siemens DEFINITION
24 Morishita Clinic 4 4 Siemens DEFINITION
25 Nippon University Hospital 3 3 Siemens DEFINITION
26 Itabashi Central Hospital 1 1 Toshiba Aquilion 64
Total 3015 2802

Supplemental Table 2. Secondary outcomes
Overall Normal Calcium Plaque P value
Variables n = 2802 n = 515 n = 654 n = 1633
Coronary revascularization 351 (12.5) 3 (0.6) 53 (8.1) 295 (18.1) <0.0001
Early revascularization (<3 months) 257 (9.2) 3 (0.6) 33 (5.3) 221 (14) <0.0001
Late revascularization (≥3 months) 94 (3.3) 0 (0) 18 (2.8) 74 (4.6%)
Invasive coronary angiography 558 (20.0) 20 (3.9) 114 (17.4) 424 (26.0) <0.0001
Heart failure 20 (0.7) 3 (0.6) 6 (0.9) 12 (0.7) 0.8002
Aortic and/or peripheral artery disease 29 (1.0) 2 (0.4) 4 (0.6) 23 (0.8) 0.0649
Cerebrovascular disease 47 (1.7) 5 (1.0) 8 (1.2) 34 (2.1) 0.1355
End-stage renal failure 2 (0.1) 0 (0) 0 (0) 2 (0.1) -
Values are shown as n (%).
The secondary endpoints were all coronary revascularizations, invasive coronary angiography, heart failure requiring hospitalization and administration of diuretics, cerebrovascular disease (symptomatic cerebral bleeding or infarction diagnosed by computed tomography and/or magnetic resonance imaging and requiring hospitalization), aortic disease (newly occurred aortic aneurysm or aortic dissection), peripheral arterial disease (ischemic limb symptoms requiring revascularization), and end-stage renal failure (administration of dialysis).

Supplemental Figure 1. Representative specific features of coronary plaques(A) Coronary computed tomography angiography of the right coronary artery showed moderate (50%–74%) stenosis with a noncalcified plaque in the midportion of the vessel (segment 3). (B) A cross-sectional image of the lesion (solid line in Panel A) revealed the napkin-ring sign. The area of the vessel was measured (C) at the lesion site (22 mm2) and (D) at the proximal reference site (17 mm2, dashed line in Panel A). Ultimately, the coronary plaque had three of the four specific characteristics: low computed tomography attenuation (29 Hounsfield units), positive remodeling (remodeling index of 1.29), and the napkin-ring sign.

Supplemental Table 3. Parameters, complications, and interobserver agreement of CT measurementsParameters n = 2802
Heart rate (bpm) 59.0 ± 10.0
Prospective electrocardiographic-gated scans 980 (35.0)
Premedication with beta-blocker 1870 (67.0)
Estimated radiation exposure (mSv) 14.0± 8.4
Complications
Iodine allergy 15 (0.5)
Extravasation of contrast agent 1 (0.04)
Kappa value (95% CI) Assessmen
t
≥50% Stenosis (2 grades) 0.88 (0.77–0.99) Excellent
Obstructive CAD (yes/no) 0.85 (0.74–0.96) Excellent
% Stenosis (5 grades) 0.62 (0.48–0.75) Good
Extent of CAD (zero-, single-, and multi-vessel
disease)
0.74 (0.63–0.87) Good
Specific plaque characteristicsRI ≥1.2 (yes/no) 0.52 (0.32–0.71) Modest
Low CT attenuation (≤30 HU) plaque
(yes/no)
0.89 (0.41–0.77) Excellent
Spotty calcification (yes/no) 0.67 (0.51–0.84) Good
Napkin-ring sign (yes/no) 0.71 (0.56–0.86) Good
High-risk plaque (≥2 characteristics) (yes/no) 0.65 (0.49–0.81) Good
CAC, coronary artery calcium; CAD, coronary artery disease; CI, confidence interval; CT, computed tomography; RI, remodeling index; HU, Hounsfield units.

Coronary computed tomography angiography was safely performed with a well-
controlled heart rate. Retrospective and prospective electrocardiographic-gated
scans were performed in 65.0% and 35.0% of patients, respectively. Iodine
allergy reactions were observed in 0.5% of patients.
Interobserver agreement was evaluated using the Cohen kappa statistic,
which was interpreted as follows: a kappa value of >0.8 indicated excellent
agreement, and that of 0.60 to 0.80 indicated good agreement. The
interobserver agreement of plaques with low CT attenuation of ≤30 HU, spotty
calcification, and the napkin-ring sign was excellent or good. In contrast, the
interobserver agreement of an RI of ≥1.2 was modest. However, good
interobserver agreement was obtained when high-risk plaques were defined as
the presence of two or more specific characteristics.

Supplemental Figure 2. Kaplan–Meier curves by coronary mural images
Normal group (no plaque), calcium group (coronary calcification alone), and plaque group (noncalcified and/or partially calcified plaques). *P < 0.01 vs. normal group, †P < 0.01 vs. calcium group.
A. Primary outcome
B. All coronary revascularizations

Supplemental Table 4. Predictors of clinical characteristics for primary outcome
Variables Yes No Univariate HR P value
(n = 49) (n = 2753) (95% CI)
Age ≥67 years (mean) 37 (75.5) 1546 (56.2) 2.40 (1.25–4.60) 0.0084
Male 36 (73.5) 1800 (65.4) 1.47 (0.78–2.77) 0.2340
Body mass index (≥25 kg/m2) 14 (28.6) 974 (35.5) 0.73 (0.40–1.37) 0.3290
Hypertension 38 (77.6) 1854 (67.3) 1.68 (0.86–3.29) 0.1284
Dyslipidemia 28 (57.1) 1849 (67.2) 0.65 (0.37–1.14) 0.1333
Diabetes mellitus 18 (36.7) 773 (28.1) 1.50 (0.84–2.68) 0.1725
Cigarette smoking 26 (53.1) 1300 (47.2) 1.27 (0.73–2.23) 0.3973
Family history 14 (28.6) 1118 (40.6) 0.60 (0.32–1.11) 0.1012
Prior MI 4 (8.2) 219 (8.0) 1.02 (0.37– 2.83) 0.9729
Prior PCI 9 (18.4) 405 (14.7) 1.30 (0.63–2.67) 0.4826
Cerebrovascular disease 8 (16.3) 235(8.5) 2.13 (1.00–4.53) 0.0515
Aortic disease 3 (6.1) 51 (1.9) 3.52 (1.09–11.31) 0.0348
Peripheral artery disease 4 (8.2) 97 (3.5) 2.54 (0.91–7.06) 0.0740
Typical chest symptom or
proven CAD
18 (36.7) 1002 (36.4) 0.98 (0.55–1.76) 0.9548
Medication after CCTA
Renin–angiotensin system
inhibitors
25 (51.0) 1156 (42.0) 1.45 (0.83–2.53) 0.1972
Beta-blockers 12 (24.5) 520 (18.9) 1.42 (0.74–2.73) 0.2876
Statins 21 (42.9) 1359 (49.4) 0.77 (0.44–1.36) 0.3635
Hypoglycemic drugs 15 (30.6) 585 (21.2) 1.64 (0.89–3.01) 0.1109
Aspirin 28 (57.1) 1056 (38.3) 2.16 (0.22–3.80) 0.0078
CAD, coronary artery disease; CCTA, coronary computed tomography angiography; PCI, percutaneous coronary intervention; MI, myocardial infarction.

Supplemental Figure 3. Kaplan–Meier curves for the primary outcome stratified by numbers of specific plaque characteristics defined as low attenuation (≤30 Hounsfield units), positive remodeling (remodeling index of ≥1.2), spotty calcification, and the napkin-ring sign. *P < 0.01 vs. no characteristics.

Supplemental Figure 4. Receiver-operating characteristic analysis for incremental prognostic values to predict (A) primary outcome and (B) all coronary revascularizationsModel 1 (base model) consisted of age of ≥67 years, male sex, hypertension, hyperlipidemia, diabetes mellitus, cigarette smoking, and coronary artery calcium score of ≥100.

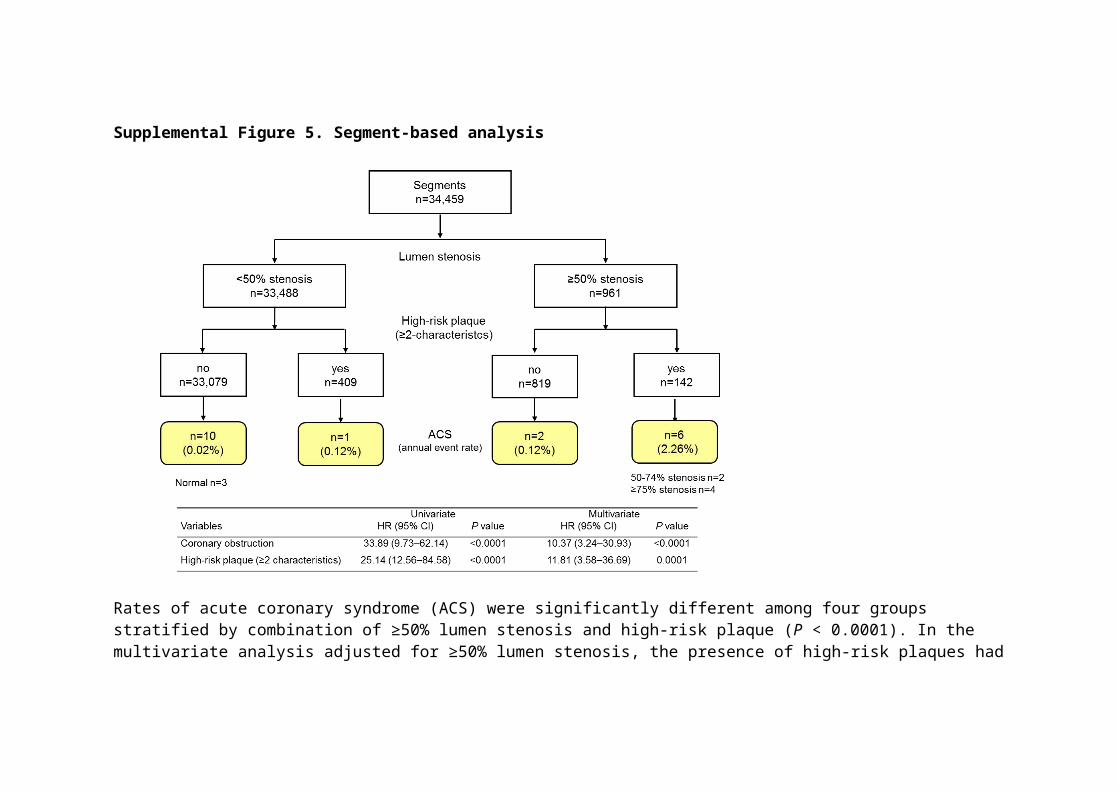
Supplemental Figure 5. Segment-based analysis
Rates of acute coronary syndrome (ACS) were significantly different among four groups stratified by combination of ≥50% lumen stenosis and high-risk plaque (P < 0.0001). In the multivariate analysis adjusted for ≥50% lumen stenosis, the presence of high-risk plaques had an 11.84-fold (95% CI, 3.58–36.69; P = 0.0001) higher risk of the occurrence of ACS compared with absence of such plaques

Supplemental Table 5. Characteristics of patients who developed ACS (N = 19)No. age sex Indication (chest symptom) Event Interval
(months)
ACS site Culprit defined by ICA
(AHA segment)
Initial CCTA findings of culprit lesion
% stenosis High-risk plaque
1 53 M typical UAP 0.1 Anterior LAD #6, ≥75% yes
2 79 M typical NSTEMI 0.2 Anterior LAD #7, ≥75% yes
3 53 F typical UAP 0.2 Anterior LAD #6 ≥75% yes
4 67 M asymptomatic UAP 0.4 Inferior RCA #1 50-74% no
5 67 M known CAD UAP 0.7 Anterior LAD #7 50-74% yes
6 48 M asymptomatic, Non-STEMI 1 Posterior LAD #13 0% no
7 63 F typical UAP 1 Anterior LAD #6 ≥75% no
8 80 M atypical STEMI 2 Anterior LAD #7 0% no
9 78 M known CAD STEMI 6.3 Inferior RCA #3 50-74% no
10 66 M atypical UAP 9.4 Inferior RCA #1 0% no
11 60 M atypical STEMI 10.2 Posterior LCX #13 1–24% no
12 60 M atypical UAP 12.4 Anterior LMT #5 1–24% no
13 84 M typical STEMI 13.7 Inferior RCA #2 25-49% no
14 76 M atypical STEMI 20.9 Inferior RCA #3 25-49% no
15 63 F atypical STEMI 22.5 Inferior RCA #1 50-74% yes
16 79 F atypical Non-STEMI 23.2 Inferior RCA #2 25-49% yes
17 67 M atypical Non-STEMI 23.6 Anterior LAD #6, 1–24% no
18 67 M atypical UAP 23.8 Anterior LAD #8 25-49% no
19 63 M typical UAP 24.3 Anterior LAD #6 50-74% yes

ACS, acute coronary syndrome; AHA, American Heart Association; CAD, coronary artery disease; CCTA, coronary computed tomography angiography; F, female; ICA, invasive coronary angiography; STEMI, ST-elevation myocardial infarction; UAP, unstable angina pectoris; M, male.

Supplemental Figure 6. Analyses of the use of two obstructive stenosis criteria A
When the more stringent definition of obstructive stenosis as the presence of ≥75%
stenosis in any coronary artery or ≥50% stenosis in the left main coronary artery (†definition
#2) was used, the univariate hazard ratio (HR) of the primary outcome 2.47 [95%
confidence interval (CI) 1.41–4.32, P = 0.0018) was lower than the HR of 3.29 (95% CI
1.79–6.04, P < 0.0001) using the ≥50% stenosis criteria (*definition #1).
B
The figures show a multivariate Cox regression model using stepwise variable selection for
occurrence of the primary endpoint using the more stringent definition (†definition #2) of
obstructive CAD as the presence of ≥75% stenosis in any coronary artery or ≥50% stenosis
in the left main coronary artery). Stepwise variable selection was performed to achieve the
optimal combination of covariates (stay α and exit α values were set at 0.25 and 0.15,
respectively). The optimal combinations of covariates were obtained and are shown. High-
risk plaque did not remain as a confounding factor in this model. PCP, partially-calcified
plaque.
C
The figures show a multivariate Cox regression model using stepwise variable selection for
occurrence of ACS. Stepwise variable selection was performed to achieve the optimal
combination of covariates (stay α and exit α values were set at 0.25 and 0.15, respectively).
The optimal combinations of covariates were obtained and are shown (the upper model
uses the ≥50% stenosis criterion (*definition #1), and the lower model uses the more
stringent definition (†definition #2) of obstructive CAD as the presence of ≥75% stenosis in
any coronary artery or ≥50% stenosis in the left main coronary artery).

Supplemental Table 6. One-year changes in statin treatment and serum LDL-C concentrationsVariables Plaque type Baseline 1 year Within Difference Between
n P value P value
LDL-C (mg/dL) Plaque 790 113.7 ± 30.6 103.4 ± 27.4 <0.0001 −10.32 ± 29.2
Calcium 379 115.1 ± 29.9 107.6 ± 30.3 <0.0001 −7.54 ± 28.6 0.0053
Normal 302 115.6 ± 29.7 111.6 ± 27.8 0.0102 −4.03 ± 30.0
n Add-on
Stains (%) Plaque 790 313 (39.6) 376 (47.6) 74 (9.4)
Calcium 379 158 (41.7) 175 (46.2) 24 (6.3)
Normal 302 96 (31.8) 106 (35.1) 16 (5.3)
P = 0.0204 P = 0.0008 P = 0.0389
Data were evaluated in 1471 patients after excluding patients with proven coronary artery disease and early revascularization. LDL-C, low-density lipoprotein cholesterol.
We compared changes in statin treatment and serum cholesterol concentrations from baseline to 1 year in 1471
patients after excluding patients with proven coronary artery disease and early revascularization. Our data revealed that
lipid-lowering therapy with statins was more aggressively introduced and that serum LDL cholesterol concentrations were
more significantly reduced in the plaque group than in the other two groups. These results suggest that these plaque
findings may encourage more physicians to use lipid-lowering therapy.