Embed Size (px)
Citation preview
Supply and DemandPRINCIPLES OF ECONOMICS (ECON 210)
BEN VAN KAMMEN, PHD
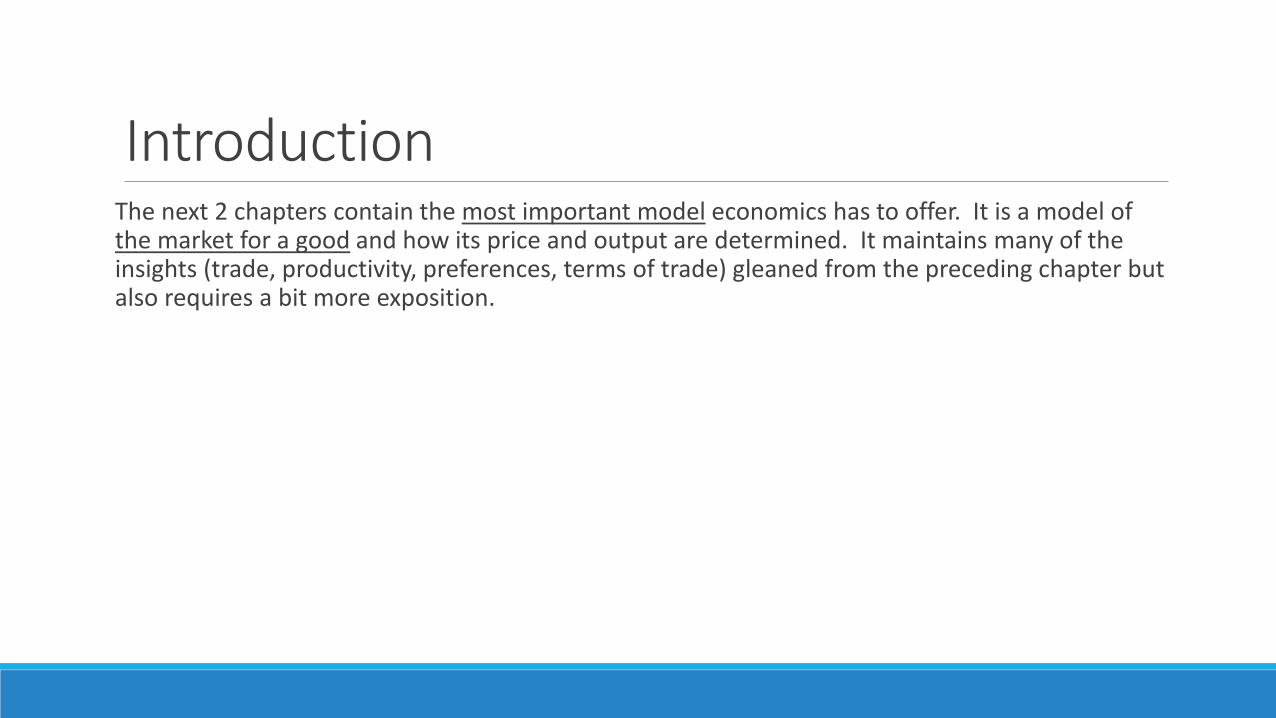
IntroductionThe next 2 chapters contain the most important model economics has to offer. It is a model of the market for a good and how its price and output are determined. It maintains many of the insights (trade, productivity, preferences, terms of trade) gleaned from the preceding chapter but also requires a bit more exposition.
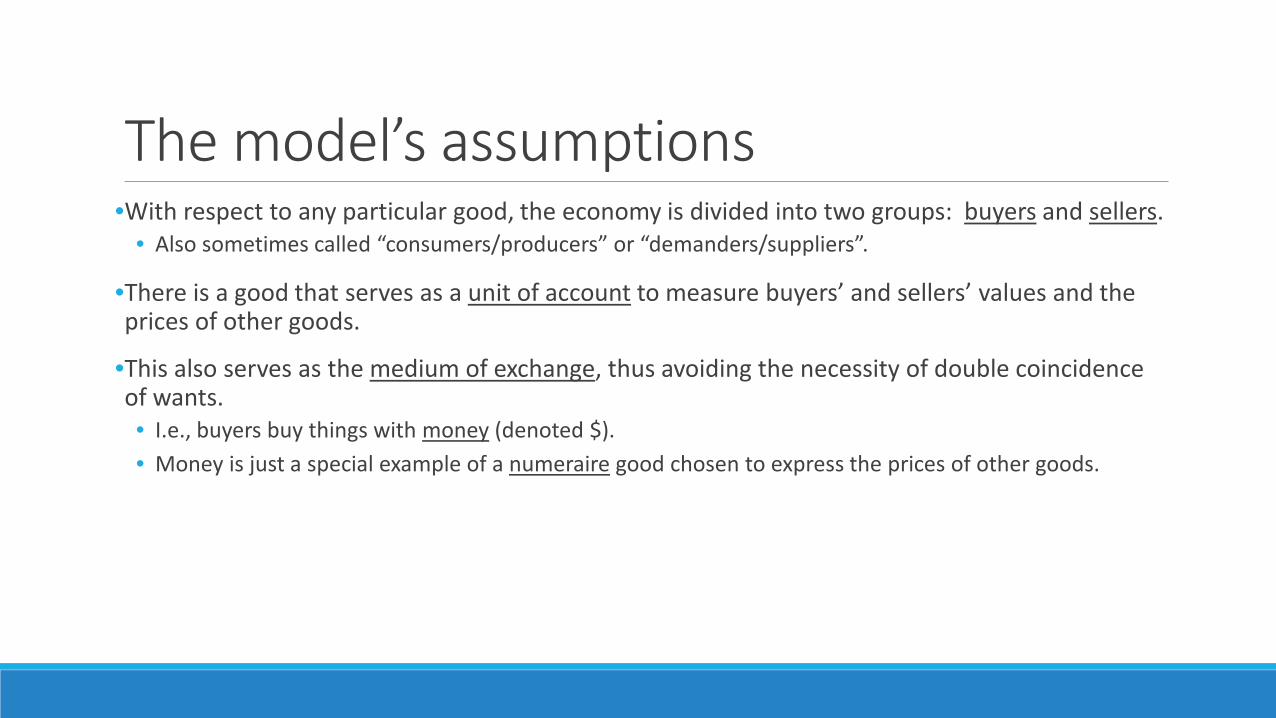
The model’s assumptions•With respect to any particular good, the economy is divided into two groups: buyers and sellers.
• Also sometimes called “consumers/producers” or “demanders/suppliers”.
•There is a good that serves as a unit of account to measure buyers’ and sellers’ values and the prices of other goods.
•This also serves as the medium of exchange, thus avoiding the necessity of double coincidence of wants. • I.e., buyers buy things with money (denoted $).• Money is just a special example of a numeraire good chosen to express the prices of other goods.
Buyers and sellers assumptions•Each buyer has a willingness to pay,
• i.e., the maximum they are willing to give up to buy this good.
•Sellers each have a reservation price, • i.e., the minimum they insist on receiving in exchange for this good.
•Buyers and sellers can be ranked according to willingness to pay and reservation price, respectively.

Eliciting the willingness to pay
The demand curveWith buyers ranked from highest willingness to pay to lowest, for any price, you can count how many buyers value the good at least as much as the price. This is the quantity demanded at that price.
•The demand curve is a graphical relationship between price and quantity demanded.• With a small number of consumers, it looks like a “step” function (left panel on next slide).• Assuming a large number of buyers with finely-differentiated willingness to pay, the curve looks like the
familiar “smooth” function (right panel on next slide).
The demand curve (continued)
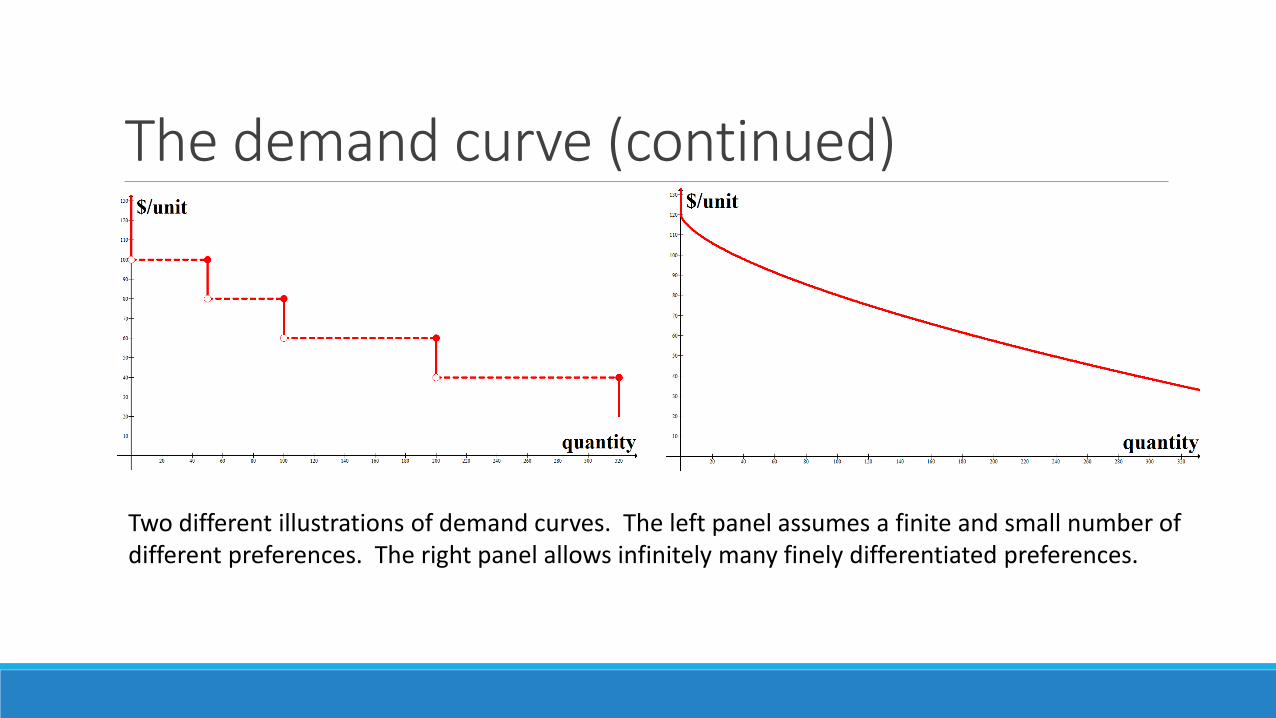
Two different illustrations of demand curves. The left panel assumes a finite and small number of different preferences. The right panel allows infinitely many finely differentiated preferences.
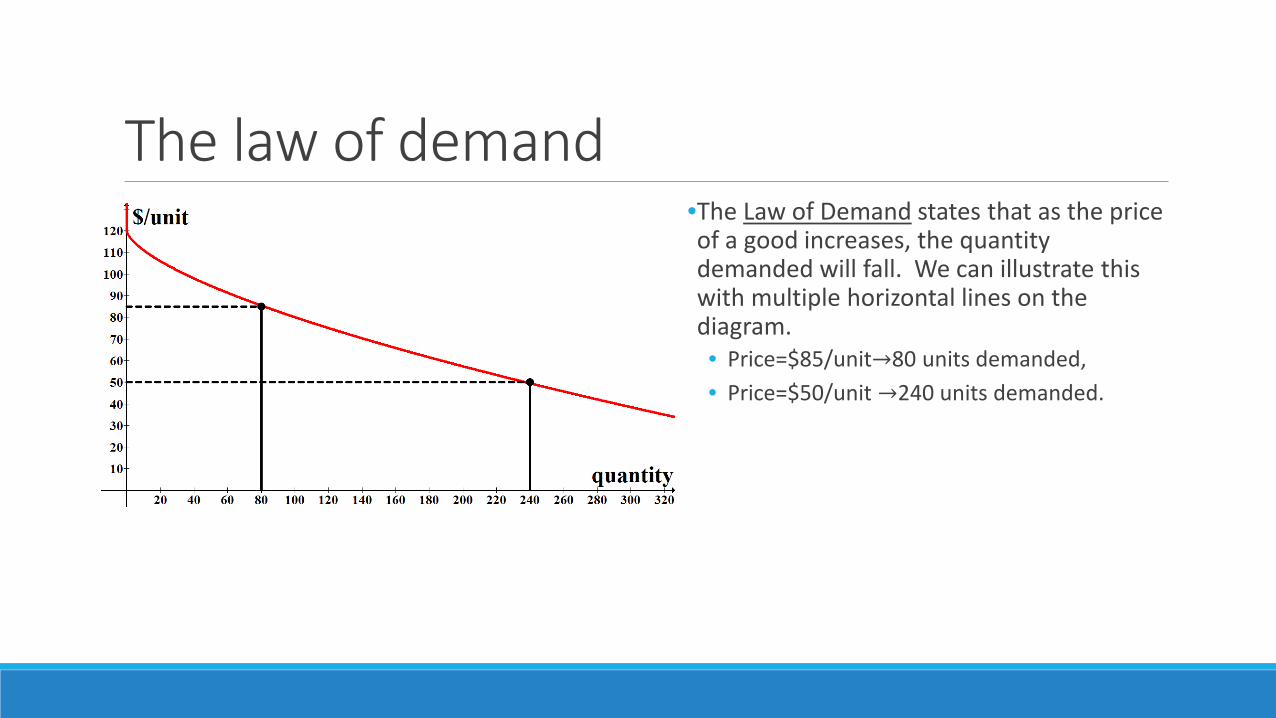
The law of demand•The Law of Demand states that as the price of a good increases, the quantity demanded will fall. We can illustrate this with multiple horizontal lines on the diagram.• Price=$85/unit→80 units demanded,• Price=$50/unit →240 units demanded.
Price rations demand•The most fundamental job of price—separate the high value uses of a good from the low value uses. Goods are scarce, so some potential uses will not be fulfilled.
•The price is a cut-off between uses valuable enough to be fulfilled and those that are insufficiently high, given the current price.
• Price allocates goods to the highest value uses (see previous slide). The 80 units go to the buyers at the top of the demand curve. Same thing with the 240.
• There are just more uses justified by spending $50 than by spending $85.
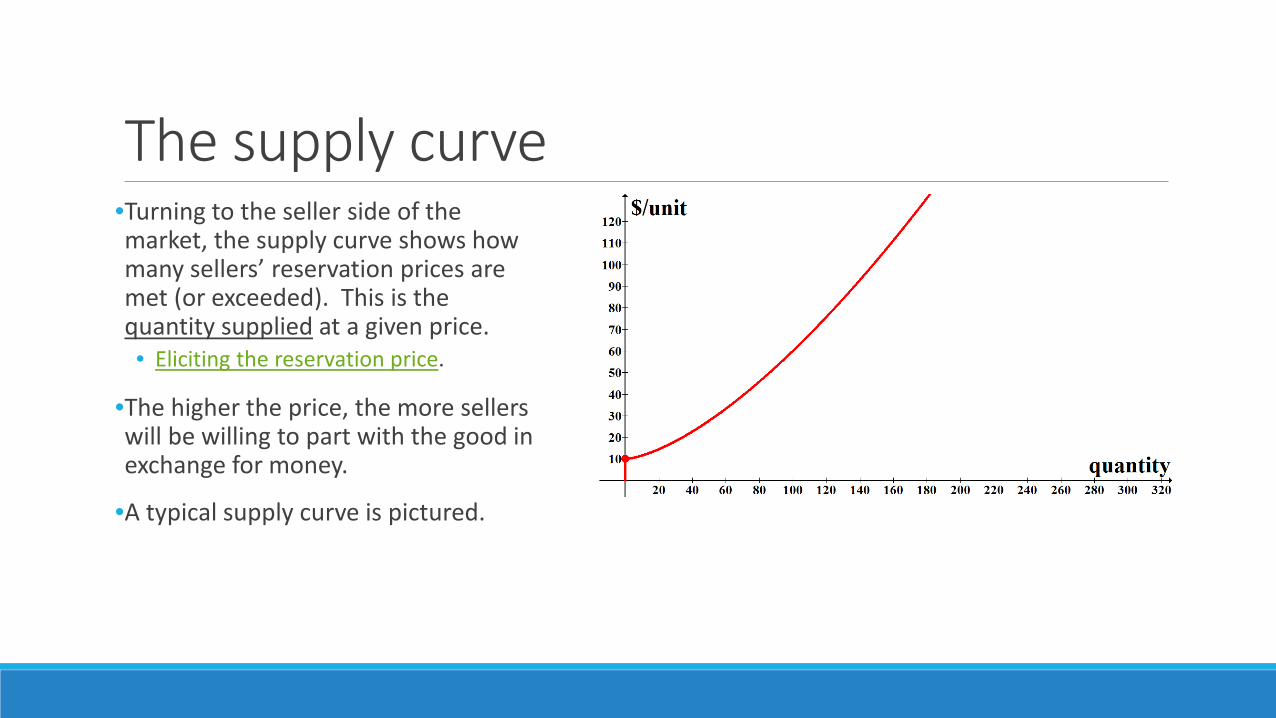
The supply curve•Turning to the seller side of the market, the supply curve shows how many sellers’ reservation prices are met (or exceeded). This is the quantity supplied at a given price.• Eliciting the reservation price.
•The higher the price, the more sellers will be willing to part with the good in exchange for money.
•A typical supply curve is pictured.
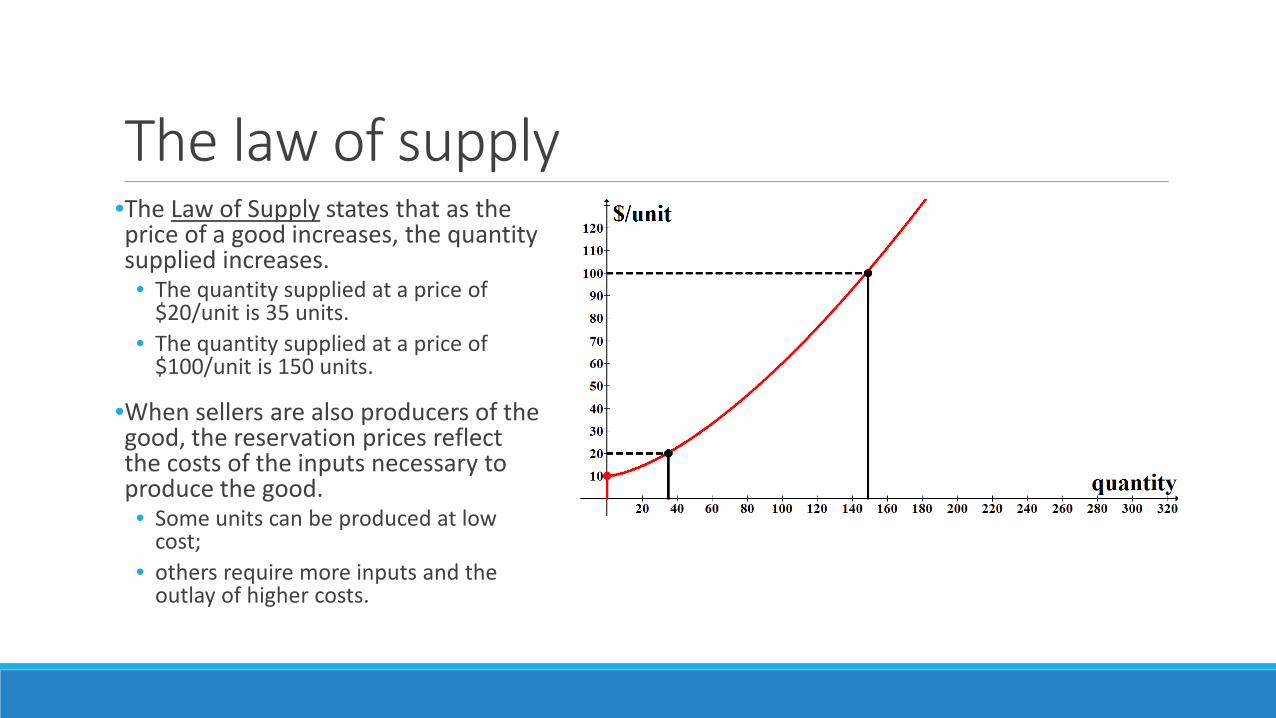
The law of supply•The Law of Supply states that as the price of a good increases, the quantity supplied increases.• The quantity supplied at a price of
$20/unit is 35 units.• The quantity supplied at a price of
$100/unit is 150 units.
•When sellers are also producers of the good, the reservation prices reflect the costs of the inputs necessary to produce the good.• Some units can be produced at low
cost; • others require more inputs and the
outlay of higher costs.
Gains from tradeThe demand and supply curves offer an excellent illustration of how trade makes both parties better off. Buyers’ uses have higher and lower values; sellers have higher and lower costs.
A phenomenon similar to rationing demand occurs with sellers, whereby for any price the units supplied are the lowest cost units on the supply curve.
•But all units are bought/sold at the same price.• This is an assumption lifted in microeconomics classes that discuss price discrimination—when buyers
with higher willingness pay higher prices (see textbook chapter 14).
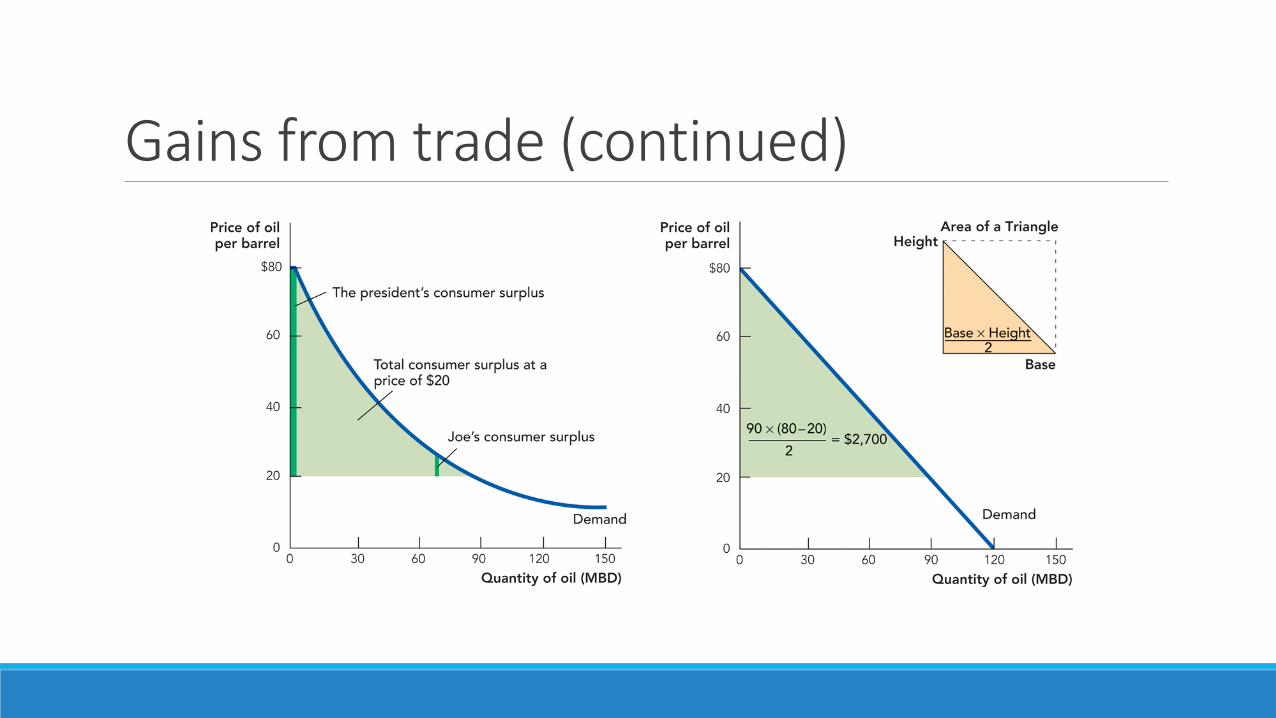
Gains from trade (continued)•Most consumers derive more value from their purchases than the price they pay.
• This is represented by the line segments connecting the demand curve to the horizontal price line.• See the left panel on the next slide.
•The aggregate gains from trade for all buyers of a good is called consumer surplus and is shown by the area under the demand curve and above the market price (right panel, next slide).
Gains from trade (continued)
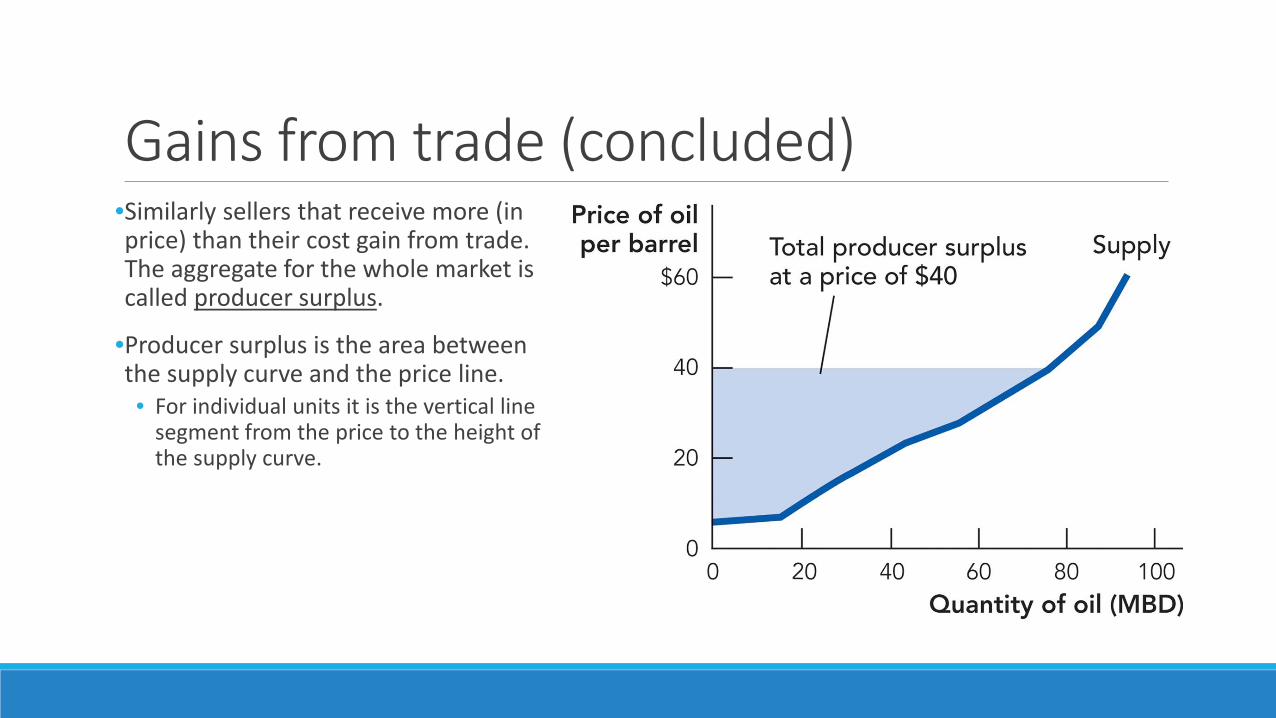
Gains from trade (concluded)•Similarly sellers that receive more (in price) than their cost gain from trade. The aggregate for the whole market is called producer surplus.
•Producer surplus is the area between the supply curve and the price line.• For individual units it is the vertical line
segment from the price to the height of the supply curve.
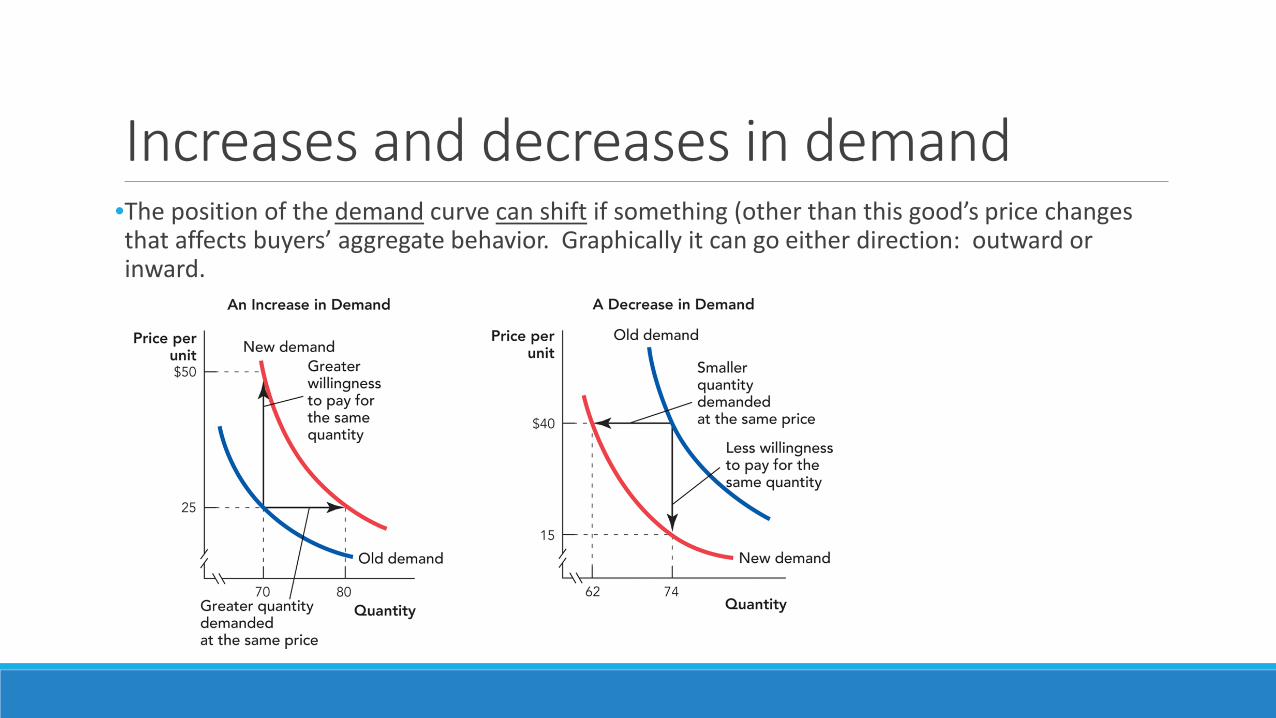
Increases and decreases in demand•The position of the demand curve can shift if something (other than this good’s price changes that affects buyers’ aggregate behavior. Graphically it can go either direction: outward or inward.
Increases and decreases in demand (continued)
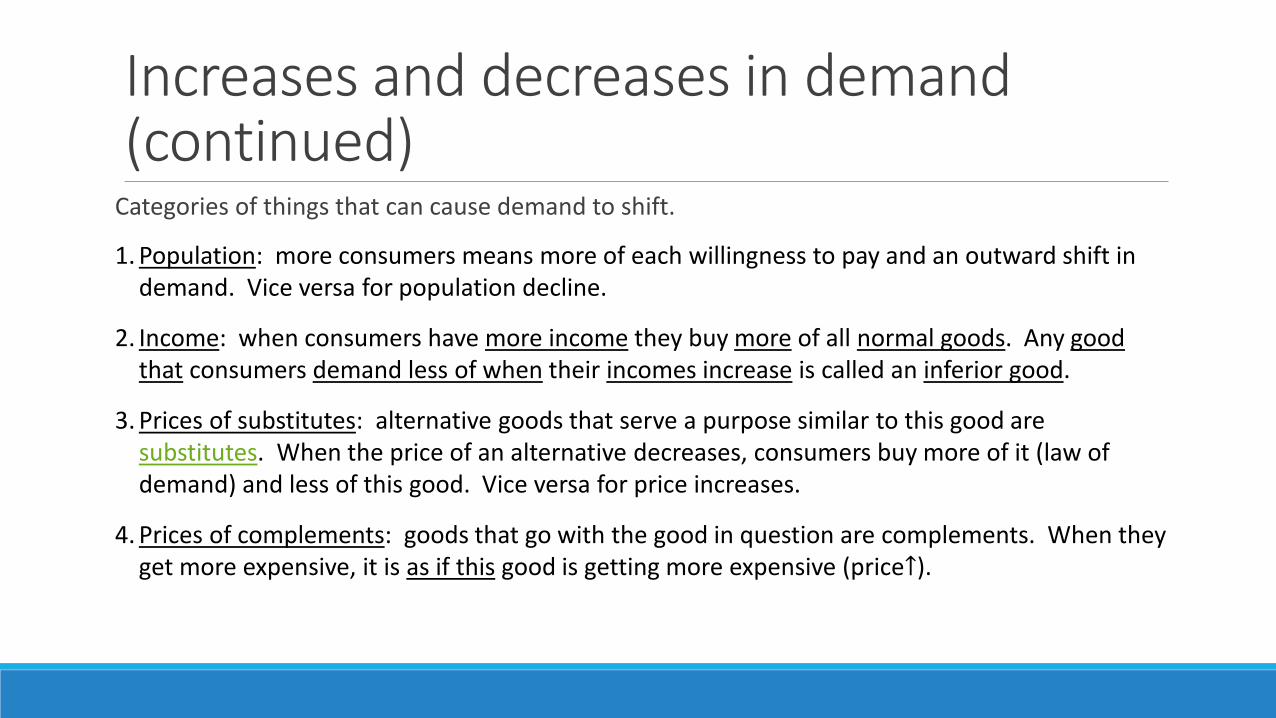
Categories of things that can cause demand to shift.
1. Population: more consumers means more of each willingness to pay and an outward shift in demand. Vice versa for population decline.
2. Income: when consumers have more income they buy more of all normal goods. Any good that consumers demand less of when their incomes increase is called an inferior good.
3. Prices of substitutes: alternative goods that serve a purpose similar to this good are substitutes. When the price of an alternative decreases, consumers buy more of it (law of demand) and less of this good. Vice versa for price increases.
4. Prices of complements: goods that go with the good in question are complements. When they get more expensive, it is as if this good is getting more expensive (price↑).
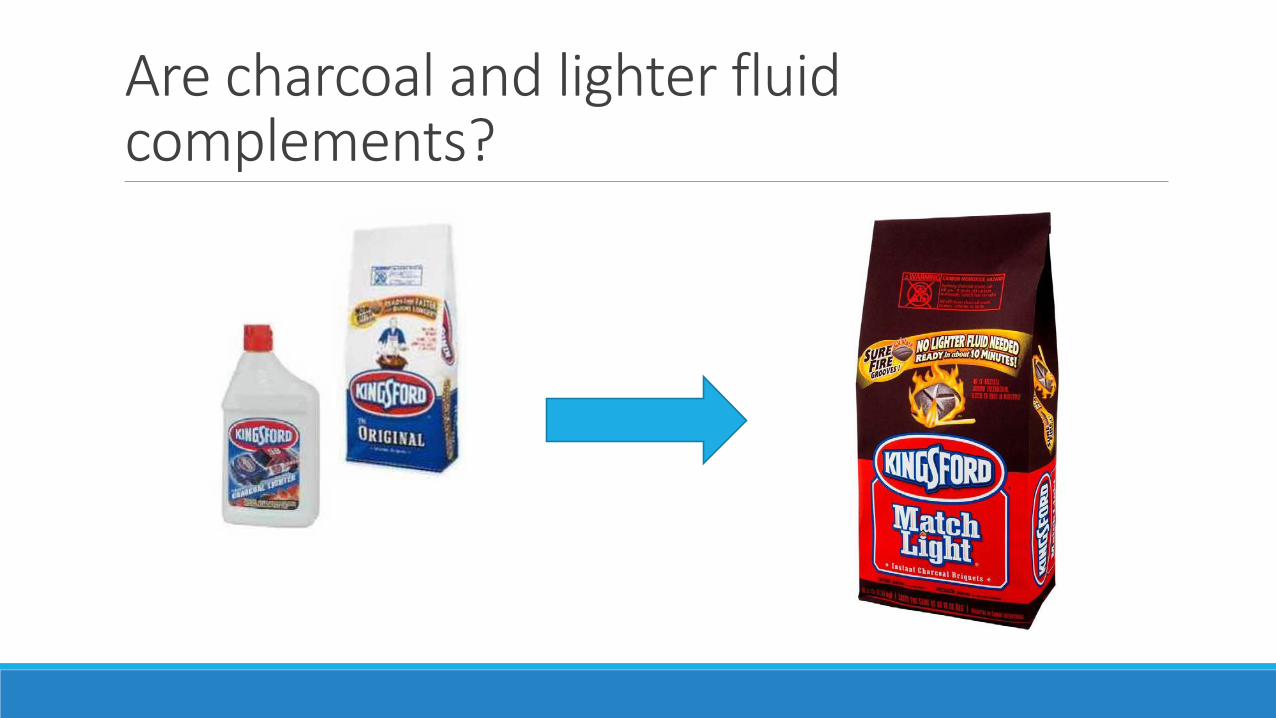
Are charcoal and lighter fluid complements?
Increases and decreases in demand (concluded)
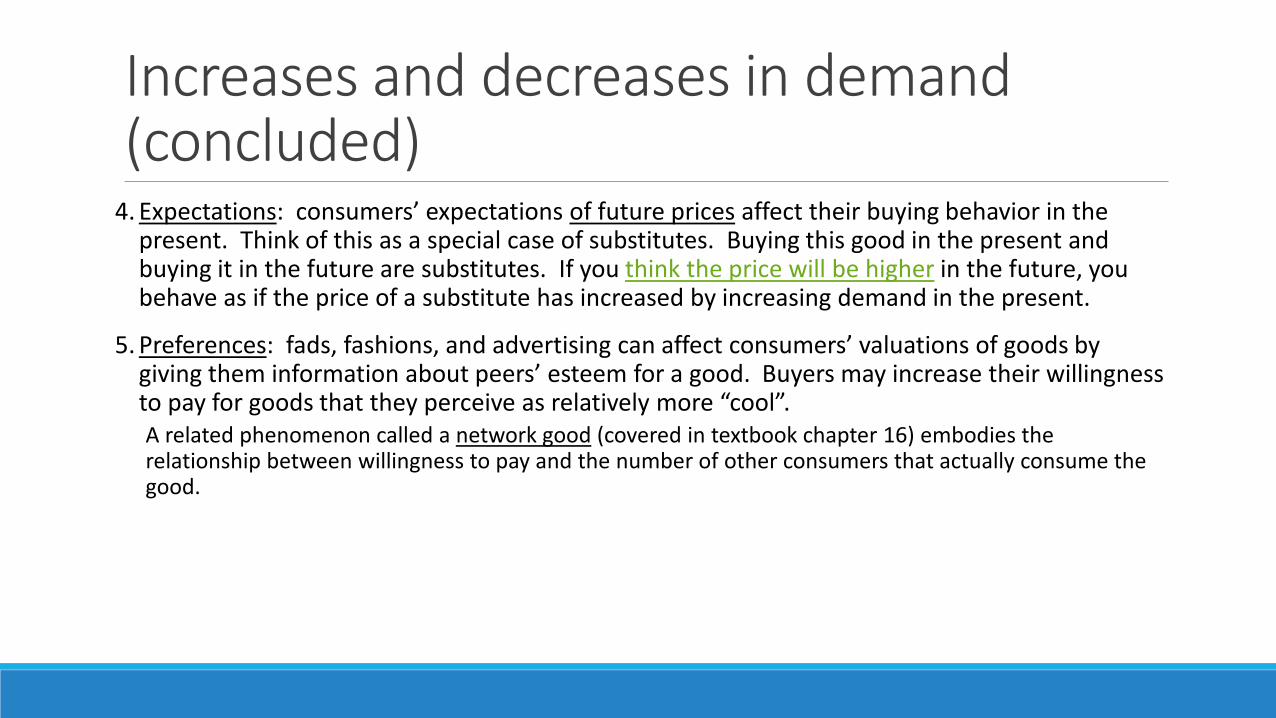
4. Expectations: consumers’ expectations of future prices affect their buying behavior in the present. Think of this as a special case of substitutes. Buying this good in the present and buying it in the future are substitutes. If you think the price will be higher in the future, you behave as if the price of a substitute has increased by increasing demand in the present.
5. Preferences: fads, fashions, and advertising can affect consumers’ valuations of goods by giving them information about peers’ esteem for a good. Buyers may increase their willingness to pay for goods that they perceive as relatively more “cool”.A related phenomenon called a network good (covered in textbook chapter 16) embodies the relationship between willingness to pay and the number of other consumers that actually consume the good.
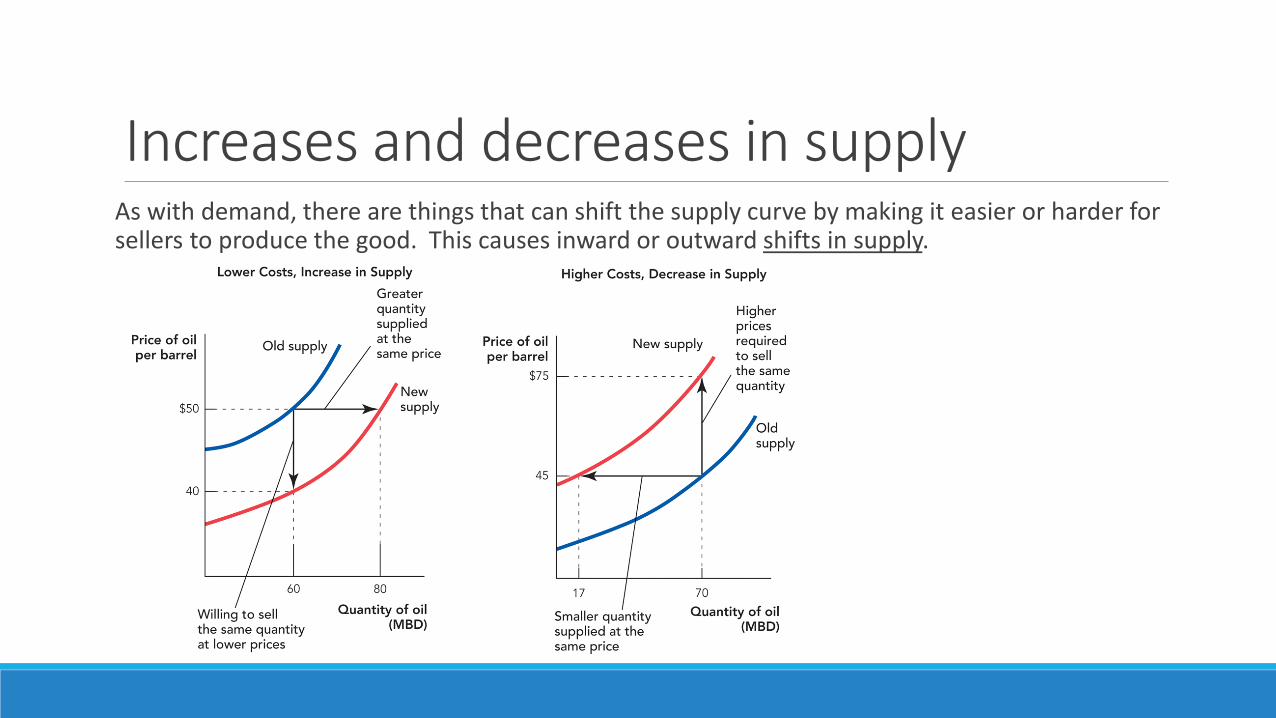
Increases and decreases in supplyAs with demand, there are things that can shift the supply curve by making it easier or harder for sellers to produce the good. This causes inward or outward shifts in supply.
Increases and decreases in supply (continued)
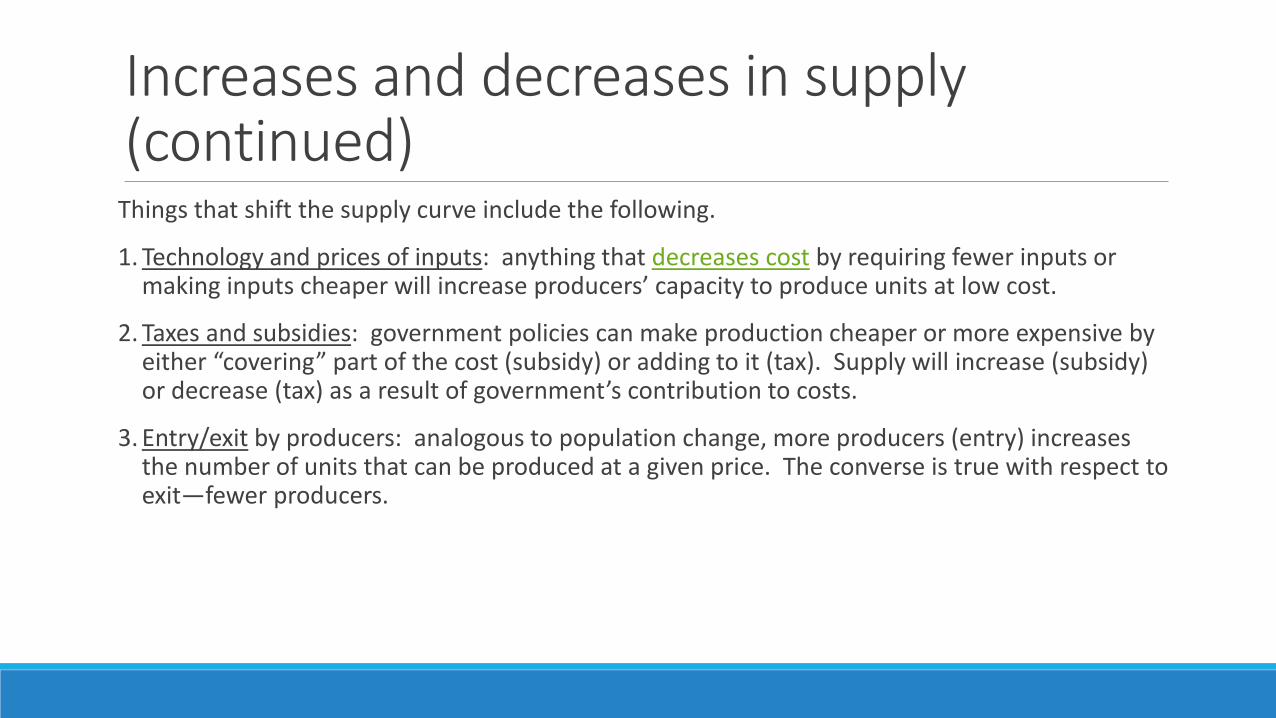
Things that shift the supply curve include the following.
1. Technology and prices of inputs: anything that decreases cost by requiring fewer inputs or making inputs cheaper will increase producers’ capacity to produce units at low cost.
2. Taxes and subsidies: government policies can make production cheaper or more expensive by either “covering” part of the cost (subsidy) or adding to it (tax). Supply will increase (subsidy) or decrease (tax) as a result of government’s contribution to costs.
3. Entry/exit by producers: analogous to population change, more producers (entry) increases the number of units that can be produced at a given price. The converse is true with respect to exit—fewer producers.
Increases and decreases in supply (concluded)
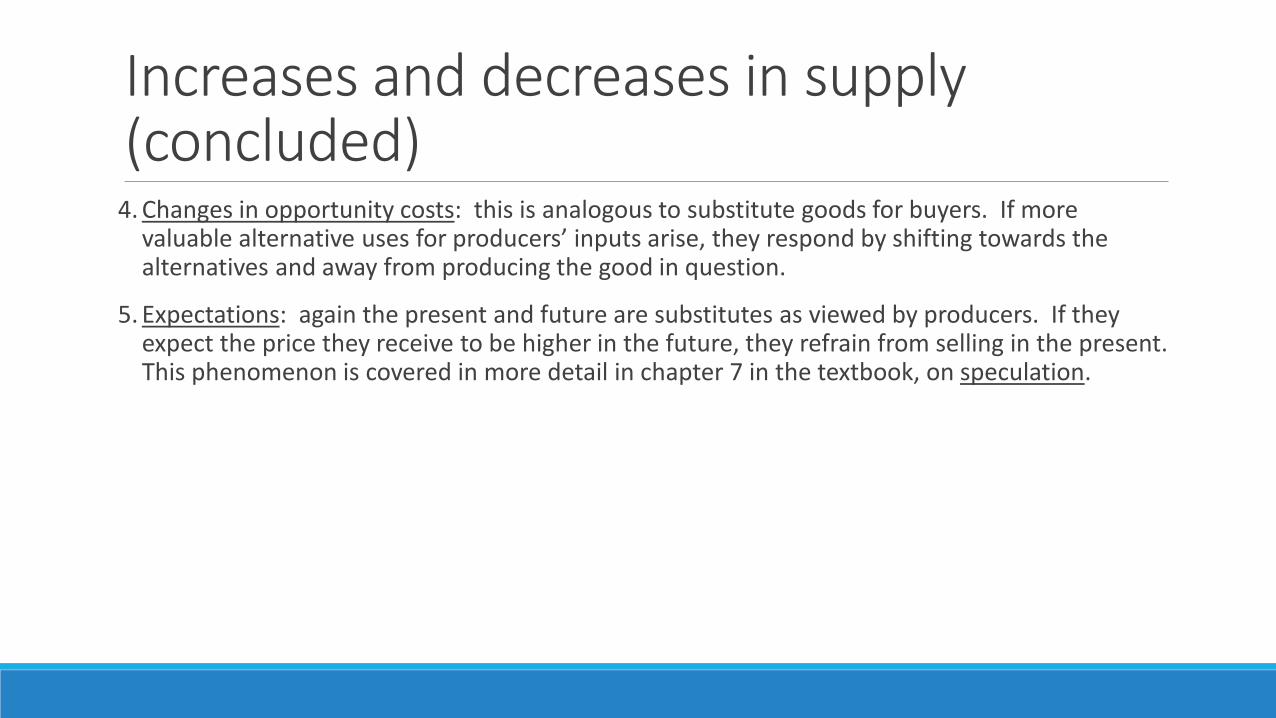
4. Changes in opportunity costs: this is analogous to substitute goods for buyers. If more valuable alternative uses for producers’ inputs arise, they respond by shifting towards the alternatives and away from producing the good in question.
5. Expectations: again the present and future are substitutes as viewed by producers. If they expect the price they receive to be higher in the future, they refrain from selling in the present. This phenomenon is covered in more detail in chapter 7 in the textbook, on speculation.
Conclusion•Supply and demand are the 2 elemental forces of the market that jointly determine goods’ prices and levels of output.
•The mechanism by which they do so is called equilibrium, and it is the next concept to which we will turn our attention.

Insufficiently valuable use of resourcesHomer: Flanders! My socks feel dirty. Give me some water to wash them.
Flanders: Again? Homer, we have to ration the water carefully. It's our only hope!
Back.
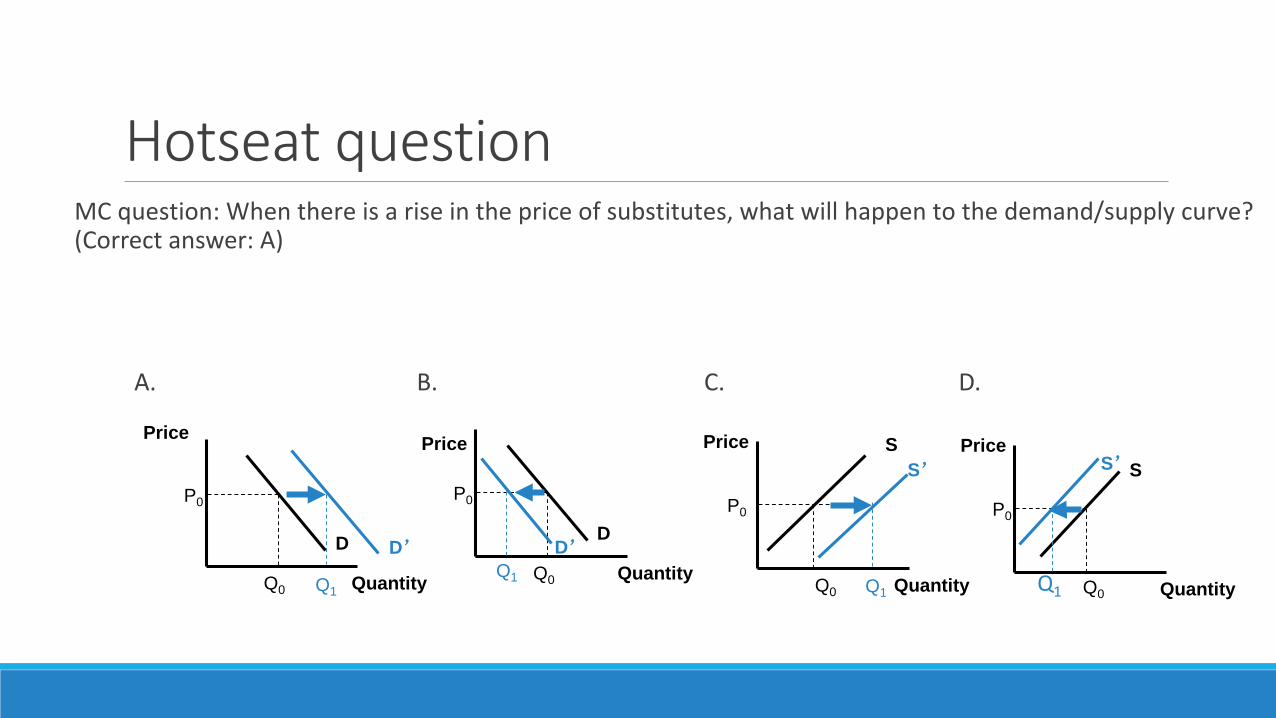
Hotseat questionMC question: When there is a rise in the price of substitutes, what will happen to the demand/supply curve? (Correct answer: A)
A. B. C. D.
P0
Q0
Price
Quantity
D D’
Q1
P0
Q0
Price
Quantity
DD’
Q1
P0
Q0
Price
Quantity
S
Q1
S’
P0
Price
Quantity
SS’
Q0Q1