Embed Size (px)
Citation preview
i
Supply C hain Busines s In telligen ce ‐
Marce la Alves F reire
Mode l prop osal and imple mentation to sup por t the
onl ine sales sup ply chai n end to end ope ratio n of a
Portuguese ele ctronics re tail comp a ny
Pro je c t W ork presented as partial r equir em e nt fo r obtaining
th e Master’s d egre e in Infor mati on M anagem en t
i
NOVA Information Management School
Instituto Superior de Estatística e Gestão de Informação Universidade Nova de Lisboa
SUPPLY CHAIN BUSINESS INTELLIGENCE ‐ MODEL PROPOSAL AND
IMPLEMENTATION TO SUPPORT THE ONLINE SALES SUPPLY CHAIN
END TO END OPERATION OF A PORTUGUESE ELECTRONICS RETAIL
COMPANY
by
Marcela Alves Freire
Project Work presented as partial requirement for obtaining the Master’s degree in Information
Management, with a specialization in Knowledge Management and Business Intelligence
Co Advisor: Miguel de Castro Simões Ferreira Neto
Co Advisor: Miguel Nuno da Silva Gomes Rodrigues Gago

ii
ACKNOWLEDGEMENTS
I would like to thank all those who contributed to the development of this project.
To my advisors, Professor Miguel Neto and Professor Miguel Gago. Thank you for your guidance,
advices and feedback throughout this process.
To the company that trusted me with this project, in particular to my advisor Pedro Costa and to the
entire Business Intelligence team. This would have not been a possibility without your support and
guidance.
To Carlos Francisco Neto, who has always been there for me. Thank you for being supportive, caring
and patient throughout this entire journey.
To my family, in particular to my parents, Vera Maria Alves and Francisco Morel. You are my
inspiration. Thank you for supporting me throughout my studies, for motivating me and for believing
in me.
iii
ABSTRACT
In today’s highly competitive business environment, the adoption of Supply Chain Management is seen
as an advantage. It provides not only effective integration, but also cooperation within the supply
chain.
However, in order to achieve further integration, other practices are needed. With growing volumes
of data, businesses are required to ensure its appropriate flow, integration and analysis.
This project, named “Supply Chain Business Intelligence ‐ Model proposal and implementation to
support the online sales supply chain end to end operation of a Portuguese electronics retail company”
had as its main goal the development of a conceptual model of a Business Intelligence system to
address the needs of an online sales supply chain end to end operation. The proposed model should
not focus on a specific company. Instead, it should provide a solution for other similar problems.
The project starts with the definition of the problem, objectives and methodology. It is then followed
by the literature review, which consists of a thorough research to identify best practices and previous
works in the literature that dealt with similar problems. The research focuses on three main topics:
Supply Chain Management, Internet Retail Industry and Business Intelligence.
A conceptual model is then developed, which consists of four main steps: definition of the overall
requirements, metrics, data mart model and dashboards. For the data mart model, it is important to
identify the business process, the appropriate granularity and respective dimensions and fact tables.
It is then followed by a case study, which consists in the implementation of the model to solve
Company X’s problem. As outputs of the project, both data mart and dashboards are considered, since
they are part of the artifact needed to achieve the business requirements.
Finally, a discussion and evaluation of the results is conducted. Even though the implementation part
of the project presented some challenges, the final solution still showed improvements for Company
X and proved to be appropriate for the provided business requirements.
Limitations and possible aspects of improvements are presented in the last chapter of the project.
KEYWORDS
Supply Chain; Internet Retail; Online Sales; Business Intelligence; Data Mart; Dashboard.
iv
INDEX
1. Introduction ......................................................................................................................... 1
1.1. Background ................................................................................................................... 1
1.2. Problem definition ........................................................................................................ 2
1.3. Main Goal and Specific Objectives ................................................................................ 3
1.4. Study Relevance and Importance .................................................................................. 4
1.5. Methodology ................................................................................................................ 5
2. Literature Review ................................................................................................................. 7
2.1. Supply Chain Management ........................................................................................... 7
2.2. Internet Retail Industry Supply Chain............................................................................ 9
2.3. Business Intelligence in Supply Chain Management ................................................... 12
2.3.1. Data Warehouse ................................................................................................. 14
2.3.2. Information Visualization and Dashboard Design ............................................... 16
3. Conceptual Model Proposal ............................................................................................... 21
3.1. Context ....................................................................................................................... 21
3.2. Overall Requirements ................................................................................................. 25
3.3. Measures and Metrics ................................................................................................ 27
3.4. Data Mart Conceptual Model...................................................................................... 32
3.4.1. Select the business process ................................................................................. 32
3.4.2. Define the granularity ......................................................................................... 32
3.4.3. Identify the dimensions ....................................................................................... 33
3.4.4. Identify the facts ................................................................................................. 36
3.5. Dashboard Conceptual Model .................................................................................... 41
4. Development ...................................................................................................................... 45
4.1. Platform ...................................................................................................................... 45
4.2. Data Sources ............................................................................................................... 46
4.3. Data Integration and Processing ................................................................................. 47
4.3.1. Data Mart Model ................................................................................................. 47
4.3.2. ETL ....................................................................................................................... 49
4.4. Dashboard ................................................................................................................... 50
4.4.1. Transportation Purchase Orders Information ..................................................... 55
4.4.2. Online Sales Supply Chain E2E Process Summary................................................ 56
4.4.3. Online Sales Supply Chain E2E Process Summary (Campaign Season) ................ 57
4.4.4. Systems, Operation and Transportation Performance Assessment .................... 57
5. Results and Discussion ....................................................................................................... 59

v
5.1. Discussion and Evaluation of the Results .................................................................... 59
6. Conclusion .......................................................................................................................... 61
7. Limitations and recommendations for Future Works ......................................................... 63
8. Bibliography ....................................................................................................................... 65
9. Appendix ............................................................................................................................ 69
vi
LIST OF FIGURES
Figure 1.1 – Overall Online Sales Process .................................................................................. 2
Figure 1.2 – Diagram showing the existing solution and the intended solution for Company X
............................................................................................................................................
3
Figure 1.3 – Process Model for DSR. Adapted from Peffers, Tuunanen, Rothenberger &
Chatterjee (2007) ...............................................................................................................
6
Figure 2.1 – Typical supply chain of a company. Adapted from Chen & Paulraj (2004) ............ 8
Figure 2.2 – Representation of a multichannel company’s supply chain which includes
Warehousing, Distribution, Information Technology and Transportation Services.
Adapted from Barry (n. d.) ............................................................................................... 11
Figure 2.3 – Top 10 categories in Amazon as of April 2019. Adapted from ScrapeHero (2019)
..........................................................................................................................................
12
Figure 2.4 – Modern data architecture. Adapted from Hansen (2020) ................................... 14
Figure 2.5 – SCI Global Model. Adapted from Stefanovic, Majstorovic & Stefanovic (2006) .. 15
Figure 2.6 – Star Schema. Adapted from Kimball & Ross (2011) ............................................. 16
Figure 2.7 – Visualization process. Adapted from Ware (2013) .............................................. 17
Figure 2.8 – GQM model. Adapted from Janes, Sillitti & Succi (2013) ..................................... 18
Figure 2.9 – A guideline for choosing the proper chart. Adapted from Abela (2006) ............. 20
Figure 2.10 – Reading gravity. Adapted from Reporting Impulse (2019) ................................ 21
Figure 3.1 – Overall Online Sales Process ................................................................................ 23
Figure 3.2 – Supplier Stores online sales E2E process ............................................................. 24
Figure 3.3 – Online sales E2E process for orders that are prepared in a supplier store that
coincides with the chosen delivery store ......................................................................... 25
Figure 3.4 – Proposed supply chain metrics. Adapted from Chae (2009) ............................... 30
Figure 3.5 – Simplified diagram of the conceptual data mart model ..................................... 40
Figure 3.6 – Systems Purchase Orders Information dashboard conceptual model ................ 42
Figure 3.7 – Operation Purchase Orders Information dashboard conceptual model ............. 42
Figure 3.8 – Transportation Purchase Orders Information dashboard conceptual model ..... 43
Figure 3.9 – Online Sales Supply Chain E2E Process Summary (Campaign Season) dashboard
conceptual model .............................................................................................................
43
Figure 3.10 – Online Sales Supply Chain E2E Process Summary dashboard conceptual model
vii
..........................................................................................................................................
44
Figure 4.1 – Magic Quadrant for Analytics and Business Intelligence Platforms (Gartner,
2020) .................................................................................................................................
45
Figure 4.2 – Simplified diagram of Company X’s data mart ..................................................... 49
Figure 4.3 – Dashboard Transportation Purchase Orders Information ................................... 51
Figure 4.4 – Dashboard Online Sales Supply Chain E2E Process Summary ............................. 52
Figure 4.5 – Dashboard Online Sales Supply Chain E2E Process Summary (Campaign Season)
..........................................................................................................................................
53
Figure 4.6 – Dashboard Systems, Operation and Transportation Performance Assessmen ... 54
Figure 6.1 – Evaluation of the artifact ...................................................................................... 61
Figure 9.1 – Diagram of the conceptual data mart model ...................................................... 79
Figure 9.2– Zoom of the diagram of the data mart model focusing solely on FactSystems and
its dimensions ...................................................................................................................
80
Figure 9.3 – Zoom of the diagram of the data mart model focusing solely on FactOperation
and its dimensions ............................................................................................................
81
Figure 9.4 – Zoom of the diagram of the data mart model focusing solely on
FactTransportation and its dimensions ............................................................................
82
Figure 9.5 – Zoom of the diagram of the data mart model focusing solely on
FactOnlineSalesE2E and its dimension .............................................................................
83
Figure 9.6 – Diagram of Company X’s data mart.................................................................... 84
Figure 9.7 – Summary of ETL process ...................................................................................... 94
Figure 9.8 – Summary of ETL process (zoom) .......................................................................... 95
Figure 9.9 – Summary of ETL process (zoom) .......................................................................... 96

viii
LIST OF TABLES
Table 2.1 – Examples of potential applications of big data in logistics. Adapted from Waller &
Fawcett (2013) ................................................................................................................. 13
Table 3.1 – Dashboards and their target users ........................................................................ 30
Table 3.2 – Supply Chain Performance Metrics Framework. Adapted from Gunasekaran,
Patel & McGaughey (2004) .............................................................................................. 31
Table 3.3 – Measures and metrics defined for the project ..................................................... 33
Table 9.1 – DimDate fields and their respective descriptions ................................................. 69
Table 9.2 – DimProduct fields and their respective descriptions ............................................ 70
Table 9.3 – DimAddress fields and their respective descriptions ............................................ 70
Table 9.4 – DimFlow fields and their respective descriptions ................................................. 71
Table 9.5 – DimShipCompany fields and their respective descriptions ................................... 71
Table 9.6 – DimStore fields and their respective descriptions ................................................ 72
Table 9.7 – DimStatus fields and their respective descriptions ............................................... 72
Table 9.8 – FactOnlineSalesE2E fields and their respective descriptions ................................ 74
Table 9.9 – FactSystems fields and their respective descriptions ........................................... 75
Table 9.10 – FactOperation fields and their respective descriptions ...................................... 76
Table 9.11 – FactTransportation fields and their respective description ................................ 78
Table 9.12 – OMS used tables and respective fields ................................................................ 86
Table 9.13 – WMS used tables and respective fields ............................................................... 87
Table 9.14 – RMOS used tables and respective fields ............................................................. 87
Table 9.15 – Company X’s DimDate fields, data sources and data types ................................ 88
Table 9.16 – Company X’s DimProduct fields, data sources and data types ...........................
89
Table 9.17 – Company X’s DimAddress fields, data sources and data types ...........................
89
Table 9.18 – Company X’s DimFlow fields, data sources and data types ................................ 90
Table 9.19 – Company X’s DimStore fields, data sources and data types ...............................
90
Table 9.20 – Company X’s DimStatus fields, data sources and data types .............................. 90
Table 9.21 – Company X’s FactOnlineSalesE2E fields, data sources and data types ...............
92 Table 9.22 – Company X’s FactTransportation fields, data sources and data types
............... 93
ix
LIST OF ABBREVIATIONS AND ACRONYMS
ABI Analytics and Business Intelligence
B2C Business‐to‐Consumer
BI Business Intelligence
CE Consumer Electronics
DC Distribution Centers
DD Degenerate Dimension
DM Data Mining
DS Design Science
DSR Design Science Research
DSRM Design Science Research Methodology
DSS Decision Support System
DW Data Warehouse
ETL Extract, Transform and Load
GQM Goal Question Measurement
GSCF Global Supply Chain Forum
IS Information Systems
KPI Key Performance Indicator
OLAP Online Analytical Processing
OMS Online Management System
RMOS Retail Merchandise Operation System
SA Sales Assistant
SC Supply Chain
SCD Slowly Changing Dimension
SCI Supply Chain Intelligence
x
SCM Supply Chain Management
SCOR Supply Chain Operations Reference
SKU Stock Keeping Unit
SSIS SQL Server Integration Services
SSMS SQL Server Management Studio
UML Unified Modeling Language
WMS Warehouse Management System
YTD Year to date
1
1. INTRODUCTION
Given the flexibility and the comfort that online shopping brings to the shopping experience,
ecommerce has shown a considerable growth in the past years. As new technologies and trends
emerge, it is of great importance that the e‐commerce businesses adapt to the new reality.
Some of the biggest challenges faced by these businesses are centered in their supply chain. The
purpose of the following project is to present a Business Intelligence (BI) solution to address the needs
of the online sales end to end operation from a supply chain perspective. After proposing a conceptual
model, its implementation will be conducted concerning a Portuguese electronics retail company. Due
to confidentiality terms, the company will not be identified, as well as the specific names for data
sources, tables and respective fields. So, in order to deliver the outputs proposed in this project,
generic names will be presented and the company will be referred to as Company X.
1.1. BACKGROUND
Every day, businesses face more and more pressure to reduce costs, reduce process times and increase
profit. There is an increasing expectation for high quality products and services that need to be
delivered at the right time and place. In this business environment, one of the key success factors for
companies concerns the implementation of an effective integration strategy between all supply chain
collaborators (Stefanovic & Stefanovic, 2009).
In order to provide competitive advantage and to respond to an ever‐changing global environment,
Supply Chain Management (SCM) was introduced as a new management philosophy (Stefanovic &
Stefanovic, 2009). This has been a concept of great value ever since the early 20th century with the
development of the first assembly line. However, as a term, it was only introduced to the public in
1982 in an interview given to the Financial Times by Keith Oliver, a consultant at Booz Allen Hamilton.
Still, it only became popular with the publication of “Introduction of Supply Chain Management” in
1999 by Robert B. Handfield and Ernest L. Nichols, Jr. The book was translated to Japanese, Korean,
Chinese, and Russian and over 25,000 copies were published (Ghosh, 2016).
Instead of viewing Supply Chain (SC) as a set of individual parts, each having its own function and
purpose, SCM considers it to be a single entity. After developing a study to find a consensus definition
for SCM, Stock and Boyer (2009) came up with the following result: “The management of a network of
relationships within a firm and between interdependent organizations and business units consisting of
material suppliers, purchasing, production facilities, logistics, marketing, and related systems that
facilitate the forward and reverse flow of materials, services, finances and information from the
original producer to final customer with the benefits of adding value, maximizing profitability through
efficiencies, and achieving customer satisfaction”.
Even with all the benefits that come from implementing SCM systems, they do not have the capability
of developing the sophisticated analysis necessary to provide an integrated view of the SC. That is
where BI takes place. With its tools and methodologies, such as data warehousing, “Extract, Transform
and Load” (ETL), Online Analytical Processing (OLAP) and Data Mining (DM), BI provides the means for
the identification, treatment and analysis of business data (Stefanovic & Stefanovic, 2009).
2
With focus on the past two decades, BI and related fields have grown considerably (Chen, Chiang &
Storey, 2012). According to the Gartner Group (n. d.), analytics and business intelligence (ABI) may be
defined as “an umbrella term that includes the applications, infrastructure and tools, and best
practices that enable access to and analysis of information to improve and optimize decisions and
performance”.
Alongside analytics, BI proposes a set of techniques and methodologies which allow for critical business
data to be integrated and analyzed, providing businesses the possibility of making better decisions.
Through the combination of data mart modelling and tools, it is possible to extract, transform and load
the core data into final structured data repositories. Then, with OLAP and reporting tools, explore the
data and present it in an intuitive way according to the business needs (Chen, Chiang & Storey, 2012).
1.2. PROBLEM DEFINITION
Company X is a Portuguese retail company that operates in the fields of consumer electronics (CE),
household appliances and entertainment. It is currently present in Portugal, including Madeira e
Açores, in more than 180 stores. Besides physical stores, it also has an e‐commerce channel, through
which customers have access to a wide selection of products and brands, including exclusive brands.
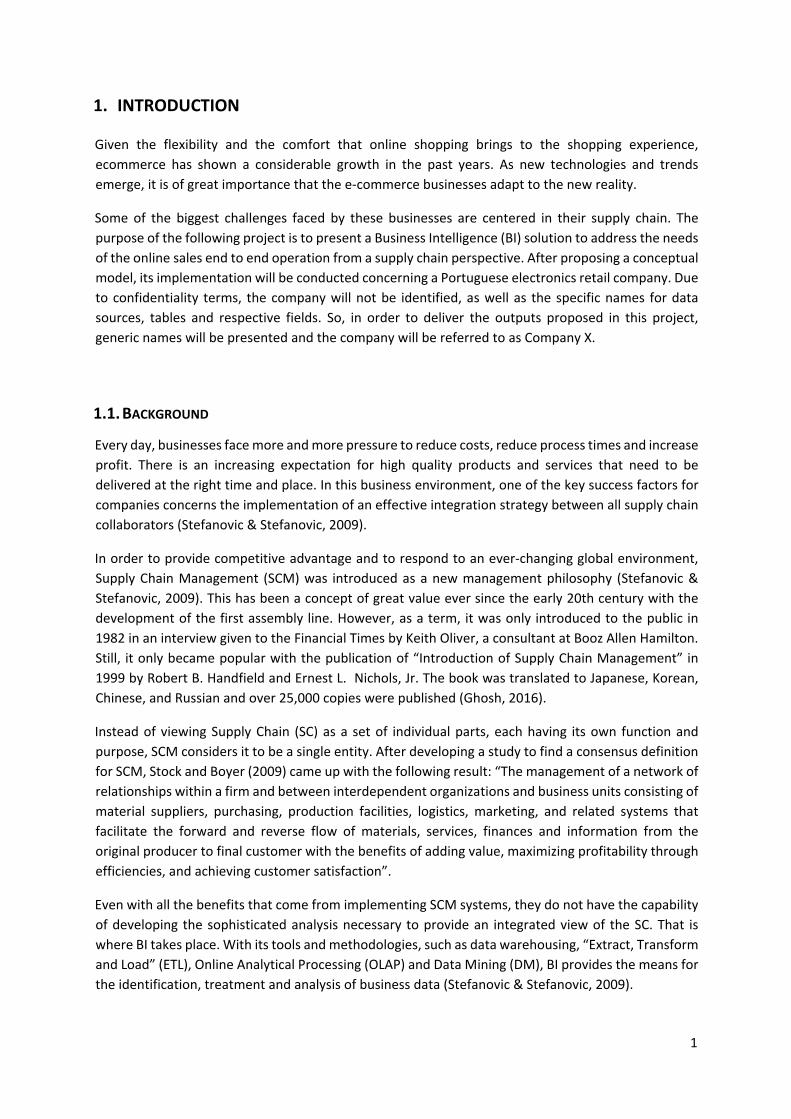
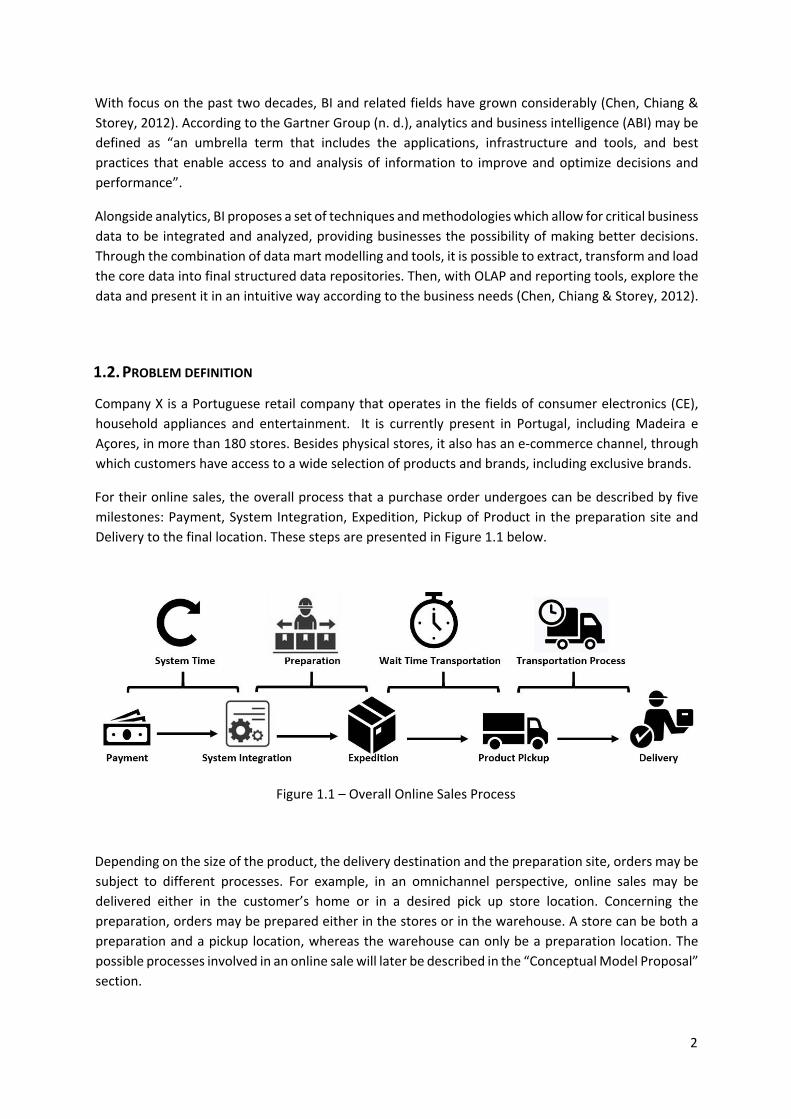
For their online sales, the overall process that a purchase order undergoes can be described by five
milestones: Payment, System Integration, Expedition, Pickup of Product in the preparation site and
Delivery to the final location. These steps are presented in Figure 1.1 below.
Figure 1.1 – Overall Online Sales Process
Depending on the size of the product, the delivery destination and the preparation site, orders may be
subject to different processes. For example, in an omnichannel perspective, online sales may be
delivered either in the customer’s home or in a desired pick up store location. Concerning the
preparation, orders may be prepared either in the stores or in the warehouse. A store can be both a
preparation and a pickup location, whereas the warehouse can only be a preparation location. The
possible processes involved in an online sale will later be described in the “Conceptual Model Proposal”
section.
3
Since the customers’ satisfaction is one of Company X’s main priorities, keeping track of every order
and making sure that the delivery is made within the promised date is one of their biggest concerns.
In the present moment, the solution developed to address this matter is built using Microsoft Access
and Excel, which limits its performance considerably.
As it is not a properly structured solution, updates, errors corrections and other repetitive tasks
represent a heavy workload for the members of the supply chain BI team. Also, due to the long time
the updates require, it is not possible to deliver analysis in a timely manner, which is a big concern
specially during discount events that overburden the supply chain.
In addition, because of changes in the company’s supply chain management strategy, the currently
used warehouse management system is being replaced. This implicates in the change of processes,
data fields mapping and, consequently, in the invalidation of some parts of the current solution.
1.3. MAIN GOAL AND SPECIFIC OBJECTIVES
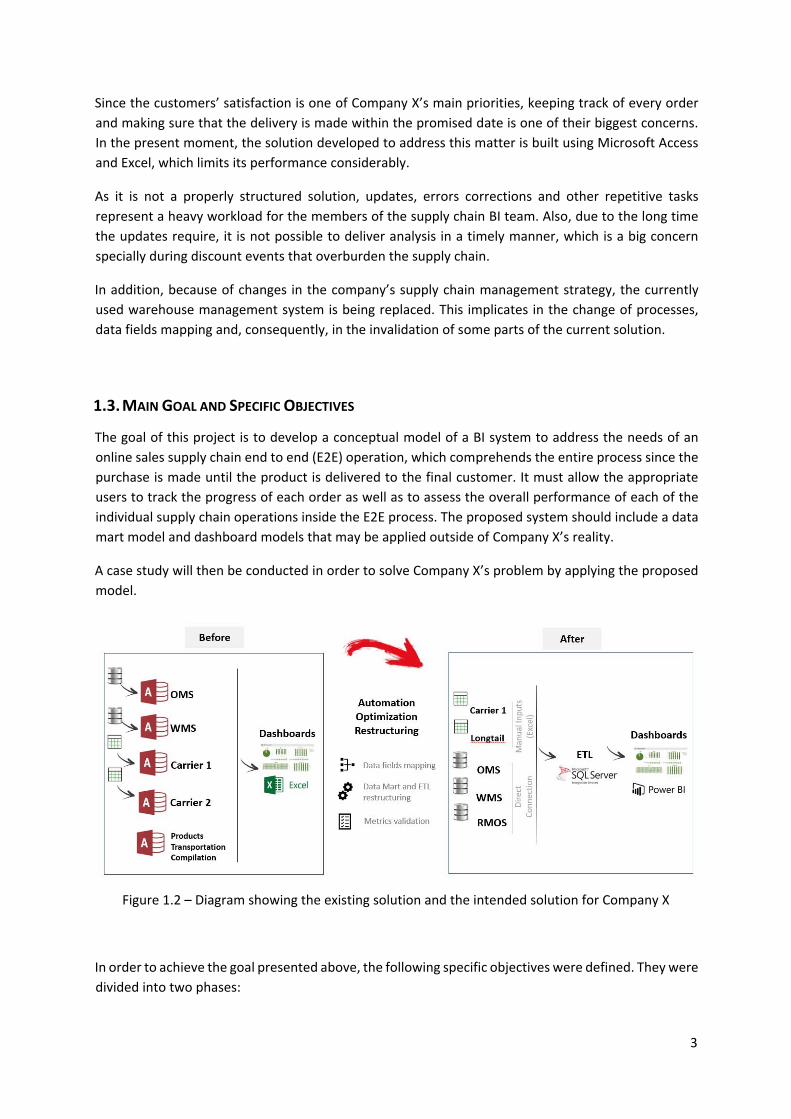
The goal of this project is to develop a conceptual model of a BI system to address the needs of an
online sales supply chain end to end (E2E) operation, which comprehends the entire process since the
purchase is made until the product is delivered to the final customer. It must allow the appropriate
users to track the progress of each order as well as to assess the overall performance of each of the
individual supply chain operations inside the E2E process. The proposed system should include a data
mart model and dashboard models that may be applied outside of Company X’s reality.
A case study will then be conducted in order to solve Company X’s problem by applying the proposed
model.
Figure 1.2 – Diagram showing the existing solution and the intended solution for Company X
In order to achieve the goal presented above, the following specific objectives were defined. They were
divided into two phases:
4
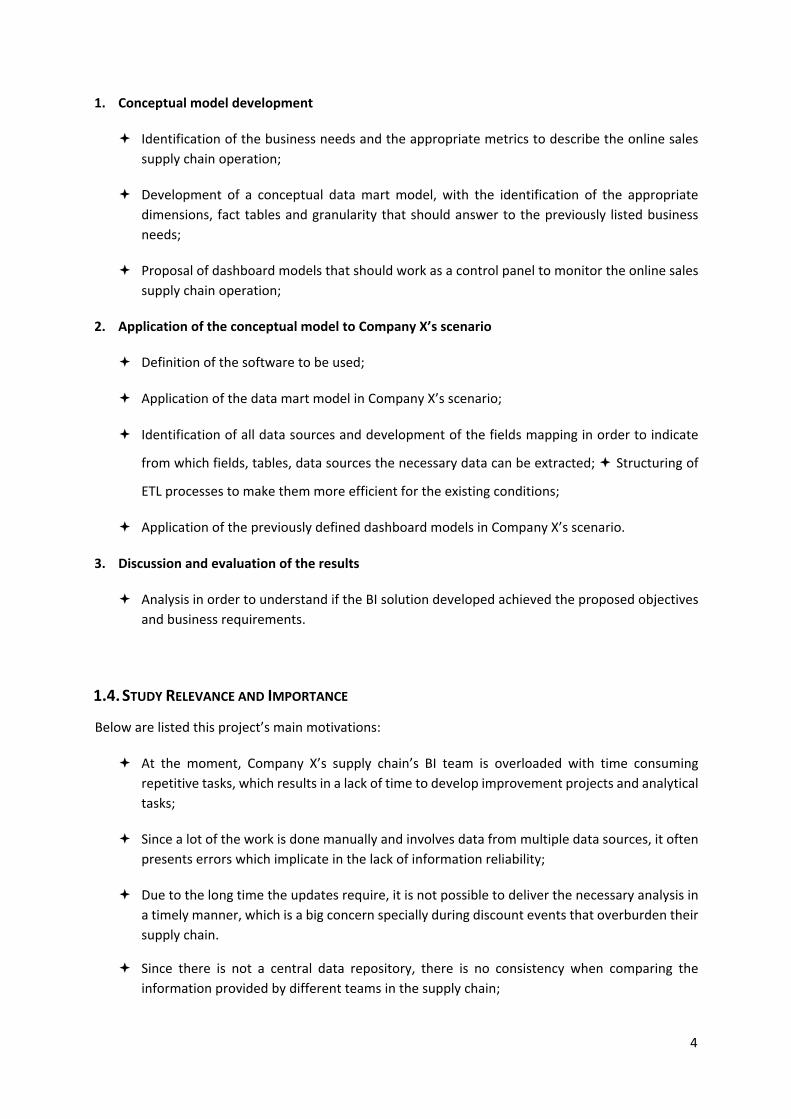
1. Conceptual model development
Identification of the business needs and the appropriate metrics to describe the online sales
supply chain operation;
Development of a conceptual data mart model, with the identification of the appropriate
dimensions, fact tables and granularity that should answer to the previously listed business
needs;
Proposal of dashboard models that should work as a control panel to monitor the online sales
supply chain operation;
2. Application of the conceptual model to Company X’s scenario
Definition of the software to be used;
Application of the data mart model in Company X’s scenario;
Identification of all data sources and development of the fields mapping in order to indicate
from which fields, tables, data sources the necessary data can be extracted; Structuring of
ETL processes to make them more efficient for the existing conditions;
Application of the previously defined dashboard models in Company X’s scenario.
3. Discussion and evaluation of the results
Analysis in order to understand if the BI solution developed achieved the proposed objectives
and business requirements.
1.4. STUDY RELEVANCE AND IMPORTANCE
Below are listed this project’s main motivations:
At the moment, Company X’s supply chain’s BI team is overloaded with time consuming
repetitive tasks, which results in a lack of time to develop improvement projects and analytical
tasks;
Since a lot of the work is done manually and involves data from multiple data sources, it often
presents errors which implicate in the lack of information reliability;
Due to the long time the updates require, it is not possible to deliver the necessary analysis in
a timely manner, which is a big concern specially during discount events that overburden their
supply chain.
Since there is not a central data repository, there is no consistency when comparing the
information provided by different teams in the supply chain;
5
Due to the replacement of the warehouse’s management system, some parts of the existing BI
solution are no longer valid.
Through the implementation of a well‐structured BI solution, Company X will be able to guarantee the
quality of what is shared along their supply chain. It will also allow more accurate and faster reporting,
it will optimize team members’ time and, consequently, improve employee satisfaction. Team
members will be able to dedicate their time to more challenging and fulfilling projects, instead of
manual repetitive tasks. Finally, it will give Company X competitive advantage in the market by
increasing its adaptability. And also allow it to overcome the impact of a change in the warehouse
management system.
Besides being relevant to Company X, the conceptual model proposed in this project may benefit other
companies that are facing similar challenges. Although each case is different and brings its own needs,
the model intends to propose the core fact tables and dimensions for a data mart that allows the
tracking of the progress of an online sale throughout the supply chain of a company. Besides that, it
should allow for the assessment of the overall performance of each of the supply chain operations
involved in an online sale. As well as the data mart model, the dashboard models could be adapted for
other company’s needs.
In an academic perspective, this project will also be relevant to studies which correlate BI, supply chain
and e‐commerce. Although it is possible to find many studies concerning BI in supply chain or e‐
commerce’s supply chain, it is not common in the literature to find publications that correlate the
three.
1.5. METHODOLOGY
In order to develop this project, the chosen methodology is Design Science Research (DSR). According
to Peffers, Tuunanen, Rothenberger & Chatterjee (2007), responsible for proposing a framework for
Design Science Research Methodology (DSRM), it “contributes to information systems (IS) research by
providing a commonly accepted framework for successfully carrying out design science (DS) research
and a mental model for its presentation”.
DSR has its primary focus set in the creation of new knowledge through the development and design
of innovative artifacts and their performance assessment through reflection and abstraction. The
outputs of DSR include algorithms, system design methodologies, languages, among others (Vaishnavi
& Kuechler, 2004).
As it was already mentioned in the previous sections, the main goal of this project is to develop a
conceptual model of a BI system that answers to the needs of an online sales supply chain end to end
operation. Since it involves the creation of innovative artifacts and products in the field of IS which
intend to answer to a specific problem in its own application environment, the DSRM was considered
appropriate for the development of the project.
The DSRM proposed by Peffers, Tuunanen, Rothenberger & Chatterjee (2007) resulted from a
consensus building approach which identified the key elements used in prior literature in DS research.
The result consisted of a process model composed by six core activities: 1) Problem identification and
motivation, 2) Definition of the objectives for a solution, 3) Design and development, 4)
6
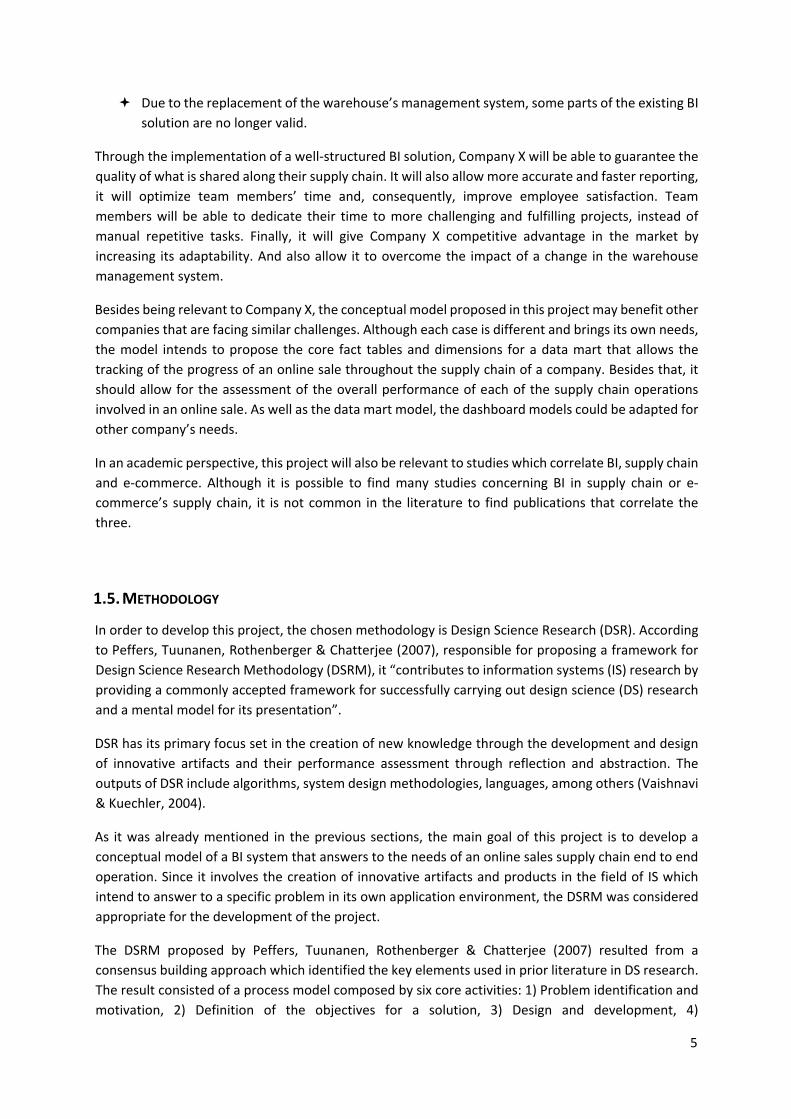
Demonstration, 5) Evaluation, 6) Communication (Peffers, Tuunanen, Rothenberger & Chatterjee,
2007). A graphical representation of the model can be seen in Figure 1.3 below:
Figure 1.3 – Process Model for DSR. Adapted from Peffers, Tuunanen, Rothenberger & Chatterjee
(2007)
Problem identification and motivation: Definition of the specific research problem and the
identification of the solution relevance and importance (Peffers, Tuunanen, Rothenberger &
Chatterjee, 2007). For this project, the motivation came from Company X’s need of a new and
improved BI solution focused in its online sales supply chain end to end operation. As it was previously
mentioned, the existing BI solution lacked in performance and resulted in time consuming repetitive
tasks that overburden the supply chain BI team and resulted in unreliable information. Problem
identification and solution value are presented in more detail in the “Problem Definition” and “Study
Relevance and Importance” sections.
Definition of the objectives for a solution: Identification of the objectives of a solution which should
be inferred from the problem specification. These objectives should be rationally defined (possible and
feasible objectives) and can either be quantitative or qualitative (Peffers, Tuunanen, Rothenberger &
Chatterjee, 2007). For the current project, as it was specified in the section “Main Goal and Specific
Objectives”, the main objective is centered in the development a conceptual model and application of
a BI system that answers to the needs of an online sales supply chain end to end operation.
Design and development: Creation of the artifact. Artifacts may be constructs, models, methods or
instantiations (Peffers, Tuunanen, Rothenberger & Chatterjee, 2007). For this project, the artifact will
consist of a conceptual model of a BI system which will be composed of appropriate metrics, data mart
model and dashboard models to meet the previously described objective. Even though it is focused in
Company X’s needs, the artifact must provide a solution that can be adapted for similar applications
outside of the company. The design of the model will be defined considering the best practices
identified in the “Literature Review” section.
7
Demonstration: Implementation/demonstration of the previously developed solution in order to solve
the identified problem. It may be done by experimentation, simulation, case study, proof or other
appropriate activity (Peffers, Tuunanen, Rothenberger & Chatterjee, 2007). For this project, a case
study will be conducted through the application of the proposed artifact to Company X’s problem. An
analysis will be first developed in order to identify the best tools for the implementation of the
solution, according to company’s available resources.
Evaluation: For this activity, it is necessary to observe and assess how the proposed artifact contributes
to the solution of the problem. It consists of comparing the obtained results of the implementation to
the previously defined objectives. The evaluation may be done in many forms, such as, quantitative
performance measures, satisfaction surveys, client feedback or simulations (Peffers, Tuunanen,
Rothenberger & Chatterjee, 2007). For this project, the evaluation will be done through the
assessment of the level of achievement of the artifact.
Communication: This activity is based in communication with the purpose of promoting awareness of
the problem and its importance, the solution through a proposed artifact, its design and effectiveness
(Peffers, Tuunanen, Rothenberger & Chatterjee, 2007). In the current project, communication will be
achieved through the development of the present report. Its structure is defined according to the
DSRM and its process model.
2. LITERATURE REVIEW
This chapter consists of the literature review that serves as the theoretical basis for the development
of the project.
First, a study of SCM and its role in organizations is presented. The specifications of e‐commerce supply
chain will be described in this section. Following, a topic for the application of BI solutions in the SCM
area will be presented.
Finally, the BI topic will be addressed. A study of the best practices in data warehousing, ETL, dashboard
design and information visualization will be conducted.
2.1. SUPPLY CHAIN MANAGEMENT
As it was previously mentioned, the term SCM was introduced in the early 1980s by consultants. Since
then, it has been used in reference to the planning, control of materials, logistics activities and
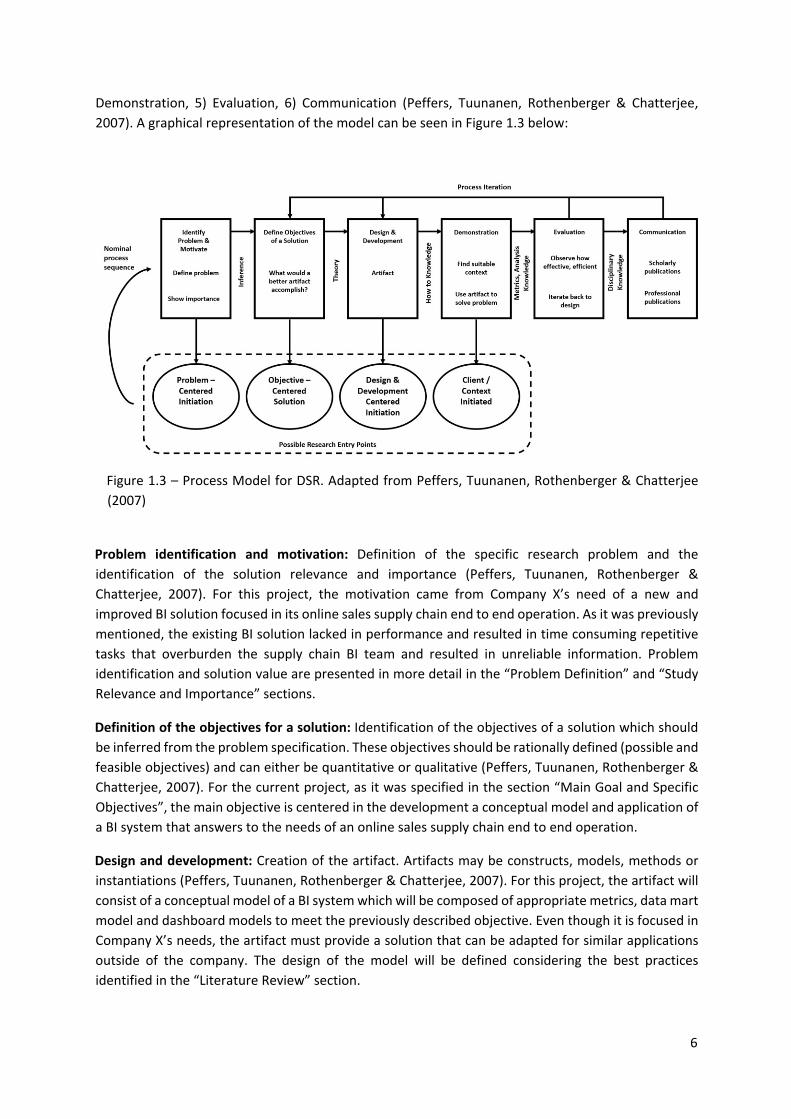
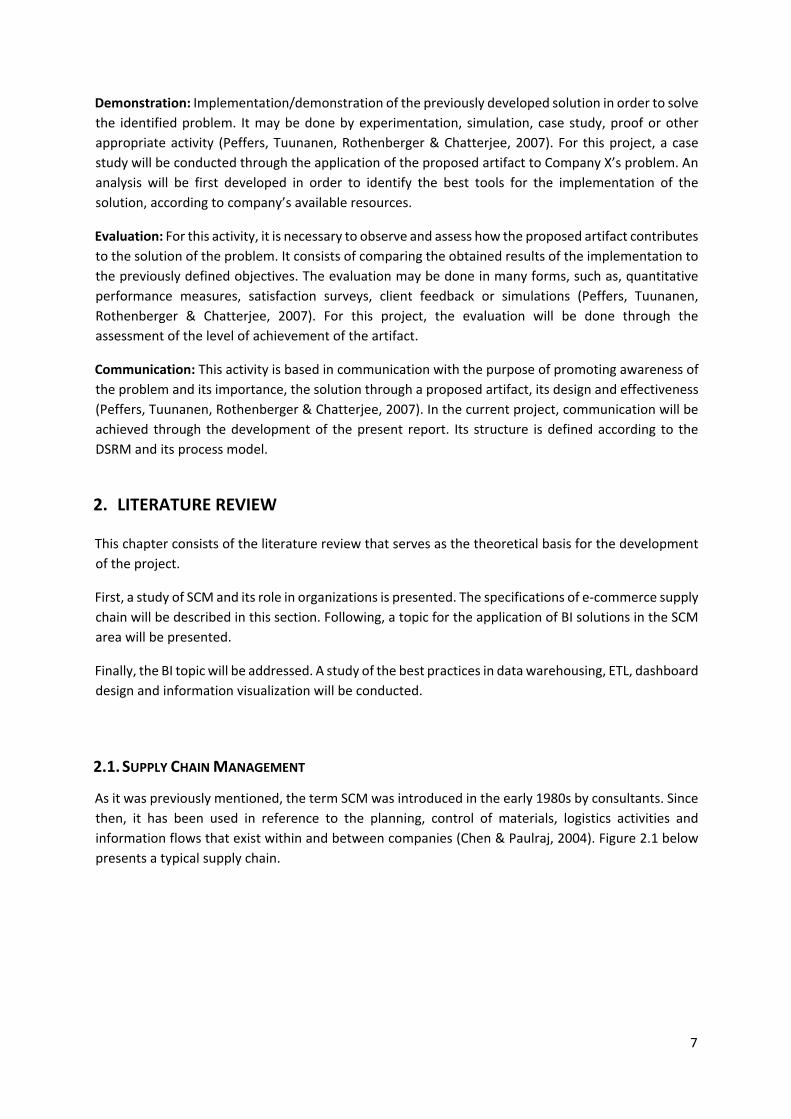
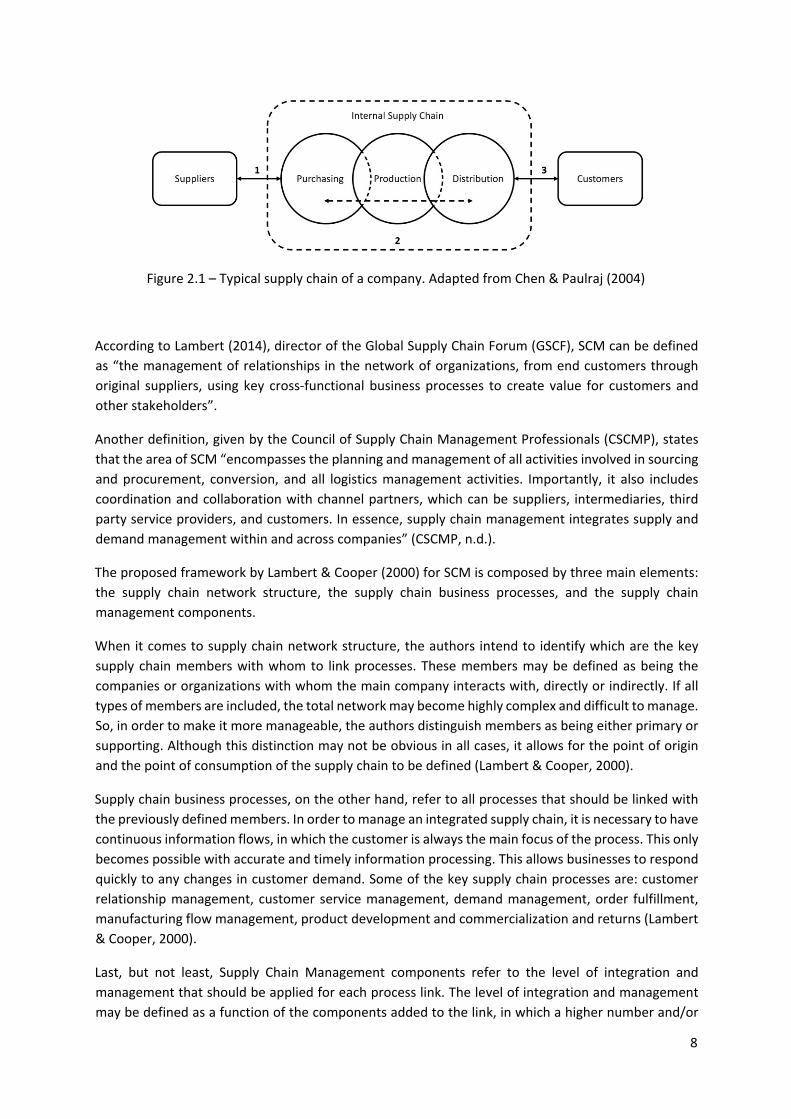
information flows that exist within and between companies (Chen & Paulraj, 2004). Figure 2.1 below
presents a typical supply chain.
8
Figure 2.1 – Typical supply chain of a company. Adapted from Chen & Paulraj (2004)
According to Lambert (2014), director of the Global Supply Chain Forum (GSCF), SCM can be defined
as “the management of relationships in the network of organizations, from end customers through
original suppliers, using key cross‐functional business processes to create value for customers and
other stakeholders”.
Another definition, given by the Council of Supply Chain Management Professionals (CSCMP), states
that the area of SCM “encompasses the planning and management of all activities involved in sourcing
and procurement, conversion, and all logistics management activities. Importantly, it also includes
coordination and collaboration with channel partners, which can be suppliers, intermediaries, third
party service providers, and customers. In essence, supply chain management integrates supply and
demand management within and across companies” (CSCMP, n.d.).
The proposed framework by Lambert & Cooper (2000) for SCM is composed by three main elements:
the supply chain network structure, the supply chain business processes, and the supply chain
management components.
When it comes to supply chain network structure, the authors intend to identify which are the key
supply chain members with whom to link processes. These members may be defined as being the
companies or organizations with whom the main company interacts with, directly or indirectly. If all
types of members are included, the total network may become highly complex and difficult to manage.
So, in order to make it more manageable, the authors distinguish members as being either primary or
supporting. Although this distinction may not be obvious in all cases, it allows for the point of origin
and the point of consumption of the supply chain to be defined (Lambert & Cooper, 2000).
Supply chain business processes, on the other hand, refer to all processes that should be linked with
the previously defined members. In order to manage an integrated supply chain, it is necessary to have
continuous information flows, in which the customer is always the main focus of the process. This only
becomes possible with accurate and timely information processing. This allows businesses to respond
quickly to any changes in customer demand. Some of the key supply chain processes are: customer
relationship management, customer service management, demand management, order fulfillment,
manufacturing flow management, product development and commercialization and returns (Lambert
& Cooper, 2000).
Last, but not least, Supply Chain Management components refer to the level of integration and
management that should be applied for each process link. The level of integration and management
may be defined as a function of the components added to the link, in which a higher number and/or
9
level of each component increase the level of integration and management. The authors identify nine
main management components that are key for successful SCM: culture and attitude, power and
leadership structure, management methods, product flow facility structure, organizational structure,
work structure, planning and control and information flow facility structure (Lambert & Cooper, 2000).
2.2. INTERNET RETAIL INDUSTRY SUPPLY CHAIN
Defined as being the segment of companies which sell products to customers, the retail industry is
characterized by one main relationship: retailer and customer. This relationship leads to the
interaction between retailers and suppliers: one retailer may have multiple suppliers, while one
supplier may serve multiple retailers. This supply chain is subject to constant change and a dynamic
environment in which the main driver is the retail customer. Before, customer purchasing habits could
be satisfied only by managing inventory levels. However, their demands have changed and a certain
level of customer service is now expected, which leads to the need of innovative solutions (Chiles &
Dau, 2005).
For a company’s supply chain to be successful, its chosen practices should be aligned with its business
strategy. Even though focusing on operational effectiveness and cost reduction may help set a
company’s position in the market, it is not enough to differentiate it in such a competitive
environment. Focusing on performing the same activities better is not enough. According to Hammer
(2004), the focus should be in achieving operational innovation, which involves performing different
activities or adopting differentiating methodologies. By aligning operational effectiveness and a
thought‐out business strategy, a company may develop unique practices that may provide continuous
performance differentiation (Hammer, 2004).
An important segment of the retail industry is internet retailing. It can be defined as the group of
companies that sells products or services though websites that act as online stores. These companies
may operate through multiple channels. Traditional companies that only operate through physical
stores are referred to as “brick‐and‐mortar”, while multichannel companies with online and physical
stores are said to use a “click‐and‐mortar” strategy. Those retailers which do not operate through
physical branches and rely solely on the internet are referred to as “pure‐play” (DeYoung, 2001).
As stated by Meyer (2020), the global e‐commerce market has reached the mark of $3.5 trillion of sales
by the end of 2019, which represents a total share of global retail sales of 14%. Predictions show a
growth of two percentage points by the end of 2020 and a total of sales of $4.2 trillion (Meyer, 2020).
With the Covid‐19 pandemic and consequent lockdown restrictions and business closures, ecommerce
has been a convenient option for consumers to acquire all kinds of goods. In 2020’s first semester,
June presented the biggest increase in global e‐commerce sales, with an increase in volume of 31%
when compared to the previous year. Although customers are spending online more regularly,
statistics show that the overall spending is slowing down (Toplin, 2020).
E‐commerce has changed significantly and is still changing the retailing industry. With its fast growth,
internet retail has a great impact on supply chain logistics. Nowadays, companies face the need to
adapt their supply chains in order to handle the growing volume of shipments that are now delivered
directly to their customers. Also, system changes and better processes become necessary so as to
10
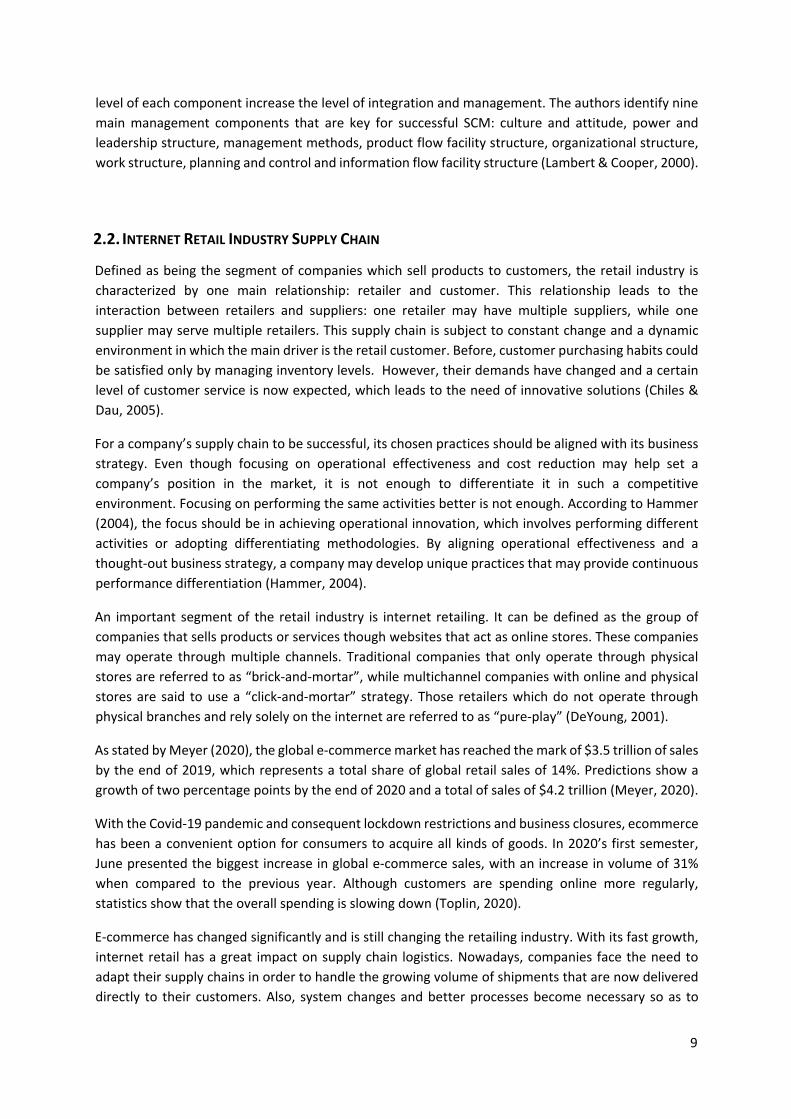
answer to a much higher volume of exchanges and returns (Barry, n. d.). Figure 2.2 below simulates a
multichannel company’s supply chain which includes Warehousing, Distribution, Information
Technology and Transportation Services.
Figure 2.2 – Representation of a multichannel company’s supply chain which includes Warehousing,
Distribution, Information Technology and Transportation Services. Adapted from Barry (n. d.)
According to Klumpp & Jasper (2008), the changes caused by the e‐commerce growth on logistic
processes are as follows: change in customers’ requirements, multiplicity of heterogeneous products,
large number of low volume deliveries and direct delivery.
Change in customers requirements: Due to new buying experiences and to continuous innovation
provided by leading e‐commerce businsseses, customers’ expectations are increasing. Customers
expect not only shorter delivery times, but also high availabitity of information in their shopping
experiences. For example, in the purchase process, reliable information concerning delivery time as
well as the possibility to track the order is expected. Also, with the convenience provided by the
internet, customers expect smaller processing times and order fullfilment (Klumpp & Jasper, 2008).
Multiplicity of heterogeneous products: At the beginning, e‐commerce opperated specially in the
sales of products that could be easily packed or that were digitiseable. With its growth, the
assortments available for sale expanded. Products available were then of multiple sizes, formats,
contained multiple parts or could even be perishable. This expansion presented new challenges to the
supply chain, as it was now necessary to develop new solutions for product storage and transportation
(Klumpp & Jasper, 2008).
11
Large number of low volume deliveries: When it comes to business‐to‐consumer (B2C) sales,
businesses were used to dealing with few, large volume consignments which had to be delivered
directly to the physical stores. However, with the expansion of e‐commerce, they had to adapt to deal
with the ever growing online orders that were mostly small sized and of low volume that had to be
delivered directly to the final customer. This presented a challenge as supply chain processes and
warehouses layout had to be revised (Klumpp & Jasper, 2008).
Direct Delivery: In traditional retail, when making a purchase, the customer is expected to go directly
to a physical store. The stages of picking and delivery are performed by the customer at the place of
sale. However, with e‐commerce, each purchase is then expected to be delivered at the customer’s
place of preference, which could mean having to return several times in case of customer’s absence.
In order not to overload the distribution system, businesses could choose to have these deliveries
made by a parcel service, which would mean having additional fixed costs. Another solution would be
limiting the supply area. Still, this goes against the goal of e‐commerce of expanding the market outside
of the area covered by chain stores (Klumpp & Jasper, 2008).
As mentioned before, in order to overcome these challenges and achieve a competitive position in the
e‐commerce environment, innovation is key. It is no longer acceptable to focus only on performance
by developing the same activities as every other business.
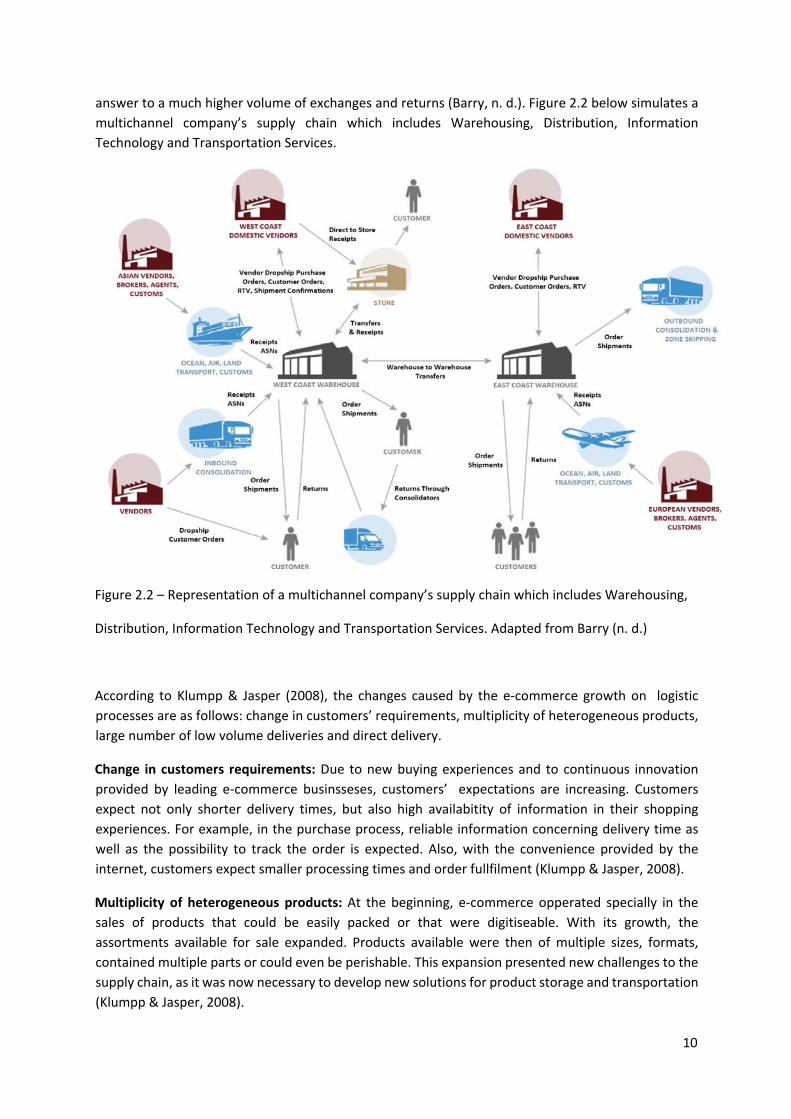
When it comes to innovative solutions in e‐commerce supply chain, Amazon.com is one of the most
referenced businesses. It first began selling books and music online in 1998. Its current scope of
products though ranges from video games and electronics to food and cosmetics. According to
ScrapeHero (2019), Amazon.com has a range of almost 120 million products as of April 2019. Figure
2.3 below shows Amazon.com’s top 10 categories. The measure presented is in millions of products
per category.
Figure 2.3 – Top 10 categories in Amazon as of April 2019. Adapted from ScrapeHero (2019)
Amazon.com is also present in many different countries, such as United States, Brazil, Spain, the U.K.
and many others. In order to grow and overcome the logistic challenges presented, the company relied
12
on technology and innovation. For example, as mentioned by Yu, Wang, Zhong & Huang (2016), the
company employed different levels of automation depending on the size and shape of a product. For
easily transported products, highly automated processes could be implemented, while irregularly
shaped products required a lower level of automation (Yu, Wang, Zhong & Huang, 2016).
When it comes to transportation of orders, Amazon relied on injection points which were strategically
placed in districts where there was a high concentration of customers. When a purchase is made, the
order first integrates in the distribution centers (DC) where it is prepared and then is shipped to one
of these transportation hubs (Yu, Wang, Zhong & Huang, 2016).
Another challenge faced by businesses concerns storage and inventory levels. Instead of keeping high
inventory levels, Amazon integrated the inventories in their DCs with the inventories available in their
partners’ warehouses (Chiles & Dau, 2005). This means that the accessibility to its partners’ inventories
allowed the company to keep lower inventory levels. Instead of keeping the products in its own DCs,
it may ship an order directly from the partner’s warehouse. The location for these DCs was defined
taking into consideration both the level of taxes and the distance from the districts with high
concentration of customers (Yu, Wang, Zhong & Huang, 2016).
2.3. BUSINESS INTELLIGENCE IN SUPPLY CHAIN MANAGEMENT
As stated by Liu (2010), in today’s highly competitive market, adopting SCM became a form of
obtaining advantage. The author states that competition is no longer between enterprises, but
between supply chains. Great competitive advantage can then be achieved by guaranteeing effective
integration and cooperation within the supply chain. A higher level of integration requires effective
information flow and analysis, which can only be obtained through the implementation of the
appropriate practices and technologies (Liu, 2010).
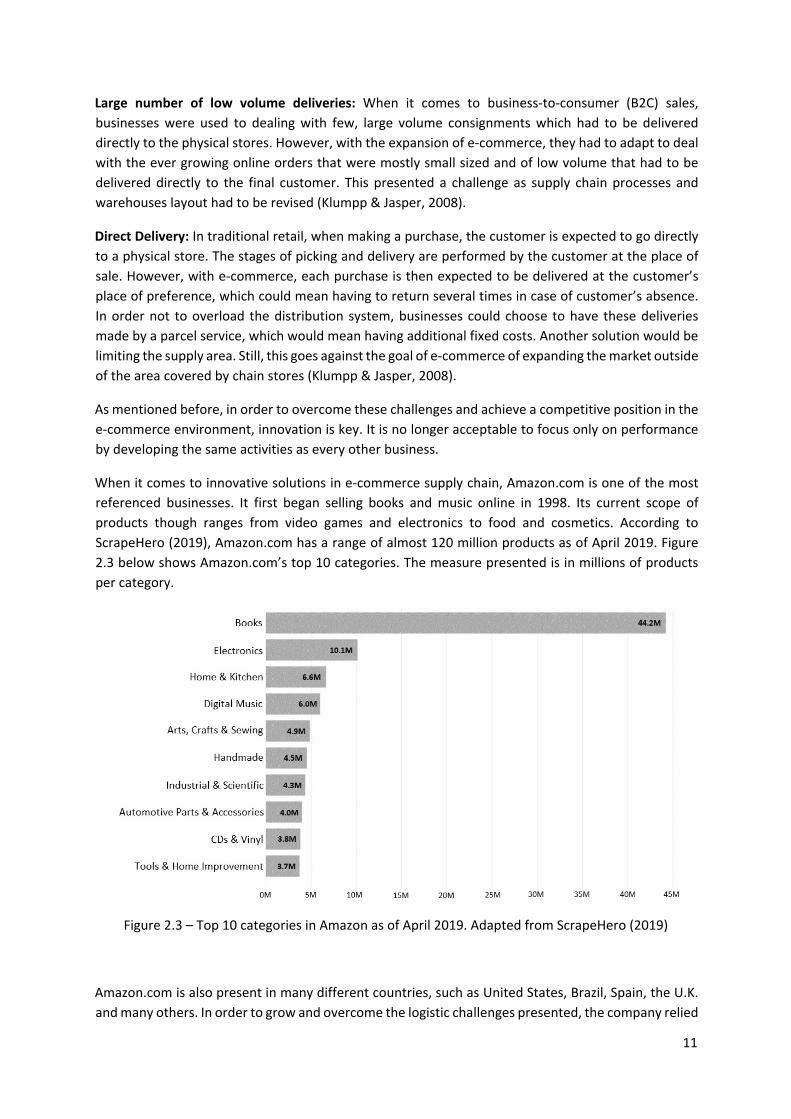
Waller & Fawcett (2013) note that every day more and more data is recorded and it presents both
opportunities and challenges in SCM. The growing volume of data resulted in data sets so big that it is
no longer practical to use conventional data management tools. In Table 2.1 below, the authors
present examples of potential applications of big data in logistics.
Table 2.1 – Examples of potential applications of big data in logistics. Adapted from Waller & Fawcett
13
(2013)
Considering the potential in big data, analytics and with the proper set of tools and techniques, it is
possible to produce breakthrough insights that may lead to risk and cost reduction while providing
higher service levels and operational agility (Deloitte & MHI, 2016).
According to Ittmann (2015), one of the greatest trends observed among companies in the past years
is the awareness of the necessity for decision‐making processes to be more data‐driven. The author
also presents the events that combined contributed for the expansion of supply chain analytics:
growing supply chain data, cheaper data storage, faster and ever‐increasing processing power,
anywhere and anytime connectivity since mobile data is available almost anywhere, better tools that
made analysis simpler and advanced tools and techniques for data visualization.
As stated by Langlois & Chauvel (2017), a great volume of data is produced within the supply chain and
it has to be processed. The greater the volume, the greater the competition. The expectations for faster
deliveries and decision making are high. In this context, BI provides the means for businesses to achieve
success and manage their supply chain more efficiently (Langlois & Chauvel, 2017).
As it was already mentioned in the “Introduction”, the Gartner Group (n. d.) defines analytics and
business intelligence (ABI) as “an umbrella term that includes the applications, infrastructure and tools,
and best practices that enable access to and analysis of information to improve and optimize decisions
and performance”.
The framework for developing a Business Intelligence system may be represented through the
following stages: identification of all the different data sources and mapping of the data according to
the business needs, ETL (extraction, transformation and load) of the previously identified data into a
data warehouse and data marts, development of reports, cubes, use of data mining methodologies
and optimization (Vercellis, 2009).
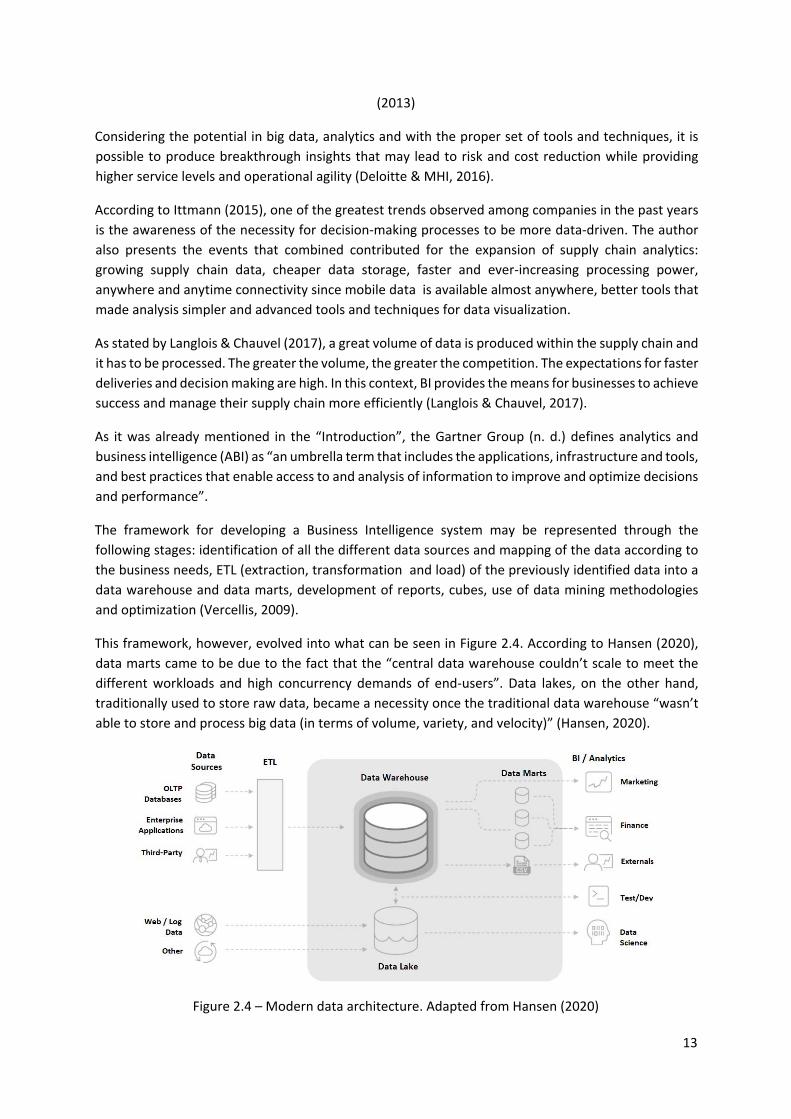
This framework, however, evolved into what can be seen in Figure 2.4. According to Hansen (2020),
data marts came to be due to the fact that the “central data warehouse couldn’t scale to meet the
different workloads and high concurrency demands of end‐users”. Data lakes, on the other hand,
traditionally used to store raw data, became a necessity once the traditional data warehouse “wasn’t
able to store and process big data (in terms of volume, variety, and velocity)” (Hansen, 2020).
Figure 2.4 – Modern data architecture. Adapted from Hansen (2020)
14
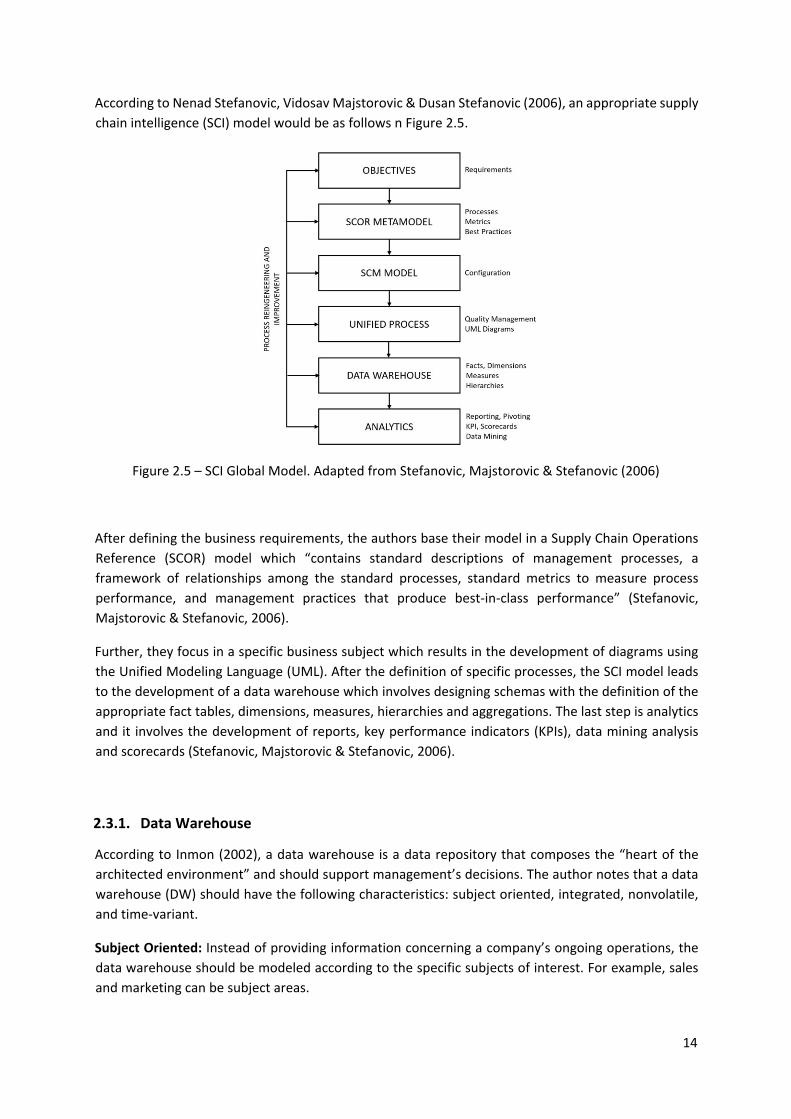
According to Nenad Stefanovic, Vidosav Majstorovic & Dusan Stefanovic (2006), an appropriate supply
chain intelligence (SCI) model would be as follows n Figure 2.5.
Figure 2.5 – SCI Global Model. Adapted from Stefanovic, Majstorovic & Stefanovic (2006)
After defining the business requirements, the authors base their model in a Supply Chain Operations
Reference (SCOR) model which “contains standard descriptions of management processes, a
framework of relationships among the standard processes, standard metrics to measure process
performance, and management practices that produce best‐in‐class performance” (Stefanovic,
Majstorovic & Stefanovic, 2006).
Further, they focus in a specific business subject which results in the development of diagrams using
the Unified Modeling Language (UML). After the definition of specific processes, the SCI model leads
to the development of a data warehouse which involves designing schemas with the definition of the
appropriate fact tables, dimensions, measures, hierarchies and aggregations. The last step is analytics
and it involves the development of reports, key performance indicators (KPIs), data mining analysis
and scorecards (Stefanovic, Majstorovic & Stefanovic, 2006).
2.3.1. Data Warehouse
According to Inmon (2002), a data warehouse is a data repository that composes the “heart of the
architected environment” and should support management’s decisions. The author notes that a data
warehouse (DW) should have the following characteristics: subject oriented, integrated, nonvolatile,
and time‐variant.
Subject Oriented: Instead of providing information concerning a company’s ongoing operations, the
data warehouse should be modeled according to the specific subjects of interest. For example, sales
and marketing can be subject areas.
15
Integrated: As stated by Inmon (2002), this is the most important aspect of a data warehouse. As the
data is extracted from various data sources, transformed and loaded, it should keep its consistency.
Formatting and naming conventions should be universally accepted within the company. This means
that, once the data is loaded within the data warehouse, there should be a “single physical corporate
image”.
Nonvolatile: By this, the author means that unlike in the operational environment, data within the
data warehouse is not updated or erased. When data undergoes any changes, the record is kept and
a new snapshot record is written (Inmon, 2002). This helps further historical data analysis and
understanding.
Time‐Variant: In the data warehouse, data is always associated with a certain moment in time. Every
record is accurate at some point in time. Some even contain a time stamp (Inmon, 2002).
Kimball & Ross (2011) propose a four‐step process for designing a data warehouse model. The steps
are the following: 1) Select the business processes, 2) Define the granularity (level of detail associated
with fact table measurements), 3) Identify the dimensions (provide description for the measurements),
4) Identify the facts.
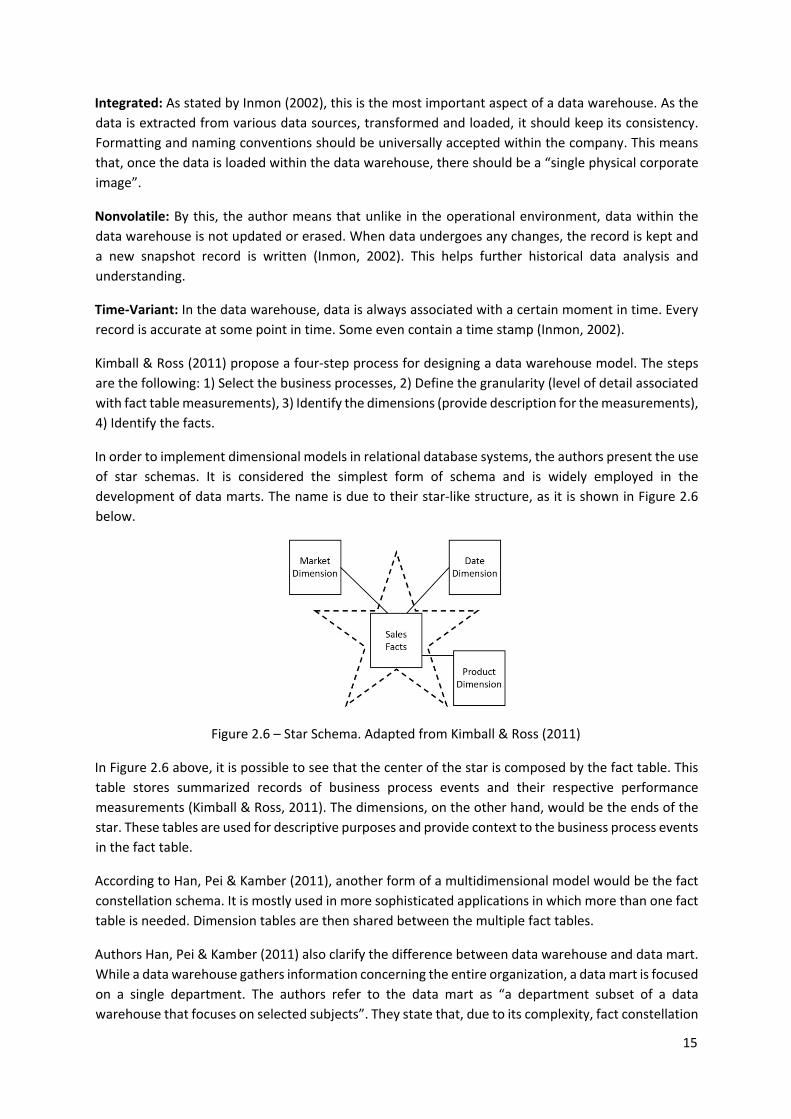
In order to implement dimensional models in relational database systems, the authors present the use
of star schemas. It is considered the simplest form of schema and is widely employed in the
development of data marts. The name is due to their star‐like structure, as it is shown in Figure 2.6
below.
Figure 2.6 – Star Schema. Adapted from Kimball & Ross (2011)
In Figure 2.6 above, it is possible to see that the center of the star is composed by the fact table. This
table stores summarized records of business process events and their respective performance
measurements (Kimball & Ross, 2011). The dimensions, on the other hand, would be the ends of the
star. These tables are used for descriptive purposes and provide context to the business process events
in the fact table.
According to Han, Pei & Kamber (2011), another form of a multidimensional model would be the fact
constellation schema. It is mostly used in more sophisticated applications in which more than one fact
table is needed. Dimension tables are then shared between the multiple fact tables.
Authors Han, Pei & Kamber (2011) also clarify the difference between data warehouse and data mart.
While a data warehouse gathers information concerning the entire organization, a data mart is focused
on a single department. The authors refer to the data mart as “a department subset of a data
warehouse that focuses on selected subjects”. They state that, due to its complexity, fact constellation
16
schemas are more commonly used in, but not restricted to, data warehouses. Then, for a data mart, a
star schema would be more common (Han, Pei & Kamber, 2011).
2.3.2. Information Visualization and Dashboard Design
As stated by Ware (2013), “we acquire more information through vision than through all of the other
senses combined”.
Nowadays, the term “visualization” is strongly related to graphical representations of data or concepts
and is an important part of the decision‐making process within companies.
According to Ware (2013), visualization brings a series of advantages, being these the following:
The capability of making sense of large volumes of data;
The ability to identify patterns and obtain insights that otherwise were not evident;
The improvement in data quality control; visualization provides a better perception when it
comes to how the data was collected and if there are any problems with it;
Visualization also contributes to the formation of hypothesis.
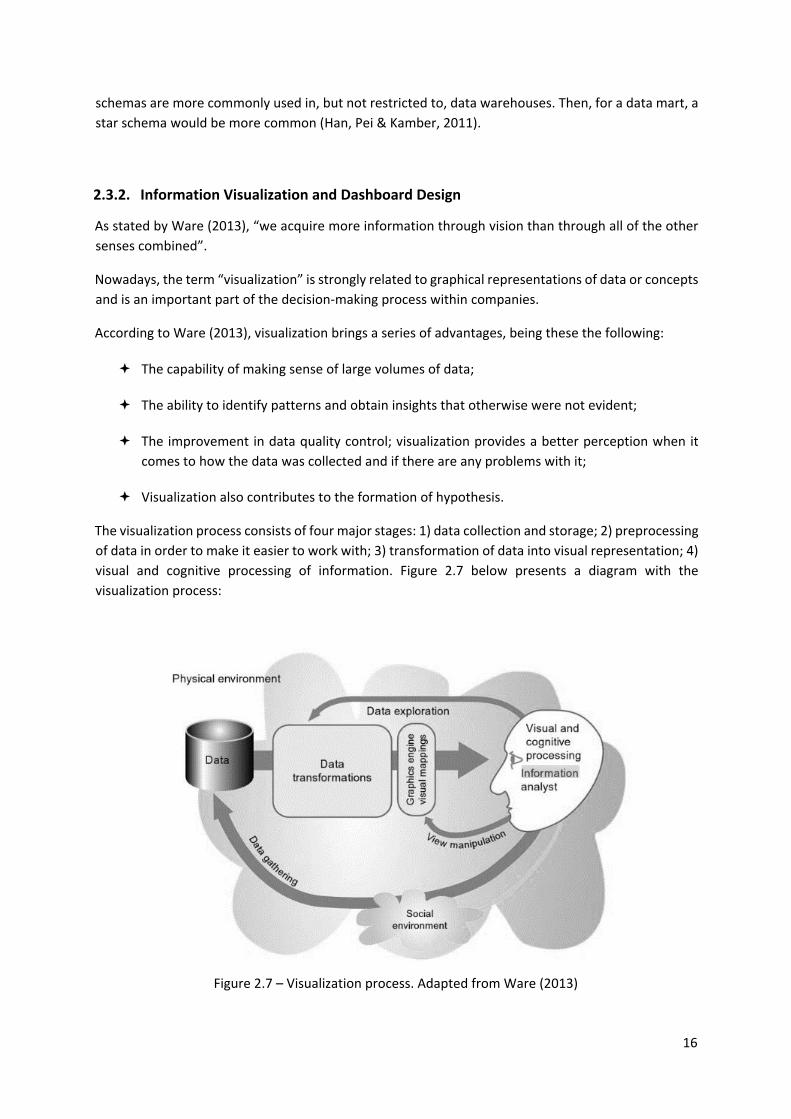
The visualization process consists of four major stages: 1) data collection and storage; 2) preprocessing
of data in order to make it easier to work with; 3) transformation of data into visual representation; 4)
visual and cognitive processing of information. Figure 2.7 below presents a diagram with the
visualization process:
Figure 2.7 – Visualization process. Adapted from Ware (2013)

17
According to Hubbard (2014), measurements are important because of three main reasons: 1) they
support decision making processes; 2) some measurements present their own market value and can
be sold to interested parties (an example would be the results of consumer surveys); 3) measurements
can have an entertaining purpose, so as to satisfy user curiosity or bring clarification.
When it comes to decision making, reason 1 presented above, Hubbard (2014) states that
“management needs a method to analyze options for reducing uncertainty about decisions”.
Given the need for proper measurements and data visualization, dashboards became extremely
popular. Bakusevych (2018) defines a dashboard as “an at a glance preview of the most crucial
information for the user at the moment he is looking at it, and an easy way to navigate directly to
various areas of the application that requires users’ attention”.
In order to design an ideal dashboard, Janes, Sillitti & Succi (2013) propose a technique consisting of two
main steps: 1) selecting the proper data to extract and 2) choosing the proper data visualization
technique.
1. Choosing the proper data: The authors propose a Goal – Question – Measurement (GQM) model.
A model diagram is provided in Figure 2.8 below.
Figure 2.8 – GQM model. Adapted from Janes, Sillitti & Succi (2013)
a) Goal: The “goal” part (conceptual level) is consisted of defining the purpose of the study, which
gives a notion of reason, environment, points of view and what aspects to consider to deliver
the final result;
b) Question: The “question” part (operational level) considers which aspects, processes and their
properties are relevant, taking into consideration the “goal” and what is necessary to achieve
it;
c) Measure: The “measure” part (quantitative level) takes into consideration the questions
provided in the previous level and define which would be the proper data to collect to answer
them.
2. Choosing proper visualization: According to the authors, in order for the user to obtain specific
information from a dashboard, the following considerations should be taken into account:
18
a) Visualizing the dashboard should be effortless. For example, it can be displayed in monitors
positioned in strategic places inside the company;
b) Interactions with the dashboard should be avoided, meaning the visualization should be
enough for the user to understand the data. Interactions should only be used when the user
wants to investigate further;
c) Visualizing and understanding the dashboard should be a fast and easy process, which implies
that changes in the design should be avoided (always display the same information in the same
place);
d) Use techniques to draw the attention of the user to the most important information, but not
overdo it;
e) Make the design and the visuals appealing to the users in order to draw their attention to the
dashboard and capture their interest.
Bakusevych (2018) also provides guidelines for designing a dashboard. Similarly, from the first
presented model, the first step would be defining the purpose of the dashboard. For example,
dashboards can be categorized as: analytical, strategic, operational and tactical. In the present project,
the purpose is to design operational dashboards which deal with time‐sensitive tasks. By providing
information in a quick and effective way, the users are able to visualize deviations and take immediate
action. Still, when it comes to an overall analysis of the E2E process, analytical, strategic and tactical
level information may be present in the design of the dashboard.
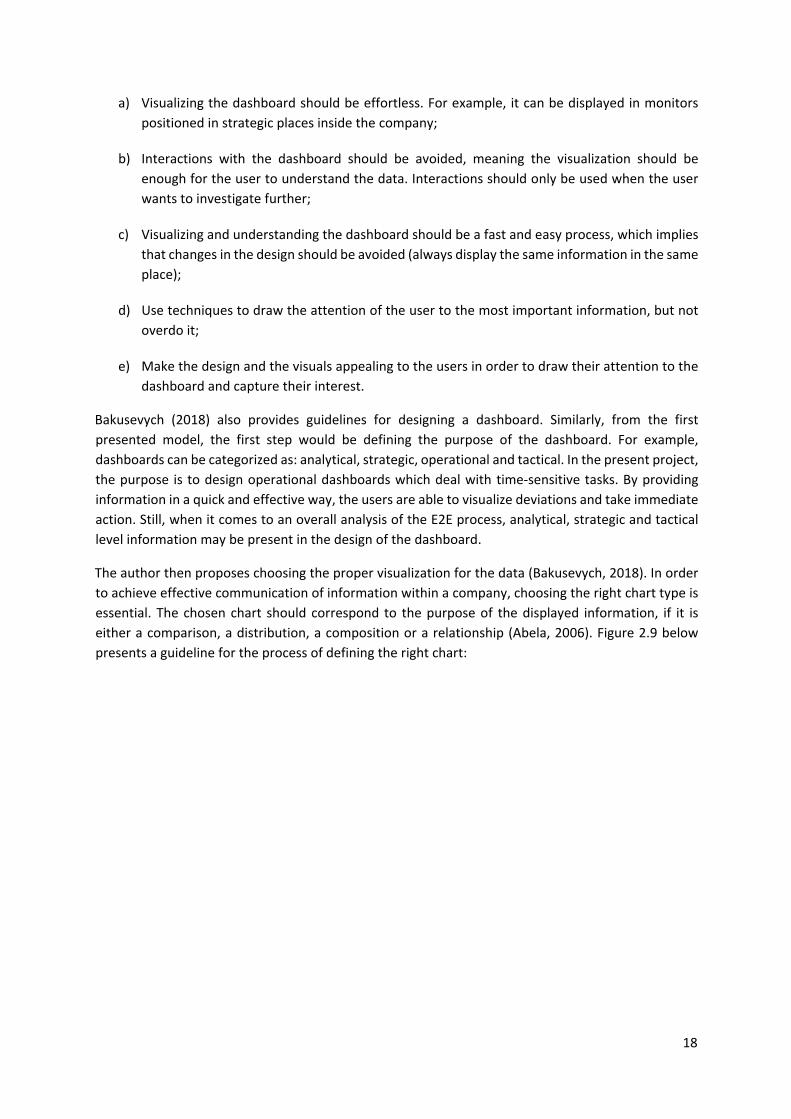
The author then proposes choosing the proper visualization for the data (Bakusevych, 2018). In order
to achieve effective communication of information within a company, choosing the right chart type is
essential. The chosen chart should correspond to the purpose of the displayed information, if it is
either a comparison, a distribution, a composition or a relationship (Abela, 2006). Figure 2.9 below
presents a guideline for the process of defining the right chart:
19
Figure 2.9 – A guideline for choosing the proper chart. Adapted from Abela (2006)
In the next step, the author gives a reminder to stick to naming conventions and to provide effective
formatting. Large values should be truncated and dates should be clear. Dashboards are supposed to
deliver the right information, at the right time, in a clear and effortless way (Bakusevych, 2018).
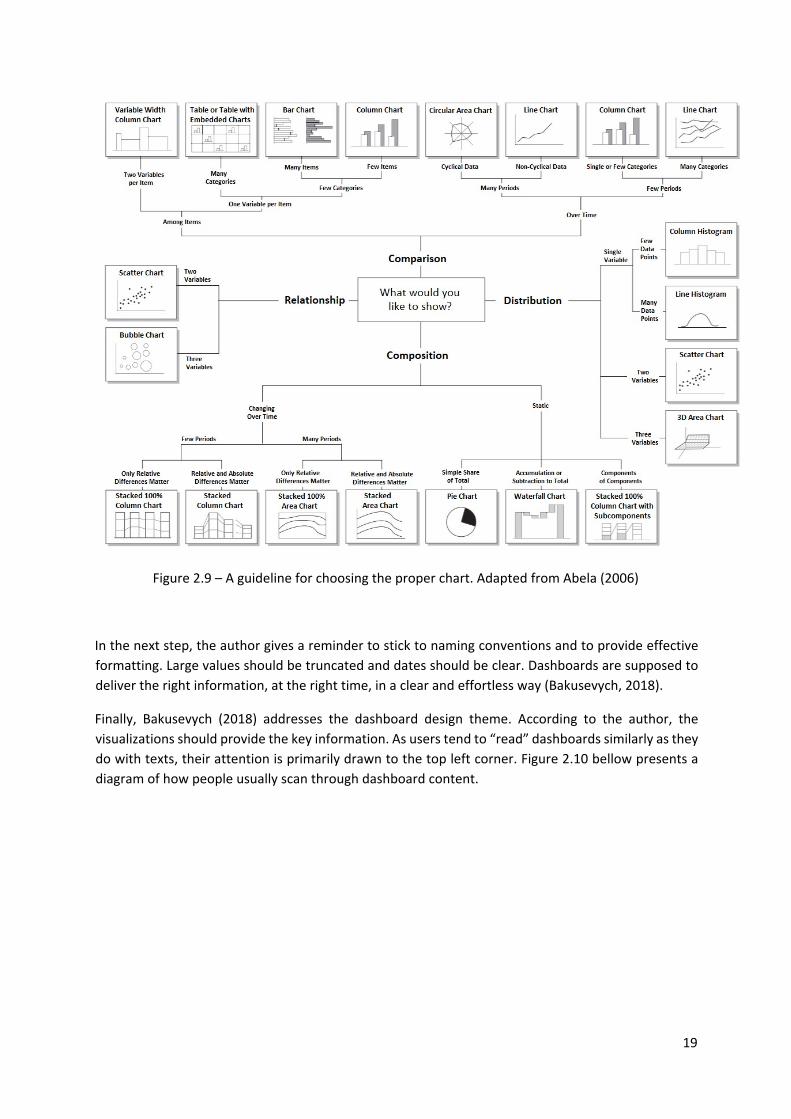
Finally, Bakusevych (2018) addresses the dashboard design theme. According to the author, the
visualizations should provide the key information. As users tend to “read” dashboards similarly as they
do with texts, their attention is primarily drawn to the top left corner. Figure 2.10 bellow presents a
diagram of how people usually scan through dashboard content.
20
Figure 2.10 – Reading gravity. Adapted from Reporting Impulse (2019)
While important information should have large representations and should appear in areas users are
more likely to draw their attention to, less important information should be handled with an opposite
approach (Few, 2007). Also, there should be a continuous flow in the dashboard. Related information
should be displayed together in order to avoid going back and forth (Bakusevych, 2018).
21
3. CONCEPTUAL MODEL PROPOSAL
The present chapter consists of the “Design and Development” step proposed in the DSR methodology.
As mentioned in the “Main Goal and Specific Objectives” section, this conceptual model must be
designed to not only answer to Company X´s needs, but to present a solution to similar problems
outside of the company. Still, one of the main motivations for this project is focused on Company X´s
supply chain E2E operation. That being said, comprehending the company´s existing process flows is
crucial.
So, initially, this chapter presents a “Context” section consisted of the process flows and the
identification of the target users.
Following, in the “Overall Requirements” section, the needs observed for Company X are extrapolated.
Only the key requirements are listed so as to make this conceptual model adaptable to other
companies with similar needs.
Then, in “Measures and Metrics”, as the title says, the proper measures and metrics are chosen.
In the next three sections, a proposal for the system architecture, data mart conceptual model and
dashboards conceptual models is made.
3.1. CONTEXT
As it was previously discussed in the literature review, Nenad Stefanovic, Vidosav Majstorovic & Dusan
Stefanovic (2006) proposed a SCI model composed of six main steps. According to the authors, after
defining the objectives and requirements, a SCOR model must be made. Since a complete SCOR model
for the supply chain is not part of the scope of this project and is not viable, only the main process
flows needed to provide a solution will be discussed. Then, in the following sections, proper metrics
and KPIs will be defined.
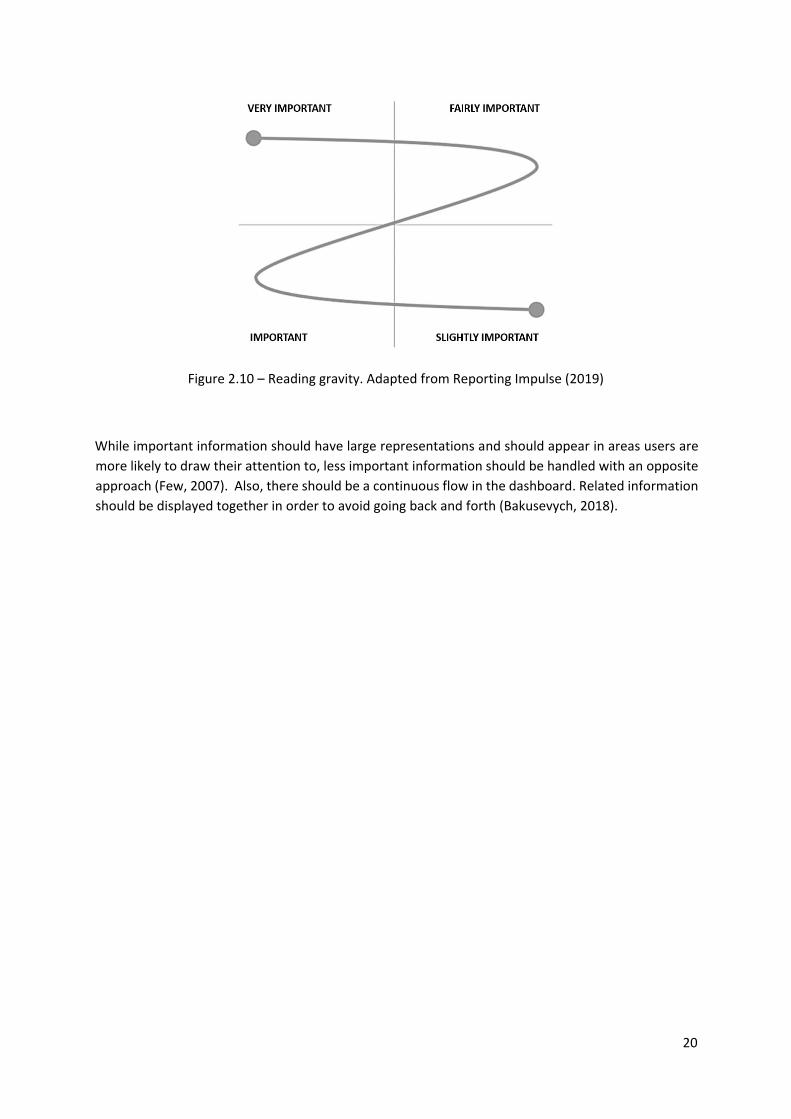
For Company X, the supply chain E2E operation can be divided into three main groups: Systems,
Operation and Transportation. Before explaining the responsibilities for each of these groups, an
overall view of the online sales process will be given. Figure 3.1 below presents a diagram of the
process.
Figure 3.1 – Overall Online Sales Process
22
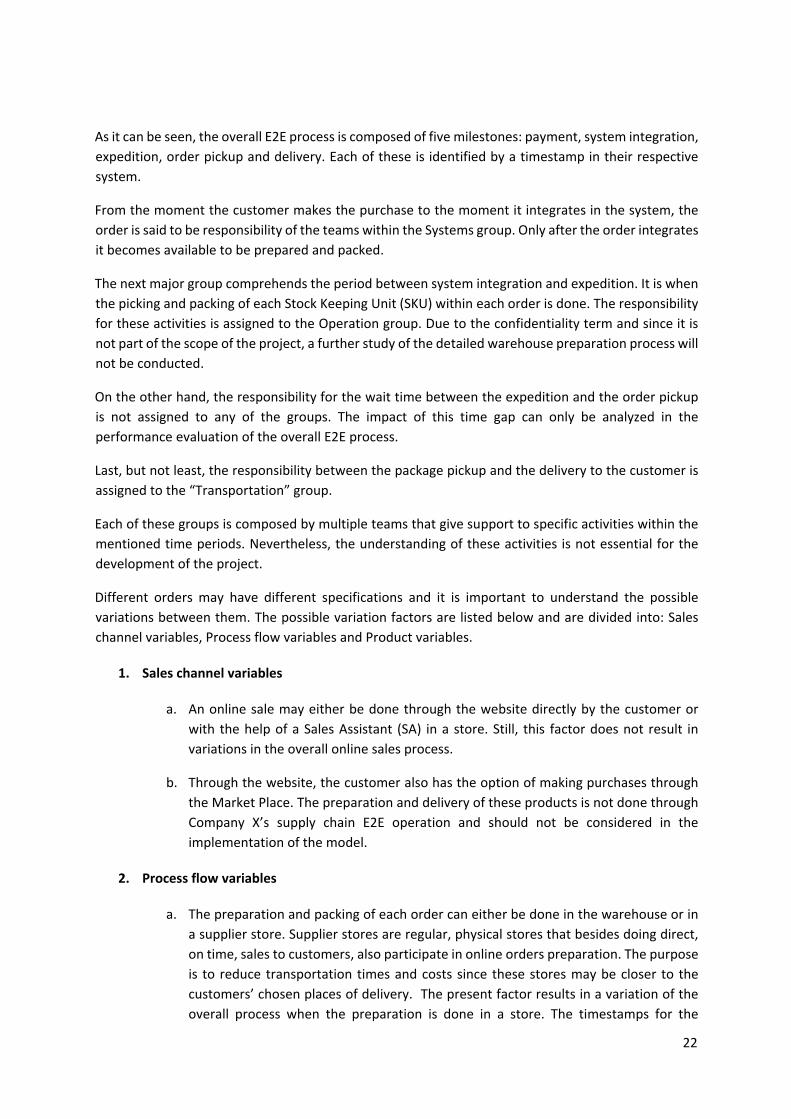
As it can be seen, the overall E2E process is composed of five milestones: payment, system integration,
expedition, order pickup and delivery. Each of these is identified by a timestamp in their respective
system.
From the moment the customer makes the purchase to the moment it integrates in the system, the
order is said to be responsibility of the teams within the Systems group. Only after the order integrates
it becomes available to be prepared and packed.
The next major group comprehends the period between system integration and expedition. It is when
the picking and packing of each Stock Keeping Unit (SKU) within each order is done. The responsibility
for these activities is assigned to the Operation group. Due to the confidentiality term and since it is
not part of the scope of the project, a further study of the detailed warehouse preparation process will
not be conducted.
On the other hand, the responsibility for the wait time between the expedition and the order pickup
is not assigned to any of the groups. The impact of this time gap can only be analyzed in the
performance evaluation of the overall E2E process.
Last, but not least, the responsibility between the package pickup and the delivery to the customer is
assigned to the “Transportation” group.
Each of these groups is composed by multiple teams that give support to specific activities within the
mentioned time periods. Nevertheless, the understanding of these activities is not essential for the
development of the project.
Different orders may have different specifications and it is important to understand the possible
variations between them. The possible variation factors are listed below and are divided into: Sales
channel variables, Process flow variables and Product variables.
1. Sales channel variables
a. An online sale may either be done through the website directly by the customer or
with the help of a Sales Assistant (SA) in a store. Still, this factor does not result in
variations in the overall online sales process.
b. Through the website, the customer also has the option of making purchases through
the Market Place. The preparation and delivery of these products is not done through
Company X’s supply chain E2E operation and should not be considered in the
implementation of the model.
2. Process flow variables
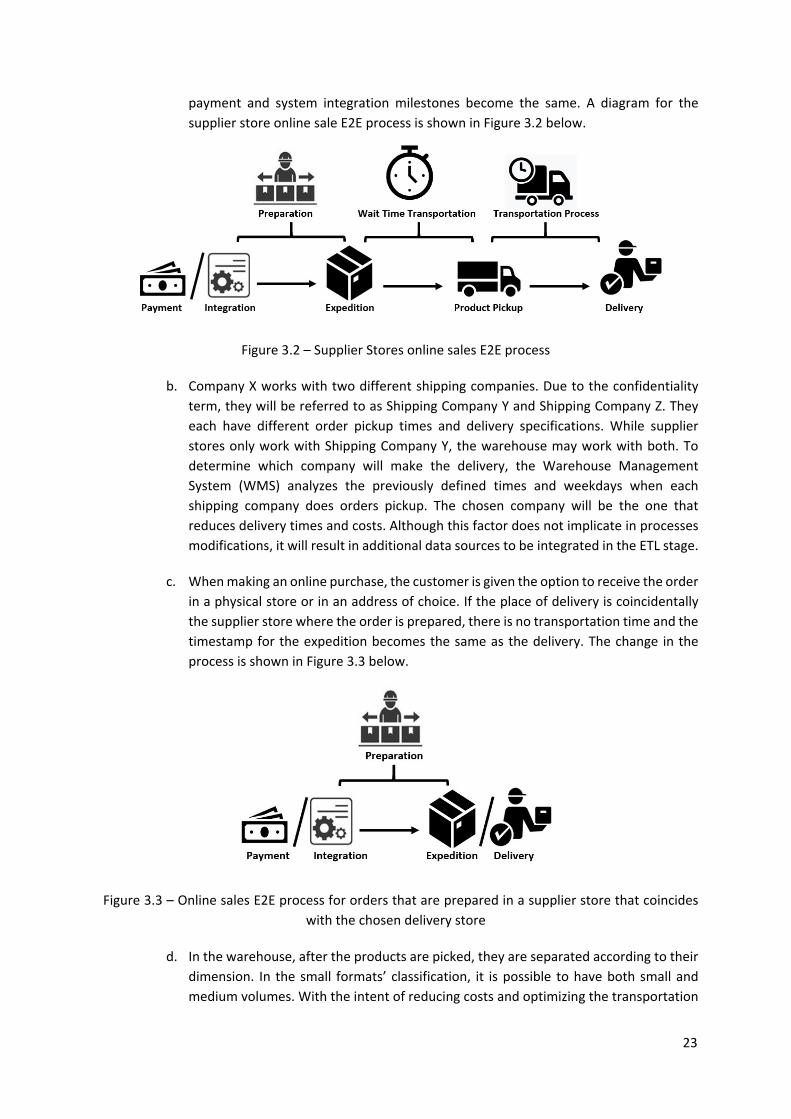
a. The preparation and packing of each order can either be done in the warehouse or in
a supplier store. Supplier stores are regular, physical stores that besides doing direct,
on time, sales to customers, also participate in online orders preparation. The purpose
is to reduce transportation times and costs since these stores may be closer to the
customers’ chosen places of delivery. The present factor results in a variation of the
overall process when the preparation is done in a store. The timestamps for the
23
payment and system integration milestones become the same. A diagram for the
supplier store online sale E2E process is shown in Figure 3.2 below.
Figure 3.2 – Supplier Stores online sales E2E process
b. Company X works with two different shipping companies. Due to the confidentiality
term, they will be referred to as Shipping Company Y and Shipping Company Z. They
each have different order pickup times and delivery specifications. While supplier
stores only work with Shipping Company Y, the warehouse may work with both. To
determine which company will make the delivery, the Warehouse Management
System (WMS) analyzes the previously defined times and weekdays when each
shipping company does orders pickup. The chosen company will be the one that
reduces delivery times and costs. Although this factor does not implicate in processes
modifications, it will result in additional data sources to be integrated in the ETL stage.
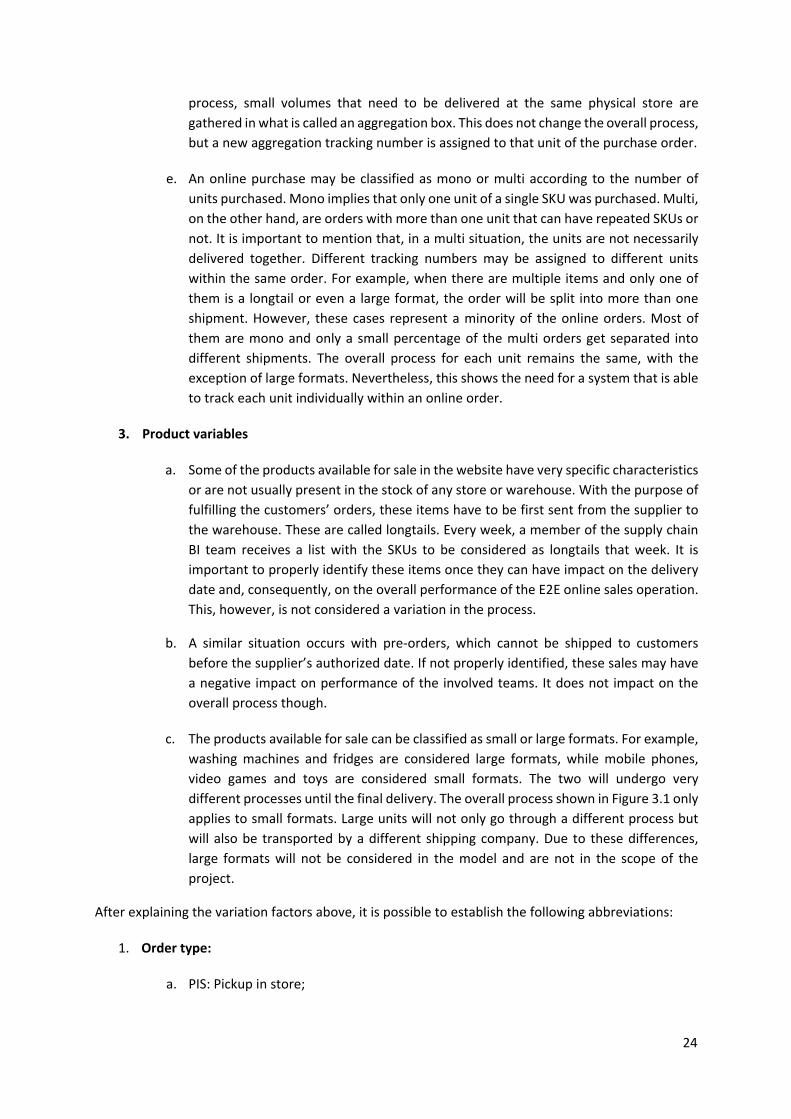
c. When making an online purchase, the customer is given the option to receive the order
in a physical store or in an address of choice. If the place of delivery is coincidentally
the supplier store where the order is prepared, there is no transportation time and the
timestamp for the expedition becomes the same as the delivery. The change in the
process is shown in Figure 3.3 below.
Figure 3.3 – Online sales E2E process for orders that are prepared in a supplier store that coincides
with the chosen delivery store
d. In the warehouse, after the products are picked, they are separated according to their
dimension. In the small formats’ classification, it is possible to have both small and
medium volumes. With the intent of reducing costs and optimizing the transportation
24
process, small volumes that need to be delivered at the same physical store are
gathered in what is called an aggregation box. This does not change the overall process,
but a new aggregation tracking number is assigned to that unit of the purchase order.
e. An online purchase may be classified as mono or multi according to the number of
units purchased. Mono implies that only one unit of a single SKU was purchased. Multi,
on the other hand, are orders with more than one unit that can have repeated SKUs or
not. It is important to mention that, in a multi situation, the units are not necessarily
delivered together. Different tracking numbers may be assigned to different units
within the same order. For example, when there are multiple items and only one of
them is a longtail or even a large format, the order will be split into more than one
shipment. However, these cases represent a minority of the online orders. Most of
them are mono and only a small percentage of the multi orders get separated into
different shipments. The overall process for each unit remains the same, with the
exception of large formats. Nevertheless, this shows the need for a system that is able
to track each unit individually within an online order.
3. Product variables
a. Some of the products available for sale in the website have very specific characteristics
or are not usually present in the stock of any store or warehouse. With the purpose of
fulfilling the customers’ orders, these items have to be first sent from the supplier to
the warehouse. These are called longtails. Every week, a member of the supply chain
BI team receives a list with the SKUs to be considered as longtails that week. It is
important to properly identify these items once they can have impact on the delivery
date and, consequently, on the overall performance of the E2E online sales operation.
This, however, is not considered a variation in the process.
b. A similar situation occurs with pre‐orders, which cannot be shipped to customers
before the supplier’s authorized date. If not properly identified, these sales may have
a negative impact on performance of the involved teams. It does not impact on the
overall process though.
c. The products available for sale can be classified as small or large formats. For example,
washing machines and fridges are considered large formats, while mobile phones,
video games and toys are considered small formats. The two will undergo very
different processes until the final delivery. The overall process shown in Figure 3.1 only
applies to small formats. Large units will not only go through a different process but
will also be transported by a different shipping company. Due to these differences,
large formats will not be considered in the model and are not in the scope of the
project.
After explaining the variation factors above, it is possible to establish the following abbreviations:
1. Order type:
a. PIS: Pickup in store;
25
b. HD: Home delivery (can only be done through Shipping Company Y);
2. Process flow type:
a. SS‐PIS: order prepared in a supplier store but delivered in another physical store;
b. SS‐Y‐HD: preparation is done in a supplier store, transportation is done through
Shipping Company Y and delivery is done at the customer’s chosen address;
c. SS‐SS: the supplier store is both the preparation and pickup site;
d. WH‐Y‐HD: preparation is done in the warehouse, transportation is done through
Shipping Company Y and delivery is done at the customer’s chosen address;
e. WH‐Y‐PIS: preparation is done in the warehouse, transportation is done through
Shipping Company Y and delivery is done at a physical store;
f. WH‐Z‐PIS: preparation is done in the warehouse, transportation is done through
Shipping Company Z and delivery is done at a physical store.
Finally, it is important to discuss the established delivery time intervals and expectations that allow for
the supply chain operation to assess its performance.
For the overall E2E process, Company X has the commitment of delivering the orders in the next
business day after being purchased. Considering their cutoff time at 7 PM, every purchase made before
that time should be delivered in the next business day. Purchases made after 7 PM are considered to
be made on the following day.
Also, each one of the mentioned groups (Systems, Operation and Transportation) have their own time
interval goals to achieve. When it comes to Systems, it is expected for the time gap between payment
and integration to stay under 20 minutes.
The Operation group, on the other hand, has its cutoff time ate 7 PM. The teams are expected to
complete the product preparation on the same day, meaning that every purchase that integrates in
the system before 7 PM is expected to have the expedition on the same day. Exceptions exist on
weekends and holidays.
For the Transportation group, a commitment date is defined according to the next business day rule.
Their performance is then assessed through the comparison of the commitment date with the actual
delivery date.
3.2. OVERALL REQUIREMENTS
After discussing Company X’s online sales supply chain E2E operation, it is possible to define the basic
requirements for the development of the conceptual model. Once again, it is important to mention
that the purpose of the model is to provide a solution that can be adapted to solve similar problems
outside of Company X.
26
The present project should provide a model that can be adapted to companies that are either
“clickand‐mortar” or “pure‐play”. The specifics within each company’s E2E process are not relevant for
the development of the conceptual model and should not be considered in the basic requirements.
To make this model adaptable, it is important to look at the overall process and its five milestones:
payment, integration, expedition, order pickup and delivery. No matter how different the companies
are from one another, it is highly probable that their online purchase orders undergo these basic
milestones. So, it is still possible to think of the process as being consisted of three major groups:
Systems, Operation and Transportation.
Systems will deal with how the orders become available for preparation from the moment they are
created and payed to the moment the Operation obtains clearance to start picking and packing. It is
crucial that, at this stage, all the relevant information about the customers preferences is correctly
attached to the order object that will be passed on to the Operation. There are obvious items, such as
SKUs, and delivery address. But there are also examples of more sophisticated options, such as
wrapping, engraving or messages in cards. All of these must be available as soon as the preparation
request arrives at the Operation, so that the process can be optimized.
Operation, on the other hand, deals with the preparation process. There are major differences
between companies when it comes to their preparation strategy. Amazon, for example, operates with
a highly automated warehouse, while others have an operation that combines both human labor and
automation. However, these specifics should not have any impact on the model, which focuses on the
macro process rather than in each specificity of the process, either conducted by a machine, a person
or both.
Finally, “Transportation” deals with the delivery of the purchase order. Its responsibility is to manage
the available transportation means so that the customers receive their orders on time and at their
place of choice. Nowadays, companies adopt many different transportation solutions, ranging from
traditional truck deliveries, to autonomous delivery devices, such as Amazon’s Scout (Amazon, n. d.).
Urban areas are more prone to technological advances, whereas rural areas often have less availability
and more traditional solutions.
It is important to mention that each company will have its own specificities. Orders may be cancelled,
out of stock, delivered to the wrong address or even undergo processing and payment problems. These
cannot be defined in the conceptual model stage, but may appear as a status field for their respective
process group.
Below, are listed the basic requirements for the development of the conceptual model:
The conceptual model should provide the possibility to track each purchase order from the
moment it was created to the moment of delivery;
Each milestone should have a corresponding timestamp;
Considering that purchase orders can have one or multiple units, they may or may not be
transported in the same shipment. So, it is important that the data is presented on a unit level,
meaning that each record should correspond to a single unit of a purchase order;
27
The purpose of the model is to support different teams within the supply chain that are
responsible for the fulfillment of online sales. Consequently, metrics and KPIs should be
defined according to the target users of each dashboard;
In order to deal with time‐sensitive tasks and to support important campaigns (such as Black
Friday), users on an operational level should have access to updated information on an hourly
basis. This constitutes Operational BI;
Users should also be able to visualize the orders on an extended period of time (days to weeks
or months) and their distribution between the milestones. It allows teams to be informed of
any backlog that needs to be taken care of, conduct short term analysis and reach strategic
goals. This constitutes Tactical BI;
It is of interest of supply chain executives to be able to compare metrics and KPIs over extended
periods of time (months to years). It helps them reach long term organizational objectives).
This constitutes Strategic BI;
KPIs need to allow for each group (Systems, Operation and Transportation) to assess their
individual performances. This should be done in both tactical and operational level;
The assessment of the performance of the overall E2E process is also needed. Since the supply
chain directors and analysts would be the main target users, strategic and tactic level
information should be the focus;
To support “Systems”, “Operation” and “Transportation” teams, most of their indicators
should provide operational level information. They should be quick and effective, so that users
are able to visualize deviations and take immediate action.
3.3. MEASURES AND METRICS
Since measures and metrics should be aligned with the company’s strategy, it is not appropriate to
base their definition solely on Company X’s experience. Still, when it comes to key metrics to support
the online sales E2E process, it may help with possible insights.
That being said, this section will be developed based on the compilation of what is found in the
literature and adapted to fit the previously defined requirements. Company X’s previous experience
may help shape the final result.
In order to achieve the objectives proposed on this project, the defined measures and metrics should
focus on order information. Also, they should be specific to each group (Systems, Operation and
Transportation) and reflect the information needs of their target users.
So, the first step is to establish the theme for each dashboard and the users they need to reach. Further
understanding of the dashboards will be given in the final topic of the chapter. Below, Table 3.1
presents the themes for the dashboards, the expected level of information and the respective target
users.
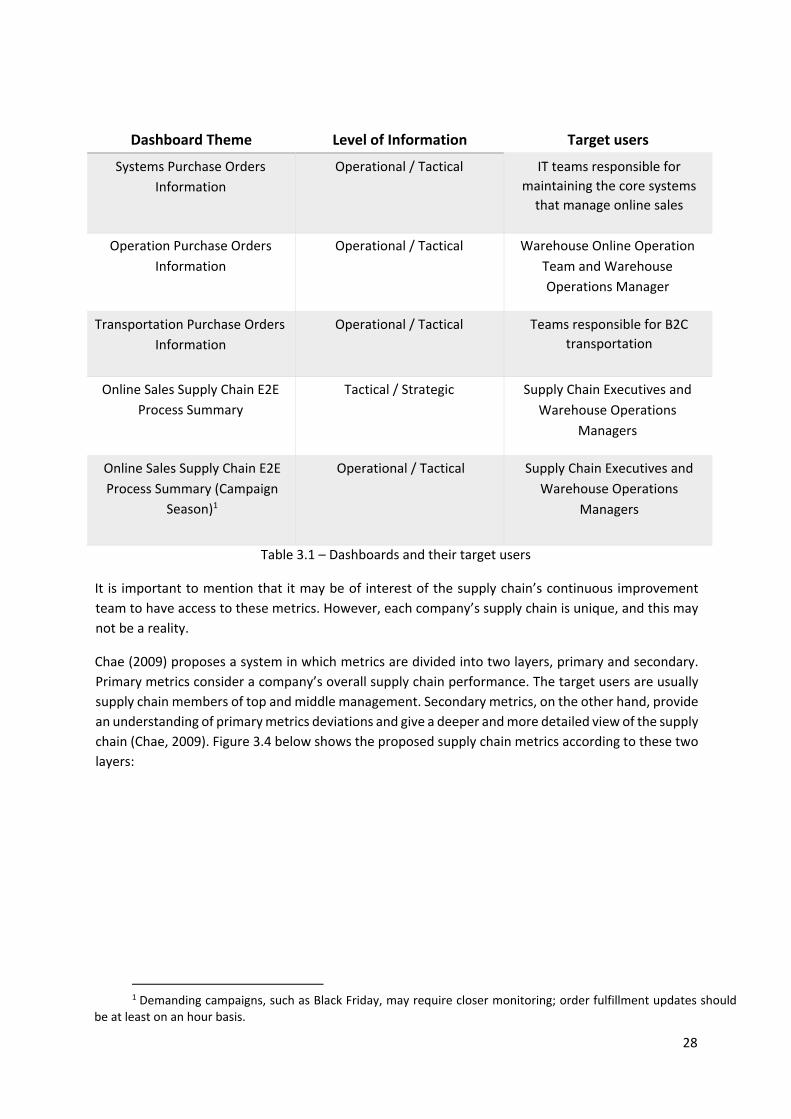
28
Dashboard Theme Level of Information Target users
Systems Purchase Orders
Information
Operational / Tactical IT teams responsible for
maintaining the core systems
that manage online sales
Operation Purchase Orders
Information
Operational / Tactical Warehouse Online Operation
Team and Warehouse
Operations Manager
Transportation Purchase Orders
Information
Operational / Tactical Teams responsible for B2C
transportation
Online Sales Supply Chain E2E
Process Summary
Tactical / Strategic Supply Chain Executives and
Warehouse Operations
Managers
Online Sales Supply Chain E2E
Process Summary (Campaign
Season)1
Operational / Tactical Supply Chain Executives and
Warehouse Operations
Managers
Table 3.1 – Dashboards and their target users
It is important to mention that it may be of interest of the supply chain’s continuous improvement
team to have access to these metrics. However, each company’s supply chain is unique, and this may
not be a reality.
Chae (2009) proposes a system in which metrics are divided into two layers, primary and secondary.
Primary metrics consider a company’s overall supply chain performance. The target users are usually
supply chain members of top and middle management. Secondary metrics, on the other hand, provide
an understanding of primary metrics deviations and give a deeper and more detailed view of the supply
chain (Chae, 2009). Figure 3.4 below shows the proposed supply chain metrics according to these two
layers:
1 Demanding campaigns, such as Black Friday, may require closer monitoring; order fulfillment updates should
be at least on an hour basis.
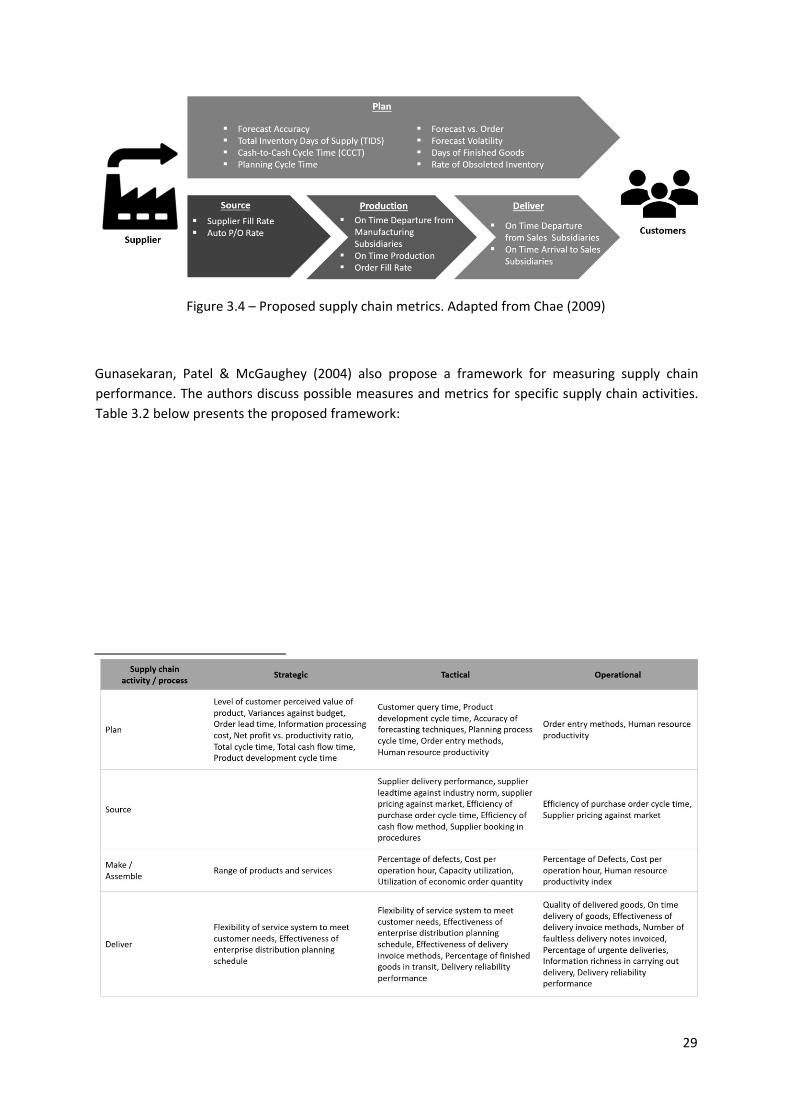
29
Figure 3.4 – Proposed supply chain metrics. Adapted from Chae (2009)
Gunasekaran, Patel & McGaughey (2004) also propose a framework for measuring supply chain
performance. The authors discuss possible measures and metrics for specific supply chain activities.
Table 3.2 below presents the proposed framework:
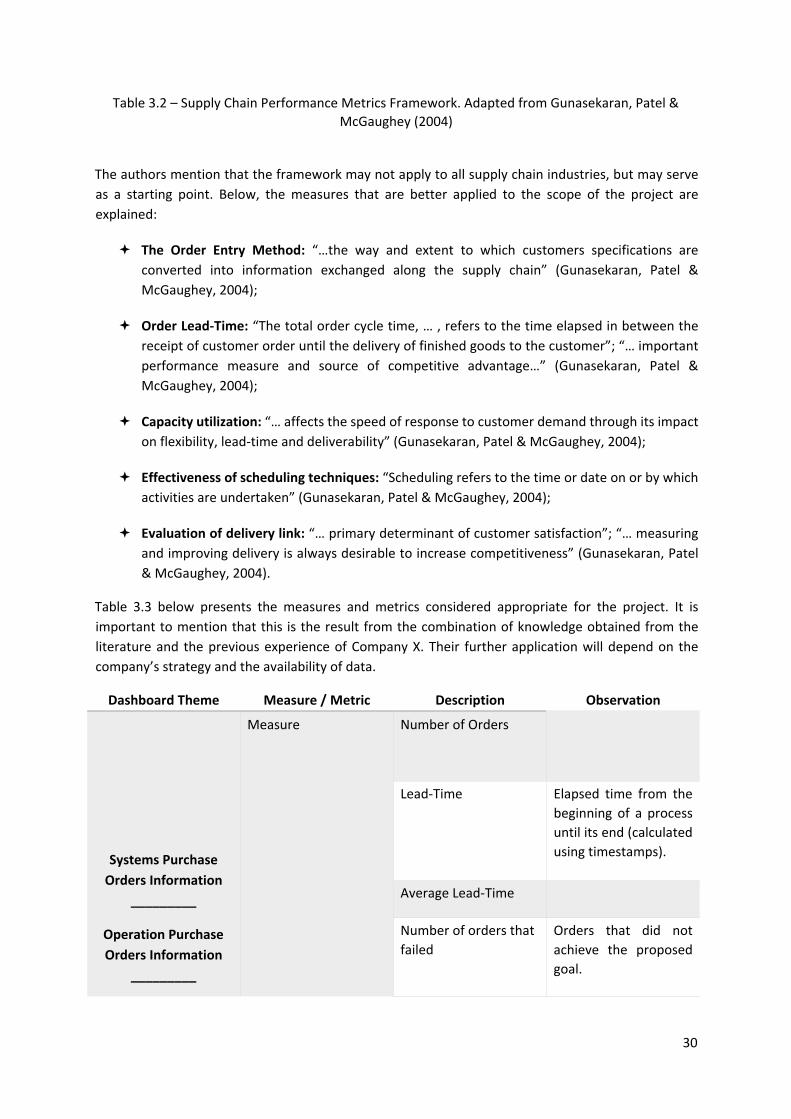
30
Table 3.2 – Supply Chain Performance Metrics Framework. Adapted from Gunasekaran, Patel &
McGaughey (2004)
The authors mention that the framework may not apply to all supply chain industries, but may serve
as a starting point. Below, the measures that are better applied to the scope of the project are
explained:
The Order Entry Method: “…the way and extent to which customers specifications are
converted into information exchanged along the supply chain” (Gunasekaran, Patel &
McGaughey, 2004);
Order Lead‐Time: “The total order cycle time, … , refers to the time elapsed in between the
receipt of customer order until the delivery of finished goods to the customer”; “… important
performance measure and source of competitive advantage…” (Gunasekaran, Patel &
McGaughey, 2004);
Capacity utilization: “… affects the speed of response to customer demand through its impact
on flexibility, lead‐time and deliverability” (Gunasekaran, Patel & McGaughey, 2004);
Effectiveness of scheduling techniques: “Scheduling refers to the time or date on or by which
activities are undertaken” (Gunasekaran, Patel & McGaughey, 2004);
Evaluation of delivery link: “… primary determinant of customer satisfaction”; “… measuring
and improving delivery is always desirable to increase competitiveness” (Gunasekaran, Patel
& McGaughey, 2004).
Table 3.3 below presents the measures and metrics considered appropriate for the project. It is
important to mention that this is the result from the combination of knowledge obtained from the
literature and the previous experience of Company X. Their further application will depend on the
company’s strategy and the availability of data.
Dashboard Theme Measure / Metric Description Observation
Systems Purchase
Orders Information
_________
Operation Purchase
Orders Information
_________
Measure Number of Orders
Lead‐Time Elapsed time from the
beginning of a process
until its end (calculated
using timestamps).
Average Lead‐Time
Number of orders that
failed
Orders that did not
achieve the proposed
goal.

31
Transportation
Purchase Orders
Information
_________
Online Sales Supply
Chain E2E Process
Summary
_________
Online Sales Supply
Chain E2E Process
Summary (Campaign
Season)
Number of successful
orders
Orders that did achieve
the proposed goal.
Metric Rate of success Ratio between the
number of successful
orders and the total
number of orders.
Range of errors Distribution of orders
between all the
registered process
errors that are
identified by a current
or by a past status.
Number of orders per
worked hour
Orders completed
divided by the total
number of worked
hours (consider
number of employees).
Online Sales Supply
Chain E2E Process
Summary
Measure Average Cost of
Process
Should be per
purchase order
Metric Range of Products and
Services
Distribution of orders
between
product
categories.
Cost per worked hour Appropriate when
talking about the
preparation process.
Table 3.3 – Measures and metrics defined for the project
When a measure or metric is based on orders, it may refer to the number of purchased orders, total
number of units ordered (volume) or number of shipments (packages shipped). It depends on the
process it needs to describe.
When referring to the preparation process (Operation), it is better to work with volume, since purchase
orders may be split into different shipments. On the other hand, Transportation is mostly concerned
about the number of shipments. They should be able to track each unit in the delivery process, but
their performance should be based on the number of shipments. When it comes to Systems, this
matter does not have a big influence. Although their teams need to make sure every unit is accounted
for, measuring their performance by purchase order is more appropriate.

32
Finally, the overall E2E process should base its performance on the “smallest” element inside a
purchase order (that cannot be separated). So, dealing with volume would be appropriate.
3.4. DATA MART CONCEPTUAL MODEL
After defining the prerequisites for the BI system and listing the appropriate measures and metrics for
that purpose, the next step should be designing the data mart.
It is important to mention that the chosen denomination “data mart” is due to the fact that this
multidimensional model focuses solely on the supply chain online sales operation and does not
consider operations company wide.
Just as was mentioned in the previous section, a data mart model must be aligned with the companys
needs and strategy. So, for a conceptual model that answers to companies other than Company X, it
is only possible to define the core dimensions and fact tables. Also, most table fields are specific to the
business and only the main ones will be presented in the model.
Therefore, the data mart model proposed in this section is not a complete version. It contains the core
dimensions, fact tables, fields and granularity necessary to solve the problem proposed in this project.
The chosen methodology to design the data mart was the one presented by Kimball & Ross (2011) and
is composed by four main steps: 1) Select the business process; 2) Define the granularity; 3) Identify
the dimensions; 4) Identify the facts. The schema chosen was the fact constellation schema in which
there are multiple fact tables that share dimensions between them.
3.4.1. Select the business process
The data mart model should be focused on the online sales supply chain E2E operation of a “clickand‐
mortar” or “pure‐play” company.
As it was already presented in the “Overall Requirements” section, for this conceptual model to be
adaptable, it is important to consider the overall process of an online sale and not the specific
processes within each company. The five milestones of the process are: payment, integration,
expedition, order pickup and delivery.
It is important to mention that one of the main requirements listed was that the model should provide
the possibility to track each purchase from the moment it was created to the moment of delivery.
3.4.2. Define the granularity
By the word granularity, Kimball & Ross (2011) meant the level of detail associated with fact table
measurements.
33
When dealing with online sales, it is common to think of an online purchase order as being the smallest
grain and, consequently, use it to define the granularity of a fact table. However, online purchase
orders may contain multiple units and items2.
For the first milestone, payment, having a mono or a multi purchase order does not make a difference.
All the units will be payed at the same time. Nevertheless, they may become available for preparation
at different times and may not be delivered in the same shipment. Consequently, the remaining
milestones’ timestamps (integration, expedition, order pickup and delivery) are bound to be different
between each unit within a purchase order. So, to deal with the overall E2E process, the appropriate
would be to present the data at a unit level.
The same applies when the process is divided into: Systems, Preparation and Transportation. The
teams responsible for Systems need to make sure that every unit within each order integrates in the
appropriate system at the right time. Preparation, on the other hand, needs to secure the picking and
packing of each unit made available for preparation (that integrated) in the system. Finally,
Transportation needs to keep track of every shipment and to guarantee that every unit within them
gets delivered at the right time and place to the customer.
Each unit of a purchase order is associated with specific timestamps that are related to a time
dimension through their date part. It is also associated to a specific SKU (represents the product) and
to a specific postal code (represents the delivery address). For an entire purchase order there would
be a single flow type defined and, for a shipment, a single shipping company.
So, the granularity would be defined as online sale, per product, per day, per address, per flow, per
shipping company, per unit within the purchase order. The grain would be one row per online sale
process. Different fact tables may not present all these listed attributes, but will all be developed on a
unit level.
3.4.3. Identify the dimensions
From the previously defined granularity, it is possible to infer which will be the core dimensions. Still,
it is important to mention that each company has its peculiarities and strategies, which may result in
less or additional dimensions.
The hierarchies presented for some of the following dimensions (not all dimensions have a hierarchy)
are also bound to change when adapted to other companies. For example, different companies may
present different product hierarchies.
A final consideration concerns the management and storage of both historical and current data. Some
dimensions’ records, in specific fields, may change overtime. For example, a product name that was
mistakenly registered needs to be corrected. In order for that to be a possibility, the dimension should
2 An item is equivalent to a SKU while unit represents each article within a purchase order (multiple units may
be of different or of the same SKU).
34
be configured as a slowly changing dimension (SCD) and the appropriate changing fields assigned.
These SCDs can be of three different types: Type 1, Type 2 and Type 3.
a. Type 1 SCD: The new data overwrites the existing data, which results in the loss of what
was previously stored;
b. Type 2 SCD: A new record is created to store the new data; additional fields may be used
to track inactive and active records; this type of SCD provides the possibility to keep
historical information;
c. Type 3 SCD: The use of two different columns allows for the original and the current data
to be registered in the same record; however, if the record changes more than once,
historical information is lost.
Even though it may result in the increase of the size of the table, Type 2 SCD was considered the most
appropriate for the purpose of the model.
Below are presented the proposed dimensions for the data mart model. The suggested structures are
presented in tables 9.1 through 9.7 in the Appendix section. The tables present both the fields and
their descriptions.
Time Dimension: This dimension was named DimDate and presents the dates between a
determined period of time. Its hierarchy is composed by six levels: date, week, month, quarter,
semester and year.
Since one of the main purposes of this project is to develop a model that allows users to keep track
of every order, being able to know the date and the time when every milestone is achieved is
essential. However, it is not viable to have a dimension that keeps track of hours and minutes. So,
DimDate will only be related to keys that are defined by the date part of the timestamps. The
timestamps, on the other hand, will be presented in separate fields in the fact tables.
It is also important to mention that, when dealing with an online sale E2E process, holidays,
weekends and changes of season can have a big impact. These may result in peaks of sale or even
in the lack of human resources in the preparation process. Even though these behaviors and trends
and very specific to each business, fields were included in the conceptual model dimension that
describe them.
Product Dimension: This dimension was named DimProduct and presents the entire range of
products that are or were available for sale in the company. Some of these products may not even
share the same online sales overall E2E process and are not going to be represented in any fact
table.
However, in order for this conceptual model to be able to incorporate other processes in the future
and, consequently, other fact tables, it is important not to limit the product dimension. For
example, as it was mentioned in the “Context” section, the model only focuses in Company X’s
online sales of small and medium formats, since large formats undergo a much different process
and cannot be presented in the same fact tables. Still, in the future, it can be of interest to expand
the data mart.
35
Also, the products in the dimension may be active or inactive (available or not for sale). This will be
identified by a specific field, which can be altered overtime. Besides the product status, other fields
in the dimension may go through changes. These are the product supplier name and number, the
standard cost and the list price. For these changes to be a possibility, the dimension should be
configured as a SCD and the appropriate type chosen. Since keeping historical data is of interest,
this SCD was designed as type 2 with two additional datetime fields to track the start and end
moment of the record being active.
It is important to mention that each company will have a different product hierarchy and the one
shown in Table 9.2 in the Appendix is only a reflection of the previous experience with Company
X.
Address Dimension: This dimension was named DimAddress and presents all the locations that
can either be customers’, warehouses’ or stores’ addresses. In order to define which one it is, a
field was be used to identify the type.
Since the same postal code can be shared by different types of addresses, it cannot be used as the
primary key. So, a separate field was created for the postal code.
The hierarchy defined for this dimension can be observed in Table 9.3 in the Appendix, as well as
the other fields.
Flow dimension: This dimension was named DimFlow and presents, in a simplified way, all the
possible flows that a certain unit within a purchase order can go through. These flows are going to
be very specific to each company.
When it comes to Company X, having a clear perception of the flows is essential. Its flows were
explained in the “Context” section of the chapter and reflect the site of preparation, chosen
shipping company and final place of delivery. Once there are many possible combinations of these
three elements, adopting this dimension in the model adds value to the user’s experience.
Since changes in specific processes may occur overtime, the flows presented in this dimension
cannot be said to be static. For example, Company X can decide not to work with a certain shipping
company or even to concentrate the entire preparation process in the warehouse. This would turn
active flows into inactive. Other companies are also subject to changes. So, to configure this
dimension as a SCD was considered the most appropriate. The changing field would be the flow
status.
Shipping Company Dimension: This dimension was named DimShipCompany and presents all the
shipping companies responsible for the pickup and delivery of every ongoing order within the
company. In order not to limit the model so it can be expanded to other processes, it is not
interesting to present only shipping companies involved in the fulfillment of online orders. On the
contrary, and alike DimProduct, the dimension should be as complete as possible.
Also, the dimension was configured as a SCD with its changing fields being the shipping company
status and pickup frequency. The first field shows if the shipping company is active or not, meaning
if its services are still being required. Similarly, if there are ever any revisions in the contract, the
second field may go through changes.
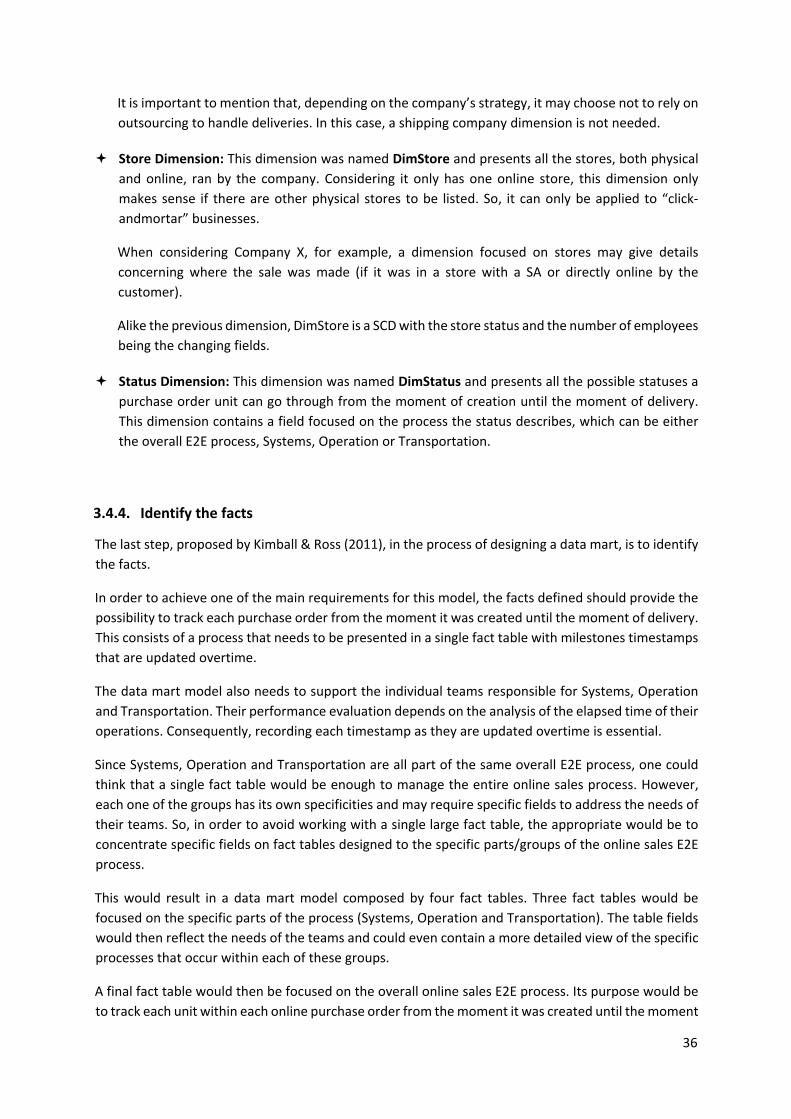
36
It is important to mention that, depending on the company’s strategy, it may choose not to rely on
outsourcing to handle deliveries. In this case, a shipping company dimension is not needed.
Store Dimension: This dimension was named DimStore and presents all the stores, both physical
and online, ran by the company. Considering it only has one online store, this dimension only
makes sense if there are other physical stores to be listed. So, it can only be applied to “click‐
andmortar” businesses.
When considering Company X, for example, a dimension focused on stores may give details
concerning where the sale was made (if it was in a store with a SA or directly online by the
customer).
Alike the previous dimension, DimStore is a SCD with the store status and the number of employees
being the changing fields.
Status Dimension: This dimension was named DimStatus and presents all the possible statuses a
purchase order unit can go through from the moment of creation until the moment of delivery.
This dimension contains a field focused on the process the status describes, which can be either
the overall E2E process, Systems, Operation or Transportation.
3.4.4. Identify the facts
The last step, proposed by Kimball & Ross (2011), in the process of designing a data mart, is to identify
the facts.
In order to achieve one of the main requirements for this model, the facts defined should provide the
possibility to track each purchase order from the moment it was created until the moment of delivery.
This consists of a process that needs to be presented in a single fact table with milestones timestamps
that are updated overtime.
The data mart model also needs to support the individual teams responsible for Systems, Operation
and Transportation. Their performance evaluation depends on the analysis of the elapsed time of their
operations. Consequently, recording each timestamp as they are updated overtime is essential.
Since Systems, Operation and Transportation are all part of the same overall E2E process, one could
think that a single fact table would be enough to manage the entire online sales process. However,
each one of the groups has its own specificities and may require specific fields to address the needs of
their teams. So, in order to avoid working with a single large fact table, the appropriate would be to
concentrate specific fields on fact tables designed to the specific parts/groups of the online sales E2E
process.
This would result in a data mart model composed by four fact tables. Three fact tables would be
focused on the specific parts of the process (Systems, Operation and Transportation). The table fields
would then reflect the needs of the teams and could even contain a more detailed view of the specific
processes that occur within each of these groups.
A final fact table would then be focused on the overall online sales E2E process. Its purpose would be
to track each unit within each online purchase order from the moment it was created until the moment
37
of delivery and assess the overall performance. Most of its fields would be composed of milestones
timestamps. The remaining fields would provide a more detailed view of the overall E2E process, as
well as measures and surrogate keys that are related to the dimensions.
Since we are dealing with processes, in this case the online sales pipeline, the best way to represent it
would be as a time stamped accumulating snapshot fact table. According to Mundy (2012), a standard
accumulating snapshot fact table may be characterized by one row per occurrence of the process and
each of these rows is updated multiple times until the pipeline is somehow completed. The author
presents it as an appropriate solution to track the current state of a particular process, but states that
it is imperfect when it comes to keeping record of intermediate states (such as processes’ statuses)
(Mundy, 2012).
One of the solutions presented by Mundy (2012) involves the combination of two types of fact tables:
an accumulating snapshot with a periodic snapshot. The resulting fact table would be similar to a type
2 dimension with two additional fields: the first one would be a snapshot start date (when the row
became effective) and the second one a snapshot end date (when the row expired). So, every time
something in the pipeline changes, a new row is added with the updated fields. The snapshot start and
end dates of the original and the current records are also updated accordingly (Mundy, 2012).
Another challenge faced in the definition of the fact tables was when dealing with the primary keys. In
most situations, the combination of the dimensions’ surrogate keys would be enough to obtain the
primary key. However, this is not the case for the present model. Since each record of a fact table
represents a single unit of a purchase order, it can be related to its business ID, which should be unique
in all data sources in the company. If no historical data is being kept int the fact table, this business ID
would be enough to achieve a unique primary key for the model.
According to Becker (2003), this would be called a degenerate dimension (DD).The author states that
a DD “acts as a dimension key in the fact table , however does not join to a corresponding dimension
table because all its interesting attributes have already been placed in another analytic dimensions”
(Becker, 2003). He also mentions that these DD are usually “natural keys of the “parents” of the line
items” (Becker, 2003).
Nevertheless, since it is considered appropriate to keep historical data, each fact table gains a new
record every time there is a change in the unit’s pipeline. So, a purchase order unit business ID used
as a DD is no longer acceptable to maintain unique primary keys.
An appropriate way to overcome this would be through the combination of the unit business ID with
the snapshot start date. Another option would be through the creation of a separate field that
combines the unit business ID with the number of times the pipeline of the same purchase order unit
has changed (number of rows created to register the changes).
DDs are also useful when dealing with data quality and integrity, since they allow records to be traced
back to their original operational systems. A fact table may have more than one DD as well. For
example, purchase order number and purchase order unit number may be both DDs in a fact table.
It is important to mention that, since many of the fact table fields associated to dimensions are updated
overtime and may not have initial values, the dimensions must contain default values such as
“unknown” or “n/a”. This happens because a key value in a fact table cannot be null. For example, all

38
dates after the creation of a purchase order do not have initial values. Consequently, for these dates
to relate to a dimension before being updated, a default value is necessary.
Tables 9.8 through 9.11 in the Appendix propose a structure for the data mart’s fact tables. They
present both table fields and their descriptions. Since every company has its own specifications, these
structures should be adapted to fit its own business scenarios and processes.
Below, a simplified version of the diagram of the conceptual data mart model is presented. The
complete version of the diagram is shown on Figure 9.1 of the Appendix. Also, in order to make the
visualization easier, diagrams focusing on single fact tables and their respective dimensions are
presented in the Appendix (Figure 9.2 through Figure 9.5).
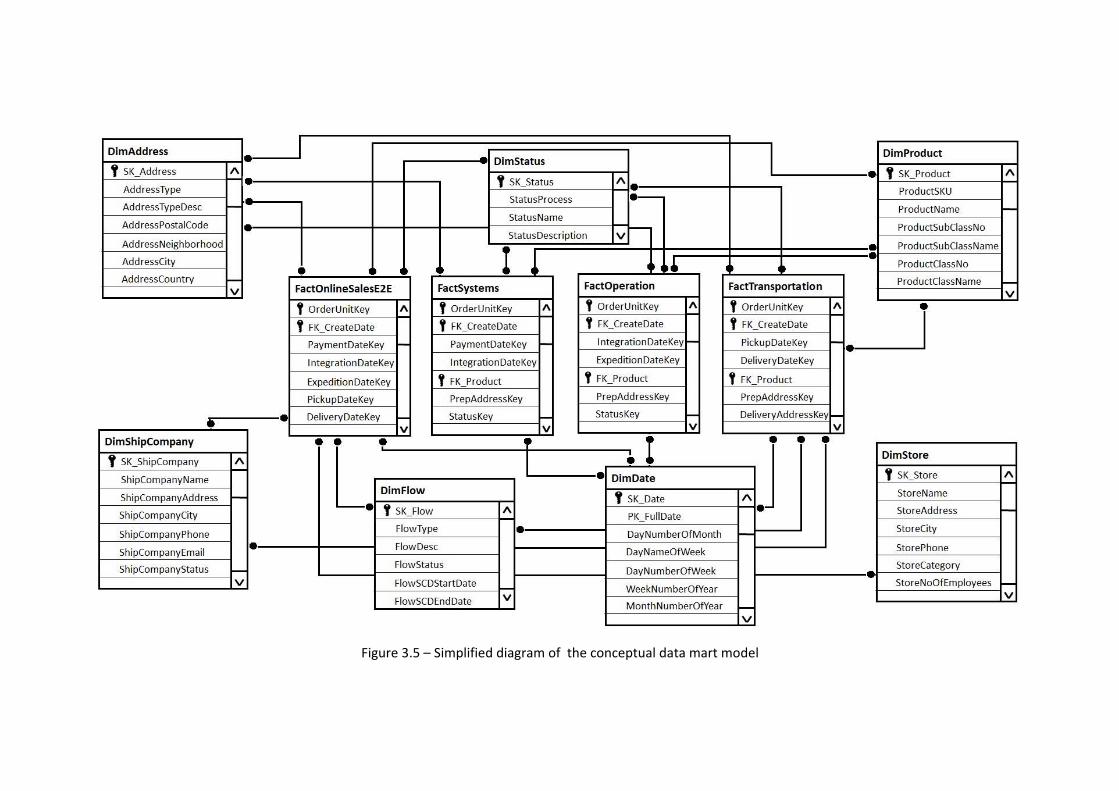
Figure 3.5 – Simplified diagram of the conceptual data mart model

40
41
3.5. DASHBOARD CONCEPTUAL MODEL
Following the proposed goals and objectives of this project, a conceptual model was developed for the
final dashboards.
Like in the previous topics, it is important to note that a BI system should be specific and aligned with
the company’s strategy. So, the conceptual model proposed in this chapter is only a suggestion of a
solution for problems that are similar to Company X’s.
Not only the structure of the dashboards but also the measures, metrics and KPIs presented in them
may vary from one company to the other. Even though a list of appropriate measures and metrics was
presented in topic 3.3, a company may lack the data that is needed to obtain them. Consequently, the
dashboards’ models presented below may be subject to change when considering certain scenarios.
As it was already mentioned in the “Measures and Metrics” topic, five dashboard themes were
proposed with different levels of information. At an operational and tactical level, the themes were:
1) Systems Purchase Orders Information; 2) Operation Purchase Orders Information; 3) Transportation
Purchase Orders Information; 4) Online Sales Supply Chain E2E Process Summary (Campaign Season).
At a tactical and strategic level, the theme was: 1) Online Sales Supply Chain E2E Process Summary.
The dashboard models presented below were designed based on the best practices identified in the
researched literature. They intend to present the information in an efficient, yet coherent, way.
Following the dashboard design technique proposed by Janes, Sillitti & Succi (2013), it is possible to
observe that the first step (select the proper data to extract) was completed in section 3.3. With the
goals previously defined, the right questions were asked and the appropriate measures defined. For
the next step, it was then necessary to choose the proper visualization. The authors’ observations were
taken into account as well as Abela’s (2006) guidelines to choose appropriate charts.
Finally, the distribution of these charts was considered. Combining the theory provided by Bakusevych
(2018) and the reading gravity chart by Reporting Impulse (2019), the optimal visualization areas were
identified. Even though the authors’ guidelines provide a path for the dashboards’ design, each one of
them should be specific to the business needs. So, variations may exist when applied in real life
scenarios.
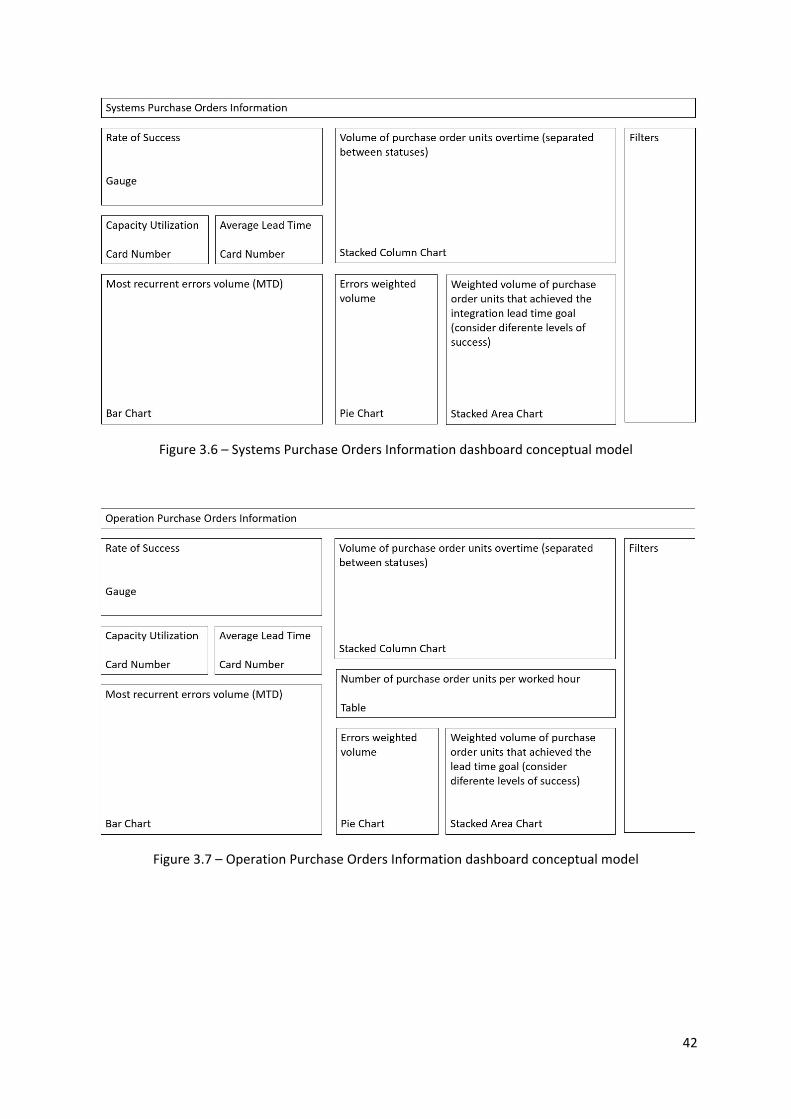
42
Figure 3.6 – Systems Purchase Orders Information dashboard conceptual model
Figure 3.7 – Operation Purchase Orders Information dashboard conceptual model
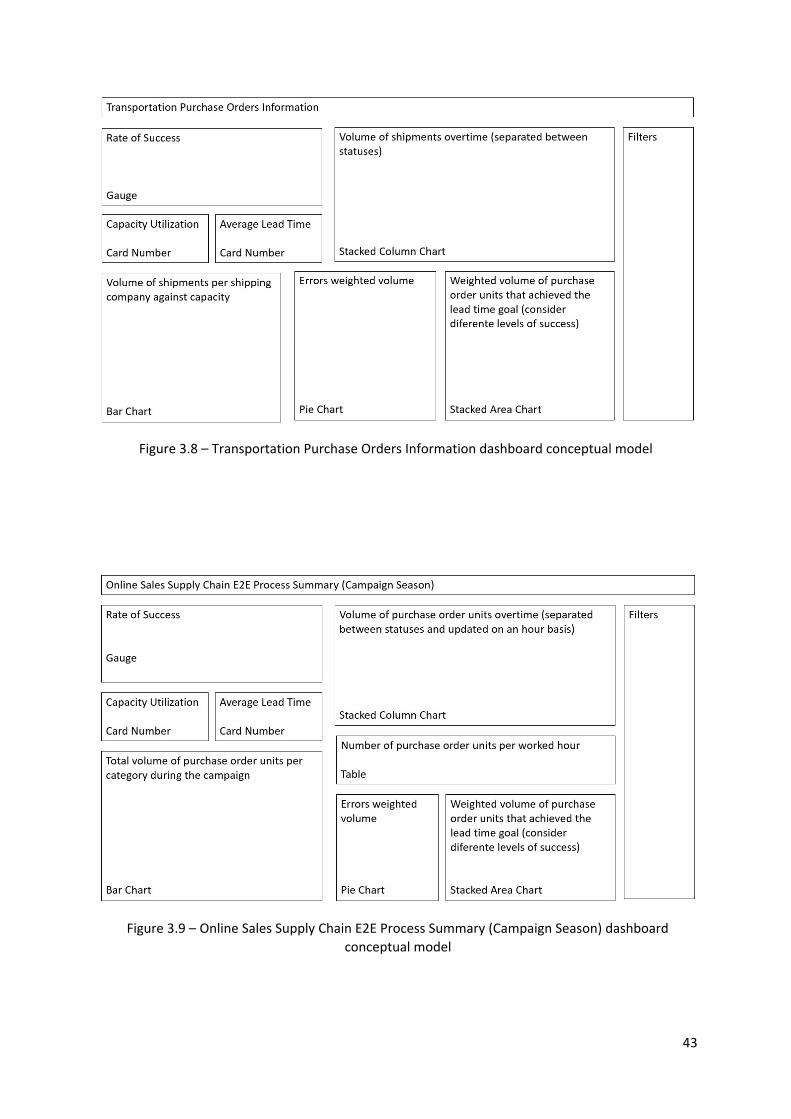
43
Figure 3.8 – Transportation Purchase Orders Information dashboard conceptual model
Figure 3.9 – Online Sales Supply Chain E2E Process Summary (Campaign Season) dashboard
conceptual model
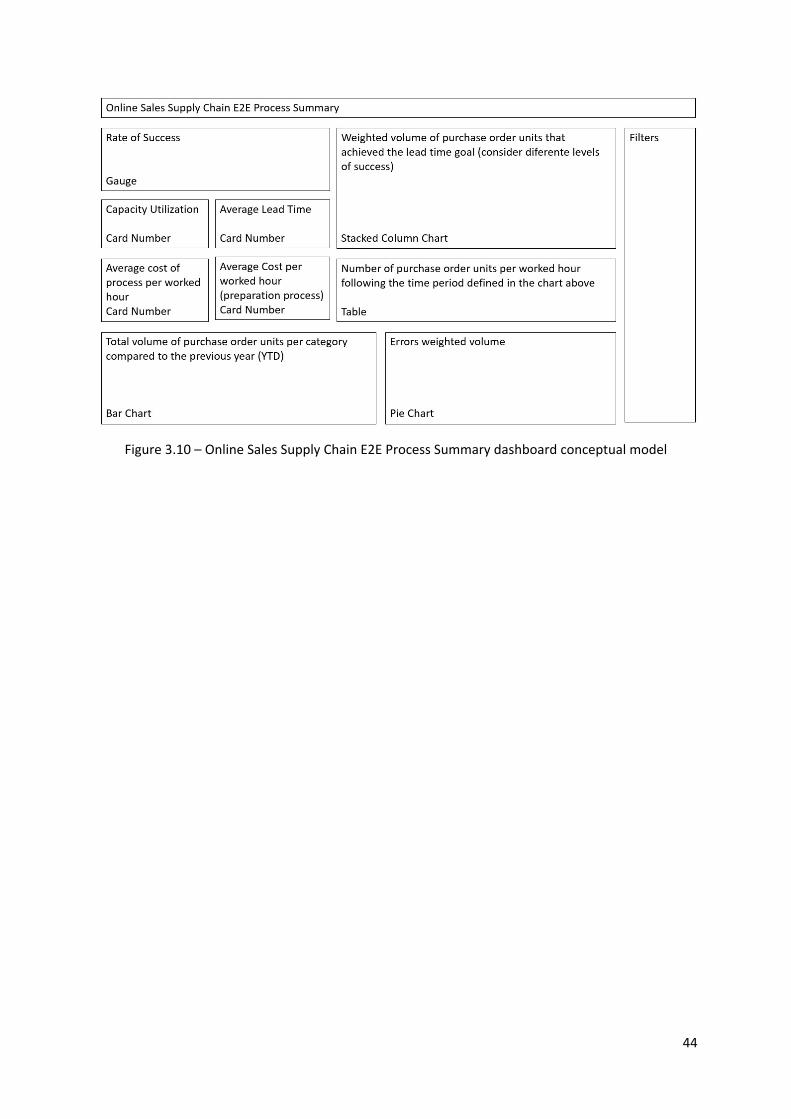
44
Figure 3.10 – Online Sales Supply Chain E2E Process Summary dashboard conceptual model
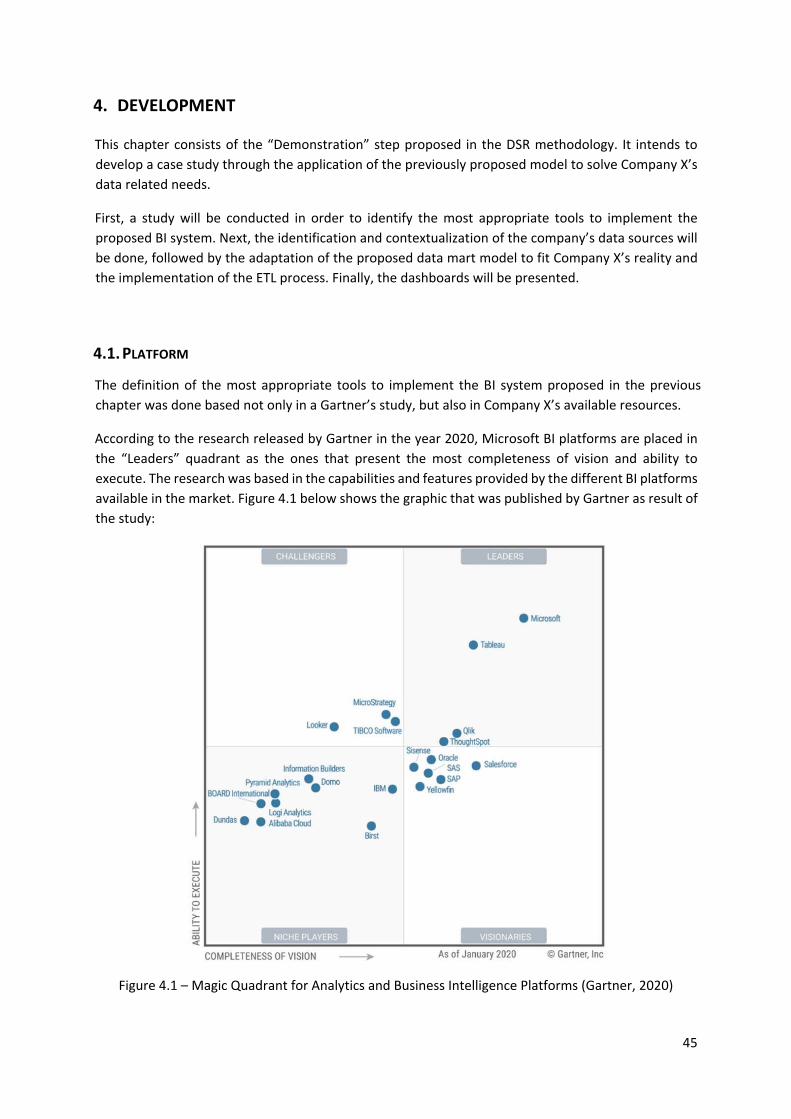
45
4. DEVELOPMENT
This chapter consists of the “Demonstration” step proposed in the DSR methodology. It intends to
develop a case study through the application of the previously proposed model to solve Company X’s
data related needs.
First, a study will be conducted in order to identify the most appropriate tools to implement the
proposed BI system. Next, the identification and contextualization of the company’s data sources will
be done, followed by the adaptation of the proposed data mart model to fit Company X’s reality and
the implementation of the ETL process. Finally, the dashboards will be presented.
4.1. PLATFORM
The definition of the most appropriate tools to implement the BI system proposed in the previous
chapter was done based not only in a Gartner’s study, but also in Company X’s available resources.
According to the research released by Gartner in the year 2020, Microsoft BI platforms are placed in
the “Leaders” quadrant as the ones that present the most completeness of vision and ability to
execute. The research was based in the capabilities and features provided by the different BI platforms
available in the market. Figure 4.1 below shows the graphic that was published by Gartner as result of
the study:
Figure 4.1 – Magic Quadrant for Analytics and Business Intelligence Platforms (Gartner, 2020)

46
In order to achieve the purposes of the project, the chosen software was: Microsoft SQL Server and
Power BI, both developed by Microsoft and available for use in Company X. More specifically, SQL
Server Management Studio (SSMS) and SQL Server Integration Services (SSIS) were the components
chosen from Microsoft SQL Server database software to implement the data integration, processing
and loading stages of the project. On the other hand, Power BI was defined as the reporting platform,
where the final dashboards are supposed to be designed and managed.
A brief description of the chosen tools is provided below:
SSMS: As stated by Esat Erkec (2020), SSMS “is an advanced, development environment that
enables us to configure, manage and administrate SQL Server database engines”. One of its
central features is “Object Explorer” that allows users to manage objects within Database
Engine, Analysis Services, Integration Services and Reporting Services, which are instances of
Microsoft SQL Server (SQL Docs, 2017). For example, it is possible to schedule through SSMS
the deployment of packages within the Integration Services Server and that are stored in SQL
Server (SQL Docs, 2018).
SSIS: Another component of Microsoft SQL Server, SSIS is a platform used to build “enterprise‐
level data integration and data transformation solutions” (SQL Docs, 2018). When it comes to
this project, Integration Services was the tool chosen to develop the ETL process. Through SSIS,
it is possible to extract data from a wide range of data sources, to perform the necessary data
transformations and to load it into the chosen destinations.
Power BI: It is a business analytics solution that allows the user to visualize data and
collaborate with insights to a better informed decision making process (Power BI, 2020). The
user is able to connect to different data sources and to explore it, resulting in interactive
visualizations, dashboards and reports. These can be published and shared across the
organization. In the current project, Power BI is used as a reporting tool, in the development
of dashboards, since it is not only positioned as a leader in the Gartner Group study, but is also
an available resource at Company X.
4.2. DATA SOURCES
The data necessary to implement the proposed BI system is not provided by a single source. Instead, it
needs to be extracted from different data sources, of different types, transformed and integrated.
It is important to mention that Company X’s available data does not allow for a complete
implementation of the proposed data mart. So, for this case study, the conceptual model will provide
guidelines for Company X’s BI system, but changes will have to be made to adapt the model to the
company’s available data.
The following data sources were identified:
Online Management System (OMS): System responsible for maintaining data that concerns
the online sales of Company X. Still, it does not provide all the required data, specially when it
comes to Operation and Transportation. In OMS, all sales and sold units are identified, the
47
corresponding products, customers, addresses and some important dates. It is also responsible
for holding all data concerning supplier stores. All used tables and respective fields are
identified in table 9.12 of the Appendix.
Warehouse Management System (WMS): System responsible for maintaining data that
concerns all warehouse operations. For the current project, this is the system that will provide
data on Operation for all online sales prepared in the warehouse. It is also responsible for
defining the appropriate Shipping Company and it keeps record of Shipping Company Z’s
activities. All used tables and respective fields are identified in table 9.13 of the Appendix.
Retail Merchandise Operation System (RMOS): This was the first system to ever be
implemented in Company X. It keeps data on various operations across the company. When it
comes to the present project, RMOS helps identify all online sales that did not have their
payment completed. It also provides the necessary data to complete the product dimension.
All used tables and respective fields are identified in table 9.14 of the Appendix.
Longtail Excel File: Every week (monday morning), the supply chain BI team receives an email
containing an excel file with a list of all current longtails. An explanation for what longtails are
was provided in the “Context” section of the “Conceptual Model Proposal” chapter. From the
supplied spreadsheet, the only needed fields are: Year, Week and SKU.
Shipping Company Y Excel File: An Excel file is provided daily (every morning) by Shipping
Company Y containing data on their Transportation operation for the past months. It identifies
tracking numbers, statuses and dates for all packages handled. The milestones of their
transportation process are: 1) Picked up from Company X’s warehouse, 2) Checked‐in in
Shipping Company Y’s distribution center, 3) Left Shipping Company Y’s distribution Center and
4) Delivered at customer’s chosen address.
Due to the confidentiality agreement, the data sources’ original structures, table names and field
names cannot be presented. Instead, fictitious names were used to define the required tables and
table fields for the ETL process. Also, generic names were used for each of the data sources.
4.3. DATA INTEGRATION AND PROCESSING
After defining which software is going to be used and identifying the data sources, the next steps in
the implementation stage of the project are: to integrate the data, to perform the necessary
transformations and to load it into the data mart. First, based on the proposed data mart conceptual
model, the final data mart model for Company X is going to be presented. Then, the ETL process is
going to be developed.
4.3.1. Data Mart Model
This section of the “Development” chapter is based on the implementation of the previously proposed
data mart conceptual model to fit Company X´s scenario. As it was previously stated, the conceptual
model did not solely focus on Company X. Instead, it was meant to provide a BI solution for all
48
companies facing similar challenges. Consequently, the proposed fact tables and dimensions and
respective fields should be adapted to fit Company X´s reality.
According to the data mart conceptual model, appropriate dimensions would be the following:
DimDate, DimProduct, DimAddress, DimFlow, DimShipCompany, DimStore and DimStatus. Due to the
lack of data, not all proposed data fields can be kept, as well as dimension DimShipCompany. A revised
structure for all dimensions, the corresponding data types for their columns and necessary data
sources are presented in Table 9.15 through Table 9.20 in the “Appendix”.
The conceptual model also proposes the appropriate fact tables for this solution. They are the
following: FactOnlineSalesE2E, FactSystems, FactOperation and FactTransportation. The first one is
focused on the overall online sales E2E process. The other three, on the other hand, focus on the
specific parts of the process (Systems, Operation and Transportation). Even though they are all
appropriate as part of this BI solution, not all fields and tables may be implemented on Company X
since some of the necessary data is not provided.
Due to the lack of data on Systems, this fact table does not integrate Company X’s data mart. Operation
also lacks data on specific processes dates and statuses. The query provided to extract data from WMS
does not contain that information. After adjusting FactOperation fields, the final fact table does not
contain any complimentary data when compared to FactOnlineSalesE2E. So, it should not take part in
Company X’s BI system. All the others may be implemented with some adjustments of the table fields.
Table 9.21 and Table 9.22 in the “Appendix” present their final structure, respective data types and
corresponding data sources.
As a result of the challenges faced in the ETL process (explained in the next section), implementing fact
tables with a similar structure of a Type 2 SCD was not possible. Instead, a Type 1 like structure was
adopted, meaning that only one record per unit is maintained and any changes end up overwriting
previous fields. It also resulted in a change of the fact table keys, which became a concatenated version
of the Order Unit Number and the Product Key.
It is important to mention that for Shipping Company Z it is not possible to obtain the
ShippingCenterEntranceDate, as well as the OutForDeliveryDate. Also, the data mart model developed
for Company X contains both TrackingNumber and AggregationTrackingNumber, as described in the
“Context” section of the conceptual model proposal. Last, but not least, since the Madeira and Açores
islands have extended shipping and delivery objectives, it is of interest for them to be identified.
Below, a simplified version of the diagram of the final data mart is presented. The complete version is
shown on Figure 9.6 of the Appendix.

49
Figure 4.2 – Simplified diagram of Company X’s data mart
4.3.2. ETL
After defining the data mart structure, the ETL process had to be implemented. Data from the
previously presented data sources was first imported into a staging area. Then, in a second staging
area, the data went through the necessary transformations in order to fit into the final data mart
structure. Only then the data could be loaded into Company X’s data mart.
The ETL process represented one of the most challenging parts of this project. Besides dealing with
many data sources and with large volumes of data, it was necessary to implement the process using a
computer that lacked the computing capabilities needed to do so. At first, only one staging area was
used. However, when deploying the package in SSIS, there were often memory errors and, even when
no issues were presented, it took so long to run the package that it became impracticable to use it as
a solution.
There was then a second attempt, this time using two staging areas. The first one would be used mainly
to import data from the multiple data sources. The second one, on the other hand, would store the
data with all the transformations needed to make it appropriate for the final data mart. Although this
solution solved the memory errors, it was still time consuming to deploy the packages (took over four
hours to be completed). It is important to remember that, in campaign periods, the updates should be
done every hour. So, for scheduled overnight updates, in an everyday scenario, this solution would be
50
appropriate. However, while the updates are still manually done and are required on an hour basis,
this solution is impracticable.
It is also important to consider that the implementation of this BI solution happened right after the
change of the system responsible for managing the warehouse operations. So, besides representing a
major change in the data sources field mapping, it became of great urgency to present the solution.
Due to the fact that this project was developed in this scenario, there was no available time to pursue
other optimization solutions.
Thus, to make the daily/hourly update a possibility, some adaptations had to be made. First, it was
decided that the dimensions update would not be done every day, since no big changes are expected.
Instead, the update would be done once a week.
Also, as it was already mentioned in the “Data Mart Model” section, a Type 1 SCD like structure was
adopted for the fact tables, unlike what was proposed in the conceptual model. This new structure
allowed the incremental load of the records to be developed, as well as the continuous update of the
fields, since the milestones dates are only updated overtime.
Figure 9.7 through Figure 9.9 in the “Appendix” present a diagram with a summary of the ETL process
developed.
4.4. DASHBOARD
The final stage of the implementation part of the project was the development of the dashboards. As
it was already mentioned, the following dashboards should be designed based on the proposed
structures of the conceptual model. Even though that was considered the best solution for the
presented problem, it should fit into Company X’s reality, meaning that some adaptations are needed
in order to implement it.
As seen in the previous sections, at the moment, Company X does not provide specific data concerning
Systems and Operation. Besides that, data regarding costs and employees’ productivity is also not
available. Consequently, the following dashboards were the ones implemented (with minor
alterations): Transportation Purchase Orders Information, Online Sales Supply Chain E2E Process
Summary (Campaign Season) and Online Sales Supply Chain E2E Process Summary. In order to present
an overview of Systems and Operation performance, a fourth dashboard was built considering their
milestones and their expected individual response times.
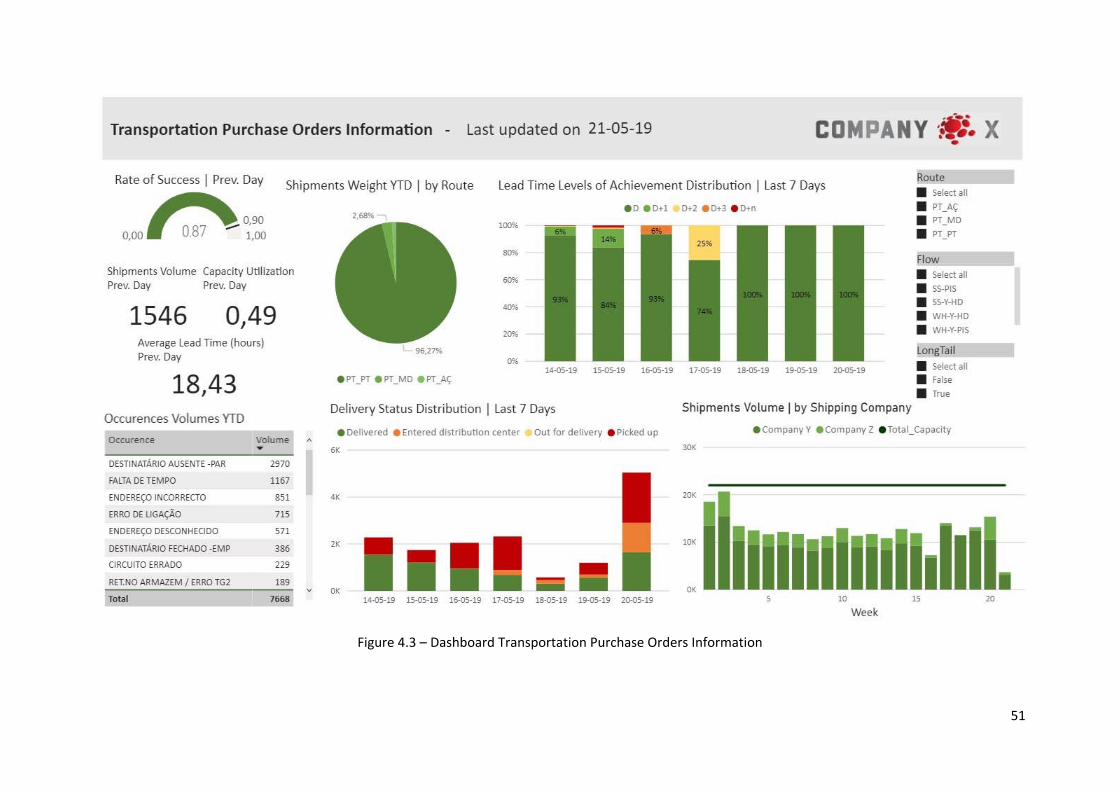
51
Figure 4.3 – Dashboard Transportation Purchase Orders Information
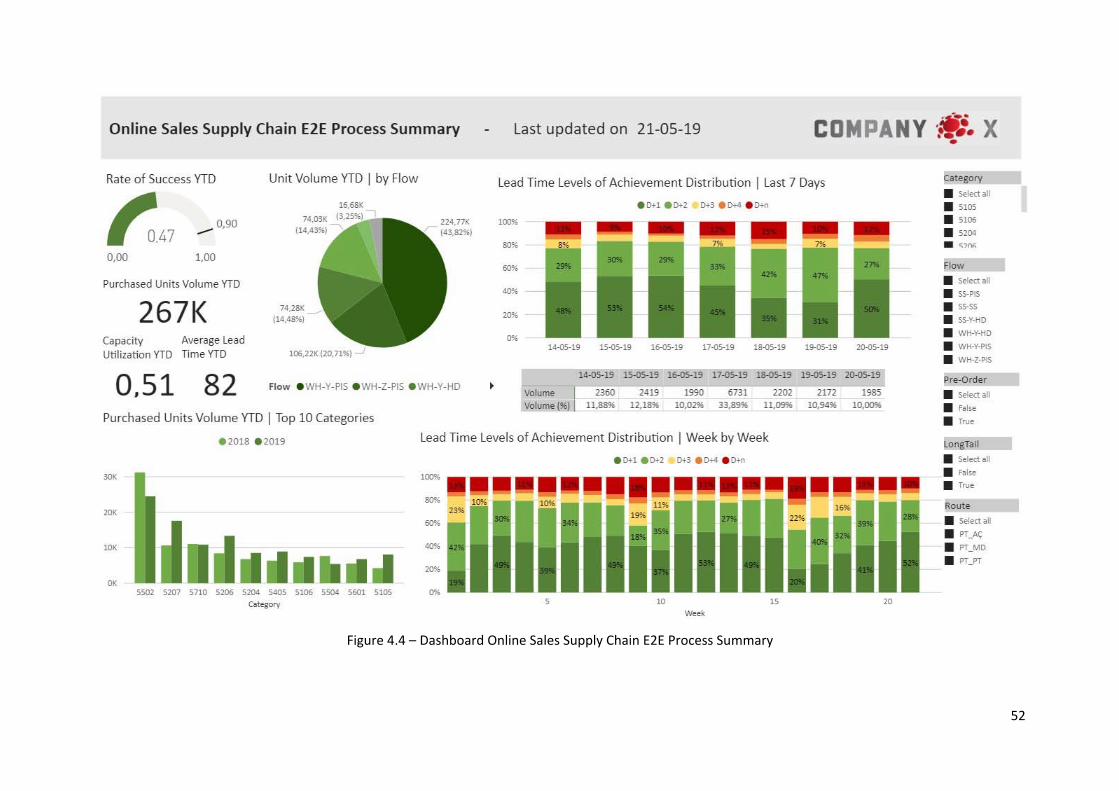
52
Figure 4.4 – Dashboard Online Sales Supply Chain E2E Process Summary
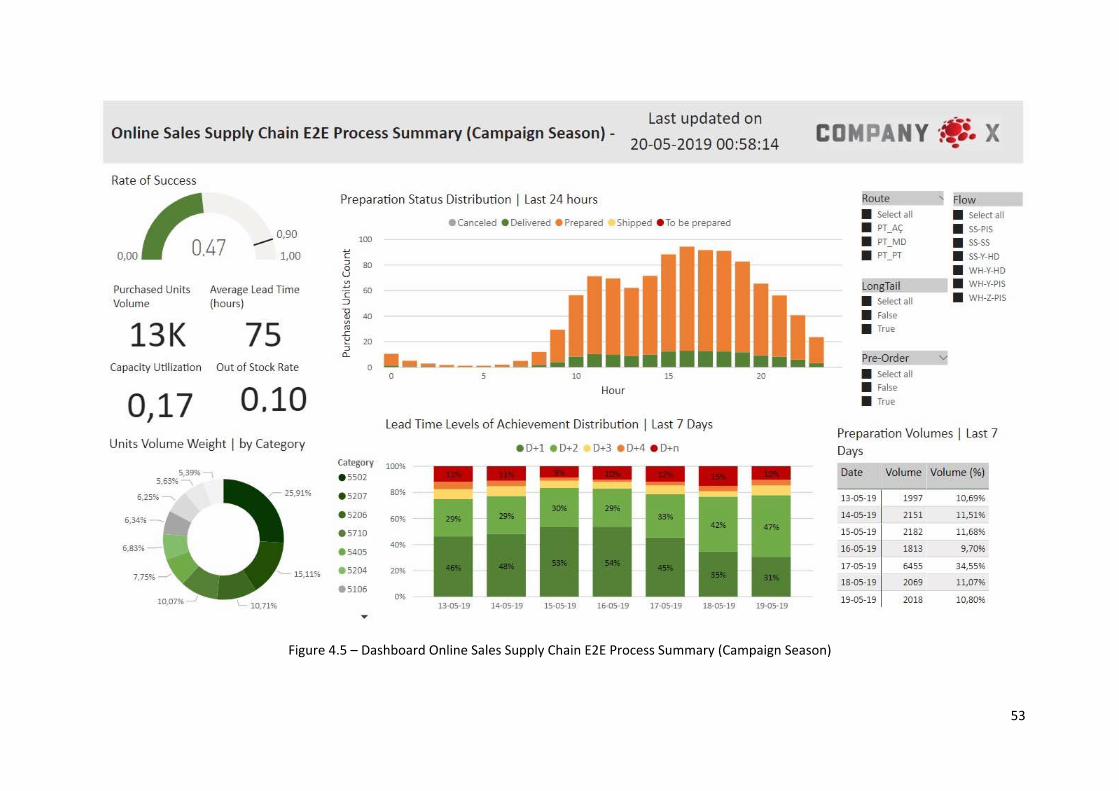
53
Figure 4.5 – Dashboard Online Sales Supply Chain E2E Process Summary (Campaign Season)

54
Figure 4.6 – Dashboard Systems, Operation and Transportation Performance Assessmen
55
Below, an explanation is presented for each of the implemented dashboards. The purpose is to
understand what information is displayed and how it fits into the company’s business scenario.
4.4.1. Transportation Purchase Orders Information
The first dashboard built was meant to provide information concerning Transportation and it is
shown on Figure 4.3 of the previous chapter. The information provided is mostly on an operation
level and is deeply focused on the context provided by Company X.
On the top left corner of the dashboard, a gauge visualization of the rate of success alongside three
data cards containing information of the volume of shipments, average lead time and capacity
utilization provide an overall view of the transportation process. Since the ETL update is done once a
day (during the morning) and the data provided by Shipping Company Y concern the previous day,
these visualizations also show information concerning the previous day.
Other visualizations, such as the pie chart containing the distribution of shipments between routes
also provide further understanding of transportation. According to the graph, more than 95% of
online sales were delivered within Portugal’s continental territory, while Madeira and Azores
represented less than 4% of shipments.
The volume of shipments per shipping company against capacity also contributes to contextualize the
user. As seen in the provided chart, transportation operates far from its capacity limit, with a rare
exception on week 2. So, rethinking its strategy may help reduce costs and eliminate waste. Shipping
Company Y’s and Shipping Company Z’s individual capacities are shown in the tooltip.
The other charts presented have a deeper focus on transportation’s everyday operation. Through
shipment statuses, team members are able to visualize the progress of shipments overtime, from the
moment they were picked up until the moment they were delivered. It also allows them to identify
backlogs and possible deviations.
The stacked bar chart containing the weighted volume of shipments that achieved the lead time goal
allows users to visualize deviations as well. This is one of Company X’s most required supply chain
analyses and provides an overall assessment of the process performance. Each group (Systems,
Operation and Transportation) considers its own levels of success, designed to fit each of their lead
time goals.
For Transportation, this calculation is based on the comparison of two dates: delivery date and
expected delivery date. To calculate the second one, it is necessary to consider the day of the week,
upcoming holidays and location of final delivery (if it is in Madeira, Azores or continental Portugal).
Then, by comparing both dates, one of five levels of success may be obtained: D, D+1, D+2, D+3 or
D+n. If a shipment is delivered before or on the expected delivery date, it is assigned the level D. If it
is delivered one day after the expected delivery date, it is said to be D+1, and so on.
To help identify possible causes of deviation and allow Transportation teams to improve their
process, a table is provided containing occurrences that impose a delay on delivery and their
frequencies for the past year. At the moment, however, this information is provided only for Shipping
Company Y.
56
In order to complete this dashboard, appropriate filters were chosen. It is important to remember
that Transportation comprehends the process between the moment the shipment is picked up from
the warehouse or from the supplier store and the moment of its final delivery. So, if a unit within the
shipment is a pre‐order or a longtail, Transportation’s performance will not be affected. On the other
hand, different routes may have different delivery criteria, which makes it an appropriate filter. It is
also interesting to visualize the data according to the preparation location, shipping company and
delivery site. So, the final filter considered was “Flow”.
4.4.2. Online Sales Supply Chain E2E Process Summary
The second dashboard built was focused on the online sales E2E process and it is presented on Figure
4.4 of the previous chapter. Unlike the previous dashboard, this one should have a tactical/strategic
focus. It is primarily consumed on a weekly meeting between supply chain executives and warehouse
operation managers.
Since this dashboard comprehends the E2E process, it is appropriate to consider every sold unit from
the moment of payment until the moment of delivery.
On the top left corner of the dashboard, a YTD summary of the entire process is presented. Through
a gauge visualization, an overall rate of success is shown. It is possible to observe that, unlike the
objective set (which was of 0,90), the process presented a rate of success of 0,47 for the current
year. A card visualization also shows a use of only half of the process capacity, which shows that
there is room for improvement. Other two card visualizations present the YTD volume produced and
the average process lead time.
Due to recently established business strategies, product category became an important point of
analysis. In order to satisfy that necessity, a clustered column chart was used to compare sales
volumes of the top ten categories for the current and past year. A dashboard filter containing all
product categories was also employed to allow the manipulation of other charts.
Another concern presented by supply chain executives concerns the distribution of online sales
preparation between warehouse and supplier stores. It is of interest to reduce distances (preparation
from delivery) and to increase the number of orders that fit into the “SS‐SS” flow option (order is
prepared in the same store chosen as the delivery site). For this analysis to be a possibility, a pie
chart was used as well as a “Flow” dashboard filter.
As previously stated for the Transportation dashboard, Company X strongly relies on the analysis of
the weighted volume of shipments that achieved the lead time goal to assess the process
performance. For that purpose, two stacked column charts were used. The first one considers the
last seven days while the other considers the past weeks.
Different purchase order units are distributed between five levels of success: D+1, D+2, D+3, D+4 and
D+n. It is important to mention that, for continental Portugal deliveries, a purchase order is expected
to be delivered on the next business day of its payment. So, to calculate the appropriate level, the
following factors are considered: day of the week of the payment, cutoff hour of 8 PM, holidays and
route. If a unit has a calculated level of D+1 it means that it achieved the objected and was delivered
57
on the next business day of its payment. On the other hand, if it is delivered one day after the next
business day, a level of D+2 is assigned, and so on.
To complete this analysis, the volume of orders fulfilled is presented on absolute and relative terms
for the past seven days.
Finally, three other filters were provided due to their impact on the analysis. These are: Route, Longtail
and Pre‐Order.
4.4.3. Online Sales Supply Chain E2E Process Summary (Campaign Season)
The third dashboard built was also focused on the online sales E2E process, but this time concerning
campaign seasons. It is presented on Figure 4.5 of the previous chapter. Since its main objective is to
guide supply chain executives and warehouse operations managers through campaign seasons (such
as Black Friday), it is important for it to contain information on an operational level.
Its structure is similar to the previous dashboard, with the difference that it only analyzes the orders
impacted by the campaign. For example, visualizations on the top left corner keep track only of
orders made during the campaign period. On the other hand, visualizations that give information
about the last 7 days may present orders that were created before the campaign, since they will still
have an impact on the preparation and transportation process. The dashboard also provides an hour
to hour analysis of the distribution of purchase order units between statuses. Through the
continuous observation of their progress, operations managers can identify deviations and take
immediate action.
4.4.4. Systems, Operation and Transportation Performance Assessment
The final dashboard comes to fulfill the necessity of further information concerning specific groups
(Systems, Operation and Transportation) since the lack of data prevented from the development of
two of the proposed dashboards. It is shown on Figure 4.6 of the previous chapter.
The dashboard structure allows for its intuitive reading and interpretation. It is divided into five
sections. On the top left corner, an E2E process summary containing rate of success, volume
produced, capacity utilization and average lead time, for the last 7 days, is observed. A chart of the
distribution of orders between lead time levels of achievement is also observed. The top right corner,
on the other hand, shows different dashboard filters. They were chosen following the same logic as
the previous dashboards.
The last three sections present a performance assessment in the perspective of Systems, Operation
and Transportation, respectively. For each one of them is presented a stacked column chart of their
weighted volume of units/shipments that achieved the lead time goal in the last seven days. So, if
any deviations are observed in the E2E process visualizations, it is possible to determine from each of
groups it resulted from.
58
As it was already mentioned, the group Systems comprehends the process between the moment of
payment and the moment of integration. It is expected of it to ensure that the elapsed time between
those two moments is less or equal to 20 minutes. So, if a certain purchase order unit integrates in
the system within those 20 minutes, it is assigned a D success level. If the elapsed time is greater
than 20 minutes but less than 40 minutes, it is assigned a D+20 success level, and so on. The five
possible levels are: D, D+20, D+40, D+60 and D+n.
Operation, on the other hand, comprehends the process between integration and expedition. From
Monday through Friday, purchase order units that integrate until 8 PM are expected to be dispatched
on the same day. From 8 PM on Friday through 8 PM on Saturday, purchase order units are expected
to be dispatched on Sunday. For those that integrate from 8 PM on Saturday until 8 PM on Monday,
expedition is expected to occur on Monday. Given these conditions, the five possible levels of
success are: D, D+1, D+2, D+3 and D+n. If the expedition occurs on the expected date, it is assigned a
level D. If it is dispatched one day after the expected date, it is assigned a level D+1, and so on.
The different levels of success for Transportation were already discussed in the first dashboard.
59
5. RESULTS AND DISCUSSION
This chapter consists of the “Evaluation” part proposed in the DSR methodology.
The developed BI solution and its outputs were analyzed against the previously defined objectives to
conclude if these were met or not. As outputs, both data mart and dashboards were considered.
5.1. DISCUSSION AND EVALUATION OF THE RESULTS
This project started with the identification of a problem within Company X. In order to achieve the best
solution, a series of objectives were first identified and a methodology was chosen. It was then
followed by a thorough research which meant to identify best practices and previous works in
literature that dealt with similar problems.
All the knowledge obtained, complemented by the identification of the business needs, led to the
development of a conceptual model that addressed the proposed problem. The developed model
extrapolated Company X’s scenario and actually composed a solution for other companies facing
similar challenges, which constituted one of the main objectives listed.
It is important to observe that the data mart fact tables proposed structure was not the most
traditional. Due to one of the model’s main requirements, they were better represented as a
combination of accumulating snapshot and periodic snapshot fact tables. Even though this implicated
in a more complex implementation process, the resulting data mart model answered to all business
requirements and provided an appropriate solution for the problem. More specifically, the data mart
provided fact tables on a unit level that allowed for each of these units to be tracked from the moment
of their creation until the moment of their delivery. Besides that, all required information was
presented and every milestone was registered through a timestamp.
For the implementation stage of the project, the definition of the software was first required. The
chosen software can be said to have been appropriate for the problem, however there were some
challenges during the ETL implementation. The computer provided, at the time, by Company X had
significant memory problems and did not have the processing capabilities needed for the solution.
Also, connections to operational systems provided by Company X were very unstable. Hence, the
implemented solution required some adaptations so that it could be delivered in a timely manner.
Even though the ETL process faced some challenges, the final solution still presented improvements
for Company X. It helped identify all data sources and concentrate all required extractions and
transformations in the same place. It also provided a central data repository (structured according to
the identified business needs), as well as a solution for the changes that resulted from the replacement
of the former warehouse management system.
The implementation of the dashboards also faced some challenges. Due to the lack of data, not all
proposed dashboards were viable and some alterations had to be made. Even with some restrictions,
supply chain groups were still able to assess their performances on an operational level. Also, analysis
on extended periods of time and on different perspectives were provided. Finally, considering the
needs listed for campaign seasons, users were able to visualize the progress between statuses of
purchase order units overtime.

60
It is possible to say that the dashboards, both proposed and implemented, allow for an intuitive
reading and interpretation. They are also interactive, and all visualizations and filters provided
contribute to the fulfillment of the business requirements.
It is important to mention that it is made sure that all target users fully understand the information
displayed in the dashboards. Also, all observations and evaluation concerning the artifact developed
in this project reflect the comments and feedback given by each of the users.
A final evaluation, which ranged from 0 to 10, was made in order to identify the project’s level of
achievement. The topics evaluated were: 1) Extraction of data directly from the data source; 2)
Eliminates manual tasks; 3) Artifact may be implemented in other companies facing similar challenges;
4) Dimensions, fact tables and granularity chosen are appropriate; 5) Solution is user friendly; 6) Allows
faster reporting; 7) Provides more accurate reporting; 8) Data centered in a single data repository. All
topics scored between 8 and 10, with an average of 8,9. Results can be seen in Figure 6.1 in the next
chapter.
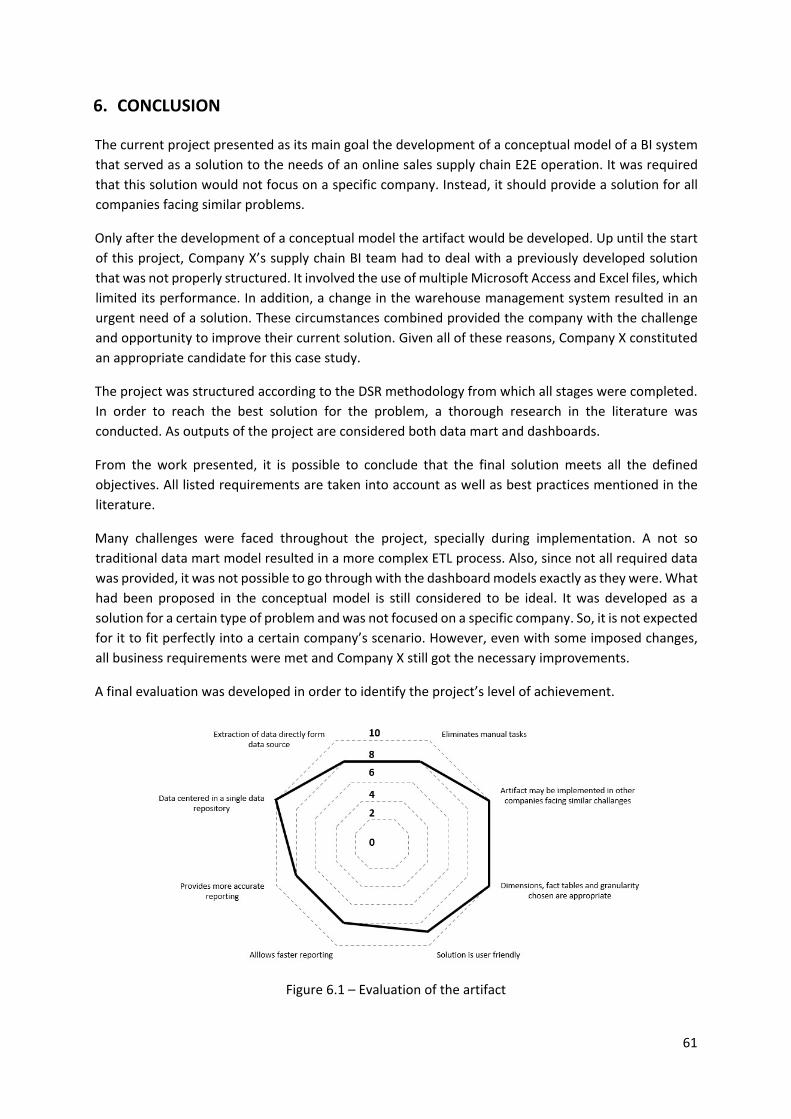
61
6. CONCLUSION
The current project presented as its main goal the development of a conceptual model of a BI system
that served as a solution to the needs of an online sales supply chain E2E operation. It was required
that this solution would not focus on a specific company. Instead, it should provide a solution for all
companies facing similar problems.
Only after the development of a conceptual model the artifact would be developed. Up until the start
of this project, Company X’s supply chain BI team had to deal with a previously developed solution
that was not properly structured. It involved the use of multiple Microsoft Access and Excel files, which
limited its performance. In addition, a change in the warehouse management system resulted in an
urgent need of a solution. These circumstances combined provided the company with the challenge
and opportunity to improve their current solution. Given all of these reasons, Company X constituted
an appropriate candidate for this case study.
The project was structured according to the DSR methodology from which all stages were completed.
In order to reach the best solution for the problem, a thorough research in the literature was
conducted. As outputs of the project are considered both data mart and dashboards.
From the work presented, it is possible to conclude that the final solution meets all the defined
objectives. All listed requirements are taken into account as well as best practices mentioned in the
literature.
Many challenges were faced throughout the project, specially during implementation. A not so
traditional data mart model resulted in a more complex ETL process. Also, since not all required data
was provided, it was not possible to go through with the dashboard models exactly as they were. What
had been proposed in the conceptual model is still considered to be ideal. It was developed as a
solution for a certain type of problem and was not focused on a specific company. So, it is not expected
for it to fit perfectly into a certain company’s scenario. However, even with some imposed changes,
all business requirements were met and Company X still got the necessary improvements.
A final evaluation was developed in order to identify the project’s level of achievement.
Figure 6.1 – Evaluation of the artifact

62
This evaluation is mainly focused on the identified recommendations from works in the literature, on
the listed project objectives and on its main motivations.
Even with some challenges, it is possible to say that the project reached a successful result. The
conceptual model developed provided a solution not only to Company X, but to all companies with
similar needs. Also, with this well‐structured BI solution, Company X is now able to share quality
information along its supply chain, reporting became more accurate and faster, and BI team members
time was optimized. This all results in a consequent improvement of the decision‐making process.
Also concerning the visualization part of the project, the result was a group of intuitive and
wellstructured dashboards. Each of the supply chain individual teams are able to assess their
performance, visualize deviations and act on the observed problems.

63
7. LIMITATIONS AND RECOMMENDATIONS FOR FUTURE WORKS
The limitations observed during the development of the project are the following:
The computer provided by Company X had significant memory problems and did not have the
processing capabilities needed for the solution;
Connections to operational systems provided by Company X were very unstable and resulted
in longer package deployment times;
Data from different data sources had different formats and nomenclature, which contributed
to a more complex ETL process;
The need to track each purchase order unit throughout the entire E2E process made the
development of an appropriate data mart model much more complex, as well as the ETL
process;
Since some of the required data was not provided by Company X, limitations were imposed on
the implementation of the dashboards;
The change of the warehouse management system resulted in the urgent need to develop a
solution;
Not all required data is integrated in the operational systems. So, it is still necessary to
manipulate manually those data sources composed by excel files that are provided
daily/weekly.
Bellow, are presented the recommendations for future works:
Performance indicators determined by the weighted volume of units/shipments that achieved
the lead time goal were based on previously existing practices of Company X. The way they are
formulated does not allow the visualization of the impact of orders that still have not gone
through the complete process. An improvement would be to include an additional level of
success, so that the impact of pending orders can be observed;
Even though purchase order units’/shipments’ volumes are measures of interest, it would be
more informative to have those values relative to the number of worked hours. So, for future
developments, it would be of interest to have the necessary data (needed to obtain that
calculation) integrated to the system;
Understanding the reasons why orders do not achieve the highest levels of success is just as
important as assessing processes performances. So, for future developments, access to
occurrences data is suggested. At the moment, this is only provided for Shipping Company Y;
It would be of interest to integrate in the existing solution data that describes the stages that
orders go through in the preparation process (not yet provided by the company);
It is suggested to explore different tools in order to improve the ETL process;

64
Conduct a survey to obtain users’ opinions regarding the current solution and to define which
of its aspects can be improved;
For future works, it would be interesting to have a table on the dashboards, or even a separate
report, with the detail of online orders that presented delays during the process;
Finally, it is suggested to build a structure to store meta data, which was not yet possible.
65
8. BIBLIOGRAPHY
Abela, A. (2006). Choosing a good chart ‐ The Extreme Presentation™ Method. Retrieved October 25,
2019, from https://extremepresentation.typepad.com/blog/2006/09/choosing_a_good.html
Amazon – About Amazon Scout (n. d.). Retrieved August 18, 2020, from
https://www.amazon.com/gp/help/customer/display.html?nodeId=GTGUQUQHMZ54B55F
Bakusevych, T. (2018). 10 rules for better dashboard design. Retrieved October 25, 2019, from
https://uxplanet.org/10‐rules‐for‐better‐dashboard‐design‐ef68189d734c
Barry, B. (n. d.). 10 Supply Chain Strategies for eCommerce Businesses ‐ F. Curtis Barry & Company.
Retrieved October 20, 2019, from: https://www.fcbco.com/blog/bid/156247/10‐supply‐
chainstrategies‐for‐ecommerce‐businesses
Becker, B. (2003). Design Tip #46: Another Look at Degenerate Dimensions. Retrieved December 15,
2019, from https://www.kimballgroup.com/2003/06/design‐tip‐46‐another‐look‐
atdegenerate‐dimensions/
Chae, B. K. (2009). Developing key performance indicators for supply chain: an industry perspective.
Supply Chain Management: An International Journal, 14 (6), 422‐
428. https://doi.org/10.1108/13598540910995192
Chen, H., Chiang, R. H. L., & Storey, V. C. (2012). Business Intelligence and Analytics: From Big Data to
Big Impact. MIS Quarterly, 36, 1165‐1188. 10.2307/41703503.
Chen, I. J., & Paulraj, A. (2004). Towards a theory of supply chain management: the constructs and
measurements. Journal of Operations Management, 22, 119‐150.
https://doi.org/10.1016/j.jom.2003.12.007
Chiles, C. R., & Dau, M. T. (2005). An Analysis of Current Supply Chain Best Practices in the Retail
Industry with Case Studies of Wal‐Mart and Amazon.com [Master’s Thesis, Massachusetts
Institute of Technology]. Institutional Repository at the Massachusetts Institute of Technology.
http://dspace.mit.edu/handle/1721.1/7582
CSCMP Supply Chain Management Definitions and Glossary (n.d.). Retrieved September 10, 2019, from
https://cscmp.org/CSCMP/Educate/SCM_Definitions_and_Glossary_of_Terms.aspx#:~:text=Su
pply%20chain%20management%20encompasses%20the,and%20all%20logistics%20managem
ent%20activities.&text=In%20essence%2C%20supply%20chain%20management,management
%20within%20and%20across%20companies.
Deloitte & MHI (2016). The 2016 MHI Annual Industry Report ‐ Accelerating change: How innovation is
driving digital, always‐on supply chains. Retrieved October 03, 2019, from
http://cpbucket.fiu.edu/1168‐geb6368x81168_emba‐97075%2F2016‐industry‐report‐2016‐
(1).pdf
DeYoung, R. (2001). The financial performance of pure play Internet banks. Economic
PerspectivesFederal Reserve Bank of Chicago, 25, 60‐78.
66
Erkec, E. (2020). Overview of Microsoft SQL Server Management Studio (SSMS). Retrieved February
10, 2020, from: https://www.sqlshack.com/overview‐of‐microsoft‐sql‐server‐
managementstudio‐ssms/
Few, S. (2007). Pervasive Hurdles to Effective Dashboard Design. Visual Business Intelligence
Newsletter, 1–7.
Gartner Glossary ‐ Analytics and Business Intelligence (n. d.). Retrieved August 20, 2019, from
https://www.gartner.com/it‐glossary/business‐intelligence‐bi/
Gartner Magic Quadrant for Analytics and Business Intelligence Platforms (2020). Retrieved March 20,
2020, from https://www.gartner.com/doc/reprints?id=1‐1YCR6NZW&ct=200213&st=sb
Ghosh, A. (2016). Business Intelligence (BI) in Supply Chain Management. Asian Journal of Science and
Technology, 07 (11).
Gunasekaran, A., Patel, C., & McGaughey, R. E. (2004). A framework for supply chain performance
measurement. International journal of production economics, 87(3), 333‐347.
Hammer, M. (2004). Deep Change: How Operational Innovation Can Transform Your Company.
Harvard Business Review, 82, 84‐93.
Han, J., Pei, J., & Kamber, M. (2011). Data mining: concepts and techniques. Waltham, MA: Elsevier.
Hansen, J. (2020). Beyond “Modern” Data Architecture. Retrieved August 25, 2020, from
https://support.snowflake.net/s/article/Beyond‐Modern‐Data‐Architecture
Hubbard, D. W. (2014). How to measure anything: finding the value of intangibles in business.
Hoboken, NJ: John Wiley & Sons.
Inmon, W. H. (2002). Building the Data Warehouse. Hoboken, NJ: John Wiley & Sons.
Ittmann, H. W. (2015). The impact of big data and business analytics on supply chain management.
Journal of Transport and Supply Chain Management, 9 (1), 1‐9.
https://doi.org/10.4102/jtscm.v9i1.165
Janes, A., Sillitti, A., & Succi, G. (2013). Effective Dashboard Design. Cutter IT Journal, 26 (1), 17‐24.
Kimball, R., & Ross, M. (2011). The data warehouse toolkit: the complete guide to dimensional
modeling. Hoboken, NJ: John Wiley & Sons.
Klumpp, M., & Jasper, A. (2008). Success Factors for Retail Logistics in an E‐commerce environment.
Sineuropean Engineering Research Journal, 1, 63‐68.
Lambert, D. M. (2014). Supply Chain Management: Processes, Partnerships, Performance. Sarasota, FL:
Supply Chain Management Institute.
Lambert, D. M., & Cooper, M. C. (2000). Issues in Supply Chain Management. Industrial Marketing
Management, 29(1), 65‐83. https://doi.org/10.1016/S0019‐8501(99)00113‐3
67
Langlois, A., & Chauvel, B. (2017). The impact of supply chain management on business intelligence.
Journal of Intelligence Studies in Business, 7 (2), 51‐61. https://doi.org/10.37380/jisib.v7i2.239
Liu, L. (2010). Supply Chain Integration through Business Intelligence. In 2010 International Conference
on Management and Service Science, Wuhan, 2010. Wuhan, China: IEEE.
10.1109/ICMSS.2010.5576813
Meyer, S. (2020). Evolving Ecommerce: 14 Trends Driving Online Retail In 2020. Retrieved August 25,
2020, from https://www.bigcommerce.com/blog/ecommerce‐trends/#14‐ecommerce‐
trendsleading‐the‐way
Mundy, J. (2012). Design Tip #145 Timespan Accumulating Snapshot Fact Tables. Retrieved January 05,
2020, from https://www.kimballgroup.com/2012/05/design‐tip‐145‐time‐
stampingaccumulating‐snapshot‐fact‐tables/
Peffers, K., Tuunanen, T., Rothenberger, M. A., & Chatterjee, S. (2007). A Design Research
Methodology for Information Systems Research. Journal of Management Information Systems,
24 (3), 45‐77. https://doi.org/10.2753/MIS0742‐1222240302
Power BI ‐ What is Power BI? (2020). Retrieved November 03, 2019, from
https://powerbi.microsoft.com/en‐us/what‐is‐power‐bi/
Reporting Impulse ‐ Dashboard Design Rule No.3: Develop Along Reading Gravity (2019). Retrieved
September 15, 2019, from https://reporting‐blog.com/2019/04/19/dashboard‐design‐rule‐no3‐
develop‐along‐reading‐gravity/#respond
ScrapeHero ‐ How many Products Does Amazon Sell? – April 2019 (2019). Retrieved October 21, 2019,
from https://www.scrapehero.com/number‐of‐products‐on‐amazon‐april‐2019/
SQL Docs ‐ Object Explorer (2017). Retrieved April 15, 2020, from
https://docs.microsoft.com/enus/sql/ssms/object/object‐explorer?view=sql‐server‐ver15
SQL Docs ‐ SQL Server Agent Jobs for Packages (2018). Retrieved April 15, 2020, from
https://docs.microsoft.com/en‐us/sql/integration‐services/packages/sql‐server‐agent‐jobs‐
forpackages?view=sql‐server‐ver15
SQL Docs ‐ SQL Server Integration Services (2018). Retrieved April 15, 2020, from
https://docs.microsoft.com/en‐us/sql/integration‐services/sql‐server‐
integrationservices?view=sql‐server‐ver15
Stefanovic, N., Majstorovic, V., & Stefanovic, D. (2006). Supply Chain Business Intelligence Model.
Proceedings 13th International Conference on Life Cycle Engineering, pages 613‐618.
Stefanovic, N., & Stefanovic, D. (2009). Supply Chain Business Intelligence: Technologies, Issues and
Trends. Berlin, Heidelberg: Springer.
Stock, J. & Boyer, S. (2009). Developing a consensus definition of supply chain management: A
qualitative study. International Journal of Physical Distribution & Logistics Management, 39 (8),
690‐711. https://doi.org/10.1108/09600030910996323
Toplin, J. (2020). June e‐commerce growth was the highest of the pandemic so far. Retrieved August
68
25, 2020, from https://www.businessinsider.com/pandemic‐ecommerce‐habits‐setting‐in2020‐
7
Vaishnavi, V., & Kuechler, W. (2004). Design Research in Information Systems. Association for
Information Systems.
Vercellis, C. (2009). Business Intelligence. In: Business Intelligence: Data Mining and Optimization for
Decision Making. Chichester, West Sussex: John Wiley & Sons Ltd.
Waller, M. A., & Fawcett, S. E. (2013). Data Science, Predictive Analytics, and Big Data: A Revolution
That Will Transform Supply Chain Design and Management. Journal of Business Logistics, 34
(2), 77‐84. https://doi.org/10.1111/jbl.12010
Ware, C. (2013). Information Visualization: Perception for Design. Burlington, MA: Morgan Kaufmann.
Yu, Y., Wang, X., Zhong, R. Y., & Huang, G. Q. (2016). E‐Commerce Logistics in Supply Chain
Management: Practice Perspective. Procedia Cirp, 52, 179‐185.
https://doi.org/10.1016/j.procir.2016.08.002
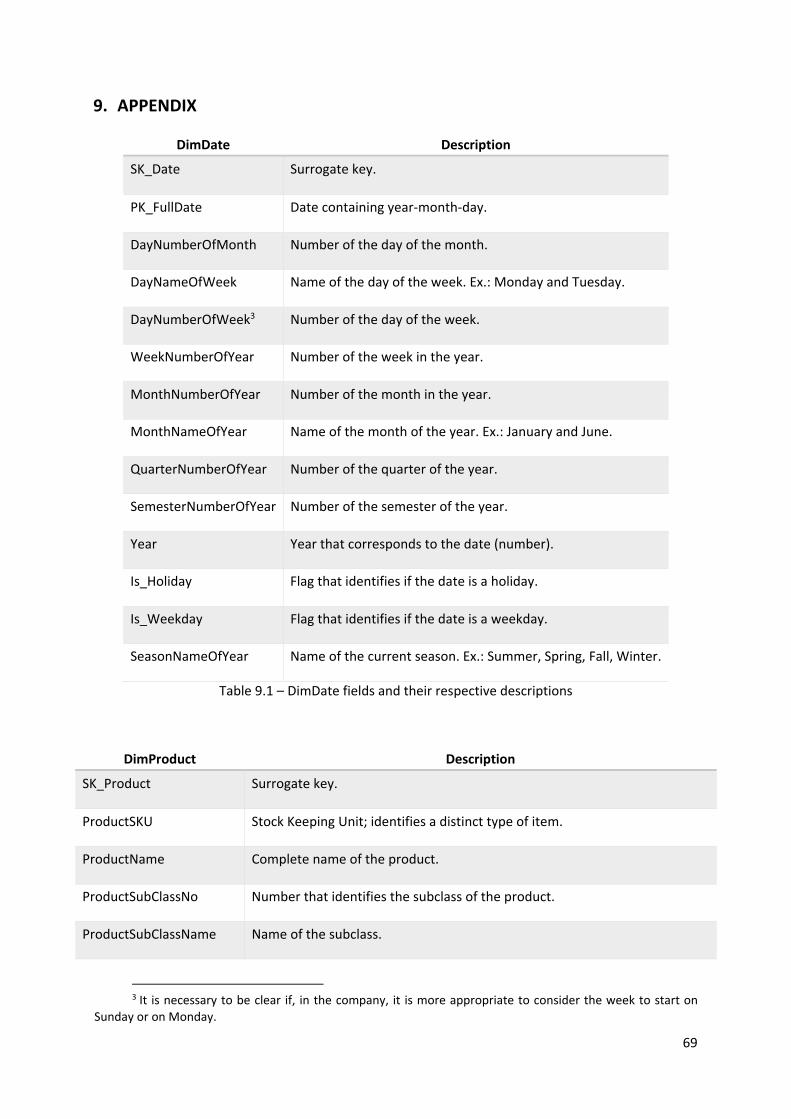
69
9. APPENDIX
DimDate Description
SK_Date Surrogate key.
PK_FullDate Date containing year‐month‐day.
DayNumberOfMonth Number of the day of the month.
DayNameOfWeek Name of the day of the week. Ex.: Monday and Tuesday.
DayNumberOfWeek3 Number of the day of the week.
WeekNumberOfYear Number of the week in the year.
MonthNumberOfYear Number of the month in the year.
MonthNameOfYear Name of the month of the year. Ex.: January and June.
QuarterNumberOfYear Number of the quarter of the year.
SemesterNumberOfYear Number of the semester of the year.
Year Year that corresponds to the date (number).
Is_Holiday Flag that identifies if the date is a holiday.
Is_Weekday Flag that identifies if the date is a weekday.
SeasonNameOfYear Name of the current season. Ex.: Summer, Spring, Fall, Winter.
Table 9.1 – DimDate fields and their respective descriptions
DimProduct Description
SK_Product Surrogate key.
ProductSKU Stock Keeping Unit; identifies a distinct type of item.
ProductName Complete name of the product.
ProductSubClassNo Number that identifies the subclass of the product.
ProductSubClassName Name of the subclass.
3 It is necessary to be clear if, in the company, it is more appropriate to consider the week to start on
Sunday or on Monday.
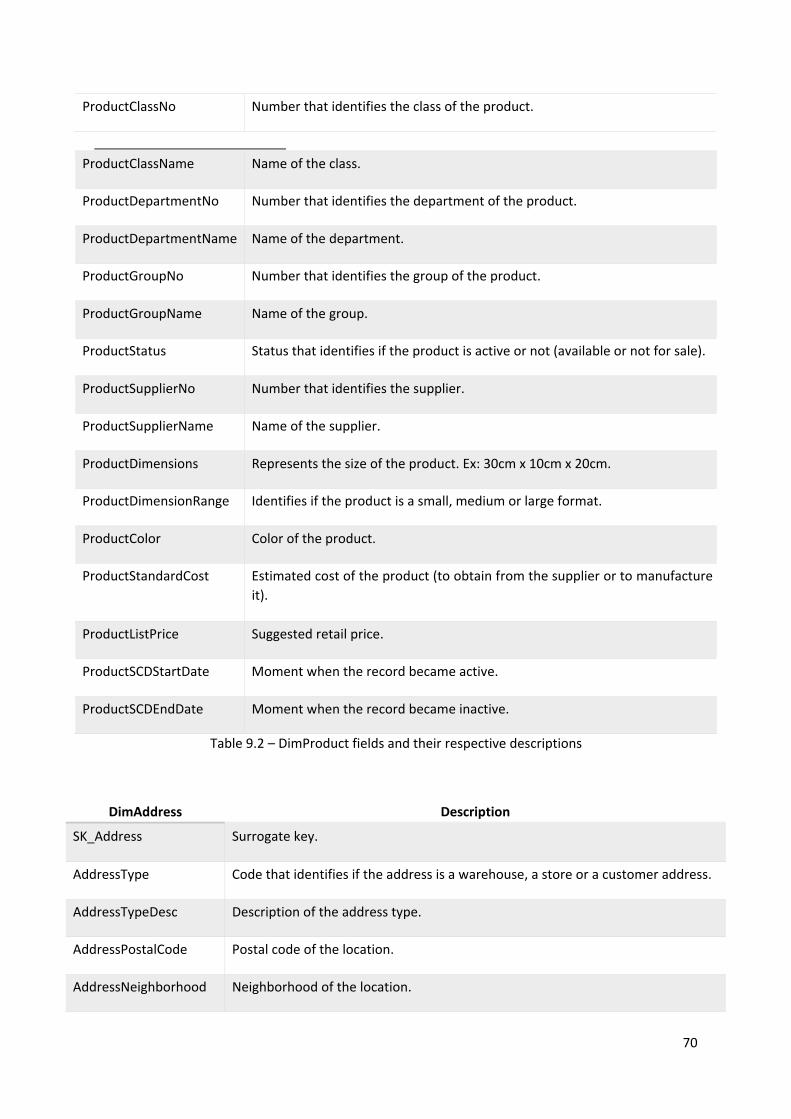
70
ProductClassNo Number that identifies the class of the product.
ProductClassName Name of the class.
ProductDepartmentNo Number that identifies the department of the product.
ProductDepartmentName Name of the department.
ProductGroupNo Number that identifies the group of the product.
ProductGroupName Name of the group.
ProductStatus Status that identifies if the product is active or not (available or not for sale).
ProductSupplierNo Number that identifies the supplier.
ProductSupplierName Name of the supplier.
ProductDimensions Represents the size of the product. Ex: 30cm x 10cm x 20cm.
ProductDimensionRange Identifies if the product is a small, medium or large format.
ProductColor Color of the product.
ProductStandardCost Estimated cost of the product (to obtain from the supplier or to manufacture
it).
ProductListPrice Suggested retail price.
ProductSCDStartDate Moment when the record became active.
ProductSCDEndDate Moment when the record became inactive.
Table 9.2 – DimProduct fields and their respective descriptions
DimAddress Description
SK_Address Surrogate key.
AddressType Code that identifies if the address is a warehouse, a store or a customer address.
AddressTypeDesc Description of the address type.
AddressPostalCode Postal code of the location.
AddressNeighborhood Neighborhood of the location.
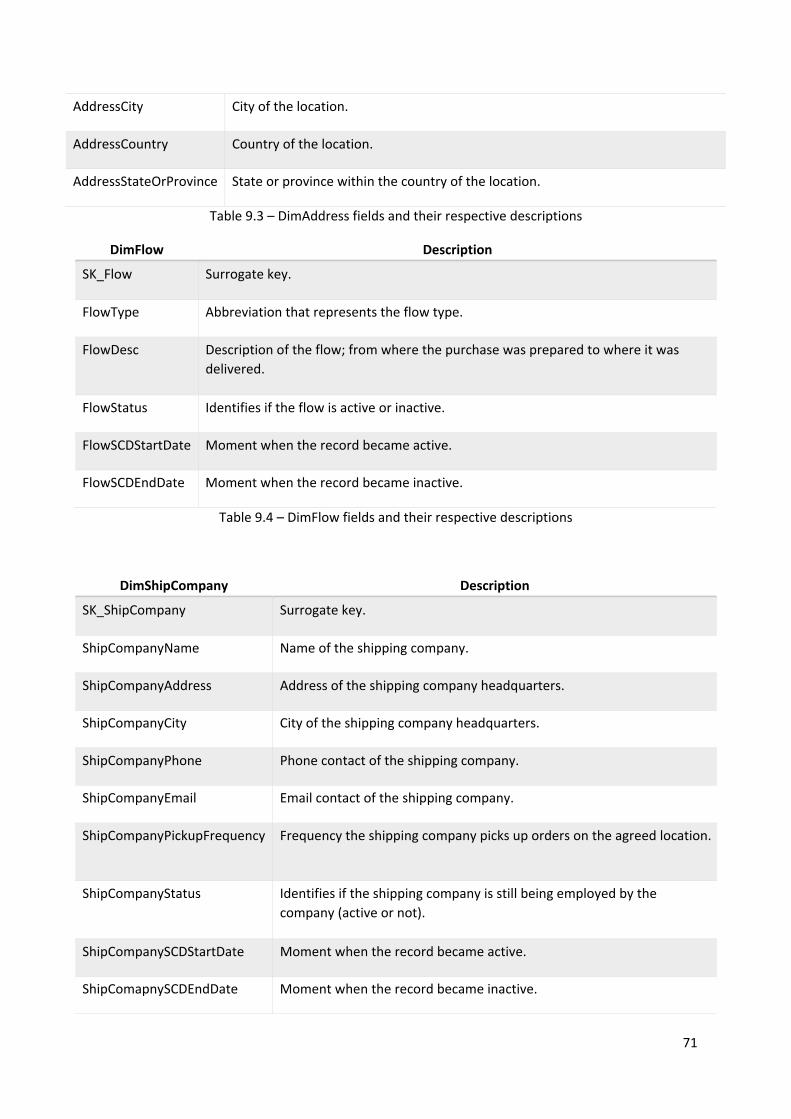
71
AddressCity City of the location.
AddressCountry Country of the location.
AddressStateOrProvince State or province within the country of the location.
Table 9.3 – DimAddress fields and their respective descriptions
DimFlow Description
SK_Flow Surrogate key.
FlowType Abbreviation that represents the flow type.
FlowDesc Description of the flow; from where the purchase was prepared to where it was
delivered.
FlowStatus Identifies if the flow is active or inactive.
FlowSCDStartDate Moment when the record became active.
FlowSCDEndDate Moment when the record became inactive.
Table 9.4 – DimFlow fields and their respective descriptions
DimShipCompany Description
SK_ShipCompany Surrogate key.
ShipCompanyName Name of the shipping company.
ShipCompanyAddress Address of the shipping company headquarters.
ShipCompanyCity City of the shipping company headquarters.
ShipCompanyPhone Phone contact of the shipping company.
ShipCompanyEmail Email contact of the shipping company.
ShipCompanyPickupFrequency Frequency the shipping company picks up orders on the agreed location.
ShipCompanyStatus Identifies if the shipping company is still being employed by the
company (active or not).
ShipCompanySCDStartDate Moment when the record became active.
ShipComapnySCDEndDate Moment when the record became inactive.
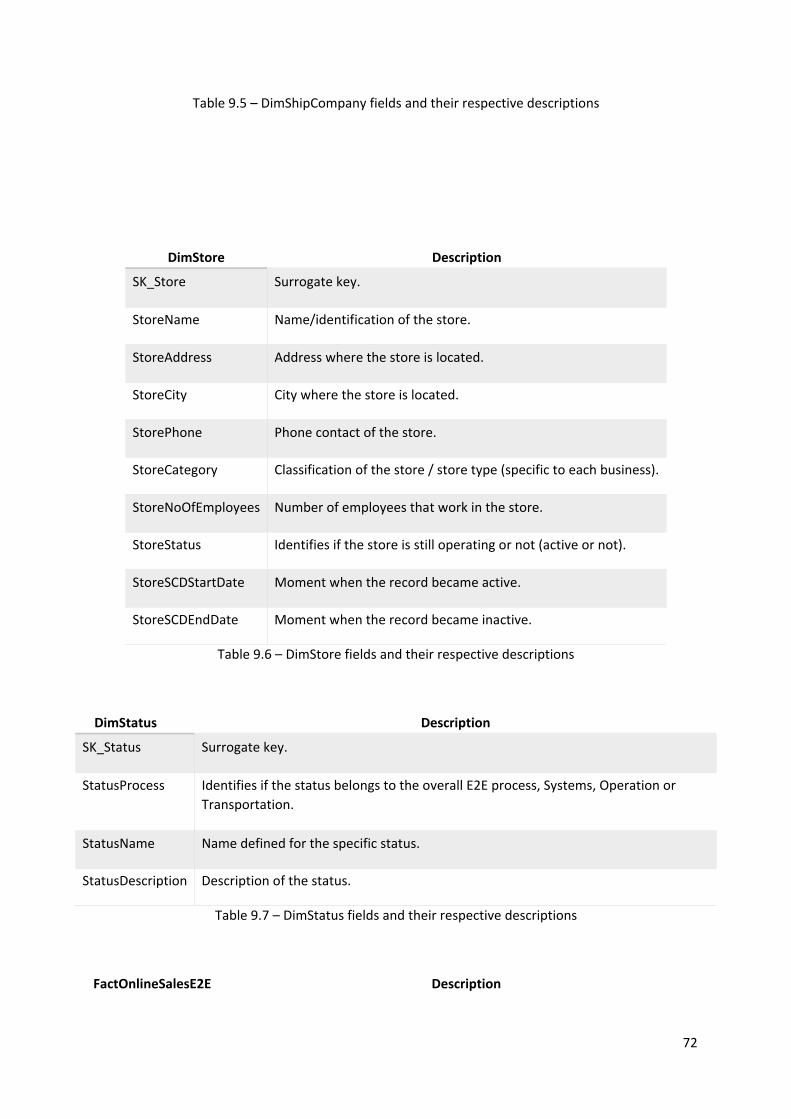
72
Table 9.5 – DimShipCompany fields and their respective descriptions
DimStore Description
SK_Store Surrogate key.
StoreName Name/identification of the store.
StoreAddress Address where the store is located.
StoreCity City where the store is located.
StorePhone Phone contact of the store.
StoreCategory Classification of the store / store type (specific to each business).
StoreNoOfEmployees Number of employees that work in the store.
StoreStatus Identifies if the store is still operating or not (active or not).
StoreSCDStartDate Moment when the record became active.
StoreSCDEndDate Moment when the record became inactive.
Table 9.6 – DimStore fields and their respective descriptions
DimStatus Description
SK_Status Surrogate key.
StatusProcess Identifies if the status belongs to the overall E2E process, Systems, Operation or
Transportation.
StatusName Name defined for the specific status.
StatusDescription Description of the status.
Table 9.7 – DimStatus fields and their respective descriptions
FactOnlineSalesE2E Description
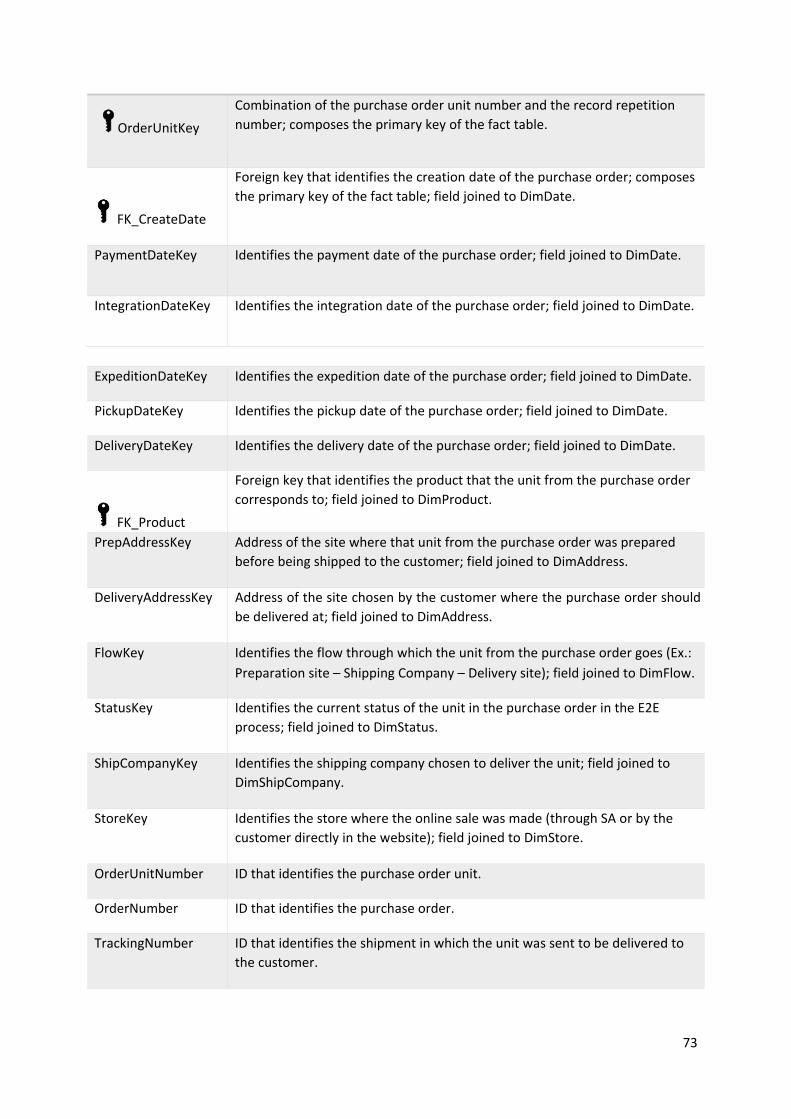
73
OrderUnitKey
Combination of the purchase order unit number and the record repetition
number; composes the primary key of the fact table.
FK_CreateDate
Foreign key that identifies the creation date of the purchase order; composes
the primary key of the fact table; field joined to DimDate.
PaymentDateKey Identifies the payment date of the purchase order; field joined to DimDate.
IntegrationDateKey Identifies the integration date of the purchase order; field joined to DimDate.
ExpeditionDateKey Identifies the expedition date of the purchase order; field joined to DimDate.
PickupDateKey Identifies the pickup date of the purchase order; field joined to DimDate.
DeliveryDateKey Identifies the delivery date of the purchase order; field joined to DimDate.
FK_Product
Foreign key that identifies the product that the unit from the purchase order
corresponds to; field joined to DimProduct.
PrepAddressKey Address of the site where that unit from the purchase order was prepared
before being shipped to the customer; field joined to DimAddress.
DeliveryAddressKey Address of the site chosen by the customer where the purchase order should
be delivered at; field joined to DimAddress.
FlowKey Identifies the flow through which the unit from the purchase order goes (Ex.:
Preparation site – Shipping Company – Delivery site); field joined to DimFlow.
StatusKey Identifies the current status of the unit in the purchase order in the E2E
process; field joined to DimStatus.
ShipCompanyKey Identifies the shipping company chosen to deliver the unit; field joined to
DimShipCompany.
StoreKey Identifies the store where the online sale was made (through SA or by the
customer directly in the website); field joined to DimStore.
OrderUnitNumber ID that identifies the purchase order unit.
OrderNumber ID that identifies the purchase order.
TrackingNumber ID that identifies the shipment in which the unit was sent to be delivered to
the customer.
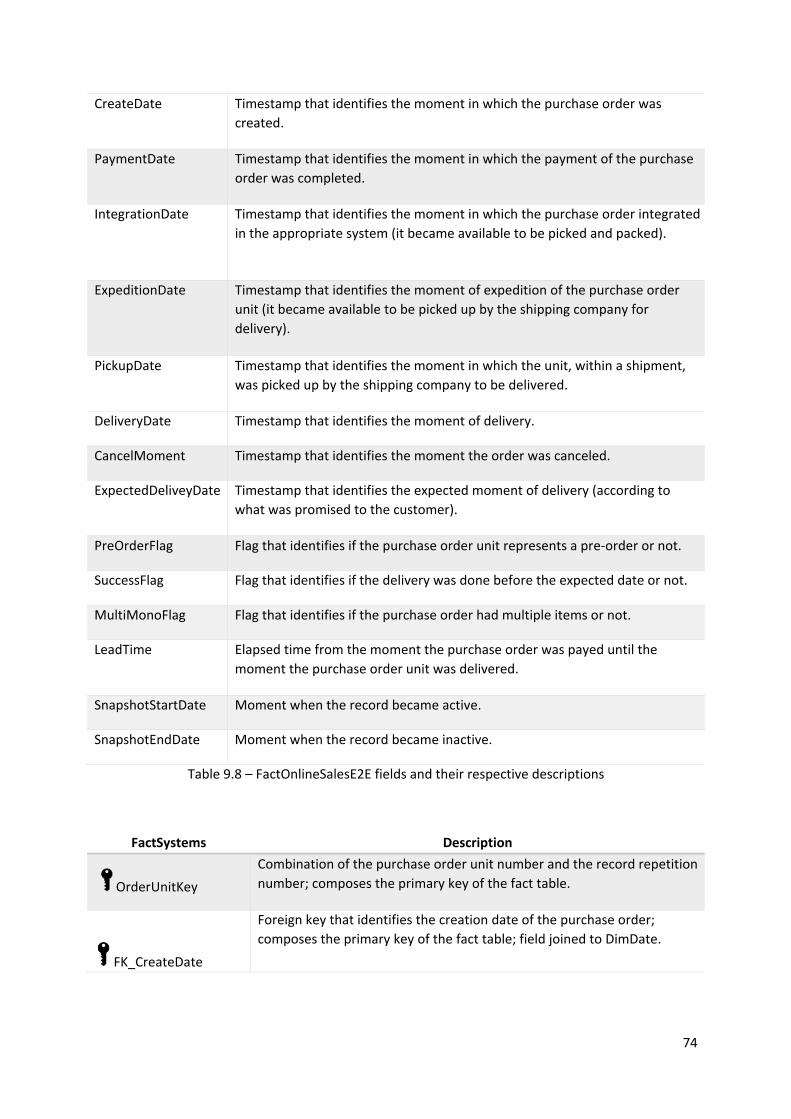
74
CreateDate Timestamp that identifies the moment in which the purchase order was
created.
PaymentDate Timestamp that identifies the moment in which the payment of the purchase
order was completed.
IntegrationDate Timestamp that identifies the moment in which the purchase order integrated
in the appropriate system (it became available to be picked and packed).
ExpeditionDate Timestamp that identifies the moment of expedition of the purchase order
unit (it became available to be picked up by the shipping company for
delivery).
PickupDate Timestamp that identifies the moment in which the unit, within a shipment,
was picked up by the shipping company to be delivered.
DeliveryDate Timestamp that identifies the moment of delivery.
CancelMoment Timestamp that identifies the moment the order was canceled.
ExpectedDeliveyDate Timestamp that identifies the expected moment of delivery (according to
what was promised to the customer).
PreOrderFlag Flag that identifies if the purchase order unit represents a pre‐order or not.
SuccessFlag Flag that identifies if the delivery was done before the expected date or not.
MultiMonoFlag Flag that identifies if the purchase order had multiple items or not.
LeadTime Elapsed time from the moment the purchase order was payed until the
moment the purchase order unit was delivered.
SnapshotStartDate Moment when the record became active.
SnapshotEndDate Moment when the record became inactive.
Table 9.8 – FactOnlineSalesE2E fields and their respective descriptions
FactSystems Description
OrderUnitKey
Combination of the purchase order unit number and the record repetition
number; composes the primary key of the fact table.
FK_CreateDate
Foreign key that identifies the creation date of the purchase order;
composes the primary key of the fact table; field joined to DimDate.
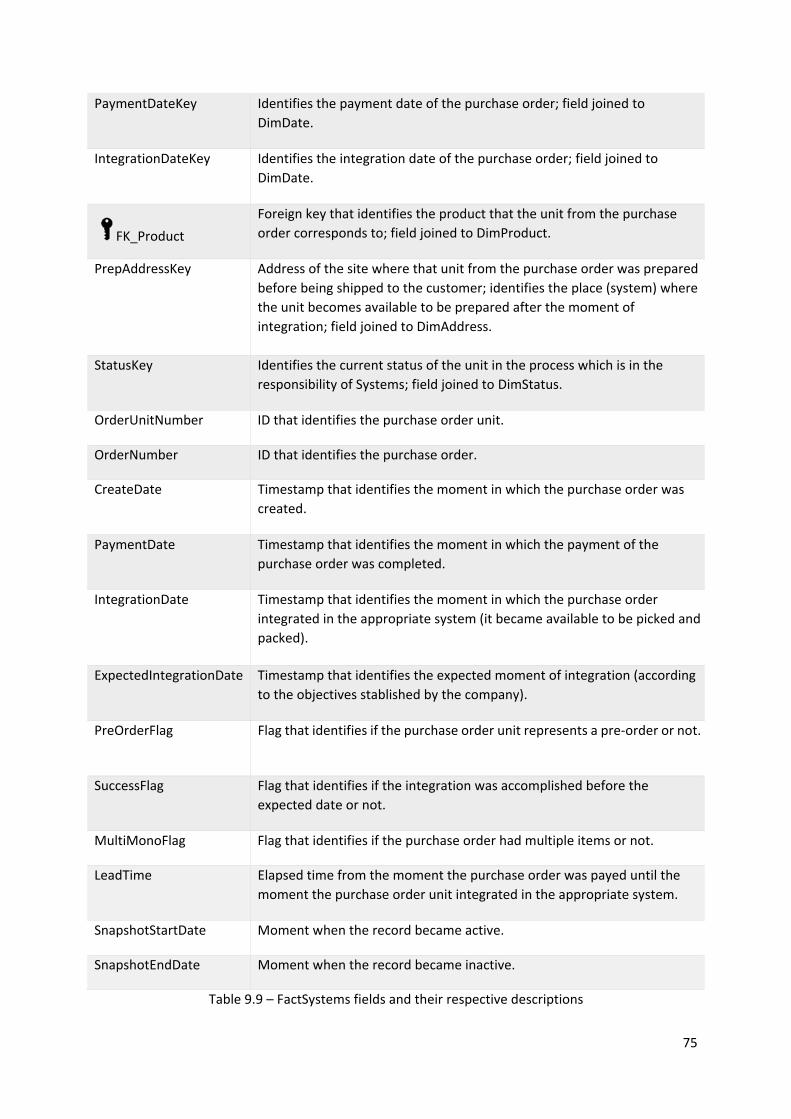
75
PaymentDateKey Identifies the payment date of the purchase order; field joined to
DimDate.
IntegrationDateKey Identifies the integration date of the purchase order; field joined to
DimDate.
FK_Product
Foreign key that identifies the product that the unit from the purchase
order corresponds to; field joined to DimProduct.
PrepAddressKey Address of the site where that unit from the purchase order was prepared
before being shipped to the customer; identifies the place (system) where
the unit becomes available to be prepared after the moment of
integration; field joined to DimAddress.
StatusKey Identifies the current status of the unit in the process which is in the
responsibility of Systems; field joined to DimStatus.
OrderUnitNumber ID that identifies the purchase order unit.
OrderNumber ID that identifies the purchase order.
CreateDate Timestamp that identifies the moment in which the purchase order was
created.
PaymentDate Timestamp that identifies the moment in which the payment of the
purchase order was completed.
IntegrationDate Timestamp that identifies the moment in which the purchase order
integrated in the appropriate system (it became available to be picked and
packed).
ExpectedIntegrationDate Timestamp that identifies the expected moment of integration (according
to the objectives stablished by the company).
PreOrderFlag Flag that identifies if the purchase order unit represents a pre‐order or not.
SuccessFlag Flag that identifies if the integration was accomplished before the
expected date or not.
MultiMonoFlag Flag that identifies if the purchase order had multiple items or not.
LeadTime Elapsed time from the moment the purchase order was payed until the
moment the purchase order unit integrated in the appropriate system.
SnapshotStartDate Moment when the record became active.
SnapshotEndDate Moment when the record became inactive.
Table 9.9 – FactSystems fields and their respective descriptions
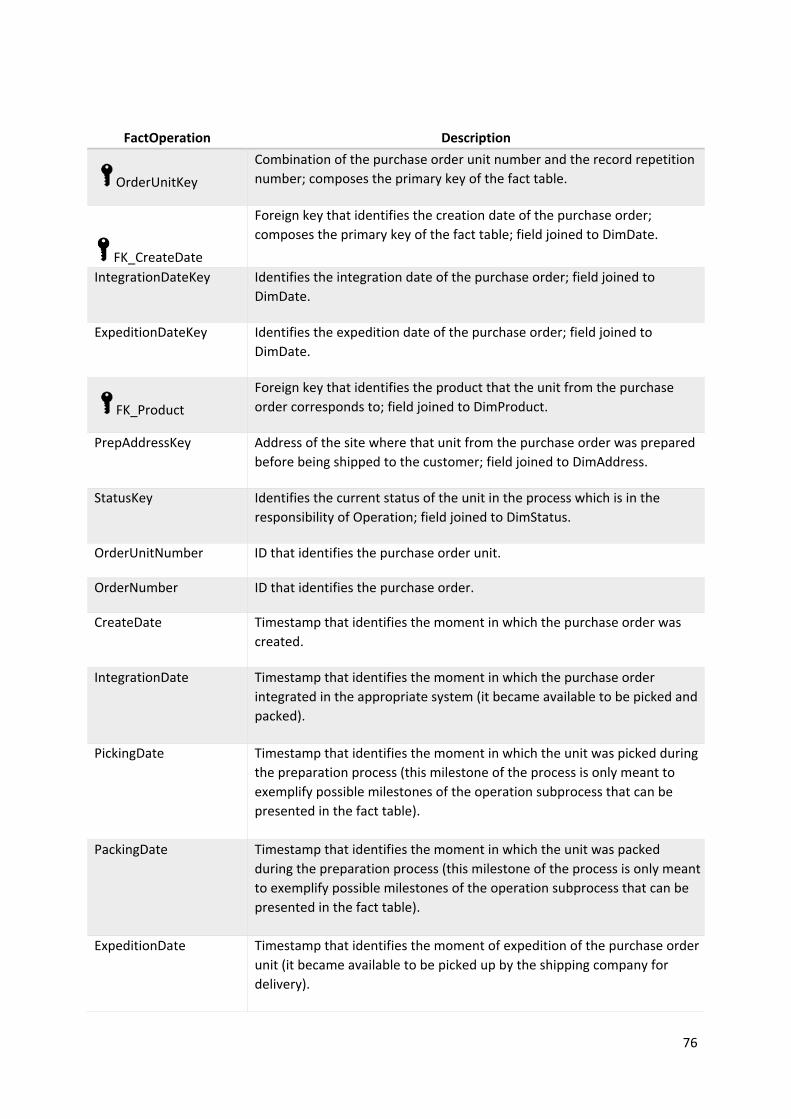
76
FactOperation Description
OrderUnitKey
Combination of the purchase order unit number and the record repetition
number; composes the primary key of the fact table.
FK_CreateDate
Foreign key that identifies the creation date of the purchase order;
composes the primary key of the fact table; field joined to DimDate.
IntegrationDateKey Identifies the integration date of the purchase order; field joined to
DimDate.
ExpeditionDateKey Identifies the expedition date of the purchase order; field joined to
DimDate.
FK_Product
Foreign key that identifies the product that the unit from the purchase
order corresponds to; field joined to DimProduct.
PrepAddressKey Address of the site where that unit from the purchase order was prepared
before being shipped to the customer; field joined to DimAddress.
StatusKey Identifies the current status of the unit in the process which is in the
responsibility of Operation; field joined to DimStatus.
OrderUnitNumber ID that identifies the purchase order unit.
OrderNumber ID that identifies the purchase order.
CreateDate Timestamp that identifies the moment in which the purchase order was
created.
IntegrationDate Timestamp that identifies the moment in which the purchase order
integrated in the appropriate system (it became available to be picked and
packed).
PickingDate Timestamp that identifies the moment in which the unit was picked during
the preparation process (this milestone of the process is only meant to
exemplify possible milestones of the operation subprocess that can be
presented in the fact table).
PackingDate Timestamp that identifies the moment in which the unit was packed
during the preparation process (this milestone of the process is only meant
to exemplify possible milestones of the operation subprocess that can be
presented in the fact table).
ExpeditionDate Timestamp that identifies the moment of expedition of the purchase order
unit (it became available to be picked up by the shipping company for
delivery).
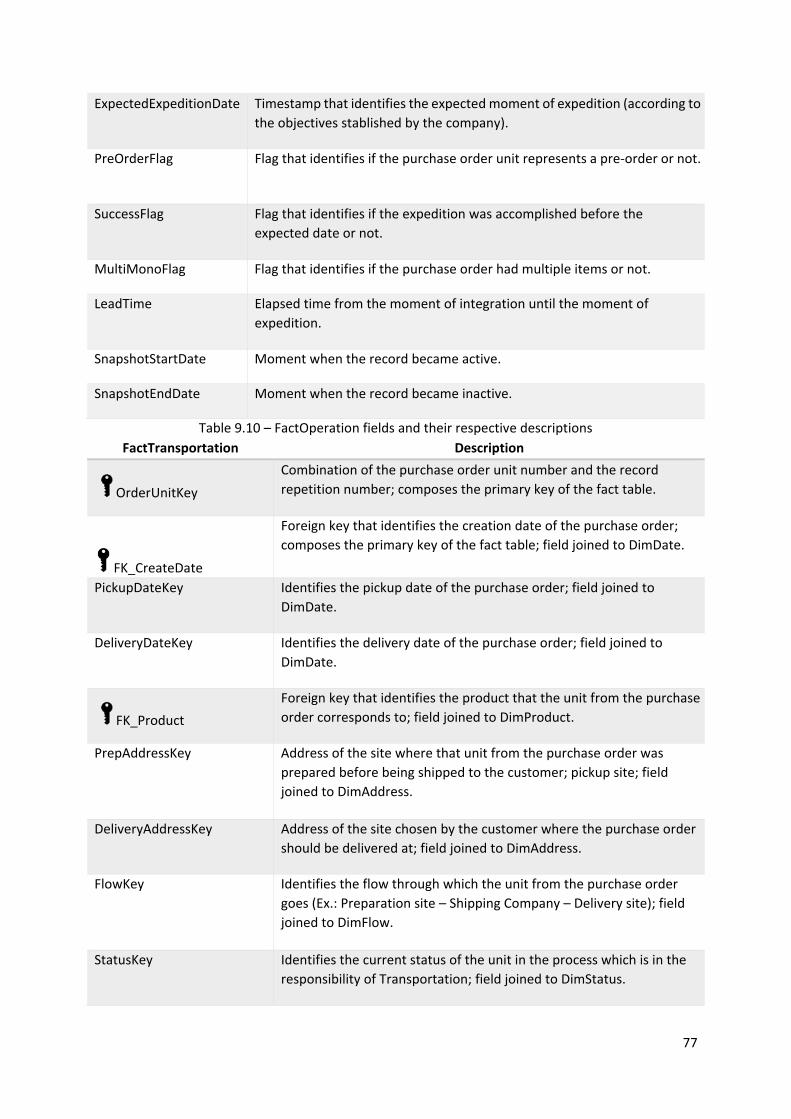
77
ExpectedExpeditionDate Timestamp that identifies the expected moment of expedition (according to
the objectives stablished by the company).
PreOrderFlag Flag that identifies if the purchase order unit represents a pre‐order or not.
SuccessFlag Flag that identifies if the expedition was accomplished before the
expected date or not.
MultiMonoFlag Flag that identifies if the purchase order had multiple items or not.
LeadTime Elapsed time from the moment of integration until the moment of
expedition.
SnapshotStartDate Moment when the record became active.
SnapshotEndDate Moment when the record became inactive.
Table 9.10 – FactOperation fields and their respective descriptions
FactTransportation Description
OrderUnitKey
Combination of the purchase order unit number and the record
repetition number; composes the primary key of the fact table.
FK_CreateDate
Foreign key that identifies the creation date of the purchase order;
composes the primary key of the fact table; field joined to DimDate.
PickupDateKey Identifies the pickup date of the purchase order; field joined to
DimDate.
DeliveryDateKey Identifies the delivery date of the purchase order; field joined to
DimDate.
FK_Product
Foreign key that identifies the product that the unit from the purchase
order corresponds to; field joined to DimProduct.
PrepAddressKey Address of the site where that unit from the purchase order was
prepared before being shipped to the customer; pickup site; field
joined to DimAddress.
DeliveryAddressKey Address of the site chosen by the customer where the purchase order
should be delivered at; field joined to DimAddress.
FlowKey Identifies the flow through which the unit from the purchase order
goes (Ex.: Preparation site – Shipping Company – Delivery site); field
joined to DimFlow.
StatusKey Identifies the current status of the unit in the process which is in the
responsibility of Transportation; field joined to DimStatus.
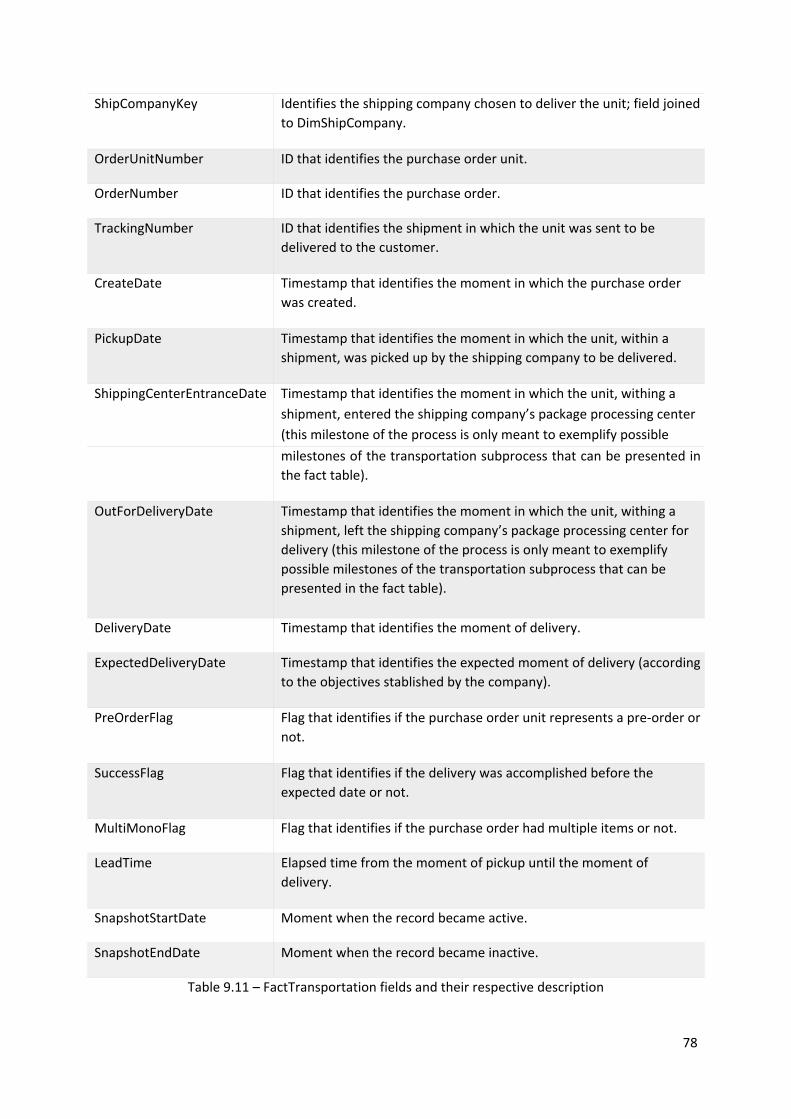
78
ShipCompanyKey Identifies the shipping company chosen to deliver the unit; field joined
to DimShipCompany.
OrderUnitNumber ID that identifies the purchase order unit.
OrderNumber ID that identifies the purchase order.
TrackingNumber ID that identifies the shipment in which the unit was sent to be
delivered to the customer.
CreateDate Timestamp that identifies the moment in which the purchase order
was created.
PickupDate Timestamp that identifies the moment in which the unit, within a
shipment, was picked up by the shipping company to be delivered.
ShippingCenterEntranceDate Timestamp that identifies the moment in which the unit, withing a
shipment, entered the shipping company’s package processing center
(this milestone of the process is only meant to exemplify possible
milestones of the transportation subprocess that can be presented in
the fact table).
OutForDeliveryDate Timestamp that identifies the moment in which the unit, withing a
shipment, left the shipping company’s package processing center for
delivery (this milestone of the process is only meant to exemplify
possible milestones of the transportation subprocess that can be
presented in the fact table).
DeliveryDate Timestamp that identifies the moment of delivery.
ExpectedDeliveryDate Timestamp that identifies the expected moment of delivery (according
to the objectives stablished by the company).
PreOrderFlag Flag that identifies if the purchase order unit represents a pre‐order or
not.
SuccessFlag Flag that identifies if the delivery was accomplished before the
expected date or not.
MultiMonoFlag Flag that identifies if the purchase order had multiple items or not.
LeadTime Elapsed time from the moment of pickup until the moment of
delivery.
SnapshotStartDate Moment when the record became active.
SnapshotEndDate Moment when the record became inactive.
Table 9.11 – FactTransportation fields and their respective description
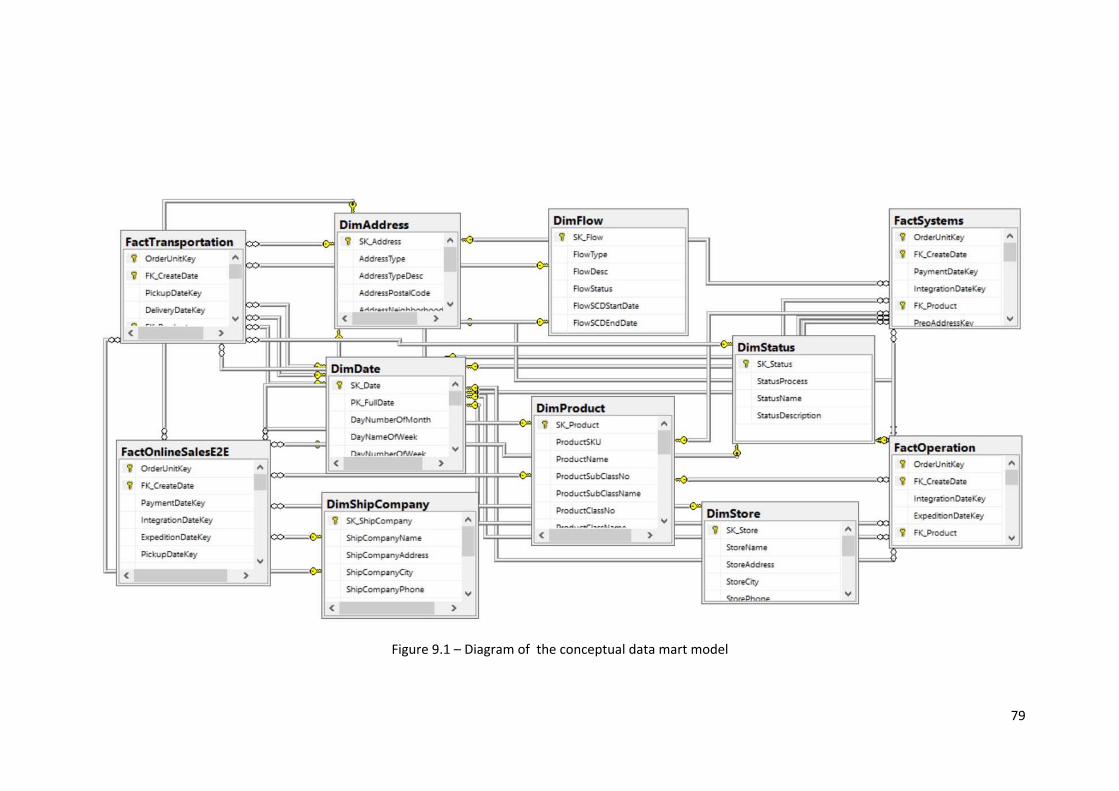
79
Figure 9.1 – Diagram of the conceptual data mart model

80
Figure 9.2– Zoom of the diagram of the data mart model focusing solely on FactSystems and its dimensions
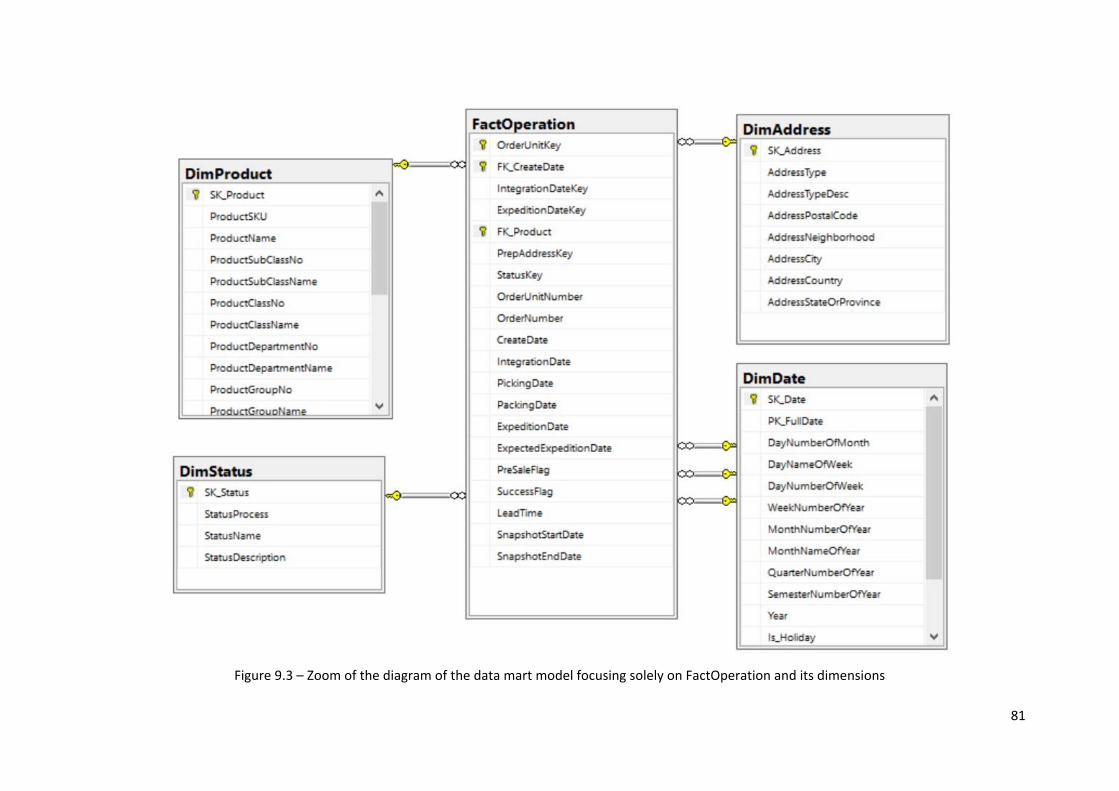
81
Figure 9.3 – Zoom of the diagram of the data mart model focusing solely on FactOperation and its dimensions
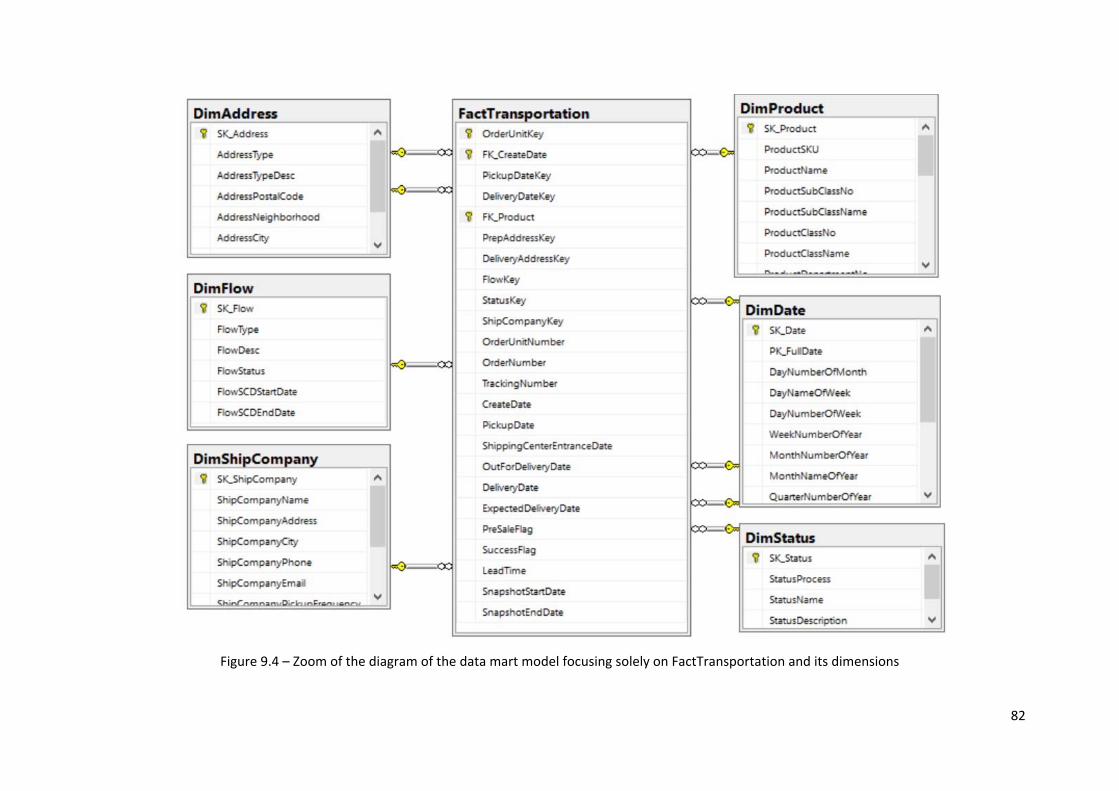
82
Figure 9.4 – Zoom of the diagram of the data mart model focusing solely on FactTransportation and its dimensions
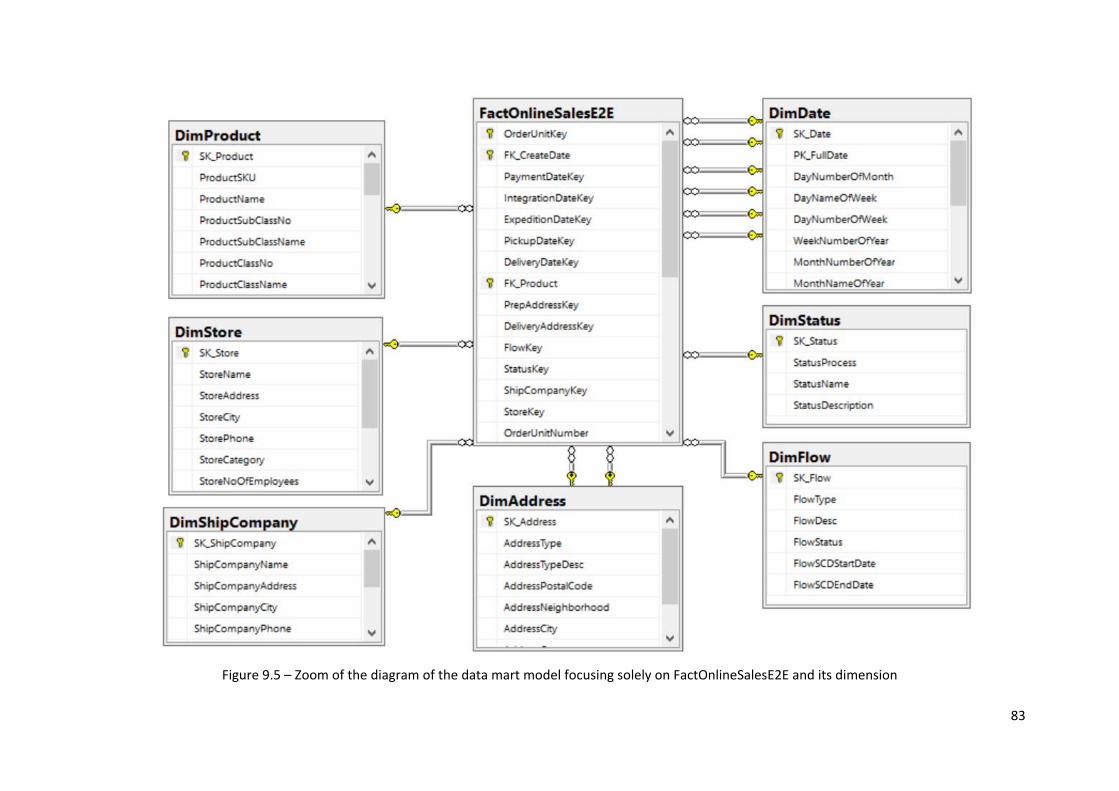
83
Figure 9.5 – Zoom of the diagram of the data mart model focusing solely on FactOnlineSalesE2E and its dimension
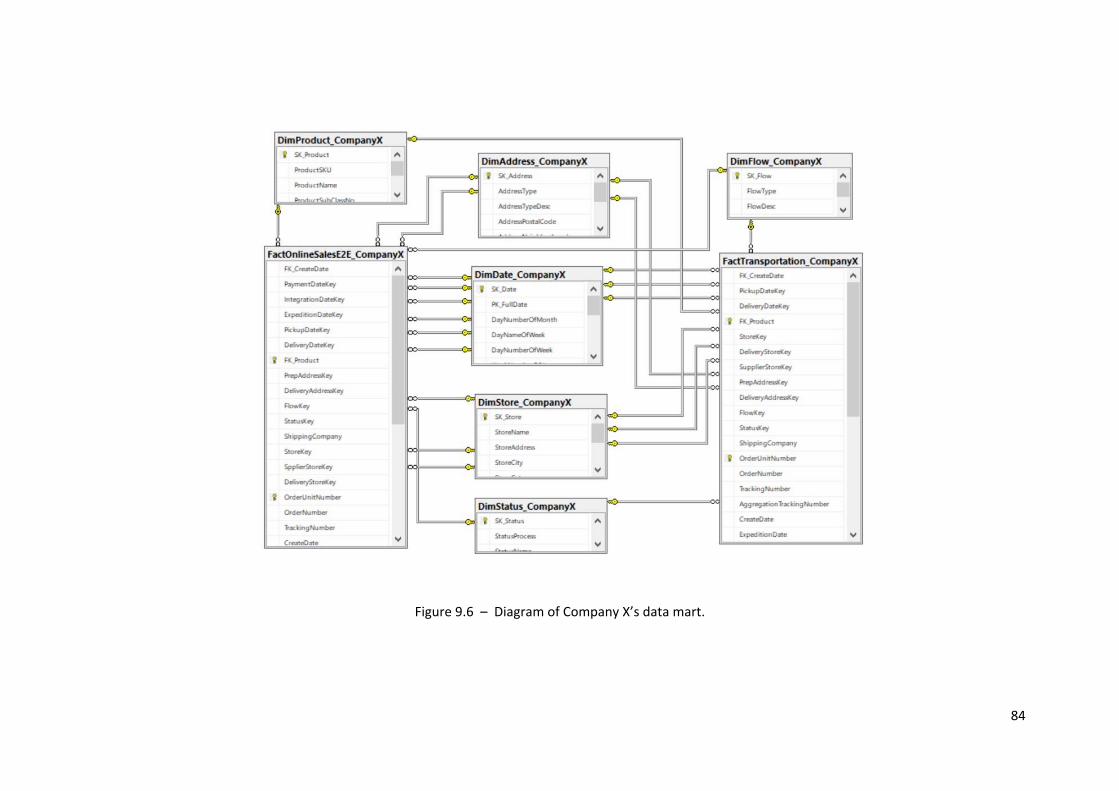
84
Figure 9.6 – Diagram of Company X’s data mart.
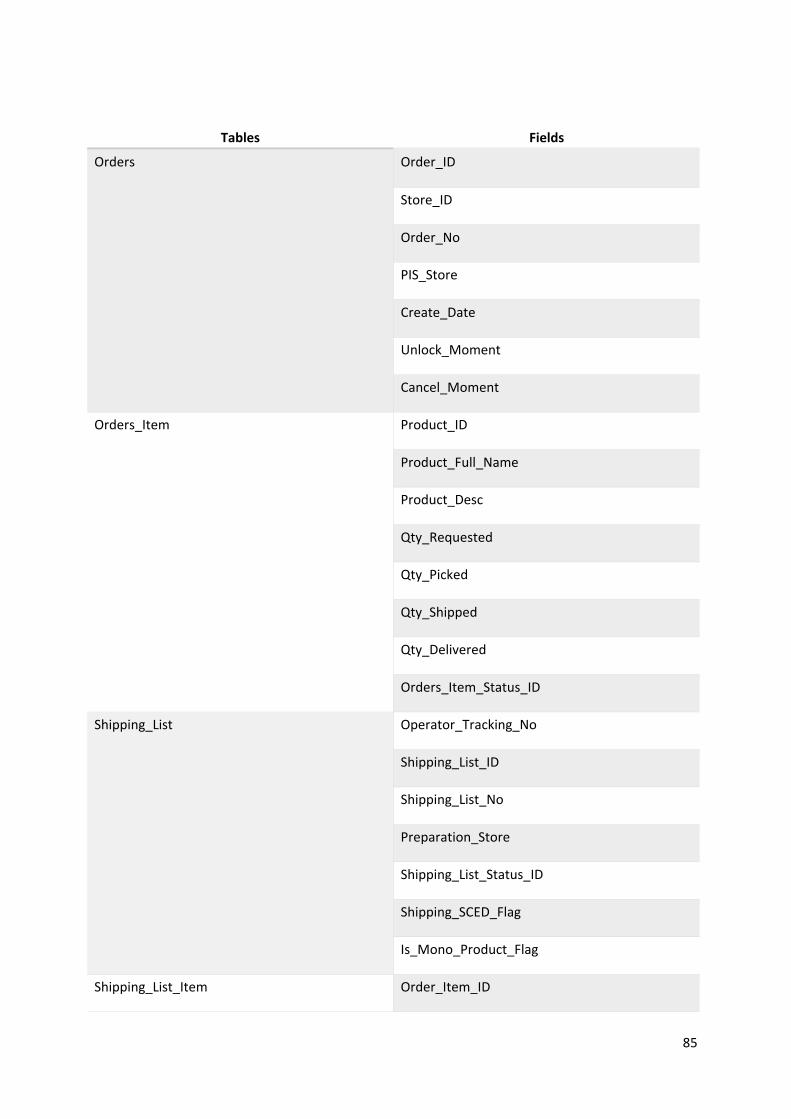
85
Tables Fields
Orders Order_ID
Store_ID
Order_No
PIS_Store
Create_Date
Unlock_Moment
Cancel_Moment
Orders_Item Product_ID
Product_Full_Name
Product_Desc
Qty_Requested
Qty_Picked
Qty_Shipped
Qty_Delivered
Orders_Item_Status_ID
Shipping_List Operator_Tracking_No
Shipping_List_ID
Shipping_List_No
Preparation_Store
Shipping_List_Status_ID
Shipping_SCED_Flag
Is_Mono_Product_Flag
Shipping_List_Item Order_Item_ID
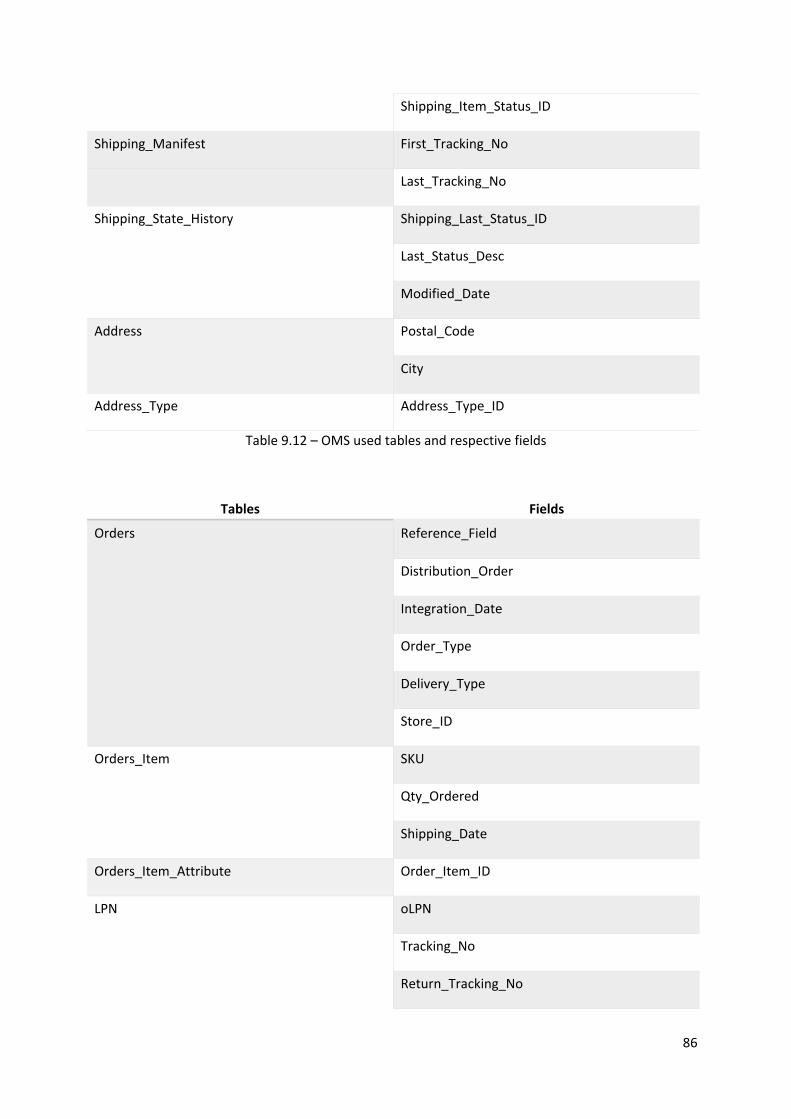
86
Shipping_Item_Status_ID
Shipping_Manifest First_Tracking_No
Last_Tracking_No
Shipping_State_History Shipping_Last_Status_ID
Last_Status_Desc
Modified_Date
Address Postal_Code
City
Address_Type Address_Type_ID
Table 9.12 – OMS used tables and respective fields
Tables Fields
Orders Reference_Field
Distribution_Order
Integration_Date
Order_Type
Delivery_Type
Store_ID
Orders_Item SKU
Qty_Ordered
Shipping_Date
Orders_Item_Attribute Order_Item_ID
LPN oLPN
Tracking_No
Return_Tracking_No
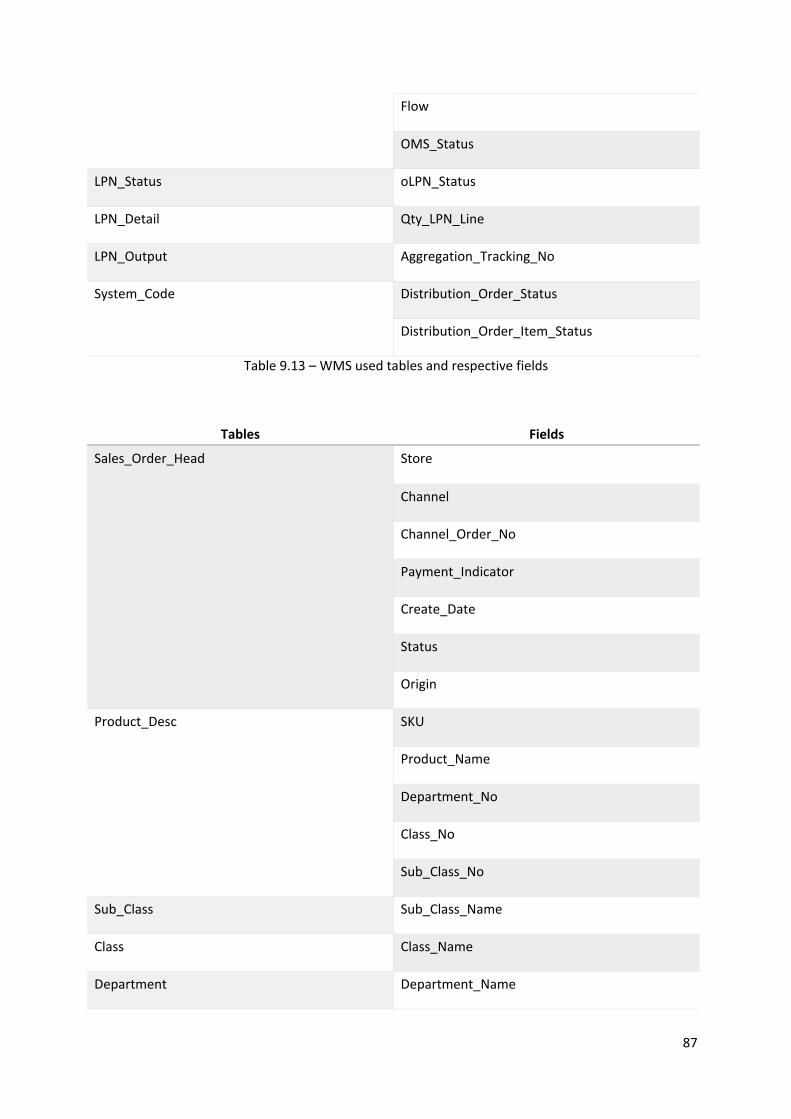
87
Flow
OMS_Status
LPN_Status oLPN_Status
LPN_Detail Qty_LPN_Line
LPN_Output Aggregation_Tracking_No
System_Code Distribution_Order_Status
Distribution_Order_Item_Status
Table 9.13 – WMS used tables and respective fields
Tables Fields
Sales_Order_Head Store
Channel
Channel_Order_No
Payment_Indicator
Create_Date
Status
Origin
Product_Desc SKU
Product_Name
Department_No
Class_No
Sub_Class_No
Sub_Class Sub_Class_Name
Class Class_Name
Department Department_Name
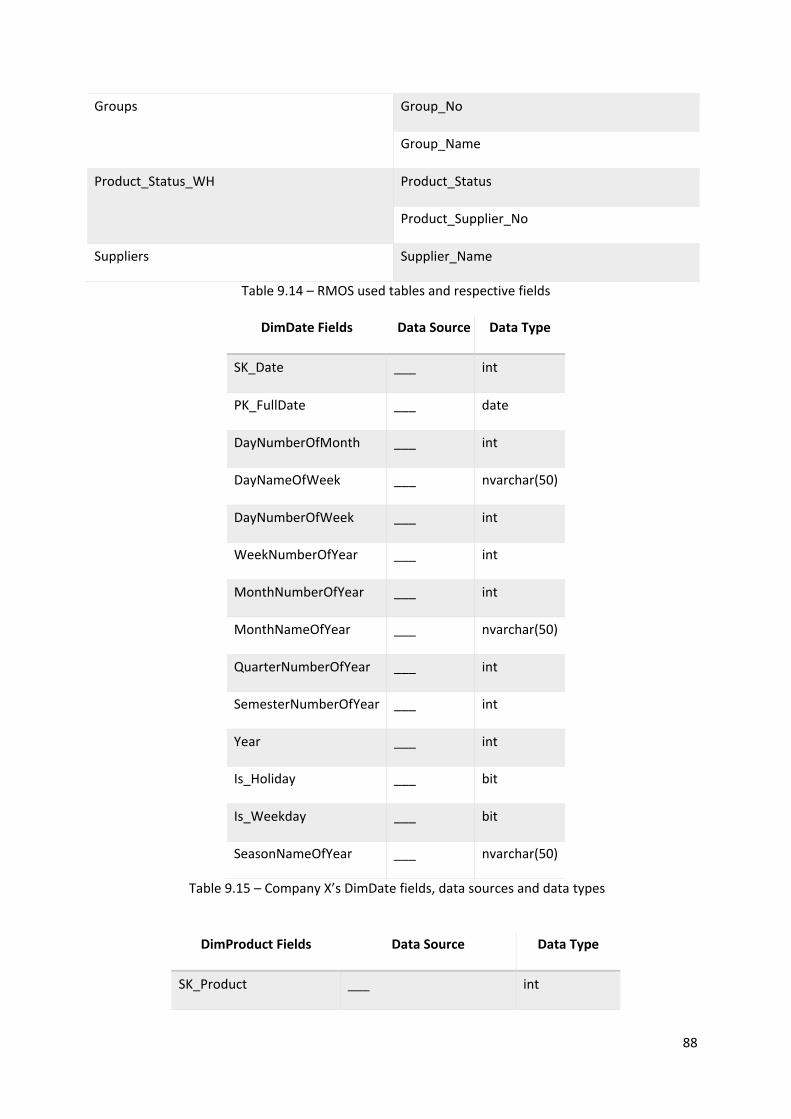
88
Groups Group_No
Group_Name
Product_Status_WH Product_Status
Product_Supplier_No
Suppliers Supplier_Name
Table 9.14 – RMOS used tables and respective fields
DimDate Fields Data Source Data Type
SK_Date ___ int
PK_FullDate ___ date
DayNumberOfMonth ___ int
DayNameOfWeek ___ nvarchar(50)
DayNumberOfWeek ___ int
WeekNumberOfYear ___ int
MonthNumberOfYear ___ int
MonthNameOfYear ___ nvarchar(50)
QuarterNumberOfYear ___ int
SemesterNumberOfYear ___ int
Year ___ int
Is_Holiday ___ bit
Is_Weekday ___ bit
SeasonNameOfYear ___ nvarchar(50)
Table 9.15 – Company X’s DimDate fields, data sources and data types
DimProduct Fields Data Source Data Type
SK_Product ___ int
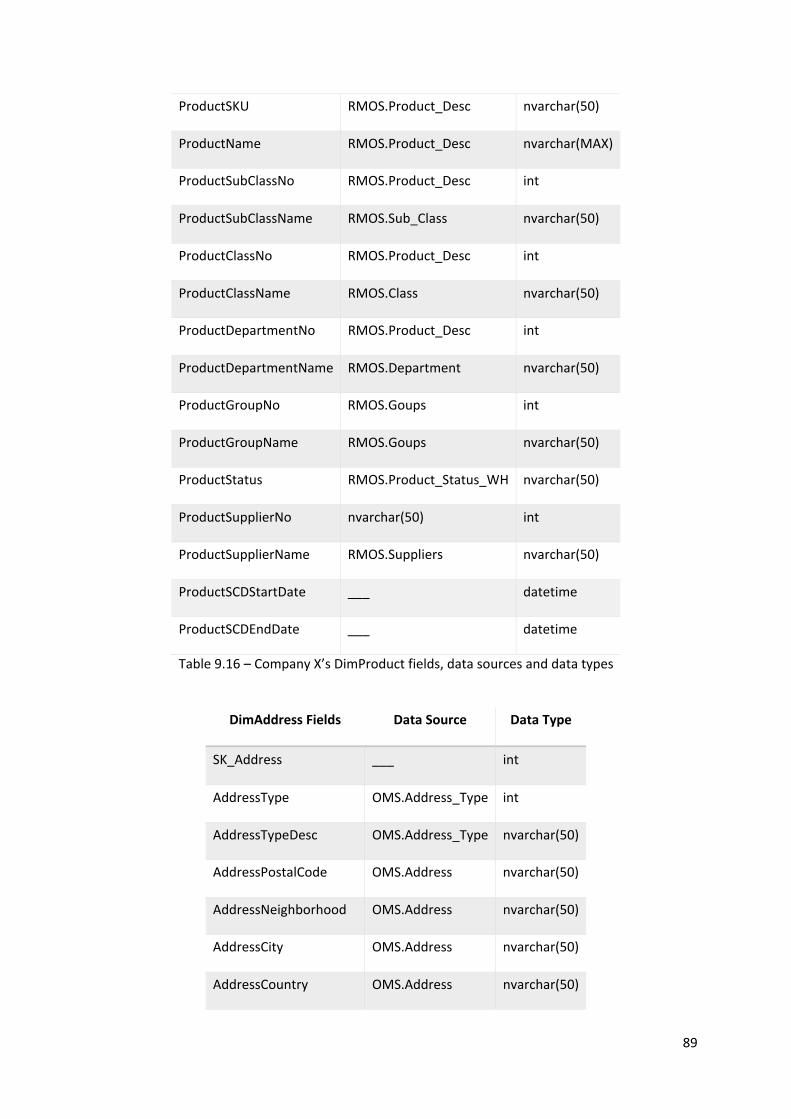
89
ProductSKU RMOS.Product_Desc nvarchar(50)
ProductName RMOS.Product_Desc nvarchar(MAX)
ProductSubClassNo RMOS.Product_Desc int
ProductSubClassName RMOS.Sub_Class nvarchar(50)
ProductClassNo RMOS.Product_Desc int
ProductClassName RMOS.Class nvarchar(50)
ProductDepartmentNo RMOS.Product_Desc int
ProductDepartmentName RMOS.Department nvarchar(50)
ProductGroupNo RMOS.Goups int
ProductGroupName RMOS.Goups nvarchar(50)
ProductStatus RMOS.Product_Status_WH nvarchar(50)
ProductSupplierNo nvarchar(50) int
ProductSupplierName RMOS.Suppliers nvarchar(50)
ProductSCDStartDate ___ datetime
ProductSCDEndDate ___ datetime
Table 9.16 – Company X’s DimProduct fields, data sources and data types
DimAddress Fields Data Source Data Type
SK_Address ___ int
AddressType OMS.Address_Type int
AddressTypeDesc OMS.Address_Type nvarchar(50)
AddressPostalCode OMS.Address nvarchar(50)
AddressNeighborhood OMS.Address nvarchar(50)
AddressCity OMS.Address nvarchar(50)
AddressCountry OMS.Address nvarchar(50)
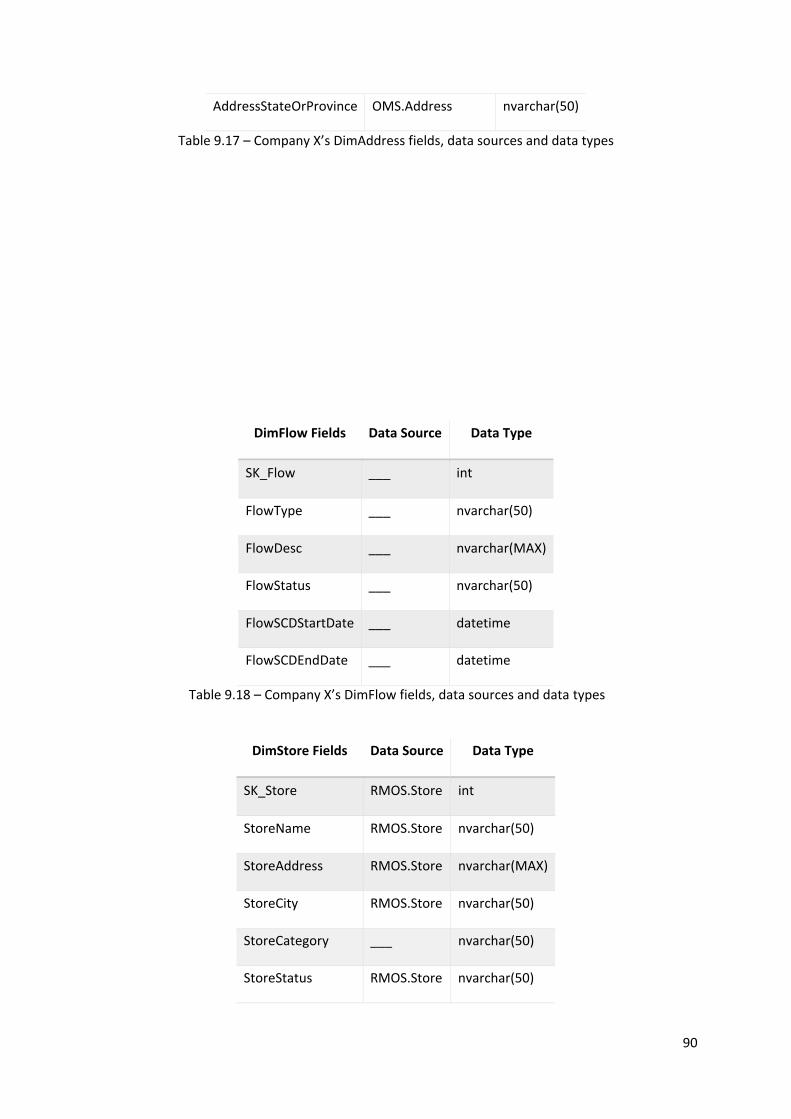
90
AddressStateOrProvince OMS.Address nvarchar(50)
Table 9.17 – Company X’s DimAddress fields, data sources and data types
DimFlow Fields Data Source Data Type
SK_Flow ___ int
FlowType ___ nvarchar(50)
FlowDesc ___ nvarchar(MAX)
FlowStatus ___ nvarchar(50)
FlowSCDStartDate ___ datetime
FlowSCDEndDate ___ datetime
Table 9.18 – Company X’s DimFlow fields, data sources and data types
DimStore Fields Data Source Data Type
SK_Store RMOS.Store int
StoreName RMOS.Store nvarchar(50)
StoreAddress RMOS.Store nvarchar(MAX)
StoreCity RMOS.Store nvarchar(50)
StoreCategory ___ nvarchar(50)
StoreStatus RMOS.Store nvarchar(50)
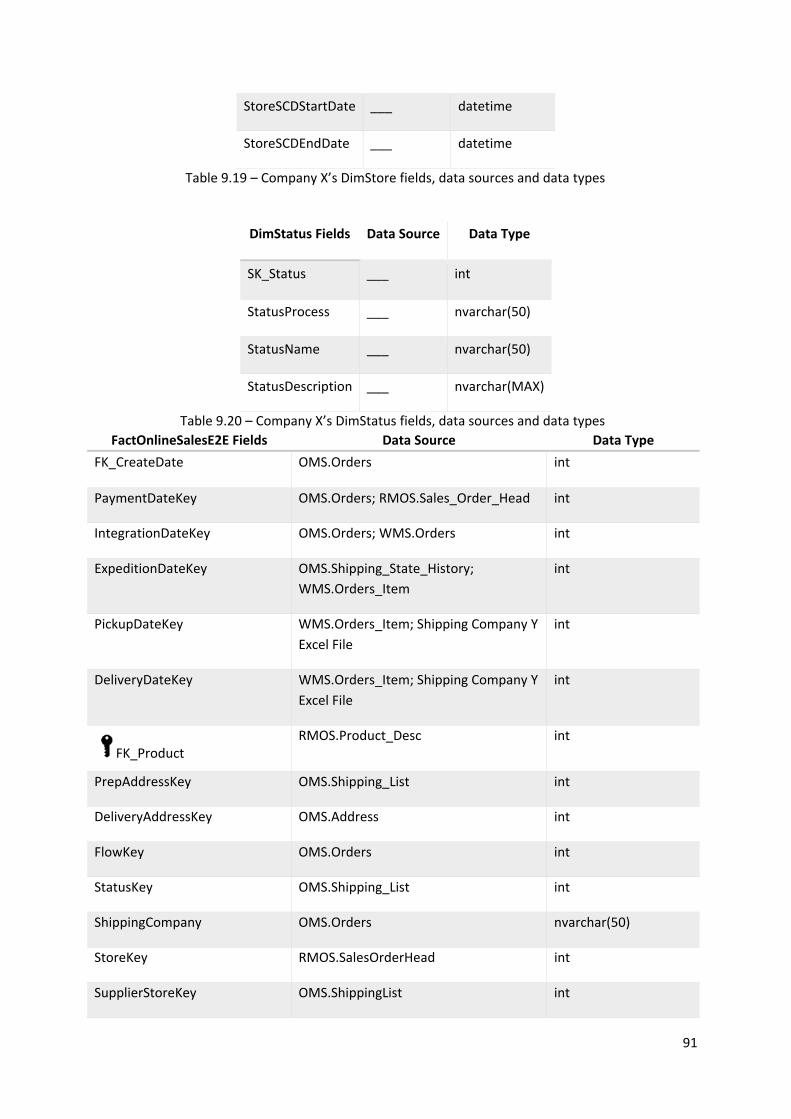
91
StoreSCDStartDate ___ datetime
StoreSCDEndDate ___ datetime
Table 9.19 – Company X’s DimStore fields, data sources and data types
DimStatus Fields Data Source Data Type
SK_Status ___ int
StatusProcess ___ nvarchar(50)
StatusName ___ nvarchar(50)
StatusDescription ___ nvarchar(MAX)
Table 9.20 – Company X’s DimStatus fields, data sources and data types
FactOnlineSalesE2E Fields Data Source Data Type
FK_CreateDate OMS.Orders int
PaymentDateKey OMS.Orders; RMOS.Sales_Order_Head int
IntegrationDateKey OMS.Orders; WMS.Orders int
ExpeditionDateKey OMS.Shipping_State_History;
WMS.Orders_Item
int
PickupDateKey WMS.Orders_Item; Shipping Company Y
Excel File
int
DeliveryDateKey WMS.Orders_Item; Shipping Company Y
Excel File
int
FK_Product RMOS.Product_Desc int
PrepAddressKey OMS.Shipping_List int
DeliveryAddressKey OMS.Address int
FlowKey OMS.Orders int
StatusKey OMS.Shipping_List int
ShippingCompany OMS.Orders nvarchar(50)
StoreKey RMOS.SalesOrderHead int
SupplierStoreKey OMS.ShippingList int
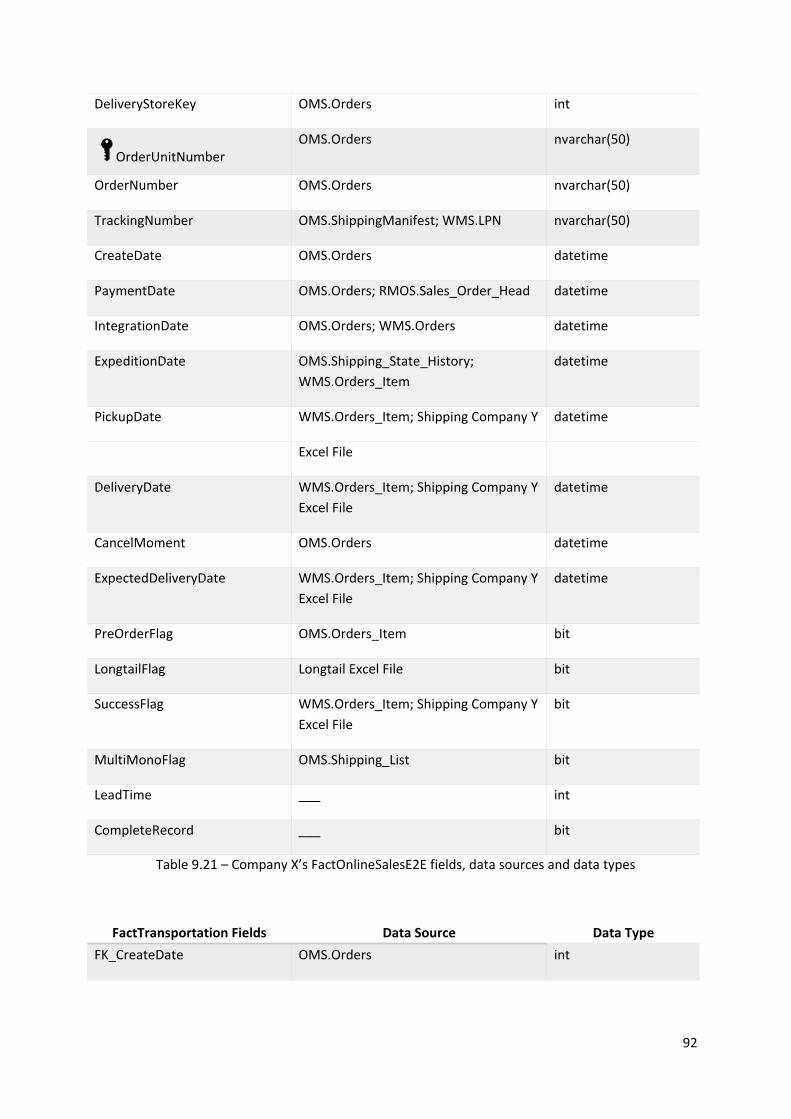
92
DeliveryStoreKey OMS.Orders int
OrderUnitNumber OMS.Orders nvarchar(50)
OrderNumber OMS.Orders nvarchar(50)
TrackingNumber OMS.ShippingManifest; WMS.LPN nvarchar(50)
CreateDate OMS.Orders datetime
PaymentDate OMS.Orders; RMOS.Sales_Order_Head datetime
IntegrationDate OMS.Orders; WMS.Orders datetime
ExpeditionDate OMS.Shipping_State_History;
WMS.Orders_Item
datetime
PickupDate WMS.Orders_Item; Shipping Company Y datetime
Excel File
DeliveryDate WMS.Orders_Item; Shipping Company Y
Excel File
datetime
CancelMoment OMS.Orders datetime
ExpectedDeliveryDate WMS.Orders_Item; Shipping Company Y
Excel File
datetime
PreOrderFlag OMS.Orders_Item bit
LongtailFlag Longtail Excel File bit
SuccessFlag WMS.Orders_Item; Shipping Company Y
Excel File
bit
MultiMonoFlag OMS.Shipping_List bit
LeadTime ___ int
CompleteRecord ___ bit
Table 9.21 – Company X’s FactOnlineSalesE2E fields, data sources and data types
FactTransportation Fields Data Source Data Type
FK_CreateDate OMS.Orders int
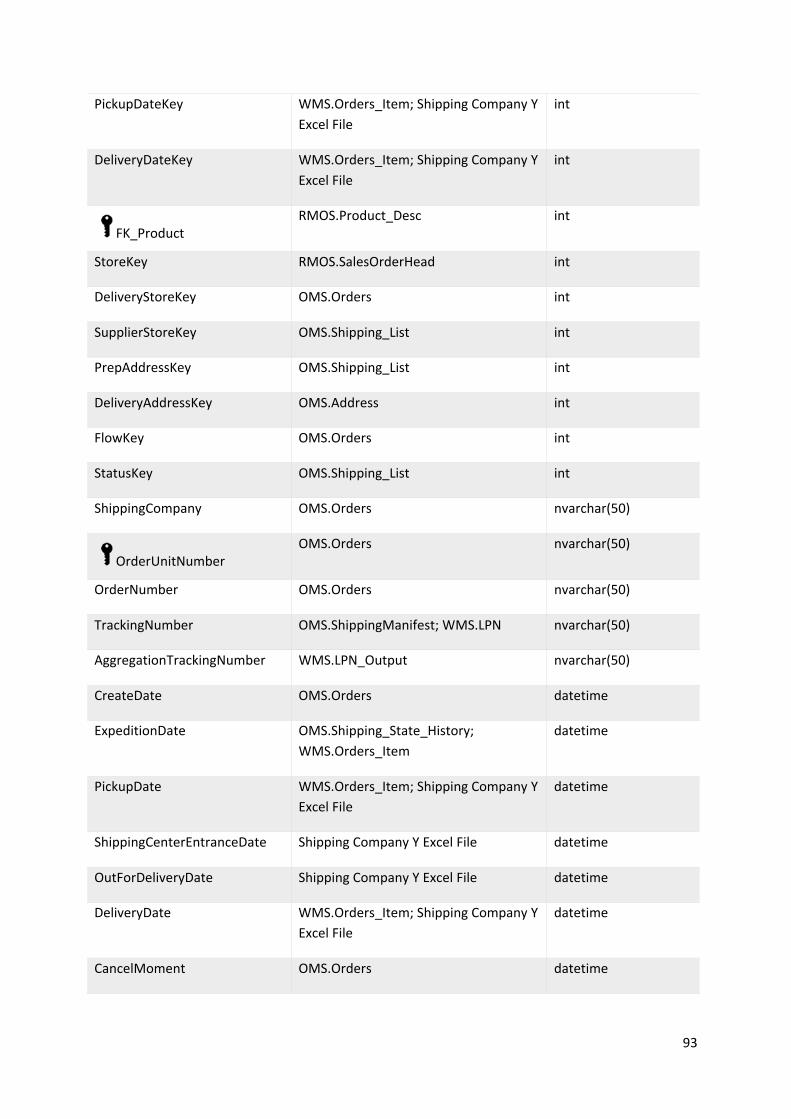
93
PickupDateKey WMS.Orders_Item; Shipping Company Y
Excel File
int
DeliveryDateKey WMS.Orders_Item; Shipping Company Y
Excel File
int
FK_Product RMOS.Product_Desc int
StoreKey RMOS.SalesOrderHead int
DeliveryStoreKey OMS.Orders int
SupplierStoreKey OMS.Shipping_List int
PrepAddressKey OMS.Shipping_List int
DeliveryAddressKey OMS.Address int
FlowKey OMS.Orders int
StatusKey OMS.Shipping_List int
ShippingCompany OMS.Orders nvarchar(50)
OrderUnitNumber OMS.Orders nvarchar(50)
OrderNumber OMS.Orders nvarchar(50)
TrackingNumber OMS.ShippingManifest; WMS.LPN nvarchar(50)
AggregationTrackingNumber WMS.LPN_Output nvarchar(50)
CreateDate OMS.Orders datetime
ExpeditionDate OMS.Shipping_State_History;
WMS.Orders_Item
datetime
PickupDate WMS.Orders_Item; Shipping Company Y
Excel File
datetime
ShippingCenterEntranceDate Shipping Company Y Excel File datetime
OutForDeliveryDate Shipping Company Y Excel File datetime
DeliveryDate WMS.Orders_Item; Shipping Company Y
Excel File
datetime
CancelMoment OMS.Orders datetime
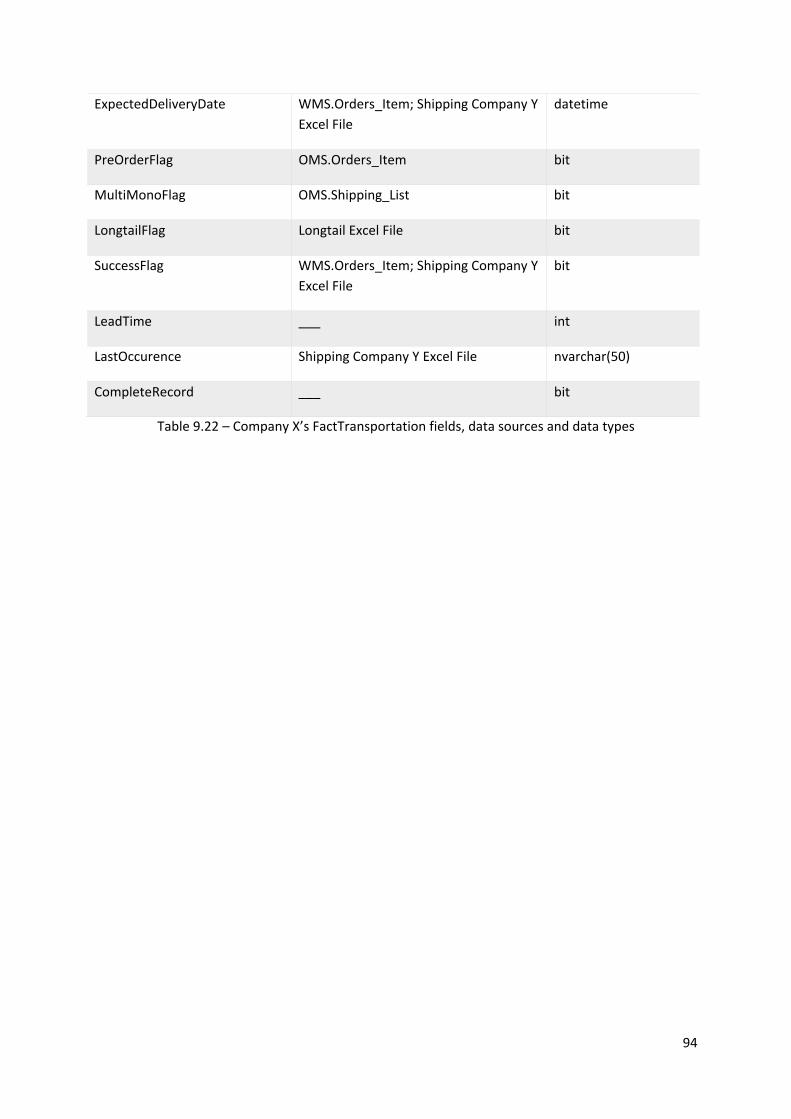
94
ExpectedDeliveryDate WMS.Orders_Item; Shipping Company Y
Excel File
datetime
PreOrderFlag OMS.Orders_Item bit
MultiMonoFlag OMS.Shipping_List bit
LongtailFlag Longtail Excel File bit
SuccessFlag WMS.Orders_Item; Shipping Company Y
Excel File
bit
LeadTime ___ int
LastOccurence Shipping Company Y Excel File nvarchar(50)
CompleteRecord ___ bit
Table 9.22 – Company X’s FactTransportation fields, data sources and data types
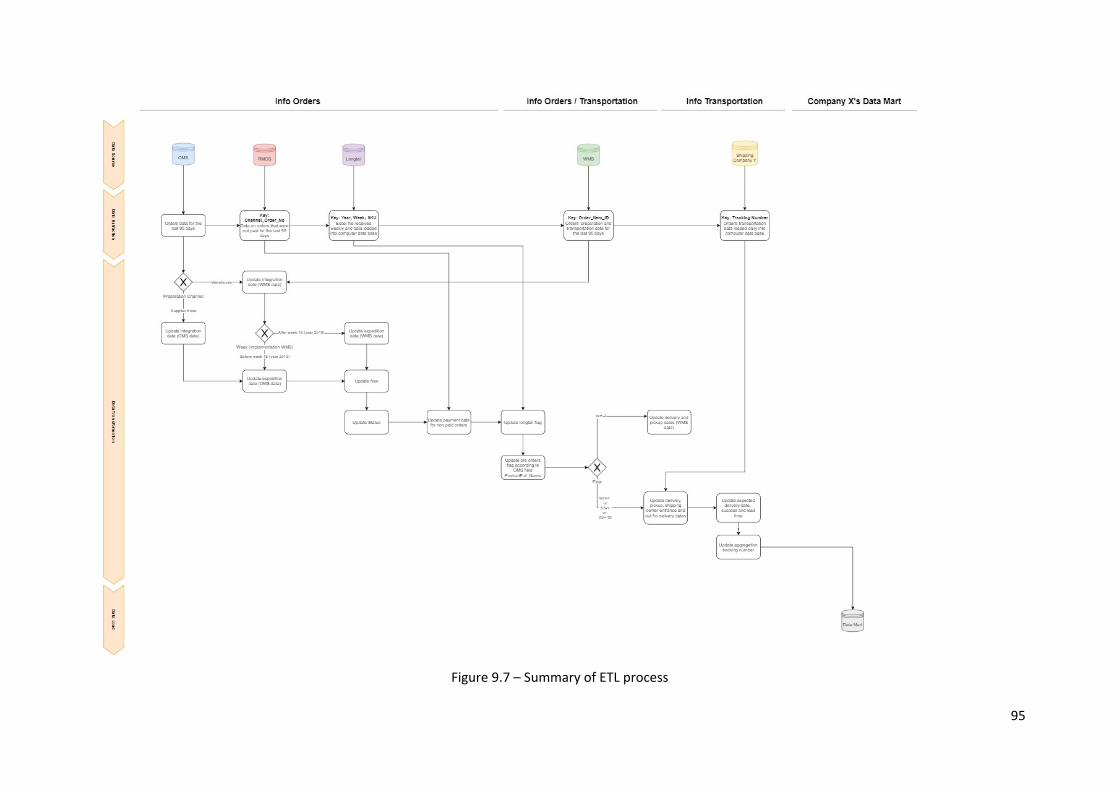
95
Figure 9.7 – Summary of ETL process
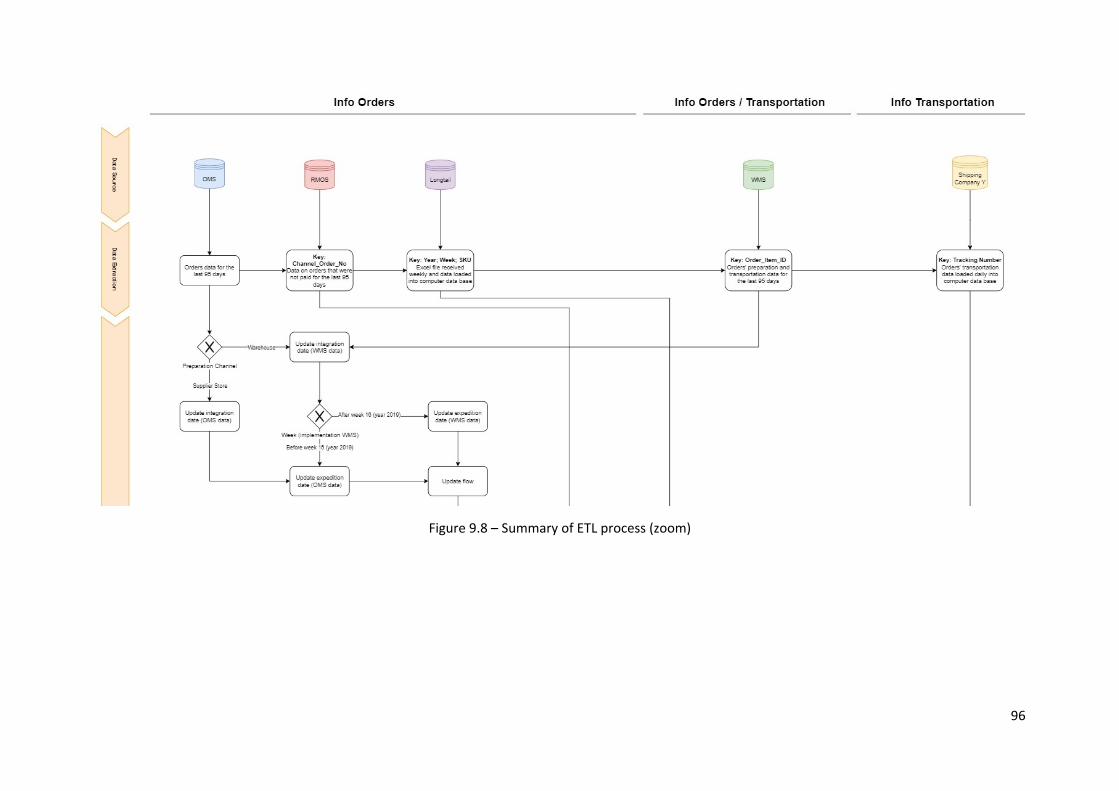
96
Figure 9.8 – Summary of ETL process (zoom)
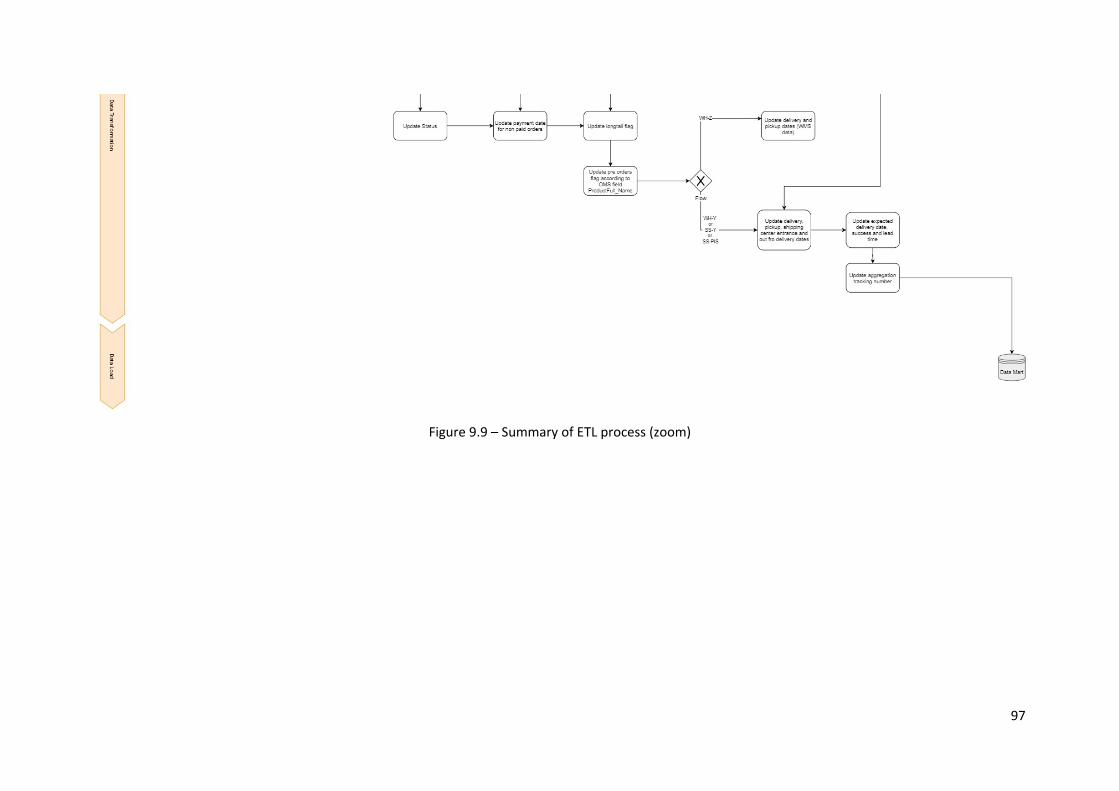
97
Figure 9.9 – Summary of ETL process (zoom)

Page | i