Embed Size (px)
Citation preview
Supply Chain Basics
Supply Chain Management
Fall, 2004
Dr. Lu
Note 2

Outline
• The supply chain processes – Cycle view and pull push view
• Service metrics– Average lead time, fill rate
• Performance drivers– Inventory, transportation, information and facility
• Basic facts and their implications in SCM– Economy of scale, risk pooling and information
principle
• Introduction to the beer game

SCM Is Hot
• The competition becomes between a supply chain to another chain
• The Increased complexity of supply chain– Emergence of global supply chain– More demanding customers– Shorter production lifecycles– Outsourcing, decentralized control and more…
• Feasibilities– radical improvement in information technology and
communication capabilities
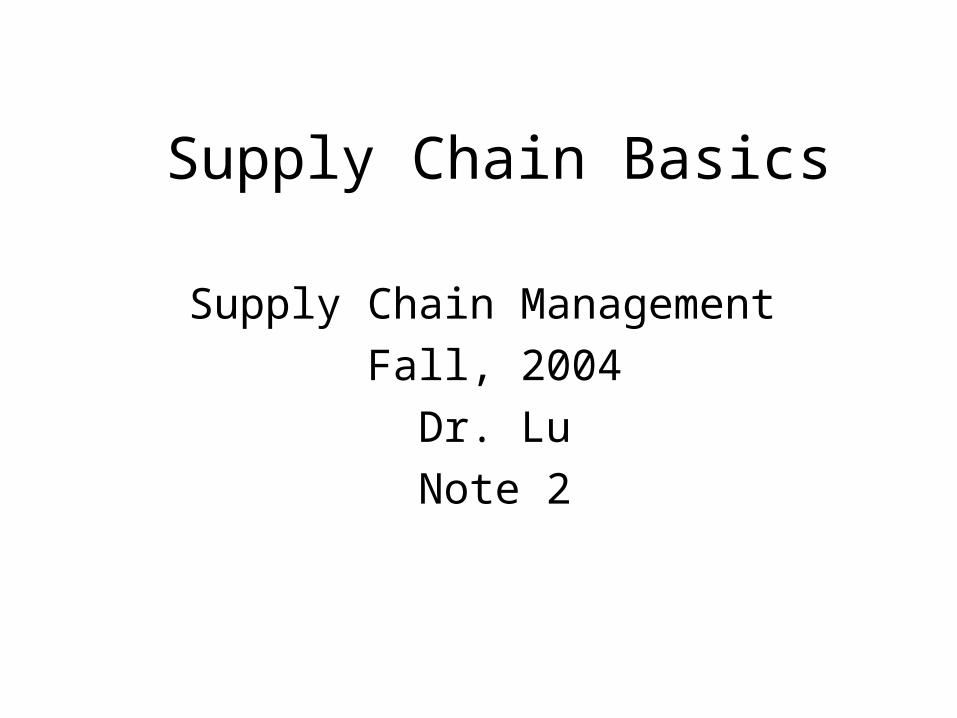
Cycle View of Supply Chain Processes
Customer Order Cycle
Replenishment Cycle
Manufacturing Cycle
Procurement Cycle
Customer
Retailer
Distributor
Manufacturer
Supplier

Customer order cycle
• Customer arrival
• Customer order entry
• Customer order fulfillment
• Customer order receiving
Replenishment cycle
• Retail order trigger
• Retail order entry
• Retail order fulfillment
• Retail order receiving

Manufacturing cycle
• Order arrival from the distributor, retailer, or customer
• Production scheduling
• Manufacturing and shipping
• Receiving at the distributor, retailer, or customer

Push/Pull View of Supply Chains
Procurement,Manufacturing and
Replenishment cycles
PUSH PROCESSES
Customer OrderCycle
PULL PROCESSES
CustomerOrder Arrives
Supply Chain Service Metrics
• Average lead time• Percentage of demand met immediately from sto
ck (fill rate)• Percentage of orders filled within a prespecified t
ime window• Percentage of orders filled correctly

Supply Chain Cost
• Ordering/transaction costs– Ordering processing equipment, labor
• Inventory costs– Capital, obsolescence, insurance, storage
• Transportation– Truck, airfreight, shipping, labor
• Facilities– Warehouses, retail space
• Taxes and tariffs
Drivers of Supply Chain Performance
• Inventory• Facility• Transportation • Information

Inventory• Inventory is the raw materials, work in process
and the finished products within a supply chain• Provides good service to the customer
– The higher inventory means higher fill rate
• Helps to take advantages of economies of scale in production and distribution– Inventory can be used as a tool to reduce cost
• It incur cost– Cost of space, equipment, labor– Cost of insurance, tax– Cost of perished, damaged goods– Cost of obsolescence– Cost of capital

Inventory the Evil

Nordstrom
• Target high-end customer– They are willing to pay premium price for high
service level
• Stock high inventory to provide high service level– High inventory cost can be justified by the
high price
Transportation
• Transportation moves the products from one stage to another stage
• Modes of transportation– Air, truck, Rail, Pipeline, Electronic transportation
• In house or outsource the transportation– Outsource usually can reduce cost, however,
flexibility is restrict
• Overall trade-off– Responsiveness or efficiency

Facilities
• Facilities is where of the inventory are stored and transported to and from
• Decision about facilities– Location– Capacity
• Overall trade-off– Responsiveness and efficiency
Information
• Information is critical in today’s SCM• Coordination needs the information
sharing– The demand information, status of inventory,
status of the supply…
• Good decision need to be based on the good information– Forecast need to be based on good
information

Major Tradeoffs in Decision Making
• Inventory costs vs. transportation– Frequent shipments are expensive, but reduce
inventory
• Inventory vs. service level– More inventory provides better service, but is more
costly
• Inventory vs. information– Better information (more accurate demand forecast
and more reliable supplier deliveries) reduces inventory, but requires efforts and investments

Challenges• Future is always uncertain
– Demand uncertainty– Supply variability
• The existence lead times worsen the situation– Transportation from one location to another– Production time– Order processing time
• While inventory can serve as a buffer to cope with the above difficulties, it is costly– Opportunity cost of capital– Maintenance, obsolescence, etc.
• Different players with different objectives

Obstacles
• Increasing variety of product
• Decreasing product cycle
• Customer is more demanding
• Globalization

SCM Tactics for the Challenge• Future is always uncertain
– demand forecasting – mechanism to reduce the variability of the demand at
some cost
• The existence lead times worsen the situation– Information technology, e-business
• While inventory can serve as a buffer to cope with the above difficulties, it is costly– Inventory management
• Different players with different objectives– Supply chain coordination

Basic Facts (1)
• There exists fixed costs– Production set-up, facility
construction/equipment purchasing, transportation cost
• Fixed costs implies economies of scale– Order more will reduce the average fixed cost
per item
Economies of Scale• When there is fixed cost in producing or
purchasing, the more one produces or purchases, the less the per unit cost will be
• Implications for SCM– A central warehouse realizes economies of scale in
consolidated purchasing– Fewer large warehouses leads to lower total overhead
cost relative to many smaller warehouse– Outsource activities that are not core competence of
economy and utilize someone else’s economy of scale

Basic Facts (2)
• There exists variation and hence risk– Demand, processes
• Variation degrades system performance and there exists an effect of risk pooling– When variation reduces, with same cost, the
service level can be improved
Risk Pooling
• Demand variability is reduced if one aggregates demand across locations because it is more likely that high demand from one customer can be offset by low demand from another customer
• We also call it “the square root effect”– Let D=D1+D2+…+Dn, where Di is the demand in locati
on i, when Di are independent and var(Di)=σ2, then var(D)=nσ2
Implication of Risk Pooling in SCM
• Centralized inventory enjoys the risk pooling effect and therefore requires less investment– This is another reason why we see central warehouse
s
• Delaying product differentiation reduces the inventory of common components and/or standardized semi-productions – Since it pools the risk of demand fore different product
s– Postpone, Dell’s ATO system
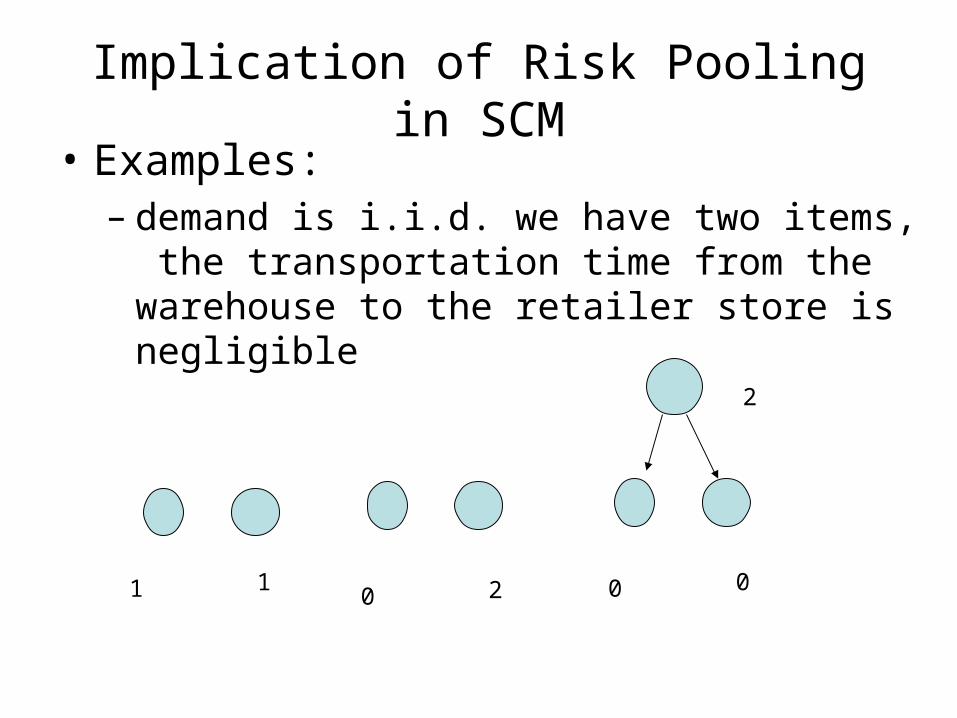
Implication of Risk Pooling in SCM• Examples:
– demand is i.i.d. we have two items, the transportation time from the warehouse to the retailer store is negligible
1 10 2 0 0
2
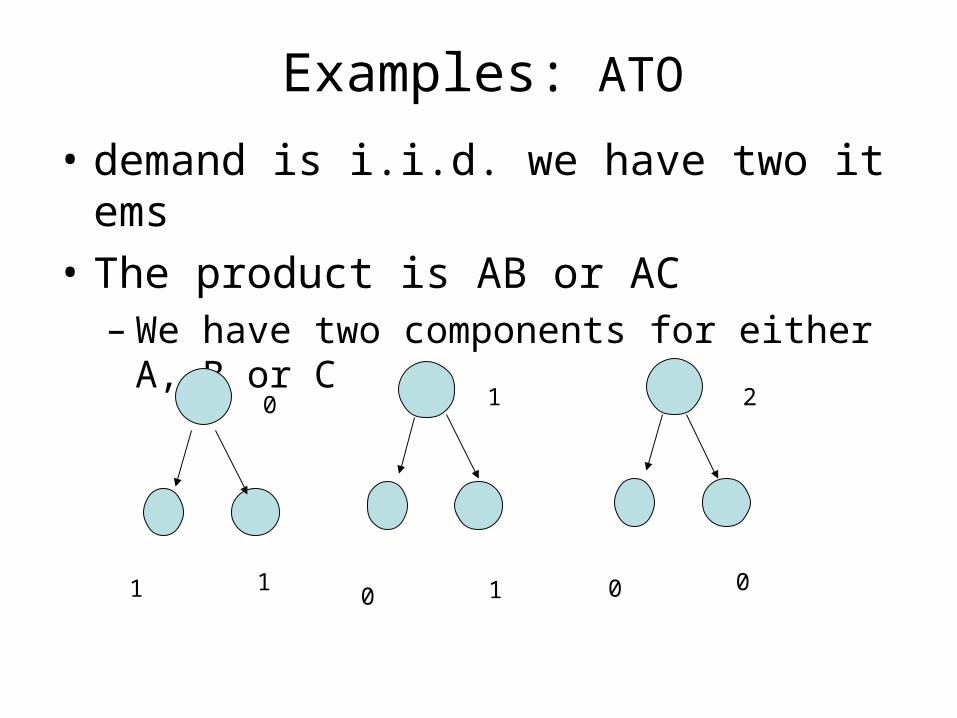
Examples: ATO
• demand is i.i.d. we have two items
• The product is AB or AC– We have two components for either A, B or C
1 1
0
0 1 0 0
1 2

Basic Facts (3)
• Information accumulates over time– Observe demand, quality, etc.
• More information helps make better decisions
Information• Uncertainty is largely due to lack of information, so more i
nformation helps to increases the predictability of the environment and therefore helps to make better decision
• Implication in the SCM– A central warehouse in effect delays the inventory allocation deci
sion to a later point, at which better allocations can be made using more accurate estimation of the local demand and the stock levels in each stores
– Delayed customization utilizes this fact too– Centralized decisions are better than the local decisions: VMI is a
n implication of this idea; Inventive schemes should be created so that to induce an decentralized system to act like a centralized system: coordination

Implication of Information
• The magic of relocating– Demand is i.i.d.
10 10 10 10
10 10
20
-20 10 -20 10
10 10
10 10
-20 10
===
Re-allocate
Purpose
• Experience first hand the flow of materials through a distribution system.
• Understand what is happening in each stage• Understand the information distortion
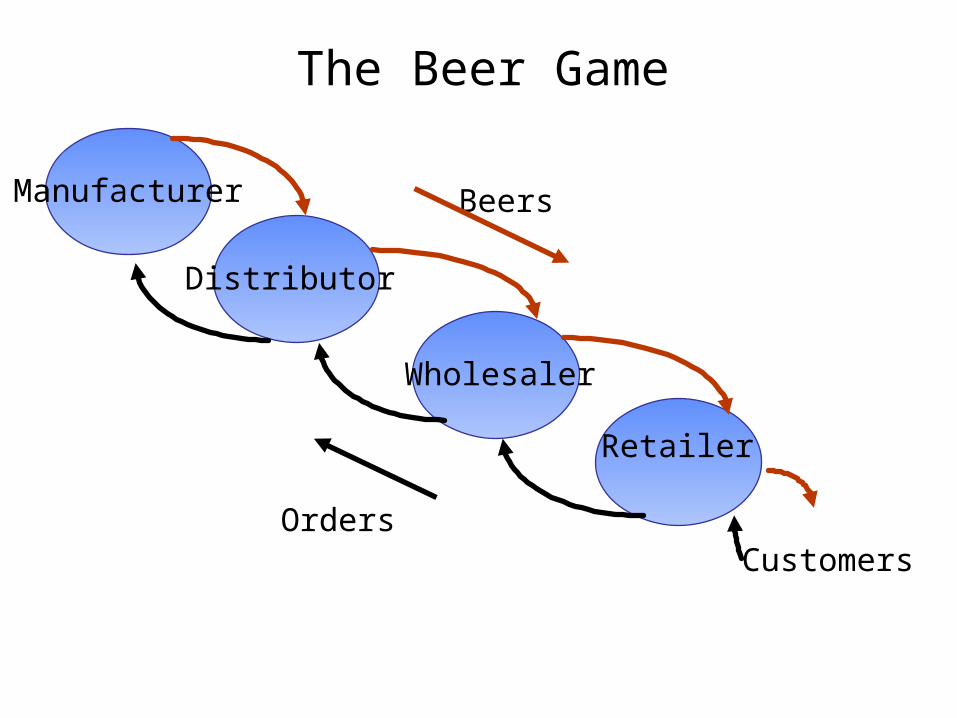
The Beer Game
Customers
Manufacturer
Distributor
Wholesaler
Retailer
Beers
Orders
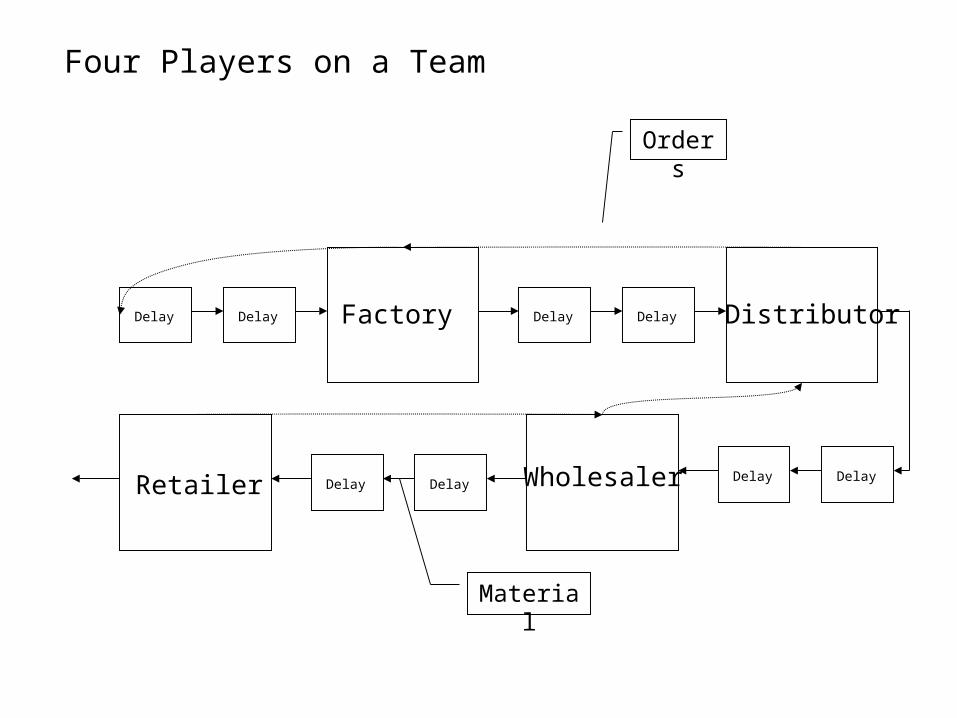
Delay Delay Factory Delay Delay Distributor
Delay DelayWholesalerDelay DelayRetailer
Orders
Material
Four Players on a Team

Beer Game
• Four players without communication• Event sequence in each stage:
– Receives Beer (after Shipping Delay)– Receives Orders from Downstream– Ships Beer Downstream to meet Orders– Orders Beer from Upstream (the only decision)
Distributor
Wholesaler RetailerManufacturer

Parameters
• Unsatisfied demand is fully backlogged (all demand is to be satisfied)
• No capacity constraints• Parameters
– Ordering lead time is two weeks for each stage– Inventory cost/week is $1.00– Backlog cost/week is $2.00
• Objective function: Minimize Total Supply Chain Cost– Total Cost = Sum of Costs at all four Stages
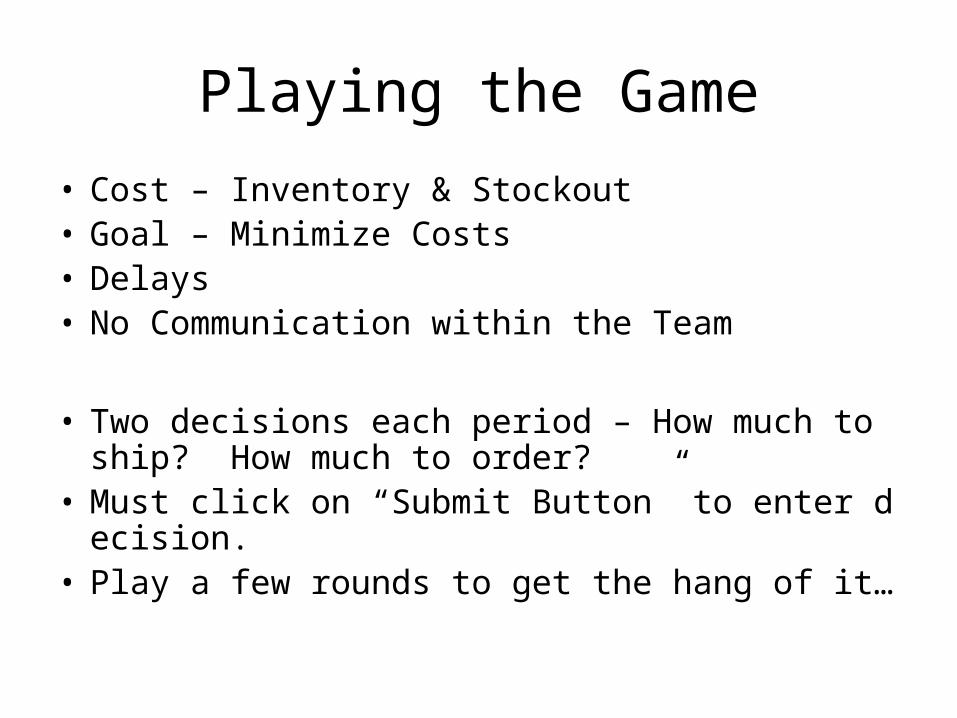
Playing the Game
• Cost – Inventory & Stockout• Goal – Minimize Costs• Delays• No Communication within the Team
• Two decisions each period – How much to ship? How much to order?
• Must click on “Submit Button” to enter decision.• Play a few rounds to get the hang of it…

Game Tasks
• Plot your Weekly Orders
• Plot your Inventory and Backlog
• Plot your Guess on Consumer Demand Pattern
• Calculate Total Cost at your Stage
• Sum Costs over all Four Stages
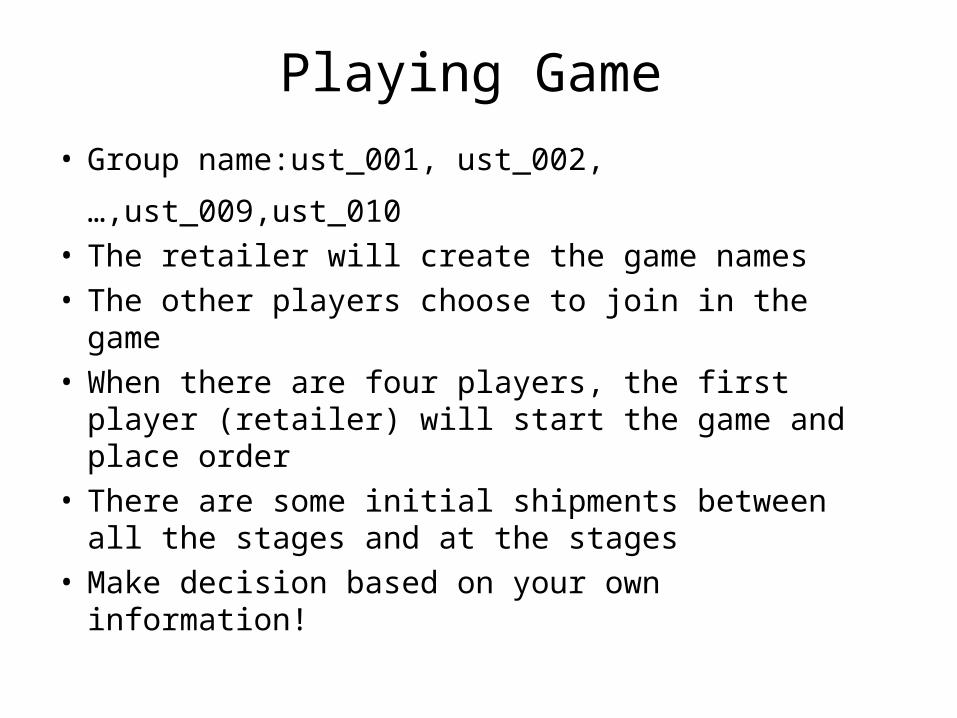
Playing Game
• Group name:ust_001, ust_002,…,ust_009,ust_010
• The retailer will create the game names• The other players choose to join in the game• When there are four players, the first player
(retailer) will start the game and place order• There are some initial shipments between all the
stages and at the stages• Make decision based on your own information!

How to Start the Game
• Go to the website:– http://www.masystem.com/beergame
• Choose Start or Join– The retailer choose start and the other players choose
join – Choose your role: the first player choose the retailer
• The retailer starts the game• The game will last for 52 weeks
– You can end it earlier

Discussion• What, if anything, is unrealistic about this game? Is reality
more complicated or less complicated?• Why are there delays between each stages?• What happened?• Variance in Orders• Inventory/Shortages – Feast or Famine• What was the actual demand at the retailer?• Did you find yourself “blaming” the person upstream for your
problems?• What commonalities do you see in the graphs for the different
teams? • What pattern do you see? What is the cost of this?• What are the reasons that such patterns are seen in the supply
chain?
Summary
• An process view of supply chain
• Drivers for the performance of supply chain
• Challenges in supply chain management
• Some basics and principles
• Next week– Achieving strategic fit and scope– Discuss of beer game