Embed Size (px)
Citation preview

11/6/2012
1
Supply Chain Management
Outline
The Supply Chain’s Strategic ImportanceGlobal Supply Chain Issues
Supply Chain EconomicsMake-or-Buy Decisions
Outsourcing

11/6/2012
2
Outline – Continued
Ethics in the Supply Chain
Supply Chain StrategiesMany Suppliers
Few Suppliers
Vertical Integration
Keiretsu Networks
Virtual Companies
Outline – Continued
Managing the Supply Chain Issues in an Integrated Supply Chain
Opportunities in an Integrated Supply Chain
E-ProcurementOnline Catalogs
Auctions
RFQs
Realtime Inventory Tracking

11/6/2012
3
Outline – Continued
Vendor SelectionVendor Evaluation
Vendor Development
Negotiations
Outline – Continued
Logistics ManagementDistribution Systems
Third-Party Logistics
Cost of Shipping Alternatives
Logistics, Security, and JIT
Measuring Supply Chain Performance

11/6/2012
4
Learning Objectives
When you complete this chapter you should be able to:
1. Explain the strategic importance of the supply chain
2. Identify five supply chain strategies
3. Explain issues and opportunities in the supply chain
4. Describe approaches to supply chain negotiations
Learning Objectives
When you complete this chapter you should be able to:
Evaluate supply chain performance
Compute percent of assets committed to inventory
Compute inventory turnover

11/6/2012
5
Darden Restaurants
Largest publicly traded casual dining company in the world
Serves over 300 million meals annually in more than 1,400 restaurants in the US and Canada
Annual sales of $2.4 billion
Operations is the strategy
Darden Restaurants
Sources food from five continents and thousands of suppliers
Four distinct supply chains
Over $1.5 billion spent annually in supply chains
Competitive advantage achieved through superior supply chain

11/6/2012
6
The Supply Chain’s Strategic Importance
Supply chain management is the integration of the activities that procure materials and services,
transform them into intermediate goods and the final product, and
deliver them to customers
Competition is no longer between companies; it is between supply chains
Supply Chain Management
1. Transportation vendors
2. Credit and cash transfers
3. Suppliers
4. Distributors
5. Accounts payable and receivable
6. Warehousing and inventory
7. Order fulfillment
8. Sharing customer, forecasting, and production information
Important activities include determining

11/6/2012
7
A Supply Chain for Beer
Figure 11.1
Global Supply Chain Issues
React to sudden changes in parts availability, distribution, or shipping channels, import duties, and currency rates
Use the latest computer and transmission technologies to schedule and manage the shipment of parts in and finished products out
Staff with local specialists who handle duties, freight, customs and political issues
Supply chains in a global environment must be able to

11/6/2012
8
How Supply Chain Decisions Impact Strategy
Low-Cost Strategy
Response Strategy
Differentiation Strategy
Supplier’s goal
Supply demand at lowest possible cost (e.g., Emerson Electric, Taco Bell)
Respond quickly to changing requirements and demand to minimize stockouts (e.g., Dell Computers)
Share market research; jointly develop products and options (e.g., Benetton)
Primary selection criteria
Select primarily for cost
Select primarily for capacity, speed, and flexibility
Select primarily for product development skills
Table 11.1
How Supply Chain Decisions Impact Strategy
Low-Cost Strategy
Response Strategy
Differentiation Strategy
Process charact-eristics
Maintain high average utilization
Invest in excess capacity and flexible processes
Modular processes that lend themselves to mass customization
Inventory charact-eristics
Minimize inventory throughout the chain to hold down cost
Develop responsive system with buffer stocks positioned to ensure supply
Minimize inventory in the chain to avoid obsolescence
Table 11.1

11/6/2012
9
How Supply Chain Decisions Impact Strategy
Low-Cost Strategy
Response Strategy
Differentiation Strategy
Lead-time charact-eristics
Shorten lead time as long as it does not increase costs
Invest aggressively to reduce production lead time
Invest aggressively to reduce development lead time
Product-design charact-eristics
Maximize performance and minimize costs
Use product designs that lead to low setup time and rapid production ramp-up
Use modular design to postpone product differentiation as long as possible
Table 11.1
Supply Chain Economics
Supply Chain Costs as a Percent of Sales
Table 11.2
Industry % Purchased
All industry 52
Automobile 67
Food 60
Paper 55
Petroleum 79
Transportation 62

11/6/2012
10
Some SCM KPIsTitle Description Direction Unit Type
Inventory Accuracy Accuracy of the book inventory versus the counted inventory. Minimize Percentage
Inventory TurnsThis KPI tells us how often the average inventory over a given period of time (usally a year) is sold in that same period of time.
Number
% of orders delivered with damaged products/items
Percentage of orders delivered with damaged products/items Minimize Percentage
Total transport cost as % of delivered sales Total transport cost as a percentage of delivered sales. Percentage
Total logistics costs as a percentage of sales Total logistics costs as a percentage of sales. Percentage
Scrap value %Scrap value as a percentage of production value.
Minimize Percentage
% of Inventory items incorrectly located Percentage of Inventory items incorrectly located. Minimize Percentage
Size of safety stockSize of safety stock is a term used to describe a level of stock that is maintained below the cycle stock to buffer against stock-outs. Safety Stock or Buffer Stock exists to counter uncertainties in supply and demand.
Range Percentage
Inventory holding costs (IHC) as % of gross sales
Inventory holding costs (IHC) as a percentage of gross sales. Minimize Percentage
Inventory holding costs (IHC) as % of inventory value
Inventory holding costs (IHC) as a percentage of inventory value. Minimize Percentage
Customer order cycle time The average time it takes to fill a customer order. Minimize Time
% of orders/items arrives at the right location Percentage of orders/items arrives at the right location. Maximize Percentage
% of stock available at customers first request Percentage of stock available at customers first request. Maximize Percentage
Damages as % of throughput This is the ratio of damaged goods to actual throughput (e.g. per Truck Load). Minimize Percentage
Empty miles Percentage of miles (trips) that carried no inventory/freight. Minimize Percentage
Title Description Direction Unit Type
Inventory to obsolete goods ratio
Inventory to obsolete goods ratio.The ratio indicating the relative measure of the currently obsolete or inactive assets held by
an entity. CALCULATION: (Obsolete or Inactive Assets) / Total Assets Ratio
Percentage of problem suppliersPercentage of problem suppliers.
Minimize Percentage
% of safety stock usedPercentage of safety stock used in measurement period. Safety stock is a term used to describe a level of stock that is maintained below the cycle stock to buffer against stock-outs. Safety Stock or Buffer Stock exists to counter uncertainties in supply and demand.
Minimize Percentage
Requested Time in Full (RTIF)RTIF measures the success at delivering according to original customer delivery requirements.
Maximize Percentage
% of orders that were captured with incorrect attributes
Percentage of orders that were captured with incorrect attributes (e.g. part #, qty, request date, delivery address)
Minimize Percentage
% of undamaged goods after shipping/transportation
Percentage of undamaged goods after shipping/transportation. Maximize Percentage
On time ship rateWhat percent of orders where shipped on or before the requested ship date. On time ship rate can be calculated on a line item, SKU, case or value basis.
Maximize Percentage
Delivery Schedule Adherence (DSA)
Delivery Schedule adherence (DSA) is a business metric used to calculate the timeliness of deliveries from suppliers. Delivery schedule adherence is calculated by dividing the number of “on time†deliveries in a period by the total number of deliveries made. The result is then multiplied by 100 and expressed as a percentage.
Maximize Percentage
% of orders that were delivered with requested documentation
Percentage of orders that were delivered with the requested documentation. Maximize Percentage
Inventory Days of Supply
Inventory Days of Supply = Average Inventory / Cost of a Day's Sales
Example: $20/ $0.5 = 40 days supply
Time
Percent Variability in Lead TimeMeasures the level adjustment of the SKU to variation in pattern and quantity of demand. Represented as a percentage. A value of 1-2% is set as a benchmark.
Minimize Percentage
Insurance costs as % of inventory costsInsurance accounts for a portion of the inventory costs. Since it is better to be safe than sorry, companies generally get the material insured. It generally works out to 1%.
Percentage
% of shipment visibility/traceabilityShipment visibility/traceability percentage: calculated by dividing the total number of shipments via carriers with order tracking systems, by the total number of shipments sent during a period.
Maximize Percentage
Manufacturing Schedule Adherence
The absolute variance of actual production to scheduled production.
Minimize Percentage
% of items equipped with Radio frequency identification (RFID)
Percentage of items equipped with Radio frequency identification (RFID). Percentage
Some SCM KPIs (cont’d)

11/6/2012
11
Make-or-Buy Decisions
1. Maintain core competence2. Lower production cost3. Unsuitable suppliers4. Assure adequate supply (quantity or delivery)5. Utilize surplus labor or facilities6. Obtain desired quality7. Remove supplier collusion8. Obtain unique item that would entail a prohibitive
commitment for a supplier9. Protect personnel from a layoff10. Protect proprietary design or quality11. Increase or maintain size of company
Reasons for Making
Table 11.4
Make-or-Buy Decisions
1. Frees management to deal with its core competence
2. Lower acquisition cost3. Preserve supplier commitment4. Obtain technical or management ability5. Inadequate capacity6. Reduce inventory costs7. Ensure alternative sources8. Inadequate managerial or technical resources9. Reciprocity10. Item is protected by a patent or trade secret
Reasons for Buying
Table 11.4
11/6/2012
12
Outsourcing
Transfers traditional internal activities and resources of a firm to outside vendors
Utilizes the efficiency that comes with specialization
Firms outsource information technology, accounting, legal, logistics, and production
Ethics in the Supply Chain
Opportunities for unethical behavior are enormous and temptations are high
Many companies have strict rules and codes of conduct that define acceptable behavior
Institute for Supply Management has developed a detailed set of principles and standards for ethical behavior

11/6/2012
13
Principles and Standards for Ethical Supply Management
Conduct
LOYALTY TO YOUR ORGANIZATION
JUSTICE TO THOSE WITH WHOM YOU DEAL
FAITH IN YOUR PROFESSION
Table 11.5
Principles and Standards for Ethical Supply Management
Conduct
1. Avoid the intent and appearance of unethical or compromising practice in relationships, actions, and communications
2. Demonstrate loyalty to the employer by diligently following the lawful instructions of the employer, using reasonable care and granted authority
3. Avoid any personal business or professional activity that would create a conflict between personal interests and the interests of the employer
Table 11.5

11/6/2012
14
Principles and Standards for Ethical Supply Management
Conduct
4. Avoid soliciting or accepting money, loans, credits, or preferential discounts, and the acceptance of gifts, entertainment, favors, or services from present or potential suppliers that might influence, or appear to influence, supply management decisions
5. Handle confidential or proprietary information with due care and proper consideration of ethical and legal ramifications and government regulations
6. Promote positive supplier relationships through courtesy and impartiality
7. Avoid improper reciprocal agreementsTable 11.5
Principles and Standards for Ethical Supply Management
Conduct
8. Know and obey the letter and spirit of laws applicable to supply management
9. Encourage support for small, disadvantaged, and minority-owned businesses
10. Acquire and maintain professional competence
11. Conduct supply management activities in accordance with national and international laws, customs, and practices, your organization’s policies, and these ethical principles and standards of conduct
12. Enhance the stature of the supply management profession
Table 11.5

11/6/2012
15
Supply Chain Strategies
Negotiating with many suppliers
Long-term partnering with few suppliers
Vertical integration
Keiretsu
Virtual companies that use suppliers on an as needed basis
Many Suppliers
Commonly used for commodity products
Purchasing is typically based on price
Suppliers compete with one another
Supplier is responsible for technology, expertise, forecasting, cost, quality, and delivery

11/6/2012
16
Few Suppliers
Buyer forms longer term relationships with fewer suppliers
Create value through economies of scale and learning curve improvements
Suppliers more willing to participate in JIT programs and contribute design and technological expertise
Cost of changing suppliers is huge
Vertical Integration
Figure 11.2
Raw material (suppliers) Iron ore Silicon Farming
Backward integration Steel
Current transformation Automobiles Integrated
circuits Flour milling
Forward integration Distribution systems Circuit boards
Finished goods (customers) Dealers
Computers Watches
CalculatorsBaked goods
Vertical Integration Examples of Vertical Integration
11/6/2012
17
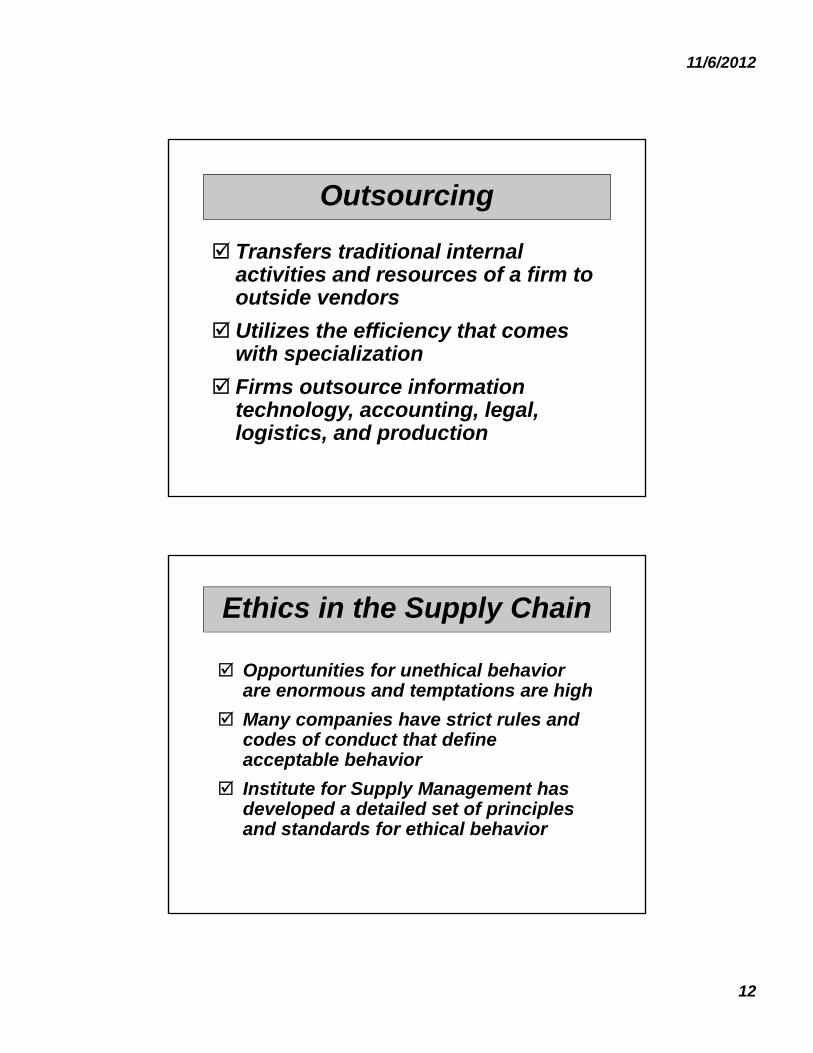
Vertical Integration
Developing the ability to produce goods or service previously purchased
Integration may be forward, towards the customer, or backward, towards suppliers
Can improve cost, quality, and inventory but requires capital, managerial skills, and demand
Risky in industries with rapid technological change
Keiretsu Networks
A middle ground between few suppliers and vertical integration
Supplier becomes part of the company coalition
Often provide financial support for suppliers through ownership or loans
Members expect long-term relationships and provide technical expertise and stable deliveries
May extend through several levels of the supply chain

11/6/2012
18
Virtual Companies
Rely on a variety of supplier relationships to provide services on demand
Fluid organizational boundaries that allow the creation of unique enterprises to meet changing market demands
Exceptionally lean performance, low capital investment, flexibility, and speed
Managing the Supply Chain
Mutual agreement on goals
Trust
Compatible organizational cultures
There are significant management issues in controlling a supply chain involving many independent organizations

11/6/2012
19
Issues in an Integrated Supply Chain
Local optimization - focusing on local profit or cost minimization based on limited knowledge
Incentives (sales incentives, quantity discounts, quotas, and promotions) -push merchandise prior to sale
Large lots - low unit cost but do not reflect sales Bullwhip effect - stable demand becomes
lumpy orders through the supply chain
Opportunities in an Integrated Supply Chain
Accurate “pull” data
Lot size reduction
Single stage control of replenishment
Vendor managed inventory
Blanket orders

11/6/2012
20
Opportunities in an Integrated Supply Chain
Standardization
Postponement
Drop shipping and special packaging
Pass-through facility
Channel assembly
Radio Frequency TagsRadio Frequency Tags: Keeping the Shelves Stocked
Supply chains work smoothly when sales are steady, but often break down when confronted by a sudden surge in demand. Radio frequency ID (or RFID) tags can change that by providing real-time information about what’s happening on store shelves. Here’s how the system works for Proctor & Gamble’s Pampers.

11/6/2012
21
E-Procurement
Uses the internet to facilitate purchasing
Electronic ordering and funds transferElectronic data interchange (EDI)
Advanced shipping notice
E-Procurement
Online catalogsCatalogs provided by vendors
Catalogs published by intermediaries
Exchanges provided by buyers

11/6/2012
22
Internet Trading Exchanges
Health care products – ghx.com
Retail goods – gnx.com
Defense and aerospace products –exostar.com
Food, beverage, consumer products – transora.com
Steel and metal products –metalsite.com
Hotels – avendra.com
E-Procurement
AuctionsMaintained by buyers, sellers, or
intermediaries
Low barriers to entry
Increase in the potential number of buyers

11/6/2012
23
E-Procurement
RFQsCan make requests for quotes
(RFQs) less costly
Improves supplier selection
Real-time inventory tracking
Vendor Selection
Vendor evaluation Critical decision
Find potential vendors
Determine the likelihood of them becoming good suppliers
Vendor Development Training
Engineering and production help
Establish policies and procedures

11/6/2012
24
Vendor Selection
Negotiations Cost-Based Price Model - supplier
opens books to purchaser
Market-Based Price Model - price based on published, auction, or indexed price
Competitive Bidding - used for infrequent purchases but may make establishing long-term relationships difficult
Vendor Evaluation
Criteria WeightsScores
(1-5)Weight x Score
Engineering/research/innovation skills .20 5 1.0
Production process capability (flexibility/technical assistance)
.15 4 .6
Distribution/delivery capability .05 4 .2
Quality systems and performance .10 2 .2
Facilities/location .05 2 .1
Financial and managerial strength (stability and cost structure)
.15 4 .6
Information systems capability (e-procurement, ERP)
.10 2 .2
Integrity (environmental compliance/ ethics)
.20 5 1.0
Total 1.00 3.9

11/6/2012
25
Logistics Management
Objective is to obtain efficient operations through the integration of all material acquisition, movement, and storage activities
Is a frequent candidate for outsourcing
Allows competitive advantage to be gained through reduced costs and improved customer service
Distribution Systems
Trucking Moves the vast majority of
manufactured goods
Chief advantage is flexibility
Railroads Capable of carrying large loads
Little flexibility though containers and piggybacking have helped with this

11/6/2012
26
Distribution Systems
Airfreight Fast and flexible for light loads
May be expensive
Distribution Systems
Waterways Typically used for bulky, low-
value cargo
Used when shipping cost is more important than speed
11/6/2012
27
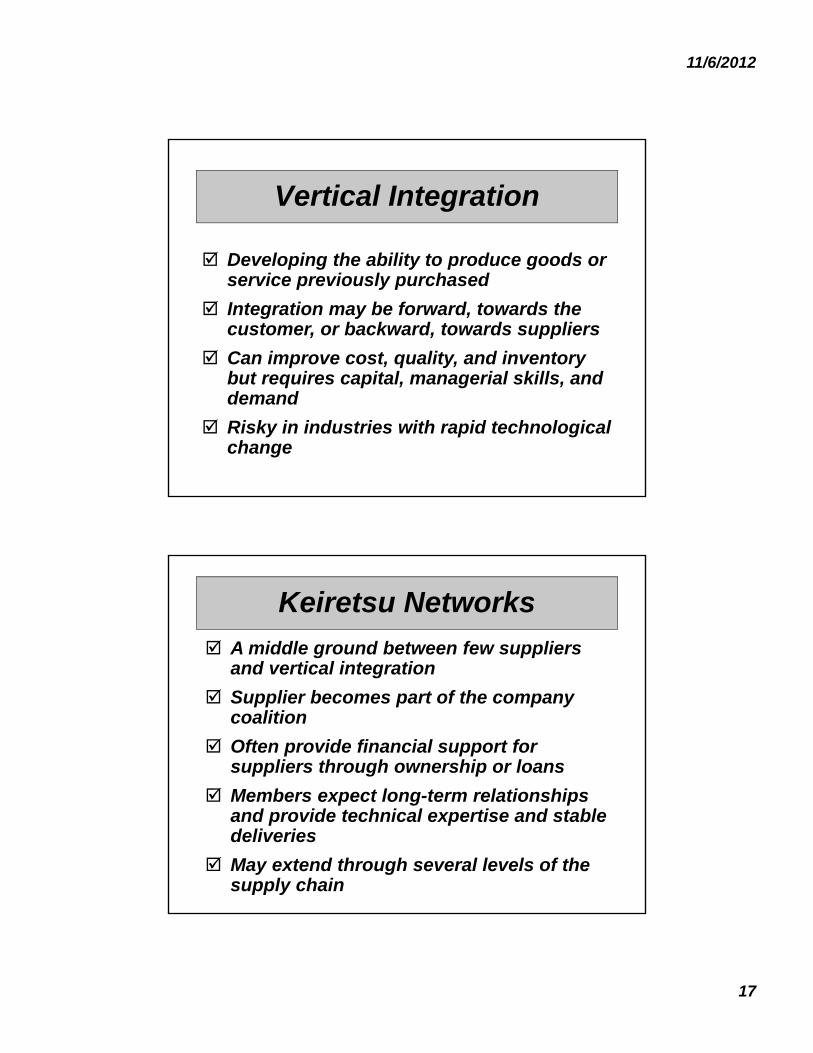
Distribution Systems
Pipelines Used for transporting oil, gas,
and other chemical products
Third-Party Logistics
Outsourcing logistics can reduce costs and improve delivery reliability and speed
Coordinate supplier inventory with delivery services
May provide warehousing, assembly, testing, shipping, customs

11/6/2012
28
Cost of Shipping Alternatives
Product in transit is a form of inventory and has a carrying cost
Faster shipping is generally more expensive than slower shipping
We can evaluate the two costs to better understand the trade-off
Cost of Shipping Alternatives
Value of connectors = $1,750.00Holding cost = 40% per yearSecond carrier is 1 day faster and $20 more expensive
Daily cost of holding product = x /365
Annual holding
cost
Product value
= (.40 x $1,750)/ 365 = $1.92
Since it costs less to hold the product one day longer than it does for the faster shipping ($1.92 < $20), we should use the cheaper, slower shipper

11/6/2012
29
Logistics, Security, and JIT
Borders are becoming more open in the U.S. and around the world
Monitoring and controlling stock moving through supply chains is more important than ever
New technologies are being developed to allow close monitoring of location, storage conditions, and movement
Measuring Supply Chain Performance
Table 11.6
Typical FirmsBenchmark
Firms
Lead time (weeks) 15 8
Time spent placing an order 42 minutes 15 minutes
Percentage of late deliveries 33% 2%
Percentage of rejected material 1.5% .0001%
Number of shortages per year 400 4
11/6/2012
30
Measuring Supply Chain Performance
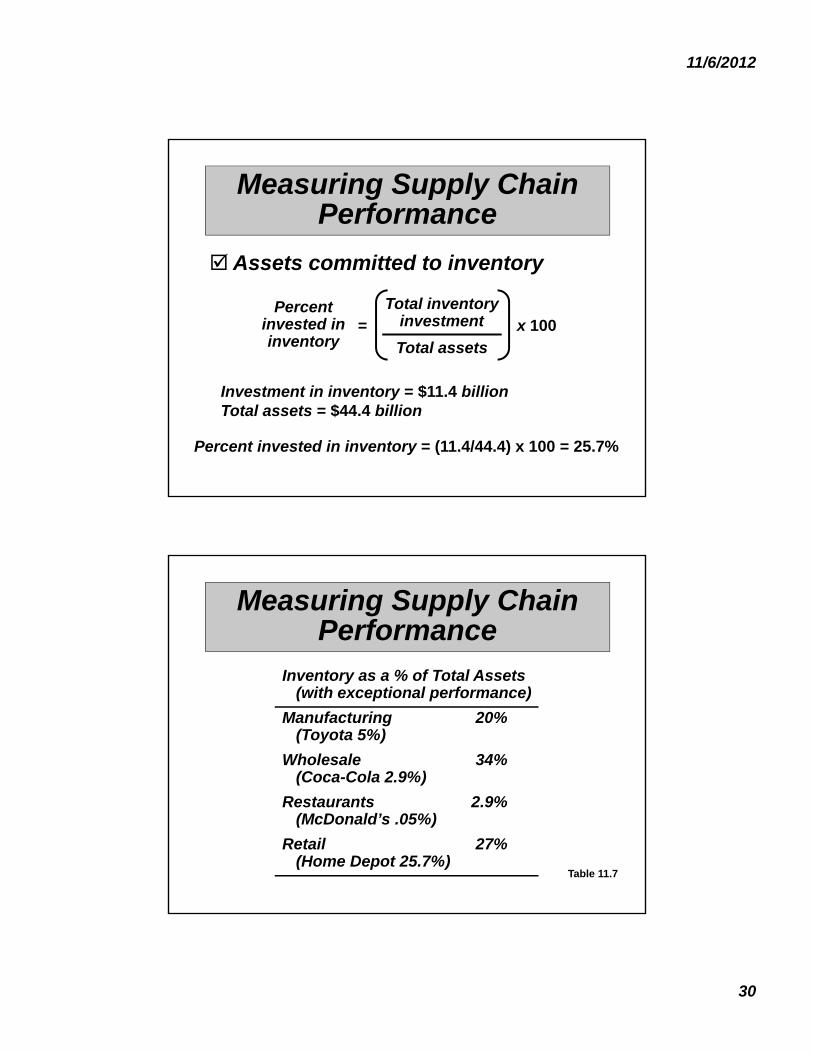
Assets committed to inventory
Percent invested in inventory
= x 100Total inventory
investment
Total assets
Investment in inventory = $11.4 billionTotal assets = $44.4 billion
Percent invested in inventory = (11.4/44.4) x 100 = 25.7%
Measuring Supply Chain Performance
Table 11.7
Inventory as a % of Total Assets(with exceptional performance)
Manufacturing 20%(Toyota 5%)
Wholesale 34%(Coca-Cola 2.9%)
Restaurants 2.9%(McDonald’s .05%)
Retail 27%(Home Depot 25.7%)

11/6/2012
31
Measuring Supply Chain Performance
Inventory turnover
Inventory turnover =
Cost of goods sold
Inventory investment
Measuring Supply Chain Performance
Table 11.8
Examples of Annual Inventory Turnover
Food, Beverage, Retail Manufacturing
Anheuser Busch 15 Dell Computer 90
Coca-Cola 14 Johnson Controls 22
Home Depot 5 Toyota (overall) 13
McDonald’s 112 Nissan (assembly) 150

11/6/2012
32
Measuring Supply Chain Performance
Inventory turnover
Net revenue $32.5Cost of goods sold $14.2Inventory:
Raw material inventory $.74Work-in-process inventory $.11Finished goods inventory $.84
Total inventory investment $1.69
Measuring Supply Chain Performance
Inventory turnover
Net revenue $32.5Cost of goods sold $14.2Inventory:
Raw material inventory $.74Work-in-process inventory $.11Finished goods inventory $.84
Total inventory investment $1.69
Inventory turnover = Cost of goods sold
Inventory investment
= 14.2 / 1.69 = 8.4

11/6/2012
33
Measuring Supply Chain Performance
Inventory turnover
Net revenue $32.5Cost of goods sold $14.2Inventory:
Raw material inventory $.74Work-in-process inventory $.11Finished goods inventory $.84
Total inventory investment $1.69
Inventory turnover = Cost of goods sold
Inventory investment
= 14.2 / 1.69 = 8.4Weeks of supply =
Inventory investment
Average weekly cost of goods sold
= 1.69 / .273 = 6.19 weeks
Average weekly cost of goods sold = $14.2 / 52 = $.273


![[PPT]Slide 1 - مواقع اعضاء هيئة التدريس | KSU Facultyfac.ksu.edu.sa/sites/default/files/Schiffman_CB10_PPT_04.ppt · Web viewCHAPTER FOUR Consumer Motivation](https://img.pdfslide.net/doc/110x75/5aa53f8b7f8b9a1d728cdc87/pptslide-1-ksu-viewchapter-four.jpg)

![[PPT]Nephelometry and Turbidimetry - مواقع اعضاء هيئة التدريس ...fac.ksu.edu.sa/sites/default/files/nephelometry_turbidi... · Web viewNephelometry and Turbidimetry](https://img.pdfslide.net/doc/110x75/5ab2ed937f8b9ac3348dc6b6/pptnephelometry-and-turbidimetry-.jpg)