Embed Size (px)
Citation preview
Supply Chain Performance of Organic Red Rice through PT Lingkar Organik Indonesia in Special Region of Yogyakarta Indonesia
Susanawati1,*, and Zachra Nur Handayani1
1Department of Agribusiness, Universitas Muhammadiyah Yogyakarta, 55183, Yogyakarta, Indonesia
Abstract. This study aimed to describe the relationship structure of organic red rice supply chain and measure the supply chain performance through PT Lingkar Organik Indonesia. The number of respondents in this study was 97 people, consisting of 30 farmers, one trader, one director of PT Lingkar Organik Indonesia, four retailers, one industrial consumer, and 60 household consumers. This study employed a descriptive analysis. The results showed that the organic red rice supply chain’s relationship structure consisted of nine actors forming five chains and having different activities. The actors consisted of farmers, trader, PT Lingkar Organik Indonesia, Pamella Supermarkets, Maga Swalayan, Progo Store, Mirota, Panti Rapih Hospital, and household consumers. In terms of continuity flow, the supply chain performance of organic red rice comprising the product flow, money flow, and information flow as a whole, has not been going well. It was because there were still quite smooth flows, including product flow and information flow. The best performance was the chain formed from farmers, trader, PT Lingkar Organik Indonesia, and Panti Rapih Hospital.
1 Introduction Rice is the staple food of Indonesian society. Rice consumption is increasing in line with the high population growth in Indonesia. The government has made efforts to increase rice production, one of which is through an intensification program. This program has increased national food production, yet causing environmental problems. Rice intensification with the use of chemical fertilizers in large quantities for a long period and a lack of attention to the use of organic matter in rice production has caused land degradation, thereby reducing agricultural production [1].
One of the efforts to minimize the negative impact of using these chemicals is by implementing organic rice farming. Organic rice products are produced from agriculture free of harmful chemicals; thus, it is relatively safer for consumption. Such products begin to attract consumers, along with increasing consumer awareness of the negative impact of chemicals on health and the environment. Besides, changes in people’s lifestyles becoming interested in healthy lifestyles are factors in increasing for organic rice demand. However,
* Corresponding author: [email protected]
© The Authors, published by EDP Sciences. This is an open access article distributed under the terms of the Creative Commons Attribution License 4.0 (http://creativecommons.org/licenses/by/4.0/).
E3S Web of Conferences 232, 02011 (2021) https://doi.org/10.1051/e3sconf/202123202011IConARD 2020
organic rice consumers tend to be limited to certain market segments because organic rice is an exclusive product and the price is relatively expensive. Based on the results of a survey by the Indonesian Consumers Foundation (YLKI), the average price for branded organic rice was IDR 23,000 / kg. The average price is much higher than the average price of conventional rice which only reaches IDR 10,000 / kg [2].
Organic red rice is one of the alternative staple foods consumed for the diet as it has a lower calorie content and contains higher fiber than white rice, thereby providing a faster feeling of fullness. People with diabetes can also consume red rice since it can control blood glucose. Currently, certified organic red rice is still limited due to a few farmers farming this rice. Consumers of organic red rice are likely to be limited to specific market segments as it is an exclusive product, causing a relatively expensive price.
PT Lingkar Organik Indonesia is a company engaged in the organic rice packaging and marketing in the Special Region of Yogyakarta. This company supplies organic red rice to several supermarkets in Yogyakarta under the brand Lingkar Organik. It offers several organic rice types, and organic red rice is the type most in demand by consumers. The distribution of organic red rice is, undoubtedly, inseparable from the supply chain concept. The supply chain is a network of companies integrated and work together to create products and then distribute them to the final consumer [3]. The supply chain is a dynamic activity and includes a constant flow of information, products and money between different stages [4]. The supply chain consists of all parties that are involved directly or indirectly in meeting consumer demand. The supply chain as a system in which organizations distribute products and services to consumers [5].
Sometimes, PT Lingkar Organik Indonesia experienced uncertainty in rice supply due to weather factors and planting schedule problems, causing harvest delays, leading to late delivery times. These constraints can affect supply chain performance as they hamper the flow continuity of organic red rice. Supply chain performance is the level of ability of a supply chain to meet consumer needs by considering key performance indicators that are appropriate at a certain time and cost [6]. The measurement of supply chain performance in agriculture takes into account the special characteristics that differentiate it from a general supply chain [7]. Besides, the large number of actors involved in the supply chain of organic red rice has resulted in poor supply chain performance since each actor has his level of importance. Therefore, research is required to describe the relationship structure of organic red rice supply chain through PT Lingkar Organik Indonesia and to analyze the supply chain performance in terms of product flow, money flow, and information flow. This study’s results can be used as information material to improve the performance of each actor involved in the organic red rice supply chain.
2 Research Method The primary method used in this research was descriptive. The determination of respondents employed snowball sampling techniques based on information from PT Lingkar Organik Indonesia, as a starting point. The sample of organic red rice farmers was determined using the census method, namely all farmer group members in Seyegan District, who plant red rice actively. Meanwhile, for household consumer respondents purchasing organic red rice at retail, the accidental sampling method was utilized. The number of research respondents was 97 people, consisting of 30 farmers, one trader, one director of PT Lingkar Organik Indonesia, four retailers, one industrial consumer, and 60 household consumers.
This study utilized both primary and secondary data collected following the research needs. Descriptive analysis was employed to provide an overview of the organic red rice supply chain’s relationship structure, including actors and their activities from farmers to
2
E3S Web of Conferences 232, 02011 (2021) https://doi.org/10.1051/e3sconf/202123202011IConARD 2020
organic rice consumers tend to be limited to certain market segments because organic rice is an exclusive product and the price is relatively expensive. Based on the results of a survey by the Indonesian Consumers Foundation (YLKI), the average price for branded organic rice was IDR 23,000 / kg. The average price is much higher than the average price of conventional rice which only reaches IDR 10,000 / kg [2].
Organic red rice is one of the alternative staple foods consumed for the diet as it has a lower calorie content and contains higher fiber than white rice, thereby providing a faster feeling of fullness. People with diabetes can also consume red rice since it can control blood glucose. Currently, certified organic red rice is still limited due to a few farmers farming this rice. Consumers of organic red rice are likely to be limited to specific market segments as it is an exclusive product, causing a relatively expensive price.
PT Lingkar Organik Indonesia is a company engaged in the organic rice packaging and marketing in the Special Region of Yogyakarta. This company supplies organic red rice to several supermarkets in Yogyakarta under the brand Lingkar Organik. It offers several organic rice types, and organic red rice is the type most in demand by consumers. The distribution of organic red rice is, undoubtedly, inseparable from the supply chain concept. The supply chain is a network of companies integrated and work together to create products and then distribute them to the final consumer [3]. The supply chain is a dynamic activity and includes a constant flow of information, products and money between different stages [4]. The supply chain consists of all parties that are involved directly or indirectly in meeting consumer demand. The supply chain as a system in which organizations distribute products and services to consumers [5].
Sometimes, PT Lingkar Organik Indonesia experienced uncertainty in rice supply due to weather factors and planting schedule problems, causing harvest delays, leading to late delivery times. These constraints can affect supply chain performance as they hamper the flow continuity of organic red rice. Supply chain performance is the level of ability of a supply chain to meet consumer needs by considering key performance indicators that are appropriate at a certain time and cost [6]. The measurement of supply chain performance in agriculture takes into account the special characteristics that differentiate it from a general supply chain [7]. Besides, the large number of actors involved in the supply chain of organic red rice has resulted in poor supply chain performance since each actor has his level of importance. Therefore, research is required to describe the relationship structure of organic red rice supply chain through PT Lingkar Organik Indonesia and to analyze the supply chain performance in terms of product flow, money flow, and information flow. This study’s results can be used as information material to improve the performance of each actor involved in the organic red rice supply chain.
2 Research Method The primary method used in this research was descriptive. The determination of respondents employed snowball sampling techniques based on information from PT Lingkar Organik Indonesia, as a starting point. The sample of organic red rice farmers was determined using the census method, namely all farmer group members in Seyegan District, who plant red rice actively. Meanwhile, for household consumer respondents purchasing organic red rice at retail, the accidental sampling method was utilized. The number of research respondents was 97 people, consisting of 30 farmers, one trader, one director of PT Lingkar Organik Indonesia, four retailers, one industrial consumer, and 60 household consumers.
This study utilized both primary and secondary data collected following the research needs. Descriptive analysis was employed to provide an overview of the organic red rice supply chain’s relationship structure, including actors and their activities from farmers to
final consumers. This descriptive data analysis technique is the same as that used by [8]. This is in line with [9] research that descriptive analysis is used to describe the onion supply chain actors in Brebes Regency, Central Java.
Supply chain performance could be seen from the smooth product flow, money flow, and information flow in the organic red rice supply chain. Indicators on product flow included the number of products [10], product quality [11], product cleanliness [10], product packaging , delivery time, means of transportation, and warehouse availability [11] ranging from 1 (inappropriate) up to 5 (very appropriate). Money flow indicators included transaction methods [12], transaction payment methods, transaction places, transaction payment dates [11], transaction payment amounts [10], and total capital ranging from 1 (inappropriate) up to 5 (very appropriate). In the information flow, indicators employed were based on [11] research, comprising information about the production, demand, delivery time, and information on consumer preferences ranging form 1 (unavailable) up to 5 (very available).
After measuring the indicators of product flow, money flow, and information flow, categorization was conducted. The categories for the three flows were not smooth, quite smooth, and smooth. The data obtained were processed using Microsoft Excel. The categorization utilized the Sturges formula:
Z=(X-Y)/K………………………...………….………..(1)
Description: Z= class interval X= the highest score Y= the lowest score K= number of classes/categories
3 Result and Discussion
3.1 The Relationship Structure of the Organic Red Rice Supply Chain
The relationship structure of the organic red rice supply chain through PT Lingkar Organik Indonesia was analyzed based on the actors forming the supply chain and their activities. Those actors were individuals or institutions involved in the product flow, money flow, and information flow, starting from the upstream to the downstream. The relationship structure of organic red rice supply chain through PT Lingkar Organik Indonesia was formed by eight actors: farmers, collecting trader, PT Lingkar Organik Indonesia, Pamella Supermarkets, Maga Swalayan, Progo Store, Mirota, and consumers. The number of actors in the red rice supply chain is in line with [13] who shows that the rice supply chain structure in India works on a traditional framework that involves many intermediaries in the supply and distribution sector so that the supply chain becomes less efficient. Research from [14] also shows that there was many actors involved in the rice chain in Solok. In contrast to [15] research, the rice supply chain in Minahasa District involves fewer actors, namely farmers, collectors, retailers and consumers.
This study’s consumers were divided into two: industrial consumers, which was Panti Rapih Hospital, and household consumers. The relationship structure of organic red rice supply chain through PT Lingkar Organik Indonesia had five chains: 1. Farmers - Collecting Trader - PT Lingkar Organik Indonesia - Pamella Supermarkets -
Household Consumers. 2. Farmers - Collecting Trader - PT Lingkar Organik Indonesia - Maga Swalayan -
Household Consumers.
3
E3S Web of Conferences 232, 02011 (2021) https://doi.org/10.1051/e3sconf/202123202011IConARD 2020
3. Farmers - Collecting Trader - PT Lingkar Organik Indonesia - Progo Store - Household Consumers.
4. Farmers - Collecting Trader - PT Lingkar Organik Indonesia - Mirota - Household Consumers.
5. Farmers - Collecting Trader - PT Lingkar Organik Indonesia - Panti Rapih Hospital
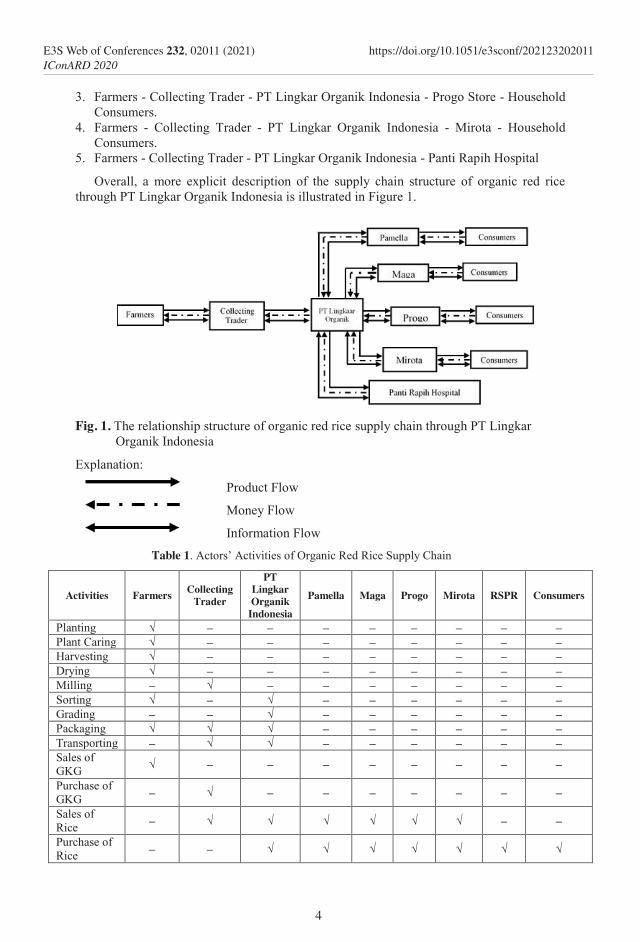
Overall, a more explicit description of the supply chain structure of organic red rice through PT Lingkar Organik Indonesia is illustrated in Figure 1.
Fig. 1. The relationship structure of organic red rice supply chain through PT Lingkar Organik Indonesia
Explanation:
Product Flow
Money Flow
Information Flow
Table 1. Actors’ Activities of Organic Red Rice Supply Chain
Activities Farmers Collecting Trader
PT Lingkar Organik
Indonesia Pamella Maga Progo Mirota RSPR Consumers
Planting √ – – – – – – – – Plant Caring √ – – – – – – – – Harvesting √ – – – – – – – – Drying √ – – – – – – – – Milling – √ – – – – – – – Sorting √ – √ – – – – – – Grading – – √ – – – – – – Packaging √ √ √ – – – – – – Transporting – √ √ – – – – – – Sales of GKG
√ – – – – – – – –
Purchase of GKG – √ – – – – – – –
Sales of Rice – √ √ √ √ √ √ – –
Purchase of Rice – – √ √ √ √ √ √ √
4
E3S Web of Conferences 232, 02011 (2021) https://doi.org/10.1051/e3sconf/202123202011IConARD 2020

3. Farmers - Collecting Trader - PT Lingkar Organik Indonesia - Progo Store - Household Consumers.
4. Farmers - Collecting Trader - PT Lingkar Organik Indonesia - Mirota - Household Consumers.
5. Farmers - Collecting Trader - PT Lingkar Organik Indonesia - Panti Rapih Hospital
Overall, a more explicit description of the supply chain structure of organic red rice through PT Lingkar Organik Indonesia is illustrated in Figure 1.
Fig. 1. The relationship structure of organic red rice supply chain through PT Lingkar Organik Indonesia
Explanation:
Product Flow
Money Flow
Information Flow
Table 1. Actors’ Activities of Organic Red Rice Supply Chain
Activities Farmers Collecting Trader
PT Lingkar Organik
Indonesia Pamella Maga Progo Mirota RSPR Consumers
Planting √ – – – – – – – – Plant Caring √ – – – – – – – – Harvesting √ – – – – – – – – Drying √ – – – – – – – – Milling – √ – – – – – – – Sorting √ – √ – – – – – – Grading – – √ – – – – – – Packaging √ √ √ – – – – – – Transporting – √ √ – – – – – – Sales of GKG
√ – – – – – – – –
Purchase of GKG – √ – – – – – – –
Sales of Rice – √ √ √ √ √ √ – –
Purchase of Rice – – √ √ √ √ √ √ √
The supply chain’s relationship structure was formed from mutually beneficial cooperation between actors and each actor’s activities. Each actor carried out different activities according to their respective roles. [16] also conducted an explanation of the activities of actors in a supply chain in his research on the rice supply chain in Bandung Regency, West Java. The activities of each actor in the organic red rice supply chain were presented in table 1.
3.1.1 Organic Red Rice Farmer
Organic red rice farmers were the first chain actors in the chain. The activities carried out by farmers were farming, drying, sorting, packaging, and selling dry unhusked rice. Each farmer generally planted rice in turns using a block system. Farmers planted red rice once or twice a year. In general, the organic red rice farming process started from pre-planting, planting, plant caring to harvesting. All farmers carried out harvesting activities. After harvesting, threshing was conducted, and then the unhulled rice, which has fallen out, was dried. The drying process utilized sunlight using the drying method. During this process, the farmers also did a cleaning. Unhulled rice cleaning was carried out to remove empty grains and other foreign objects. Then, the unhulled rice was packed in 50 kg sacks. The average amount of unhulled rice sold by farmers was two to four sacks of 50 kg in one transaction. Dry unhusked rice was purchased by collecting trader for 6,000 IDR - 7,500 IDR for each kilogram, depending on grain quality. Farmers sold dry unhusked rice to collecting trader utilizing a weighing system. They did not carry out transportation activities because the trader took the dry unhusked rice from the farmers.
3.1.2 Collecting Trader
The collecting trader was also a farmer having enough capital to conduct business activities. There was one collecting trader. The trader’s activities included buying farmers’ harvest of dry unhusked rice, transporting unhulled rice from farmers, grinding unhulled rice, packing rice, and selling rice to PT Lingkar Organik Indonesia. The trader took the dry unhusked rice from the farmers using a pick-up car or motorbike. The dry unhusked rice was purchased from farmers for 6,000 IDR - 7,500 IDR for each kilogram, depending on the quality.
The dry unhusked rice purchased by the trader was stored in a warehouse located at the collecting trader’s house. When there was an order from PT Lingkar Organik, the trader got the dry unhusked rice milled. The rice was then put in a 50 kg sack package. PT Lingkar Organik Indonesia came directly and transported organic red rice to PT Lingkar Organik Indonesia’s warehouse in Kalasan, Sleman, using a pick-up car.
3.1.3 PT Lingkar Organik Indonesia
Activities carried out by PT Lingkar Organik Indonesia were purchasing rice from collecting trader. PT Lingkar Organik Indonesia took organic red rice from the trader once a week on average. The average amount of rice purchased from the trader was around one ton. Organic red rice was purchased from the collecting trader at 13,000 IDR for each kilogram. Payment would be made by PT Lingkar Organik Indonesia within two weeks by way of transfer. After purchasing, several processes consisting of grading, sorting and packing were conducted before the rice was ready to be sold again. The resulting rice grade conformed to SNI standards, such as having a maximum water content of 14%, broken rice < 5%, and no content other than rice, such as rocks, dust, and other debris. The packaging plastic used consisted of three sizes: 1 kg, 2.5 kg, and 25 kg. 1 kg and 2.5 kg packaging
5
E3S Web of Conferences 232, 02011 (2021) https://doi.org/10.1051/e3sconf/202123202011IConARD 2020
were used for products to be distributed to retailers, while 25 kg packaging was intended for distribution to hospitals. After the rice was put in the packaging, the packaging was closed tightly using a sealer machine. The packaging was then labeled with a sticker containing product information. Packaged organic red rice was sold to retailers and hospitals. Organic red rice was sold to retail at 15,000 IDR for 1 kg packaging and 37,500 IDR for 2.5 kg packaging. Meanwhile, organic red rice was sold in bulk to homes for 15,000 IDR for each kilogram.
3.1.4 Pamella Supermarket
Activities carried out by Pamella Supermarkets concerning organic red rice supply chain were purchasing it from PT Lingkar Organik Indonesia and reselling it to consumers. Pamella purchased organic red rice from PT Lingkar Organik Indonesia around 48 packs in 2.5 kg packaging at a price of 37,500 IDR. PT Lingkar Organik Indonesia delivered products to Pamella every two weeks. The payment system from Pamella to PT Lingkar Organik was made in cash. Pamella sold organic red rice to final consumers, namely household consumers, at a price of 39,900 IDR.
3.1.5 Maga Swalayan
This swalayan conducted several activities within the organic red rice supply chain consisting of purchasing organic it from PT Lingkar Organik Indonesia and reselling it to consumers. Maga Swalayan bought organic red rice from PT Lingkar Organik Indonesia around 60 packs in 1 kg packaging for 15,000 IDR. PT Lingkar Organik Indonesia usually only made deliveries to the swalayan. The long delivery and the insignificant quantity from PT Lingkar Organik Indonesia resulted in the scarcity of organic red rice products at Maga Swalayan. Therefore, the swalayan tried to negotiate with PT Lingkar Organik Indonesia to change the collaboration into a purchase order system. Payment from Maga Swalayan to PT Lingkar Organik was made by transfer one week after the note’s signature. Maga Swalayan sold organic red rice to household consumers at 16,500 IDR.
3.1.6 Progo Store
Similarly, activities carried out by Progo Store related to the organic red rice supply chain were purchasing it from PT Lingkar Organik Indonesia and reselling it to consumers. Progo Store bought organic red rice from PT Lingkar Organik Indonesia around 60 packs in 2.5 kg packaging at 37,500 IDR. It always placed an order by issuing a purchase order, which had to be taken by the sales of PT Lingkar Organik Indonesia. Progo Store, on average, ordered it once a week. The payment system was carried out through bank transfer. The store sold organic red rice to household consumers for 40,000 IDR.
3.1.7 Mirota
Activities carried out by Mirota regarding the organic red rice supply chain were purchasing it from PT Lingkar Organik Indonesia and reselling it to consumers. Mirota bought organic red rice from PT Lingkar Organik Indonesia in 1 kg packaging for 15,000 IDR and 2.5 kg packaging for 37,500 IDR. Mirota always placed an order by issuing a purchase order, which had to be taken by PT Lingkar Organik Indonesia. The payment was made in cash. Mirota sold organic red rice to final household consumers at a price of 17,200 IDR and 42,000 IDR.
6
E3S Web of Conferences 232, 02011 (2021) https://doi.org/10.1051/e3sconf/202123202011IConARD 2020

were used for products to be distributed to retailers, while 25 kg packaging was intended for distribution to hospitals. After the rice was put in the packaging, the packaging was closed tightly using a sealer machine. The packaging was then labeled with a sticker containing product information. Packaged organic red rice was sold to retailers and hospitals. Organic red rice was sold to retail at 15,000 IDR for 1 kg packaging and 37,500 IDR for 2.5 kg packaging. Meanwhile, organic red rice was sold in bulk to homes for 15,000 IDR for each kilogram.
3.1.4 Pamella Supermarket
Activities carried out by Pamella Supermarkets concerning organic red rice supply chain were purchasing it from PT Lingkar Organik Indonesia and reselling it to consumers. Pamella purchased organic red rice from PT Lingkar Organik Indonesia around 48 packs in 2.5 kg packaging at a price of 37,500 IDR. PT Lingkar Organik Indonesia delivered products to Pamella every two weeks. The payment system from Pamella to PT Lingkar Organik was made in cash. Pamella sold organic red rice to final consumers, namely household consumers, at a price of 39,900 IDR.
3.1.5 Maga Swalayan
This swalayan conducted several activities within the organic red rice supply chain consisting of purchasing organic it from PT Lingkar Organik Indonesia and reselling it to consumers. Maga Swalayan bought organic red rice from PT Lingkar Organik Indonesia around 60 packs in 1 kg packaging for 15,000 IDR. PT Lingkar Organik Indonesia usually only made deliveries to the swalayan. The long delivery and the insignificant quantity from PT Lingkar Organik Indonesia resulted in the scarcity of organic red rice products at Maga Swalayan. Therefore, the swalayan tried to negotiate with PT Lingkar Organik Indonesia to change the collaboration into a purchase order system. Payment from Maga Swalayan to PT Lingkar Organik was made by transfer one week after the note’s signature. Maga Swalayan sold organic red rice to household consumers at 16,500 IDR.
3.1.6 Progo Store
Similarly, activities carried out by Progo Store related to the organic red rice supply chain were purchasing it from PT Lingkar Organik Indonesia and reselling it to consumers. Progo Store bought organic red rice from PT Lingkar Organik Indonesia around 60 packs in 2.5 kg packaging at 37,500 IDR. It always placed an order by issuing a purchase order, which had to be taken by the sales of PT Lingkar Organik Indonesia. Progo Store, on average, ordered it once a week. The payment system was carried out through bank transfer. The store sold organic red rice to household consumers for 40,000 IDR.
3.1.7 Mirota
Activities carried out by Mirota regarding the organic red rice supply chain were purchasing it from PT Lingkar Organik Indonesia and reselling it to consumers. Mirota bought organic red rice from PT Lingkar Organik Indonesia in 1 kg packaging for 15,000 IDR and 2.5 kg packaging for 37,500 IDR. Mirota always placed an order by issuing a purchase order, which had to be taken by PT Lingkar Organik Indonesia. The payment was made in cash. Mirota sold organic red rice to final household consumers at a price of 17,200 IDR and 42,000 IDR.
3.1.8 Panti Rapih Hospital
As an industrial consumer, the activity carried out by this hospital was purchasing organic red rice in large packaging. Purchases were made directly from PT Lingkar Organik Indonesia. The purchase time was adjusted to the hospital kitchen’s needs, an average of 1-2 times a month. The hospital would place an order with PT Lingkar Organik Indonesia two days before the rice was shipped. Reservations were made by phone. The amount required was also not fixed for each transaction. The average purchase amount was around 50-75 kg, with a price of 15,000 IDR for each kilogram. Organic red rice purchased from PT Lingkar Organik Indonesia was packaged in a plain sack of 25 kg size. The payment was made in cash.
3.1.9 Household Consumers
Apart from industrial consumers, the last actor in the organic red rice supply chain through PT Lingkar Organik also included household consumers, namely individuals who purchased organic red rice at retail for their own or family needs. Household consumers purchased organic red rice in small packages and quantities.
3.2 Organic Red Rice Supply Chain Performance
The supply chain performance of organic red rice through PT Lingkar Organik Indonesia could be assessed from the three flows occurring within it, comprising product flow, money flow, and information flow. Each performance in the supply chain structure of organic red rice through PT Lingkar Organik Indonesia is as follows:
3.2.1 Chain I: Farmers - Collecting Trader - PT Lingkar Organik Indonesia - Pamella – Consumers
The product flow was from organic red rice farmers in Pakem through PT Lingkar Organik Indonesia to final consumers in the Yogyakarta Special Region. The product flow from collecting trader to PT Lingkar Organik was quite smooth because of the total scores ranging from 16.3 to 25.5. The product flow was quite smooth because it was influenced by quality and cleanliness indicators having low scores. Another indicator of having a low score was the packaging. This result is different from [17] regarding the supply chain of coconut derivative products at PT. Royal Coconut Minahasa Utara states that the flow of goods in the coconut flour supply chain is not smooth due to insufficient supply of raw materials because last year there was a long and impactful summer this year. Thus, it is known that the substandard flow of goods results in delays in the supply chain process that occurs.
Money flow from the end consumers to organic red rice farmers is categorized as smooth. In the money flow from PT Lingkar Organik Indonesia to collecting trader, the cooperation between them has had a formal contract agreement, where the agreement’s points included the transaction method, transaction payment method, and payment time. The transaction method and transaction payment were always carried out based on the agreement in the contract.
7
E3S Web of Conferences 232, 02011 (2021) https://doi.org/10.1051/e3sconf/202123202011IConARD 2020
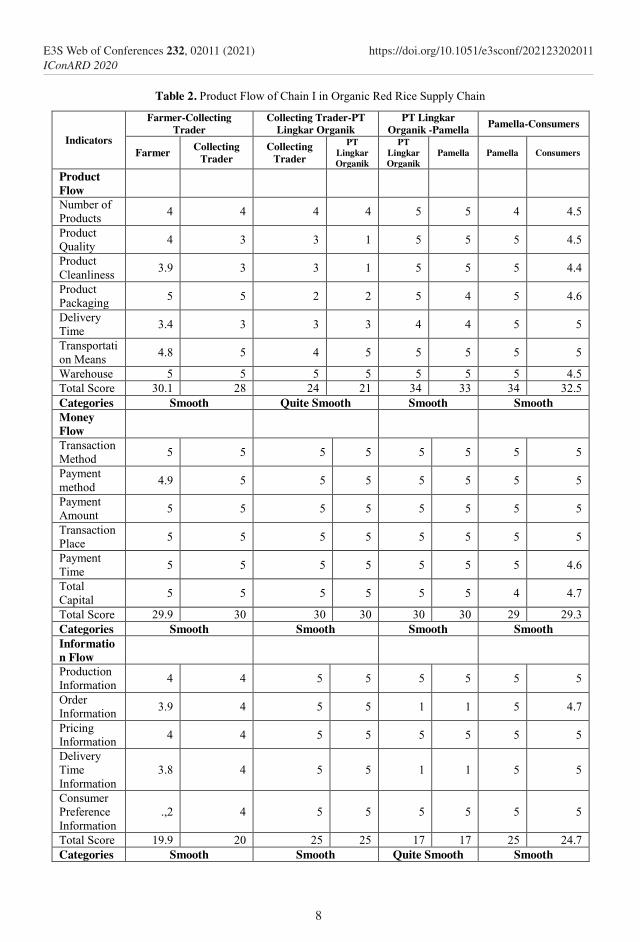
Table 2. Product Flow of Chain I in Organic Red Rice Supply Chain
Indicators
Farmer-Collecting Trader
Collecting Trader-PT Lingkar Organik
PT Lingkar Organik -Pamella Pamella-Consumers
Farmer Collecting Trader
Collecting Trader
PT Lingkar Organik
PT Lingkar Organik
Pamella Pamella Consumers
Product Flow
Number of Products
4 4 4 4 5 5 4 4.5
Product Quality
4 3 3 1 5 5 5 4.5
Product Cleanliness
3.9 3 3 1 5 5 5 4.4
Product Packaging
5 5 2 2 5 4 5 4.6
Delivery Time
3.4 3 3 3 4 4 5 5
Transportation Means
4.8 5 4 5 5 5 5 5
Warehouse 5 5 5 5 5 5 5 4.5 Total Score 30.1 28 24 21 34 33 34 32.5 Categories Smooth Quite Smooth Smooth Smooth Money Flow
Transaction Method
5 5 5 5 5 5 5 5
Payment method
4.9 5 5 5 5 5 5 5
Payment Amount
5 5 5 5 5 5 5 5
Transaction Place
5 5 5 5 5 5 5 5
Payment Time
5 5 5 5 5 5 5 4.6
Total Capital
5 5 5 5 5 5 4 4.7
Total Score 29.9 30 30 30 30 30 29 29.3 Categories Smooth Smooth Smooth Smooth Information Flow
Production Information
4 4 5 5 5 5 5 5
Order Information
3.9 4 5 5 1 1 5 4.7
Pricing Information
4 4 5 5 5 5 5 5
Delivery Time Information
3.8 4 5 5 1 1 5 5
Consumer Preference Information
.,2 4 5 5 5 5 5 5
Total Score 19.9 20 25 25 17 17 25 24.7 Categories Smooth Smooth Quite Smooth Smooth
8
E3S Web of Conferences 232, 02011 (2021) https://doi.org/10.1051/e3sconf/202123202011IConARD 2020
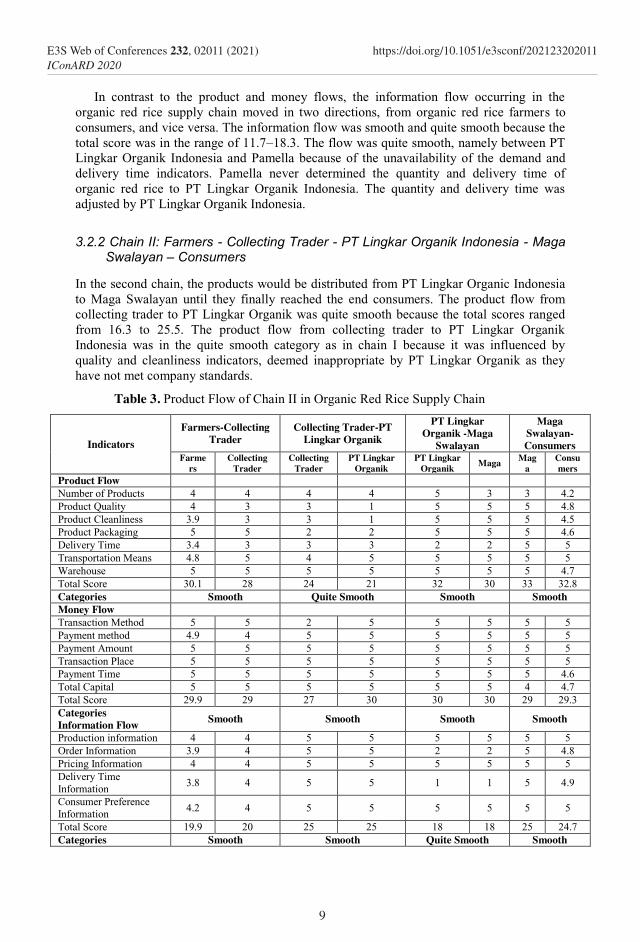
Table 2. Product Flow of Chain I in Organic Red Rice Supply Chain
Indicators
Farmer-Collecting Trader
Collecting Trader-PT Lingkar Organik
PT Lingkar Organik -Pamella Pamella-Consumers
Farmer Collecting Trader
Collecting Trader
PT Lingkar Organik
PT Lingkar Organik
Pamella Pamella Consumers
Product Flow
Number of Products
4 4 4 4 5 5 4 4.5
Product Quality
4 3 3 1 5 5 5 4.5
Product Cleanliness
3.9 3 3 1 5 5 5 4.4
Product Packaging
5 5 2 2 5 4 5 4.6
Delivery Time
3.4 3 3 3 4 4 5 5
Transportation Means
4.8 5 4 5 5 5 5 5
Warehouse 5 5 5 5 5 5 5 4.5 Total Score 30.1 28 24 21 34 33 34 32.5 Categories Smooth Quite Smooth Smooth Smooth Money Flow
Transaction Method
5 5 5 5 5 5 5 5
Payment method
4.9 5 5 5 5 5 5 5
Payment Amount
5 5 5 5 5 5 5 5
Transaction Place
5 5 5 5 5 5 5 5
Payment Time
5 5 5 5 5 5 5 4.6
Total Capital
5 5 5 5 5 5 4 4.7
Total Score 29.9 30 30 30 30 30 29 29.3 Categories Smooth Smooth Smooth Smooth Information Flow
Production Information
4 4 5 5 5 5 5 5
Order Information
3.9 4 5 5 1 1 5 4.7
Pricing Information
4 4 5 5 5 5 5 5
Delivery Time Information
3.8 4 5 5 1 1 5 5
Consumer Preference Information
.,2 4 5 5 5 5 5 5
Total Score 19.9 20 25 25 17 17 25 24.7 Categories Smooth Smooth Quite Smooth Smooth
In contrast to the product and money flows, the information flow occurring in the organic red rice supply chain moved in two directions, from organic red rice farmers to consumers, and vice versa. The information flow was smooth and quite smooth because the total score was in the range of 11.7–18.3. The flow was quite smooth, namely between PT Lingkar Organik Indonesia and Pamella because of the unavailability of the demand and delivery time indicators. Pamella never determined the quantity and delivery time of organic red rice to PT Lingkar Organik Indonesia. The quantity and delivery time was adjusted by PT Lingkar Organik Indonesia.
3.2.2 Chain II: Farmers - Collecting Trader - PT Lingkar Organik Indonesia - Maga Swalayan – Consumers
In the second chain, the products would be distributed from PT Lingkar Organic Indonesia to Maga Swalayan until they finally reached the end consumers. The product flow from collecting trader to PT Lingkar Organik was quite smooth because the total scores ranged from 16.3 to 25.5. The product flow from collecting trader to PT Lingkar Organik Indonesia was in the quite smooth category as in chain I because it was influenced by quality and cleanliness indicators, deemed inappropriate by PT Lingkar Organik as they have not met company standards.
Table 3. Product Flow of Chain II in Organic Red Rice Supply Chain
Indicators Farmers-Collecting
Trader Collecting Trader-PT
Lingkar Organik PT Lingkar
Organik -Maga Swalayan
Maga Swalayan-Consumers
Farmers
Collecting Trader
Collecting Trader
PT Lingkar Organik
PT Lingkar Organik Maga Mag
a Consumers
Product Flow Number of Products 4 4 4 4 5 3 3 4.2 Product Quality 4 3 3 1 5 5 5 4.8 Product Cleanliness 3.9 3 3 1 5 5 5 4.5 Product Packaging 5 5 2 2 5 5 5 4.6 Delivery Time 3.4 3 3 3 2 2 5 5 Transportation Means 4.8 5 4 5 5 5 5 5 Warehouse 5 5 5 5 5 5 5 4.7 Total Score 30.1 28 24 21 32 30 33 32.8 Categories Smooth Quite Smooth Smooth Smooth Money Flow Transaction Method 5 5 2 5 5 5 5 5 Payment method 4.9 4 5 5 5 5 5 5 Payment Amount 5 5 5 5 5 5 5 5 Transaction Place 5 5 5 5 5 5 5 5 Payment Time 5 5 5 5 5 5 5 4.6 Total Capital 5 5 5 5 5 5 4 4.7 Total Score 29.9 29 27 30 30 30 29 29.3 Categories Information Flow Smooth Smooth Smooth Smooth
Production information 4 4 5 5 5 5 5 5 Order Information 3.9 4 5 5 2 2 5 4.8 Pricing Information 4 4 5 5 5 5 5 5 Delivery Time Information
3.8 4 5 5 1 1 5 4.9
Consumer Preference Information
4.2 4 5 5 5 5 5 5
Total Score 19.9 20 25 25 18 18 25 24.7 Categories Smooth Smooth Quite Smooth Smooth
9
E3S Web of Conferences 232, 02011 (2021) https://doi.org/10.1051/e3sconf/202123202011IConARD 2020
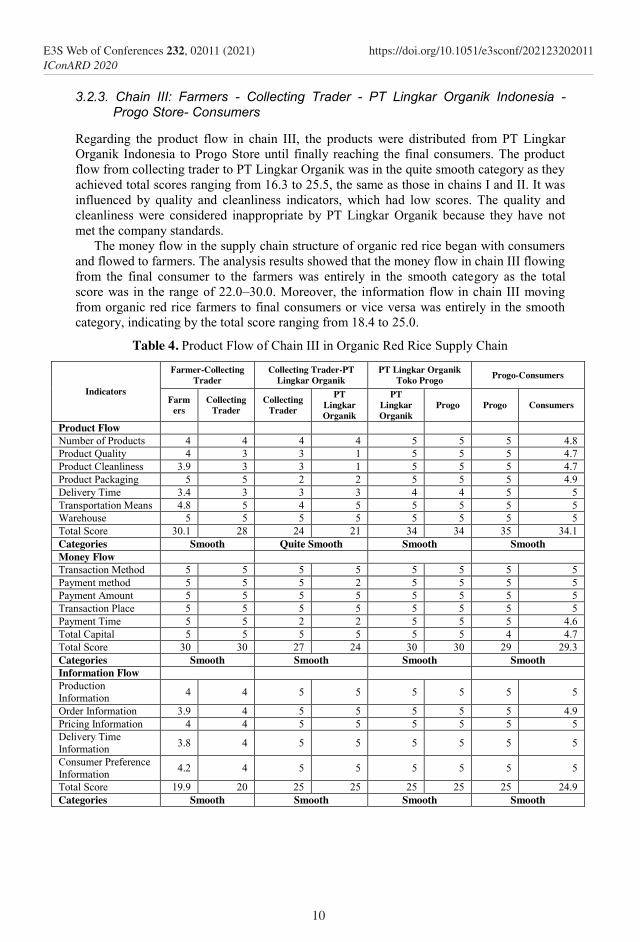
3.2.3. Chain III: Farmers - Collecting Trader - PT Lingkar Organik Indonesia - Progo Store- Consumers
Regarding the product flow in chain III, the products were distributed from PT Lingkar Organik Indonesia to Progo Store until finally reaching the final consumers. The product flow from collecting trader to PT Lingkar Organik was in the quite smooth category as they achieved total scores ranging from 16.3 to 25.5, the same as those in chains I and II. It was influenced by quality and cleanliness indicators, which had low scores. The quality and cleanliness were considered inappropriate by PT Lingkar Organik because they have not met the company standards.
The money flow in the supply chain structure of organic red rice began with consumers and flowed to farmers. The analysis results showed that the money flow in chain III flowing from the final consumer to the farmers was entirely in the smooth category as the total score was in the range of 22.0–30.0. Moreover, the information flow in chain III moving from organic red rice farmers to final consumers or vice versa was entirely in the smooth category, indicating by the total score ranging from 18.4 to 25.0.
Table 4. Product Flow of Chain III in Organic Red Rice Supply Chain
Indicators
Farmer-Collecting Trader
Collecting Trader-PT Lingkar Organik
PT Lingkar Organik Toko Progo Progo-Consumers
Farmers
Collecting Trader
Collecting Trader
PT Lingkar Organik
PT Lingkar Organik
Progo Progo Consumers
Product Flow Number of Products 4 4 4 4 5 5 5 4.8 Product Quality 4 3 3 1 5 5 5 4.7 Product Cleanliness 3.9 3 3 1 5 5 5 4.7 Product Packaging 5 5 2 2 5 5 5 4.9 Delivery Time 3.4 3 3 3 4 4 5 5 Transportation Means 4.8 5 4 5 5 5 5 5 Warehouse 5 5 5 5 5 5 5 5 Total Score 30.1 28 24 21 34 34 35 34.1 Categories Smooth Quite Smooth Smooth Smooth Money Flow Transaction Method 5 5 5 5 5 5 5 5 Payment method 5 5 5 2 5 5 5 5 Payment Amount 5 5 5 5 5 5 5 5 Transaction Place 5 5 5 5 5 5 5 5 Payment Time 5 5 2 2 5 5 5 4.6 Total Capital 5 5 5 5 5 5 4 4.7 Total Score 30 30 27 24 30 30 29 29.3 Categories Smooth Smooth Smooth Smooth Information Flow Production Information
4 4 5 5 5 5 5 5
Order Information 3.9 4 5 5 5 5 5 4.9 Pricing Information 4 4 5 5 5 5 5 5 Delivery Time Information
3.8 4 5 5 5 5 5 5
Consumer Preference Information
4.2 4 5 5 5 5 5 5
Total Score 19.9 20 25 25 25 25 25 24.9 Categories Smooth Smooth Smooth Smooth
10
E3S Web of Conferences 232, 02011 (2021) https://doi.org/10.1051/e3sconf/202123202011IConARD 2020
3.2.3. Chain III: Farmers - Collecting Trader - PT Lingkar Organik Indonesia - Progo Store- Consumers
Regarding the product flow in chain III, the products were distributed from PT Lingkar Organik Indonesia to Progo Store until finally reaching the final consumers. The product flow from collecting trader to PT Lingkar Organik was in the quite smooth category as they achieved total scores ranging from 16.3 to 25.5, the same as those in chains I and II. It was influenced by quality and cleanliness indicators, which had low scores. The quality and cleanliness were considered inappropriate by PT Lingkar Organik because they have not met the company standards.
The money flow in the supply chain structure of organic red rice began with consumers and flowed to farmers. The analysis results showed that the money flow in chain III flowing from the final consumer to the farmers was entirely in the smooth category as the total score was in the range of 22.0–30.0. Moreover, the information flow in chain III moving from organic red rice farmers to final consumers or vice versa was entirely in the smooth category, indicating by the total score ranging from 18.4 to 25.0.
Table 4. Product Flow of Chain III in Organic Red Rice Supply Chain
Indicators
Farmer-Collecting Trader
Collecting Trader-PT Lingkar Organik
PT Lingkar Organik Toko Progo Progo-Consumers
Farmers
Collecting Trader
Collecting Trader
PT Lingkar Organik
PT Lingkar Organik
Progo Progo Consumers
Product Flow Number of Products 4 4 4 4 5 5 5 4.8 Product Quality 4 3 3 1 5 5 5 4.7 Product Cleanliness 3.9 3 3 1 5 5 5 4.7 Product Packaging 5 5 2 2 5 5 5 4.9 Delivery Time 3.4 3 3 3 4 4 5 5 Transportation Means 4.8 5 4 5 5 5 5 5 Warehouse 5 5 5 5 5 5 5 5 Total Score 30.1 28 24 21 34 34 35 34.1 Categories Smooth Quite Smooth Smooth Smooth Money Flow Transaction Method 5 5 5 5 5 5 5 5 Payment method 5 5 5 2 5 5 5 5 Payment Amount 5 5 5 5 5 5 5 5 Transaction Place 5 5 5 5 5 5 5 5 Payment Time 5 5 2 2 5 5 5 4.6 Total Capital 5 5 5 5 5 5 4 4.7 Total Score 30 30 27 24 30 30 29 29.3 Categories Smooth Smooth Smooth Smooth Information Flow Production Information
4 4 5 5 5 5 5 5
Order Information 3.9 4 5 5 5 5 5 4.9 Pricing Information 4 4 5 5 5 5 5 5 Delivery Time Information
3.8 4 5 5 5 5 5 5
Consumer Preference Information
4.2 4 5 5 5 5 5 5
Total Score 19.9 20 25 25 25 25 25 24.9 Categories Smooth Smooth Smooth Smooth
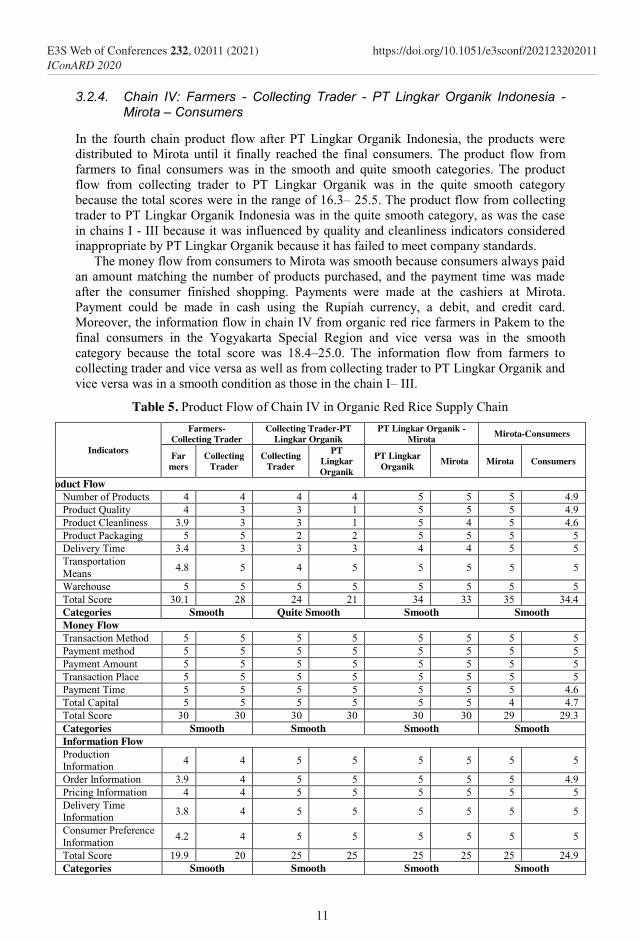
3.2.4. Chain IV: Farmers - Collecting Trader - PT Lingkar Organik Indonesia - Mirota – Consumers
In the fourth chain product flow after PT Lingkar Organik Indonesia, the products were distributed to Mirota until it finally reached the final consumers. The product flow from farmers to final consumers was in the smooth and quite smooth categories. The product flow from collecting trader to PT Lingkar Organik was in the quite smooth category because the total scores were in the range of 16.3– 25.5. The product flow from collecting trader to PT Lingkar Organik Indonesia was in the quite smooth category, as was the case in chains I - III because it was influenced by quality and cleanliness indicators considered inappropriate by PT Lingkar Organik because it has failed to meet company standards.
The money flow from consumers to Mirota was smooth because consumers always paid an amount matching the number of products purchased, and the payment time was made after the consumer finished shopping. Payments were made at the cashiers at Mirota. Payment could be made in cash using the Rupiah currency, a debit, and credit card. Moreover, the information flow in chain IV from organic red rice farmers in Pakem to the final consumers in the Yogyakarta Special Region and vice versa was in the smooth category because the total score was 18.4–25.0. The information flow from farmers to collecting trader and vice versa as well as from collecting trader to PT Lingkar Organik and vice versa was in a smooth condition as those in the chain I– III.
Table 5. Product Flow of Chain IV in Organic Red Rice Supply Chain
Indicators
Farmers-Collecting Trader
Collecting Trader-PT Lingkar Organik
PT Lingkar Organik -Mirota Mirota-Consumers
Farmers
Collecting Trader
Collecting Trader
PT Lingkar Organik
PT Lingkar Organik Mirota Mirota Consumers
Product Flow Number of Products 4 4 4 4 5 5 5 4.9 Product Quality 4 3 3 1 5 5 5 4.9 Product Cleanliness 3.9 3 3 1 5 4 5 4.6 Product Packaging 5 5 2 2 5 5 5 5 Delivery Time 3.4 3 3 3 4 4 5 5 Transportation Means
4.8 5 4 5 5 5 5 5
Warehouse 5 5 5 5 5 5 5 5 Total Score 30.1 28 24 21 34 33 35 34.4 Categories Smooth Quite Smooth Smooth Smooth Money Flow Transaction Method 5 5 5 5 5 5 5 5 Payment method 5 5 5 5 5 5 5 5 Payment Amount 5 5 5 5 5 5 5 5 Transaction Place 5 5 5 5 5 5 5 5 Payment Time 5 5 5 5 5 5 5 4.6 Total Capital 5 5 5 5 5 5 4 4.7 Total Score 30 30 30 30 30 30 29 29.3 Categories Smooth Smooth Smooth Smooth Information Flow Production Information
4 4 5 5 5 5 5 5
Order Information 3.9 4 5 5 5 5 5 4.9 Pricing Information 4 4 5 5 5 5 5 5 Delivery Time Information
3.8 4 5 5 5 5 5 5
Consumer Preference Information
4.2 4 5 5 5 5 5 5
Total Score 19.9 20 25 25 25 25 25 24.9 Categories Smooth Smooth Smooth Smooth
11
E3S Web of Conferences 232, 02011 (2021) https://doi.org/10.1051/e3sconf/202123202011IConARD 2020
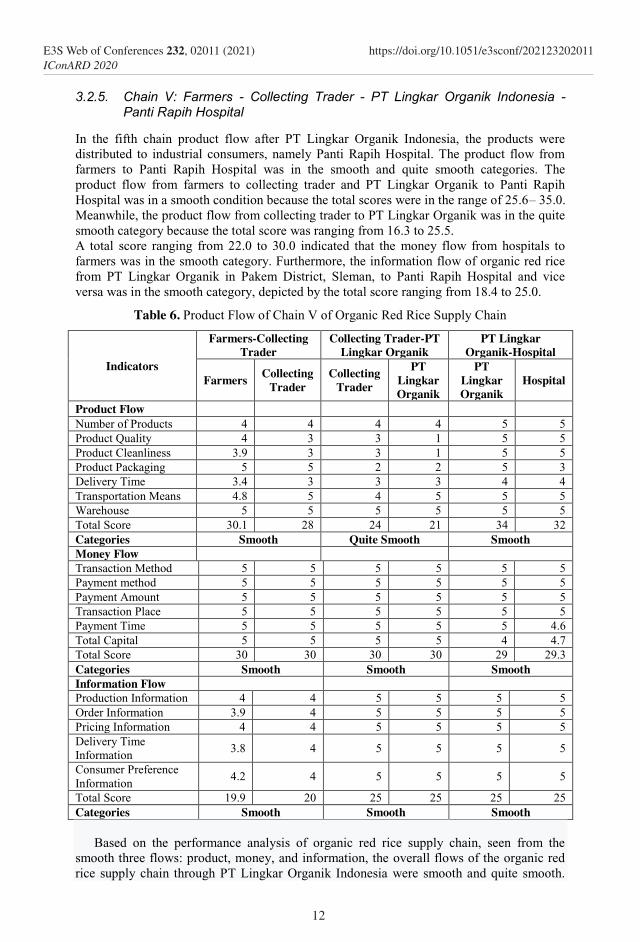
3.2.5. Chain V: Farmers - Collecting Trader - PT Lingkar Organik Indonesia - Panti Rapih Hospital
In the fifth chain product flow after PT Lingkar Organik Indonesia, the products were distributed to industrial consumers, namely Panti Rapih Hospital. The product flow from farmers to Panti Rapih Hospital was in the smooth and quite smooth categories. The product flow from farmers to collecting trader and PT Lingkar Organik to Panti Rapih Hospital was in a smooth condition because the total scores were in the range of 25.6– 35.0. Meanwhile, the product flow from collecting trader to PT Lingkar Organik was in the quite smooth category because the total score was ranging from 16.3 to 25.5. A total score ranging from 22.0 to 30.0 indicated that the money flow from hospitals to farmers was in the smooth category. Furthermore, the information flow of organic red rice from PT Lingkar Organik in Pakem District, Sleman, to Panti Rapih Hospital and vice versa was in the smooth category, depicted by the total score ranging from 18.4 to 25.0.
Table 6. Product Flow of Chain V of Organic Red Rice Supply Chain
Indicators
Farmers-Collecting Trader
Collecting Trader-PT Lingkar Organik
PT Lingkar Organik-Hospital
Farmers Collecting Trader
Collecting Trader
PT Lingkar Organik
PT Lingkar Organik
Hospital
Product Flow Number of Products 4 4 4 4 5 5 Product Quality 4 3 3 1 5 5 Product Cleanliness 3.9 3 3 1 5 5 Product Packaging 5 5 2 2 5 3 Delivery Time 3.4 3 3 3 4 4 Transportation Means 4.8 5 4 5 5 5 Warehouse 5 5 5 5 5 5 Total Score 30.1 28 24 21 34 32 Categories Smooth Quite Smooth Smooth Money Flow Transaction Method 5 5 5 5 5 5 Payment method 5 5 5 5 5 5 Payment Amount 5 5 5 5 5 5 Transaction Place 5 5 5 5 5 5 Payment Time 5 5 5 5 5 4.6 Total Capital 5 5 5 5 4 4.7 Total Score 30 30 30 30 29 29.3 Categories Smooth Smooth Smooth Information Flow Production Information 4 4 5 5 5 5 Order Information 3.9 4 5 5 5 5 Pricing Information 4 4 5 5 5 5 Delivery Time Information
3.8 4 5 5 5 5
Consumer Preference Information
4.2 4 5 5 5 5
Total Score 19.9 20 25 25 25 25 Categories Smooth Smooth Smooth
Based on the performance analysis of organic red rice supply chain, seen from the smooth three flows: product, money, and information, the overall flows of the organic red rice supply chain through PT Lingkar Organik Indonesia were smooth and quite smooth.
12
E3S Web of Conferences 232, 02011 (2021) https://doi.org/10.1051/e3sconf/202123202011IConARD 2020

3.2.5. Chain V: Farmers - Collecting Trader - PT Lingkar Organik Indonesia - Panti Rapih Hospital
In the fifth chain product flow after PT Lingkar Organik Indonesia, the products were distributed to industrial consumers, namely Panti Rapih Hospital. The product flow from farmers to Panti Rapih Hospital was in the smooth and quite smooth categories. The product flow from farmers to collecting trader and PT Lingkar Organik to Panti Rapih Hospital was in a smooth condition because the total scores were in the range of 25.6– 35.0. Meanwhile, the product flow from collecting trader to PT Lingkar Organik was in the quite smooth category because the total score was ranging from 16.3 to 25.5. A total score ranging from 22.0 to 30.0 indicated that the money flow from hospitals to farmers was in the smooth category. Furthermore, the information flow of organic red rice from PT Lingkar Organik in Pakem District, Sleman, to Panti Rapih Hospital and vice versa was in the smooth category, depicted by the total score ranging from 18.4 to 25.0.
Table 6. Product Flow of Chain V of Organic Red Rice Supply Chain
Indicators
Farmers-Collecting Trader
Collecting Trader-PT Lingkar Organik
PT Lingkar Organik-Hospital
Farmers Collecting Trader
Collecting Trader
PT Lingkar Organik
PT Lingkar Organik
Hospital
Product Flow Number of Products 4 4 4 4 5 5 Product Quality 4 3 3 1 5 5 Product Cleanliness 3.9 3 3 1 5 5 Product Packaging 5 5 2 2 5 3 Delivery Time 3.4 3 3 3 4 4 Transportation Means 4.8 5 4 5 5 5 Warehouse 5 5 5 5 5 5 Total Score 30.1 28 24 21 34 32 Categories Smooth Quite Smooth Smooth Money Flow Transaction Method 5 5 5 5 5 5 Payment method 5 5 5 5 5 5 Payment Amount 5 5 5 5 5 5 Transaction Place 5 5 5 5 5 5 Payment Time 5 5 5 5 5 4.6 Total Capital 5 5 5 5 4 4.7 Total Score 30 30 30 30 29 29.3 Categories Smooth Smooth Smooth Information Flow Production Information 4 4 5 5 5 5 Order Information 3.9 4 5 5 5 5 Pricing Information 4 4 5 5 5 5 Delivery Time Information
3.8 4 5 5 5 5
Consumer Preference Information
4.2 4 5 5 5 5
Total Score 19.9 20 25 25 25 25 Categories Smooth Smooth Smooth
Based on the performance analysis of organic red rice supply chain, seen from the smooth three flows: product, money, and information, the overall flows of the organic red rice supply chain through PT Lingkar Organik Indonesia were smooth and quite smooth.
The supply chain with the best performance is the fifth chain with the least number of actors. These results are in line with [20] that the supply chain of shallots from Nganjuk to Jakarta is more efficient than Brebes to Jakarta because there are fewer perpetrators even though the distance is farther. The organic red rice supply chain performance through PT Lingkar Organik Indonesia is presented in the following chart.
Fig. 2. The relationship structure of organic red rice supply chain through PT Lingkar Organik Indonesia
Explanation: Smooth Product Flow Quite Smooth Product Flow Smooth Money Flow Smooth Information Flow Quite Smooth Information Flow
4 Conclusion
The supply chain structure of organic red rice through PT Lingkar Organik Indonesia was formed by five chains, consisting of nine actors: farmers, collecting trader, PT Lingkar Organik Indonesia, Pamella Supermarkets, Maga Swalayan, Progo Store, Mirota, Panti Rapih Hospital, and household consumers. Each actor in the organic red rice supply chain had different activities. The smoothest flow of organic red rice product flow occurred in chain III, moving from Farmers - Collecting Trader - PT Lingkar Organik Indonesia - Progo Store - Household Consumers. The smoothest flow of money and information flows occurred in the chain V, which moved from Farmers – Collecting Trader - PT Lingkar Organik Indonesia - Panti Rapih Hospital. The best supply chain performance for organic red rice through PT Lingkar Organik Indonesia was in the chain V, namely Farmers – Collecting Trader - PT Lingkar Organik - Panti Rapih Hospital.
References
1. J. Pramono, Agrosains 6(1), 11 (2004). 2. I. Rahmawati, R., & Taryono, Analisis Perbandingan Rantai Distribusi Beras
Organik Di Desa Candingasinan, Kecamatan Banyu Urip Dan Desa Ringgit, Kecamatan Ngombol, Kabupaten Purworejo, Universitas Muhammadiyah Surakarta, 2017.
13
E3S Web of Conferences 232, 02011 (2021) https://doi.org/10.1051/e3sconf/202123202011IConARD 2020
3. I. Pujawan, Supply Chain Management (Guna Widya, Surabaya, 2005). 4. P. Chopra, S. & Meindl, Supply Chain Management: Strategy, Planning and
Operation Fourth Edition (New Jersey: Pearson Education, 2010). 5. D. Indrajit, & Eko, R., Konsep Manajemen Supply Chain: Strategi Mengelola
Manajemen Rantai Pasokan Bagi Perusahaan Modern Di Indonesia (PT Gramedia Widiasarana Indonesia, Jakarta, 2003).
6. Vorst, Performance Measurement In Agri-Food Supply Chain Networks: An Overview (Wageningen, 2006).
7. A. Aramyan, L., Ondersteijn, C., Kooten, O., & Oude Lansink, Quantifying Agri-Food Supply Chain 49 (2006).
8. D. R. Nurhuda, L., Setiawan, B., & Andriani, J. Ekon. Pertan. Dan Agribisnis 1(2), 129 (2018).
9. M. Susanawati dan Fauzan, Int. J. Supply Chain Manag. 8(1), 124 (2019). 10. N. Aryadi, Rantai Pasok Jamur Tiram Di Kabupaten Sleman, Universitas
Gajah Mada Yogyakarta, 2017. 11. Susanawati, Rantai Pasok Pertanian (UMY Press LP3M UMY, Yogyakarta,
2016). 12. N. Saptana & Ilham, J. Anal. Kebijak. Pertan. 15, 83 (2017). 13. S. S. Sharma, V., Giri, S., & Rai, Int. J. Manag. Value Supply Chain. 4 (1), 25
(2013). 14. Richardo, UNES J. Soc. Econ. Res. 2 (2), (2017). 15. M. Suoth, O., Sumarauw, J. S., & Karuntu, J. EMBA J. Ris. Ekon.
Manajemen, Bisnis Dan Akunt. 5 (2), (2017). 16. S. Purwandoko, P. B., Seminar, K. B., Sutrisno, S., & Sugiyanta, J. Pangan 27
(3), 187 (2005). 17. R. J. Piri, S. D., & Jorie, J. EMBA J. Ris. Ekon. Manajemen, Bisnis Dan
Akunt. 4 (2), (2016). 18. A. Saragih, A. E., Tinaprilla, N., & Rifin, J. Manaj. Agribisnis 14 (3), 218
(2017). 19. D. R. Istiyanti, E., & Kamardiani, Agrar. J. Agribus. Rural Dev. Res. 3 (1), 23
(2017). 20. D. Susanawati, Jamhari, Masyhuri, & Darwanto, Int. J. Appl. Bus. Econ. Res.
15, 283 (2017).
14
E3S Web of Conferences 232, 02011 (2021) https://doi.org/10.1051/e3sconf/202123202011IConARD 2020