Embed Size (px)
Citation preview
Supply Chain Resilience 2010
Copyright © 2010 The Business Continuity Institute. All Rights Reserved.
Supply Chain Resilience 2010
BCI survey of resilience professionals
Sponsored by:
2nd Annual Survey Published October 2010
Supply Chain Resilience 2010 2
Copyright © 2010 The Business Continuity Institute. All Rights Reserved. 2
Table of Contents 1.0 Executive Summary 3
1.1 Introduction 3
1.2 Key findings 3
1.3 Conclusions 4
2.0 Supply Chain Resilience - Main Report 6
2.1 Introduction & Survey Methodology 6
2.2 Recording, Measuring & Reporting on Supply Chain Disruption 6
2.3 Number of Supply Chain Incidents 7
2.4 Sources of Disruption 8
2.5 Measurable Impacts 10
3.0 Business Continuity Management in the Supply Chain 12
3.1 Application of BCM to the Supply Chain 12
3.2 Time-sensitivity in Supply Chains 13
4.0 Good Practice in Supply Chain BCM 15
4.1 Identifying Key Supply Chains 15
4.2 Visibility in the Supply Chain 16
4.3 Reviewing Plans with Key Suppliers 17
4.4 Building Trust and Confidence through Evidence and Validation 17
4.5 Negotiating with Suppliers 19
5.0 Considerations 22
5.1 The Impact of Supply Chain Optimization Strategies on Resilience 22
5.2 The Impact of Good Practice on Incident Levels 23
5.3 Incident Levels, Organization Size and Numbers of Suppliers 23
5.4 Sustainability Risks in the Supply Chain 24
5.5 The BCM Factor in Procurement Decisions 24
5.6 Perspectives from Supply Chain Management Practitioners 25
6.0 Respondent Profiles 26
By organization size, geographic location, industry sector and role. 26
7.0 Conclusions, Reflection and Next Steps 28
8.0 About BCM, the BCI & Zurich 29
Appendix A: Qualitative Statements Provided by Respondents. 30
Page
Supply Chain Resilience 2010 3
Copyright © 2010 The Business Continuity Institute. All Rights Reserved. 3
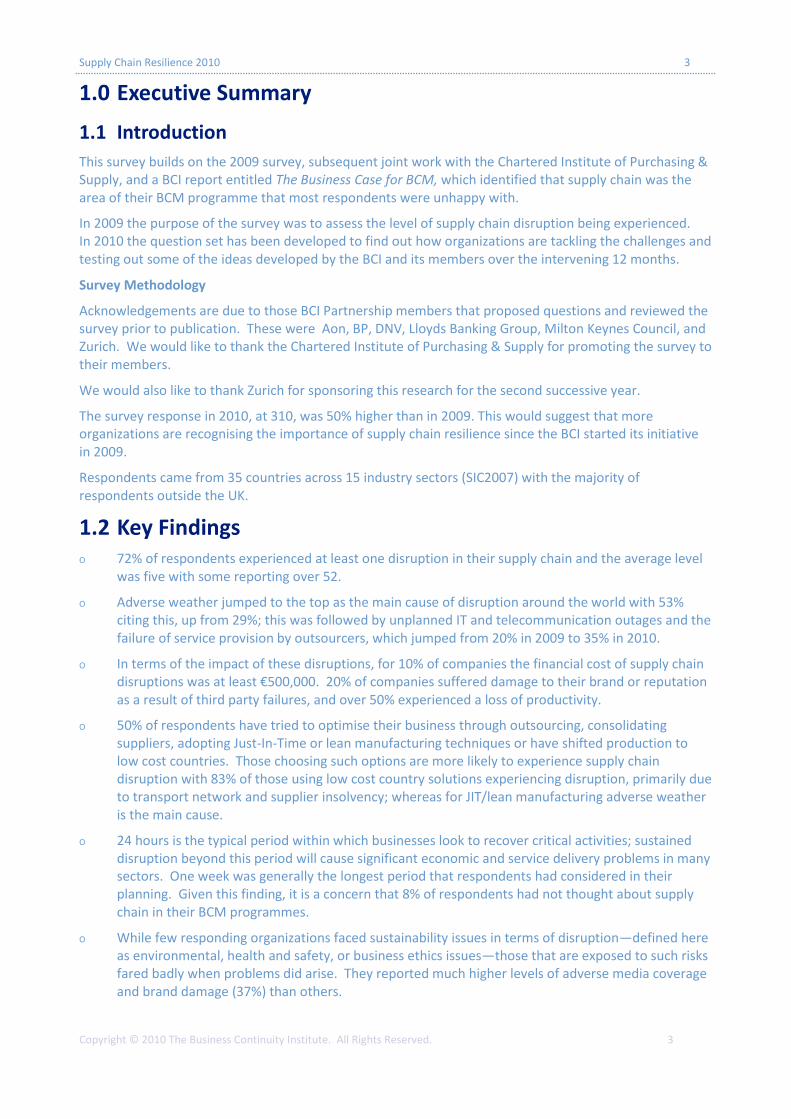
1.0 Executive Summary
1.1 Introduction
This survey builds on the 2009 survey, subsequent joint work with the Chartered Institute of Purchasing & Supply, and a BCI report entitled The Business Case for BCM, which identified that supply chain was the area of their BCM programme that most respondents were unhappy with.
In 2009 the purpose of the survey was to assess the level of supply chain disruption being experienced. In 2010 the question set has been developed to find out how organizations are tackling the challenges and testing out some of the ideas developed by the BCI and its members over the intervening 12 months.
Survey Methodology
Acknowledgements are due to those BCI Partnership members that proposed questions and reviewed the survey prior to publication. These were Aon, BP, DNV, Lloyds Banking Group, Milton Keynes Council, and Zurich. We would like to thank the Chartered Institute of Purchasing & Supply for promoting the survey to their members.
We would also like to thank Zurich for sponsoring this research for the second successive year.
The survey response in 2010, at 310, was 50% higher than in 2009. This would suggest that more organizations are recognising the importance of supply chain resilience since the BCI started its initiative in 2009.
Respondents came from 35 countries across 15 industry sectors (SIC2007) with the majority of respondents outside the UK.
1.2 Key Findings O 72% of respondents experienced at least one disruption in their supply chain and the average level
was five with some reporting over 52.
O Adverse weather jumped to the top as the main cause of disruption around the world with 53% citing this, up from 29%; this was followed by unplanned IT and telecommunication outages and the failure of service provision by outsourcers, which jumped from 20% in 2009 to 35% in 2010.
O In terms of the impact of these disruptions, for 10% of companies the financial cost of supply chain disruptions was at least €500,000. 20% of companies suffered damage to their brand or reputation as a result of third party failures, and over 50% experienced a loss of productivity.
O 50% of respondents have tried to optimise their business through outsourcing, consolidating suppliers, adopting Just-In-Time or lean manufacturing techniques or have shifted production to low cost countries. Those choosing such options are more likely to experience supply chain disruption with 83% of those using low cost country solutions experiencing disruption, primarily due to transport network and supplier insolvency; whereas for JIT/lean manufacturing adverse weather is the main cause.
O 24 hours is the typical period within which businesses look to recover critical activities; sustained disruption beyond this period will cause significant economic and service delivery problems in many sectors. One week was generally the longest period that respondents had considered in their planning. Given this finding, it is a concern that 8% of respondents had not thought about supply chain in their BCM programmes.
O While few responding organizations faced sustainability issues in terms of disruption—defined here as environmental, health and safety, or business ethics issues—those that are exposed to such risks fared badly when problems did arise. They reported much higher levels of adverse media coverage and brand damage (37%) than others.
Supply Chain Resilience 2010 4
Copyright © 2010 The Business Continuity Institute. All Rights Reserved. 4
O For BCM practitioners, the survey shows that while many are starting out on supply chain BCM, and 24% have not started, good practice is developing in a number of areas especially in identifying key partners via Business Impact Analysis and focusing efforts on this group rather than looking at every supply chain and its constituent partners.
O Advanced programmes are also marked by looking for evidence of not just a BCP but a wider BCM programme, and its scope and relevance for the product or service that organizations are reliant upon.
O However, the immaturity of supply chain BCM is evidenced by 15% of respondents not reviewing their business continuity plan with key suppliers, 18% not seeking evidence of BCM arrangements, and 50% of respondents not looking to validate that key supplier business continuity plans would actually work in practice.
O The financial services sector was more advanced in its approach to supply chain BCM across all indicators, for example, checking the supplier has a BCM programme in place, its scope and relevancy to the product or service being purchased and, in the context of this report, more likely to validate plans. The financial services sector was also the highest user of outsourcing with 87%.
O The manufacturing sector counts adverse weather and product quality issues as major causes of supply chain disruption; and not surprisingly the sector features high (73%) use of JIT and lean manufacturing techniques. However, this sector is less likely to review supplier plans and 73% have not validated plans will work in practice. Higher levels of increased force majeure invocation are also noteworthy at 36% (compared with the survey average of 14%).
O In the government, education, health and social care cluster, almost 50% did not record supply chain disruption. Cyber attacks/threats scored the highest levels at 24% compared with the survey average of 10%. This cluster of sectors is more prone to adverse media coverage at twice the survey average. Costs of disruption, where given, are also much higher with a third of responding organizations citing costs of €100K-€500K. This sector is less likely to identify key suppliers, review or validate plans.
O In the retail sector, supply chain disruption is virtually guaranteed, with the highest levels seen of any sector (average of ten per year). Use of Just-in-Time techniques scored 100% and 83% use supplier consolidation techniques.
O There are geographical variations in terms of the causes of supply chain disruption. In Australia and New Zealand, energy scarcity and fires featured prominently, while health and safety incidents featured prominently among USA respondents. The UK had the highest levels of reported disruption with 83%, compared with the survey average of 72%. In the ASEAN+ cluster, civil unrest and environmental incidents featured more prominently, whereas in the Central & Latin America cluster, cyber threats and terrorism scored highly.
1.3 Conclusions
Business Continuity Management is proving to be an effective technique to better understand supply chain dependencies and develop a robust strategy to deal with disruption. BCM provides a practical and proven methodology to ensure an organization’s own business continuity programme accounts for supply chain disruption as well as enable close and transparent work with supply chain partners to develop their resilience in turn.
BCM’s “all risks” approach saves time in guessing which threat will realise itself and cause the actual disruption, thereby allowing time to focus on indentifying vulnerabilities and developing preparedness to deal with what ever threat may eventually affect the organization’s supply chain. The survey provides invaluable evidence to support the business case for investment in effective BCM programmes by identifying the level of disruption being experienced and measurable consequential impacts.
Supply Chain Resilience 2010 5
Copyright © 2010 The Business Continuity Institute. All Rights Reserved. 5
Good practice is already evident in supply chain BCM and this requires identification of key partners, asking the right questions of them, and validating that their plans are likely to be effective when experiencing a disruptive incident.
Business strategies to extend or optimise supply chains are here to stay, but these are not ’cost free’ decisions. Most organizations sit at some point between the polarities of ‘no risk at any price’ and ‘lowest cost at any risk’ but the survey indicates that business continuity is still overlooked in supply chain decisions. The findings also highlight that increased disruption is a reality not just a threat when pursuing such decisions, however the intelligent application of BCM can help support organizations take advantage of such supply chain optimization techniques, as part of an overall enterprise-wide resilience strategy.
Reflection and Next Steps
As with earlier surveys, a key purpose of BCI surveys is to capture good practice in tackling common problems shared by business continuity management practitioners around the world. The BCI’s Good Practice Guidelines make limited reference to supply chain BCM, and we hope that future editions will be enhanced with the evolving body of good practice in this area. The BCI will also continue to run workshops in this area to facilitate discussion and sharing of experiences in terms of “what works”.
There is much more work to be done to convince supply chain and procurement practitioners of the importance of business continuity as a risk mitigation technique and we look forward to continuing our cooperation with the Chartered Institute of Purchasing & Supply.
Perhaps, the greater challenge is in embedding business continuity considerations in strategic and operational business decisions; this requires cooperation across a broad coalition of resilience professionals to demonstrate the benefits of such thinking in the context of the organization’s risk appetite.
Finally, we welcome feedback on this survey and its conclusions and will use this input to guide future work in this important area.
End of Executive Summary.
Supply Chain Resilience 2010 6
Copyright © 2010 The Business Continuity Institute. All Rights Reserved. 6
2.0 Supply Chain Resilience—Main Report
2.1 Introduction & Survey Methodology
This survey builds on the 2009 survey and subsequent joint work with the Chartered Institute of Purchasing & Supply and an earlier BCI report entitled The Business Case for BCM (March 2010) which identified that supply chain was the area of their BCM programme that most respondents were unhappy with.
In 2009 the purpose of the survey was to assess the level of supply chain disruption being experienced. In 2010 the question set has been developed to find out how organizations are tackling the challenges and testing out some of the ideas developed by the BCI and its members over the intervening 12 months.
This report is divided into the following sections: This Section 2 examines the level, source and impact of supply chain disruption, Section 3 considers the role of business continuity management in supply chain resilience, Section 4 looks at developing good practice in supply chain BCM; and Section 5 considers some of the underlying issues and relationships between supply chain decisions and business impact.
Survey Methodology
The online survey response in 2010 was 50% higher than in 2009 with 310 organizations responding. This clearly shows that more organizations are interested in the subject of supply chain resilience since the BCI started its initiative in 2009. The survey was conducted between June 30th and September 2nd 2010.
Respondents from 35 countries across 15 industry sectors (SIC2007) with the majority of respondents
outside the UK (52%).
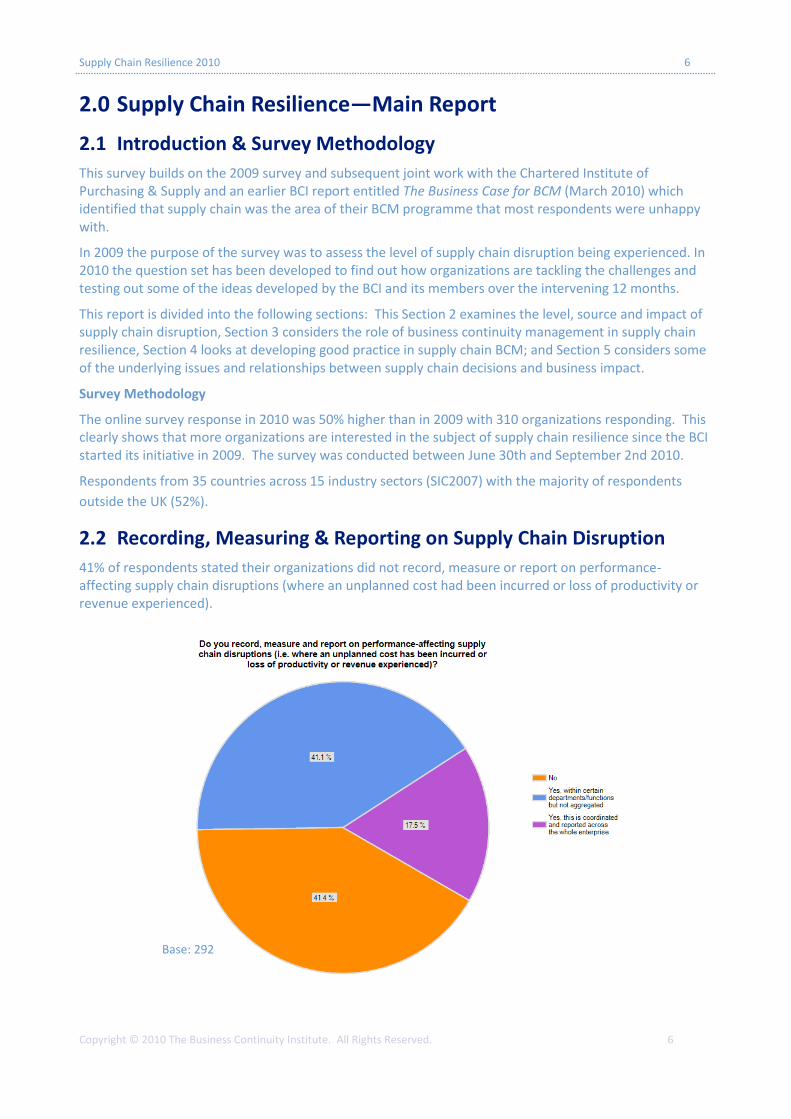
2.2 Recording, Measuring & Reporting on Supply Chain Disruption
41% of respondents stated their organizations did not record, measure or report on performance-affecting supply chain disruptions (where an unplanned cost had been incurred or loss of productivity or revenue experienced).
Base: 292
Supply Chain Resilience 2010 7
Copyright © 2010 The Business Continuity Institute. All Rights Reserved. 7
A further 41% of respondents either do this within certain departments or functions but not in an aggregated manner or coordinated and reported across the whole enterprise. Only 17.5% were able to say that disruption was coordinated and reported across the whole enterprise. This cohort of 171 was able to respond to most of the subsequent questions, while others dipped in and out of the survey.
Sector comparisons
Financial Services was more likely to have a co-ordinated enterprise-wide approach. All respondents in the manufacturing sector record, measure and report on supply chain disruption. While in the government, education, health and social care cluster, it is very unlikely that supply chain incidents will be reported across the whole organization (less than 10% do so) and almost half (49%) do not record anything at all.
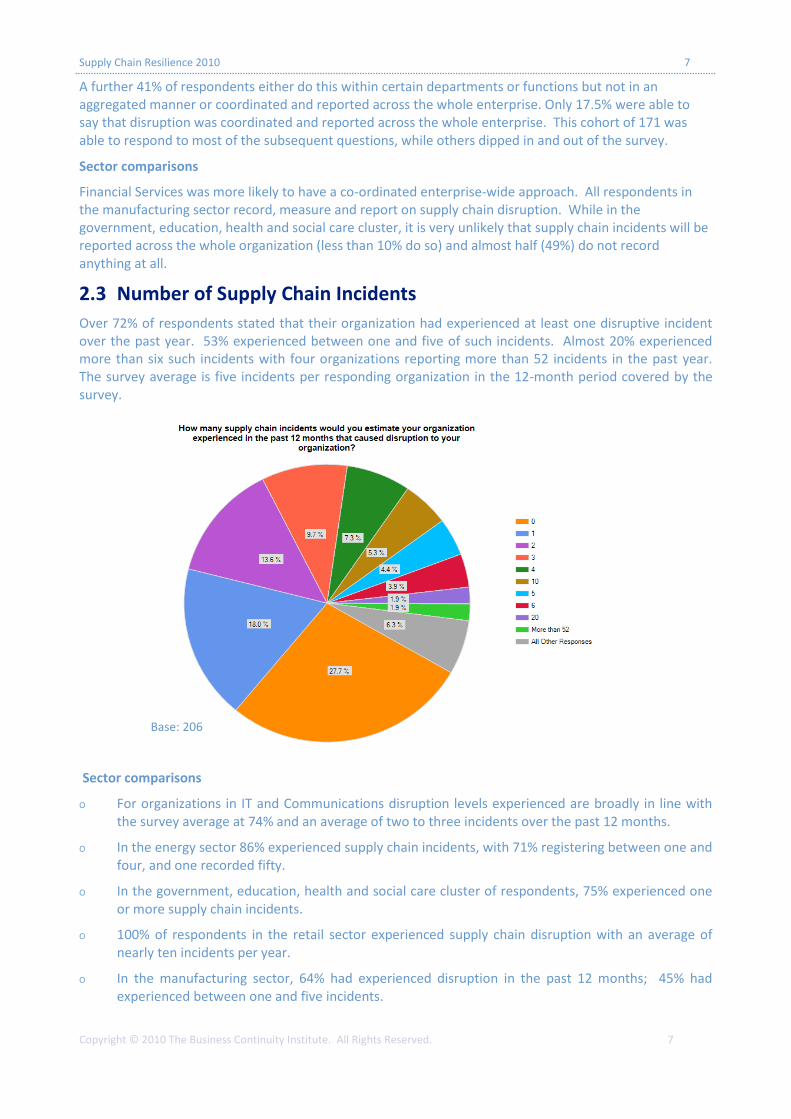
2.3 Number of Supply Chain Incidents
Over 72% of respondents stated that their organization had experienced at least one disruptive incident over the past year. 53% experienced between one and five of such incidents. Almost 20% experienced more than six such incidents with four organizations reporting more than 52 incidents in the past year. The survey average is five incidents per responding organization in the 12-month period covered by the survey.
Sector comparisons
O For organizations in IT and Communications disruption levels experienced are broadly in line with the survey average at 74% and an average of two to three incidents over the past 12 months.
O In the energy sector 86% experienced supply chain incidents, with 71% registering between one and four, and one recorded fifty.
O In the government, education, health and social care cluster of respondents, 75% experienced one or more supply chain incidents.
O 100% of respondents in the retail sector experienced supply chain disruption with an average of nearly ten incidents per year.
O In the manufacturing sector, 64% had experienced disruption in the past 12 months; 45% had experienced between one and five incidents.
Base: 206
Supply Chain Resilience 2010 8
Copyright © 2010 The Business Continuity Institute. All Rights Reserved. 8
Geographical comparisons
O In Australia and New Zealand, there were elevated levels of organizations experiencing at least one incident (80%).
O The USA shared Australia’s elevated levels of supply chain incidents.
O The UK experienced the highest level of supply chain disruption with 83% of respondents being affected by at least one incident.
O In the ASEAN+ cluster, there were the lowest levels of reported supply chain incidents (69%). The cluster includes China, India, Japan, South Korea, Philippines and Pakistan.
O A cluster of 13 European mainland countries provided responses broadly in line with the overall survey response.
O A small sample from Central & Latin America (CALA) - which included Barbados, Brazil, Colombia, Peru, Trinidad & Tobago — was broadly in line with the overall sample, although cyber threats score 40% along with acts of terrorism.
In this cluster 80% experienced negative media coverage as a result of supply chain disruption, while the primary impacts of the disruption were loss of revenue, increased cost of working and loss of productivity.
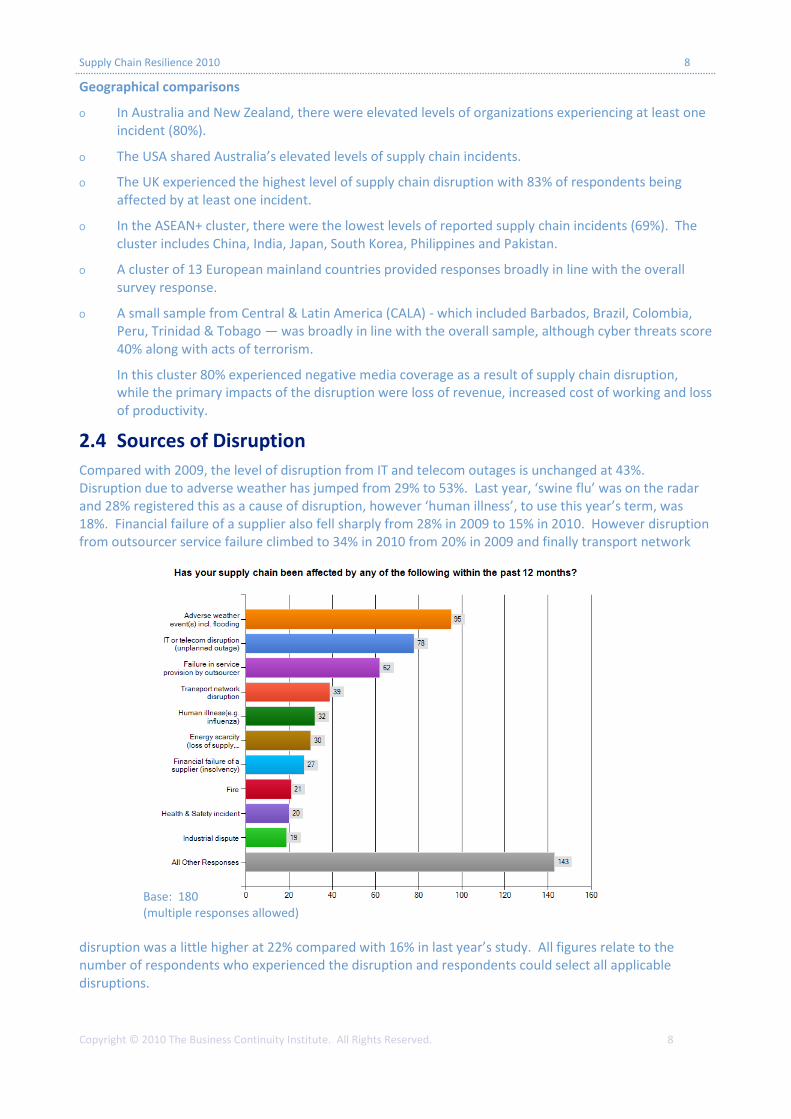
2.4 Sources of Disruption
Compared with 2009, the level of disruption from IT and telecom outages is unchanged at 43%. Disruption due to adverse weather has jumped from 29% to 53%. Last year, ‘swine flu’ was on the radar and 28% registered this as a cause of disruption, however ‘human illness’, to use this year’s term, was 18%. Financial failure of a supplier also fell sharply from 28% in 2009 to 15% in 2010. However disruption from outsourcer service failure climbed to 34% in 2010 from 20% in 2009 and finally transport network
disruption was a little higher at 22% compared with 16% in last year’s study. All figures relate to the number of respondents who experienced the disruption and respondents could select all applicable disruptions.
Base: 180 (multiple responses allowed)
Supply Chain Resilience 2010 9
Copyright © 2010 The Business Continuity Institute. All Rights Reserved. 9
The item in the chart (above) entitled “all other responses” included: adverse media coverage, tighter credit insurance conditions, intellectual property violation, loss or theft of confidential information, act of terrorism, civil unrest/conflict, cyber attack/threat, new laws or regulations, animal disease, environmental incident, product quality, unsatisfactory business or employment practices, and loss of talent/skills.
Sources of disruption identified separately by respondents included: Legal dispute between primary outsourcer and a third party outsourcer; a world sporting event; utility failure; G20 security plans; power failure; strike at port; protesters blocking roads to and from an establishment; excessive rain causing wet coal which limited capacity; and theft of a [service provider] cable.
Sector comparisons
O In Financial Services, the top cause of disruption was IT & telecom outages, which were much higher than the average with 67% reporting this disruption. Failure of service provision by an outsourcer was also higher than the average at 39%. Beyond the top five reported, the other causes of disruption - with higher than average response levels— in this sector were: adverse media coverage (15% compared with 10%) and civil unrest/conflict (18% compared 9%).
O In the manufacturing sector, the two main causes of disruption were adverse weather (60%) and product quality (40%). There was one case of intellectual property violation and one incident of unsatisfactory business or employment practices.
O In the government, education and health and social care cluster, the top five causes of disruption uniquely featured ‘cyber attack’ scoring 24% compared with just 10% in the overall sample. Generally, this sector experienced elevated levels of disruption across all of the primary causes of disruption.
O In Retail, the main causes of supply chain incidents were adverse weather, transport network disruption and failure in service provision by an outsourcer.
O The energy sector scored transport network disruption as the most frequent cause of disruption with 71% experiencing this problem, and ‘energy scarcity’ (loss of supply and/or price fluctuation) reached the top five causes of disruption.
Geographical comparisons
O For respondents in Australia & New Zealand, the top five causes of supply chain disruption were: IT & telecom outages (63%); energy scarcity (44%); adverse weather (38%); failure of service provision by an outsourcer (38%); and fire (31%).
The interesting differences to the overall survey response are clearly the prominence of ‘energy scarcity’ in the top three with 44%, which compares with just 17% in the overall response and the high level of disruption caused by fire, which is likely due to widely reported fires in parts of Australia earlier in the year.
O In the USA, the main causes of supply chain incidents were adverse weather, outsourcer service failure, health and safety incidents and unplanned IT/telecom outages. Noteworthy is that IT/telecom outages ‘only’ scored 29% suggesting much better resilience in the USA. In contrast with the rest of the survey respondents, health and safety incidents scored much higher than the average though.
O Looking at the top five causes of disruption in the UK, adverse weather scored high with 65% followed by unplanned IT and telecom outages with failure of service provision by outsourcers in third place with transport network disruption in fourth. A top five place was secured by supplier insolvency with 22%.
O In the ASEAN+ cluster, the primary causes of supply chain disruption were: adverse weather, unplanned IT and telecom outages, civil unrest/conflict (33%) and environmental incidents (25%).
Supply Chain Resilience 2010 10
Copyright © 2010 The Business Continuity Institute. All Rights Reserved. 10
O In the Middle East & Africa cluster (the sample was derived from respondents in Botswana,
Mauritius, Nigeria, Saudi Arabia and South Africa) the most reported types of disruption were
unplanned IT/telecom outages (57%) followed by outsourcer service failure and product quality.
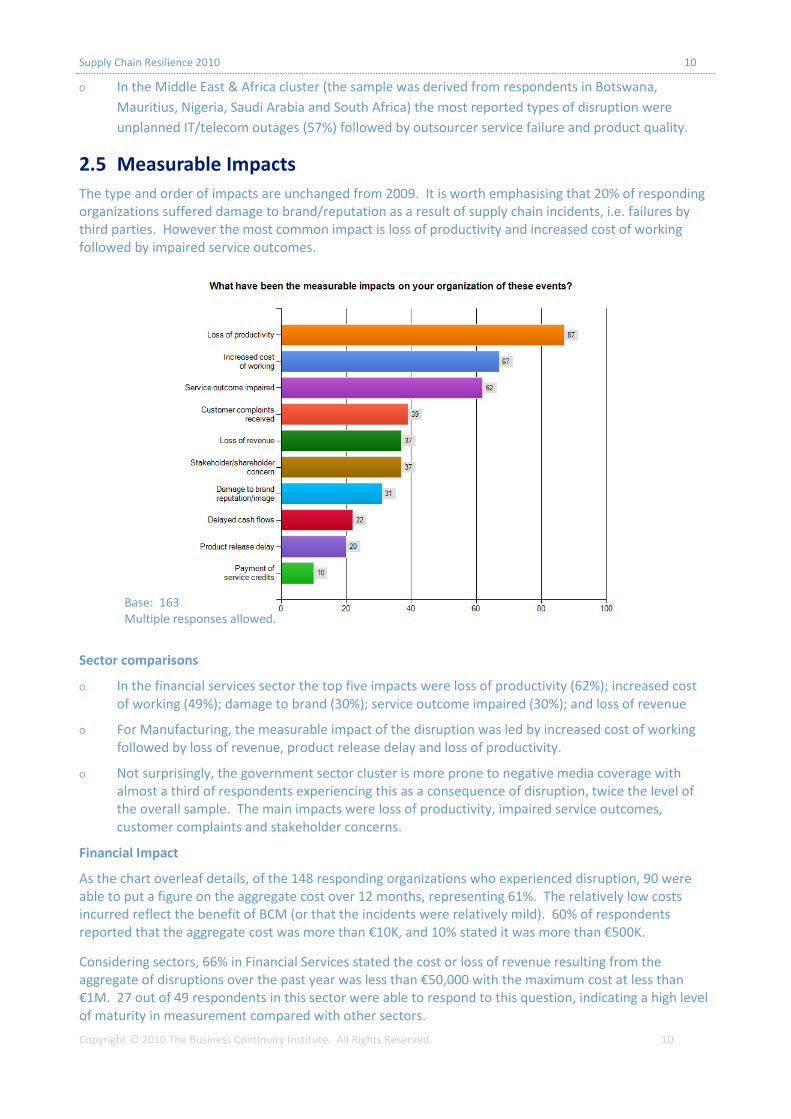
2.5 Measurable Impacts
The type and order of impacts are unchanged from 2009. It is worth emphasising that 20% of responding organizations suffered damage to brand/reputation as a result of supply chain incidents, i.e. failures by third parties. However the most common impact is loss of productivity and increased cost of working followed by impaired service outcomes.
Sector comparisons
O In the financial services sector the top five impacts were loss of productivity (62%); increased cost of working (49%); damage to brand (30%); service outcome impaired (30%); and loss of revenue
O For Manufacturing, the measurable impact of the disruption was led by increased cost of working followed by loss of revenue, product release delay and loss of productivity.
O Not surprisingly, the government sector cluster is more prone to negative media coverage with almost a third of respondents experiencing this as a consequence of disruption, twice the level of the overall sample. The main impacts were loss of productivity, impaired service outcomes, customer complaints and stakeholder concerns.
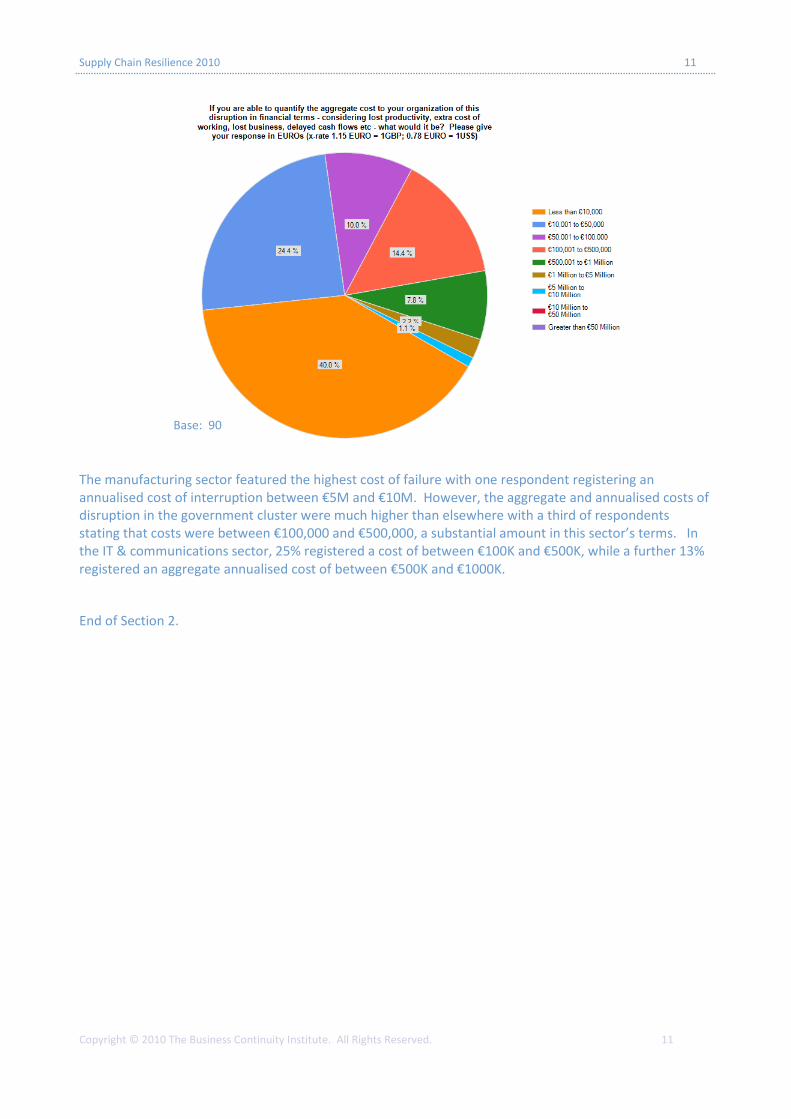
Financial Impact
As the chart overleaf details, of the 148 responding organizations who experienced disruption, 90 were able to put a figure on the aggregate cost over 12 months, representing 61%. The relatively low costs incurred reflect the benefit of BCM (or that the incidents were relatively mild). 60% of respondents reported that the aggregate cost was more than €10K, and 10% stated it was more than €500K.
Considering sectors, 66% in Financial Services stated the cost or loss of revenue resulting from the aggregate of disruptions over the past year was less than €50,000 with the maximum cost at less than €1M. 27 out of 49 respondents in this sector were able to respond to this question, indicating a high level of maturity in measurement compared with other sectors.
Base: 163 Multiple responses allowed.
Supply Chain Resilience 2010 11
Copyright © 2010 The Business Continuity Institute. All Rights Reserved. 11
The manufacturing sector featured the highest cost of failure with one respondent registering an annualised cost of interruption between €5M and €10M. However, the aggregate and annualised costs of disruption in the government cluster were much higher than elsewhere with a third of respondents stating that costs were between €100,000 and €500,000, a substantial amount in this sector’s terms. In the IT & communications sector, 25% registered a cost of between €100K and €500K, while a further 13% registered an aggregate annualised cost of between €500K and €1000K.
End of Section 2.
Base: 90
Supply Chain Resilience 2010 12
Copyright © 2010 The Business Continuity Institute. All Rights Reserved. 12
3.0 Business Continuity Management in the Supply Chain
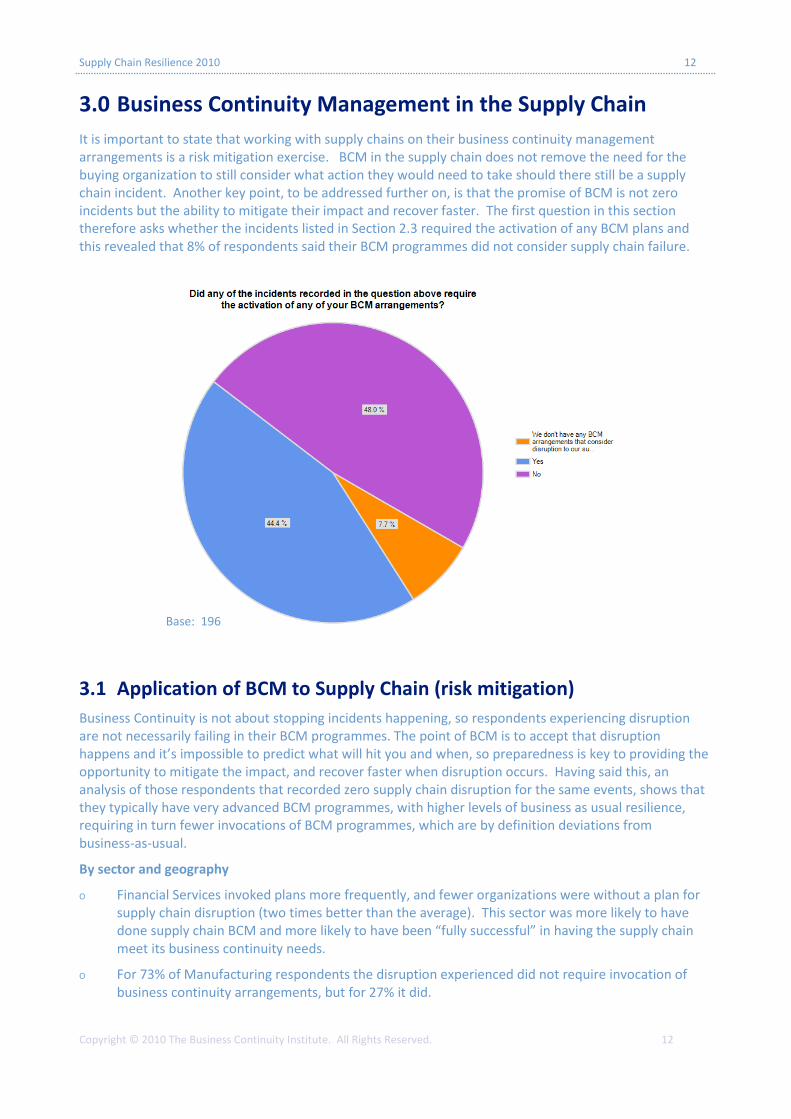
It is important to state that working with supply chains on their business continuity management arrangements is a risk mitigation exercise. BCM in the supply chain does not remove the need for the buying organization to still consider what action they would need to take should there still be a supply chain incident. Another key point, to be addressed further on, is that the promise of BCM is not zero incidents but the ability to mitigate their impact and recover faster. The first question in this section therefore asks whether the incidents listed in Section 2.3 required the activation of any BCM plans and this revealed that 8% of respondents said their BCM programmes did not consider supply chain failure.
3.1 Application of BCM to Supply Chain (risk mitigation)
Business Continuity is not about stopping incidents happening, so respondents experiencing disruption are not necessarily failing in their BCM programmes. The point of BCM is to accept that disruption happens and it’s impossible to predict what will hit you and when, so preparedness is key to providing the opportunity to mitigate the impact, and recover faster when disruption occurs. Having said this, an analysis of those respondents that recorded zero supply chain disruption for the same events, shows that they typically have very advanced BCM programmes, with higher levels of business as usual resilience, requiring in turn fewer invocations of BCM programmes, which are by definition deviations from business-as-usual.
By sector and geography
O Financial Services invoked plans more frequently, and fewer organizations were without a plan for supply chain disruption (two times better than the average). This sector was more likely to have done supply chain BCM and more likely to have been “fully successful” in having the supply chain meet its business continuity needs.
O For 73% of Manufacturing respondents the disruption experienced did not require invocation of business continuity arrangements, but for 27% it did.
Base: 196
Supply Chain Resilience 2010 13
Copyright © 2010 The Business Continuity Institute. All Rights Reserved. 13
O In terms of BCM in the supply chain, the government cluster is less likely to differentiate between suppliers in requesting they meet client needs, they therefore deal with many more suppliers and it is unusual for them to work through the full supply chain. 34% stated that they have not yet tackled supply chain BCM, 26% never review the BCP with suppliers, and 24% do not ask for any evidence of business continuity, while 61% do not validate plans to check whether they might work in practice.
O For Retail, in one third of cases the responding organization had to invoke the BCM arrangements. In one case the aggregated annualised cost of disruption was between €500,000 and €1,000,000.
O For the energy sector, BCP invocation was much higher with 57% having to do this as a result of the incidents experienced. All respondents relied on outsource partners and they primarily used supply chain management techniques to identify key suppliers rather than BCM. Their focus was on immediate suppliers (67%) with none working through the full supply chain.
O In the ASEAN+ cluster, there were much higher levels of BCP invocation with 54% being required to do so.
3.2 Time-sensitivity in Supply Chains
Question: For your organization, what time period or magnitude of disruption would you need to experience in the supply chain in order to invoke your business continuity response (i.e. Supply chain RTO in BCM terminology)?
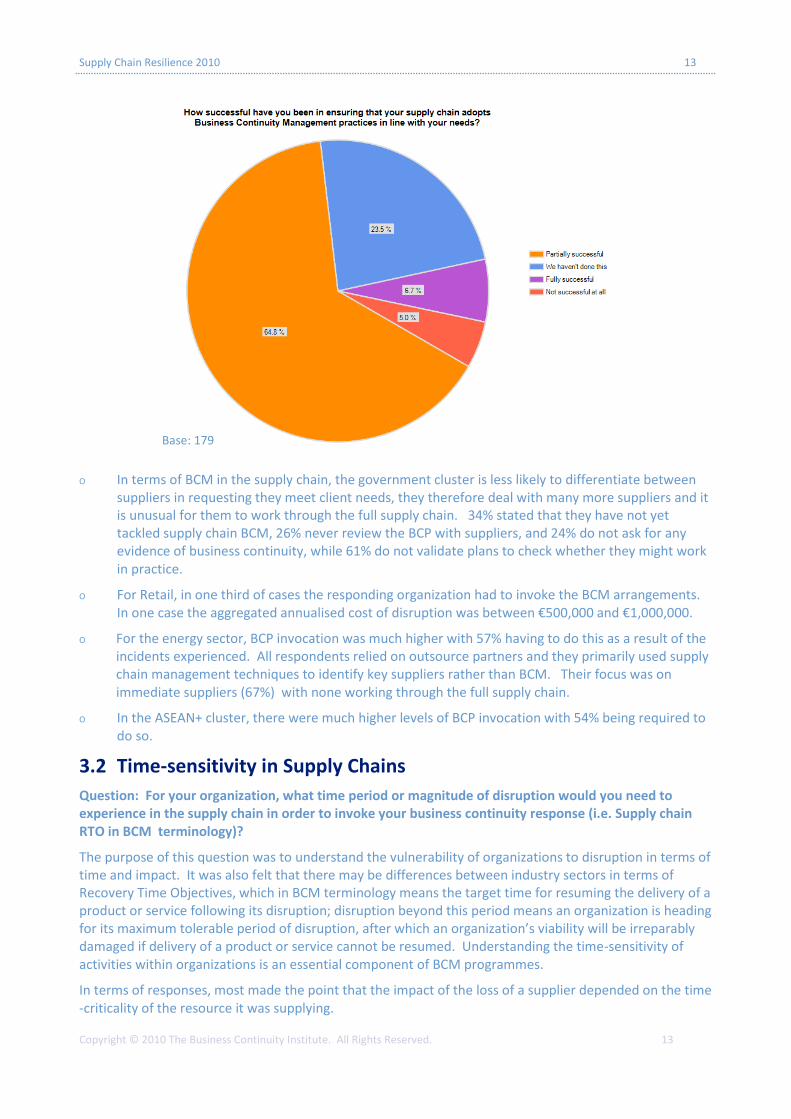
The purpose of this question was to understand the vulnerability of organizations to disruption in terms of time and impact. It was also felt that there may be differences between industry sectors in terms of Recovery Time Objectives, which in BCM terminology means the target time for resuming the delivery of a product or service following its disruption; disruption beyond this period means an organization is heading for its maximum tolerable period of disruption, after which an organization’s viability will be irreparably damaged if delivery of a product or service cannot be resumed. Understanding the time-sensitivity of activities within organizations is an essential component of BCM programmes.
In terms of responses, most made the point that the impact of the loss of a supplier depended on the time-criticality of the resource it was supplying.
Base: 179
Supply Chain Resilience 2010 14
Copyright © 2010 The Business Continuity Institute. All Rights Reserved. 14
O For respondents in the financial services sector, the most frequent time interval given was 24 hours, with a number referring to four hours or less.
O For respondents in the manufacturing sector, the response was very different with most respondents talking about days rather than hours with one week the most frequent response given. However, others made the comment that there was a wide range within their own organization.
O In the retail and wholesale sector, the responses were highly qualified: one respondent stated that eight hours was the key time period but that this would depend on the day and time on which the incident occurred. More than 24 hours was the most common response though, which was in one case linked to loss of access to a depot or critical supplier.
O In the energy sector, while some provided figures in hours, others provided a timeline of one week which appeared to relate to the stock of fuel they carried.
O In IT and Communications there was a singular consistency of 24 hours from almost all respondents. Some provided qualified statements such as “most critical processes have an RTO of one hour”; while another was very specific: “loss of WAN for more than four hours leads to a BCP invocation”.
O In the government, health and education cluster, a wide range of numbers were given but the qualitative statements reveal some interesting analysis. Firstly, that supporting ICT is more time-critical than many of the services that are actually delivered in this sector, and that the loss of a main IT supplier or outsourced financial record company would invoke the BCP. While ICT may have a 24 hour RTO, refuse collection would be one week. Critical services such as payroll prior to the payroll run would have an RTO of 24 hours. Loss of a utility service would provoke one of the shorter BCP invocation periods of four hours.
Other sectors: while the number of respondents in the following sectors were low, the written responses are of some interest:
O Agriculture & Fishing: Two months or 20% of the supply chain.
O Mining & Quarrying: For air transportation, two days; for chemicals: seven days.
O Support Services: 12-24 hours; power failure in a building: immediate invocation; ASP, 4+ hours; diesel fuel: 24 hours. One respondent had sufficient operational flexibility that it would take a national-level disruption of greater than five days before a specific BCM invocation was likely to be required.
O In the transportation and storage sector, the inability to receive or dispatch for more than 24 hours would cause a problem.
What the responses show is that a disruption to key supply chains for 24 hours or more would have a significant negative impact on many areas of economic activity, with the financial services sector being most vulnerable to interruption. It therefore makes sense to know more about your suppliers’ ability to support you when they are faced with a disruption and ensure your own BCM programme adequately reflects this vulnerability.
End of Section 3.
Supply Chain Resilience 2010 15
Copyright © 2010 The Business Continuity Institute. All Rights Reserved. 15
4.0 Good Practice in Supply Chain BCM
Applying good ‘in-house’ BCM approaches to supply chain requires a revisit to the Business Impact Analysis to identify those supply chains supporting key activities. This selective approach makes sense in terms of focusing scarce resources where they are most needed, rather than working through every supply chain
4.1 Identifying Key Supply Chains
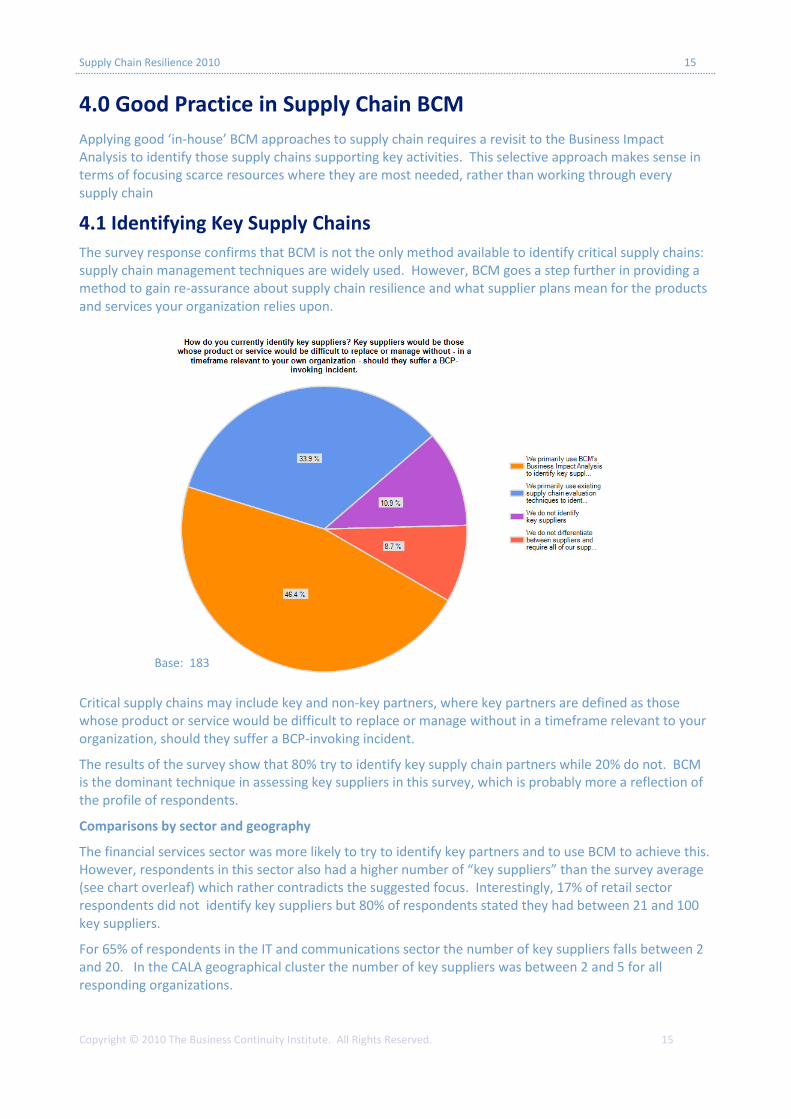
The survey response confirms that BCM is not the only method available to identify critical supply chains: supply chain management techniques are widely used. However, BCM goes a step further in providing a method to gain re-assurance about supply chain resilience and what supplier plans mean for the products and services your organization relies upon.
Critical supply chains may include key and non-key partners, where key partners are defined as those whose product or service would be difficult to replace or manage without in a timeframe relevant to your organization, should they suffer a BCP-invoking incident.
The results of the survey show that 80% try to identify key supply chain partners while 20% do not. BCM is the dominant technique in assessing key suppliers in this survey, which is probably more a reflection of the profile of respondents.
Comparisons by sector and geography
The financial services sector was more likely to try to identify key partners and to use BCM to achieve this. However, respondents in this sector also had a higher number of “key suppliers” than the survey average (see chart overleaf) which rather contradicts the suggested focus. Interestingly, 17% of retail sector respondents did not identify key suppliers but 80% of respondents stated they had between 21 and 100 key suppliers.
For 65% of respondents in the IT and communications sector the number of key suppliers falls between 2 and 20. In the CALA geographical cluster the number of key suppliers was between 2 and 5 for all responding organizations.
Base: 183
Supply Chain Resilience 2010 16
Copyright © 2010 The Business Continuity Institute. All Rights Reserved. 16
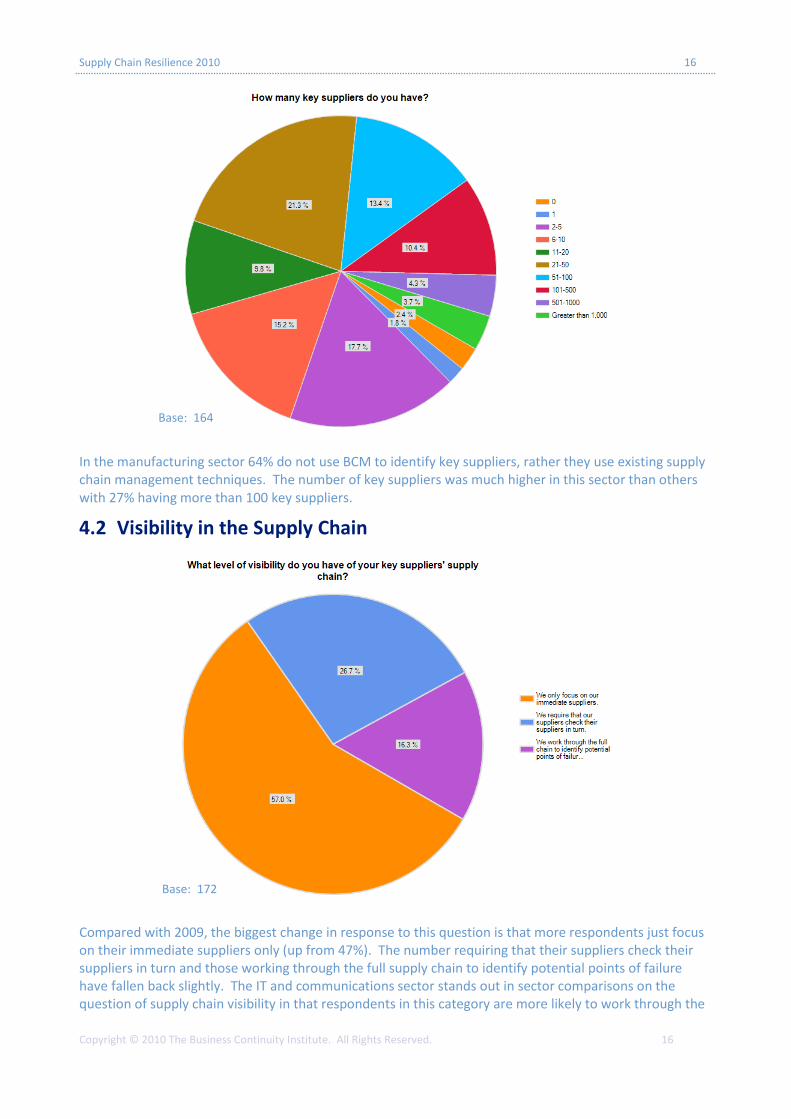
In the manufacturing sector 64% do not use BCM to identify key suppliers, rather they use existing supply chain management techniques. The number of key suppliers was much higher in this sector than others with 27% having more than 100 key suppliers.
4.2 Visibility in the Supply Chain
Compared with 2009, the biggest change in response to this question is that more respondents just focus on their immediate suppliers only (up from 47%). The number requiring that their suppliers check their suppliers in turn and those working through the full supply chain to identify potential points of failure have fallen back slightly. The IT and communications sector stands out in sector comparisons on the question of supply chain visibility in that respondents in this category are more likely to work through the
Base: 164
Base: 172
Supply Chain Resilience 2010 17
Copyright © 2010 The Business Continuity Institute. All Rights Reserved. 17
full supply chain with 25% stating they do this. However, at the other extreme, 45% also stated that they have not done BCM in the supply chain. The financial services sector is more likely to require its suppliers to check their suppliers and work through the full supply chain. Manufacturers are more likely to require suppliers to check their suppliers in turn. 82% felt they had been partially successful in getting their requirements into the supply chain; 18% have not done it
The proportion of respondents who have been partially successful in ensuring their supply chain adopts BCM practices in line with their needs is unchanged from 2009 at 64%, however, the number who have not done this has increased slightly to 24% (probably reflecting new respondents to this year’s survey). Only 7% have been fully successful, while 5% have not had any success at all.
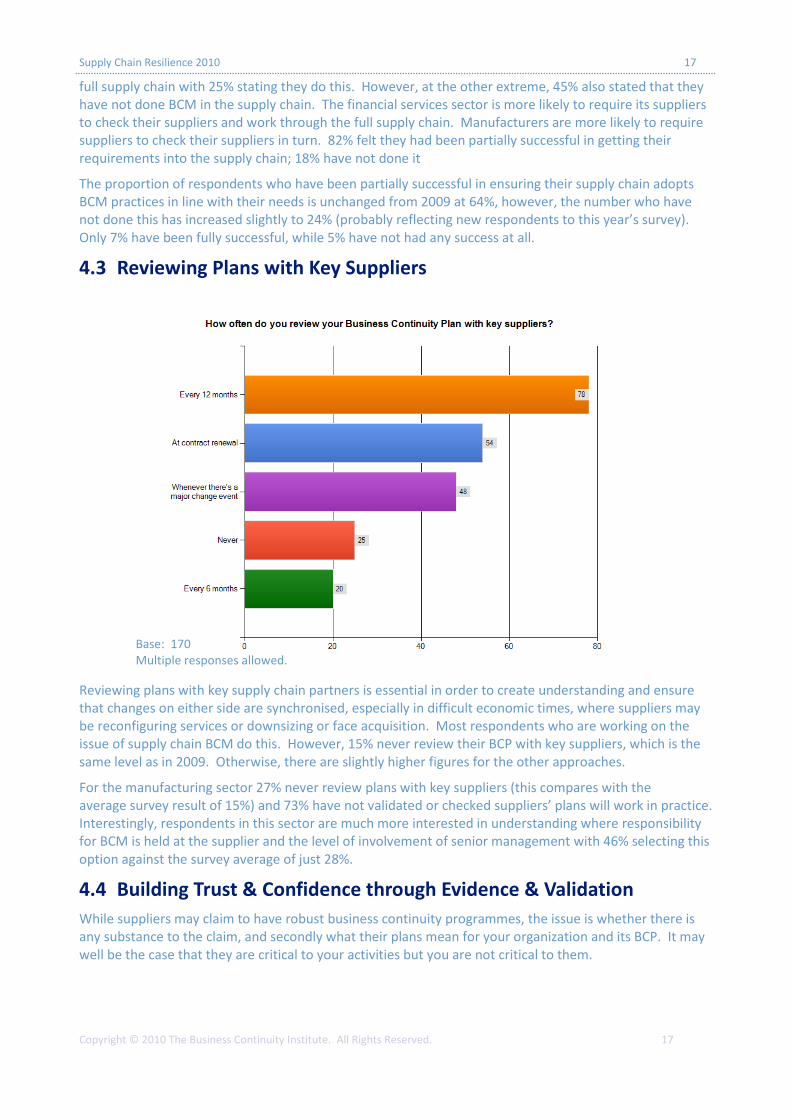
4.3 Reviewing Plans with Key Suppliers
Reviewing plans with key supply chain partners is essential in order to create understanding and ensure that changes on either side are synchronised, especially in difficult economic times, where suppliers may be reconfiguring services or downsizing or face acquisition. Most respondents who are working on the issue of supply chain BCM do this. However, 15% never review their BCP with key suppliers, which is the same level as in 2009. Otherwise, there are slightly higher figures for the other approaches.
For the manufacturing sector 27% never review plans with key suppliers (this compares with the average survey result of 15%) and 73% have not validated or checked suppliers’ plans will work in practice. Interestingly, respondents in this sector are much more interested in understanding where responsibility for BCM is held at the supplier and the level of involvement of senior management with 46% selecting this option against the survey average of just 28%.
4.4 Building Trust & Confidence through Evidence & Validation
While suppliers may claim to have robust business continuity programmes, the issue is whether there is any substance to the claim, and secondly what their plans mean for your organization and its BCP. It may well be the case that they are critical to your activities but you are not critical to them.
Base: 170 Multiple responses allowed.
Supply Chain Resilience 2010 18
Copyright © 2010 The Business Continuity Institute. All Rights Reserved. 18
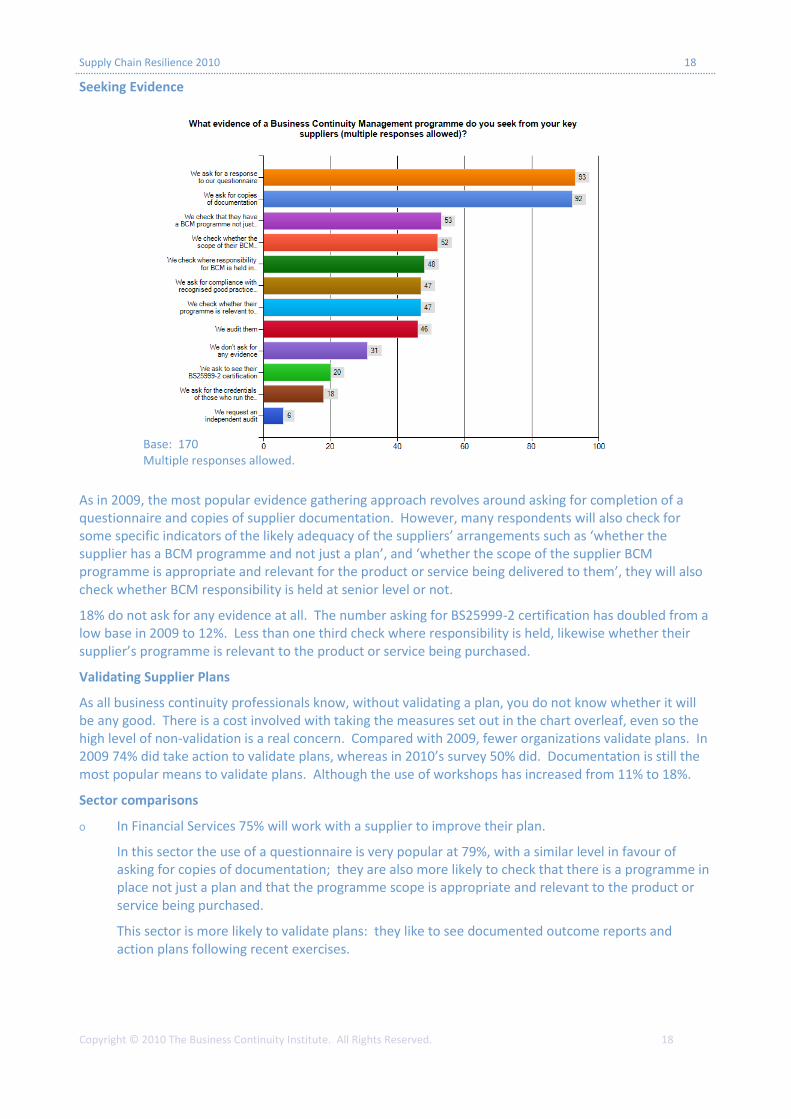
Seeking Evidence
As in 2009, the most popular evidence gathering approach revolves around asking for completion of a questionnaire and copies of supplier documentation. However, many respondents will also check for some specific indicators of the likely adequacy of the suppliers’ arrangements such as ‘whether the supplier has a BCM programme and not just a plan’, and ‘whether the scope of the supplier BCM programme is appropriate and relevant for the product or service being delivered to them’, they will also check whether BCM responsibility is held at senior level or not.
18% do not ask for any evidence at all. The number asking for BS25999-2 certification has doubled from a low base in 2009 to 12%. Less than one third check where responsibility is held, likewise whether their supplier’s programme is relevant to the product or service being purchased.
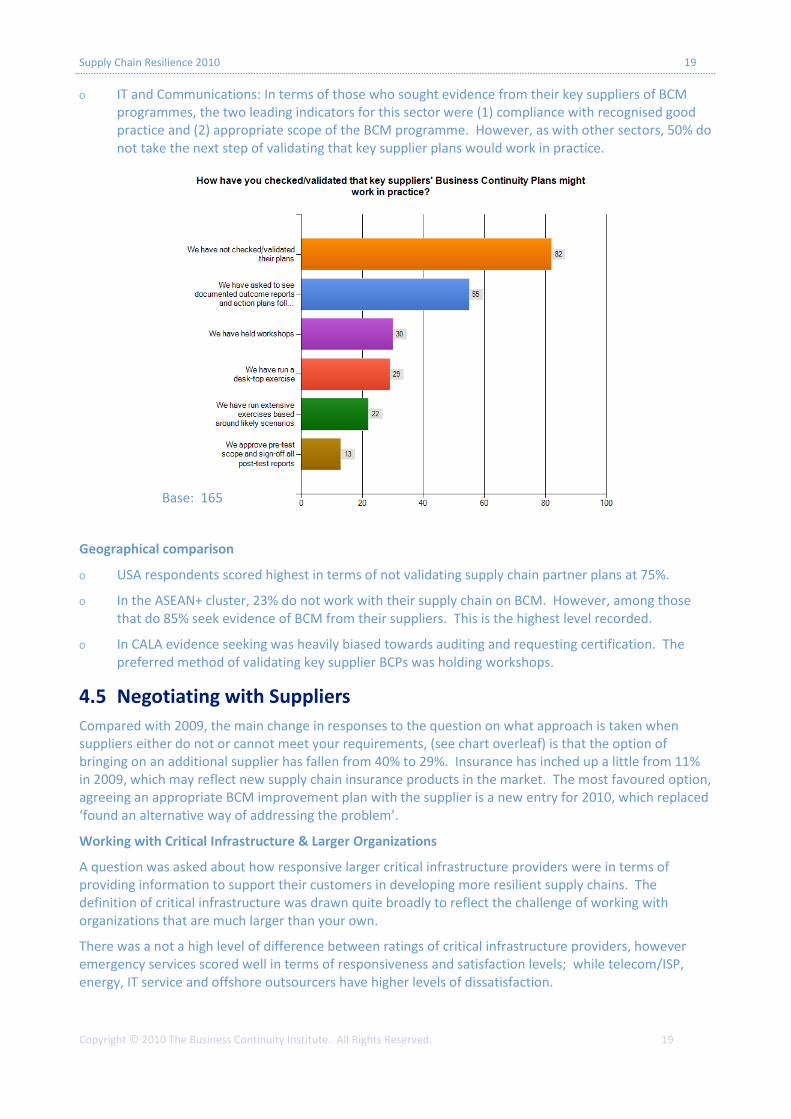
Validating Supplier Plans
As all business continuity professionals know, without validating a plan, you do not know whether it will be any good. There is a cost involved with taking the measures set out in the chart overleaf, even so the high level of non-validation is a real concern. Compared with 2009, fewer organizations validate plans. In 2009 74% did take action to validate plans, whereas in 2010’s survey 50% did. Documentation is still the most popular means to validate plans. Although the use of workshops has increased from 11% to 18%.
Sector comparisons
O In Financial Services 75% will work with a supplier to improve their plan.
In this sector the use of a questionnaire is very popular at 79%, with a similar level in favour of asking for copies of documentation; they are also more likely to check that there is a programme in place not just a plan and that the programme scope is appropriate and relevant to the product or service being purchased.
This sector is more likely to validate plans: they like to see documented outcome reports and action plans following recent exercises.
Base: 170 Multiple responses allowed.
Supply Chain Resilience 2010 19
Copyright © 2010 The Business Continuity Institute. All Rights Reserved. 19
O IT and Communications: In terms of those who sought evidence from their key suppliers of BCM programmes, the two leading indicators for this sector were (1) compliance with recognised good practice and (2) appropriate scope of the BCM programme. However, as with other sectors, 50% do not take the next step of validating that key supplier plans would work in practice.
Geographical comparison
O USA respondents scored highest in terms of not validating supply chain partner plans at 75%.
O In the ASEAN+ cluster, 23% do not work with their supply chain on BCM. However, among those that do 85% seek evidence of BCM from their suppliers. This is the highest level recorded.
O In CALA evidence seeking was heavily biased towards auditing and requesting certification. The preferred method of validating key supplier BCPs was holding workshops.
4.5 Negotiating with Suppliers
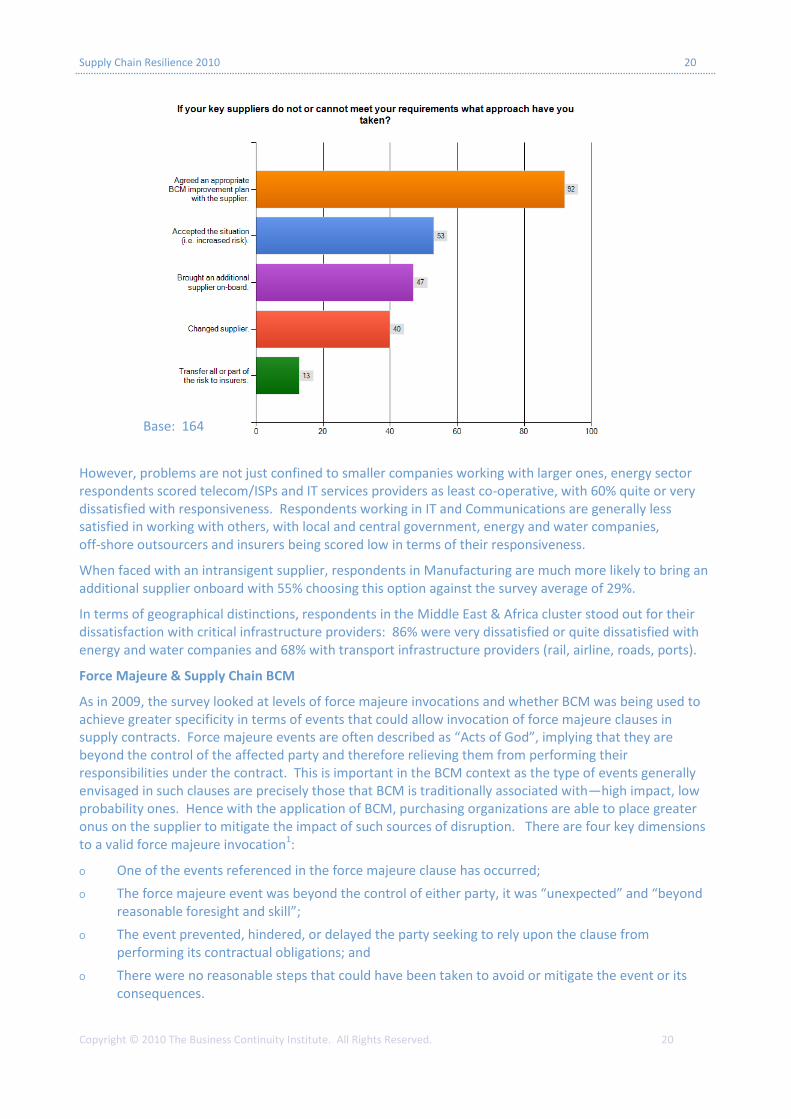
Compared with 2009, the main change in responses to the question on what approach is taken when suppliers either do not or cannot meet your requirements, (see chart overleaf) is that the option of bringing on an additional supplier has fallen from 40% to 29%. Insurance has inched up a little from 11% in 2009, which may reflect new supply chain insurance products in the market. The most favoured option, agreeing an appropriate BCM improvement plan with the supplier is a new entry for 2010, which replaced ‘found an alternative way of addressing the problem’.
Working with Critical Infrastructure & Larger Organizations
A question was asked about how responsive larger critical infrastructure providers were in terms of providing information to support their customers in developing more resilient supply chains. The definition of critical infrastructure was drawn quite broadly to reflect the challenge of working with organizations that are much larger than your own.
There was a not a high level of difference between ratings of critical infrastructure providers, however emergency services scored well in terms of responsiveness and satisfaction levels; while telecom/ISP, energy, IT service and offshore outsourcers have higher levels of dissatisfaction.
Base: 165
Supply Chain Resilience 2010 20
Copyright © 2010 The Business Continuity Institute. All Rights Reserved. 20
However, problems are not just confined to smaller companies working with larger ones, energy sector respondents scored telecom/ISPs and IT services providers as least co-operative, with 60% quite or very dissatisfied with responsiveness. Respondents working in IT and Communications are generally less satisfied in working with others, with local and central government, energy and water companies, off-shore outsourcers and insurers being scored low in terms of their responsiveness.
When faced with an intransigent supplier, respondents in Manufacturing are much more likely to bring an additional supplier onboard with 55% choosing this option against the survey average of 29%.
In terms of geographical distinctions, respondents in the Middle East & Africa cluster stood out for their dissatisfaction with critical infrastructure providers: 86% were very dissatisfied or quite dissatisfied with energy and water companies and 68% with transport infrastructure providers (rail, airline, roads, ports).
Force Majeure & Supply Chain BCM
As in 2009, the survey looked at levels of force majeure invocations and whether BCM was being used to achieve greater specificity in terms of events that could allow invocation of force majeure clauses in supply contracts. Force majeure events are often described as “Acts of God”, implying that they are beyond the control of the affected party and therefore relieving them from performing their responsibilities under the contract. This is important in the BCM context as the type of events generally envisaged in such clauses are precisely those that BCM is traditionally associated with—high impact, low probability ones. Hence with the application of BCM, purchasing organizations are able to place greater onus on the supplier to mitigate the impact of such sources of disruption. There are four key dimensions to a valid force majeure invocation1:
O One of the events referenced in the force majeure clause has occurred;
O The force majeure event was beyond the control of either party, it was “unexpected” and “beyond reasonable foresight and skill”;
O The event prevented, hindered, or delayed the party seeking to rely upon the clause from performing its contractual obligations; and
O There were no reasonable steps that could have been taken to avoid or mitigate the event or its consequences.
Base: 164
Supply Chain Resilience 2010 21
Copyright © 2010 The Business Continuity Institute. All Rights Reserved. 21
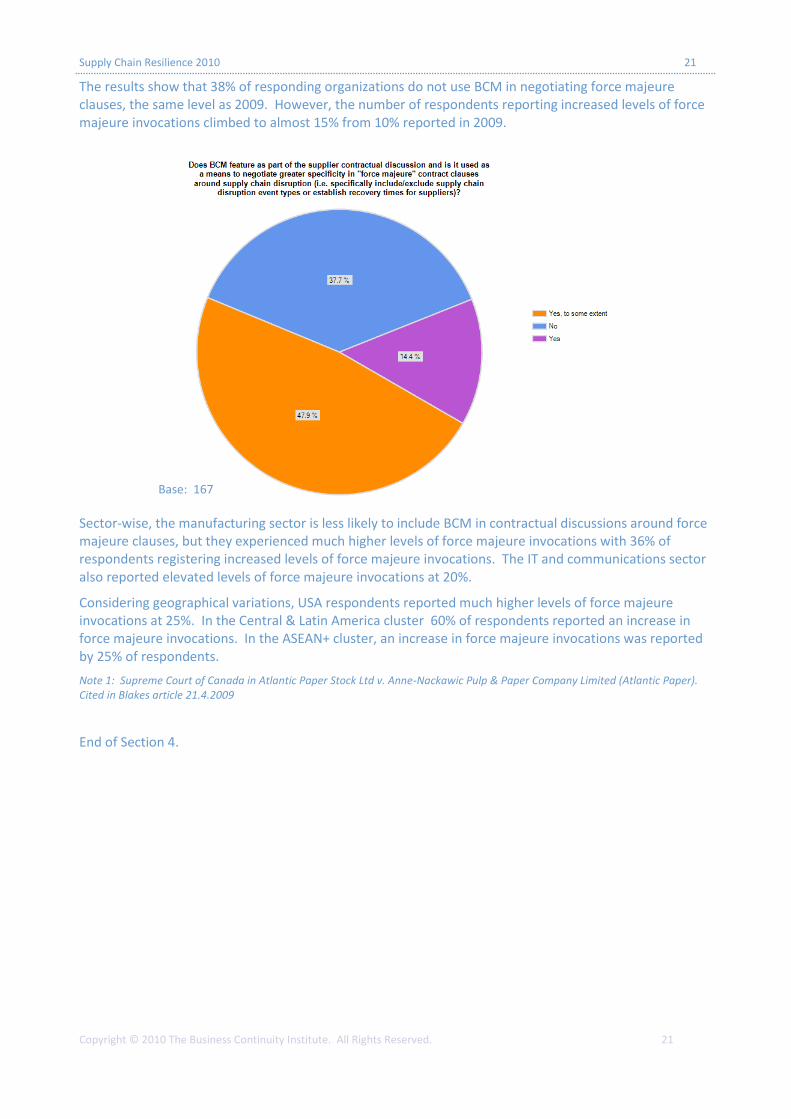
The results show that 38% of responding organizations do not use BCM in negotiating force majeure clauses, the same level as 2009. However, the number of respondents reporting increased levels of force majeure invocations climbed to almost 15% from 10% reported in 2009.
Sector-wise, the manufacturing sector is less likely to include BCM in contractual discussions around force majeure clauses, but they experienced much higher levels of force majeure invocations with 36% of respondents registering increased levels of force majeure invocations. The IT and communications sector also reported elevated levels of force majeure invocations at 20%.
Considering geographical variations, USA respondents reported much higher levels of force majeure invocations at 25%. In the Central & Latin America cluster 60% of respondents reported an increase in force majeure invocations. In the ASEAN+ cluster, an increase in force majeure invocations was reported by 25% of respondents.
Note 1: Supreme Court of Canada in Atlantic Paper Stock Ltd v. Anne-Nackawic Pulp & Paper Company Limited (Atlantic Paper). Cited in Blakes article 21.4.2009
End of Section 4.
Base: 167
Supply Chain Resilience 2010 22
Copyright © 2010 The Business Continuity Institute. All Rights Reserved. 22
5.0 Considerations
5.1 The Impact of Optimization Strategies on Supply Chain Resilience
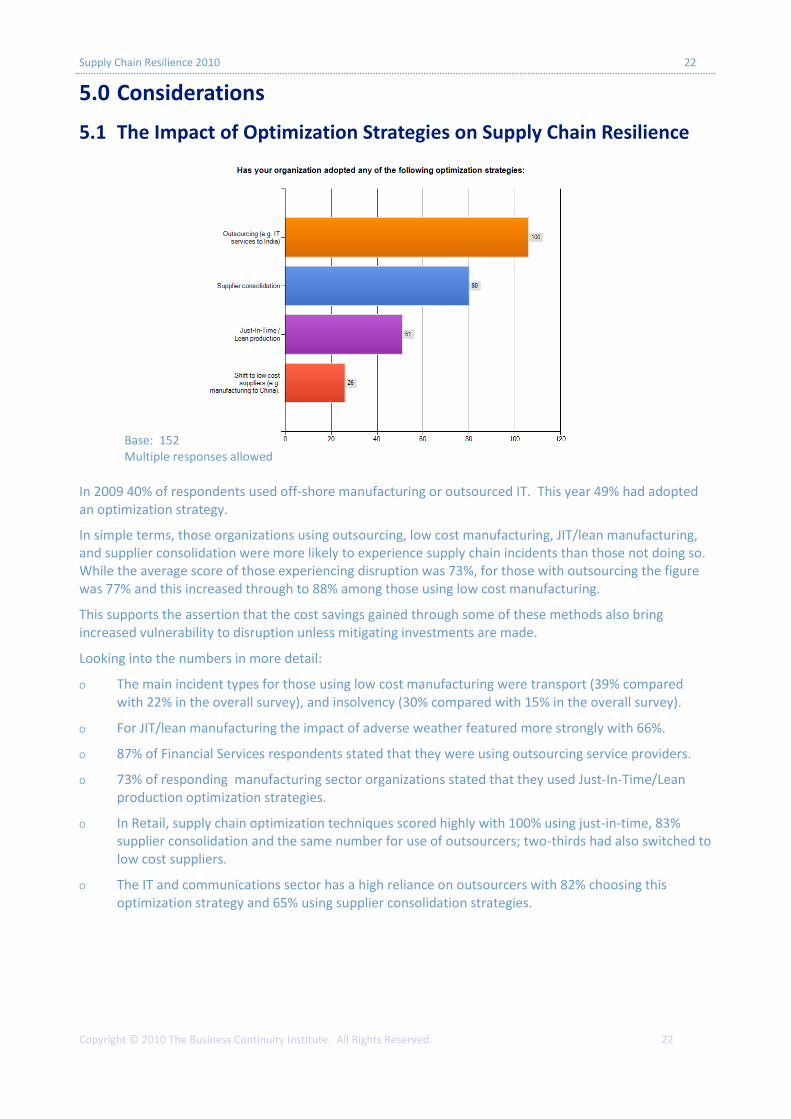
In 2009 40% of respondents used off-shore manufacturing or outsourced IT. This year 49% had adopted an optimization strategy.
In simple terms, those organizations using outsourcing, low cost manufacturing, JIT/lean manufacturing, and supplier consolidation were more likely to experience supply chain incidents than those not doing so. While the average score of those experiencing disruption was 73%, for those with outsourcing the figure was 77% and this increased through to 88% among those using low cost manufacturing.
This supports the assertion that the cost savings gained through some of these methods also bring increased vulnerability to disruption unless mitigating investments are made.
Looking into the numbers in more detail:
O The main incident types for those using low cost manufacturing were transport (39% compared with 22% in the overall survey), and insolvency (30% compared with 15% in the overall survey).
O For JIT/lean manufacturing the impact of adverse weather featured more strongly with 66%.
O 87% of Financial Services respondents stated that they were using outsourcing service providers.
O 73% of responding manufacturing sector organizations stated that they used Just-In-Time/Lean production optimization strategies.
O In Retail, supply chain optimization techniques scored highly with 100% using just-in-time, 83% supplier consolidation and the same number for use of outsourcers; two-thirds had also switched to low cost suppliers.
O The IT and communications sector has a high reliance on outsourcers with 82% choosing this optimization strategy and 65% using supplier consolidation strategies.
Base: 152 Multiple responses allowed
Supply Chain Resilience 2010 23
Copyright © 2010 The Business Continuity Institute. All Rights Reserved. 23
5.2 The Impact of Good Practice on Incident Levels
An analysis of those who registered zero incidents suggests two types of maturity level:
There is a one group that is very advanced in their supply chain resilience thinking, which is characterised by high levels of recording, measuring and reporting on performance-affecting supply chain disruption, including coordination and reporting across the whole enterprise (42% compared with 17% in the overall survey).
This group are also characterised by two additional attributes: firstly, that 47% of them check where responsibility for BCM is held in the supplier organization (compared with 28%) and they actively look for BCM capability in their suppliers (47% compared with 36%).
In conclusion, for this group, it would be reasonable to summarise that well developed business continuity programmes with supply chain partners are leading to higher levels of operational resilience and less need to invoke BCPs for the same incidents that others are still needing to invoke BCPs.
The other group which claimed to have zero incidents did not record, measure and report on performance-affecting supply chain disruptions. So it could be asserted that lack of visibility is a key reason for not necessarily seeing disruption.
5.3 Is there a Relationship between the Number of Incidents Experienced, Organizational Size and the Number of Key Suppliers Identified?
There are indicative patterns that the number of incidents increase with the number of suppliers:
O For 1-5 Incidents (89 respondents), the most frequent response was 2-5 suppliers.
O For 6-12 incidents (20 respondents), the most frequent response was 21-50 suppliers.
O For 13+ incidents (9 respondents), the most frequent response was 51-100 key suppliers.
In terms of size of organization, those with larger numbers of employees experienced higher levels of supply chain disruption:
O For 1-5 Incidents (89 respondents), the most frequent size was 1,000-5,000 employees (30%)
O For 6-12 incidents (20 respondents), the most frequent size was 1,000-5,000 employees (38%)
O For 13+ incidents (9 respondents), the most frequent size was greater than 50,000 employees (30%); in the latter case 70% of organizations employed 1,000 or more employees.
There were also higher levels of force majeure invocations in the past 12 months with those organizations experiencing 6-12 incidents (27%) and 13+ incidents (30%).
The results of this analysis confirm that larger organizations and those organizations with more key suppliers face higher risk of a disruptive incident occurring; this supports earlier BCI research, which demonstrated that levels of disruption grew with the increasing size of organization (in that case by number of locations and employees).
Supply Chain Resilience 2010 24
Copyright © 2010 The Business Continuity Institute. All Rights Reserved. 24
5.4 Sustainability Risks in the Supply Chain
It is common to talk about sustainability these days, so the survey attempted to look at disruption caused by sustainability issues: in this case three areas were considered—health and safety, environment and ethical business practices. The overall reported levels of supply chain incidents in these areas were low with levels of reported sustainability incidents as follows:
O Environmental: 8%
O Health & safety: 10%
O Unsatisfactory business or employment practices: 2%
However among those that were affected by sustainability issues, there are some important characteristics:
O They attracted much higher levels of negative media coverage (37% compared with 14% average score)
O Virtually none worked through their full supply chain (just 4% did)
O 47% did not record supply chain incidents
O 48% did not validate supplier plans to see whether they would work in practice
The conclusion from this information is that if your organization is vulnerable to sustainability issues, then more effort is required in terms of supply chain understanding and affirmative action. This is clearly one area where reputation can be severely impacted.
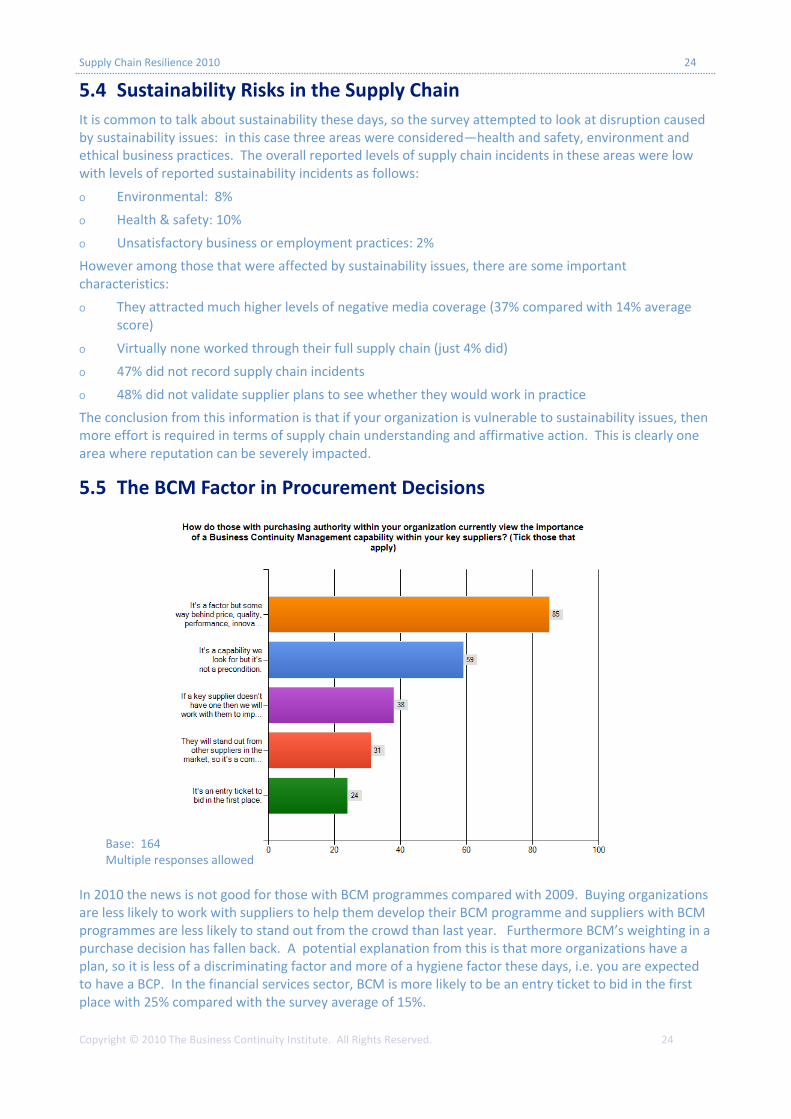
5.5 The BCM Factor in Procurement Decisions
In 2010 the news is not good for those with BCM programmes compared with 2009. Buying organizations are less likely to work with suppliers to help them develop their BCM programme and suppliers with BCM programmes are less likely to stand out from the crowd than last year. Furthermore BCM’s weighting in a purchase decision has fallen back. A potential explanation from this is that more organizations have a plan, so it is less of a discriminating factor and more of a hygiene factor these days, i.e. you are expected to have a BCP. In the financial services sector, BCM is more likely to be an entry ticket to bid in the first place with 25% compared with the survey average of 15%.
Base: 164 Multiple responses allowed
Supply Chain Resilience 2010 25
Copyright © 2010 The Business Continuity Institute. All Rights Reserved. 25
5.6 Perspectives from Supply Chain Practitioners
The primary difference between those seeing themselves as supply chain practitioners as opposed to those in business continuity revealed itself in two areas, firstly, and not surprisingly, the primary tools used to identify key suppliers are existing supply chain management ones rather than business continuity management. The other key difference is in the list of key causes of disruption, which ranked adverse weather and supplier insolvency at the top followed by outsourcer failure and product quality. In contrast, unplanned IT/telecom outages, which is a perennial top three source of disruption among business continuity practitioners, was recognised by just 17% of supply chain practitioners as a source of disruption.
End of Section 5.
Supply Chain Resilience 2010 26
Copyright © 2010 The Business Continuity Institute. All Rights Reserved. 26
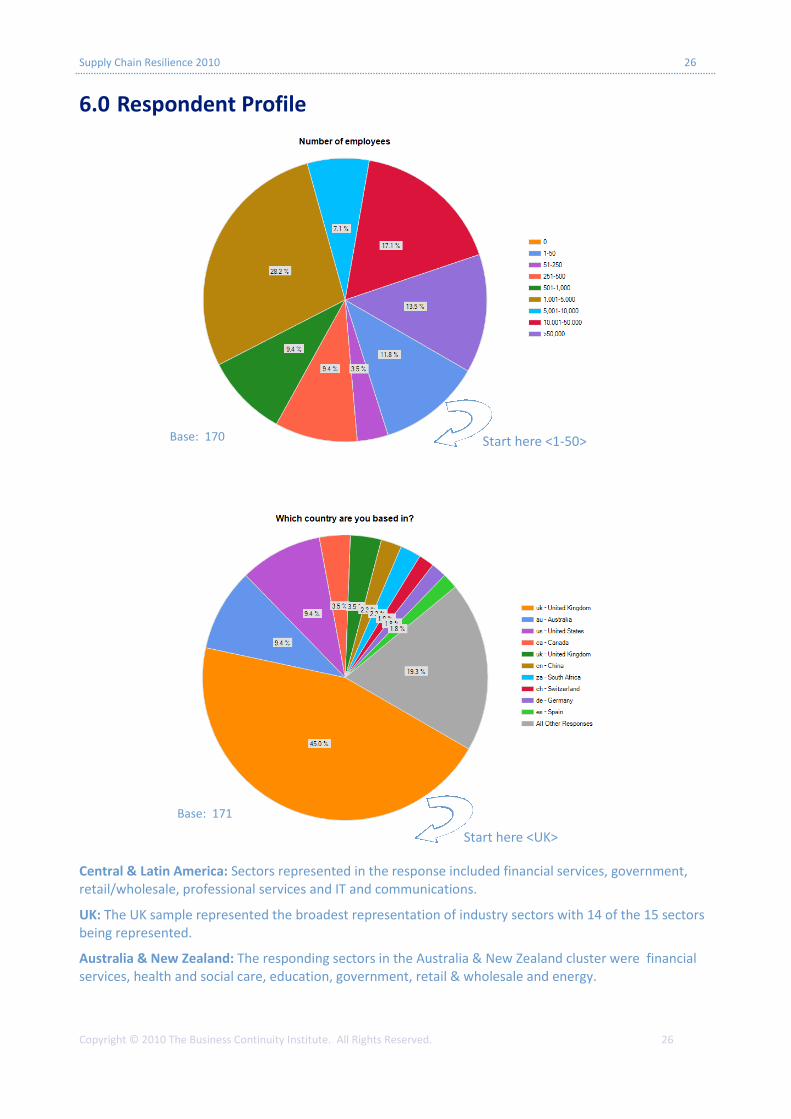
6.0 Respondent Profile
Central & Latin America: Sectors represented in the response included financial services, government, retail/wholesale, professional services and IT and communications.
UK: The UK sample represented the broadest representation of industry sectors with 14 of the 15 sectors being represented.
Australia & New Zealand: The responding sectors in the Australia & New Zealand cluster were financial services, health and social care, education, government, retail & wholesale and energy.
Base: 170
Base: 171
Start here <1-50>
Start here <UK>
Supply Chain Resilience 2010 27
Copyright © 2010 The Business Continuity Institute. All Rights Reserved. 27
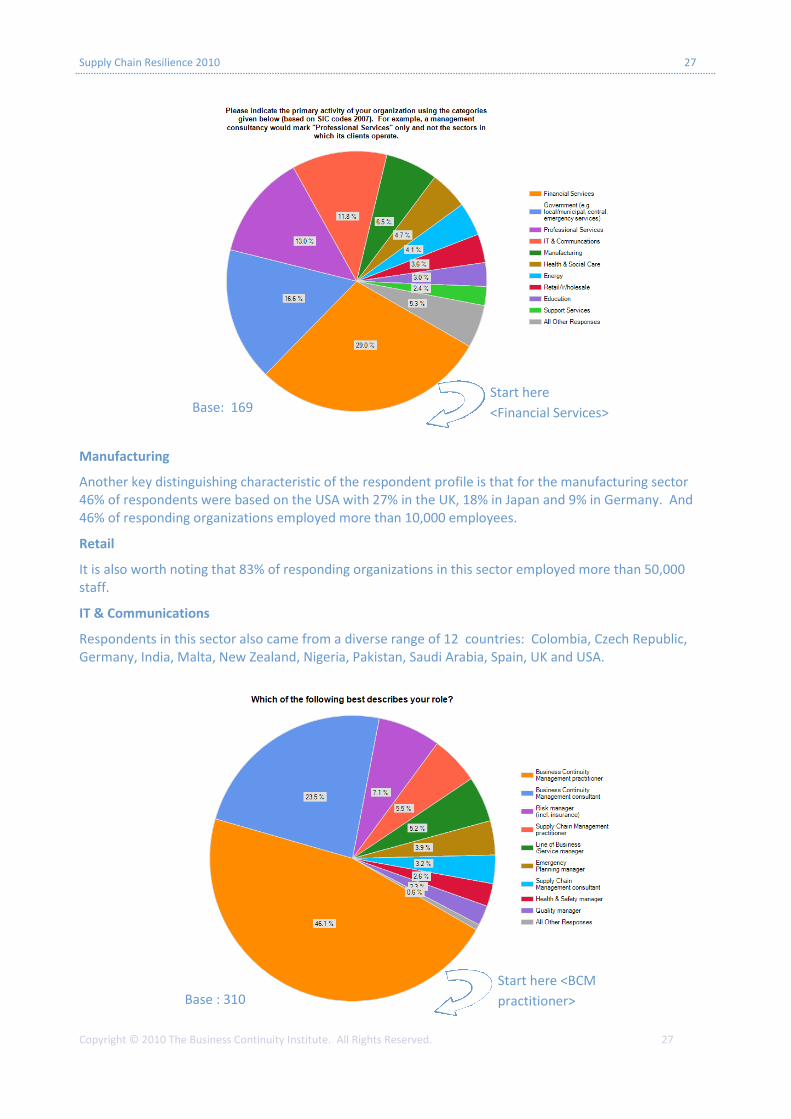
Base : 310
Manufacturing
Another key distinguishing characteristic of the respondent profile is that for the manufacturing sector 46% of respondents were based on the USA with 27% in the UK, 18% in Japan and 9% in Germany. And 46% of responding organizations employed more than 10,000 employees.
Retail
It is also worth noting that 83% of responding organizations in this sector employed more than 50,000 staff.
IT & Communications
Respondents in this sector also came from a diverse range of 12 countries: Colombia, Czech Republic, Germany, India, Malta, New Zealand, Nigeria, Pakistan, Saudi Arabia, Spain, UK and USA.
Base: 169 Start here
<Financial Services>
Start here <BCM
practitioner>
Supply Chain Resilience 2010 28
Copyright © 2010 The Business Continuity Institute. All Rights Reserved. 28
7.0 Conclusions, Reflection & Next Steps
Business Continuity Management is proving to be an effective technique to better understand supply chain dependencies and develop a robust strategy to deal with disruption. BCM provides a practical and proven methodology to ensure an organization’s own business continuity programme accounts for supply chain disruption as well as enable close and transparent work with supply chain partners to develop their resilience in turn.
BCM’s “all risks” approach saves time in guessing which threat will realise itself and cause the actual disruption, thereby allowing time to focus on indentifying vulnerabilities and developing preparedness to deal with what ever threat may eventually affect the organization’s supply chain. The survey provides invaluable evidence to support the business case for investment in effective BCM programmes by identifying the level of disruption being experienced and measurable consequential impacts.
Good practice is already evident in supply chain BCM and this requires identification of key partners, asking the right questions of them, and validating that their plans are likely to be effective when experiencing a disruptive incident.
Business strategies to extend or optimise supply chains are here to stay, but these are not ’cost free’ decisions. Most organizations sit at some point between the polarities of ‘no risk at any price’ and ‘lowest cost at any risk’ but the survey indicates that business continuity is still overlooked in supply chain decisions. The findings also highlight that increased disruption is a reality not just a threat when pursuing such decisions, however the intelligent application of BCM can help support organizations take advantage of such supply chain optimization techniques, as part of an overall enterprise-wide resilience strategy.
Reflection and Next Steps
As with earlier surveys, a key purpose of BCI surveys is to capture good practice in tackling common problems shared by business continuity management practitioners around the world. The BCI’s Good Practice Guidelines make limited reference to supply chain BCM, and we hope that future editions will be enhanced with the evolving body of good practice in this area. The BCI will also continue to run workshops in this area to facilitate discussion and sharing of experiences in terms of “what works”.
There is much more work to be done to convince supply chain and procurement practitioners of the importance of business continuity as a risk mitigation technique and we look forward to continuing our cooperation with the Chartered Institute of Purchasing & Supply.
Perhaps, the greater challenge is in embedding business continuity considerations in strategic and operational business decisions; this requires cooperation across a broad coalition of resilience professionals to demonstrate the benefits of such thinking in the context of the organization’s risk appetite.
Finally, we welcome feedback on this survey and its conclusions and will use this input to guide future work in this important area.
End of Section 7.
Supply Chain Resilience 2010 29
Copyright © 2010 The Business Continuity Institute. All Rights Reserved. 29
8.0 About BCM Business Continuity Management (BCM) identifies potential threats to an organization and the impacts to business operations that those threats, if realized, might cause. It provides a framework for building organizational resilience with the capability for an effective response that safeguards the interests of key stakeholders, reputation, brand and value-creating activities.
8.1 About the Business Continuity Institute Based in Caversham, United Kingdom, the Business Continuity Institute (BCI) was established in 1994 to promote the art and science of business continuity management and to assist organizations in preparing for and surviving minor and large-scale man-made and natural disasters. The Institute enables members to obtain guidance and support from their fellow practitioners, as well as offers professional training and certification programmes to disseminate and validate the highest standards of competence and ethics. It has over 5,000 members in more than 90 countries, active in an estimated 2,500 organizations in private, public and third sectors. For more information go to: www.thebci.org
The BCI Partnership, established in 2007, offers corporate membership of the BCI with 80 member organizations including Aon Hewitt, BAE Systems, BP, BSI Group, BT, ContinuitySA, Deloitte, DNV, Continuity Shop, EADS, eBRP, G4S Risk Management, Garrison Continuity, IBM, HP, Link Associates, Lloyds Banking Group, Lockheed Martin, Marsh, Milton Keynes Council, Prudential, PwC, Royal Mail, Savant, Statoil, Steelhenge Consulting, Vocalink, and Zurich. To join as a corporate member, go to: www.bcipartnership.com
8.2 Contacting the BCI Lee Glendon, Head of Campaigns The Business Continuity Institute 10-11 Southview Park, Marsack Street Caversham, RG4 5AF UNITED KINGDOM Phone: +44 (0) 118 947 8215 Fax: +44 (0) 118 947 6237 E-mail: [email protected]
8.3 About Zurich Zurich Financial Services Group is an insurance-based financial services provider. Our headquarters are in Zurich, Switzerland. Founded in 1872, we now have a global network of subsidiaries and offices in North America, Europe, Asia Pacific, Latin America and other markets. Our 60,000 employees serve customers in more than 170 countries.
8.4 Contacting Zurich For any questions, please contact: Nick Wildgoose Global Supply Chain Proposition Manager Zurich Global Corporate Telephone: +44 (0) 207 648 3066 email: [email protected]
Supply Chain Resilience 2010 30
Copyright © 2010 The Business Continuity Institute. All Rights Reserved. 30
Appendix A DISCLAIMER: Any views or opinions made in this Appendix A are those
of the respondents and not necessarily of the Business Continuity
Institute and the report’s sponsors.
Qualitative Statements Provided by Respondents
Which best describes your role:
O Business Continuity Advisor
O Resilience and Security manager and BC practitioner
O Business Continuity and Risk practitioner
O Risk engineer
O Buyer
O Manager Corporate Security
O Procurement officer
O Head of Procurement
O Disaster recovery management practitioner
O Group Risk Manager
O Business Continuity Rep
O Risk Manager including insurance and BCM
O Operational Risk Analyst
O BCM/EP
O Head of internal audit
O Manager Risk & Business Continuity
O Service Continuity Manager
O Service Continuity Analyst
O Risk and Business Continuity Officer
O Business Resilience Coordinator
O Security Consultant
O Risk & Business Continuity Manager
O Disaster Recovery Manager
O Risk surveyor (insurance)
O BCM Advisor
O Risk Manager (excluding insurance)
O Department Manager for ISO third party management system certification
O Business Continuity & Risk Manager
Do you record, measure and report on perform-ance affecting supply chain disruptions (i.e. where an unplanned cost has been incurred or loss of productivity or revenue experienced)
O Each dept. coordinates its disruption costs reported to the Finance for reporting and analysis
O Only for critical suppliers from critical departments identified in the BCP. However, no supply chain disruptions has occurred until now.
O When this occurs it maybe recorded but not centrally.
O This would be collated as an 'incident' within the operational risk framework, not within BCM.
O Failure to supply critical goods by our vendors is always communicated to head office.
O Just conducted survey with clients; incidents are reported but most of time not at an aggregated level.
O These events are measured & recorded as an Equivalent Forced Outage Factor (%). Causes of the outage are reviewed to ensure they are entered in the risk register and controls are evaluated for effectiveness.
O Supply chain dependencies & interdependencies are hard to unravel in a health service, especially a large hospital.
O Divisions and branches are responsible for their own procurement and supply chain management and there is currently no systematic reporting.
How many supply chain incidents would you estimate your organization experienced in the past 12 months that caused disruption to your organization?
O Mainly due to outsourcing within contracts.
O One major supplier came close to bankruptcy after failing to meet deadlines on a toxic contract with large penalty clauses, but was eventually bailed out by its US parent company after pressure applied by senior figures.
Supply Chain Resilience 2010 31
Copyright © 2010 The Business Continuity Institute. All Rights Reserved. 31
O Delays due to ash cloud.
O One very long one involving the reduced availability and increased usage / need for road salt / grit.
O FIFA 2010 World Cup hosted in South Africa, [while] many were able to put measures in place to minimise the disruptions to their organization, there were still some unexpected events that took place, i.e. snow in specific parts in SA causing inaccessibility.
O All related to weather disruption.
O Failure of Nortel.
O It was relatively minor relating to the Toronto G20 security plans.
O Snow was the main impact although increasingly industrial action has had to be looked at.
O We have a major supplier, that provides equipment to our service users, which were going into administration over-night and convened a crisis management meeting. We invoked our business continuity plan.
O All raw material shortages.
O A vendor calibrated some critical equipment in their factory. They then returned it to another company who fitted it. It took 3 months for them to sort out the problem, meanwhile we were without the equipment ourselves.
O Industrial action, SLA breach.
O We trade in shares, and have experienced the Johannesburg stock exchange services being unavailable on several locations. We have also had information feeds being unavailable.
O Our most critical supplier would be our WAN providers. with multiple providers we minimise the risk of the inevitable outages, i.e. 3rd time this year.
O Mainly based on conveyance or transport, these disruptive incidents have had the effect of stopping or delaying goods inwards and dispatch of goods between ourselves and the UK.
O Delays by [Telecom Service Provider] in respect of new premises
O Mostly system related issues.
O Flight cancellation due to Iceland volcano caused audit to be postponed and client certification nearly expired.
O Wet coal supply caused generation problems.
O IT department trying to cut costs by using the same printer type throughout the organization. In May this year a process failure at the manufacturers caused a shortage of the toner cartridges throughout the northern hemisphere. Costs were doubled. Resolution was to ensure that we do not become over reliant on one supplier.
O Trying to order additional personal protective equipment when the A-H1N1 rose as a threat. It highlighted how inelastic our supply chain is.
O A single power outage event may affect 25+ separate locations.
O Ranging from unexpected volumes, breakdown in communications, IT failures, supply chain failures etc.
O Ash Cloud induced loss of transport to client in Sweden.
O There was only one ['Supply Chain Incident'] that caused actual disruption to operations, when mains power to a large portion of the town where the specific site is situated was lost for the majority of 24 hours - which revealed a fault in the standby generator and ultimately UPS - actual disruption was restricted to some 3 hours of low level night shift working before the generator was brought on line and then continued to supply power to the site until the mains power was restored and proven to be stable.
O Failure of [Telecom Service Provider] network
O Inability to complete BCP due to illness of persons involved.
Did any of the incidents recorded in Question 5 (list of causes of disruption) require the activation of any of your BCM arrangements?
O Temporary cancellation of all services provided by the supplier involving CEO sign off to ensure security of both our offices and also our supplier who would have been delivering in a very visible vehicle during potential riots.
Supply Chain Resilience 2010 32
Copyright © 2010 The Business Continuity Institute. All Rights Reserved. 32
O Contingency plans had to be revised.
O Crisis Team call out.
O When we became aware of the financial difficulties of the company involved, a BC management team including financial specialists formed to look at alternative methods for sourcing the work, options for recovering data and the possibility of recruiting key workers from the failing company.
O Although the flu pandemic didn't cause an interruption, we did invoke our BCM arrangements to cater for the wider business implications.
O Severe weather and influenza.
O Snow and industrial action caused our crisis management team to monitor impacts on key services
O We needed to call on additional staff to maintain a 24/7 capability
O Telephony issues meant we had to move to one of our workplace recovery centres.
O HR policies for home-working during severe winter weather, policies for absence/annual leave following volcanic ash travel disruption.
O Work from home strategy invoked.
O We have detailed emergency procedures that cover most eventualities. Not so well covered by many of the issues listed.
O Industrial action, strike action, extreme weather
O Failure in service provision by outsourcer triggered invocation of Contingency Plan component of BCP - function brought back in house.
O Our BCM arrangements came into play when we noticed that there may be an issue. The arrangements did not have to reach invocation as we had back-up plans in place however invocation of the back-up plans incurred some additional expenditure.
O Workarounds instigated to cover all key areas - resulting in central updates and communications daily.
O Incidents were managed at the CMT level.
Did any of the incidents above cause your organization to experience negative media coverage?
O Negative media coverage of health services is rather commonplace. Most negative reports are "routine", but occasionally these are about "non-routine" business challenges.
O Media coverage was directed at protestors rather than ourselves.
O We had an issue within the organization, that due to continued work pressures, unqualified staff were being asked to back-fill.
O Local authorities always get negative cover-age during snow as there is an expectation that bins will be collected even though residents cannot get to work. Swine flu meant that we had to open a Tamiflu collection point, which had implications for the leisure centre concerned.
What have been the measurable impacts on your organization of these events?
O Product repackaging needed.
O Potential unprotected website led to the possibility of unauthorised access to data that would lead to data protection issues.
O Impact on patient care.
O Production lines stopped.
O Existing backlogs were exacerbated by the outage.
O Some minimal additional costs for procurement (of sourcing alternative suppliers).
O We are looking to the supplier for service credits.
O Services outcome delayed.
O Increased costs absorbed by business and offset against some savings from incidents, e.g. travel budget savings during air travel disruption.
Supply Chain Resilience 2010 33
Copyright © 2010 The Business Continuity Institute. All Rights Reserved. 33
If you are able to quantify the aggregate cost to your organization of this disruption in financial terms, what would it be?
O Work time spent cancelling and getting agreement for cancellation and changes to work patterns, additional travel costs.
O Supplier suffered IT failure which in turn stopped production for 15 hrs@$1/4M/hr
O Cost of severe weather disruption circa £1m.
O [Company] closed its office for 2 business days. Employees were paid for these days at a cost of about 92,000 EUROs; overtime in clearing backlogs and meeting pre-designated timelines pushed this cost beyond 100,000 EUROs.
O Power failure and failure of redundant power supply.
O Ramp up office space and facilities to onboard additional staff.
O We had to renovate a block/building following a fire, relocate patients and staff for some time while we did.
O Quarantine of site, staff and operations due to malicious 'white powder' incident for 12 hours - with potential contamination of whole site and all staff - affected some 100 FTE's and resulted in overnight/overtime working to recover to BAU SLA achieving operations within 24 hours of the incident.
How do you currently identify key suppliers?
O Key suppliers are identified within key activities. A specific BIA has been created to qualify and quantify the risks related to supplier's unavailability. A supplier is all the more critical in terms of business continuity, if the activity performed by the supplier can not be recovered internally or transferred to another supplier within the Maximum Tolerable Period of Disruption.
O All suppliers have BCM statements in their contracts. However those key suppliers we are more dependent on (higher value contracts) have more stringent BCM requirements. We would expect a summary copy of their key BCM documents. Some of these we would also expect to be involved in
their BCM testing.
O We have specific policy requirements for all third parties ratings based on a number of risk factors not only BIA.
O Developing BIA into all supplier /procurement arrangements and use BCM business impact analysis to identify key suppliers, monitored on a regular basis.
O In the process of introducing specific BC requirements into supplier questionnaires etc
O We assess all suppliers for criticality to our business. We also have BCM clauses in all our contracts, & do additional work to identify, manage & monitor key suppliers in conjunction with procurement, corporate responsibility & BC.
O Suppliers are prioritised due to the criticality to the Business Processes and focus on high priority Suppliers
O We measure all our suppliers against our ISO 9001 criterion and insist that they adhere to our regular surveys.
O Not in place yet, but I will be using the BIA process to identify where suppliers are key to the delivery of a critical activity.
O Have developed a Material Vendor Assessment tool that incorporates BCM and Supply Chain methodologies to determine impact criticality of the product or service.
O ISO approved only.
O We are held under the constraints of the NHS Logistics processes for purchasing our in house resources. We commission services which we monitor BCM and supply arrangements through schedule 4.10 of the national contract.
O We do identify key suppliers, but are not yet consistent across the organization.
O Awareness of a BCM BIA approach is gaining headway.
What level of visibility do you have of your key suppliers’ supply chain?
O As we just start to treat this kind of unavailability in our BCP, we focus on
Supply Chain Resilience 2010 34
Copyright © 2010 The Business Continuity Institute. All Rights Reserved. 34
immediate suppliers only and we make sure that they have a BCP corresponding to our expectations. When this step will be completed, we will require that our suppliers check their suppliers in turn or work through the full supply chain to identify potential points of failure.
O Annual assessment.
O During the 2009 influenza pandemic, we asked our key suppliers to confirm their ability to continue services under various scenarios. We did not ask for any detail on their supply chain needs.
O Audits are carried out.
O We would work through the full chain where appropriate.
O Part of the requirement on suppliers will be that they have business continuity arrangements in place - which will include them ensuring that their supply chain is resilient.
O Our business has no current option but to deal with a single supplier which is [Service Provider].
O Maturing process that has been somewhat ad hoc in the past. Program in place to address entire supply chain risk.
O We have yet to establish a supply chain security matrix.
O Even identifying our immediate suppliers is a challenge in the BIA update process.
O Only in rare cases do we push past the primary suppliers, rather we rely on 'multiple' redundant suppliers.
O We also require our suppliers to grant audit rights all the way down the supply chain - as our customers in turn require of us - thus giving visibility of the majority of the supply chain - whilst consolidation of supply chain has and is taking place - the distributed nature of our operations requires a reasonably wide distribution of our supply chain thus giving a reasonably high degree of mitigation and resilience by having the ability to increase / decrease demand on individual suppliers to cope with variations in demand.
How successful have you been in ensuring that your supply chain adopts BCM practices in line with your needs?
O For the moment we don't have the whole visibility on BCP for all key suppliers.
O All renewals and new contracts cannot be agreed without BCM practice clauses.
O It’s been difficult to persuade procurement managers to ensure BCM is retro-fitted into existing contracts due to cost implications and also problematic to organize worthwhile compliance auditing.
O Customer critical products only.
O Only as part of initial BIA of key supply chain.
O Certain key suppliers file regulatory reports and we get a copy of these.
O Due to the number of suppliers we have, we have focussed on the more critical suppliers at this stage with a plan to pick up more on an ongoing basis.
O Partially successful in terms of documentation formality. However we always ensure that suppliers do have the necessary qualified human resources & alternates as well as the required emergency management processes and escalation procedures.
O Business Continuity has only really had focus for this year so we are currently in the process of getting the right people and ensuring that the right policies and procedures are put in place.
O We work hard at maintaining good relationships with our key providers.
O BC is part of our standard contract but not always assessed during contract audits
O The company is too small to have an impact on the behaviour of our key suppliers.
O We are now starting the implementation in one of the locations then roll out the rest of the facilities.
O All suppliers have to submit that they have a BC Plan before they are awarded a contract.
Supply Chain Resilience 2010 35
Copyright © 2010 The Business Continuity Institute. All Rights Reserved. 35
If your key suppliers do not or cannot meet your requirements what approach have you taken?
O If no evidence of improvement is given then we would look to change supplier as and when contracts allow, or depending on costs.
O Legacy contracts the issue, easy for new third parties to have contract clauses for BCM, right to audit etc but for historic con-tracts often have to wait until re-tender unless breach / lack of delivery etc.
O We are working with key suppliers to ensure we are a priority customer. Nonetheless, most of our key suppliers are renowned products and service providers having appropriate resiliency management practice embedded in their org. culture.
O We work with them to understand the problem and determine our residual level of risk.
O We discuss our findings with each supplier and if they are further perceived as a risk based upon those findings and they can do nothing or are not prepared to be open to change then we seek alternative sources. To date our policy has been readily accepted and we have suppliers that have been with us for many years.
O We are of a scale where we can pressure a supplier to comply - often with our assistance.
O Strategy taken depends on asset / service supplied.
O We are currently working with our suppliers to demonstrate their business continuity planning, including us in their exercises and them in ours. We hope this will improve our understanding both ways.
O Variable - criticality of supply, uniqueness of delivery, Intellectual Property.
If applicable, how satisfied are you with the responsiveness of the following types of suppliers in providing you with information on their business continuity plans and responding to your needs?
O Our biggest problem is with the [Service Provider] who are completely intransigent and with their recent industrial problems we
have worked around them to a point where very little of our mail goes via 'snail-mail'. As part of our energy conservation and environmental policy we are encouraging the use of electronic format communication - more and more.
O BCPs from major utilities tend to be generic with motherhood statements only. Energy, Water, Telecoms, Public Transport etc will not provide specific plan details.
O This organization is considered national critical infrastructure, so we get assistance ahead of many others. We should not rely on that assistance and need to be become more resilient and self-sufficient.
How often do you review your BCP with key sup-pliers?
O When a new supplier is appointed.
O We currently make sure that contracts include BCP clause and if not we modify it in accordance with internal instructions and with supplier's agreement.
O Mostly BCM-requirements stick to Service Level Statements, not going into BCP-solution details of the supplier as this is referred to confidential. We - as a large bank - do follow the same approach with our clients. We distribute declarations about our BCM-status and are willing to discuss BCP with (large) clients, but do not distribute the BCP-document.
O Re "your plan" we reviewed our plan every 3 months. We expected, and verified, that the suppliers did this for their plans every 6 months or major change during that time.
O Every 2 years or major event.
O Depends if sole supplier.
O We review our supplier criticality assessments yearly and amend as appropriate.
O During our BIA refresh project, we are asking questions about BC of our key suppliers, but our best opportunity to influence is at the time of contract renewal.
O Varies according to contract - Monthly Service Management Reviews - supported by
Supply Chain Resilience 2010 36
Copyright © 2010 The Business Continuity Institute. All Rights Reserved. 36
quarterly; half-yearly and annual reviews at increasing levels of management involvement
What evidence of a BCM programme do you seek
from your key suppliers?
O Copies of documentation asked: summary of continuity measures for the service provided, crisis management organization, test assessment report.
O We asked for a copy of their plans and if refused, required they supplied us with a 'body of evidence' to prove much of above.
O Different for each client.
O Depends whether sole supplier or not.
O For important purchases we carry out risk assessments and prepare contingency plans.
O We ask for evidence, but none is supplied. Most of our key suppliers are monopolies.
O The company is too small for any of the key suppliers to bother to respond.
O We make it a contractual obligation to have appropriate BC arrangements in place.
O We ask them to participate in our exercises and we expect to participate in theirs.
O Depending on the client and the type of providers they have.
O With IT suppliers we run extensive exercises but other suppliers are not checked properly.
How have you checked/validated that key suppliers’ BCPs might work in practice?
O Some suppliers will not provide documented outcome reports even though we ask for them.
O These are joint exercises, including not just desk top but technical recovery.
O This is an area in which we are trying to create more awareness.
O We have used then during exercises.
O Plan to run desk top exercises in the future.
O Most vendors have not been checked; our outsourced IT provider runs independent tests and participates in our BC tests.
O We ask key suppliers for more evidence and a more simple confirmation from less critical suppliers.
O Requested for an executive summary of their BCM plans; evaluated consistency & com-pleteness.
O We ask suppliers to evidence desktop exercises and plan updates.
O We work with key vendors and understand our risks before ordering.
O Not yet but plan to include key suppliers in our internal BC exercises.
O We have held joint exercises involving our suppliers.
How do those with purchasing authority within
your organization currently view the importance
of a BCM capability within your key suppliers?
O BCP is more and more considered as a competitive advantage or as a precondition by those with purchasing authority in the organization. However, awareness should be constantly improved.
O I think it depends on the sector type, for IT driven processes it gives competitive advantage, but for people / non-IT support processes it is less mature and seen as important but not critical.
O BCM terms and conditions being implemented as standard within all tenders.
O We assess suppliers using a range of techniques. Price is not always our significant driver when selecting a vendor.
O Depends on criticality of business process being supported.
O They have no view currently.
O Due to the variety of places within the organization where contracts get signed, consistency lags.
Supplier negotiating strategies: what
argumentation have you successfully employed to
persuade EXISTING suppliers to implement BCM
arrangements even if current contracts do not
require them to do so?
O No argumentation was required until now to
Supply Chain Resilience 2010 37
Copyright © 2010 The Business Continuity Institute. All Rights Reserved. 37
persuade existing suppliers to implement BCM arrangements. Contracts are updated with BCP standard clause automatically and providers accept this new demand from clients.
O Notification and renegotiation at end of contract (max three years).
O We've economy of scale and thus have unparalleled bargaining power.
O Where appropriate, we ask them to comply or we will find an alternative vendor.
O Best practices and regulations.
O Regulatory requirement and possibility of non renewal of contract.
O We insist that our BCP is synchronised with vendor's. We make sure that they meet our standards in the wake of BCM program being invoked.
O Educate them on the importance to our continued relationship.
O Offering a free BCM health check, many see the benefit in terms of future clients.
O Headlock! Seriously asked for this nicely pointing out that by renewal of contract it will be expected.
O Future requirement when renewing contract.
O It is a requirement that will need to be put in place at some stage for their own sustainability and competitive edge.
O Explain why we have a BCM programme in place highlighting its mutual benefits. Influence them to act reciprocally.
O Long-term contracts signed quite some time back typically do not have the BCM arrangements as a part of them; otherwise, all new arrangements specifically include the BCM arrangements as a part of vendor-contracts.
O Consolidation of suppliers, BCM is a differentiator.
O We have used the line that it is something that financial services companies expect. This was more around pandemic planning rather than business continuity planning it-self.
O While we do speak of BCM, we emphasize more on resiliency and back-up support and the effective procedures to substantiate this.
O Benefits of BCM and the need for the council to ensure its key suppliers are resilient
O Pressure from our client base as they are regulated and therefore require BCPs.
O Penalty clauses for late delivery and rewards for meeting targets.
O Assurance they can meet SLAs during a ma-jor incident.
O We have explained that we have regulatory requirements to fulfil therefore we need assurance that any supplier can continue to provide a service even during a disruption.
O We have a separate group (CIM) who negotiates with them. It should be part of the contract.
O Competitive advantage.
O Bidding and long-term contract. Also, the capability improvement for the supplier to support our bid and other bids they may be working on with other organizations. BS25999 is certification is a capability that distinctly enables their business to gain an advantage when bidding.
O Audit.
O We change the contract at renewal or have negotiated new terms and have now worked through our supplier list.
O We are a large organization with over 5000 employees and an AUD$1B, so key suppliers want to keep our business.
O Most suppliers do not need much cajoling to implement at least basic BC planning.
O Improved contracts / engagement with them on scenario planning and testing / sharing of best practice.
O Withdrawal of contract + provision of consultancy / advice from our internal BCM team.
O It will become mandatory on us, and thus on our suppliers.
Supply Chain Resilience 2010 38
Copyright © 2010 The Business Continuity Institute. All Rights Reserved. 38
O It is in their interest to do so as everyone is now asking for it. So it will save them lost business.
Does BCM feature as part of the supplier contractual discussion and is it used as a means to negotiate greater specificity in “force majeure” contract clauses around supply chain disruption (i.e. Specifically include or exclude supply chain disruption event types or establish recovery times for suppliers)?
O Scenario covered by the BCM are specified in the clause.
O For us this really only happens for key suppliers at the moment although we are trying to see what we can do to get business continuity into more contracts.
O Depending the priority level of the key supplier, including the product/service criticality based on the level of internal resiliency through our own BCM.
O Definitely part of the discussion, but not necessarily in the force majeure context.
O Force Majeure and business disruption are kept separate.
Have you experienced an increase in force majeure invocations among suppliers within the past 12 months?
O During the GFC & pandemic challenges, activating "force majeure" was more commonplace than usual - traditionally very rare.
O As a point I have raised with our legal group...it is odd that we have neither seen nor formally invoked Force Majeure...even in severe incidents where we are 'required' to provide services, say, following a hurricane. The formal declaration doesn't seem to happen.
END OF REPORT.