Embed Size (px)
Citation preview

1
08Fall
Energy & Energy Policy
Professors Stephen Berry & George Tolley
The University of Chicago
December 2015
Supplying Crude Oil to Yemen and India: Exploring the Hurdles to Energy Access for Net-Importers and Net-Exporters
AUTHORS: Andréa Breslin Ayesha Saksena Samantha Weiss Alessandro Zito

2
Abstract
Our paper analyzes the supply of crude oil to two developing nations - India (as a case
study for Asia) and Yemen (as a case study for MENA). We compare and contrast how crude oil
supply holistically affects the respective economies of these regions, taking into account their
relationships with foreign economies and trade. While India is a net importer of crude oil,
Yemen strongly relies on the exports of such good. To better understand how oil production and
consumption have behaved in recent times (from 1990 to 2012), a linear econometric model has
been carried out for both countries. Factors used in the model included: the level of oil
consumption (regressed with respect to current GDP per capita), energy intensity of use (a
measure for the energy efficiency of a country), the consumer price index and the amount of
crude oil exports (for Yemen) and imports (for India). While the model worked for Yemen,
returning a consumption elasticity with respect to exports of 0.223 (which suggests a positive
relationship between crude oil consumption and exports), it proved inefficient for India,
returning irrational results. This failure is attributed to the structure of the economic, political,
and geographical differences between the two regions. While coal, natural gas and electricity are
influential for India’s energetic sector, they are not for that of Yemen. We found that Foreign
Direct Investment (FDI) is the most appropriate means by which to combat the economic,
political, and environmental hurdles that hamper energy supply.

3
Contents 1 Introduction 5 2 Region Selection & Rationale 6 2.1 Developing regions identification . . . . . . . . . . . . . . . . . . . . . . . . . . . . . . . . . . . . . 6
2.2 Yemen . . . . . . . . . . . . . . . . . . . . . . . . . . . . . . . . . . . . . . . . . . . . . . . . . . . . . . . . . . 8
2.3 India . . . . . . . . . . . . . . . . . . . . . . . . . . . . . . . . . . . . . . . . . . . . . . . . . . . . . . . . . . . 10
3 Energy Source Selection & Rational 11 3.1 Crude oil rational . . . . . . . . . . . . . . . . . . . . . . . . . . . . . . . . . . . . . . . . . . . . . . . . . 11
3.2 Net importer vs. net exporter . . . . . . . . . . . . . . . . . . . . . . . . . . . . . . . . . . . . . . . . 12
4 Current oil consumption & production 13 4.1 Oil production in Yemen . . . . . . . . . . . . . . . . . . . . . . . . . . . . . . . . . . . . . . . . . . . 13
4.2 Oil consumption in Yemen . . . . . . . . . . . . . . . . . . . . . . . . . . . . . . . . . . . . . . . . . .15
4.3 Oil production in India . . . . . . . . . . . . . . . . . . . . . . . . . . . . . . . . . . . . . . . . . . . . . 17
4.4 Oil consumption in India . . . . . . . . . . . . . . . . . . . . . . . . . . . . . . . . . . . . . . . . . . . 17
5 Yemen Econometric Model 19
5.1 Overview of model . . . . . . . . . . . . . . . . . . . . . . . . . . . . . . . . . . . . . . . . . . . . . . . .19
5.2 Oil production . . . . . . . . . . . . . . . . . . . . . . . . . . . . . . . . . . . . . . . . . . . . . . . . . . . 20
5.3 Crude oil consumption . . . . . . . . . . . . . . . . . . . . . . . . . . . . . . . . . . . . . . . . . . . . . 22
5.4 Energy intensity of use . . . . . . . . . . . . . . . . . . . . . . . . . . . . . . . . . . . . . . . . . . . . . 22
5.5 Current GDP per Capita . . . . . . . . . . . . . . . . . . . . . . . . . . . . . . . . . . . . . . . . . . . . 23
5.6 Crude Oil Exports . . . . . . . . . . . . . . . . . . . . . . . . . . . . . . . . . . . . . . . . . . . . . . . . 24

4
5.7 Results . . . . . . . . . . . . . . . . . . . . . . . . . . . . . . . . . . . . . . . . . . . . . . . . . . . . . . . . . 24 6 India Econometric Model 27 7 Hurdles to sufficient oil supply 28 7.1 Economic hurdles in Yemen . . . . . . . . . . . . . . . . . . . . . . . . . . . . . . . . . . . . . . . . 29
7.2 Political hurdles in Yemen . . . . . . . . . . . . . . . . . . . . . . . . . . . . . . . . . . . . . . . . . . 29
7.3 Environmental hurdles in Yemen . . . . . . . . . . . . . . . . . . . . . . . . . . . . . . . . . . . . .30
7.4 Economic hurdles in India . . . . . . . . . . . . . . . . . . . . . . . . . . . . . . . . . . . . . . . . . . 30
7.5 Political hurdles in India . . . . . . . . . . . . . . . . . . . . . . . . . . . . . . . . . . . . . . . . . . . .31
7.6 Environmental hurdles in India . . . . . . . . . . . . . . . . . . . . . . . . . . . . . . . . . . . . . . .32
8 Foreign Investment 32 8.1 Foreign investment in Yemen . . . . . . . . . . . . . . . . . . . . . . . . . . . . . . . . . . . . . . . 33
8.2 Foreign investment in India . . . . . . . . . . . . . . . . . . . . . . . . . . . . . . . . . . . . . . . . . 34
9 References 36

5
1 Introduction
Across the developing world people are adversely impacted by very low consumption of
energy, the use of dirty or polluting fuels, and excessive time spent collecting fuel to meet basic
needs. This phenomenon is known as energy poverty. In the simplest terms, a household is said
to be energy poor if it does not have access to electricity or to modern forms of fuel for cooking
and heating1 [1]. Furthermore, if the energy provided to citizens is of poor quality, a country may
be considered energy impoverished. Access to higher quality fuels – such as liquefied petroleum
gas (LPG) – provides safer, cleaner, and more efficient energy than other traditional fuels [2].
The use of modern energy services is crucial not only to an individual’s well being, but also to a
country’s economic development. Energy access enables a country to provide its citizens clean
water, sanitation and healthcare, reliable and efficient lighting, heating, cooking, mechanical
power, transport, and telecommunications services. Despite the significance of energy,
approximately than 1.3 billion people world have no access to electricity. This is equivalent to
18% of the global population and 22% of those living in the developing world [3]. To propel
global development, the supply of energy to developing nations must improve.
Two regions impacted by energy poverty are the Middle East North Africa (MENA)
region, and the South Asia region. According to the World Bank, approximately 14.7 million
people in the MENA region and 378.6 million people in the South Asia region have no access to
electricity2. We will explore the supply of crude oil to these regions by looking at two countries
in particular – Yemen as a case study for the MENA region, and India as a case study for the 1 Modern forms of fuel include fuel wood and charcoal, agricultural residues, and animal dung used in inefficient devices. 2 We calculated the MENA figure by multiplying the percentage of the population without access to electricity (4.1%) by the population size (357.3 million) in 2012. We calculated the South Asia figure by multiplying the percentage of the population without access to electricity (22%) by the population size (1.721 billion). The data was for 2012, as this was the most recent data available.

6
South Asia region. Our paper compares and contrasts crude oil supply of a net-exporter, such as
Yemen, and a net-importer, such as India. Preceding our analysis of the two nation’s respective
economic, political, and environmental hurdles, we believe that direct foreign investment will be
the primary vehicle for improving crude oil supply to these countries.
2 Region Selection & Rational
2.1 Developing Regions Identification
According to The World Bank, low-income economies are defined as those with a GNI
per capita of $1,045 or less in 2014; middle-income economies are those with a GNI per capita
between $1,045 and $12,736; and high-income economies are those with a GNI per capita of
$12,736 or more. Those with a GNI per capita less than $12,736 are classified as developing [4].
The Middle East North Africa (MENA) region is one of the world’s most important
energy suppliers, as it comprises approximately 57% of the world oil reserves. However, energy
poverty saturates the region. A startling gap exists between oil rich countries in natural resources
and countries dependent on such resources. Presently, almost 20 million people still lack this
access, especially in rural areas. Through our analysis, we discovered that lack of access stems
3430.4
1570 1300 1501.6
0
1000
2000
3000
4000
2006 2007 2008 2009 2010 2011 2012 2013 2014 2015
GN
I Per
cap
ita (U
S$)
Gross National Income Per Capita Per Year
Middle East North Africa South Asia Yemen India
Figure 1: Comparing annual GNI per capita across the MENA region, the South Asia region, Yemen, and India, with data provided by the World Bank.
7
from distorted petroleum product prices, low cost recovery in electricity, inefficient supply, and
relatively high intensity of energy use. The region lags behind in implementing reforms in the
electricity sector and lacks private sector investment [5]. In this region alone, there are 13
developing nations, all of which have an average GNI per capita of approximately $3,430 in
2009 dollars.
With South Asia experiencing significant economic growth, the demand for oil in the
region has risen rapidly. Presently, the continent of Asia accounts for roughly a third of global
energy demand. By 2017 Asia is projected to be the highest in primary energy demand, and by
2033 in primary oil demand [6]. The rise in energy demand will be witnessed across several
Asian countries as oil demand is expected to grow to cater for growth needs of countries like
Japan, Vietnam, Thailand, Malaysia, and Indonesia. However, India and China contribute the
most to the rise in energy demand (annually at 6% and 5.5% respectively) as both countries have
vast populations and an increasing growth trajectory [7]. Moreover, the Asian economy, with 4.4
billion people, compromises for about 60% of the world population and is currently the fastest
growing economic region and largest continental economy (by GDP) in the world, making it an
incredibly important player in the global macro-economy and a fascinating region to consider in
this paper [8].
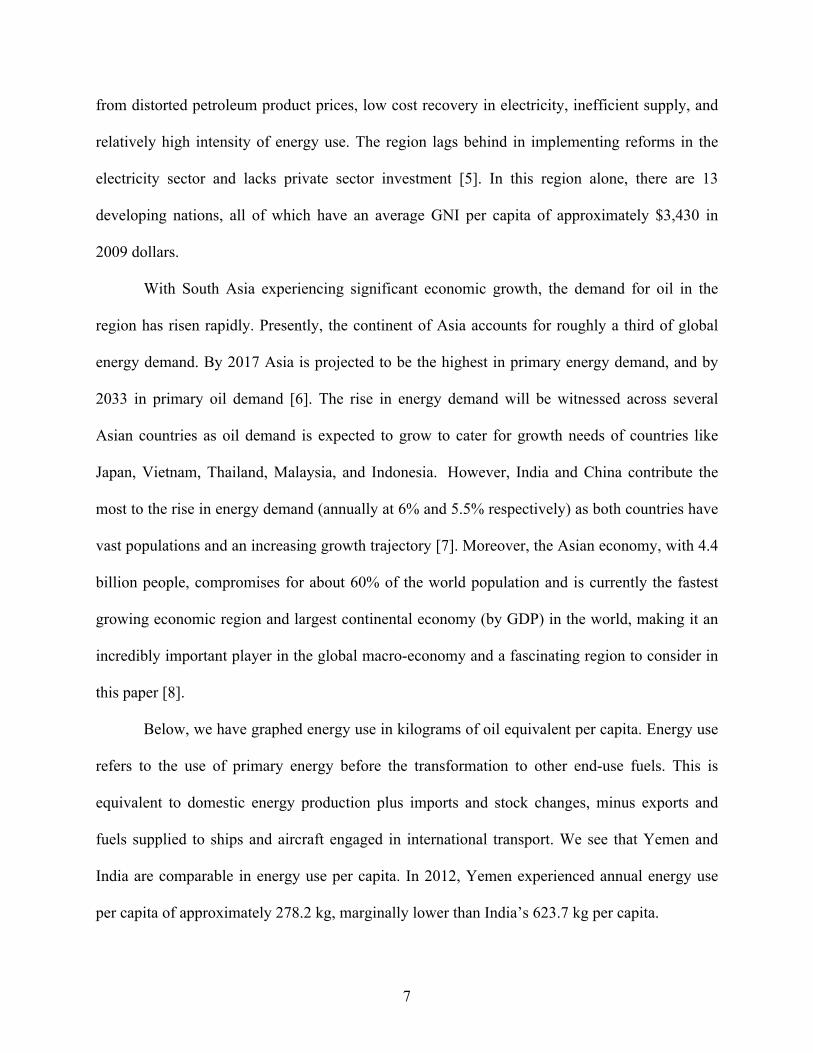
Below, we have graphed energy use in kilograms of oil equivalent per capita. Energy use
refers to the use of primary energy before the transformation to other end-use fuels. This is
equivalent to domestic energy production plus imports and stock changes, minus exports and
fuels supplied to ships and aircraft engaged in international transport. We see that Yemen and
India are comparable in energy use per capita. In 2012, Yemen experienced annual energy use
per capita of approximately 278.2 kg, marginally lower than India’s 623.7 kg per capita.
8
2.2 Yemen
Situated in the MENA region, Yemen had a GNI per capita of approximately $1,300 in
the year 2013. For comparison, the average GNI per capita in the MENA region was
approximately $3,431 in 2009, the latest available data according to the World Bank [9]. While
not the largest supplier of crude oil, Yemen does have significant oil reserves, estimated to be
approximately 2 billion barrels as of January 2014. Oil production, however, has been steadily
decreasing in the region since 2001, when production peaked at ore than 440,000 barrels per day
(bbl/d) [10]. Roughly 25% of Yemen’s GDP and 65% of government revenue comes from oil
and gas revenues, so we can anticipate the region running into problems, or perhaps national
development being hampered, by decreased oil production [11]. Furthermore, because the region
is characterized as developing, we have seen a relatively high use of energy, and accordingly a
high demand for oil.
1391
564.7
278.2
623.7
0
500
1000
1500
2006 2007 2008 2009 2010 2011 2012 2013 2014 2015
Kg
of O
il E
qu. P
er C
apita
Energy Use Per Capita Per Year
Middle East North Africa South Asia Yemen India
Figure 2: Comparing annual energy use per capita across the MENA region, the South Asia region, Yemen, and India with data from the World Bank.

9
Yemen’s energy poverty is widespread and severe, particularly among the country’s rural
population and the poor, which comprise nearly half of the population. Not only do individuals
suffer from the low rate of electrification, but businesses and industries also suffer. Energy
poverty affects Yemen’s entire economy – a paradox given that it is an energy exporter of both
natural gas and crude oil. We have decided to study Yemen due to the blatant contradiction it
presents – although the country is a net exporter of crude oil, it is one of the most impoverished
countries in terms of energy access. Later in the paper, we will explore in-depth the countries’
economic, political, and environmental factors that affect the supply of oil to the nation.
2.3 India
India, a case study for South Asia, had a GNI per capita of $1,570 in 2014 [9]. Presently
the nation is in a state of paradox: while it falls into the lower bracket of the developing nation
classification (with a modest GNI of $1,570 USD) it happens to be world's fastest growing
Figure 3: Yemen annual crude oil and lease condensate production for the years 1986 to 2013, from the US Energy Information Administration

10
energy market. In fact by 2035, India is forecasted to account for almost one fifth (18%) of the
global energy consumption.
The rise in energy demand, namely crude oil demand, combined with insufficient
investment in oil development and fairly unwavering production levels, has caused a massive
shortage of oil in India. This shortage has triggered immense reliance on oil imports for India (in
2013, for example, India’s net imports were nearly a whopping 144.3 million tons of crude oil,
and in general 77% of oil in India is supplied via imports) [12]. As seen in the above figure,
provided by Energy information, Administration, India’s energy demand is directly proportional
to the rising GDP.
3 Energy Source Selection & Rational
3.1 Crude Oil Rationale
Crude oil, a complex mixture of hydro-carbons, is a fossil fuel that formed millions of
years ago. This energy form exists as a liquid and can be extracted from reservoirs deep within
Figure 4: India’s Domestic Production and Import Demand, with data from the US Energy Information Administration. The above figure demonstrates Indian dependency on Crude Oil Imports.

11
the earth. Crude oil, when processed through refineries, can be converted into diverse petroleum
products. It is an attractive energy source for our study for two main reasons: its considerable
importance to industrialized nations, and its ability to be traded globally. Crude oil, simply put, is
considered to be the most important energy source amongst industrialized nations as it has a
wide spectrum of uses. These include the manufacturing of chemicals, plastics, detergents,
paints, medicines, as well as fueling vehicles, driving machinery, and generating heat [13]. Its
importance is reflects by global demand, which is expected to increase at an average annual
growth rate of 1%. This would make oil the largest energy source. Secondly, crude oil allows us
to compare and contrast how to supply energy to a net-importer (India) versus a net-exporter
(Yemen) [14].
3.2 Net Exporter vs. Net Importer
A net importer is defined as a country or territory whose value of crude oil shipped out of
the nation is higher than the value of crude oil brought in over a given period of time. One such
nation is Yemen. As producer of crude oil, Yemen has enough domestic oil supply to fulfill its
Figure 5: World energy consumption, measure in 1000 TWh per year, with data provide by British Petroleum (BP). From this, we can see the relative importance of oil as a source of energy.

12
nation’s demand. Nevertheless, due to distorted petroleum product prices, much of this oil is
exported and domestic demand is unfulfilled. In 2014, the country exported $8.291 billion of
goods. Embedded in this figure is the export of 43,000 bbl/d of crude oil. According to the
Central Intelligence Agency, Yemen’s most significant export partners in 2014 include China
(28.3% of Yemen’s total exports), South Korea (23%). Thailand (11.2%), and Japan (8.1%) [11].
Alternatively, a net importer relies on bringing in barrels of crude oil to the country to
bride the gap between the nation’s demand for the energy source, and its domestic supply. India
is a net importer of crude oil. In 2014, India produced approximately 37,800 thousand metric
tons (TMT) of crude oil, which is under a quarter of its demand. This amounts to producing
approximately 767,000 bbl/d in 2014. To bridge the gap between supply and demand, the
country had to import oil from various other nations. In 2013, India imported 3.812 million bbl/d
of crude oil [11]. Total consumption ended up being approximately 158,400 TMT; 77% of this
demand was fulfilled by imports [10]. According to the Central Intelligence Agency, India’s
largest import partners in 2014 were China (12.7% of total imports), Saudi Arabia (7.1% of total
imports), the UAE (5.9% of total imports), and the United States (4.6%) [11].
Below, we have graphed energy imports per year for Yemen and India. Embedded in
energy is crude oil imports – a form of energy. According to the World Bank, net energy imports
are estimated as energy use less production, both measured in oil equivalents. A negative value
indicates that the country is a net exporter.

13
4 Current oil consumption & production
4.1 Oil Production in Yemen
The oil and gas sector in Yemen in dominated by the state. The government of Yemen is
involved in all parts of the oil and gas chain, including oil production, refining, distribution, and
marketing of petroleum products. Private companies are involved in upstream oil exploration and
production activities, the filling and distribution of LPG bottles, and the distribution of petroleum
products [15]. The figure below shows the current industry and ownership structure for the oil
and gas sector in Yemen.
-118.2
30.9
-200
-150
-100
-50
0
50
2006 2007 2008 2009 2010 2011 2012 2013 2014 2015 2016
Ene
rgy
Impo
rts,
net (
% o
f ene
rgy
use)
Energy Imports Per Year
Yemen India
Figure 6: Energy imports per year in Yemen and India, with data from the World Bank.
Figure 7: Visual representation of the crude oil industry and ownership structure for the oil and gas sector in Yemen, provided by the World Bank.

14
Yemen currently has a crude refining capacity of 130,000 bbl/d (barrels per day) from
two aging refineries. One is located in Aden and is operated by Aden Refining Company (ARC).
The Aden refinery has a capacity of 120,000 bbl/d. The Marib Refining Company (MRC)
operates the second refinery, and has a capacity of 10,000 bbl/d. The Yemen Oil and Gas
Company (YOGC) supplies these two refineries with crude oil to refine oil products for the
domestic market and exports the remaining Government share. All of Yemeni crude oil for the
two refineries comes from Hunt’s Marib field. About 90% of the processed crude oil at ARC is
Marib Light. The remaining proportion is non-Yemini crude oil. MRC excessively supplies the
domestic market. In contrast, ARC trades in both the domestic and international market. ARC
has the import and export monopoly of oil products in Yemen. ARC carries out “crude swaps,”
exporting high quality crude from Marib and importing solar and heavy crude. ARC also exports
high quality oil products and imports lower quality products to supply the Yemeni market.
Yemen first began producing crude oil in 1987 at very low levels and gradually increased
production. As stated previously, oil production peaked in 2001 at 440,000 bbl/d and has not
since rebounded. This is in part due to the country’s aging fields and frequent attacks on its oil
infrastructure. As of January 2014, Yemen has proved reserves totaling 3 billion barrels [10].
Limited oil production results from maturing fields, limited exploration, and frequent attacks on
the country’s energy infrastructure. Furthermore, attacks on Yemen’s key oil infrastructure
continue to curtail both domestic petroleum consumption and exports. With the continued
decline in oil production since the early 2000s, Yemen has struggled to keep its export sector at
normal operating levels.

15
4.2 Oil Consumption in Yemen
Crude oil can be transformed into a number of products: gasoline, diesel, kerosene,
aviation fuel, fuel oil, and liquefied petroleum gas (LPG). The table below illustrates the general
trends in LPG and petroleum product consumption. It shows a sharp divergence in growth rates
among the various fuels. Over the past decade, consumption of kerosene and gasoline has barely
changed. Consumption of diesel and electricity has more than doubled growing at an average
annual rate of 9.2% and 6.3% respectively, while LPG consumption (from Marib) has tripled at
an average annual rate of 10.4%. Over the same period, the population has grown from 13.85
million to approximately 19.2 million (3% per annum on average) and gross domestic product
(GDP) has grown by 5.4% per annum on average. The high LPG growth rate can be attributed to
the success of the strategy to promote LPG use over fuelwood for cooking [15].
Figure 8: Yemen crude oil production pipeline, from the World Bank.

16
Over the past decade and a half, there has been a dramatic shift from fuel wood to LPG.
Yemen officials encouraged households to use LPG for a number of reasons. First were concerns
over deforestation. Second was the heavy time burden on rural women and children for fuel
wood collection. Third were the health impacts of using fuel wood for cooking. Lastly, all
income groups expressed a strong for LPG as the most desired fuel for cooking. LPG is produced
by separating the liquefied petroleum gas from the gas produced in association with the crude oil
at the Marib refinery. The Yemen government owns the gas treatment plant, and operates it as
part of the Yemen-Hunt oil complex at Marib.
The majority of LPG is used for domestic cooking. Few data exist on the extent of its
other uses. In addition, LPG is delivered to larger establishments such as hotels and restaurants.
The largest non-domestic use is for road transport, as there exists a high incentive to convert
gasoline cars to LPG given the difference in price. LPG consumption of the transport sector is
estimated at 10% of the total.
Another product of crude oil, with large levels of consumption in Yemen, is diesel.
Specifically, the bulk of diesel is used by non-household sectors, including transport and
Figure 9: Petroleum Product Consumption in Yemen from 1992-2003

17
industry. The main impact of diesel price increases on household would be indirect – higher
prices for food and water.
4.3 Oil Production in India
During the 2012 fiscal year, India produced 37.86 million tons of crude oil. This accounts
for less than a fourth of India’s crude oil demand. Thus, to bridge the gap between supply and
demand, India must import crude oil from other nations. According to the Petroleum Planning &
Analysis Cell report, in the 2014 fiscal year India was considered to have one of its best years in
terms of crude oil production, and India only accounted for 22% of its domestic consumption
[12]. Their proved crude oil reserves are presently approximately 5.675 billion barrels as of
January 1st, 2015 [10]. In addition to producing crude oil, India also produces petroleum products
that it then exports to other nations. Some of the crude oil imported into India is transformed into
refined petroleum products. These refined petroleum products are then exported from India,
providing revenue to the nation. Roughly 30% of the nation’s total production of petroleum
products is exported; this amounts to approximately 1.25 million barrels a day.
4.4 Oil Consumption in India
India’s demand for crude oil comes primarily from its transportation and industrial
sectors, as crude oil is used for motor gasoline. In fact, the petroleum sector contributed a total of
3.05 trillion rupees to the total GDP for India from April 2013 to March 2014 [12]. Crude oil can
be separated into different types of fuel via refineries, and can produce several valuable
petroleum products. These petroleum products have since been classified into three main types:
sensitive products, major decontrolled products, and minor decontrolled products. Sensitive
products include liquefied petroleum gas (LPG), superior kerosene oil (SKO) and high-speed
diesel (HSD): which accounts for the highest consumption of all petroleum products as it is used

18
to fuel commercial vehicles. Major decontrolled products include motor spirit (MS), Naphtha,
aviation turbine fuel (ATF), light diesel oil (LDO), and furnace oil (FO.) Minor decontrolled
products include petcoke.
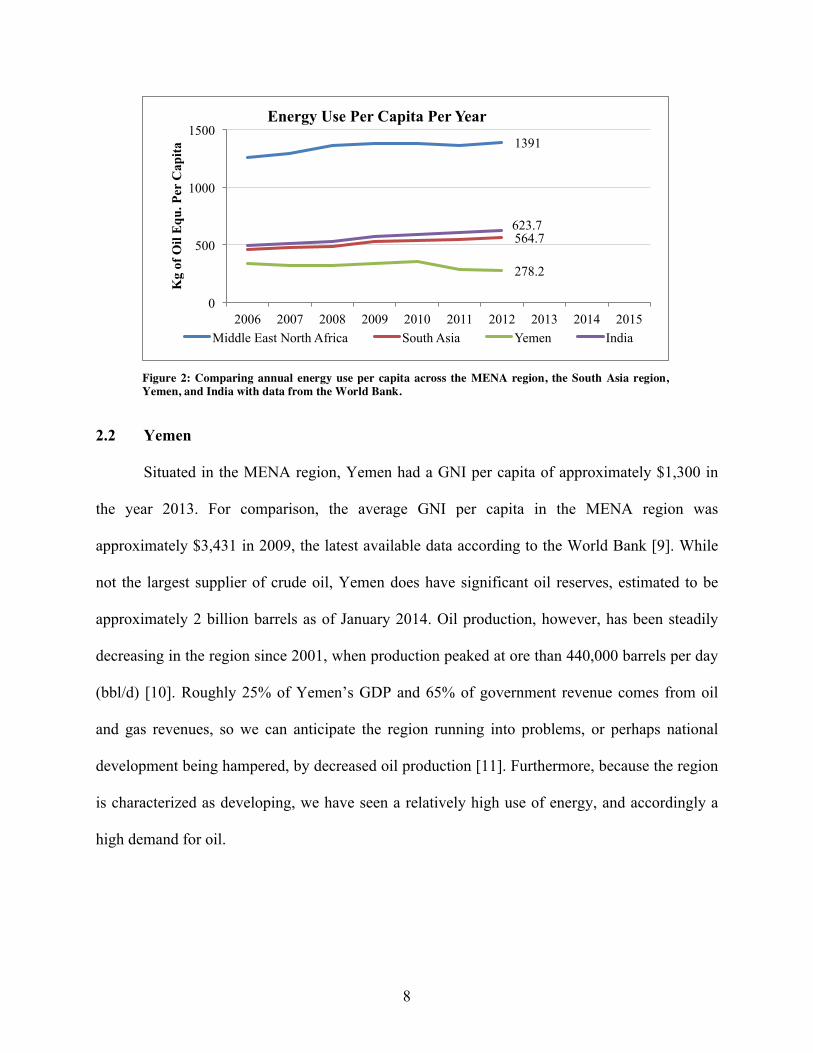
In order to breakdown the consumption of crude oil into specifics, we must analyze each
classification of fuel on its own. In terms of annual growth, consumption of sensitive products
fell by 0.4% last year; however, is forecasted to increase by 2.6% this year. Major decontrolled
products follow a similar patter: last year consumption fell by 0.7%, however, consumption this
year is estimated to increase by 2.1%. In regards to minor decontrolled products, consumption is
a bit more erratic: consumption fell by 20% in 2011, increased by 41% in 2013, increased by
3.7% in 2014, increased by 13.8% this year, and is predicted to increase along the same
trajectory next year [12]. Below are two visuals that represent the same data, and further dissect
oil consumption by individual petroleum product.
Figure 10: Annual crude oil consumption in India, measured in 1000 barrels per day.
19
5 Yemen Econometric Model
5.1 Overview of Model
The purpose of this section is to study the impact of crude oil exports in Yemen’s
economy, in particular focusing on the Total Consumption of petroleum products, from 1990 to
2012. What makes this study interesting is both the political and economic situation of this
country: Yemen highly relies on crude oil exports to sustain its economy, but is facing political
instability since 2009, along with sporadic attacks to its oil infrastructures. Even though Yemen
has sufficient oil resources to sustain both domestic demand and exports, its highly insecure
environment hinders the production and the transport of these resources [10]. Another interesting
issue is that Yemen relies heavily on foreign oil companies that have production-sharing
agreements with the government, and it is the government itself that establishes the price at
which oil is internally sold. This causes a loss in efficiency, because the prices at which products
Figure 11: Consumption of petroleum products, graphed monthly (see left) and annually (see right). The data is from Market Realist. This figure enables use to further dissect oil consumption by individual petroleum product.

20
are sold do not reflect the real production price. Given these factors, the econometric model used
for these purpose is based on the analysis the time series linear regression3:
ln𝑄! = 𝛽! + 𝛽!𝑙𝑛 𝑌! + 𝛽! 𝑙𝑛 𝐸! + 𝛽!𝑙𝑛 𝑃! + 𝛽!𝑙𝑛𝐸𝑋! + 𝑢!
Where:
𝑄! = quantity of petroleum consumption (thousand barrels per day)
𝑌! = current US$ GDP per capita.
𝐸! = energy intensity of use. It is a measure for the efficiency of a country.
𝑃!= consumer-price index (2005 =100), used as a proxy for the level of oil prices
𝐸𝑋!= amount of crude oil exports
𝑢! = error term
At time t (1990-2012)
The aim of the research is to roughly grasp the impact of each determinant, rather than
have a precise estimation of the elasticity with respect to each variable. First, it is fundamental to
go through a brief analysis on what are expected to be the main determinants of petroleum
consumption in Yemen.
5.2 Oil production
Yemen's oil production has decreased significantly since peaking in 2001 because of
natural decline in the country's aging resources, and frequent attacks on its oil infrastructure.
This has left Yemen in poor conditions, and the overall level of instability (wars, attacks, poor
resources) is not likely to decrease in a short period of time. On the other hand, by the very
beginning of 2009, the country began to produce commercial quantities of natural gas (both for
3 The model is based on the paper “The Estimation of the Energy Demand in Yemen: An Econometric Model Approach 1990-2012”, cited in the References section [16]. Given the aims and the topics of this paper, the model has been modified, rather than replicated, in order to include the role of oil exports among the determinants of oil consumption in Yemen.

21
domestic use and for exports). This development could lead the country to a more stable
economy that does not rely on extremely high oil export prices. However, replacing oil export
revenues with natural gas export revenues does not reduce the country's dependence on its
hydrocarbons sector.
Yemen relies heavily on foreign oil companies that have production-sharing agreements
with the government, which includes 20-year concession of production activities. The
agreements between the government of Yemen and the producing companies dictate that on
average 58% of the total production is for government share, whereas 42% for companies shares.
About 63% of government’s share goes for export, whereas 37% goes for domestic use [16].
Oil production started in 1986 and has increased from 192,000 barrels per day in 1990 to
441,000 barrels per day in 2001, when it reached its pick. After 2001, Yemen has faced a deep
decrease, and according to statistics published by the Energy information Administration, if no
discoveries are found, the country will face the existing resources extinction within 10 years
[17].
0 50
100 150 200 250 300 350 400 450 500
1990
19
91
1992
19
93
1994
19
95
1996
19
97
1998
19
99
2000
20
01
2002
20
03
2004
20
05
2006
20
07
2008
20
09
2010
20
11
2012
000
barr
els p
er d
ay
Total oil production
Figure 12: Oil production in Yemen (000 barrels per day)

22
5.3 Crude Oil Consumption
Yemen refines crude oil to produce a wide range of petroleum products: heating oil,
gasoline, kerosene, diesel and jet fuels. Since 1990, the consumption of petroleum products has
increase from 75.965 barrels per day to 140.067 barrels per day in 2006. From 2006 to 2012
instead the consumption has an interesting oscillation, due to the political and environmental
instability of the territory [18].
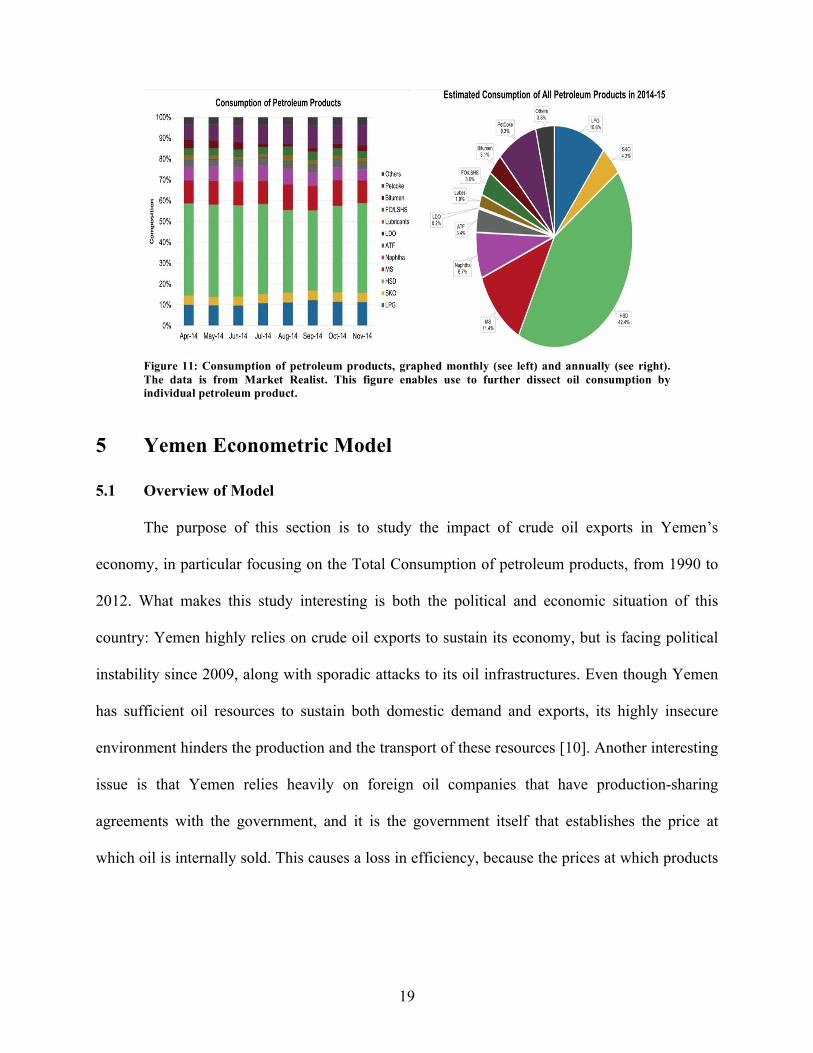
5.4 Energy Intensity of Use
The energy intensity of use is a measure for the energy efficiency of a nation: it is
measured by units of energy per units of GDP (PPP$). The energy intensity then represents the
amount of energy that is needed to create a unit of national output [19]. A high energy intensity
means that the nation has to support a high cost (or price) for converting energy into GDP. As
expected, Yemen has a high energy intensity of use, as shown in the graph below. Overall, the
intensity of use has a flat trend around 12,00 [20]. This means that 12 units of energy are
necessary to produce 1 unit of economic output. This value is pretty high, and the reason for this
inefficiency is to be found both in Yemen’s oil price policy, both in its aging infrastructures.
0.000 20.000 40.000 60.000 80.000
100.000 120.000 140.000 160.000 180.000
1990
19
91
1992
19
93
1994
19
95
1996
19
97
1998
19
99
2000
20
01
2002
20
03
2004
20
05
2006
20
07
2008
20
09
2010
20
11
2012
000
barr
les p
er d
ay
Total petroleum consumption
Figure 13: Total petroleum consumption in Yemen (in 000 of barrels per day)
23
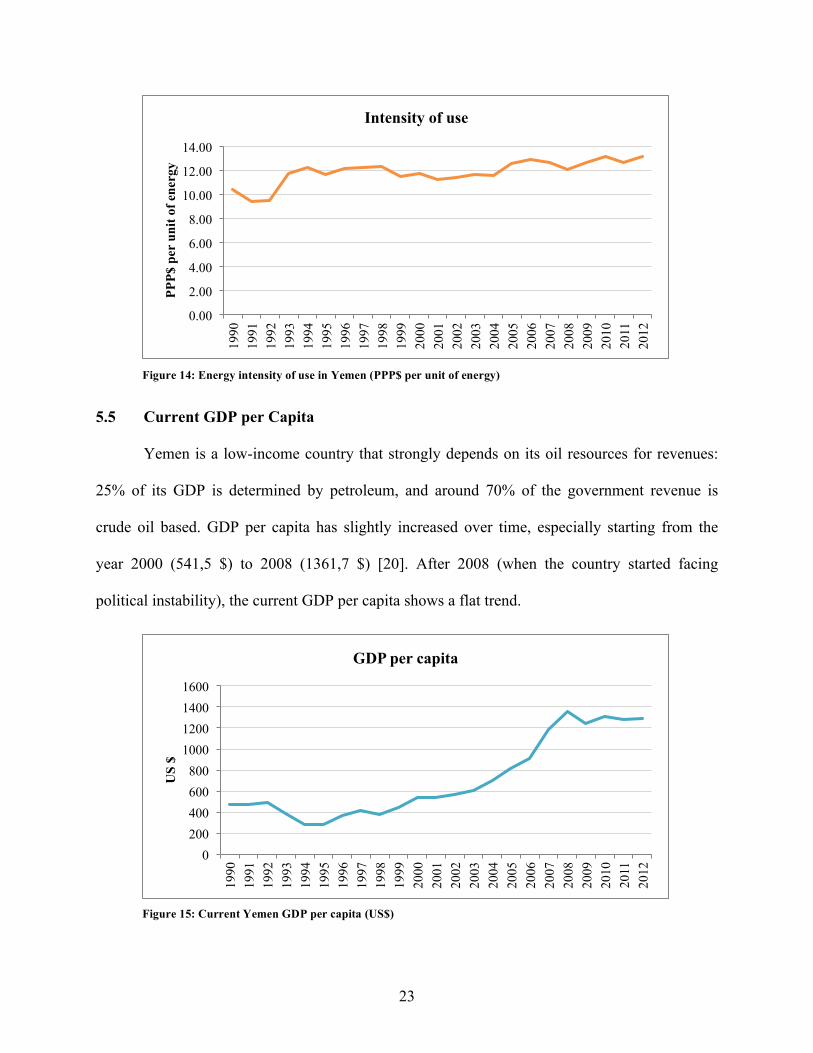
5.5 Current GDP per Capita
Yemen is a low-income country that strongly depends on its oil resources for revenues:
25% of its GDP is determined by petroleum, and around 70% of the government revenue is
crude oil based. GDP per capita has slightly increased over time, especially starting from the
year 2000 (541,5 $) to 2008 (1361,7 $) [20]. After 2008 (when the country started facing
political instability), the current GDP per capita shows a flat trend.
0.00
2.00
4.00
6.00
8.00
10.00
12.00
14.00
1990
19
91
1992
19
93
1994
19
95
1996
19
97
1998
19
99
2000
20
01
2002
20
03
2004
20
05
2006
20
07
2008
20
09
2010
20
11
2012
PPP$
per
uni
t of e
nerg
y
Intensity of use
Figure 14: Energy intensity of use in Yemen (PPP$ per unit of energy)
0 200 400 600 800
1000 1200 1400 1600
1990
19
91
1992
19
93
1994
19
95
1996
19
97
1998
19
99
2000
20
01
2002
20
03
2004
20
05
2006
20
07
2008
20
09
2010
20
11
2012
US
$
GDP per capita
Figure 15: Current Yemen GDP per capita (US$)

24
5.6 Crude oil exports
From the graph above it is clear that petroleum exports reached their pick in 2002
(357.980 barrels per day on average) and faced a quick decline over the last 10 years [17]. Again,
this is strongly correlated with the decrease in crude-oil production after 2001. The core of
Yemen’s exports operations is the pipeline, which runs from the Marib region in the centre of the
country to the export terminal at Ras Isa. For this fact, this infrastructure has been highly targeted
with sabotage attacks. In 2012, there were more than 15 attacks, and oil exports were completely
offline for most of the first half of the year.
5.7 Results
The model used for the valuation is a simple linear log-model, and its purpose is to
estimate the elasticities of the single variables.
𝐥𝐧𝑸𝒕 = 3.675+ 0.358 𝒍𝒏 𝒀𝒕 − 0.939 𝒍𝒏 𝑬𝒕 + 0.014 𝒍𝒏 𝑷𝒕 + 0.202 𝒍𝒏𝑬𝑿𝒕 (2.98) (4.51) (-3.56) (0.49) (3.53)
With an 𝑅! = 0.964 and a D-W = 2.62.
0 50
100 150 200 250 300 350 400
1990
19
91
1992
19
93
1994
19
95
1996
19
97
1998
19
99
2000
20
01
2002
20
03
2004
20
05
2006
20
07
2008
20
09
2010
20
11
2012
000
barr
els p
er d
ay
Oil exports
Figure 16: Yemen crude oil exports (000 barrels per day)

25
Apparently, the estimated specification seems to have an irrelevant variable, which is the
consumer-price index. This result is confirmed by the fact that if the level of prices increases by
1%, the consumption of petroleum product should increase by 0.014%, which is against any
economic theory. Plus, the p-value obtained for the level of prices is 0.630. Thus, there is strong
evidence that the overall level of prices does not affect the consumption of petroleum products.
This result has a technical explanation: even though the level of oil price is expected to be
relevant and fundamental for the level of the consumption of petroleum products, the model
accounts for Yemen’s overall price level (consumer price index, 2005=100), and not for the
specific price of oil.4 By getting rid of the variable Pt for the specification, the result is slightly
better:
𝐥𝐧𝑸𝒕 = 3.378+ 0.386 𝒍𝒏 𝒀𝒕 − 0.922 𝒍𝒏 𝑬𝒕 + 0.223 𝒍𝒏𝑬𝑿𝒕 (3.21) (7.31) (-3.60) (6.09)
With an 𝑅! = 0.96 and a D-W = 2.60
The results can be overall quite satisfying: the value for the Durbin-Watson statistics is
quite close to 2, which means that there is not enough empirical evidence to show that there is
autocorrelation among the variables. Graphically, the model captures the overall trend of the
(log) petroleum consumption.
4 The data for the actual price of oil in Yemen was neither stored in the U.S. EIA database nor in the World Bank one. In order to avoid using less accurate data, we have decided to run the regression with the consumer price index as a proxy. By our analysis, the proxy seems to be irrelevant.

26
It is possible to notice that after the regression line does not approximate well the final oscillating
trend of the petroleum consumption, but rather captures the mean of every variation. This is due
to the fact that variables like political instability and the aging infrastructures are not included in
the model, because they are difficult (if not impossible) to measure. For our purpose, the overall
results obtained are more than sufficient. Eventually, the model shows us the following:
• Positive relation between oil consumption and GDP per capita: more precisely, if GDP
increases by 1%, the consumption of crude oil products increases by 0.39 %
• Negative relation between the consumption and the intensity of use: if the value for the
intensity increases by 1%, the country is more likely to face a decrease in petroleum
consumption by 0.92%. This is straightforward: if the level of energy intensity increases,
then the cost for converting energy into GDP increases, and this will lead to a
consumption which is “ceteris paribus” more expensive.
• Positive relation between exports and consumption: in the exports increase by 1%, the
consumption increases by 0.22%. This result is in harmony with the role that exports
Figure 17: Oil consumption estimation

27
have in Yemen’s economy: if the exports increase, the overall output in the economy
increases, which leads to an ultimately increase in consumption.
6 India Econometric Model
Given that the econometric model above works for Yemen, the question whether it can be
used to estimate the determinants of India’s oil consumption and the impact that oil imports have
on India’s economy comes to the for automatically. Unfortunately, the answer to this question is
negative: the model cannot be applied for India’s case. This section explains why. By working
again with time series for the period of time (1990-2012), the estimated specification is the
following:
𝐥𝐧𝑄! = 𝛽! + 𝛽! ln𝑌! + 𝛽! ln𝐸! + 𝛽! ln𝑃! + 𝛽! ln 𝐼𝑀! + 𝑢!
Where [18]:
𝑄! = quantity of petroleum consumption (thousand barrels per day)
𝑌! = current US$ GDP per capita.
𝐸! = energy intensity of use (Efficiency)
𝑃!= consumer-price index (2005 =100), used as a proxy for the level of oil prices
𝐼𝑀!= amount of crude oil imports
𝑢! = error term
At time t (1990-2012).
The output of the OLS regression is listed below:
𝐥𝐧𝑸𝒕 = 5.879− 0.184 𝐥𝐧𝒀𝒕 + 0.798 𝐥𝐧𝑬𝒕 + 0.476 𝐥𝐧𝑷𝒕 − 0.029 𝐥𝐧 𝑰𝑴𝒕 (16.72) (-3.37) (3.75) (6.71) (-0.59)
With 𝑅! = 0.994 and D-W = 1.53.

28
This result is invalid, because it is against every economic (and rational) theory. In fact, it
tell that and increase in the price level will lead to an increase in consumption, an increase in
Energy Intensity (which means that the level of efficiency of a country is worsening) leads to an
increase in consumption, and an increase in GDP causes a decrease in consumption. Plus, the
crude oil imports variable is irrelevant for every standard significance level.
Eventually, the model cannot be used to answer the same question (what is the impact of
import/exports over the petroleum consumption) for two different countries 5 . A possible
explanation for this is that India’s economy is wider, more resourceful and more complex that
Yemen’s economy. In fact, India does not stand for its own but has to be observed in close
relationship with the other energy sectors: coal, natural gas, electricity (which are more
important in terms of units of energy produced and GDP generated). Thus, a simple model such
as the one above fails when used to explain the time-path development of the Indian petroleum
consumption.
7 Hurdles to sufficient oil supply
Supplying increasing amounts of oil to Yemen and India will be central to providing
energy and raising both countries from the status of developing nations, while at the same time
increasing the quality of life for their citizens. However, it would be naive to believe there are
not hurdles to increased oil supply in both countries. Thus, we analyze the obstacles faced in
5 This was not the only regression that the authors have carried out: along oil consumption, estimations for the oil production have been tried, taking into account not only factors related to crude oil, but also variables such as natural gas production, coal production and electricity capacity. All methods proved inefficient and irrelevant, if not irrational, suggesting that other econometric models have to be used to analyze the impact of oil imports in India, and the determinants of its Oil sector. Given that the authors can only rely on undergraduate-level tools for the econometric analysis, the decision that has been taken is not to dig further, rather than come up with a model that does not have a close relation to the topics developed in the paper as the Yemen’s model does.

29
both countries, answering the question: “What changes would be required to increase the supply
of oil in Yemen and India respectively?” By answering this inquiry we provide a roadmap to
change and hope to leave the reader with a realistic sense of the struggles and possibilities faced
in supplying oil energy to these two developing nations.
7.1 Economic Hurdles in Yemen
One factor that contributes to energy poverty – or lack of supply – in Yemen is the
country’s widespread total poverty levels. The complete range of factors that determine fuel
access and fuel choice include the following: household income, by determining the amount of
money a household can spend on purchasing energy; energy availability of necessary
infrastructure and other incentive structures to make use of more costly forms of energy; fuel
price and the cost of the necessary equipment to use the fuel; and individual household
preference. The combination of these factors explains why Yemen’s pattern of energy use does
not involve an automatic move along the energy ladder – the full replacement of inferior,
traditional fuels my more modern, more efficient fuels alongside income growth.
7.2 Political Hurdles in Yemen
The most immediate hurdle to investment in Yemen today is the civil war taking place. If
the obvious danger were not enough to dissuade investors the petroleum infrastructure has been
the target of attacks and sabotage. “In 2013, there were at least 10 attacks on Yemen's oil and
natural gas pipeline system, and some industry sources estimate closer to 24 attacks. In 2012,
there were more than 15 attacks, and oil exports were completely offline for most of the first half
of the year” [10]. These attacks and unstable atmosphere has had a devastating effect on the
economy “GDP growth slowed significantly to about 0.3% in 2014 from 4.8% in 2013”. In
contrast, before the conflict began the U.S. Department of State had projected the economy

30
would grow by 5% in 2014 thanks to a better investment climate [21]. Sadly, there is no sign of a
truce on the horizon and it would be difficult, if not impossible, to participate in FDI in Yemen at
this time.
7.3 Environmental Hurdles in Yemen
When investment becomes a more stable possibility Yemen’s subjection to climate
change will still be of concern. The country's vulnerability lies in droughts, floods, and rising sea
levels. Due to the county’s extensive amount of coastal lands rising sea levels are of particularly
of concern. The Intergovernmental Panel on Climate Change (IPCC) ranked Aden, the country's
busiest port and home to the Aden Free Zone, 6th on its international list of twenty-five cities
most vulnerable to danger from rising sea levels [22]. Aden is the country's economic capital and
to avoid further devastation to the economy preventative anti-flooding measures will have to be
invested in.
7.4 Economic Hurdles in India
There are a few key economic hurdles India faces regarding crude oil. India’s Oil and
Natural Gas Corporation’s (ONGC) recent purchase of shares of oil fields located in the Middle
East. This investment has led to 1) existing diplomatic tensions with the United States, whose
volatile relationship with the Middle East is no hidden secret, and 2) the political instability in
the Middle East has caused India to depend more on domestic production of oil, which as
explained previously, cannot currently meet the demands of the market. Thus, India has engaged
in enormous efforts in search of oil hotspots in local regions such as Rajasthan and the
northeastern Himalayas [7].
Due to India’s vast and ever-growing population, and consequential GDP. India has a
targeted GDP growth rate of 8% during the Tenth Five-year Plan and the energy demand is

31
expected to grow at 5.2% [23]. The rapid rise in demand of crude oil is a direct product of the
rising economic growth in India [7]. Indian production level of oil remains stagnant while these
other metrics continue to rise. As a result, consumer demand cannot be met creating greater
dependence on imports. Therefore, India is in dire need of innovative ways to supply and
produce more oil locally as well as to conserve oil.
Finally, the majority of the population in India still struggles to access energy, with
energy-poverty witnessed across all Indian states. This has severe negative ramifications on
India’s economic growth as well as social make-up. Access to energy decreases poverty and
improves the quality of life. Supplying energy to households in rural India would immensely
improve life for Indian women, who currently engage in primitive and time-consuming tactics to
access energy: such as collecting fuel and performing manual labor [24].
7.5 Political Hurdles in India
India’s policies have become increasingly friendly to FDI in recent years, but there is still
room for improvement. Red tape and time consuming bureaucracy are still serious problems in
India. The current system for auctioning off blocks of land for exploration is an infrequent
process. The ninth auction occurred in 2012 and the tenth will not be conducted until the end of
the 2015/2016 fiscal year. To resolve this time gap and make block bidding less restrictive there
are efforts in the Indian government to change to the “open acreage” system. This would also
resolve a previous problem NELP has encountered of blocks not having any takers and
inconsistent investment flow in the oil sector. In the last set of bids, NELP-IX, there was poor
international turnout due to the fact that the blocks up for auction had already been on the
market.

32
7.6 Environmental Hurdles in India
An additional hurdle India will face when expanding oil consumption will be
international pressures to curb carbon emissions. Although India holds the status of a developing
nation it is currently the third-largest greenhouse gas polluter, only behind the United States and
China [25]. Despite India’s consistent assertion that the nation deserves the same opportunity as
other developed nations to build their economy unhindered they have pledged, in a non-binding
way, to cut carbon emission intensity by 35% by 2030 [26]. This dual demand of energy and
environmental conscientiousness has led India to pursue other energy forms, including nuclear
and renewables. However oil is expected to account for 24% of India’s energy use in 2035 and
increasing quantity will be central to providing energy to the projected 1.5 billion people.
8 Foreign Investment
With all the information up to this point we are now ready to answer the crucial question:
how do we increase energy supply in these developing nations? The most promising answer
comes from foreign investment. Along with injecting an economy with much needed revenue,
foreign direct investment (FDI) provides increased production, training of technical personnel,

33
and ultimately elevates the economy of investment [27]. Instinct would tell us securing oil
supply investment for a net importer and a net exporter are different goals and require different
approaches, but surprisingly that is not the case.
8.1 Foreign Investment in Yemen
The refining and drilling sectors most require FDI, when analyzing the oil production
process in Yemen. Yemen’s refineries have a capacity of approximately 130,000 bbl/d. This is
notably lower than 2001 levels of 440,000 bbl/d, evidencing a steep decline in productivity.
Despite the clear need for investment, it cannot be easily secured as Yemen’s refining process is
vastly controlled by the government. Instead, there is more opportunity for foreign investment in
drilling for oil, making it a more appealing prospect for FDI.
Investing in drilling activities can take the form of creating new oil fields. Creating new
fields to surpass Yemen’s aging ones would ensure that more oil can be drilled and used in the
country or exported. This will increase Yemen’s GDP and the government’s budget, roughly
70% of which comes from oil sales [8]. To facilitate FDI in Yemen’s mining, oil and gas sector
the government has set the FDI capacity to 100%. This means full foreign ownership in
companies is allowed. In comparison the average FDI allowed for the same sector in some other
MENA countries, Egypt, Morocco, Saudi Arabia, Tunisia, is 78.8% [28]. In addition, investors
are not required to partner with Yemen based companies, which allows for flexible investment.
Currently, United States oil companies are a major target of the Yemeni government for foreign
investment [29].
One of the most attractive features of investing in Yemen is the Port of Aden. Yemen’s
geographic position allows the port to have strategic placing with easy access to the Suez Canal
in Egypt, the Eastern half of Africa, and South Asia and Australia. The port also acts as a free

34
economic zone, known as the Aden Free Zone (AFZ). Goods manufactured in the AFZ are
exempt from import/export fees, custom fees and production tax. There has also been an
increased effort toward regulation through joining the World Trade Organization and the creation
of the General Investment Authority [30].
8.2 Foreign Investment in India
An initial instinct when looking at a net-importer might be to try to figure out how to
import more. Although that would provide more oil to India and thus more energy it does not
provide more than a temporary solution. Over the past 15 years India’s oil imports have risen
while the level of in country production has remained relatively constant. This makes India a
“price taker” and thus very vulnerable to price fluctuation in the world market. This position
calls for India to increase its domestic production, and we shall see that option is becoming an
increasingly feasible option.
As of 2014 India had 5.64 billion gallons of proven oil reserves [17]. That will need to be
extracted to aid in supplying India’s energy demands which are “projected to double to 48.7
quadrillion but by 2035 nbsp” [31]. Once the crude oil is out of the ground the country also has
its own refineries to process it. With 22 refineries India is the second largest refiner of crude oil
in South Asia, only behind China, and will be able to refine 310 million tonne per year by March
2017 [32]. Extraction will also allow India to increase its strategic reserve, which are pre-
extracted, stored oil which can be used in the event of an emergency or extreme market hike.
The process through which India auctions land is called the New Exploration Licensing
Policy (NELP). The introduction of NELP in 1997 created an opportunity for foreign investors
by loosening the government's hand in oil production and creating an even playing field for
national, domestic, and international companies. There have been ten rounds of NELP bidding,

35
of which number ten is scheduled to end in 2016. This cycles offering of 47 blocks cover
166,053 Sq. km, 56.8% of which is in deep water [33].
A second program meant to attract foreign investors is the “Make in India” initiative, Begun in
2014 by Prime Minister Narendra Modi “Make in India” has expanded India’s reform efforts,
making the process easier and creating better terms of investment. These reforms include
transparent policies, infrastructure exclusivity for 25 years, and 100% FDI allowed in many
petroleum related tasks including: “exploration activities of oil and natural gas fields,
infrastructure related to marketing of petroleum products and natural gas, marketing of natural
gas and petroleum products, petroleum product pipelines... and Petroleum refining in the private
sector” [34]. These reforms have increased FDI with projections that 2015 will be one of India’s
most lucrative year for FDI.
Figure 18: This map highlights the blocks for bidding with yellow areas representing deep water, orange areas representing shallow water, and green areas representing land.

36
9 References
[1] El-Katiri, Laura and Fattouh, Bassam. “Energy Poverty in the Arab World.” The Oxford
Institute for Energy Studies, Aug 2011, http://www.oxfordenergy.org/wpcms/wp-
content/uploads/2011/08/MEP_1.pdf
[2] “Modern Energy for All.” International Energy Agency, 23 Nov 2015, http://www.world
energyoutlook.org/resources/energydevelopment/
[3] “Energy access database.” International Energy Agency, 23 Nov 2015, http://www.world
energyoutlook.org/resources/energydevelopment/energyaccessdatabase/#d.en.8609
[4] “Country and Lending Groups.” The World Bank, 23 Nov 2015, http://data.worldbank.or
g/about/country-and-lending-groups
[5] Yamouri, Najat. “Energy in MENA.” The World Bank, Sep 2010, http://web.worldbank.o
rg/WBSITE/EXTERNAL/COUNTRIES/MENAEXT/0,,contentMDK:22307440~pagePK
:146736~piPK:226340~theSitePK:256299,00.html
[6] “World Energy Outlook 2015.” International Agency Agency, 10 Nov 2015, http://www.i
ea.org/publications/freepublications/publication/IndiaEnergyOutlook_WEO2 015.pdf
[7] “Energy Consumption: The Asian Experience.” Konrad Adenauer Stifung Media
Programme Asia, 2013, http://ejap.org/environmental-issues-in-asia/energy-consumption.
html
[8] “Population of Asia 2014.” World Population Statistics, 14 Mar 2014, http://www.worldp
opulationstatistics.com/population-of-asia-2014/
[9] “GNI per capita, Atlas method (current US$).” The World Bank, 23 Nov 2015,
http://data.worldbank.org/indicator/NY.GNP.PCAP.CD/countries/XQ-YE-8S-IN?display
=graph

37
[10] “Yemen”, U.S. Energy Information Administration (EIA), last updated: September 25,
2014; http://www.eia.gov/beta/international/analysis_includes/countries_long/Yemen/ye
men.pdf
[11] “The World Factbook.” Central Intlligence Agence, 23 Nov 2014, https://www.cia.gov/li
brary/publications/the-world-factbook/geos/ym.html
[12] Asheworth, Daivd. "What amount of crude oil does India produce?” Market Realist, 30
Dec 2014, http://marketrealist.com/2014/12/amount-crude-oil-india-produce/
[13] “Oil: Crude and Petroleum Products Explained.” U.S. Energy Information
Administration, 5 Nov 2015, http://www.eia.gov/energyexplained/index.cfm?page=oil_h
ome
[14] “Key World Energy Statistics 2015. International Energy Agency, Nov 2015, https://ww
w.iea.org/publications/freepublications/publication/KeyWorld_Statistics_2015.pdf
[15] “Household Energy Supply and Use in Yemen: Volume I, Main Report.” Energy Sector
Management Assistance Programme (ESMAP), Dec 2005.
http://siteresources.worldbank.org/INTPSIA/Resources/490023-
1120841262639/Household_Energy_Suppy_and_Use_in_Yemen_Volume1.pdf
[16] The Estimation of the Energy Demand in Yemen: An Econometric Model Approach 1990-
2012”, Abdulkarim Ali Dahan, International Journal of Economics and Finance; Vol. 6,
No. 2; 2014.
[17] U.S. International Energy Administration (EIA), International Energy Statistics, Total Oil
Supply, http://www.eia.gov/cfapps/ipdbproject/IEDIndex3.cfm?tid=5&pid=53&aid=1

38
[18] U.S. International Energy Administration (EIA), International Energy Statistics, Total
Petroleum Consumption, http://www.eia.gov/cfapps/ipdbproject/IEDIndex3.cfm?tid=5&
pid=5&aid=2
[19] International Energy Agency (IEA), “Energy Efficiency indicators: Essential for Policy
making”, 2014. https://www.iea.org/publications/freepublications/publication/IEA_Ener
gyEfficiencyIndicators_EssentialsforPolicyMaking.pdf
[20] The World Bank, World development indicators, GDP per unit of energy use (PPP$ per
kg of oil equivalent) http://databank.worldbank.org/data/reports.aspx?source=2&countr
y=&series=SP.POP.TOTL&period=#
[21] "Yemen Overview." The World Bank. Accessed December 4, 2015. http://www.worldba
nk.org/en/country/yemen/overview
[22] El Raey, Mohamed. "Impact of Sea Level Rise on the Arab Region." Accessed
November 10, 2015. http://www.arabclimateinitiative.org/Countries/egypt/ElRaey_Impac
t_of_Sea_Level_Rise_on_the_Arab_Region.pdf
[23] “Indian Energy Sector: An Overview.” India Energy Portal, n.d., http://www.indiaenergy
portal.org/overview_detail.php
[24] “Access to Energy.” Asian Development Bank, 2015, http://www.adb.org/sectors/energy/i
ssues/access-energy
[25] Coral Davenport and Ellen Barry, “Narendra Modi Could Make or Break Obama’s
Climate Legacy,” New York Times, November 30, 2015, accessed December 1, 2010,
http://www.nytimes.com/2015/12/01/world/asia/narendra-modi-could-make-or-break-
obamas-climate-legacy.html?_r=0

39
[26] Harvey, Fiona. "India Unveils Climate Change Plan." October 2, 2015. Accessed
November 30, 2015. http://www.theguardian.com/world/2015/oct/02/india-pledges-40-
percent-electricity-renewables-2030
[27] Coleman, Denise Youngblood. "Yemen: 2015 Country Review." Yemen Country Review,
(July 2015): 1-307. Business Source Complete, EBSCOhost (accessed December 1,
2015).
[28] "Investing Across Borders 2010: Indicators of Foreign Direct Investment Regulation in
87 Economies." 2010. Accessed December 3, 2015. http://iab.worldbank.org/~/media/FP
DKM/IAB/Documents/IAB-report.pdf
[29] "Department of State: 2014 Investment Climate Statement." June 1, 2014. Accessed
December 1, 2015. http://www.state.gov/documents/organization/229320.pdf
[30] "Aden Free Zone." Invest in Yemen. Accessed December 4, 2015. http://www.investinye
men.org/content.php?c=4&langid=2&pageid=6
[31] "Oil and Gas Industry in India, Petroleum Industry in India, Natural Gas”. India Brand
Equity Foundation. Accessed November 17, 2015. http://www.ibef.org/industry/oil-gas-
india.aspx
[32] "Oil Refining Capacity to Rise 43% a Year by March 2017." Oil Refining Capacity to
Rise 43% a Year by March 2017. April 16, 2012. Accessed December 4, 2015. http://ww
w.business-standard.com/article/economy-policy/oil-refining-capacity-to-rise-43-a-year-
by-march-2017-112041603008_1.html
[33] "NELP-X Oil and Gas Blocks: Salient Features." 2014. Accessed December 3, 2015.
http://www.dghindia.org/admin/document/topstory/12.pdf

40
[34] "Quarterly Fact Sheet: Fact Sheet on Foreign Direct Investment (FDI)." Department of
Industrial Policy & Promotion. 2015. Accessed December 4, 2015. http://dipp.nic.in/Engl
ish/Publications/FDI_Statistics/2015/FDI_FactSheet_JulyAugustSe