Embed Size (px)
Citation preview
Support for Taxonomic Data in
Systematics
Nadia Anwar
A thesis submitted for the degree of Doctor of Philosophy to the
Division of Ecology and Evolutionary Biology
Faculty of Biomedical and Life Sciences
University of Glasgow
November 2008
Abstract
The Systematics community works to increase our understanding of biological di-
versity through identifying and classifying organisms and using phylogenies to un-
derstand the relationships between those organisms. It has made great progress in
the building of phylogenies and in the development of algorithms. However, it has
insufficient provision for the preservation of research outcomes and making those
widely accessible and queriable, and this is where database technologies can help.
This thesis makes a contribution in the area of database usability, by addressing the
query needs present in the community, as supported by the analysis of query logs. It
formulates clearly the user requirements in the area of phylogeny and classification
queries. It then reports on the use of warehousing techniques in the integration of
data from many sources, to satisfy those requirements. It shows how to perform
query expansion with synonyms and vernacular names, and how to implement hier-
archical query expansion effectively. A detailed analysis of the improvements offered
by those query expansion techniques is presented. This is supported by the expo-
sition of the database techniques underlying this development, and of the user and
programming interfaces (web services) which make this novel development available
to both end-users and programs.

This thesis is dedicated to my family.
Acknowledgements
This PhD was funded through a scholarship awarded by the University of Glasgow
and supervised by R.D.M. Page and Ela Hunt.
Contents
1 Introduction 1
1.1 Background . . . . . . . . . . . . . . . . . . . . . . . . . . . . . . . . . . . . . . . 1
1.2 Taxonomy . . . . . . . . . . . . . . . . . . . . . . . . . . . . . . . . . . . . . . . . 2
1.3 Systematics . . . . . . . . . . . . . . . . . . . . . . . . . . . . . . . . . . . . . . . 4
1.4 TreeBASE . . . . . . . . . . . . . . . . . . . . . . . . . . . . . . . . . . . . . . . . 5
1.5 Motivation . . . . . . . . . . . . . . . . . . . . . . . . . . . . . . . . . . . . . . . 6
1.6 Thesis Structure . . . . . . . . . . . . . . . . . . . . . . . . . . . . . . . . . . . . 7
2 Background 9
2.1 Taxonomy . . . . . . . . . . . . . . . . . . . . . . . . . . . . . . . . . . . . . . . . 9
2.1.1 Naming . . . . . . . . . . . . . . . . . . . . . . . . . . . . . . . . . . . . . 10
2.1.2 Scientific names . . . . . . . . . . . . . . . . . . . . . . . . . . . . . . . . . 10
2.1.3 Synonyms and Homonyms . . . . . . . . . . . . . . . . . . . . . . . . . . . 13
2.1.4 Classification . . . . . . . . . . . . . . . . . . . . . . . . . . . . . . . . . . 14
2.1.5 PhyloCode . . . . . . . . . . . . . . . . . . . . . . . . . . . . . . . . . . . 15
2.2 Delivery of Taxonomic Knowledge . . . . . . . . . . . . . . . . . . . . . . . . . . 16
2.3 Taxonomic Databases on the Web . . . . . . . . . . . . . . . . . . . . . . . . . . 17
2.3.1 ITIS . . . . . . . . . . . . . . . . . . . . . . . . . . . . . . . . . . . . . . . 17
2.3.2 NCBI . . . . . . . . . . . . . . . . . . . . . . . . . . . . . . . . . . . . . . 17
2.3.3 GRIN . . . . . . . . . . . . . . . . . . . . . . . . . . . . . . . . . . . . . . 18
2.3.4 Sp2000 . . . . . . . . . . . . . . . . . . . . . . . . . . . . . . . . . . . . . 18
2.3.5 Online Checklists . . . . . . . . . . . . . . . . . . . . . . . . . . . . . . . . 18
2.3.6 Other sources used to develop the TCl-Db data model . . . . . . . . . . . 19
2.3.6.1 Taxonomer . . . . . . . . . . . . . . . . . . . . . . . . . . . . . . 19
iv
CONTENTS
2.3.6.2 IPNI . . . . . . . . . . . . . . . . . . . . . . . . . . . . . . . . . 19
2.3.6.3 uBio . . . . . . . . . . . . . . . . . . . . . . . . . . . . . . . . . . 20
2.3.7 Coordination across resources . . . . . . . . . . . . . . . . . . . . . . . . . 21
2.3.7.1 TDWG . . . . . . . . . . . . . . . . . . . . . . . . . . . . . . . . 21
2.3.7.2 GBIF . . . . . . . . . . . . . . . . . . . . . . . . . . . . . . . . . 23
2.4 Taxonomy and systematics . . . . . . . . . . . . . . . . . . . . . . . . . . . . . . 24
2.4.1 TreeBASE . . . . . . . . . . . . . . . . . . . . . . . . . . . . . . . . . . . . 24
2.4.2 TreeBASE Database versus Information Retrieval . . . . . . . . . . . . . 25
2.4.3 Requirements of a “Taxonomically Aware” Database . . . . . . . . . . . . 26
2.4.3.1 Support for Hierarchical Query Expansion . . . . . . . . . . . . 26
2.4.3.2 Query Expansion with Synonyms and Vernaculars . . . . . . . . 27
2.4.3.3 Consistency . . . . . . . . . . . . . . . . . . . . . . . . . . . . . . 27
2.4.3.4 Data Coverage . . . . . . . . . . . . . . . . . . . . . . . . . . . . 28
2.5 Integration approaches and database technologies . . . . . . . . . . . . . . . . . . 30
2.5.1 Database technologies . . . . . . . . . . . . . . . . . . . . . . . . . . . . . 30
2.5.2 Data Integration . . . . . . . . . . . . . . . . . . . . . . . . . . . . . . . . 34
2.5.3 Steps to Integration in Data Warehouses . . . . . . . . . . . . . . . . . . . 40
2.5.3.1 Schema Matching . . . . . . . . . . . . . . . . . . . . . . . . . . 42
2.5.3.2 Data Transformation . . . . . . . . . . . . . . . . . . . . . . . . 42
2.5.4 Data Warehouses - Update and Maintenance . . . . . . . . . . . . . . . . 44
2.5.5 Warehousing Taxonomic Data . . . . . . . . . . . . . . . . . . . . . . . . . 45
2.6 Summary . . . . . . . . . . . . . . . . . . . . . . . . . . . . . . . . . . . . . . . . 46
3 Database Design and Implementation 48
3.1 Introduction . . . . . . . . . . . . . . . . . . . . . . . . . . . . . . . . . . . . . . . 48
3.2 Requirements . . . . . . . . . . . . . . . . . . . . . . . . . . . . . . . . . . . . . . 49
3.2.1 Data Retrieval . . . . . . . . . . . . . . . . . . . . . . . . . . . . . . . . . 49
3.3 Data Warehouse . . . . . . . . . . . . . . . . . . . . . . . . . . . . . . . . . . . . 53
3.4 Modelling hierarchical data . . . . . . . . . . . . . . . . . . . . . . . . . . . . . . 54
3.4.1 Materialized Paths . . . . . . . . . . . . . . . . . . . . . . . . . . . . . . . 55
3.4.2 Nested Sets . . . . . . . . . . . . . . . . . . . . . . . . . . . . . . . . . . . 55
3.4.3 Performance Benchmarking . . . . . . . . . . . . . . . . . . . . . . . . . . 57
3.5 TCl-Db Structure . . . . . . . . . . . . . . . . . . . . . . . . . . . . . . . . . . . . 59
v
CONTENTS
3.5.1 Modelling rank and kingdom . . . . . . . . . . . . . . . . . . . . . . . . . 62
3.5.2 Modelling synonyms and vernaculars . . . . . . . . . . . . . . . . . . . . . 63
3.5.3 Trees and Nodes . . . . . . . . . . . . . . . . . . . . . . . . . . . . . . . . 63
3.6 Application Tables and Query performance . . . . . . . . . . . . . . . . . . . . . 65
3.7 Procedures and Views . . . . . . . . . . . . . . . . . . . . . . . . . . . . . . . . . 67
3.8 Summary . . . . . . . . . . . . . . . . . . . . . . . . . . . . . . . . . . . . . . . . 68
4 Populating the Database 69
4.1 Introduction . . . . . . . . . . . . . . . . . . . . . . . . . . . . . . . . . . . . . . . 69
4.2 ITIS . . . . . . . . . . . . . . . . . . . . . . . . . . . . . . . . . . . . . . . . . . . 71
4.2.1 Schema mapping and Integration . . . . . . . . . . . . . . . . . . . . . . . 71
4.3 NCBI . . . . . . . . . . . . . . . . . . . . . . . . . . . . . . . . . . . . . . . . . . 79
4.3.1 Schema mapping and Integration . . . . . . . . . . . . . . . . . . . . . . . 79
4.4 GRIN . . . . . . . . . . . . . . . . . . . . . . . . . . . . . . . . . . . . . . . . . . 85
4.4.1 Schema mapping and Integration . . . . . . . . . . . . . . . . . . . . . . . 85
4.5 Sp2000 . . . . . . . . . . . . . . . . . . . . . . . . . . . . . . . . . . . . . . . . . . 90
4.5.1 Schema mapping and Integration . . . . . . . . . . . . . . . . . . . . . . . 90
4.6 MSOW . . . . . . . . . . . . . . . . . . . . . . . . . . . . . . . . . . . . . . . . . 92
4.6.1 Aves, early bird data . . . . . . . . . . . . . . . . . . . . . . . . . . . . . . 93
4.7 Adding New Data Sources . . . . . . . . . . . . . . . . . . . . . . . . . . . . . . . 95
4.7.1 Data Availability . . . . . . . . . . . . . . . . . . . . . . . . . . . . . . . . 96
4.8 Summary and Preview . . . . . . . . . . . . . . . . . . . . . . . . . . . . . . . . . 96
5 Database Utility and Web Tools 97
5.1 Overview . . . . . . . . . . . . . . . . . . . . . . . . . . . . . . . . . . . . . . . . 97
5.2 Supported Queries . . . . . . . . . . . . . . . . . . . . . . . . . . . . . . . . . . . 97
5.2.1 Hierarchical queries . . . . . . . . . . . . . . . . . . . . . . . . . . . . . . 98
5.3 Data analysis Queries . . . . . . . . . . . . . . . . . . . . . . . . . . . . . . . . . 99
5.3.1 Comparing classifications. . . . . . . . . . . . . . . . . . . . . . . . . . . . 104
5.4 TCl-Db Web Tools . . . . . . . . . . . . . . . . . . . . . . . . . . . . . . . . . . . 107
5.4.1 TCl-Db Search Tool . . . . . . . . . . . . . . . . . . . . . . . . . . . . . . 107
5.4.2 Visualisation Tools: Linked Names and Classifications with Webdot . . . 111
5.4.3 Supporting vernacular search terms . . . . . . . . . . . . . . . . . . . . . 113
5.4.4 A TreeBASE Wrapper . . . . . . . . . . . . . . . . . . . . . . . . . . . . . 118
vi
CONTENTS
5.4.5 SOAP Tools . . . . . . . . . . . . . . . . . . . . . . . . . . . . . . . . . . . 122
5.5 Summary . . . . . . . . . . . . . . . . . . . . . . . . . . . . . . . . . . . . . . . . 130
6 TCl-Db Reconciling data sources 131
6.1 Summary . . . . . . . . . . . . . . . . . . . . . . . . . . . . . . . . . . . . . . . . 131
6.2 Background . . . . . . . . . . . . . . . . . . . . . . . . . . . . . . . . . . . . . . . 131
6.3 Aves Checklist - Data Transformation . . . . . . . . . . . . . . . . . . . . . . . . 133
6.4 Results . . . . . . . . . . . . . . . . . . . . . . . . . . . . . . . . . . . . . . . . . . 133
6.4.1 Classification Differences . . . . . . . . . . . . . . . . . . . . . . . . . . . . 137
6.4.2 Spelling . . . . . . . . . . . . . . . . . . . . . . . . . . . . . . . . . . . . . 140
6.5 Data Cleaning and Presentation . . . . . . . . . . . . . . . . . . . . . . . . . . . 146
6.6 Conclusions . . . . . . . . . . . . . . . . . . . . . . . . . . . . . . . . . . . . . . . 148
7 Using TCl-Db to Improve the Querying of TreeBASE 149
7.1 Summary . . . . . . . . . . . . . . . . . . . . . . . . . . . . . . . . . . . . . . . . 149
7.2 Introduction . . . . . . . . . . . . . . . . . . . . . . . . . . . . . . . . . . . . . . . 149
7.3 Background . . . . . . . . . . . . . . . . . . . . . . . . . . . . . . . . . . . . . . . 150
7.4 Taxonomic Infrastructure requirements . . . . . . . . . . . . . . . . . . . . . . . . 151
7.5 TreeBASE Taxon Search Log . . . . . . . . . . . . . . . . . . . . . . . . . . . . . 151
7.5.1 Data Retrieval in TreeBASE Vs TCl-Db . . . . . . . . . . . . . . . . . . . 153
7.5.1.1 TCl-Db linked names improve data retrieval. . . . . . . . . . . . 154
7.5.1.2 TCl-Db hierarchical queries show superior data retrieval. . . . . 156
7.6 AOL Search queries . . . . . . . . . . . . . . . . . . . . . . . . . . . . . . . . . . 158
7.7 Discussion . . . . . . . . . . . . . . . . . . . . . . . . . . . . . . . . . . . . . . . . 162
7.8 Conclusions . . . . . . . . . . . . . . . . . . . . . . . . . . . . . . . . . . . . . . . 164
8 Discussion and Conclusion 165
8.1 Overview . . . . . . . . . . . . . . . . . . . . . . . . . . . . . . . . . . . . . . . . 165
8.2 Contribution . . . . . . . . . . . . . . . . . . . . . . . . . . . . . . . . . . . . . . 166
8.3 Discussion . . . . . . . . . . . . . . . . . . . . . . . . . . . . . . . . . . . . . . . . 167
8.3.1 Related Work . . . . . . . . . . . . . . . . . . . . . . . . . . . . . . . . . . 167
8.3.2 Semantic Data Integration . . . . . . . . . . . . . . . . . . . . . . . . . . . 168
8.3.3 RSS Feeds and Data Update . . . . . . . . . . . . . . . . . . . . . . . . . 171
8.3.4 The Data Model . . . . . . . . . . . . . . . . . . . . . . . . . . . . . . . . 172
vii

CONTENTS
8.3.5 The User Interface . . . . . . . . . . . . . . . . . . . . . . . . . . . . . . . 173
8.4 Further Work . . . . . . . . . . . . . . . . . . . . . . . . . . . . . . . . . . . . . . 173
8.5 Other Possible Work Directions . . . . . . . . . . . . . . . . . . . . . . . . . . . . 174
8.6 Conclusion . . . . . . . . . . . . . . . . . . . . . . . . . . . . . . . . . . . . . . . 175
A SQL Queries - A 176
A.1 Database Utility Queries . . . . . . . . . . . . . . . . . . . . . . . . . . . . . . . . 176
B SQL Queries - B 181
B.1 Taxonomic Data extraction, reconciliation and validation - SQL Queries . . . . . 181
C SQL Queries - C 183
C.1 Taxonomic requirements of TreeBASE . . . . . . . . . . . . . . . . . . . . . . . . 183
D TCl-Db in RDF 186
References 211
viii
List of Figures
2.1 Classification of turtle doves Streptopelia turtur. . . . . . . . . . . . . . . . . . . . 11
2.2 Screenshot from IPNI search on Oryza Sativa. . . . . . . . . . . . . . . . . . . . . 20
2.3 Classifications of Lice . . . . . . . . . . . . . . . . . . . . . . . . . . . . . . . . . 29
2.4 Hierarchical Model and Network Model . . . . . . . . . . . . . . . . . . . . . . . 32
2.5 GOOD , Graph database model . . . . . . . . . . . . . . . . . . . . . . . . . . . . 35
2.6 GDM , Graph database model . . . . . . . . . . . . . . . . . . . . . . . . . . . . 36
2.7 Degree of Federation and Instantiation in integration methodologies. . . . . . . 38
2.8 Overview of Loose Federation Procedure. . . . . . . . . . . . . . . . . . . . . . . 39
2.9 Overview of Materialised federation: Data Warehouse. . . . . . . . . . . . . . . . 41
2.10 Schema Matching for transformation into the Global Schema. . . . . . . . . . . . 43
2.11 Schema Mapping . . . . . . . . . . . . . . . . . . . . . . . . . . . . . . . . . . . . 43
3.1 NCBI Classification of the family Crocodylidae. . . . . . . . . . . . . . . . . . . . 50
3.2 Representation of NCBI and ITIS Aves Trees. . . . . . . . . . . . . . . . . . . . . 51
3.3 Linked Names . . . . . . . . . . . . . . . . . . . . . . . . . . . . . . . . . . . . . . 53
3.4 Hierarchical model . . . . . . . . . . . . . . . . . . . . . . . . . . . . . . . . . . . 55
3.5 Summativity representation of a hierarchy . . . . . . . . . . . . . . . . . . . . . . 56
3.6 The TCl-Db Data Model. . . . . . . . . . . . . . . . . . . . . . . . . . . . . . . . 59
3.7 TCl-Db implementation schema . . . . . . . . . . . . . . . . . . . . . . . . . . . . 60
3.8 Association entity, Assertion . . . . . . . . . . . . . . . . . . . . . . . . . . . . . . 61
3.9 Modelling rank and kingdom . . . . . . . . . . . . . . . . . . . . . . . . . . . . . 62
3.10 SQL - Nested sets . . . . . . . . . . . . . . . . . . . . . . . . . . . . . . . . . . . 64
3.11 SQL - Nested sets . . . . . . . . . . . . . . . . . . . . . . . . . . . . . . . . . . . 64
3.12 SQL - Materialised Path . . . . . . . . . . . . . . . . . . . . . . . . . . . . . . . 65
ix
LIST OF FIGURES
3.13 SQL - connect by . . . . . . . . . . . . . . . . . . . . . . . . . . . . . . . . . . 65
3.14 SQL - Application Tables, name search) . . . . . . . . . . . . . . . . . . . . . 66
3.15 SQL - Functions, name search) . . . . . . . . . . . . . . . . . . . . . . . . . . 67
4.1 TCl-Db database architecture . . . . . . . . . . . . . . . . . . . . . . . . . . . . . 70
4.2 Materialized View for ITIS Names . . . . . . . . . . . . . . . . . . . . . . . . . . 72
4.3 Procedure add itis names . . . . . . . . . . . . . . . . . . . . . . . . . . . . . . 74
4.4 Procedure add itis nodes . . . . . . . . . . . . . . . . . . . . . . . . . . . . . . 75
4.5 Algorithm used to build the tree data . . . . . . . . . . . . . . . . . . . . . . . . 76
4.6 Procedure add itis vernaculars . . . . . . . . . . . . . . . . . . . . . . . . . . 77
4.7 Procedure add itis synonyms. . . . . . . . . . . . . . . . . . . . . . . . . . . . 78
4.8 Schema mapping NCBI to TCl-Db. . . . . . . . . . . . . . . . . . . . . . . . . . . 80
4.9 The NCBI tables used in schema mapping. . . . . . . . . . . . . . . . . . . . . . 81
4.10 Procedure add ncbi names . . . . . . . . . . . . . . . . . . . . . . . . . . . . . . 82
4.11 Procedure add ncbi nodes . . . . . . . . . . . . . . . . . . . . . . . . . . . . . . 83
4.12 Procedure add ncbi synonyms . . . . . . . . . . . . . . . . . . . . . . . . . . . 84
4.13 Overview of the GRIN data migration. . . . . . . . . . . . . . . . . . . . . . . . . 86
4.14 Procedure add grin names. . . . . . . . . . . . . . . . . . . . . . . . . . . . . . 87
4.15 Procedure add grin nodes. . . . . . . . . . . . . . . . . . . . . . . . . . . . . . 88
4.16 Procedure add grin synonyms. . . . . . . . . . . . . . . . . . . . . . . . . . . . 89
4.17 Overview of the Sp2000 data migration. . . . . . . . . . . . . . . . . . . . . . . . 91
4.18 Overview of the Mammal Species of the World data migration. . . . . . . . . . . 92
5.1 ITIS and NCBI Comparisons . . . . . . . . . . . . . . . . . . . . . . . . . . . . . 100
5.2 Query results for the search term Morus. . . . . . . . . . . . . . . . . . . . . . . . 102
5.3 Crocodylidae Query, ITIS data from NCBI Tree . . . . . . . . . . . . . . . . . . . 106
5.4 Interface: Basic Search page . . . . . . . . . . . . . . . . . . . . . . . . . . . . . . 109
5.5 Interface: Detailed View Page . . . . . . . . . . . . . . . . . . . . . . . . . . . . . 110
5.6 Browse Hierarchy Interface . . . . . . . . . . . . . . . . . . . . . . . . . . . . . . 111
5.7 Classification displayed in Webdot Interface . . . . . . . . . . . . . . . . . . . . . 113
5.8 Vernacular Query form at http://spira.zoology.gla.ac.uk/app . . . . . . . . . . . 115
5.9 Screen shot of Vernacular Query Results . . . . . . . . . . . . . . . . . . . . . . . 116
5.10 Screen shot of Vernacular Query Results - Data page . . . . . . . . . . . . . . . . 117
5.11 TreeBase Wrapper Screen shot - Search Page . . . . . . . . . . . . . . . . . . . . 119
x
LIST OF FIGURES
5.12 TreeBase Wrapper Screen shot - Browse Page . . . . . . . . . . . . . . . . . . . . 120
5.13 TreeBase Wrapper Materialized Views . . . . . . . . . . . . . . . . . . . . . . . . 121
5.14 TCl-Db WSDL . . . . . . . . . . . . . . . . . . . . . . . . . . . . . . . . . . . . . 123
5.15 WebDot diagram for linked Names . . . . . . . . . . . . . . . . . . . . . . . . . . 125
5.16 WebDot diagram for Children Names . . . . . . . . . . . . . . . . . . . . . . . . . 125
6.1 Multiple Classifications of Casuariidae. . . . . . . . . . . . . . . . . . . . . . . . . 141
6.2 Interface screen shot for NCBI Unique names . . . . . . . . . . . . . . . . . . . . 147
7.1 TreeBASE taxon content and the TreeBASE taxon query log. . . . . . . . . . . 154
7.2 TreeBASE query log and the AOL query log. . . . . . . . . . . . . . . . . . . . . 160
D.1 TCl-Db RDF model . . . . . . . . . . . . . . . . . . . . . . . . . . . . . . . . . . 188
D.2 TreeBASE RDF model . . . . . . . . . . . . . . . . . . . . . . . . . . . . . . . . . 191
D.3 RDF schematic for TCl-Db and TreeBASE. . . . . . . . . . . . . . . . . . . . . . 192
D.4 TCl-Db and TreeBASE graphs . . . . . . . . . . . . . . . . . . . . . . . . . . . . 193
xi
Chapter 1
Introduction
This thesis makes a contribution in the area of database methods for systematics and taxonomy.
It consists of 8 chapters.
The focus of this thesis is on the development of database-supported query expansion mech-
anisms which improve the effectiveness of queries posed on the TreeBase database by the sys-
tematics community. To this aim, this Chapter leads the reader into a high level view of the
requirements underlying this work, and explains why this research was needed and timely. First,
a high level overview of systematics and taxonomy is given. This is followed by background
information on TreeBase and other data sources which are relevant in this context. Then it
explains what queries cannot be answered by TreeBase and why this is the case. Finally, the
thesis structure is presented in detail.
1.1 Background
Systematics aims to increase our understanding of biological diversity through identifying and
classifying organisms and using phylogenies to understand the relationships between organisms.
The field has developed very elaborate and sophisticated tools for phylogeny construction, and
practitioners have been very active in building new, better and faster algorithms (DeSalle et al.,
2002; Scotland & Pennington, 2000). However, this has not been matched with database de-
velopment for long term access and storage of the phylogenies produced from these algorithms.
Much of the data used in phylogenetic analysis is acquired from databases in other fields, partic-
ularly specimen data from museum collections (Zusi et al., 1982) and sequence data (Scotland
1
1.2 Taxonomy
& Pennington, 2000) from databases available at NCBI (Wheeler et al., 2007). The results of
phylogenetic analysis, namely evolutionary trees, on the other hand are not so easily accessible.
Mostly, phylogenetic trees are retrieved through literature searches. The trees are buried in the
pages and supplementary material sections of the journals in which they are published. The
inaccessibility compounds the practicality of use. Projects such as the tree of life (Cracraft
& Donoghue, 2004) aim to build a complete phylogenetic analysis of the world’s biodiversity
ultimately describing the history of life on earth. The informatics requirements are vast and
challenging, particularly as the data collections grow in size and complexity. Confronting the
information explosion requires creative new approaches to facilitating use of that information.
Finding information in such data sets becomes increasingly difficult the larger the data set and,
as such, data search and discovery needs to be intuitive and precise. Data retrieval through
meaningful queries is paramount to the successfully delivery of the ever more sophisticated
requirements of the systematics community especially now that these large scale projects are
being realised.
A phylogenetic data repository (Nakhleh et al., 2003) should have a good understanding of
the organisms that are represented in the phylogenetic trees and support searches using species
and higher taxa names. However, currently this is not the case. TreeBASE (Morell, 1996) is the
only repository for phylogenetic analyses. TreeBASE does not adequately support taxonomic
data retrieval.
Taxonomic data retrieval is supported in the Genbank sequence database. Genbank contains
the NCBI taxonomy and queries can be performed to retrieve data using taxon names. In
contrast to NCBI, TreeBASE does not contain a taxonomy and queries selecting all Drosophila
studies or phylogenetic trees for insects are not as easily specified. The inclusion of a taxonomic
infrastructure within TreeBASE is essential in order to support these sorts of queries. This
thesis aims to address the limitations of TreeBASE by providing an infrastructure to support
taxonomic queries.
1.2 Taxonomy
Taxonomic data are produced by the processes of Naming, which involves attaching a label
to a concept for the purposes of communication, and Classification, that is arranging similar
concepts together for the purpose of organisation. The name provides a handle on the biological
organism and the position in the classification provides knowledge of the organism in terms of
2
1.2 Taxonomy
its similarity to others (Jeffrey, 1989). This section gives a brief overview of the difficulties
users experience when utilising taxonomic data.
The taxonomic classification system is an information storage and retrieval system (Mayr,
1998), originally designed to be easily memorised (Cain, 1958). Taxon names serve two roles;
the name represents an organism that was described and named by a taxonomist and the
name is also placed in a hierarchy to relate the organism to the tree of life. This duality
presents difficulties in the use of taxonomic names. The interdependence between the name
and the classification, the fact that names are not necessarily unique to one organism and
also that the placement of an organism’s name into the hierarchy is not fixed, all complicate
the use of taxonomic names for information storage and retrieval. Compounding this is the
distributed nature of the data. The Global Biodiversity Information Facility lists over 200 data
sources (http://data.gbif.org/datasets/). This number will continue to grow as herbariums and
museums digitise their collections (Soberon & Peterson, 2004) and make their data accessible
on the web. Although taxonomy has firmly taken its place as a digital science, data accessibility
continues to cause difficulty; with the distribution there is also the heterogeneity of the data and
the lack of one all encompassing taxonomic reference. Given that the amount of data is growing
and is in constant flux, it is unlikely that it will be possible to agree on a “unitary taxonomy”
(Scoble, 2004). However, a single all encompassing data source is achievable, and this challenge
is being addressed by GBIF (Saarenmaa, 1999) and projects such as the Encyclopaedia of Life
(Wilson, 2003).
Most taxonomic data systems were developed to meet particular requirements in their use
or data scope. In contrast to the bioinformatics sequence databases, taxonomy data is by its
nature distributed. The data produced from taxonomic research tends to follow a particular
focus, a group such as insects or birds, or a geographical location, and or a period in history.
There is significant heterogeneity in data models and storage format of the data and the in-
terfaces provided to access the data. The taxonomic community have recently established the
Taxonomic Databases Working Group (TDWG) to address data standards, data integration
and interoperability. This effort is beginning to alleviate some of the accessibility and interop-
erability problems experienced by users (International Union of Biological Sciences, 2006).
Taxonomic data are also not easily deployed outside the systems in which they are stored.
This is due to the nature of taxonomic names. As stated by Thiele & Yeates (2002), taxa are not
facts like the data in most other databases, instead, taxa are hypotheses which are “proposed,
used, modified, and then perhaps discarded, as evidence dictates”. The classification of an
3
1.3 Systematics
organism is based on a set of criteria selected by the expert taxonomist. Different criteria
are used by different taxonomists, for example different morphological characteristics can be
given different weight and trees based on molecular data can be very different to trees based on
morphological data (Hedges & Sibley, 1994). Additional complications arise from the addition
of new data as new organisms are discovered, and taxonomic revisions that are made to update
existing groups. There can be, at any one time, more than one accepted taxonomic opinion on
the name and classification of an organism. This complicates the use of taxon names as search
terms. When a search is performed on the term Aves, we need to know whether the user requires
the NCBI meaning of the term or the ITIS meaning of the term. Also, in situations where a name
has changed for taxonomic reasons, such as Diomedea albatrus which was changed to Phoebastria
albatrus (Coues, 1866), additional support is needed to recognise that these two terms are linked
through synonymy. When the user performs a search on Phoebastria albatrus, should any data
associated with Diomedea albatrus also be returned? Similarly, when a user performs a search
on a vernacular term “short-tailed albatross”, is it assumed that the system should translate
this term to the appropriate Latin names, i.e. Phoebastria albatrus and Diomedea albatrus?
It is not surprising that at the time of development the TreeBASE developers shelved these
taxonomic issues. It is now timely and important to address the taxonomic requirements of
TreeBASE, given that the system is in the process of being overhauled by the CIPRES project
(CIPRES, 2006).
1.3 Systematics
Like taxonomists, most systematists focus their research on a particular group. For these scien-
tists the taxonomic requirements are fairly manageable, and usually involve the most up-to-date
checklists. Most scientists are adept at keeping up-to-date with the literature in the area and for
the most part they produce their own data. Some systematics studies, however, go beyond the
usual boundaries of collecting data and building trees. Two examples are cospeciation analysis
(Page, 2002) and the study of species richness (Gaston, 2000).
A cospeciation study usually follows two taxonomic schemes: one for the host species,
and one for the parasites. Parasites are of particular interest in systematics because of the
shared history of the host and the parasite (Page, 2002). The analysis involves comparing the
phylogenies of the parasite and the host. These phylogenies either need to be collected from
the literature or built from morphological or sequence data. For the data that are collected,
4
1.4 TreeBASE
literature searches are normally conducted using the species or higher taxa names as the search
terms. Similarly, a study of the parasite species richness of a group of organisms also uses two
taxonomic schemes and involves collecting data using taxon names as search terms (Nunn et al.,
2003). This type of analysis shows that more studies now require gathering not just previously
published data in order to stay up-to-date, but also for further analysis. Another example,
where collecting data is integral to the study, is in building super trees (Bininda-Emonds,
2004).
Within super tree analyses, data from several studies are gathered using taxon names as
search terms. Once these data are collected, the taxonomic names across these data need to
be synonymised. Usually, this is done through one authoritative source, for example, Beck
et al. (2006) used Mammal Species of the World (Wilson & Reeder, 1993); and Thomas et al.
(2004) used the taxonomy of Monroe & Sibley (1997). Where one such data source exists, this
is a simple task, however, the time is approaching when super trees go beyond the use of one
taxonomic source (Cracraft & Donoghue, 2004).
The main use of taxonomic data outside its immediate user community is in information
retrieval as the examples above show. Names are used as the keys to retrieve data (Garrity
& Lyons, 2003; Knapp, 2000; Petsko, 2002). Currently, no one taxonomic data provider sup-
ports the needs of the systematics community. This following section describes the taxonomic
requirements of TreeBASE, and provides details of the motivation for this PhD research.
1.4 TreeBASE
TreeBASE (Morell, 1996) is a phylogenetic and evolutionary information store, containing phy-
logenies for more than 56,000 taxa. Submission to TreeBASE is mainly voluntary but some
journals require or recommend that authors submit data to TreeBASE. TreeBASE is unique in
that it stores all the data that are required to reproduce the analysis, including aligned data
sets, the weighting schemes and step matrices as well as information on the algorithm used
in each phylogenetic study. The phylogenetic study is central to the TreeBASE data model,
as it represents the original publication details of the study, including the abstract. Despite
the intrinsic taxonomic content, the developers of TreeBASE purposely excluded taxonomy
(Morell, 1996). Except for the taxon names used within the trees and matrices there is no spe-
cific taxonomic scheme used. The names are not checked against or linked into any taxonomic
schemes or classification. Since the inclusion of a single taxonomic scheme would not have been
5
1.5 Motivation
sufficient, and that no systems like uBio or Sp2000 existed at the time of development, it is
easy to understand why the developers made this decision. The consequences however, are that
the system can not support taxonomic queries.
1.5 Motivation
The TreeBASE interface (www.treebase.org) supports six query types: author, citation, study
accession number, matrix accession number, taxon and structure. The taxon search, however,
does not perform adequately. This search option does not effectively support higher taxa queries
or synonym and vernacular queries. From a biologist’s perspective, the taxon search option does
not return the expected results. The query term “Aves” currently returns 5 studies (S281, S880,
S296, S1166, S433). On closer inspection, there are many more studies containing Aves (birds)
within TreeBASE, for example the search term Gallus returns a further 2 studies (S1522, S606)
and Diomedea returns 1 more study (S351). Similarly, the search term Puffinus returns no
studies, however, using the search terms Puffinus tenuirostris or Puffinus gravis, the study
S714 in which they are located is returned. The species Puffinus gravis is also contained in
the study S351, however, a search using the taxon name is not successful because the species
text is “Puffinus gravis U74354”. These examples show that higher taxa terms, such as Aves
and Puffinus, are not being expanded to include the scientific names contained within them.
Queries performed on TreeBASE return only data where the search term matches exactly a
term contained in the study. As such, the term “birds”, which is the vernacular associated with
Aves, returns no data because it is not contained in any study. The synonym for Phoebastria
albatrus, Diomedea albatrus, does not return the study S714 in which the currently accepted
valid name exists. The taxonomic content and structure of TreeBASE does not support these
queries, as query terms are not expanded to include associated terms and as a result incomplete
results are returned. The current data retrieval options within TreeBASE pose a problem for
the research community who commonly use taxonomic names as search terms. The research
hypothesis studied in this thesis is that data retrieval through TreeBASE can be improved by
the inclusion of a taxonomic infrastructure.
The taxonomic queries that TreeBASE should support are: 1) search terms should expand
to include subordinate terms in the classification if they are higher taxa, 2) vernacular queries
should be supported and expand appropriately to include the data linked to the scientific names,
and 3) any given query should also expand to include data associated with synonyms and out
6
1.6 Thesis Structure
of date usage of a taxon name. These queries are currently not supported by TreeBASE. The
developers of TreeBASE purposely excluded taxonomy (Morell, 1996) because there were too
many difficulties for a small development team to overcome. The inclusion of a taxonomic
infrastructure still poses several challenges. The distributed nature of taxon names and the
many data sources in which these are held is a significant problem, as few sources cover the
breadth of taxonomic coverage required by TreeBASE. Also, each taxonomic data source uses
a particular classification scheme supporting specific taxonomic opinions. Not only do data
sources differ in the content they deliver but, even those with similar content may follow different
taxonomic opinions and therefore deliver very different classification schemes.
These challenges may be addressed by combining the content of multiple taxonomic data
sources and uniting the data into a form that will enable the taxon query types given above.
TCl-Db, Taxonomy and Classification Database was developed to increase the accessibility and
transparency of taxonomic data by integrating data from the available data sources. It was
designed to provide a taxonomic infrastructure to TreeBASE and the queries systematists wish
to perform.
1.6 Thesis Structure
This thesis is organised into eight chapters. The following chapter, Chapter 2, provides back-
ground on taxonomy. It explains what taxonomic data is, presents the databases that contain
taxonomic data and shows how these databases are used to store taxonomic data. Following
this we discuss the structure and query capacity of TreeBASE. We show, through some ex-
amples, its limited use when queried using taxon names. This leads on to the motivation for
this work and the proposed data integration solution. There is an outline of data integration
approaches and the general benefits offered through integrating taxonomic data.
Chapter 3 gives a full description of the design and implementation TCl-Db, the data ware-
house built as a taxonomic infrastructure for TreeBASE. This chapter gives a discussion of the
requirements of the database through an analysis of the currently available taxonomic databases
and their ability to support taxonomic queries through TreeBASE.
The data sources and their load procedures are outlined in Chapter 4. Each data source is
copied into a local silo, the schema are mapped, and the data transferred using materialized
views and PL/SQL procedures.
7
1.6 Thesis Structure
Chapter 5 provides an overview of the queries that are supported by TCl-Db and how these
can be invoked from a user interface. A web interface, a SOAP service and some of the tools
created to support the use of TCl-Db data warehouse are then described. The chapter also
describes a wrapper which accesses a local version of TreeBASE. The wrapper is written in
PHP and uses TCl-Db to translate taxon queries into specific search terms in TreeBASE. This
wrapper exemplifies the queries that TCl-Db was designed to support and the requirements of
a taxonomically intelligent TreeBASE.
Chapter 6 exemplifies how this type of data integration enables data sources to be compared
side by side. In this Chapter we describe how TCl-Db was used to compare taxonomic data
sources with regard to both data composition and distribution. These comparisons enabled us
to enhance the integration by creating links across taxon names that are related.
In Chapter 7 we demonstrate the data retrieval problems experienced by TreeBASE users
through an analysis of the query logs from the TreeBASE website. We are able to show that
data retrieval difficulties are in part due to the lack of taxonomic intelligence in TreeBASE,
and we demonstrate the improved data retrieval based on the use of TCl-Db and the software
infrastructure we have created.
Finally, Chapter 8 provides a discussion of the work presented and some thoughts and
preliminary results from an alternative integration solution, using semantic web technologies.
There is an outline of improvements that could be made to the data model and the user interface.
Finally, an outline of further work is proposed.
8
Chapter 2
Background
In the previous Chapter, an introduction and an overview of the background to this thesis were
provided. This Chapter explains the background in more detail. It discusses issues related
to the use of scientific names, synonyms and homonyms, and classifications. It then provides
details of the taxonomic databases and data sources used in this work. Then it expands on the
user requirements in taxonomy and systematics and provides a high level introduction to data
integration methods. This explains why the warehousing technique was selected for this work,
which leads into Chapter 3 which will describe in detail the database techniques which support
the user requirements.
2.1 Taxonomy
A taxonomy is a collection of terms, and a classification is the relationship among those terms.
In biology, taxonomic studies involve naming and classifying organisms into a hierarchical struc-
ture representing the relationships among organisms.
Taxonomic data is the result of the processes of Naming, that is, attaching a label to a
organism for the purposes of communication, and classification of organisms, which is arranging
similar concepts together for the purpose of defining the logic and order of the information.
The name provides a handle on the organism and the classification provides knowledge of the
organism in terms of its similarity to others. These two processes are briefly outlined, and this
is followed with a description of how these data are disseminated to the user community.
9
2.1 Taxonomy
2.1.1 Naming
When a new organism is discovered the first thing a biologist needs to do, in order to share the
discovery, is to identify the organism or name it, if it is new. Organisms are named so that they
can be easily referred to in communication, publications, conversation, etc. (Jeffrey, 1989).
Names are used instead of descriptive phrases since in most situations these are impractical for
effective communication. For example, a geographical location is more easily communicated
through a place name, a street name or number, a city name or country, or GPS co-ordinates
rather than directions from place X to place Y. On the other hand, GPS co-ordinates provide
more accuracy than a name, as do perhaps descriptive directions, but such levels of accuracy
would be cumbersome in a conversation. It is of utmost importance that a name be unambiguous
and understood by all who use it to have the same meaning. However, for taxonomic names this
does not hold true, as taxon names and their organisms do not have a one to one relationship. It
is fundamentally important to have clear-cut unambiguous taxon names, in order to effectively
use those names.
To maintain some order in the naming and classification of organisms, taxonomists work un-
der specific regulations, collectively called the Codes of Nomenclature. Names are managed by
three main bodies, each providing policies (codes) for managing taxonomic names. These are:
the International Code on Zoological Nomenclature (ICZN) (ICZN, International Commission
on Zoological Nomenclature and IUBS, International Union of Biological Sciences, 1999), the
International Code for Botanical Nomenclature (ICBN) (Greuter et al., 1994) and the Interna-
tional Code of Nomenclature of Bacteria (ICNB) (Lapage, 1992). The purpose of these codes
is to ensure both good working practice, through provisions that should to be followed when
giving names, and to create stability of names, by ensuring that a taxon has only one scientific
name by which it is properly known. In a constantly expanding knowledge base accumulated
through 250 years of effort, name changes are inescapable. Even with the use of the codes,
many organisms have more than one name associated with it. In order to understand why
names change through time and the difficulties that arise through these changes, it is necessary
to understand the practices of taxonomists and the structure of taxonomic data.
2.1.2 Scientific names
Every organism is given a name by which it is formally known, this is its scientific name.
Scientific names use Latin alphabet and grammar, as in most proper names the first letter is
10
2.1 Taxonomy
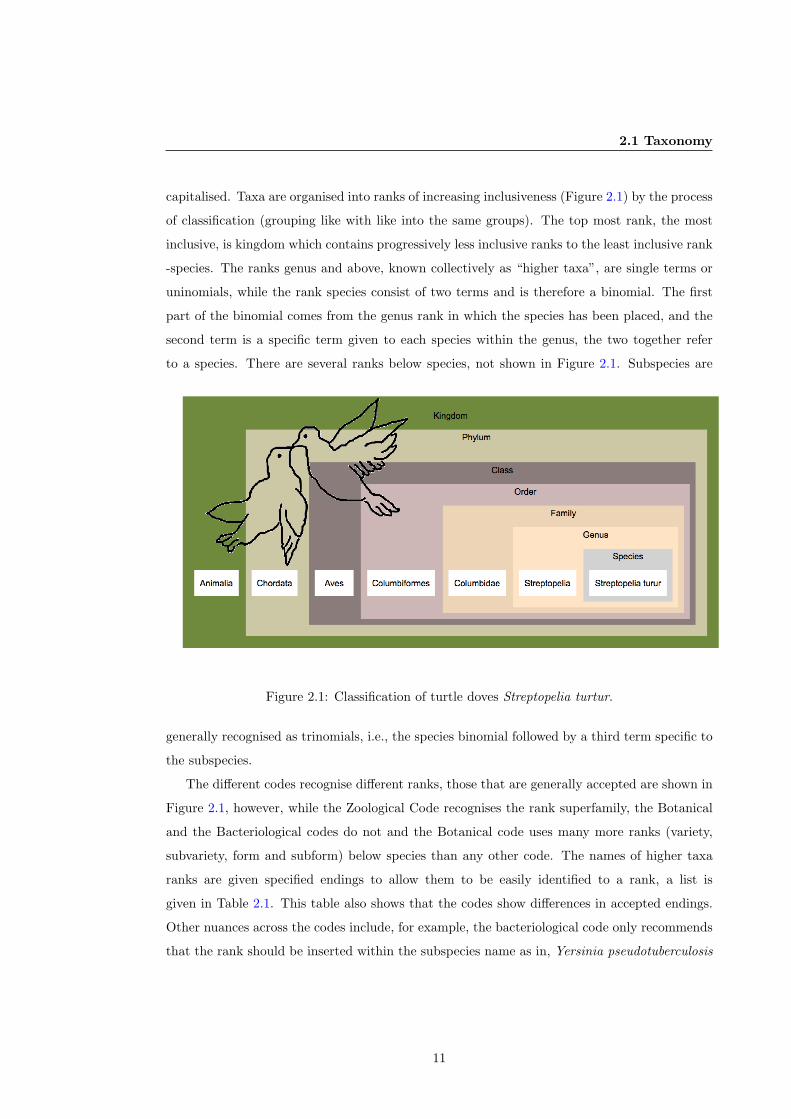
capitalised. Taxa are organised into ranks of increasing inclusiveness (Figure 2.1) by the process
of classification (grouping like with like into the same groups). The top most rank, the most
inclusive, is kingdom which contains progressively less inclusive ranks to the least inclusive rank
-species. The ranks genus and above, known collectively as “higher taxa”, are single terms or
uninomials, while the rank species consist of two terms and is therefore a binomial. The first
part of the binomial comes from the genus rank in which the species has been placed, and the
second term is a specific term given to each species within the genus, the two together refer
to a species. There are several ranks below species, not shown in Figure 2.1. Subspecies are
Figure 2.1: Classification of turtle doves Streptopelia turtur.
generally recognised as trinomials, i.e., the species binomial followed by a third term specific to
the subspecies.
The different codes recognise different ranks, those that are generally accepted are shown in
Figure 2.1, however, while the Zoological Code recognises the rank superfamily, the Botanical
and the Bacteriological codes do not and the Botanical code uses many more ranks (variety,
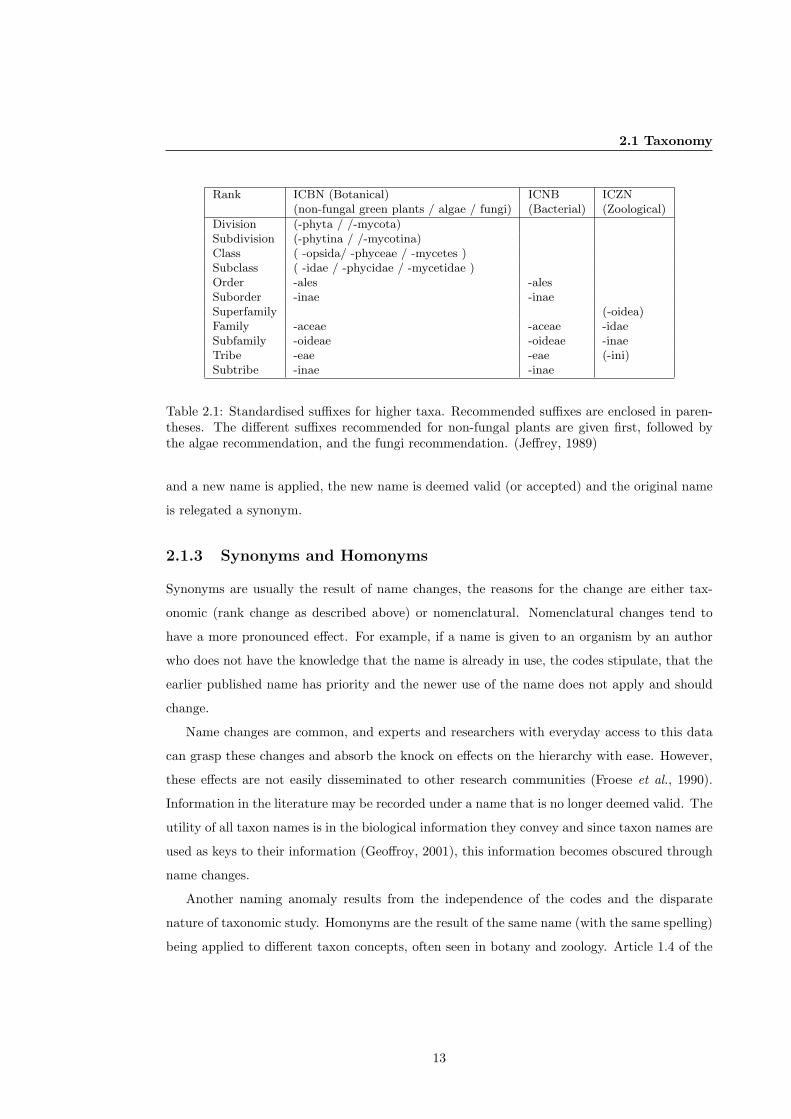
subvariety, form and subform) below species than any other code. The names of higher taxa
ranks are given specified endings to allow them to be easily identified to a rank, a list is
given in Table 2.1. This table also shows that the codes show differences in accepted endings.
Other nuances across the codes include, for example, the bacteriological code only recommends
that the rank should be inserted within the subspecies name as in, Yersinia pseudotuberculosis
11
2.1 Taxonomy
subsp. pestis whereas the botanical code insists that rank should be indicated in all ranks below
species. These differences are due to the independence of the codes, they operate autonomously
attending only the user community they serve.
As stated above, a taxon name is not a simple name and has two roles. A name relates
not only to a taxon but also indicates to users the rank or taxonomic position of that taxon
(by name endings if uninominal, lower rank if it is not). This duality (Thiele & Yeates, 2002)
of taxon names is incredibly powerful as the names give both meaning and context to users.
However, this duality has significant negative impacts on the data in terms of stability and
change. Taxon names should clearly identify a single taxonomic concept but the process of both
naming and classifying organisms in one term causes difficulty when changes and additions are
made. The process of naming the world’s biodiversity is far from complete (Dubois, 2003),
new organisms are discovered, their names added, new knowledge of their inter-relationships is
obtained and relating these to the existing structure has a considerable effect on the data. The
taxonomic hierarchy organises knowledge but, as is the case for all hierarchical structures, it is
not particularly good at dealing with change. In the simplest example, two organisms placed in
two separate genera may at a later date, based on new knowledge, be found to be more similar
than originally understood, resulting in the two genera being clumped together. Since species
names use both the genus and species epithet, this results in name changes for many of the
concepts originally named in the two genera. When such changes occur at higher taxa ranks,
the changes cascade down and affects all levels of the hierarchy below it. It is therefore difficult
to unambiguously use taxonomic names to identify taxa.
The criteria by which taxa are defined (classified) can change, for example when new or-
ganisms are discovered. The circumscription of taxonomic ranks is not strictly defined as there
are no definitive criteria that are used in the assignment of a taxon to a rank. It is up to the
taxonomists to make sure that the placement of the newly discovered organism exhibits only
those group defining features in which it is being placed. However, those group-defining fea-
tures may be called into question with new discoveries. Different expert taxonomists disagree
on what defines these groups and which criteria are important in circumscription of taxa. The
addition of new data may result in the addition of new ranks, a change in circumscription may
result in the combining of a rank or sometimes splitting of ranks. When there are classification
changes at least one taxon will undergo a change of name. In some cases the names do not
change but the circumscription of the group changes. When a change in classification is made
12
2.1 Taxonomy
Rank ICBN (Botanical) ICNB ICZN(non-fungal green plants / algae / fungi) (Bacterial) (Zoological)
Division (-phyta / /-mycota)Subdivision (-phytina / /-mycotina)Class ( -opsida/ -phyceae / -mycetes )Subclass ( -idae / -phycidae / -mycetidae )Order -ales -alesSuborder -inae -inaeSuperfamily (-oidea)Family -aceae -aceae -idaeSubfamily -oideae -oideae -inaeTribe -eae -eae (-ini)Subtribe -inae -inae
Table 2.1: Standardised suffixes for higher taxa. Recommended suffixes are enclosed in paren-theses. The different suffixes recommended for non-fungal plants are given first, followed bythe algae recommendation, and the fungi recommendation. (Jeffrey, 1989)
and a new name is applied, the new name is deemed valid (or accepted) and the original name
is relegated a synonym.
2.1.3 Synonyms and Homonyms
Synonyms are usually the result of name changes, the reasons for the change are either tax-
onomic (rank change as described above) or nomenclatural. Nomenclatural changes tend to
have a more pronounced effect. For example, if a name is given to an organism by an author
who does not have the knowledge that the name is already in use, the codes stipulate, that the
earlier published name has priority and the newer use of the name does not apply and should
change.
Name changes are common, and experts and researchers with everyday access to this data
can grasp these changes and absorb the knock on effects on the hierarchy with ease. However,
these effects are not easily disseminated to other research communities (Froese et al., 1990).
Information in the literature may be recorded under a name that is no longer deemed valid. The
utility of all taxon names is in the biological information they convey and since taxon names are
used as keys to their information (Geoffroy, 2001), this information becomes obscured through
name changes.
Another naming anomaly results from the independence of the codes and the disparate
nature of taxonomic study. Homonyms are the result of the same name (with the same spelling)
being applied to different taxon concepts, often seen in botany and zoology. Article 1.4 of the
13
2.1 Taxonomy
zoological code explicitly stipulates that:
Article 1.4 Independence
“(T)he name of an animal taxon is not to be rejected merely because it is identical
with the name of a taxon that is not an animal.”
Without clear context the use of a name that refers to two different organisms can result in
confusion. Again, while experts are well placed to deal with such anomalies, a non expert could
get confused when using one term and finding two sets of different data. For example, using
the term Morus to retrieve data will result in both Plant and Animal data returned, since this
genus is used in both the animal and plant kingdoms.
While stability of taxon names is a particular issue in the field, an issue that needs to be
addressed is the access to data associated with names that are in common use but no longer
regarded by the specialists as the proper name. The resulting gap in knowledge and the potential
loss of data can have significant side-effects across several fields of biology that use taxon names
as information retrieval keys in their studies (Mallet & Willmott, 2003).
2.1.4 Classification
Taxonomists build their classification on a set of criteria. These criteria should group similar
with similar, however, the choice of criteria used is subjective, and it is up to the taxonomist
which characteristics are used for classification. Therefore, different taxonomists can place em-
phasis on different criteria, that attempts to best reflect the similarities and differences between
the organisms. The result is multiple overlapping classifications and the same name having dif-
ferent meanings (circumscriptions) in different classifications. Similarly, when molecular data
are used for classification these do not always agree with classifications based on morphological
data (Hedges & Sibley, 1994). The classification assigns taxa to other taxa of higher ranks
(depicted in Figure 2.1), and, as stated, this is generally regarded as grouping similar organ-
isms together. Nowadays, this has shifted towards evolution (Ereshefsky, 2001; Franz, 2005), in
which the systematics community group organisms by ancestry. These two forms of grouping
and the resultant classifications are very different.
In biological taxonomy the classification is a containment hierarchy. The organisational cri-
terion (Knox, 1998) in a containment hierarchy is that entities at the higher rank are composed
of (or contain) entities at the next lower rank. For example, species which show some common
defining feature are grouped into a more inclusive rank of genus, these are in turn grouped into
14
2.1 Taxonomy
families and so on. This is distinct from a phylogeny which orders entities according to their hi-
erarchical ancestor/descendant relations. Although structured similarly (directed graphs) and
similar methods for determination are used, an ancestor descendant hierarchy is distinct from a
classification hierarchy in the organisation criterion of derivation (the evolutionary process be-
ing mapped) rather than inclusiveness. Ancestors are not contained within ancestors, therefore
the phylogenetic trees produced through systematics are not the same as classifications (Knox,
1998).
There has been significant debate as to whether the use of two systems, and the resultant
practice of merging the two systems, is having a detrimental effect on taxon names and the use
of taxon names. The PhyloCode movement, to be discussed next, calls for the exclusive use of
one system, that of ancestry, and the decommissioning of the classification system.
2.1.5 PhyloCode
The PhyloCode (de Queiroz & Gauthier, 1992) represents the movement away from Linnaean
nomenclature (the current system) to phylogenetic nomenclature, in which species on a clado-
gram would allow the definition of names of taxa by their position in trees built from phylo-
genetic hypothesis. Supporters of the PhyloCode argue that current taxonomy was designed
in a non evolutionary age and is therefore no longer appropriate, whereas their proposal, the
PhyloCode, promises to promote clarity, uniqueness and stability in nomenclature through
phylogenetic definition of taxa.
The proponents of this system argue that the organisation of the Linnaean hierarchy does
not fully reflect the genealogical relationships in its classifications and the current practices of
aligning classification and phylogeny are not appropriate. However, this system has sparked
ferocious debate and while it has its followers, many have completely shunned the idea. Critics
of the code especially dispute the claim to stability (Nixon, 2000) and the argument comes down
to the definition of stability in the two camps; the stability of the name versus the stability of
the definition, i.e., nomenclatural stability or taxonomic stability (Schuh, 2003). Others have
recognised that there is some controversy about whether taxon names are defined (de Queiroz
& Cantino, 2001) or not (Stuessy, 2001), and how they are defined in the current system
(Moore, 2003). Those in favour of PhyloCode suggest that nomenclatural stability is more
important, while the content of the named taxon may change as new organisms are placed into
the phylogeny. The resulting nomenclatural stability would sacrifice taxonomic stability which
the critics find unacceptable. Both sides have merit in their argument with one side providing a
15
2.2 Delivery of Taxonomic Knowledge
solution that copes with the inevitable change (phylogenies are hypotheses and are in constant
flux as a natural consequence of increase in knowledge) and the other side who insist that such a
radical and flawed proposal is not an appropriate solution. Indeed, to replace the whole system
with a flawed one would cause more disruption than than the current system causes confusion.
There have since been other proposals to build stability into taxonomic data, with the
registration of new names as a mandatory tenet of publication of taxonomic data (Borgen
et al., 1998; Bouchet, 1999; Knapp et al., 20077; Patterson et al., 2003; Thorne, 2003) and
the development of networked and web accessible taxonomic data sources (Bisby et al., 2002;
Emery, 2003; Gewin, 2002; Godfray, 2002; Wilson, 2003).
2.2 Delivery of Taxonomic Knowledge
The standard mechanism for delivering new knowledge in the field of taxonomy is through
publication within appropriate scientific journals. The data are also published in the form of
field guides, checklists and monographs.
Checklists take the form of a catalogue in which all known species are listed. Checklists are a
type of aide memoire and are usually devoted to particular groups or geographical locations for
example the Sibley and Monroe Checklist of Birds (Monroe & Sibley, 1997). The information
they provide is usually the species name the author or authority on that name and taxonomic
classification.
Field Guides serve the purposes of users who need a quick and reliable data source to aid
the identification of organisms in the field. These are generally small enough to be fit for
purpose (i.e. taken out to the field) and therefore only provide enough data to allow a general
identification through descriptions, photographs and illustration.
A monograph, by definition, is a more thorough treatment of a group often including a
checklist and the important bibliographic references to original publications of the group that
is being documented. Monographs can take any form and generally the information given varies
according to the requirements of the group. A monograph on plants differs significantly from
most zoological monographs. Generally however, they include illustrations of representative
species, with, when appropriate, typical examples of the male and female, a thorough phylogeny
of the group. Increasingly, taxonomic data are disseminated in database systems that are
available on the web. These systems have increased the scope and use of taxonomic data in
16
2.3 Taxonomic Databases on the Web
similar ways to the parallel field of Bioinformatics and the dissemination of data throughout
its hundreds of databases.
2.3 Taxonomic Databases on the Web
There are a large number of taxonomic databases and the field of ‘databasing’ taxonomic data
is as diverse as the data. These databases are built by institutions, taxonomists and generally
those with a vested interest in taxonomic data. The different uses led different user communities
to build databases to their meet specific needs. As a result, many heterogeneous databases exist
within the taxonomic community.
There are over 200 taxonomic databases published or described, GBIF (2006) provides
a list at http://www.gbif.org/DataProviders/. The databases that were studied and used in
this project, especially at the outset, are described here. These databases were studied either
because of their influence (uBio), their data (ITIS, NCBI) or their data model (Taxonomer
(Pyle, 2004), IPNI (IPNI, 2006)). Sp2000 was examined initially to determine its suitability
as an external taxonomic data source for TreeBASE. Those databases will now be described in
more detail.
2.3.1 ITIS
The Integrated Taxonomic Information System (ITIS) (ITIS, 2006) is a partnership of federal
agencies and organisations from the United States, Canada, and Mexico. It is primarily a
taxonomic database serving data for “biota of interest to North America”, though the data
are curated by experts from around the world and the taxa are not limited to those native
to North America. The taxonomic scope includes the ITIS classification and scientific names
and common names in English, French, Spanish, and Portuguese. The data are available for
download in a relational format at http://www.itis.gov/ftp download.html, and the download
includes an SQL script for building the table structures.
2.3.2 NCBI
The National Center for Biotechnology Information (NCBI) (Federhen et.al, 2005) built a cu-
rated set of names and a classification, originally for the databases within their Entrez system
and, specifically, the Genbank sequence database. The NCBI taxonomy can now be downloaded
17
2.3 Taxonomic Databases on the Web
as a separate database. The purpose of the taxonomic system within NCBI was to enable the
names of organisms to be cross linked across NCBI tools and databases. The project started
to clean up the haphazard taxonomic content, as many taxonomies were diverging within the
sequence data bases and NCBI needed a consensus clean taxonomy within Entrez. Considerable
effort went into building the taxonomy and has since been adopted by all the sequence databases.
The data are provided as a database flat file dump at ftp://ftp.ncbi.nih.gov/pub/taxonomy/.
2.3.3 GRIN
The Germplasm Resources Information Network (GRIN) of the United States Department
of Agriculture, Agricultural Research Service contains taxonomic and nomenclatural data for
records of vascular plants. The scope and purpose of GRIN was to serve the taxonomic and
nomenclatural needs of the (American) National GermPlasm System (NPGS). The GRIN tax-
onomy includes accepted names in family, genus, species and infraspecies ranks, common names,
literature references and geographic distribution. The GRIN resource is provided over the web
and individuals and organisations are encouraged to utilise the data, with the aim of making
GRIN a standard reference for scientific names for plants. The GRIN data model has not been
published however, this resource was included in this research for the rich data it provided.
2.3.4 Sp2000
Species 2000, Sp2000 (Bisby & Smith, 2000) aims to provide a “common gateway to species-
based information in biological databases”. The focus of Sp2000 was to provide a complete
list of species names, including synonyms in a style similar to a checklist (Bisby et al., 2002).
The Sp2000 project was amalgamated into SPICE (Jones et al., 2000) and later evolved into
the Catalogue of Life. The system design followed a loose federated architecture, where the
data sources maintain autonomy. Although the architecture of Sp2000 is described as an “au-
tonomous federated system”, the system is distributed as a CD, so some data are materialised
in some way. The annual CD checklist in 2003 was distributed in Microsoft Access format.
Later versions (2006) were moved to MySQL.
2.3.5 Online Checklists
Increasingly traditional checklist publications are being placed online. The Mammal Species of
the World (MSOW) is an online checklist from the Smithsonian National Museum of History
18
2.3 Taxonomic Databases on the Web
and was also used here purely as a data source. The checklist (Wilson & Reeder, 1993) is in
its third edition, published in 2005, and the website provides this version for download in plain
text files. The scope of the data is limited to description and bibliographic data for mammals.
Other digitised checklists are also available for example, the Aves checklists from the early bird
project (Hackett, 2003).
2.3.6 Other sources used to develop the TCl-Db data model
The following databases are not available for download. However, since they were also built as
relational databases they were studied with the aim of understanding their structure.
2.3.6.1 Taxonomer
Taxonomer contains a relational data model that is used to manage taxonomic names and
concepts attached to specimen data at the B.P. Bishops Museum in Honolulu. The publication
describing this data model (Pyle, 2004) makes very clear the distinction between a taxon name
and a taxon concept. A taxonomic concept refers to a construct of a taxonomic name and
its reference or the publication in which the taxonomic name is described. The taxonomer
database models Agents, References and Assertions as taxonomic authorities, publications and
taxonomic concepts respectively. The author makes use of the term ‘Protonym’ to refer to the
tuple of Name OriginalAuthors(s) OriginalYear.
This tuple is a Protonym-Reference construct that is represented in the entity Assertion. The
data model explicates the requirement of using a taxonomic concept in order to accommodate,
in one database, multiple views and classifications of taxon names.
2.3.6.2 IPNI
The International Plant Name Index, IPNI (IPNI, 2006), is a database storing names for all
vascular plants. The database was designed to serve as a global plant checklist. IPNI was
formed as a joint venture between the Royal Botanic Gardens at Kew, the Harvard University
Herbaria and the Centre for Plant Biodiversity Research in Canberra. The requirement was
to improve the accessibility of internal databases at these institutions. Further, combining the
limited resources for data compilation and maintenance was a strong motivation. The system
has a very strong community focus, as the users contribute data and help maintain a complete
index of published names.
19
2.3 Taxonomic Databases on the Web
The database has a nomenclatural focus, providing primary literature references for taxon
names combined from three data sources: the Index Kewensis (IK), the Gray herbarium Card
Index (GCI) and the Australian Plant Names Index (APNI) (Lughadha, 2004). The database
has a central entity, the Index Entry, through this entity the database links to Names and the
Name Authority (i.e. the author that described and published a name). There are also entities
for the Author, Publication and Source of each Index Entry. Additional data in the form of
Type specimens, Synonyms (and misapplied names and spelling errors) are also included in the
database model. The IPNI website provides a very user friendly interface to search for taxon
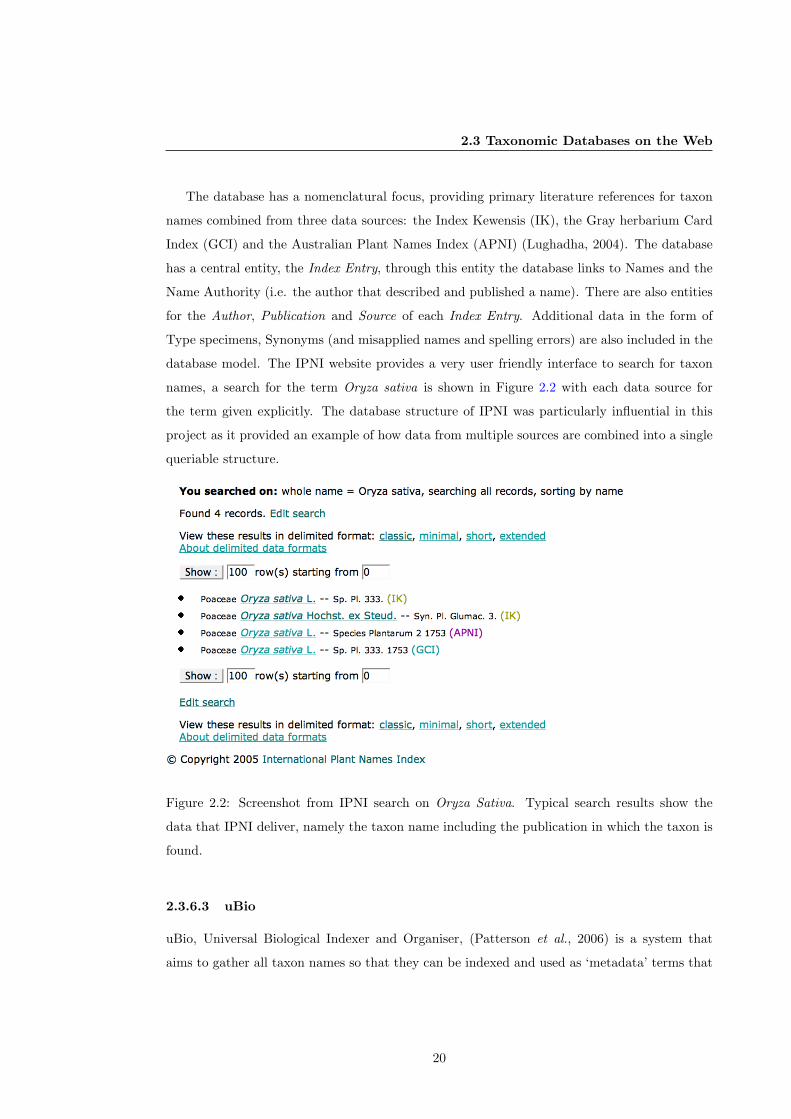
names, a search for the term Oryza sativa is shown in Figure 2.2 with each data source for
the term given explicitly. The database structure of IPNI was particularly influential in this
project as it provided an example of how data from multiple sources are combined into a single
queriable structure.
Figure 2.2: Screenshot from IPNI search on Oryza Sativa. Typical search results show the
data that IPNI deliver, namely the taxon name including the publication in which the taxon is
found.
2.3.6.3 uBio
uBio, Universal Biological Indexer and Organiser, (Patterson et al., 2006) is a system that
aims to gather all taxon names so that they can be indexed and used as ‘metadata’ terms that
20
2.3 Taxonomic Databases on the Web
are capable of defining subsets of information and therefore used to retrieve information. The
uBio NameBank is a biological name server, serving as a thesaurus for taxonomic names. The
developers also recognised that many different names are used for the same taxon and in order
for all information related to taxon to be retrieved, these names need to be linked. The remit
was later extended to include classification data. ClassificationBank is a taxon concept server
that stores multiple classifications and taxonomic concepts, thus extending the functionality of
NameBank. This project is by far the most complete taxon name source, and is characterised
by a very good API’s for data access. The database structure, however, is not published, and
the data are not downloadable, but only accessible through the graphical interface and the API.
To some extent, uBio served as a model for the taxonomic requirements for TreeBASE, with
linked names and support for multiple taxonomic opinions, however, as stated and discussed in
the conclusion, the data could not be effectively linked to TreeBASE
2.3.7 Coordination across resources
The existing amalgamated databases of taxon names address some of the issues of data scope,
however, these too were designed to meet particular requirements and do not support more
general requirements. For example, IPNI and the International Organization For Plant In-
formation (IOPI) database was designed to meet the requirements of a global plant checklist,
Sp2000 (Bisby & Smith, 2000) extended similar requirements to all species and the uBio (uBio,
2006) name server is now both a names server and classification bank. The large number of
taxonomic database systems and amalgamations have made obvious the requirements of inter-
operability and quality (especially in secondary amalgamated databases (Chapman, 2005a)).
Encouragingly, many of the stable published databases have some affiliation to TDWG (Taxo-
nomic Databases Working Group) who are beginning to address the requirements of taxonomic
data across several user communities.
2.3.7.1 TDWG
TDWG and GBIF (Global Biodiversity Information facility) (Saarenmaa, 1999) have started
looking at the more global requirements of taxonomic databases. TDWG’s remit is specifically
to build interoperability through standards and protocols. GBIF have an overlapping element
but aim to use the standards output from TDWG to build tools that will enable interoperability
through their network and make biodiversity data more freely accessible.
21
2.3 Taxonomic Databases on the Web
TDWG ratified and published the Taxonomic Concept Schema (TCS) in 2006. Taxonomic
concepts (Franz et al., 2006) are entities created to tackle the inherent problems of using names
as unique identifiers, as names in different databases are not necessarily equivalent. The data
associated with a name are vital to the use of that name and therefore the understanding of the
name. A richer association of metadata and taxon name can address this. Taxon concepts can
do this through associating the reference (the definition) of the name with the name itself as a
two part entity. This two part entity enables the unique association of a taxon to its original
data.
This is especially important in taxonomic information interchange. The SEEK Project
(SEEK, 2006), where the TCS was originally conceived, is reaching out to the data concerns of
ecologists and the TCS was originally designed to enable data integration across ecological data
sources. Integrating data from two databases by matching purely on the taxon name can result
in significant loss of information. Ecologists require a certain amount of precision in the data
they use and therefore require stringent taxonomic data co-ordination. Moving a taxon name
from one database to another purely based on the name string would for example, result in the
loss of information pertaining to the taxonomic position in the hierarchy (if the two systems
used different classification schemes), or to specimen information (if the two systems came from
different geographic locations). A mechanism was required to transmit data across systems
while retaining the uniqueness of the taxon in the individual systems, within the integrated
data. Such metadata (literature reference, rank and taxonomic position, specimens) enable
better understanding of the name concept in the data systems and therefore of the meaning of
the taxon.
Using the TCS with the additional metadata, information can be transferred without ambi-
guity and the loss of meaning from the original data provider. The integrated data can be linked
without confusion backwards to the original data sources through this scheme. See references;
Kennedy et al. (2005); Franz (2006); Berendsohn (1995) and Gradstein et al. (2001).
The limitations, however, are the number of taxonomic data sources that have enough
data to fully utilise the TCS. The systems most likely to contain such verbose data will be
at herbariums and museums (primary data sources) that have links to literature references
and specimen references. Considerable effort is also required to adapt data in this format for
transfer (mapping two relational database schemas is much simpler). Although the majority
of components are optional within the schema, its full value will only be realised when the
22
2.3 Taxonomic Databases on the Web
transformation into the structure is made seamless and data is made available and openly
disseminated to the community in this format. This falls into the remit of GBIF.
2.3.7.2 GBIF
GBIF focuses particularly on data about species and specimens, with appropriate links to other
relevant data. The data GBIF will take responsibility for are (GBIF, 2006):
1. Taxonomic data, including
(a) Taxon names (the responsibility of the ECAT Work Programme)
i. Scientific names, including data on synonymy
ii. Vernacular names
(b) Taxonomic descriptions, including diagnostic keys
2. Taxon occurrence information (primarily species-level, but including data for taxa at
different ranks where appropriate)
(a) Specimen records (from natural history collections)
(b) Observation records
3. Links to other taxon-level information, including
(a) Information on taxon biology and life history
(b) Ecological interactions
(c) Genetic data
(d) Sound and image resources
The Taxonomic element is the most relevant to this work and is also their initial priority.
Using the TDWG ratified Taxanomic Concept Transfer Schema, GBIF have started exchanging
taxonomic data across their network (the GBIF portal can be found at http://data.gbif.org/),
this will take the form of ECAT (Electronic Catalogue of Names of Known Organisms), a digital
listing of the names of all known species. ECAT is being developed in collaboration with Species
2000 (Bisby & Smith, 2000), ITIS (ITIS, 2006), uBio (uBio, 2006), the providers of taxonomic
nomenclators, taxonomic institutions worldwide, the nomenclatural codes and others. In 2005,
ECAT contained about 983,000 species names from nearly 200 data providers; it aims to have
a complete listing of all known species by 2010.
23
2.4 Taxonomy and systematics
2.4 Taxonomy and systematics
Despite a plethora of taxonomic databases, there is no database of taxonomic names that
has been developed specifically for the tree building community, and no taxonomic database
currently meets the requirements of this community. This is perhaps difficult to fathom given
the interdependence of taxonomy and systematics. The reasons for this are highlighted here.
Uniquely, systematists are both taxonomic users and taxonomic data providers through
building the phylogenies on which classifications are based. As such, they have unique tax-
onomic requirements and often visit many taxonomic data sources, compared to taxonomists
whose needs are met by one or perhaps two systems. Taxonomists, generally work on small
groups of organisms and they focus more narrowly sometimes on geographical locations or ge-
ological time periods. Getting a handle on other data, even for an expert, when not actively
involved in the research, can be difficult. This is partly due to the complications associated with
taxonomic data as described above (synonyms, name changes and taxonomic revisions), but
also because of the data accessibility, particularly moving from one database system to another.
There are many taxonomic database systems and they each have a very specific data scope and
were usually built for a specific user community. Prometheus (Pullan et al., 2000), for example,
although extensible, has a working data scope of plants and was built to manage these data
through the working practices of taxonomists. There are also many examples of literature and
specimen databases that have taxonomic content but are not taxonomic databases. In these
cases, the interfaces to these systems are designed with particular queries in mind, and using
them outside of the original scope, say to extract all taxonomic data, can be difficult and some-
times impossible through the interfaces provided. Although, some database have been built
to expressly index names so that they can be used to retrieve data (Berendsohn, 2003), the
focus was towards retrieving literature data. Databases that performed literature retrieval well,
with the exception of uBio, had limited data scope. Given that no system has been designed
with the data scope and query interface geared towards the systematics community, currently
systematists have to visit and learn to use many systems and from these gather the data they
require and collate and manipulate it into a form they can use.
2.4.1 TreeBASE
TreeBASE Morell (1996) is a phylogenetic and evolutionary information store now containing
phylogenies for more than 90,000 taxa. Despite the intrinsic taxonomic content, at design, the
24
2.4 Taxonomy and systematics
developers of TreeBASE purposely excluded taxonomy. This decision was taken because at the
time of development, there were few electronic taxonomic data sources to choose from and there
was also the question of which classification to use. This is still an issue. As we show in Chapter
5 names in different classifications can have different meanings hierarchically, for example, Aves
in NCBI and Aves in ITIS are quite different in their data coverage and content. Also, some
classifications do not support some commonly used ranks and data coverage varies across the
taxonomic data sources. It would be unfitting to apply one single classification to TreeBASE,
but without a classification, TreeBASE does not effectively support higher taxa queries.
Currently, data can only be retrieved by exact of partial string matching. As a result, sys-
tematists prefer to gather the data they require for their analysis through literature searches.
In most cases, once data are retrieved the search results have to be manually examined to deter-
mine if they contain the phylogenetic data of interest. The lack of taxonomic intelligence makes
data retrieval through TreeBASE difficult. Currently, in order to retrieve all bird sequences a
user would first have to find all the scientific names and any synonyms he is interested in and
then perform the searches one at a time using this list. It would be far more efficient if the
query term “birds” translated to Aves which, in turn translated hierarchically by the system,
this is what is meant by ‘taxonomic intelligence’.
2.4.2 TreeBASE Database versus Information Retrieval
When querying a database system, the results returned are exactly those data that satisfy the
given query. This is referred to as data retrieval and in relational database systems it can be
accomplished by the structured query language (SQL). For effective data retrieval, the data has
well defined structure and should have well defined semantics. A well formed query will return
exactly those data that satisfy that query. In information retrieval, ideally, a given query is
understood by the system, i.e., there is an element of interpretation through related terms or
categorised topics (Fast et al., 2002). The query therefore does not have to be exact and the
data returned is not that which matches the query but that which is relevant to the query. The
query need neither be well formed nor exact.
The queries supported by the TreeBASE interface do not perform adequately, as it does not
support higher taxa queries or synonym and vernacular queries. Currently TreeBASE provides
only data retrieval capacity, (as outlined in Section 1.5) and as we show in Chapter 7, in the
searches performed on TreeBASE, the users expect information retrieval, which means that the
systems does not perform as expected.
25
2.4 Taxonomy and systematics
2.4.3 Requirements of a “Taxonomically Aware” Database
At the very least, the taxonomic requirements that TreeBASE should support are:
• search terms should expand to include subordinate terms in the classification if they are
higher taxa
• vernacular queries should be supported and expand appropriately to include the data
linked to the scientific names
• any given query should also expand to include data associated with synonyms and out of
date usage of a taxon name
2.4.3.1 Support for Hierarchical Query Expansion
Genbank (Wheeler et al., 2007) is an example of a database with a taxonomic intelligence. Each
sequence record in Genbank includes the data; the organism name and organism classification.
By using this information queries such as ‘select all Insecta sequences’, ‘select all plant sequences’
or ‘select all sequences in the genus Drosophilla’ retrieve the data in a taxonomically intelligent
manner, i.e. by resolving the query hierarchically. This is what users expect when they perform
a query using a higher taxa search term and is what a taxonomically aware database should
be able to achieve. TreeBASE was built when there were few taxonomic databases available.
While NCBI had the resources to build the taxonomy (Federhen et.al, 2005) they required for
information retrieval, smaller projects such as TreeBASE, due to financial constraints, could
achieve the same. The Genbank model highlights the requirements of taxonomic intelligence
that would potentially make TreeBASE a more attractive information provider.
Many queries that users perform are higher taxa queries. As data are often collected for
multiple taxa, it is easier to use the higher taxa that include all the species of interest, than
it is to search for each species name individually. Higher taxa queries implicitly include all
lower taxa in the hierarchy, and as a result make the queries more succinct and easier to
formulate. Including hierarchical queries in TreeBASE can be easily achieved with the inclusion
of the NCBI taxonomy. However, the difficulty here is that NCBI provides just one taxonomic
view and there are multiple overlapping classifications which may be useful in different user
26
2.4 Taxonomy and systematics
communities. Some users may wish to use higher taxa groups that are not contained in the
NCBI classification. This poses a problem for systems such as TreeBASE that store data across
classifications, and the storage of these classifications and the choice of which classification
to traverse when performing these hierarchical queries is a significant consideration. In this
respect, Genbank only provides one particular view of taxonomy, and no others, which may not
be suitable for all TreeBASE users.
2.4.3.2 Query Expansion with Synonyms and Vernaculars
It seems that users prefer to perform loose queries in the hope of gathering all the data (and not
loose anything of value) and manually filter the result set. Vernaculars can be considered to be
loose queries, for example, a cat could refer to all species in the family Felidae, where as puma,
cougar and mountain lion have a little more specificity. The use of loose search terms is typical
in a “drill down” search, which is usually performed when a user has a rough idea of what she
is looking for but is not exactly sure, and chooses to browse the relevant data until she comes
across the actual search term. The use of loose query terms is similar to hierarchical query
expansion, in that the query term should also translate from the vernacular to the currently
accepted scientific name. Indeed, judging from the queries we examined (see Chapter 7), a user
expects that the query translates to the scientific name and any other synonyms and vernaculars
that are linked to that scientific name.
Synonyms are not loose queries but queries that are performed either because the user knows
exactly what she is looking for or because she is unaware of the current status of the name and is
using it in error. This should not cripple a user in their search strategy, and similarly, synonyms
should translate in much the same way as vernaculars, so that all relevant data are returned to
the user, despite the fact that the user provided a very specific query term.
2.4.3.3 Consistency
Consistent use of names is important in information retrieval. If the database system only allows
the use of a single name for a given concept, the data linked to that name can be retrieved
when using the name as a search term. However, if names are used inconsistently, i.e. with
two different spellings, then some data will be attached to one use of the name and some other
data to the other spelling (Rothschild, 1989). In order to get all data of interest, both names
would have to be used as the search term. However, two different classification schemes may
rightly or wrongly use different spellings, i.e., the spellings Boopidae vs. Boopiidae shown in
27
2.4 Taxonomy and systematics
Figure 2.3. It is therefore an important design consideration to allow mismatches in search
terms as taxonomic names take Latin form and the exact spelling can sometimes be difficult to
decipher for both experts and novices. As a result, spelling mistakes have propagated through
the data. Not only do users require some capacity to check for the correct spelling of a name
but they should also be able to retrieve data that has been used with an alternative spelling.
An approximate string match tool can be employed that will enable the system to find a match
even if a query it is misspelt.
2.4.3.4 Data Coverage
Simply employing the NCBI taxonomy, as used in Genbank, is not a solution to all the tax-
onomic requirements of TreeBASE or the work of all systematists. In some cases, there is an
obvious choice of a taxonomic data source, however, there are cases where users require full
coverage of all known named organisms. In the example, in Figure 2.3 we see that Genbank is
not a complete source of taxonomic data for lice. Many more taxon names can usually be found
in the classifications of constructed by experts. In Genbank the sarch term Aves returns 4645
taxon names while the same search in ITIS returns 14,095 names. Considering this, the NCBI
taxonomy alone would not suffice for the working practices of systematists. Most researchers in
the field are able to find with ease the most up-to-date checklist on particular groups, however,
these checklists are not always linked to data. For example, 4645 bird names are linked to a
sequence, but names in stand alone checklists are not digitally linked to data. Using another
taxonomic scheme requires manually synonymising names across the schemes in order to trans-
late the query term in one, to the relevant query term in the other. For example, Charadii vs
Charadiiformes is a required synonymisation. It is therefore important for a taxonomy database
to provide full coverage of the estimated 1.7 million known species (Alroy, 2002) by including
as many taxonomic data sources as possible.
These challenges may be addressed by combining the content of multiple taxonomic data
sources and integrating the data into a form that can support taxon queries in TreeBASE.
The research hypothesis studied in this project is that data retrieval from TreeBASE can be
improved by the inclusion of a taxonomic infrastructure. This infrastructure must provide a
wide coverage of data and therefore a merged, integrated view of taxonomic data through a
single point of access is required.
28
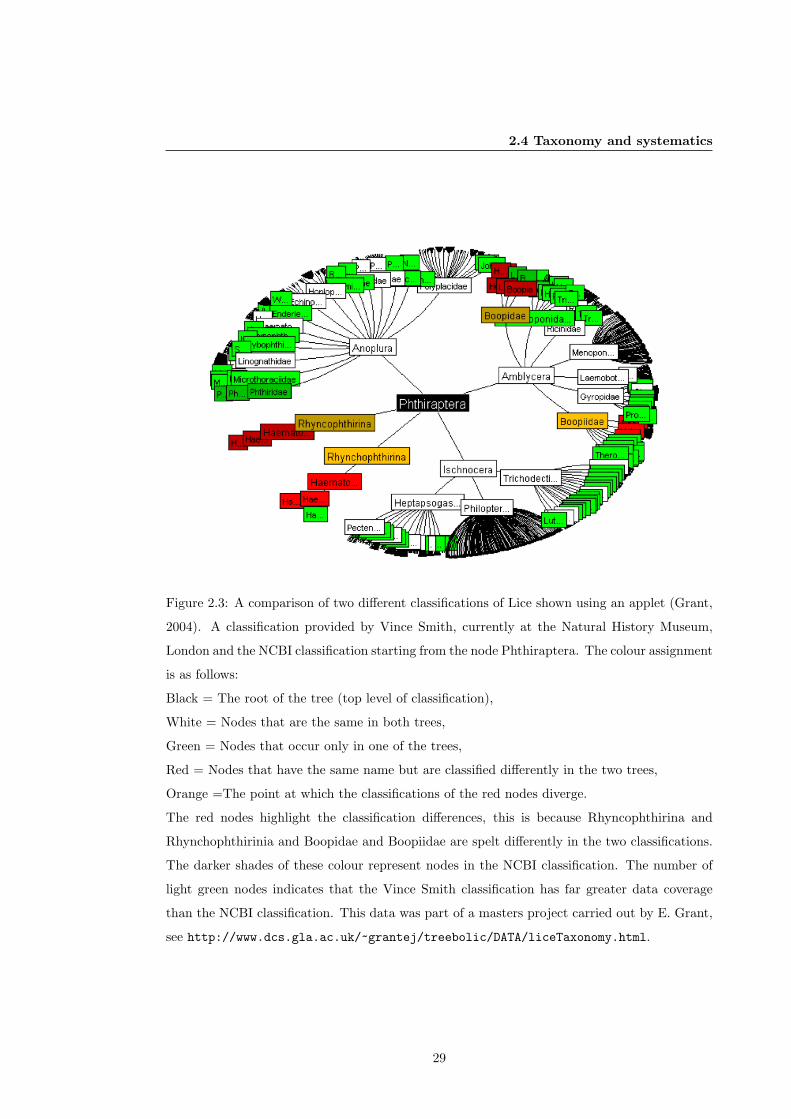
2.4 Taxonomy and systematics
Figure 2.3: A comparison of two different classifications of Lice shown using an applet (Grant,
2004). A classification provided by Vince Smith, currently at the Natural History Museum,
London and the NCBI classification starting from the node Phthiraptera. The colour assignment
is as follows:
Black = The root of the tree (top level of classification),
White = Nodes that are the same in both trees,
Green = Nodes that occur only in one of the trees,
Red = Nodes that have the same name but are classified differently in the two trees,
Orange =The point at which the classifications of the red nodes diverge.
The red nodes highlight the classification differences, this is because Rhyncophthirina and
Rhynchophthirinia and Boopidae and Boopiidae are spelt differently in the two classifications.
The darker shades of these colour represent nodes in the NCBI classification. The number of
light green nodes indicates that the Vince Smith classification has far greater data coverage
than the NCBI classification. This data was part of a masters project carried out by E. Grant,
see http://www.dcs.gla.ac.uk/~grantej/treebolic/DATA/liceTaxonomy.html.
29
2.5 Integration approaches and database technologies
2.5 Integration approaches and database technologies
It is clear from the taxonomic requirements of TreeBASE that a taxonomic database is required
that can deliver a broad coverage of taxa and multiple classifications. The proposed approach
is to build this database specifically for TreeBASE. A database is defined as a collection of
related information about a subject, organised into a useful manner that allows the data to be
safely stored, accessed and analysed. This section briefly outlines database technologies that
are in prominent use in biology.
2.5.1 Database technologies
Database System
The term database system (or more accurately database management system) is distinct from
database, although the terms are used synonymously. A database system comprises the com-
puter programs used to manage and query a database, while databases are structured collections
of related data. The structure of the data is the key component of a database, and is mod-
elled by the database schema. A database schema represents the structural description of the
data that is held and the objects and relationships among them. There are different ways of
organising a database schema. The different database models that are in use described below.
Database management systems are categorised by the data model they support. The re-
lational model is the most commonly used. Object Relational is a relatively recent addition
and there are the older Hierarchical and Network Models. The database system also provides a
language to access the data. These two components of a DBMS, the model supported and the
query language, are a key part of the decision for which system to use in the development of a
database. One other data model that is not supported by any particular management system1
is the flat model.
Flat files
In the early days of computing (when magnetic tapes/punch cards were in widespread use) data
was generally structured in a flat model. This data model represented data in simple files of
sequential records. The more commonly used term now is “flat file” since they are distinct from
most other data models and this term is more literal. In a flat file one record is sequentially
followed by the next, and the file contains only data and delimiters. The field delimiters and1Excluding the operating system - these were essentially filesystems similar to those currently in use.
30
2.5 Integration approaches and database technologies
the record delimiters are commonly commas and newlines. Fixed width flat files were the first
implementations where the fields were padded (with spaces) to a particular width2. Flat files
are still common data structures. They are simple tables (precursor to spreadsheets), easy to
use and conceptualise and one of the main reasons they have stayed in regular use is that they
are easy to share and transform into other structures.
With the ease of use came several limitations, in particular the operations on these structures
were limited to: opening the file and reading the current record and only basic operations to
allow you to go to the next, first, last, previous or nth record with only insert, update and
delete manipulations. These file systems were soon found to be lacking as a database, given
the overhead of opening and closing files, the problems associated with redundant data3 and
concurrent access 4. In terms of data management, flat files were especially inappropriate for
complex data.
Though flat files are making a revival through more sophisticated structured XML files,
other data models offer more adequate solutions to databases and data management.
Hierarchical Model
The first data model in prominent use was the Hierarchical model. In this model data is
structured as a tree (hierarchy), similar to the taxonomic tree structure. Data at each level in
the hierarchy are either related or dependant upon data at the level higher. The model presents
data as records, records have fields and the fields hold the data values. Records are
connected to each other through links, and links connect two records.
However, while the hierarchical model is very fast and efficient at querying hierarchies,
certain queries can be difficult, i.e. querying across multiple trees. Also, these models are
not designed for regularly changing hierarchies. The most widely used hierarchical DBMS is
IBM’s IMS (Information Management System) (Strickland et al., 1982), initially developed for
the Apollo space program back in the 1960’s and still in use today in many financial systems.
However, it runs only on IBM’s mainframe hardware and is integrally linked to the Z/OS
operating system making it an inaccessible product for most academic environments.
A newer Linux-based and open source implementation called Mumps/MDH (The Multi-
Dimensional and Hierarchical Database Toolkit (O’Kane, 2006)) provides hierarchical storage
and retrieval and has been shown to work very well. It has been implemented successfully for280 digit punch cards are an example of fixed width flat file.3the same data in many files4data corruption through two processes attempting to modify the same data file
31
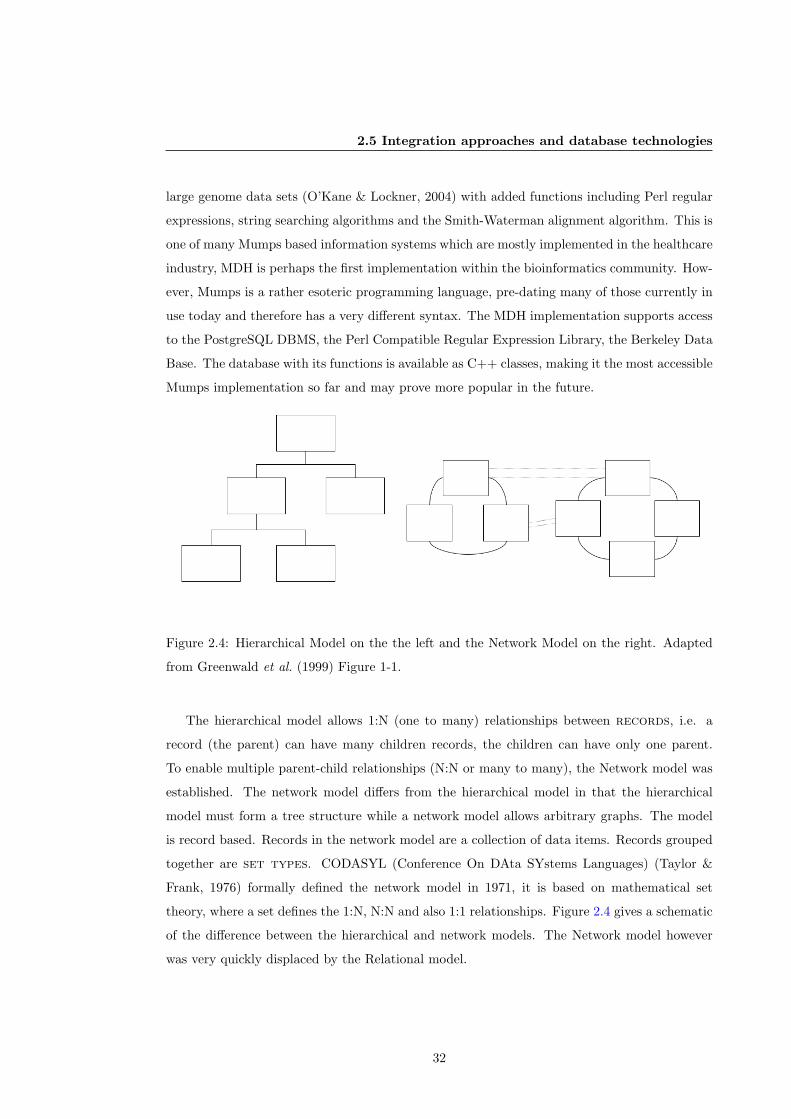
2.5 Integration approaches and database technologies
large genome data sets (O’Kane & Lockner, 2004) with added functions including Perl regular
expressions, string searching algorithms and the Smith-Waterman alignment algorithm. This is
one of many Mumps based information systems which are mostly implemented in the healthcare
industry, MDH is perhaps the first implementation within the bioinformatics community. How-
ever, Mumps is a rather esoteric programming language, pre-dating many of those currently in
use today and therefore has a very different syntax. The MDH implementation supports access
to the PostgreSQL DBMS, the Perl Compatible Regular Expression Library, the Berkeley Data
Base. The database with its functions is available as C++ classes, making it the most accessible
Mumps implementation so far and may prove more popular in the future.
Figure 2.4: Hierarchical Model on the the left and the Network Model on the right. Adapted
from Greenwald et al. (1999) Figure 1-1.
The hierarchical model allows 1:N (one to many) relationships between records, i.e. a
record (the parent) can have many children records, the children can have only one parent.
To enable multiple parent-child relationships (N:N or many to many), the Network model was
established. The network model differs from the hierarchical model in that the hierarchical
model must form a tree structure while a network model allows arbitrary graphs. The model
is record based. Records in the network model are a collection of data items. Records grouped
together are set types. CODASYL (Conference On DAta SYstems Languages) (Taylor &
Frank, 1976) formally defined the network model in 1971, it is based on mathematical set
theory, where a set defines the 1:N, N:N and also 1:1 relationships. Figure 2.4 gives a schematic
of the difference between the hierarchical and network models. The Network model however
was very quickly displaced by the Relational model.
32
2.5 Integration approaches and database technologies
The Relational Model
The Relational model (Codd, 1970) is by far the biggest success story in database research. Also
based on mathematical set theory, its biggest advantage was in the simplification of systems
through independence of data from the application. In all the systems described above, the data
and application were tightly coupled. In the relational model this is not so, because the data
model and implementation (physical components that constitute the model) are distinct and
‘data independence’ is achieved. What this means to application designers is that if changes
are made to the way the data are stored and accessed at the physical level, no corresponding
changes are needed at the application level. The way the data looks to the user and the way
queries are made do not need to change.
The language of the relational system also simplified data access, as older systems commonly
used procedural languages, working on one record at a time, while relational programming is
non procedural working on sets. At another level of simplification, data consistency in the
relational database is enforced, not by rules built into the applications but through constraints
which are part of the logical schema. The same rules are accessible from the schema and they
do not have to be built into each individual application that accesses the data. Overall, it was
these simplifications of data management and data querying that resulted in the Relational
Model dominating the database market. One other reason the relational databases grew to be
more dominant was through the availability of multiple platform versions; unlike IBM’s IMS, for
example, the Oracle relational database was available on nearly all the early operating systems
(Greenwald et al., 1999). The Relational Model is the most accessible and by far the easiest to
use system of all those described. It is predominant in bioinformatics and indeed most of the
taxonomic databases currently available are built on a relational model.
The Object-Oriented Model
The object-oriented (OO) database model (Silberschatz et al., 1996) is adapted, as the name
suggests, from the object oriented paradigm used in programming languages. The model is
based on objects and their relationships, contrasting them from the record based relational
model. Within the OO data model, data are represented as objects. These in turn, are organised
into classes, giving a hierarchical structure where classes inherit from its parent. Both data,
and operations on the data (methods), are stored in the database as objects and since data
values are stored as objects, objects can be shared. Using object identity, two objects can
33
2.5 Integration approaches and database technologies
share components, other objects or methods. The hierarchical structure of classes facilitates
the re-use of methods. Object-oriented models are used for systems where other data models,
such as the relational model, can not be used easily to capture the underlying structure of the
data.
Graph Model
The graph database models (Angles & Gutierrez, 2008) were popularised alongside OO models
and were developed to explicitly capture the inherent graph structure of certain data, i.e.
hypertext data. In graph databases the data structure (and the schema) are represented as
graphs (directed, labelled) or a generalisation of a graph (hypernode, hypergraphs) and data
manipulations are expressed as graph-oriented queries. Each of the proposed graph data models
supports node labelled digraphs and the majority also support edge labels. An example schema
and instance for the graph database model GOOD is presented in Figure 2.5 and the more
recent model, the Graph Data Model (GDM) is presented in Figure 2.6. GDM was based on
the GOOD data-model but extended to support complex objects.
2.5.2 Data Integration
Data integration involves combining data, so that data from a number of heterogeneous data
sources can be queried seamlessly. Data integration offers significant advantages to users,
namely; transparency and extensibility of data. Data from several different sources often need to
be queried in specific ways, by integrating the data accessibility is made efficient and differences
and overlaps in the data are made more obvious. Also, in terms of extensibility, if is often
difficult to use data outside of the scope provided by individual data providers, data integration
offers to extend the scope of data use. Data integration is most often achieved through Database
Integration.
The establishment of reliable data management solutions has resulted in increasing numbers
of easily accessible information resources. However, with large number of databases built for
specific needs and requirements, especially in the biological sciences, data has become more
disparate and the focus has shifted towards data integration in order to maximise the use of
these data. The main goal of data integration systems is to provide a mechanism to unify
databases so that users do not have to manually query multiple databases and collate the
results. There are clear benefits to be gained from integrating data other than the convenience
34
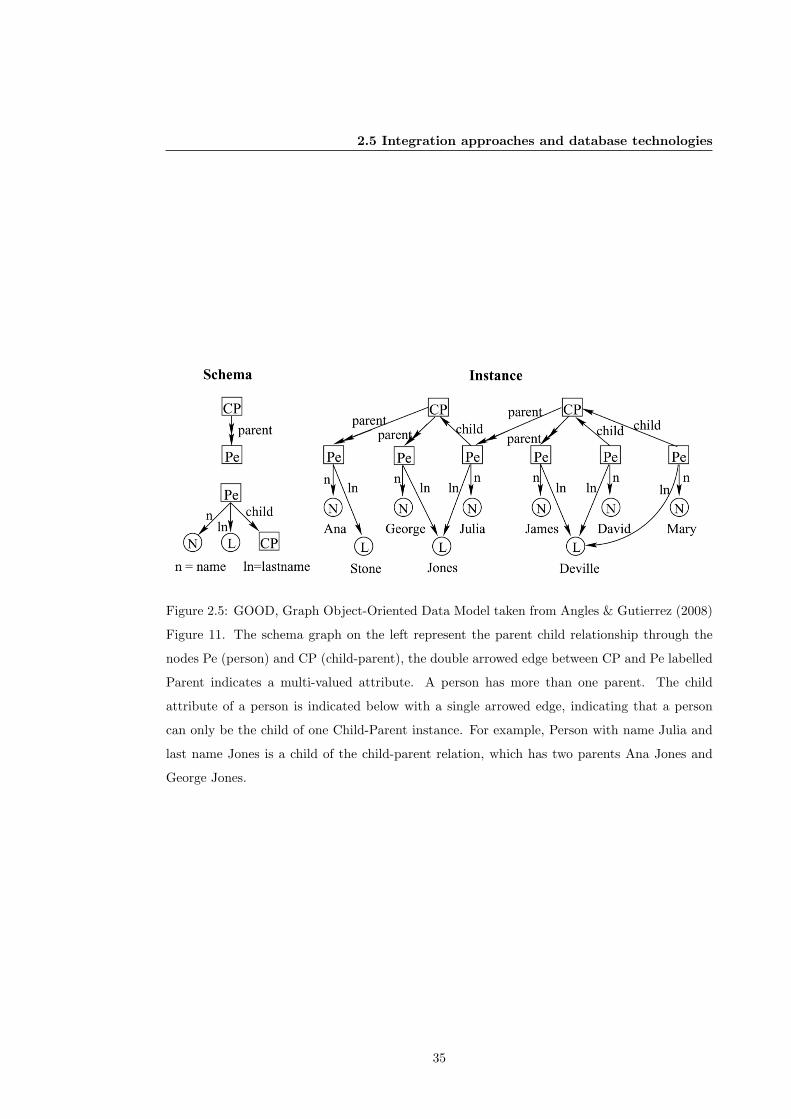
2.5 Integration approaches and database technologies
Figure 2.5: GOOD, Graph Object-Oriented Data Model taken from Angles & Gutierrez (2008)
Figure 11. The schema graph on the left represent the parent child relationship through the
nodes Pe (person) and CP (child-parent), the double arrowed edge between CP and Pe labelled
Parent indicates a multi-valued attribute. A person has more than one parent. The child
attribute of a person is indicated below with a single arrowed edge, indicating that a person
can only be the child of one Child-Parent instance. For example, Person with name Julia and
last name Jones is a child of the child-parent relation, which has two parents Ana Jones and
George Jones.
35
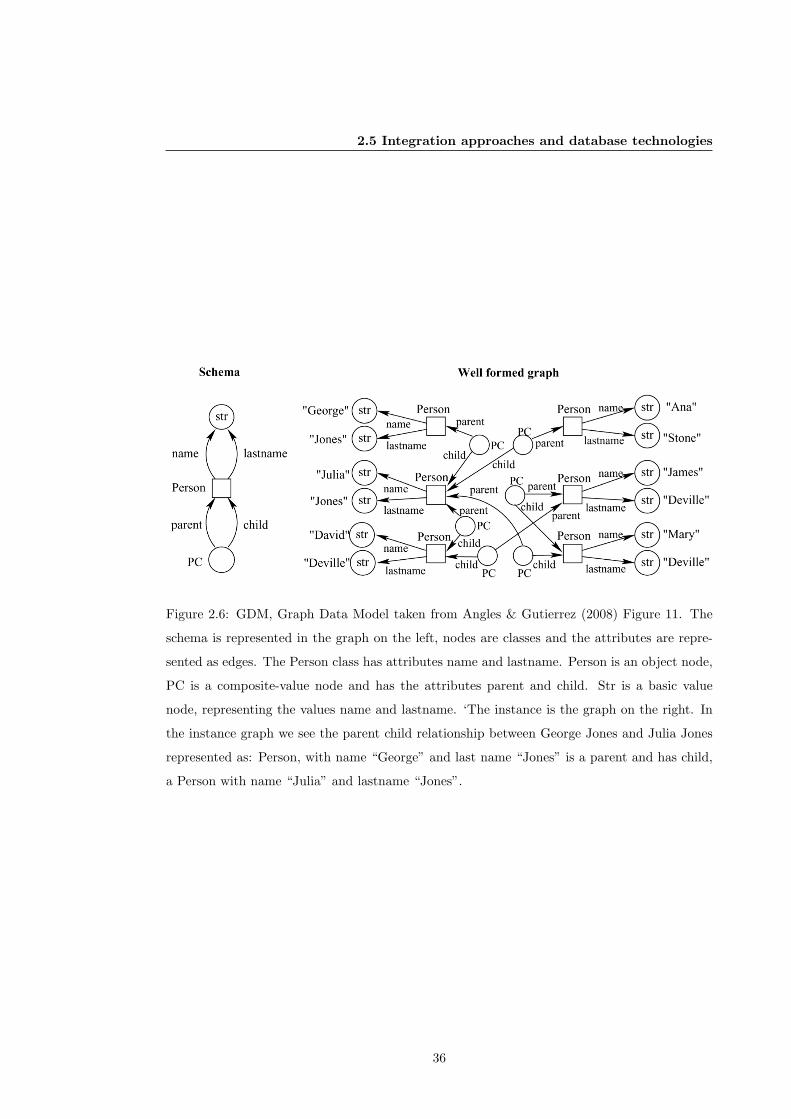
2.5 Integration approaches and database technologies
Figure 2.6: GDM, Graph Data Model taken from Angles & Gutierrez (2008) Figure 11. The
schema is represented in the graph on the left, nodes are classes and the attributes are repre-
sented as edges. The Person class has attributes name and lastname. Person is an object node,
PC is a composite-value node and has the attributes parent and child. Str is a basic value
node, representing the values name and lastname. ‘The instance is the graph on the right. In
the instance graph we see the parent child relationship between George Jones and Julia Jones
represented as: Person, with name “George” and last name “Jones” is a parent and has child,
a Person with name “Julia” and lastname “Jones”.
36
2.5 Integration approaches and database technologies
of not having to query several databases; the ability to extract data and make predictions or
decisions from integrated sources is just not possible when the databases are queried in isolation.
In data integration, the data are combined from two or more databases (data sources) into
one large database (Lenzerini, 2002). Within the large integrated database, the consolidated
data can be queried as a unit, thus allowing more information to be acquired from the data
(Calvanese et al., 1999). One approach to data integration is database federation which consists
of relational database that provides uniform access to two or more heterogeneous data sources.
Database federation is an effective approach to integration of heterogeneous data sources when
the data can not be materialised into the integrated database (a data warehouse). Data in-
tegration using a data warehouse approach, where data from the data sources are physically
combined into one structure, is a very mature field. The data warehousing solutions (OLAP
- see below) and data federation tools (query rewrite and cost-based optimisation) are well
established and used in many production systems.
Through a federated approach, the combining of data from several data sources can be
accomplished in several ways. In a loose federation (Figure 2.7), application systems are built
to directly combine data retrieved from querying the individual data sources. These special
purpose applications are often a ‘quick and dirty solution’. They are quick because integration
is coded into the applications which are inexpensive and simple to build, but dirty, because
these systems are expensive to maintain especially as they are easily broken by changes to the
underlying sources (new data sources generally require the application to be re-written), see
Figure 2.8.
More robust data integration systems generally follow a materialised approach (Figure 2.7),
where the degree of federation is based on requirements and data availability. Where data are
being integrated from different organisations, those organisation may choose to make the data
available in such a way that the underlying data sources remain under their control. These
autonomous data sources force the development towards loose federation. However, where
the requirements show data mining or decision support queries then performance becomes the
key driver to the degree of federation, pushing towards a data warehouse. This approach is
illustrated in Figure 2.9.
In a data warehouse copies of data from several sources are stored in a single database, using
a global schema (Bouzeghoub & Lenzerini, 2001). The components of a data warehouse are
the sources containing the original data, the global schema providing the integrated view of the
data and the data load processes that transform the data from the sources to the global schema.
37
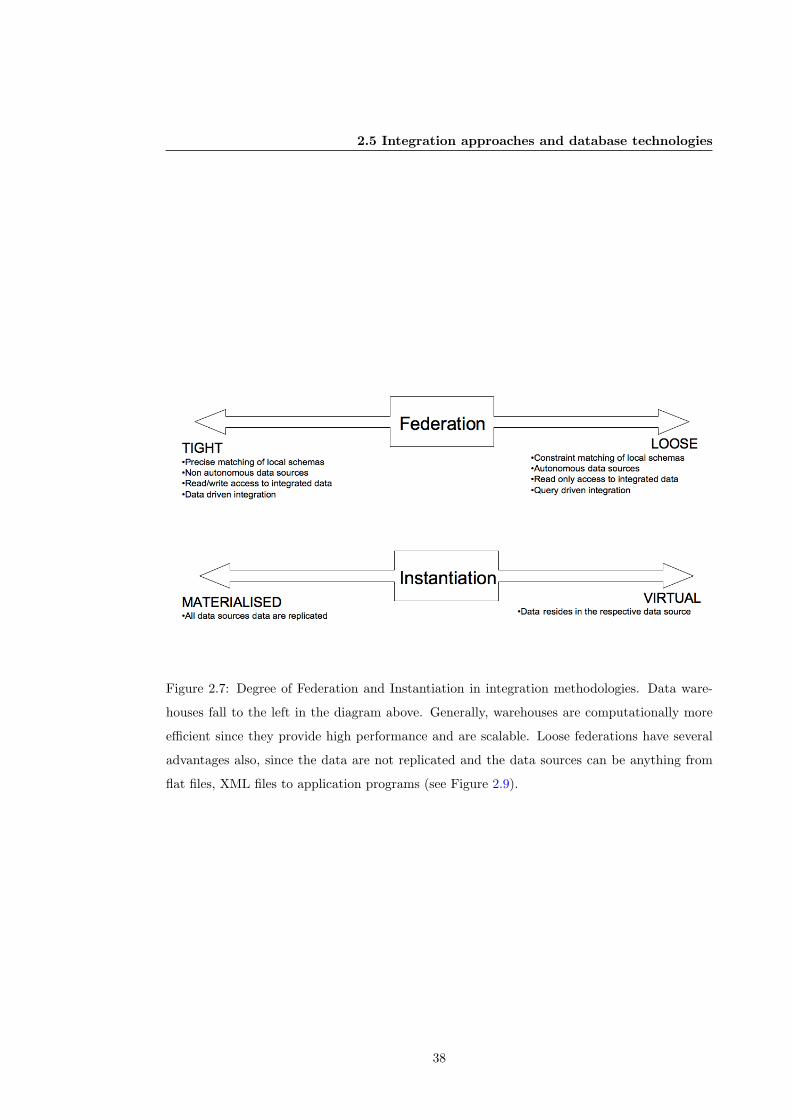
2.5 Integration approaches and database technologies
Figure 2.7: Degree of Federation and Instantiation in integration methodologies. Data ware-
houses fall to the left in the diagram above. Generally, warehouses are computationally more
efficient since they provide high performance and are scalable. Loose federations have several
advantages also, since the data are not replicated and the data sources can be anything from
flat files, XML files to application programs (see Figure 2.9).
38
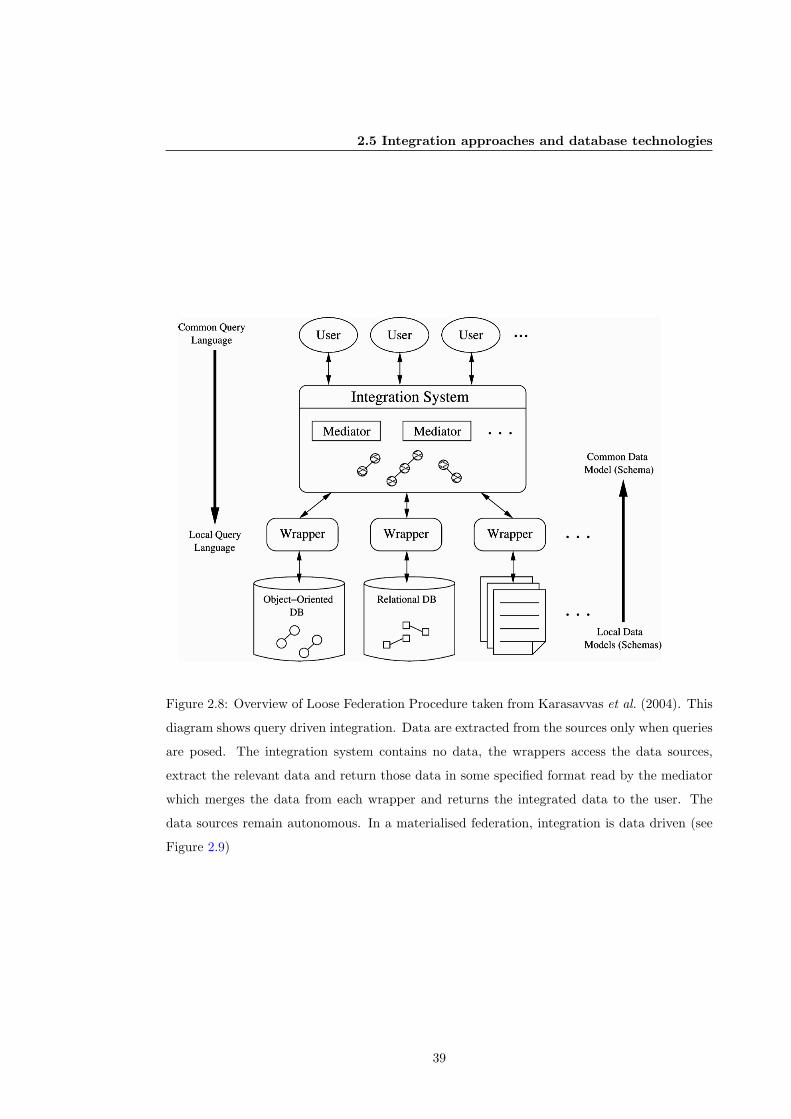
2.5 Integration approaches and database technologies
Figure 2.8: Overview of Loose Federation Procedure taken from Karasavvas et al. (2004). This
diagram shows query driven integration. Data are extracted from the sources only when queries
are posed. The integration system contains no data, the wrappers access the data sources,
extract the relevant data and return those data in some specified format read by the mediator
which merges the data from each wrapper and returns the integrated data to the user. The
data sources remain autonomous. In a materialised federation, integration is data driven (see
Figure 2.9)
39
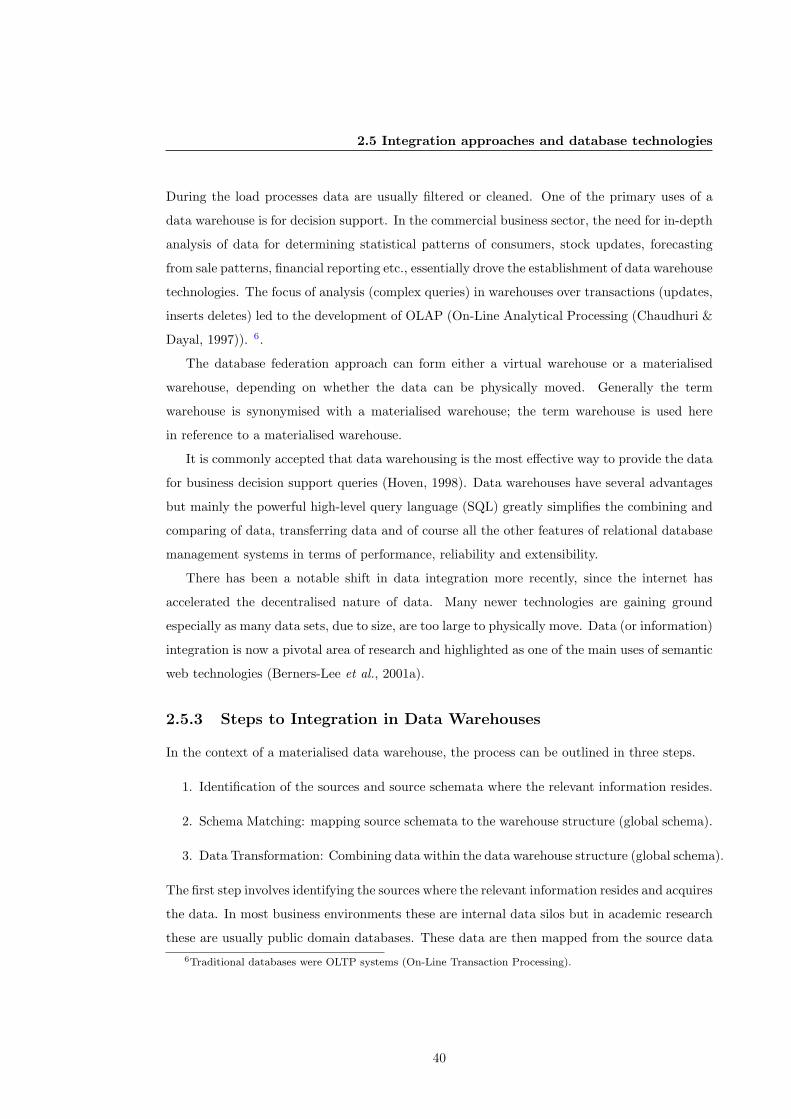
2.5 Integration approaches and database technologies
During the load processes data are usually filtered or cleaned. One of the primary uses of a
data warehouse is for decision support. In the commercial business sector, the need for in-depth
analysis of data for determining statistical patterns of consumers, stock updates, forecasting
from sale patterns, financial reporting etc., essentially drove the establishment of data warehouse
technologies. The focus of analysis (complex queries) in warehouses over transactions (updates,
inserts deletes) led to the development of OLAP (On-Line Analytical Processing (Chaudhuri &
Dayal, 1997)). 6.
The database federation approach can form either a virtual warehouse or a materialised
warehouse, depending on whether the data can be physically moved. Generally the term
warehouse is synonymised with a materialised warehouse; the term warehouse is used here
in reference to a materialised warehouse.
It is commonly accepted that data warehousing is the most effective way to provide the data
for business decision support queries (Hoven, 1998). Data warehouses have several advantages
but mainly the powerful high-level query language (SQL) greatly simplifies the combining and
comparing of data, transferring data and of course all the other features of relational database
management systems in terms of performance, reliability and extensibility.
There has been a notable shift in data integration more recently, since the internet has
accelerated the decentralised nature of data. Many newer technologies are gaining ground
especially as many data sets, due to size, are too large to physically move. Data (or information)
integration is now a pivotal area of research and highlighted as one of the main uses of semantic
web technologies (Berners-Lee et al., 2001a).
2.5.3 Steps to Integration in Data Warehouses
In the context of a materialised data warehouse, the process can be outlined in three steps.
1. Identification of the sources and source schemata where the relevant information resides.
2. Schema Matching: mapping source schemata to the warehouse structure (global schema).
3. Data Transformation: Combining data within the data warehouse structure (global schema).
The first step involves identifying the sources where the relevant information resides and acquires
the data. In most business environments these are internal data silos but in academic research
these are usually public domain databases. These data are then mapped from the source data6Traditional databases were OLTP systems (On-Line Transaction Processing).
40
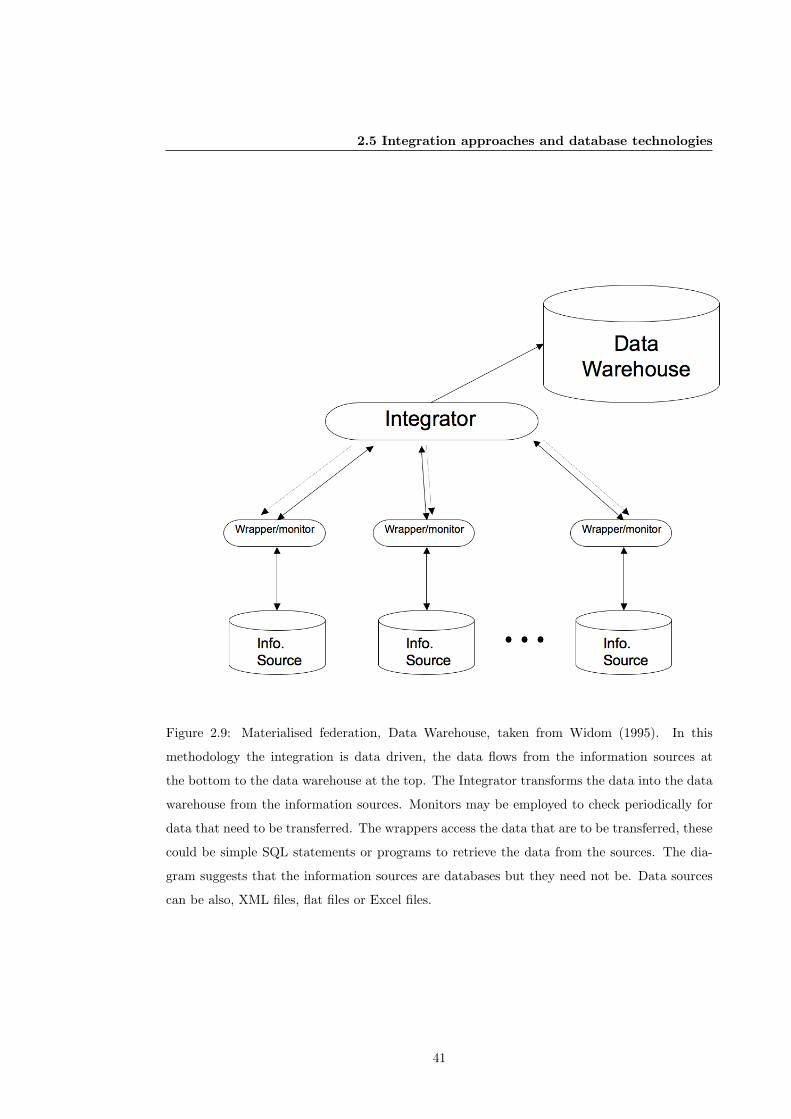
2.5 Integration approaches and database technologies
Figure 2.9: Materialised federation, Data Warehouse, taken from Widom (1995). In this
methodology the integration is data driven, the data flows from the information sources at
the bottom to the data warehouse at the top. The Integrator transforms the data into the data
warehouse from the information sources. Monitors may be employed to check periodically for
data that need to be transferred. The wrappers access the data that are to be transferred, these
could be simple SQL statements or programs to retrieve the data from the sources. The dia-
gram suggests that the information sources are databases but they need not be. Data sources
can be also, XML files, flat files or Excel files.
41
2.5 Integration approaches and database technologies
structure (schema) to the warehouse schema (schema matching) and finally integration occurs
as physical transformation of the data to the data warehouse schema. Particular attention is
paid to the second step, mapping of the source schemata to the warehouse schema since this is
the most challenging step in the process.
2.5.3.1 Schema Matching
Schema matching (Navathe et al., 1984) is the interpretation of the data within the data sources
before integration (i.e. before building the transformation code to transfer data in the source
schema to the destination schema). Schemata are the structural description of the data held in
data stores and as such are metadata. Some schemata also address data contents through, for
example, allowable values and meaning of data through cardinality and referential integrity. As
much as databases are heterogeneous, their schema representations are equally heterogeneous,
making the process of mapping across schemata a manual task. The mapping process looks at
data elements described in the schema to determine how and which data elements should be
transformed into the source schema. An example is given in Figure 2.10, showing the mapping
between two different schema structures. The first step is the comparison of the source schema
to the corresponding destination/global schema. In the example given, we can map Style
to Genre, Band to Artist and so on. These are semantic correspondences between the two
schemata. In many cases the mapping is clear through, however, cases such as Track and Title
could be tricky given only this level of metadata. Quite often it is necessary to look at data
items, for example, Track could equally map to Name or Title. However, if it turned out that
tracks in this case are numbers (e.g. Track 1) it would not map to any of the items in the global
schema. Only by looking at data items may data elements become obvious. The example also
highlights missing data in the local schema, and a possible amalgamated element in Band and
Producer which together could correspond to Artist.
Identifying these semantic correspondences is almost entirely a manual task, sometimes even
requiring domain experts to perform the matching. New research is attempting to automate
this (Saleem et al., 2008)) Since the next step, data integration, is fundamentally built on these
mappings it is particularly important that this step is expertly completed.
2.5.3.2 Data Transformation
The semantic mappings from the previous step are used to write the relevant code (SQL) to
transform and transfer the data into the global schema. Given the examples in Figure 2.10, if
42
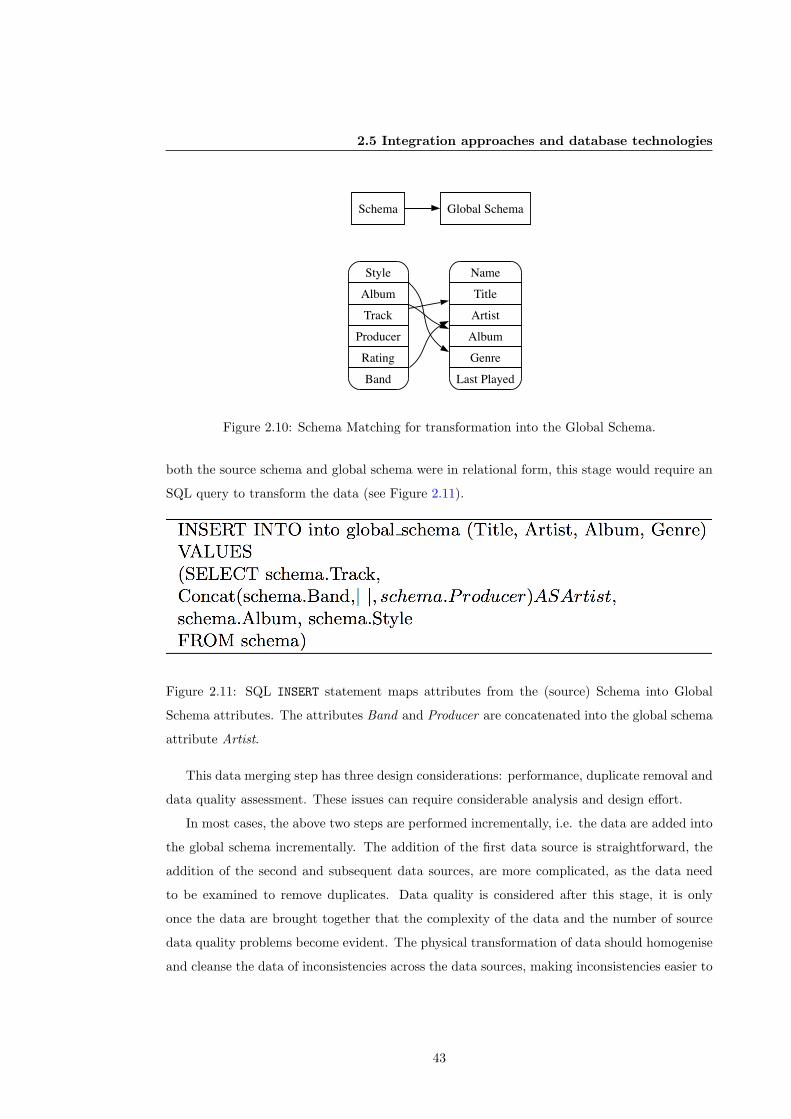
2.5 Integration approaches and database technologies
Name
Title
Artist
Album
Genre
Last Played
Schema Global Schema
Style
Album
Track
Producer
Rating
Band
Figure 2.10: Schema Matching for transformation into the Global Schema.
both the source schema and global schema were in relational form, this stage would require an
SQL query to transform the data (see Figure 2.11).
Figure 2.11: SQL INSERT statement maps attributes from the (source) Schema into Global
Schema attributes. The attributes Band and Producer are concatenated into the global schema
attribute Artist.
This data merging step has three design considerations: performance, duplicate removal and
data quality assessment. These issues can require considerable analysis and design effort.
In most cases, the above two steps are performed incrementally, i.e. the data are added into
the global schema incrementally. The addition of the first data source is straightforward, the
addition of the second and subsequent data sources, are more complicated, as the data need
to be examined to remove duplicates. Data quality is considered after this stage, it is only
once the data are brought together that the complexity of the data and the number of source
data quality problems become evident. The physical transformation of data should homogenise
and cleanse the data of inconsistencies across the data sources, making inconsistencies easier to
43
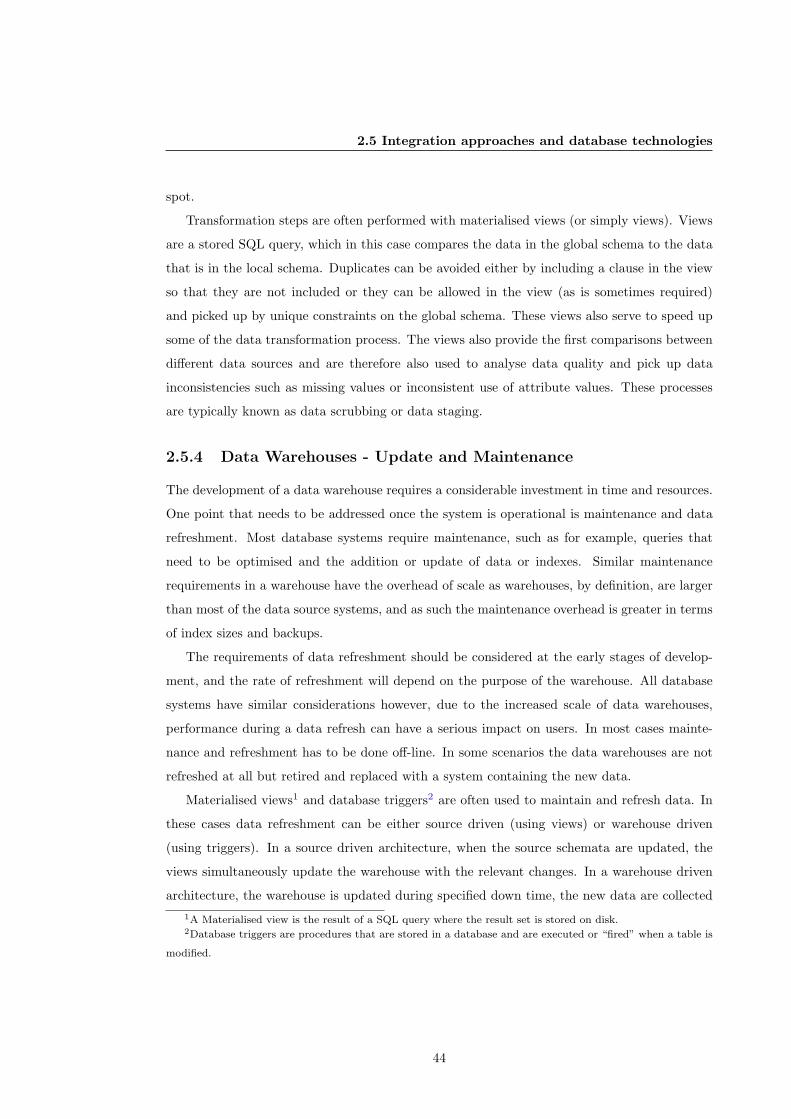
2.5 Integration approaches and database technologies
spot.
Transformation steps are often performed with materialised views (or simply views). Views
are a stored SQL query, which in this case compares the data in the global schema to the data
that is in the local schema. Duplicates can be avoided either by including a clause in the view
so that they are not included or they can be allowed in the view (as is sometimes required)
and picked up by unique constraints on the global schema. These views also serve to speed up
some of the data transformation process. The views also provide the first comparisons between
different data sources and are therefore also used to analyse data quality and pick up data
inconsistencies such as missing values or inconsistent use of attribute values. These processes
are typically known as data scrubbing or data staging.
2.5.4 Data Warehouses - Update and Maintenance
The development of a data warehouse requires a considerable investment in time and resources.
One point that needs to be addressed once the system is operational is maintenance and data
refreshment. Most database systems require maintenance, such as for example, queries that
need to be optimised and the addition or update of data or indexes. Similar maintenance
requirements in a warehouse have the overhead of scale as warehouses, by definition, are larger
than most of the data source systems, and as such the maintenance overhead is greater in terms
of index sizes and backups.
The requirements of data refreshment should be considered at the early stages of develop-
ment, and the rate of refreshment will depend on the purpose of the warehouse. All database
systems have similar considerations however, due to the increased scale of data warehouses,
performance during a data refresh can have a serious impact on users. In most cases mainte-
nance and refreshment has to be done off-line. In some scenarios the data warehouses are not
refreshed at all but retired and replaced with a system containing the new data.
Materialised views1 and database triggers2 are often used to maintain and refresh data. In
these cases data refreshment can be either source driven (using views) or warehouse driven
(using triggers). In a source driven architecture, when the source schemata are updated, the
views simultaneously update the warehouse with the relevant changes. In a warehouse driven
architecture, the warehouse is updated during specified down time, the new data are collected1A Materialised view is the result of a SQL query where the result set is stored on disk.2Database triggers are procedures that are stored in a database and are executed or “fired” when a table is
modified.
44
2.5 Integration approaches and database technologies
into log tables and a trigger is fired once these tables reach a certain point (size or time driven).
Clearly source driven refreshment has advantages, however, performance remains an issue and
most databases can be refreshed more efficiently when they are taken off-line.
An alternative approach to data warehousing uses web services to facilitate cross-database
queries. This mediated approach has also been successfully deployed for taxonomy (Page, 2005).
In this system a user’s query is captured by a mediating script (wrapper), which translates the
query to the various data sources and returns the results to the user. The major advantage
is that users have access to the most up-to-date data. Each source is mapped and the query
mechanism is coded into a wrapper so that the user accesses each source through a uniform
query interface. What can be delivered though are only those queries supported by each indi-
vidual system. The warehouse approach has this additional advantage; the flexibility of data
manipulation during transfer, and the ability to effectively query combined data as a unit. The
warehouse approach is also more commonly used when data mining and cleaning are a necessary
part of data integration.
2.5.5 Warehousing Taxonomic Data
As more and more taxonomic data becomes available to the wider user community, focus
is beginning to shift towards understanding the distribution and quality of taxonomic data
(Chavan et al., 2005; Embury et al., 2001). Data accuracy, consistency and completeness are
issues the taxonomic community are beginning to address (Chapman, 2005a,b). By reconciling
taxonomic data, we can begin to understand the quality of the data currently available and
deliver more information to our user communities.
There is considerable benefit in combining and merging these taxonomic data sources. Aside
from providing a single point of entry to taxonomic data, integrated data sources enable us to
determine and understand data quality. Taxonomic names combined from several data sources
into a common structure can be compared and verified against each other to identify inaccurate,
inconsistent and incomplete data. Uncovering these data quality metrics (Fox et al., 1994; Wang
et al., 1995) gives users the ability to understand and therefore use their data better. It can
also be used to identify data that require cleaning or complete taxonomic review.
Integrated Taxonomic Information System (ITIS, 2006), the Universal Biological Indexer
and Organizer (uBio, 2006) and Species 2000 (Bisby & Smith, 2000) were each built for specific
user communities. The Sp2000 project provides federated taxonomic data and performs excep-
tionally well for the purposes and scope for which it was built. The problem arises for users
45
2.6 Summary
who wish to use the data beyond this scope, for example, Sp2000 does not support the ability
to search the individual data sources from which data are collected hierarchically, because it
does not store the classifications from each of the data sources. uBio provides, at the moment,
possibly the best taxonomic name search facility. These queries can be automated and inte-
grated into other systems (Page, 2005) through their web services interface. However, the data
they provide can not be downloaded into other databases, for example, a phylogenetic database.
ITIS, which also compiles data from other data sources, carefully curate each datum they ac-
quire and provide users with a single conservative view of each name. It is however, biased
in data scope. Similarly, the NCBI (Federhen et.al, 2005) taxonomy is another excellent data
source but biased reflecting only those organisms for which nucleotide or amino acid sequence
information is available. There are many more examples of databases, each developed to meet
specific user requirements (Deprez et al., 2004). As a result taxonomy now has an enormous
web presence yet none of these taxonomic data sources meet the requirements of TreeBASE as
outlined.
The number of online taxonomic resources has now made it easier to collate taxonomic
information (Bisby et al., 2002; Gewin, 2002). “Data Warehouse” technology enables data to
be brought together, integrated and transformed into a common structure. This increases the
accessibility of the data to wider audiences by remodelling the data for their specific require-
ments. Generally, the source systems are designed for experts in the field, leaving non-experts
put off by the interfaces and the overwhelming quantity of data. In most cases this remodelling
simplifies data, making it accessible to non expert users and used outside its’ original design
scope. This thesis goes on to outline the development of a taxonomic data source for Tree-
BASE, the Taxonomy and Classification Database (TCl-Db). In the warehouse architecture of
TCl-Db, data from several taxonomic data sources are replicated and maintained in a common
structure, increasing data coverage and adding links across the data sets. The data in TCl-Db
is also transformed to enable hierarchical queries.
2.6 Summary
This chapter gives an overview of the complexities of taxonomic data. Regular changes to biolog-
ical taxonomy result in name changes, synonyms, homonyms and many classificatory opinions.
As a result biological taxonomy cannot be used as an information retrieval system. It is par-
ticular difficult to use taxon names to retrieve data. Even though many taxonomic database
46
2.6 Summary
exist and these problems are being addressed, currently, the taxonomic requirements of the
systematics community are not well supported. TreeBASE does not contain an adequate tax-
onomic infrastructure that supports taxonomically intelligent queries for data retrieval. Given
the large number of online taxonomic database and the benefits provided by data integration,
a data warehouse approach to resolving the taxonomic deficiencies of TreeBASE forms an ideal
solution.
The following chapter details the design and implementation of TCl-Db. Taxon names and
classifications from several data sources are combined into one queriable structure that supports
expansion of vernacular, synonym and higher taxa query terms.
47
Chapter 3
Database Design and
Implementation
The previous Chapter detailed the requirements for a taxonomic infrastructure for TreeBASE.
This Chapter outlines the database structure of TCl-Db, the database that was built to meet
those requirements.
3.1 Introduction
The taxonomic requirements of TreeBASE, and particularly the need to support of informa-
tion retrieval, prompted the development of TCl-Db, a data warehouse of taxonomic names
and classifications. Currently, no taxonomic database meets the requirements of the systemat-
ics/tree building community with respect to data coverage of taxon names and classifications.
TCl-Db facilitates broader access to taxonomic data, beyond its expert community, through
an integrated view of taxonomic data. The database structure enables the types of queries the
systematics community would expect to perform. These queries are: hierarchical queries (the
use of higher taxa names as the search term with the full classification below that term returned
in the result set); and queries such as synonyms and vernaculars that expand to related terms.
TCl-Db uses a data warehouse approach to perform taxonomic data integration. In a data
warehouse, the data are gathered from multiple sources and collated into a single structure.
This approach is particularly useful to the systematics community, since it not only addresses
the issue of data scope, but is also scalable and highly configurable, allowing data to be re-
48
3.2 Requirements
structured to enable specific requirements. These requirements are outlined in this chapter.
The architecture of the TCl-Db data warehouse, the databases that contributed data, and the
global schema structure developed to hold the integrated data are described.
3.2 Requirements
3.2.1 Data Retrieval
When querying a database system the results returned are those data that satisfy the given
query. This is referred to as data retrieval and in relational database systems it is accom-
plished by the query language SQL. Given well defined structure and semantics, a well formed
query will return exactly those data that satisfy that query. In information retrieval, ideally,
a given query is understood by the system, there is an element of interpretation through related
terms or categorised topics (Fast et al., 2002). The query does not have to be exact and the
data returned is not that which matches the query but that which is relevant to the query. For
example, a search through the TreeBASE data using a query on the vernacular term “Song
Sparrow” will return data that matches that term exactly. Such a query will not return data
including associated terms i.e., the scientific name Melospiza melodia. The database structure
and data content of TreeBASE will only return data for a query if that data exists. If, for
example, the term “Song Sparrow” exists, data will be returned, however, the data attached
to Melospiza melodia will not. Inherently, a biologist is really talking about Melospiza melodia
when he uses the vernacular “Song Sparrow” therefore, these users would expect the query to
include both terms. In most cases it is also expected that a hierarchical query, a query using a
higher taxon name, would return not just the data associated with that string but all relevant
data, including subordinates of that taxon. Hierarchical queries are commonly used in “drill
down” searches through generalised terms and as such play a valuable role in information re-
trieval. Currently, TreeBASE performs only data retrieval. The database was built specifically
to enable effective taxonomic queries through TreeBASE through query expansion.
Hierarchical Queries
The hierarchical structure of taxonomic data is instinctively recognisable. A biologist can recog-
nise a taxon name simply by its structure or its name ending. This organisational structure was
originally designed to enable biologists to commit the data to memory (Cain, 1959) and enable
49
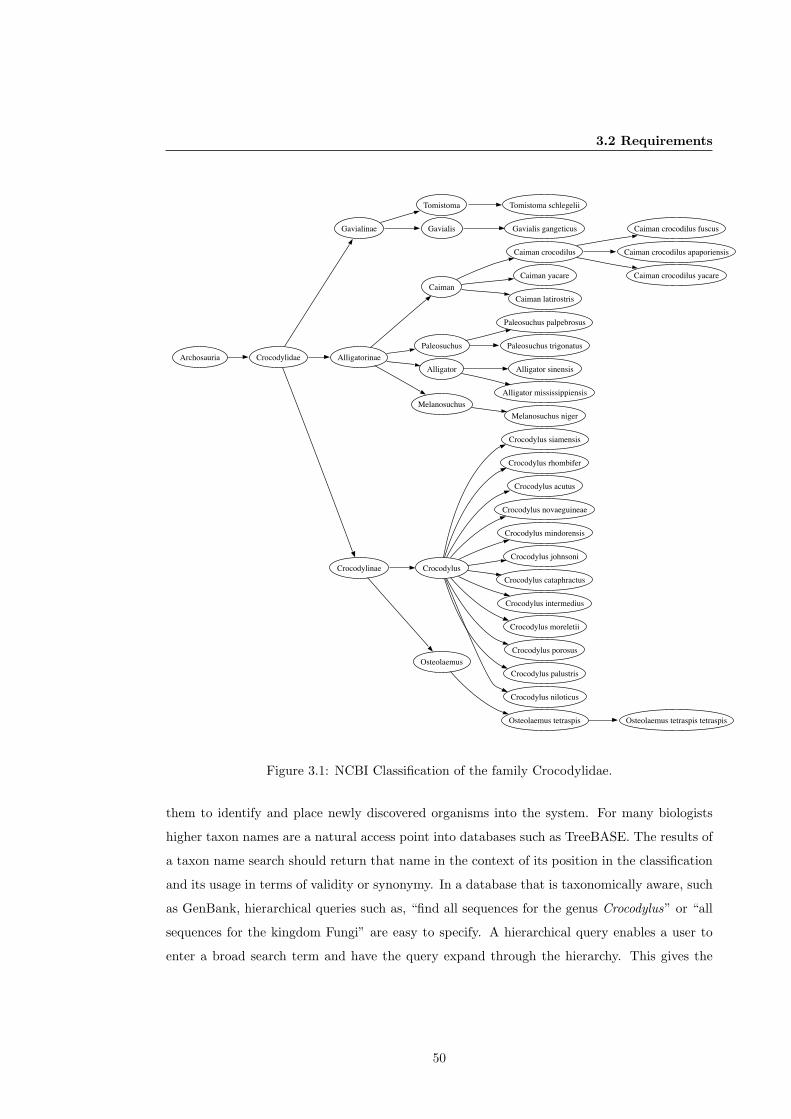
3.2 Requirements
Tomistoma Tomistoma schlegelii
Crocodylus
Crocodylus siamensis
Crocodylus rhombifer
Crocodylus acutus
Crocodylus novaeguineae
Crocodylus mindorensis
Crocodylus johnsoni
Crocodylus cataphractus
Crocodylus intermedius
Crocodylus moreletii
Crocodylus porosus
Crocodylus palustris
Crocodylus niloticus
Caiman
Caiman crocodilus
Caiman yacare
Caiman latirostris
Caiman crocodilus fuscus
Caiman crocodilus apaporiensis
Caiman crocodilus yacare
Gavialinae Gavialis
Paleosuchus
Paleosuchus palpebrosus
Paleosuchus trigonatusAlligatorinae
Alligator
Melanosuchus
Alligator sinensis
Alligator mississippiensis
Crocodylidae
Crocodylinae
Osteolaemus
Gavialis gangeticus
Archosauria
Melanosuchus niger
Osteolaemus tetraspis Osteolaemus tetraspis tetraspis
Figure 3.1: NCBI Classification of the family Crocodylidae.
them to identify and place newly discovered organisms into the system. For many biologists
higher taxon names are a natural access point into databases such as TreeBASE. The results of
a taxon name search should return that name in the context of its position in the classification
and its usage in terms of validity or synonymy. In a database that is taxonomically aware, such
as GenBank, hierarchical queries such as, “find all sequences for the genus Crocodylus” or “all
sequences for the kingdom Fungi” are easy to specify. A hierarchical query enables a user to
enter a broad search term and have the query expand through the hierarchy. This gives the
50
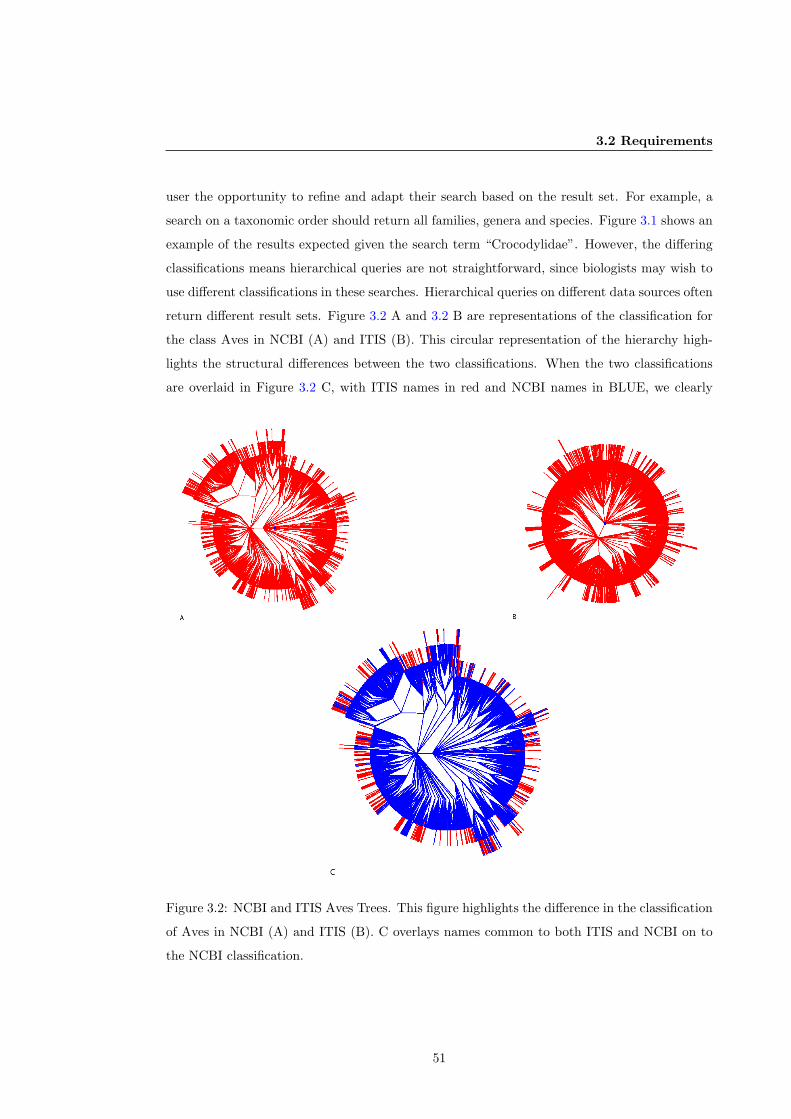
3.2 Requirements
user the opportunity to refine and adapt their search based on the result set. For example, a
search on a taxonomic order should return all families, genera and species. Figure 3.1 shows an
example of the results expected given the search term “Crocodylidae”. However, the differing
classifications means hierarchical queries are not straightforward, since biologists may wish to
use different classifications in these searches. Hierarchical queries on different data sources often
return different result sets. Figure 3.2 A and 3.2 B are representations of the classification for
the class Aves in NCBI (A) and ITIS (B). This circular representation of the hierarchy high-
lights the structural differences between the two classifications. When the two classifications
are overlaid in Figure 3.2 C, with ITIS names in red and NCBI names in BLUE, we clearly
Figure 3.2: NCBI and ITIS Aves Trees. This figure highlights the difference in the classification
of Aves in NCBI (A) and ITIS (B). C overlays names common to both ITIS and NCBI on to
the NCBI classification.
51
3.2 Requirements
see little overlap above the leaf nodes. Considering these different classification opinions it
would be inappropriate to impose one classification on users. Therefore, a part of the design
criteria of TCl-Db was to give users a choice of classification. This was also timely since most
other taxonomic database amalgamations such as uBio and Sp2000 were focusing on gathering
names and building global checklists rather than the classifications. uBio extended their remit
to classifications.
Supporting Query Expansion for Synonyms and Vernaculars
The intertwining of names into the hierarchical structure has an adverse side effect when things
change or are moved. The taxonomic system is in constant flux as new organisms are discovered
and introduced into the hierarchy (Froese et al., 1990), which often results in the movement of
names in the hierarchy to accommodate additions and the subsequent changes to the names to
fit into the new rank, as outlined in the previous chapter. Data additions that cause changes
to the classification can be particularly severe since those changes have a rippling effect on the
data below it. Where hierarchical data structures fail is in the lack of data management, as
there is no mechanism to manage and share changes and additions to classifications provided
by the expert (Froese et al., 1990). As a result, data can be misused by users who continue
to use those names they are aware of. For example, a user conducting a search with the term
Phoebastria albatrus may not be aware that there are other names associated with that organism
i.e., the synonym Diomedea albatrus and the vernacular “Short-tailed albatross” (Figure 3.3).
Therefore, explicit in the user requirements is the ability to expand queries to include associated
terms. Synonym and vernacular queries terms and their Latin names should be linked, so that
queries can expand to include data associated with the linked terms. In a search interface a
user may then enter either one of the above names as a search term, with the same result set
returned.
Data coverage
The differences in classification between ITIS and NCBI have already been highlighted, how-
ever, these databases also differ significantly in data coverage, as shown in detail in Chapter 5.
Particularly obvious differences are the coverage of data in bacteria and fungi where molecular
data has played a much greater role in discovery and identification. In order to effectively use
taxonomic data as search terms, the systematics community require an integrated global view
of taxonomy that covers the breadth of available taxonomic data.
52
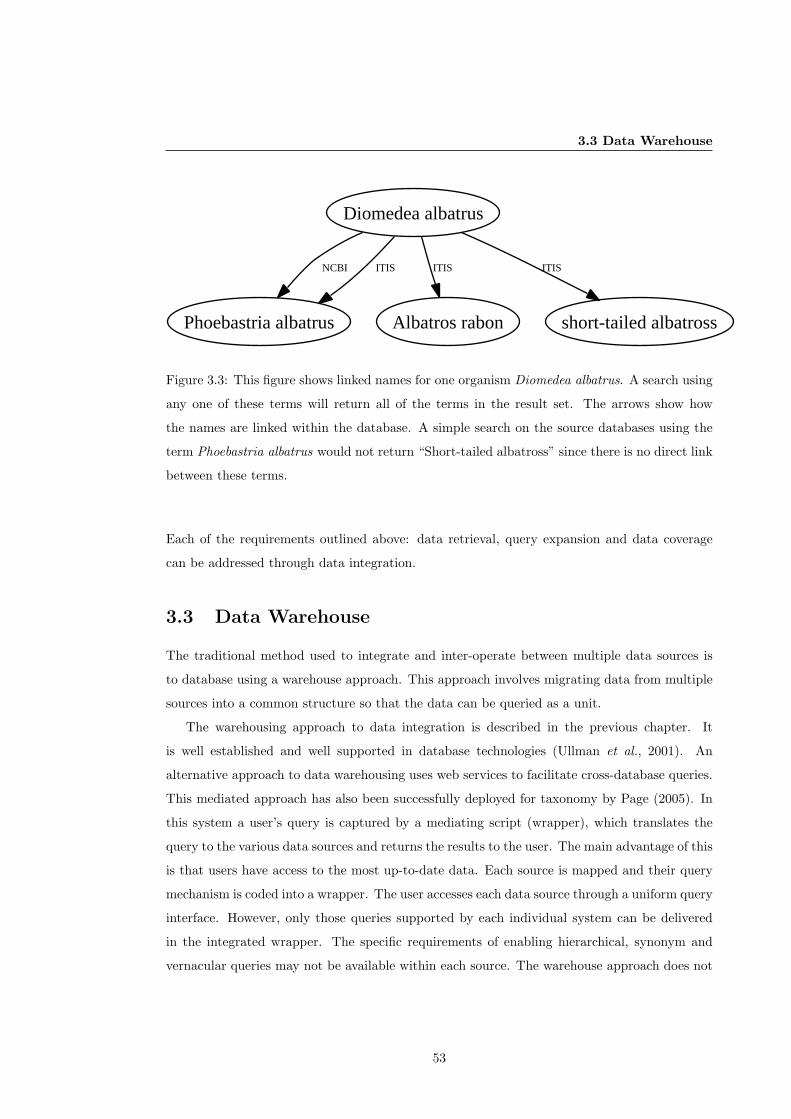
3.3 Data Warehouse
Diomedea albatrus
Phoebastria albatrus
NCBI ITIS
Albatros rabon
ITIS
short-tailed albatross
ITIS
Figure 3.3: This figure shows linked names for one organism Diomedea albatrus. A search using
any one of these terms will return all of the terms in the result set. The arrows show how
the names are linked within the database. A simple search on the source databases using the
term Phoebastria albatrus would not return “Short-tailed albatross” since there is no direct link
between these terms.
Each of the requirements outlined above: data retrieval, query expansion and data coverage
can be addressed through data integration.
3.3 Data Warehouse
The traditional method used to integrate and inter-operate between multiple data sources is
to database using a warehouse approach. This approach involves migrating data from multiple
sources into a common structure so that the data can be queried as a unit.
The warehousing approach to data integration is described in the previous chapter. It
is well established and well supported in database technologies (Ullman et al., 2001). An
alternative approach to data warehousing uses web services to facilitate cross-database queries.
This mediated approach has also been successfully deployed for taxonomy by Page (2005). In
this system a user’s query is captured by a mediating script (wrapper), which translates the
query to the various data sources and returns the results to the user. The main advantage of this
is that users have access to the most up-to-date data. Each source is mapped and their query
mechanism is coded into a wrapper. The user accesses each data source through a uniform query
interface. However, only those queries supported by each individual system can be delivered
in the integrated wrapper. The specific requirements of enabling hierarchical, synonym and
vernacular queries may not be available within each source. The warehouse approach does not
53
3.4 Modelling hierarchical data
have this disadvantage. In fact, it offers the flexibility of data manipulation during transfer,
and the ability to effectively query combined data as a unit. The warehouse approach is also
more commonly used when data mining and cleaning are a necessary part of data integration.
The advantage from our perspective is that during data migration data can be restructured to
enable specific user requirements. The disadvantage, however, is that this approach replicates
data, as keeping data up-to-date adds a significant overhead to managing the system.
Given the requirements outlined above and specified in Section 2.4.3, data integration using
a loose federated system would be insufficient. In loosely federated systems the data sources
remain autonomous and maintain control over the structure of the data. Therefore, as a fed-
eration the data can not be transformed effectively to enable hierarchical queries. However,
a materialised data warehouse copies data locally. This enables data re-modelling to support
hierarchical queries and the ability to build new data structures to enable query expansion.
Additional advantages offered through a materialised approach are reliability and scalability.
This is of particular importance since this system is envisaged to apply to secondary databases
such as TreeBASE. A materialised data warehouse approach was deemed most appropriate to
meet the requirements laid out. This would be built using a RDBMS. We were faced with
two choices of RDBMS: MySQL (MySQL, 2006), open source and distributed under the GPL
License, and Oracle (Oracle, 2006) which requires a license but is free to academics for teaching
and research. Since data can be ported across relational systems with relative ease, the deci-
sion was ultimately based on which system provided the best tools for development and which
system would deal better with the requirement of hierarchical queries.
3.4 Modelling hierarchical data
A hierarchy is an organisational model in which the highest level of organisation consists of a
single entity. An entity at a lower level of organisation is related to only one entity at the next
higher level but can be related to more than one entity at the next lower level. Entities at all
lower levels are related by extension to the single entity at the highest level of organisation.
Biological taxonomy is a containment hierarchy in which a set at one level contains all the sets
below it. For example, a family is a superset of all the genera and species contained in that
family.
Relational databases in general do not handle hierarchical data very well, especially recursive
queries through hierarchical data. Two solutions are Nested sets and Materialised paths (Celko,
54
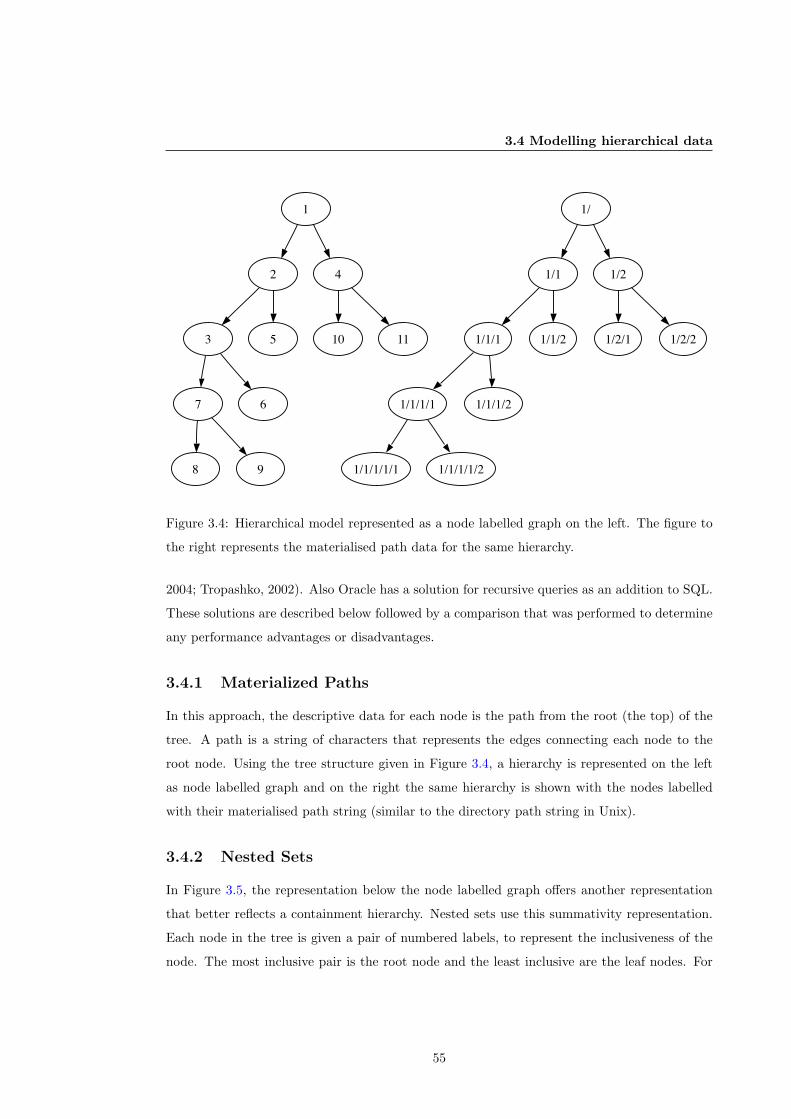
3.4 Modelling hierarchical data
1
2 4
3 5 10 11
7 6
8 9
1/
1/1 1/2
1/1/1 1/1/2 1/2/1 1/2/2
1/1/1/1 1/1/1/2
1/1/1/1/1 1/1/1/1/2
Figure 3.4: Hierarchical model represented as a node labelled graph on the left. The figure to
the right represents the materialised path data for the same hierarchy.
2004; Tropashko, 2002). Also Oracle has a solution for recursive queries as an addition to SQL.
These solutions are described below followed by a comparison that was performed to determine
any performance advantages or disadvantages.
3.4.1 Materialized Paths
In this approach, the descriptive data for each node is the path from the root (the top) of the
tree. A path is a string of characters that represents the edges connecting each node to the
root node. Using the tree structure given in Figure 3.4, a hierarchy is represented on the left
as node labelled graph and on the right the same hierarchy is shown with the nodes labelled
with their materialised path string (similar to the directory path string in Unix).
3.4.2 Nested Sets
In Figure 3.5, the representation below the node labelled graph offers another representation
that better reflects a containment hierarchy. Nested sets use this summativity representation.
Each node in the tree is given a pair of numbered labels, to represent the inclusiveness of the
node. The most inclusive pair is the root node and the least inclusive are the leaf nodes. For
55
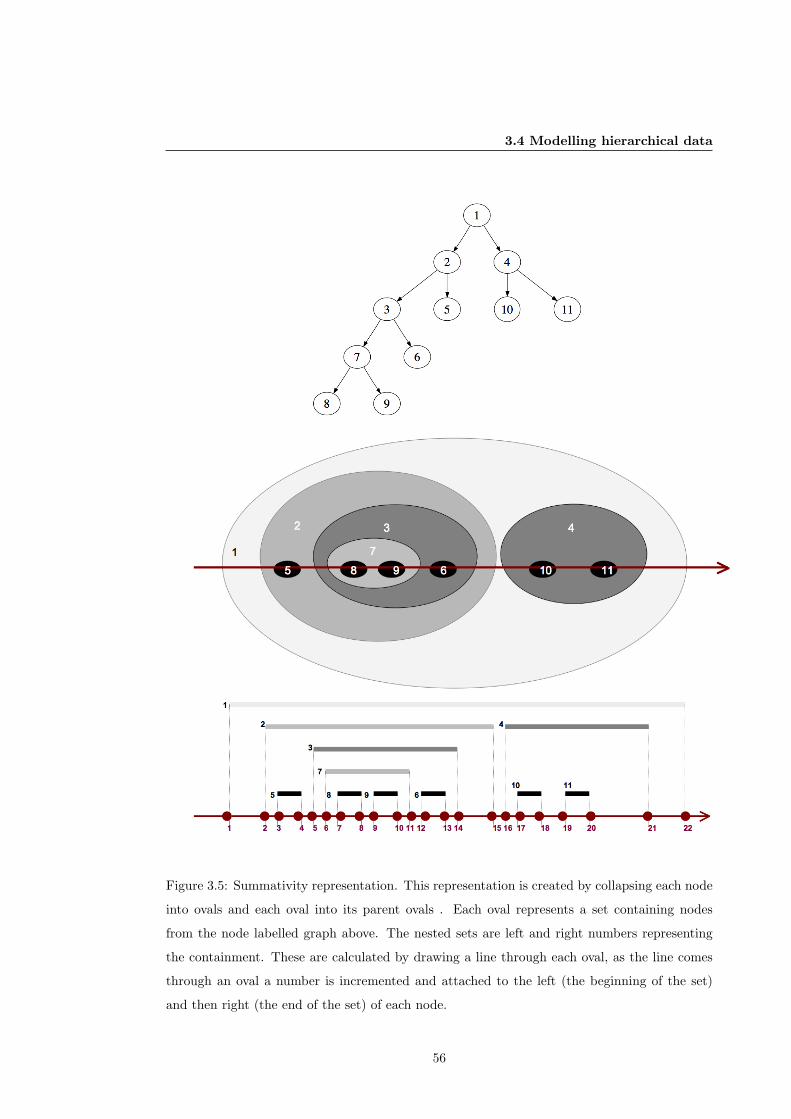
3.4 Modelling hierarchical data
Figure 3.5: Summativity representation. This representation is created by collapsing each node
into ovals and each oval into its parent ovals . Each oval represents a set containing nodes
from the node labelled graph above. The nested sets are left and right numbers representing
the containment. These are calculated by drawing a line through each oval, as the line comes
through an oval a number is incremented and attached to the left (the beginning of the set)
and then right (the end of the set) of each node.
56
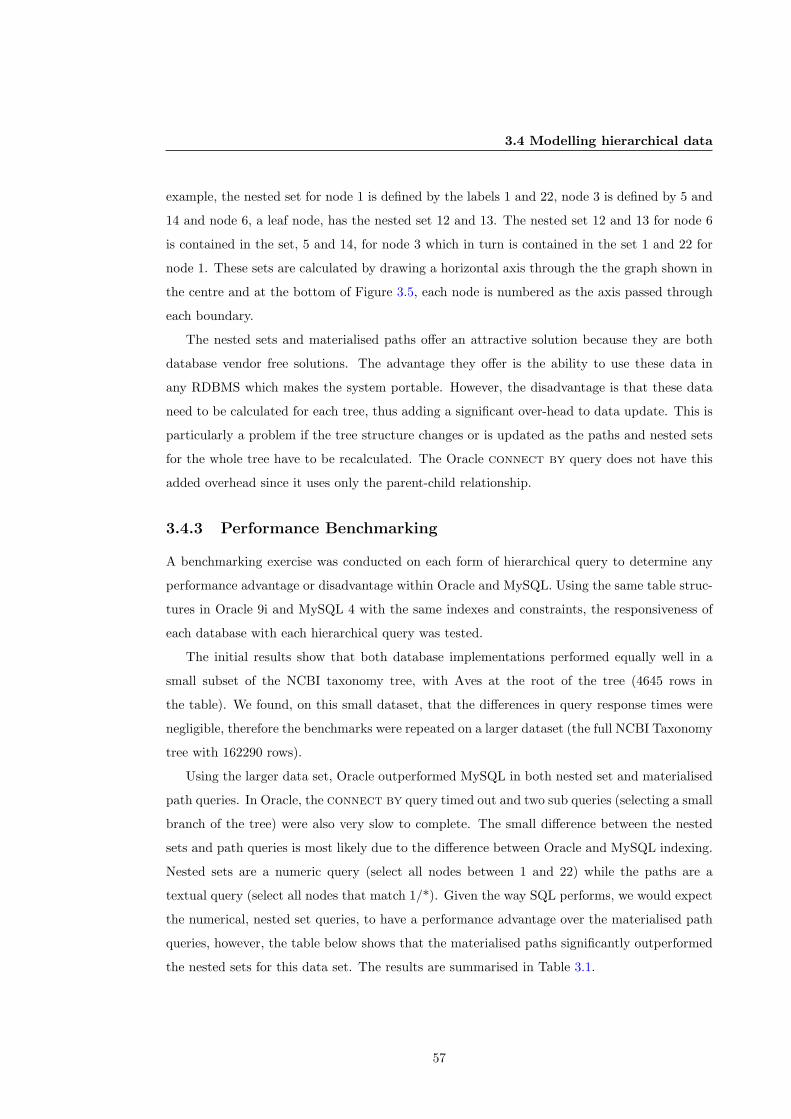
3.4 Modelling hierarchical data
example, the nested set for node 1 is defined by the labels 1 and 22, node 3 is defined by 5 and
14 and node 6, a leaf node, has the nested set 12 and 13. The nested set 12 and 13 for node 6
is contained in the set, 5 and 14, for node 3 which in turn is contained in the set 1 and 22 for
node 1. These sets are calculated by drawing a horizontal axis through the the graph shown in
the centre and at the bottom of Figure 3.5, each node is numbered as the axis passed through
each boundary.
The nested sets and materialised paths offer an attractive solution because they are both
database vendor free solutions. The advantage they offer is the ability to use these data in
any RDBMS which makes the system portable. However, the disadvantage is that these data
need to be calculated for each tree, thus adding a significant over-head to data update. This is
particularly a problem if the tree structure changes or is updated as the paths and nested sets
for the whole tree have to be recalculated. The Oracle connect by query does not have this
added overhead since it uses only the parent-child relationship.
3.4.3 Performance Benchmarking
A benchmarking exercise was conducted on each form of hierarchical query to determine any
performance advantage or disadvantage within Oracle and MySQL. Using the same table struc-
tures in Oracle 9i and MySQL 4 with the same indexes and constraints, the responsiveness of
each database with each hierarchical query was tested.
The initial results show that both database implementations performed equally well in a
small subset of the NCBI taxonomy tree, with Aves at the root of the tree (4645 rows in
the table). We found, on this small dataset, that the differences in query response times were
negligible, therefore the benchmarks were repeated on a larger dataset (the full NCBI Taxonomy
tree with 162290 rows).
Using the larger data set, Oracle outperformed MySQL in both nested set and materialised
path queries. In Oracle, the connect by query timed out and two sub queries (selecting a small
branch of the tree) were also very slow to complete. The small difference between the nested
sets and path queries is most likely due to the difference between Oracle and MySQL indexing.
Nested sets are a numeric query (select all nodes between 1 and 22) while the paths are a
textual query (select all nodes that match 1/*). Given the way SQL performs, we would expect
the numerical, nested set queries, to have a performance advantage over the materialised path
queries, however, the table below shows that the materialised paths significantly outperformed
the nested sets for this data set. The results are summarised in Table 3.1.
57
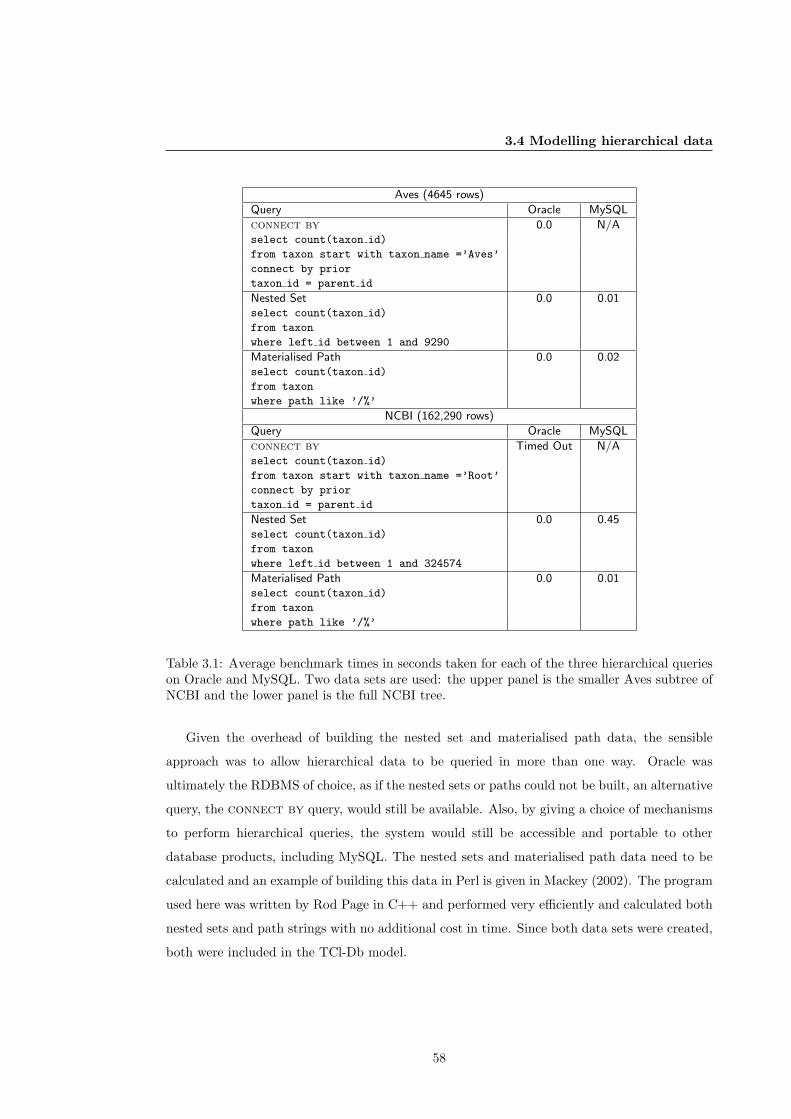
3.4 Modelling hierarchical data
Aves (4645 rows)
Query Oracle MySQL
connect by 0.0 N/Aselect count(taxon id)
from taxon start with taxon name =’Aves’
connect by prior
taxon id = parent id
Nested Set 0.0 0.01select count(taxon id)
from taxon
where left id between 1 and 9290
Materialised Path 0.0 0.02select count(taxon id)
from taxon
where path like ’/%’
NCBI (162,290 rows)
Query Oracle MySQL
connect by Timed Out N/Aselect count(taxon id)
from taxon start with taxon name =’Root’
connect by prior
taxon id = parent id
Nested Set 0.0 0.45select count(taxon id)
from taxon
where left id between 1 and 324574
Materialised Path 0.0 0.01select count(taxon id)
from taxon
where path like ’/%’
Table 3.1: Average benchmark times in seconds taken for each of the three hierarchical querieson Oracle and MySQL. Two data sets are used: the upper panel is the smaller Aves subtree ofNCBI and the lower panel is the full NCBI tree.
Given the overhead of building the nested set and materialised path data, the sensible
approach was to allow hierarchical data to be queried in more than one way. Oracle was
ultimately the RDBMS of choice, as if the nested sets or paths could not be built, an alternative
query, the connect by query, would still be available. Also, by giving a choice of mechanisms
to perform hierarchical queries, the system would still be accessible and portable to other
database products, including MySQL. The nested sets and materialised path data need to be
calculated and an example of building this data in Perl is given in Mackey (2002). The program
used here was written by Rod Page in C++ and performed very efficiently and calculated both
nested sets and path strings with no additional cost in time. Since both data sets were created,
both were included in the TCl-Db model.
58
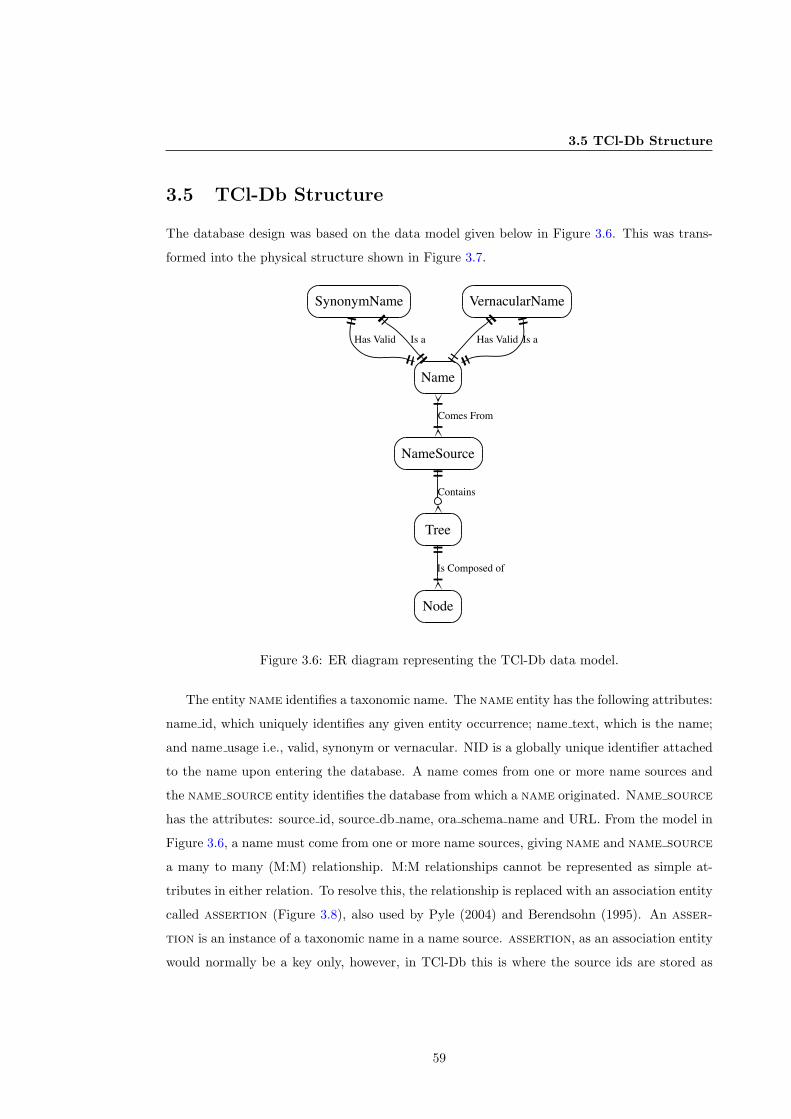
3.5 TCl-Db Structure
3.5 TCl-Db Structure
The database design was based on the data model given below in Figure 3.6. This was trans-
formed into the physical structure shown in Figure 3.7.
Name
NameSource
Comes From
Node
SynonymName
Has Valid Is a
VernacularName
Has Valid Is a
Tree
Contains
Is Composed of
Figure 3.6: ER diagram representing the TCl-Db data model.
The entity name identifies a taxonomic name. The name entity has the following attributes:
name id, which uniquely identifies any given entity occurrence; name text, which is the name;
and name usage i.e., valid, synonym or vernacular. NID is a globally unique identifier attached
to the name upon entering the database. A name comes from one or more name sources and
the name source entity identifies the database from which a name originated. Name source
has the attributes: source id, source db name, ora schema name and URL. From the model in
Figure 3.6, a name must come from one or more name sources, giving name and name source
a many to many (M:M) relationship. M:M relationships cannot be represented as simple at-
tributes in either relation. To resolve this, the relationship is replaced with an association entity
called assertion (Figure 3.8), also used by Pyle (2004) and Berendsohn (1995). An asser-
tion is an instance of a taxonomic name in a name source. assertion, as an association entity
would normally be a key only, however, in TCl-Db this is where the source ids are stored as
59
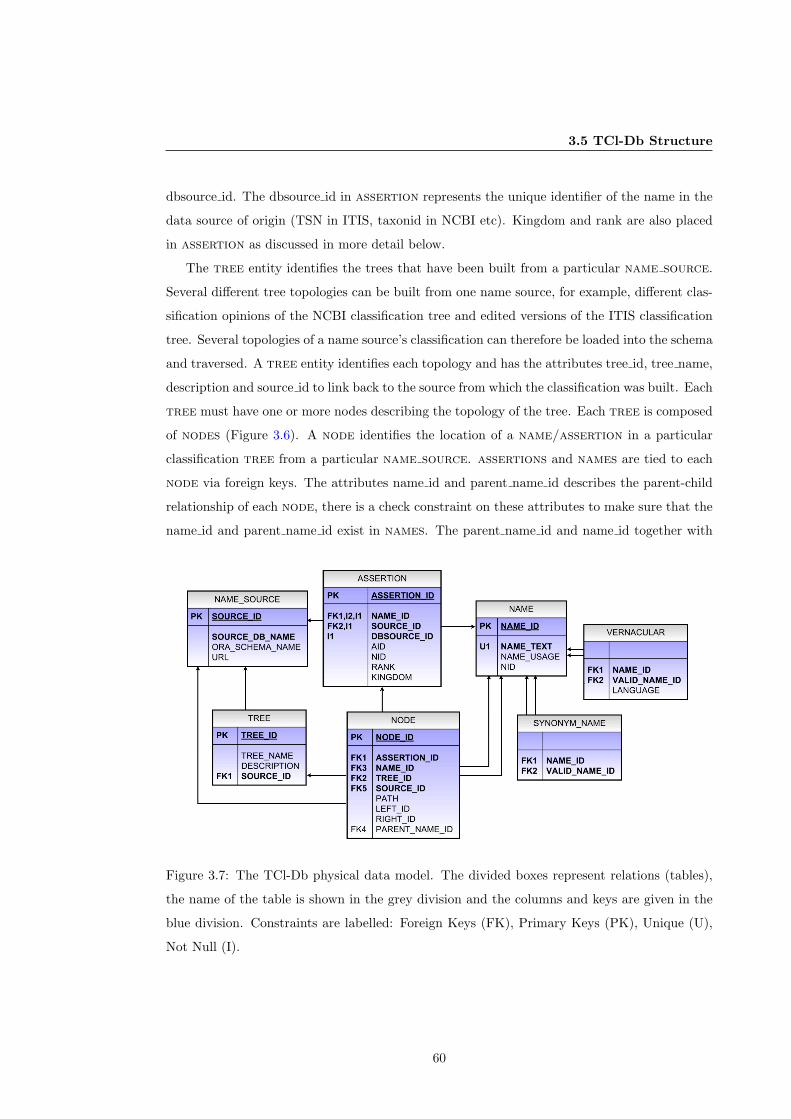
3.5 TCl-Db Structure
dbsource id. The dbsource id in assertion represents the unique identifier of the name in the
data source of origin (TSN in ITIS, taxonid in NCBI etc). Kingdom and rank are also placed
in assertion as discussed in more detail below.
The tree entity identifies the trees that have been built from a particular name source.
Several different tree topologies can be built from one name source, for example, different clas-
sification opinions of the NCBI classification tree and edited versions of the ITIS classification
tree. Several topologies of a name source’s classification can therefore be loaded into the schema
and traversed. A tree entity identifies each topology and has the attributes tree id, tree name,
description and source id to link back to the source from which the classification was built. Each
tree must have one or more nodes describing the topology of the tree. Each tree is composed
of nodes (Figure 3.6). A node identifies the location of a name/assertion in a particular
classification tree from a particular name source. assertions and names are tied to each
node via foreign keys. The attributes name id and parent name id describes the parent-child
relationship of each node, there is a check constraint on these attributes to make sure that the
name id and parent name id exist in names. The parent name id and name id together with
Figure 3.7: The TCl-Db physical data model. The divided boxes represent relations (tables),
the name of the table is shown in the grey division and the columns and keys are given in the
blue division. Constraints are labelled: Foreign Keys (FK), Primary Keys (PK), Unique (U),
Not Null (I).
60
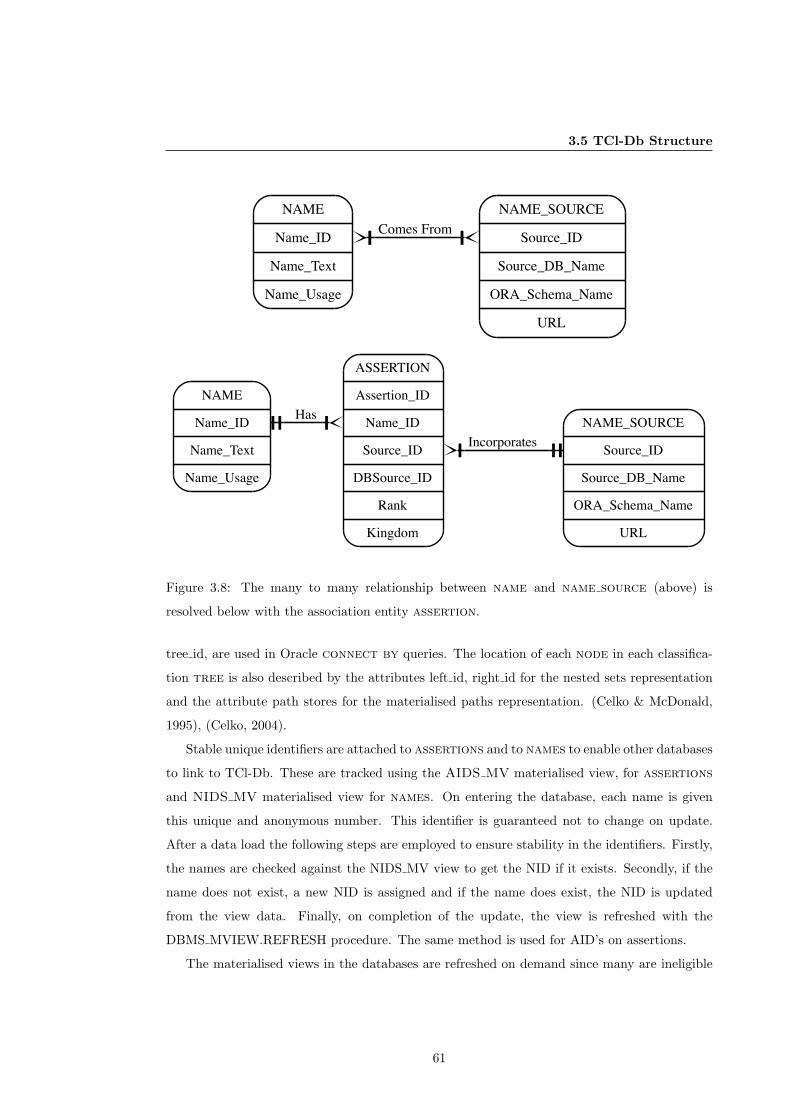
3.5 TCl-Db Structure
NAME
Name_ID
Name_Text
Name_Usage
NAME_SOURCE
Source_ID
Source_DB_Name
ORA_Schema_Name
URL
Comes From
NAME
Name_ID
Name_Text
Name_Usage
ASSERTION
Assertion_ID
Name_ID
Source_ID
DBSource_ID
Rank
Kingdom
Has NAME_SOURCE
Source_ID
Source_DB_Name
ORA_Schema_Name
URL
Incorporates
Figure 3.8: The many to many relationship between name and name source (above) is
resolved below with the association entity assertion.
tree id, are used in Oracle connect by queries. The location of each node in each classifica-
tion tree is also described by the attributes left id, right id for the nested sets representation
and the attribute path stores for the materialised paths representation. (Celko & McDonald,
1995), (Celko, 2004).
Stable unique identifiers are attached to assertions and to names to enable other databases
to link to TCl-Db. These are tracked using the AIDS MV materialised view, for assertions
and NIDS MV materialised view for names. On entering the database, each name is given
this unique and anonymous number. This identifier is guaranteed not to change on update.
After a data load the following steps are employed to ensure stability in the identifiers. Firstly,
the names are checked against the NIDS MV view to get the NID if it exists. Secondly, if the
name does not exist, a new NID is assigned and if the name does exist, the NID is updated
from the view data. Finally, on completion of the update, the view is refreshed with the
DBMS MVIEW.REFRESH procedure. The same method is used for AID’s on assertions.
The materialised views in the databases are refreshed on demand since many are ineligible
61
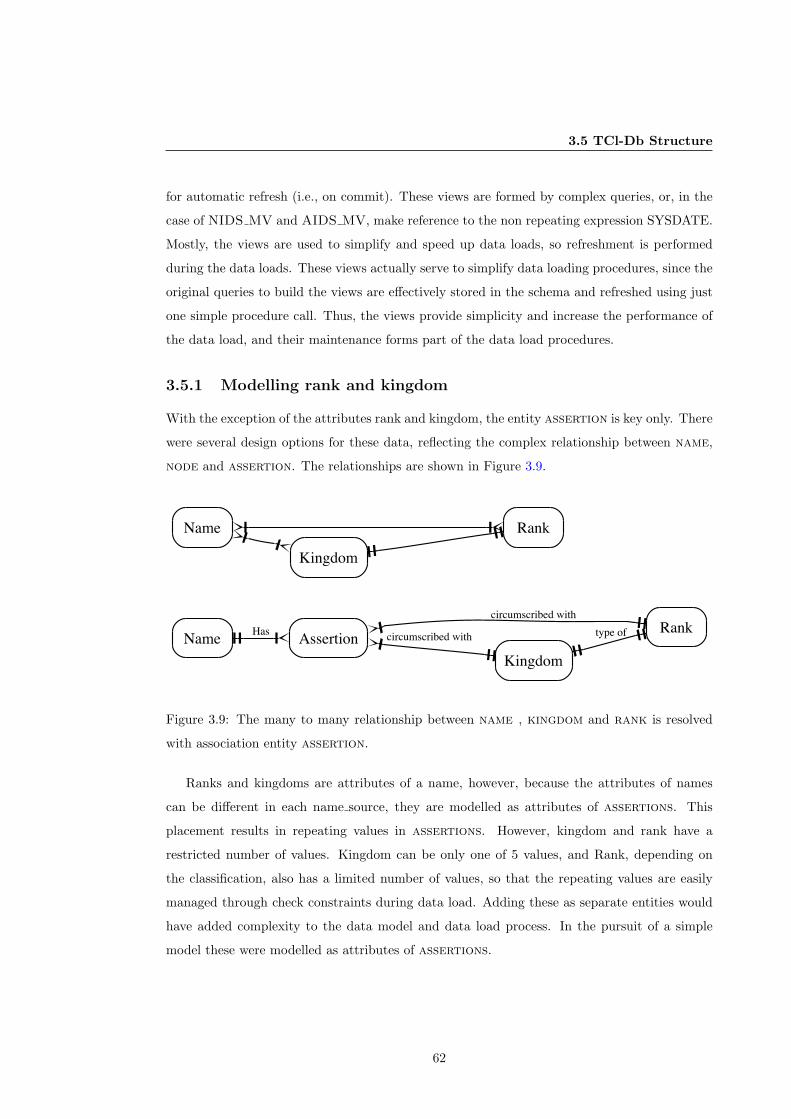
3.5 TCl-Db Structure
for automatic refresh (i.e., on commit). These views are formed by complex queries, or, in the
case of NIDS MV and AIDS MV, make reference to the non repeating expression SYSDATE.
Mostly, the views are used to simplify and speed up data loads, so refreshment is performed
during the data loads. These views actually serve to simplify data loading procedures, since the
original queries to build the views are effectively stored in the schema and refreshed using just
one simple procedure call. Thus, the views provide simplicity and increase the performance of
the data load, and their maintenance forms part of the data load procedures.
3.5.1 Modelling rank and kingdom
With the exception of the attributes rank and kingdom, the entity assertion is key only. There
were several design options for these data, reflecting the complex relationship between name,
node and assertion. The relationships are shown in Figure 3.9.
RankName AssertionHas
circumscribed with
Kingdomcircumscribed with type of
RankName
Kingdom
Figure 3.9: The many to many relationship between name , kingdom and rank is resolved
with association entity assertion.
Ranks and kingdoms are attributes of a name, however, because the attributes of names
can be different in each name source, they are modelled as attributes of assertions. This
placement results in repeating values in assertions. However, kingdom and rank have a
restricted number of values. Kingdom can be only one of 5 values, and Rank, depending on
the classification, also has a limited number of values, so that the repeating values are easily
managed through check constraints during data load. Adding these as separate entities would
have added complexity to the data model and data load process. In the pursuit of a simple
model these were modelled as attributes of assertions.
62
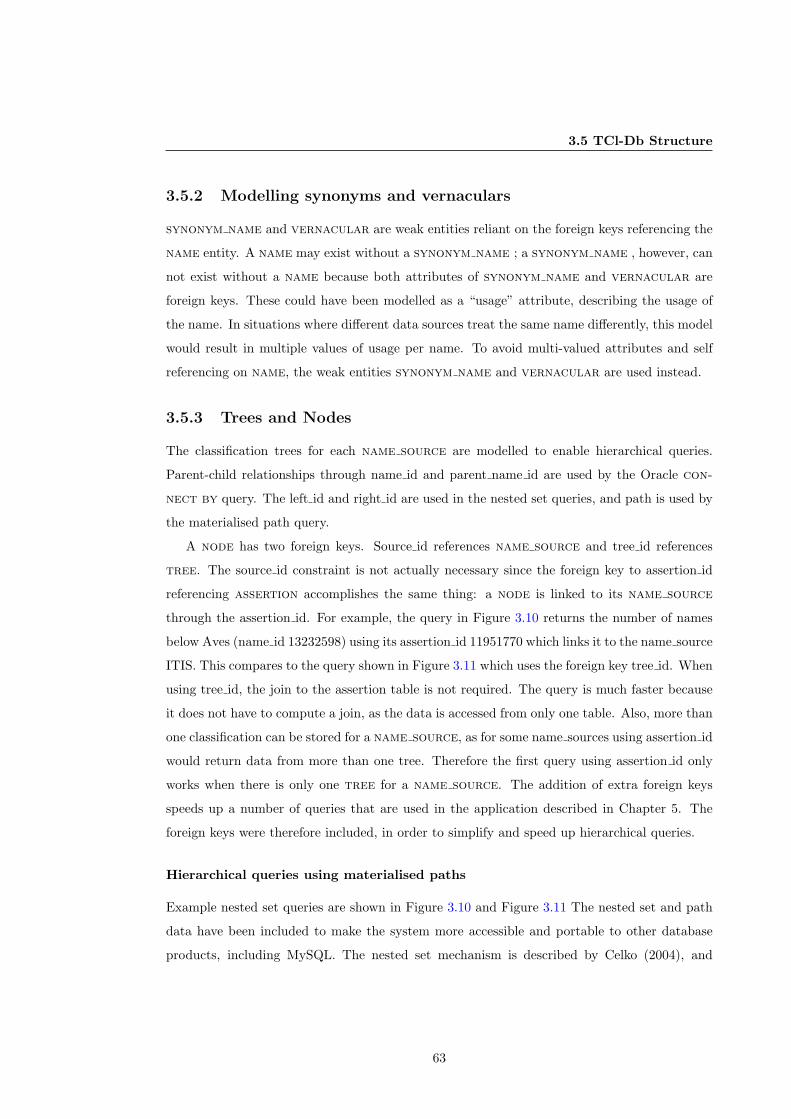
3.5 TCl-Db Structure
3.5.2 Modelling synonyms and vernaculars
synonym name and vernacular are weak entities reliant on the foreign keys referencing the
name entity. A name may exist without a synonym name ; a synonym name , however, can
not exist without a name because both attributes of synonym name and vernacular are
foreign keys. These could have been modelled as a “usage” attribute, describing the usage of
the name. In situations where different data sources treat the same name differently, this model
would result in multiple values of usage per name. To avoid multi-valued attributes and self
referencing on name, the weak entities synonym name and vernacular are used instead.
3.5.3 Trees and Nodes
The classification trees for each name source are modelled to enable hierarchical queries.
Parent-child relationships through name id and parent name id are used by the Oracle con-
nect by query. The left id and right id are used in the nested set queries, and path is used by
the materialised path query.
A node has two foreign keys. Source id references name source and tree id references
tree. The source id constraint is not actually necessary since the foreign key to assertion id
referencing assertion accomplishes the same thing: a node is linked to its name source
through the assertion id. For example, the query in Figure 3.10 returns the number of names
below Aves (name id 13232598) using its assertion id 11951770 which links it to the name source
ITIS. This compares to the query shown in Figure 3.11 which uses the foreign key tree id. When
using tree id, the join to the assertion table is not required. The query is much faster because
it does not have to compute a join, as the data is accessed from only one table. Also, more than
one classification can be stored for a name source, as for some name sources using assertion id
would return data from more than one tree. Therefore the first query using assertion id only
works when there is only one tree for a name source. The addition of extra foreign keys
speeds up a number of queries that are used in the application described in Chapter 5. The
foreign keys were therefore included, in order to simplify and speed up hierarchical queries.
Hierarchical queries using materialised paths
Example nested set queries are shown in Figure 3.10 and Figure 3.11 The nested set and path
data have been included to make the system more accessible and portable to other database
products, including MySQL. The nested set mechanism is described by Celko (2004), and
63
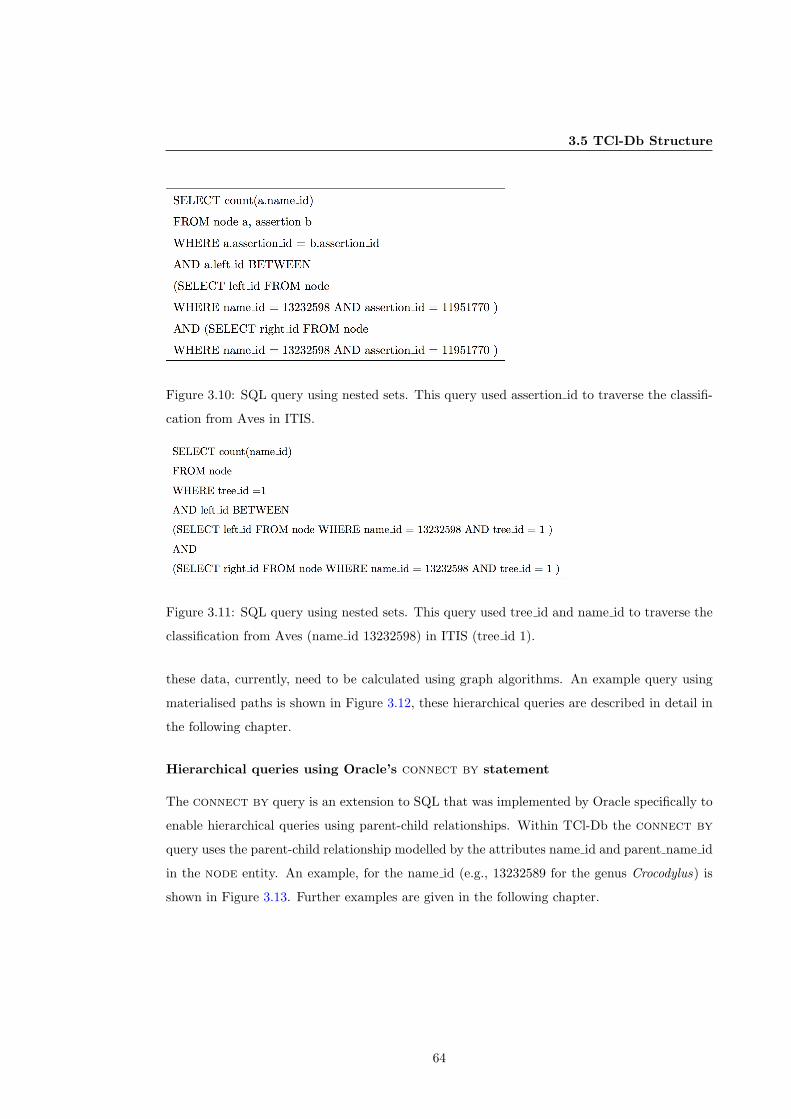
3.5 TCl-Db Structure
Figure 3.10: SQL query using nested sets. This query used assertion id to traverse the classifi-
cation from Aves in ITIS.
Figure 3.11: SQL query using nested sets. This query used tree id and name id to traverse the
classification from Aves (name id 13232598) in ITIS (tree id 1).
these data, currently, need to be calculated using graph algorithms. An example query using
materialised paths is shown in Figure 3.12, these hierarchical queries are described in detail in
the following chapter.
Hierarchical queries using Oracle’s connect by statement
The connect by query is an extension to SQL that was implemented by Oracle specifically to
enable hierarchical queries using parent-child relationships. Within TCl-Db the connect by
query uses the parent-child relationship modelled by the attributes name id and parent name id
in the node entity. An example, for the name id (e.g., 13232589 for the genus Crocodylus) is
shown in Figure 3.13. Further examples are given in the following chapter.
64
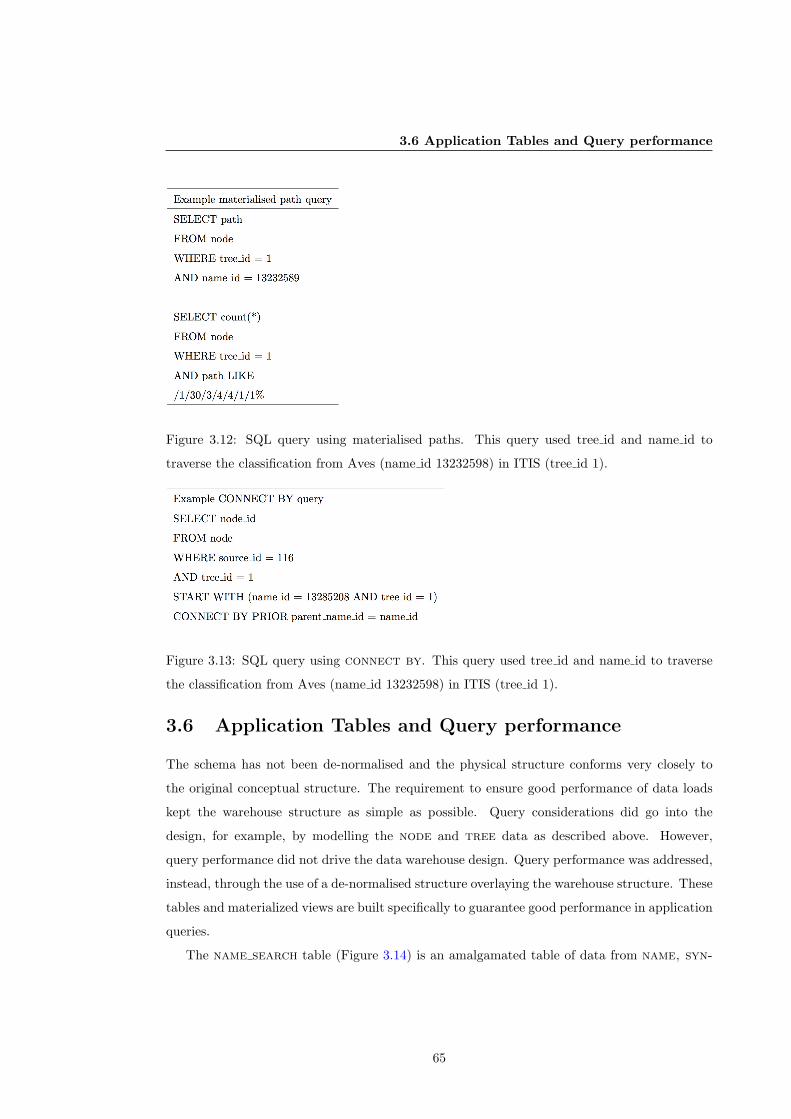
3.6 Application Tables and Query performance
Figure 3.12: SQL query using materialised paths. This query used tree id and name id to
traverse the classification from Aves (name id 13232598) in ITIS (tree id 1).
Figure 3.13: SQL query using connect by. This query used tree id and name id to traverse
the classification from Aves (name id 13232598) in ITIS (tree id 1).
3.6 Application Tables and Query performance
The schema has not been de-normalised and the physical structure conforms very closely to
the original conceptual structure. The requirement to ensure good performance of data loads
kept the warehouse structure as simple as possible. Query considerations did go into the
design, for example, by modelling the node and tree data as described above. However,
query performance did not drive the data warehouse design. Query performance was addressed,
instead, through the use of a de-normalised structure overlaying the warehouse structure. These
tables and materialized views are built specifically to guarantee good performance in application
queries.
The name search table (Figure 3.14) is an amalgamated table of data from name, syn-
65
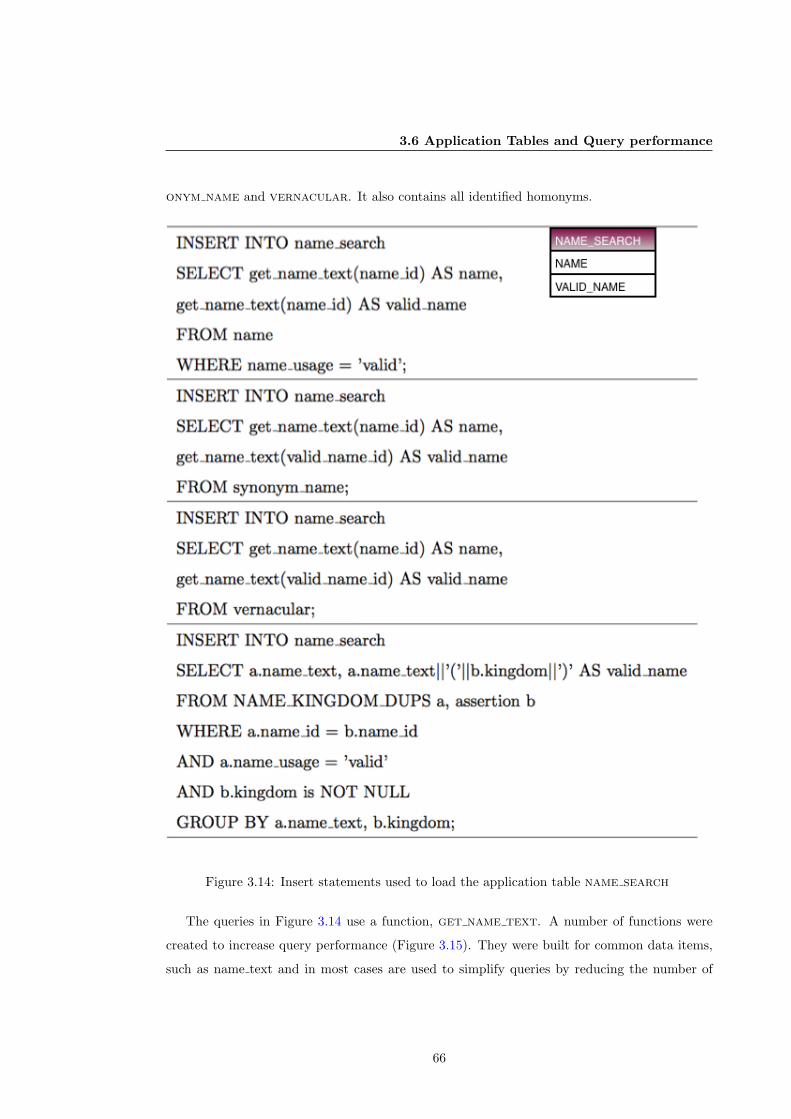
3.6 Application Tables and Query performance
onym name and vernacular. It also contains all identified homonyms.
Figure 3.14: Insert statements used to load the application table name search
The queries in Figure 3.14 use a function, get name text. A number of functions were
created to increase query performance (Figure 3.15). They were built for common data items,
such as name text and in most cases are used to simplify queries by reducing the number of
66
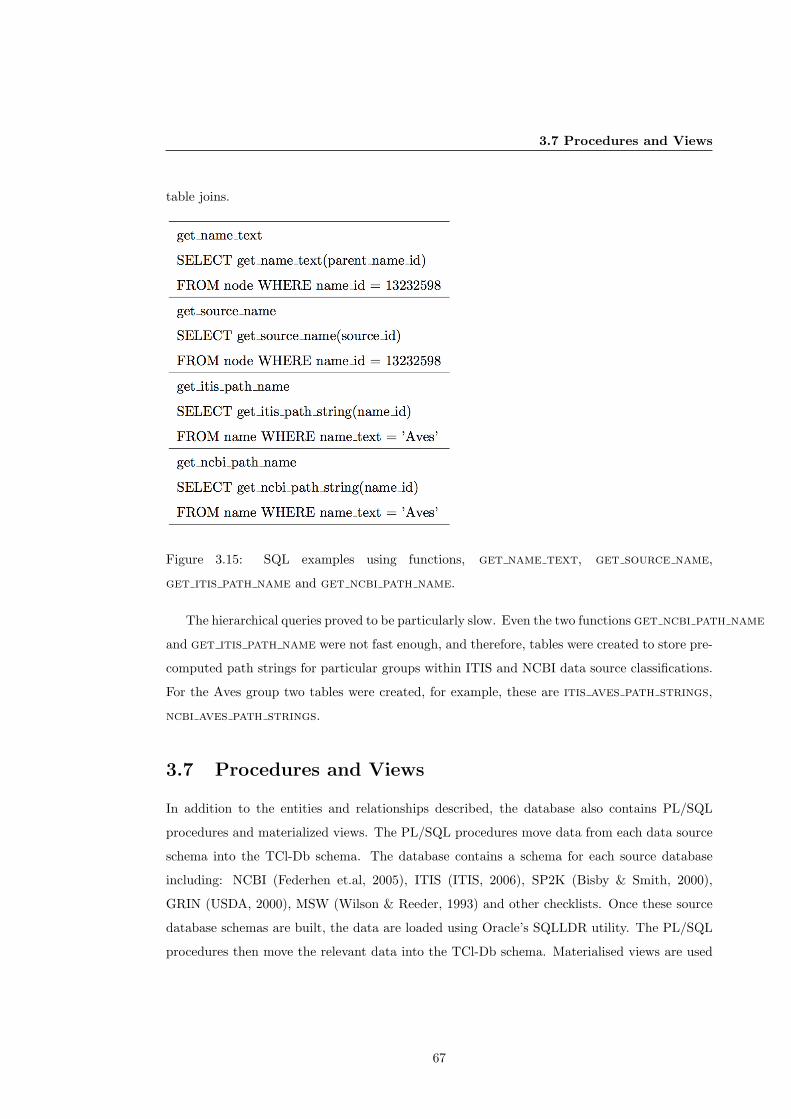
3.7 Procedures and Views
table joins.
Figure 3.15: SQL examples using functions, get name text, get source name,
get itis path name and get ncbi path name.
The hierarchical queries proved to be particularly slow. Even the two functions get ncbi path name
and get itis path name were not fast enough, and therefore, tables were created to store pre-
computed path strings for particular groups within ITIS and NCBI data source classifications.
For the Aves group two tables were created, for example, these are itis aves path strings,
ncbi aves path strings.
3.7 Procedures and Views
In addition to the entities and relationships described, the database also contains PL/SQL
procedures and materialized views. The PL/SQL procedures move data from each data source
schema into the TCl-Db schema. The database contains a schema for each source database
including: NCBI (Federhen et.al, 2005), ITIS (ITIS, 2006), SP2K (Bisby & Smith, 2000),
GRIN (USDA, 2000), MSW (Wilson & Reeder, 1993) and other checklists. Once these source
database schemas are built, the data are loaded using Oracle’s SQLLDR utility. The PL/SQL
procedures then move the relevant data into the TCl-Db schema. Materialised views are used
67
3.8 Summary
by these procedures to help speed up the data transfer across the schemas. A materialized view
is a snapshot of data from a query performed on master tables. In this case, tables in the source
database schemas. By pre-calculating expensive joins and aggregations into a materialized view,
performance of the data transfer is significantly improved. For example, the materialized views
SP2K NAMEIDS MV calculates the names that are already in TCl-Db name table and stores
the name id and db sourceid, so that the addition of these known names to the assertion
table during data load is accomplished by querying one table. The procedures used for data
load are detailed in the following chapter.
3.8 Summary
This chapter describes the architecture and schema design of TCl-Db. The database stores not
only the taxonomic names but also the full classifications for each data source. This gives users
access to differing classification opinions in one data structure. The supported hierarchical
queries are outlined with SQL examples. Application tables that were built, for example, to
enable the use of linked names in searches through the name search table, and functions
that are used to improve query performance are also described. The next chapter details the
procedure used for populating the data warehouse and data sources that were merged into the
TCl-Db structure.
68
Chapter 4
Populating the Database
This Chapter describes in detail the procedures followed during database loading. This is done
for each of the data sources in the following order: ITIS, NCBI, GRIN, Sp2000, Mammal Species
of the World and finally other smaller resources.
4.1 Introduction
In this chapter we present each of the data sources and the protocol used for loading the data.
For each of the data sources this can be described in 3 steps, (1) assembling local version of the
source database, (2) mapping source schema elements to TCl-Db and (3) loading data into the
TCl-Db schema.
The application architecture is depicted in Figure 4.1. The data sources used within TCl-
Db were all downloaded and replicated into an Oracle database as separate silos (schemas). In
most cases, the data sources were replicated into their silos in their native format. We created
the table structures that represented the structure of the source files. Since the data were not
manipulated into another format, there was no possibility of compromising the integrity of the
data with an additional transformation step. The TCl-Db warehouse was then populated with
data from several data sources. These are given in the order in which they were loaded. A full
list of contributing data sources is shown in Table 4.1.
The following section gives background information for each of the data sources and a
description of the schema mapping and data load process.
69
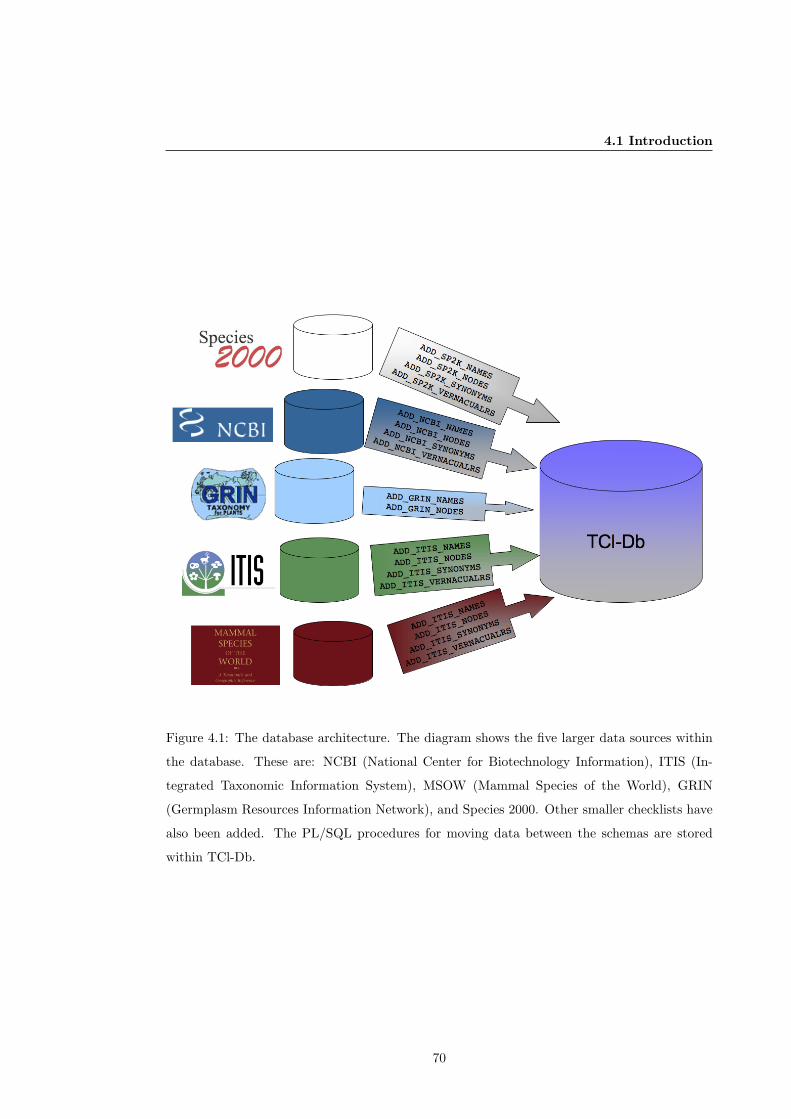
4.1 Introduction
Figure 4.1: The database architecture. The diagram shows the five larger data sources within
the database. These are: NCBI (National Center for Biotechnology Information), ITIS (In-
tegrated Taxonomic Information System), MSOW (Mammal Species of the World), GRIN
(Germplasm Resources Information Network), and Species 2000. Other smaller checklists have
also been added. The PL/SQL procedures for moving data between the schemas are stored
within TCl-Db.
70
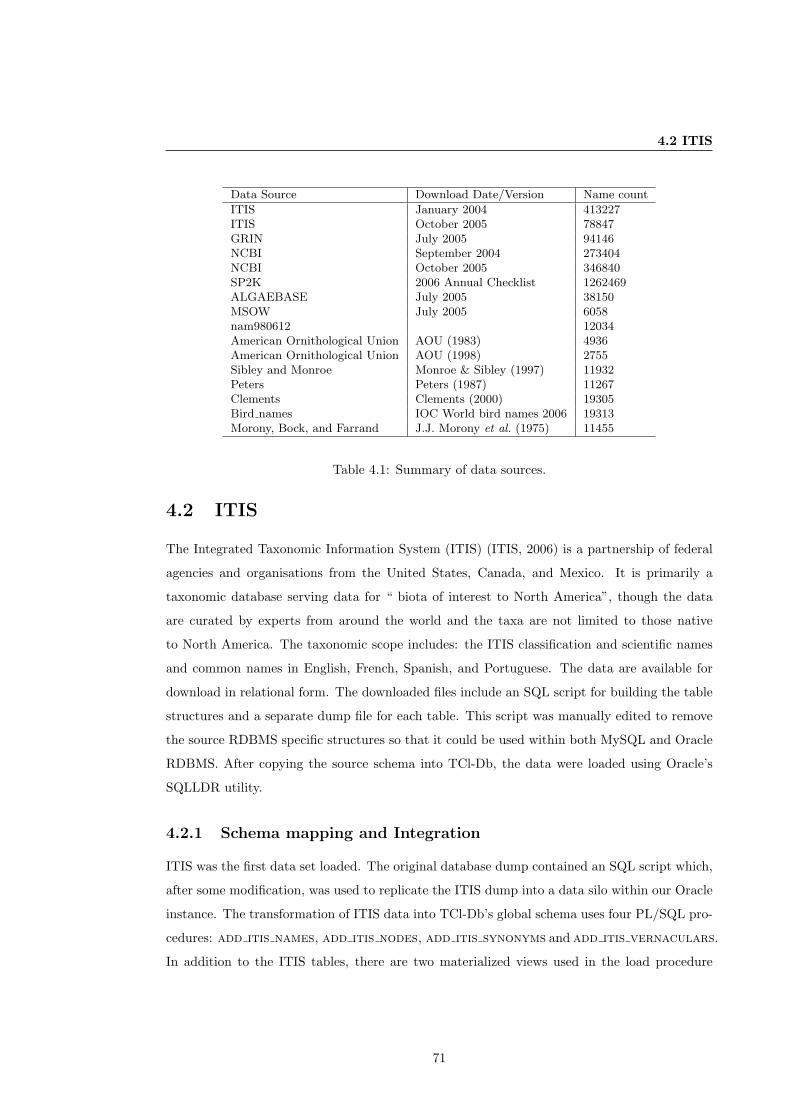
4.2 ITIS
Data Source Download Date/Version Name count
ITIS January 2004 413227ITIS October 2005 78847GRIN July 2005 94146NCBI September 2004 273404NCBI October 2005 346840SP2K 2006 Annual Checklist 1262469ALGAEBASE July 2005 38150MSOW July 2005 6058nam980612 12034American Ornithological Union AOU (1983) 4936American Ornithological Union AOU (1998) 2755Sibley and Monroe Monroe & Sibley (1997) 11932Peters Peters (1987) 11267Clements Clements (2000) 19305Bird names IOC World bird names 2006 19313Morony, Bock, and Farrand J.J. Morony et al. (1975) 11455
Table 4.1: Summary of data sources.
4.2 ITIS
The Integrated Taxonomic Information System (ITIS) (ITIS, 2006) is a partnership of federal
agencies and organisations from the United States, Canada, and Mexico. It is primarily a
taxonomic database serving data for “ biota of interest to North America”, though the data
are curated by experts from around the world and the taxa are not limited to those native
to North America. The taxonomic scope includes: the ITIS classification and scientific names
and common names in English, French, Spanish, and Portuguese. The data are available for
download in relational form. The downloaded files include an SQL script for building the table
structures and a separate dump file for each table. This script was manually edited to remove
the source RDBMS specific structures so that it could be used within both MySQL and Oracle
RDBMS. After copying the source schema into TCl-Db, the data were loaded using Oracle’s
SQLLDR utility.
4.2.1 Schema mapping and Integration
ITIS was the first data set loaded. The original database dump contained an SQL script which,
after some modification, was used to replicate the ITIS dump into a data silo within our Oracle
instance. The transformation of ITIS data into TCl-Db’s global schema uses four PL/SQL pro-
cedures: add itis names, add itis nodes, add itis synonyms and add itis vernaculars.
In addition to the ITIS tables, there are two materialized views used in the load procedure
71
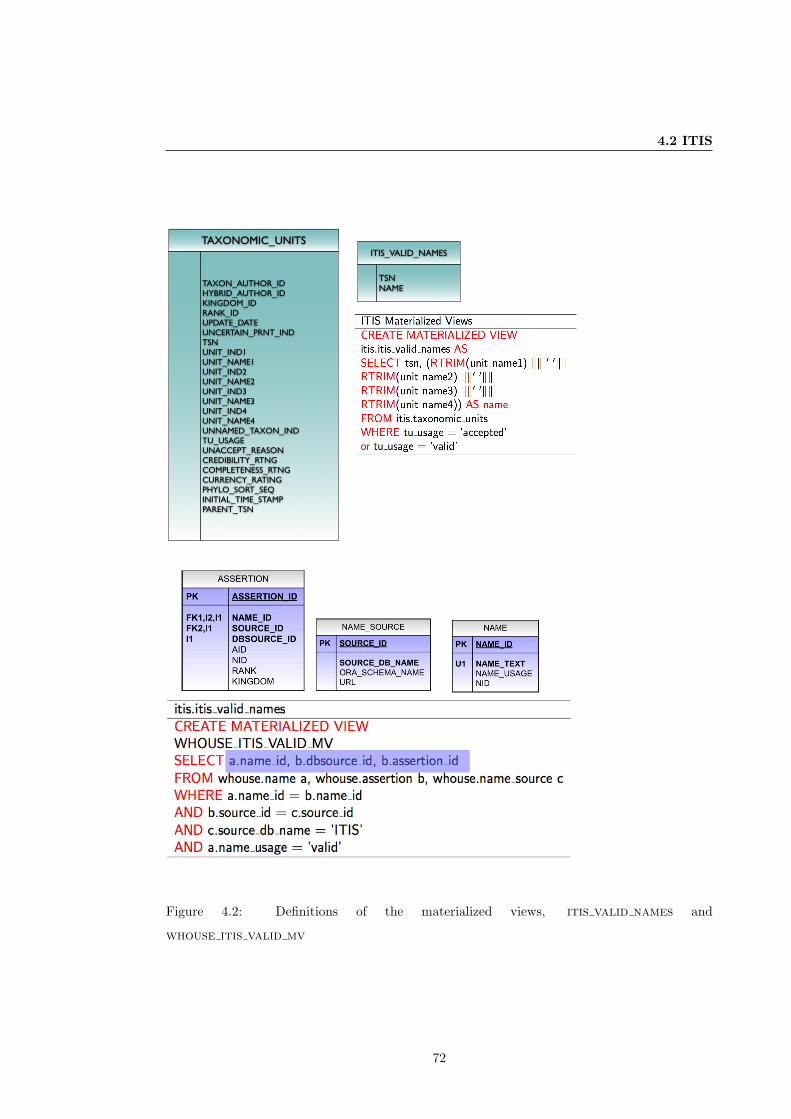
4.2 ITIS
ITIS_VALID_NAMES
TSNNAME
TAXONOMIC_UNITS
TAXON_AUTHOR_IDHYBRID_AUTHOR_IDKINGDOM_IDRANK_IDUPDATE_DATEUNCERTAIN_PRNT_INDTSNUNIT_IND1UNIT_NAME1UNIT_IND2UNIT_NAME2UNIT_IND3UNIT_NAME3UNIT_IND4UNIT_NAME4UNNAMED_TAXON_INDTU_USAGEUNACCEPT_REASONCREDIBILITY_RTNGCOMPLETENESS_RTNGCURRENCY_RATINGPHYLO_SORT_SEQINITIAL_TIME_STAMPPARENT_TSN
Figure 4.2: Definitions of the materialized views, itis valid names and
whouse itis valid mv
72
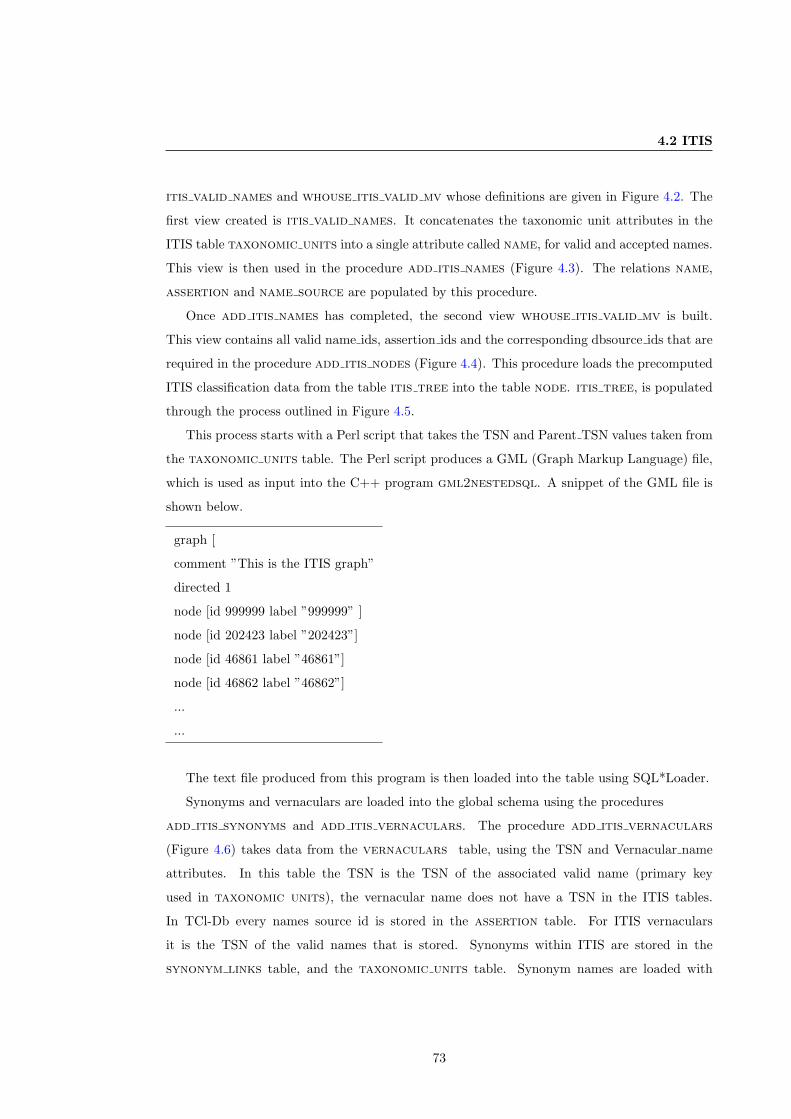
4.2 ITIS
itis valid names and whouse itis valid mv whose definitions are given in Figure 4.2. The
first view created is itis valid names. It concatenates the taxonomic unit attributes in the
ITIS table taxonomic units into a single attribute called name, for valid and accepted names.
This view is then used in the procedure add itis names (Figure 4.3). The relations name,
assertion and name source are populated by this procedure.
Once add itis names has completed, the second view whouse itis valid mv is built.
This view contains all valid name ids, assertion ids and the corresponding dbsource ids that are
required in the procedure add itis nodes (Figure 4.4). This procedure loads the precomputed
ITIS classification data from the table itis tree into the table node. itis tree, is populated
through the process outlined in Figure 4.5.
This process starts with a Perl script that takes the TSN and Parent TSN values taken from
the taxonomic units table. The Perl script produces a GML (Graph Markup Language) file,
which is used as input into the C++ program gml2nestedsql. A snippet of the GML file is
shown below.
graph [
comment ”This is the ITIS graph”
directed 1
node [id 999999 label ”999999” ]
node [id 202423 label ”202423”]
node [id 46861 label ”46861”]
node [id 46862 label ”46862”]
...
...
The text file produced from this program is then loaded into the table using SQL*Loader.
Synonyms and vernaculars are loaded into the global schema using the procedures
add itis synonyms and add itis vernaculars. The procedure add itis vernaculars
(Figure 4.6) takes data from the vernaculars table, using the TSN and Vernacular name
attributes. In this table the TSN is the TSN of the associated valid name (primary key
used in taxonomic units), the vernacular name does not have a TSN in the ITIS tables.
In TCl-Db every names source id is stored in the assertion table. For ITIS vernaculars
it is the TSN of the valid names that is stored. Synonyms within ITIS are stored in the
synonym links table, and the taxonomic units table. Synonym names are loaded with
73
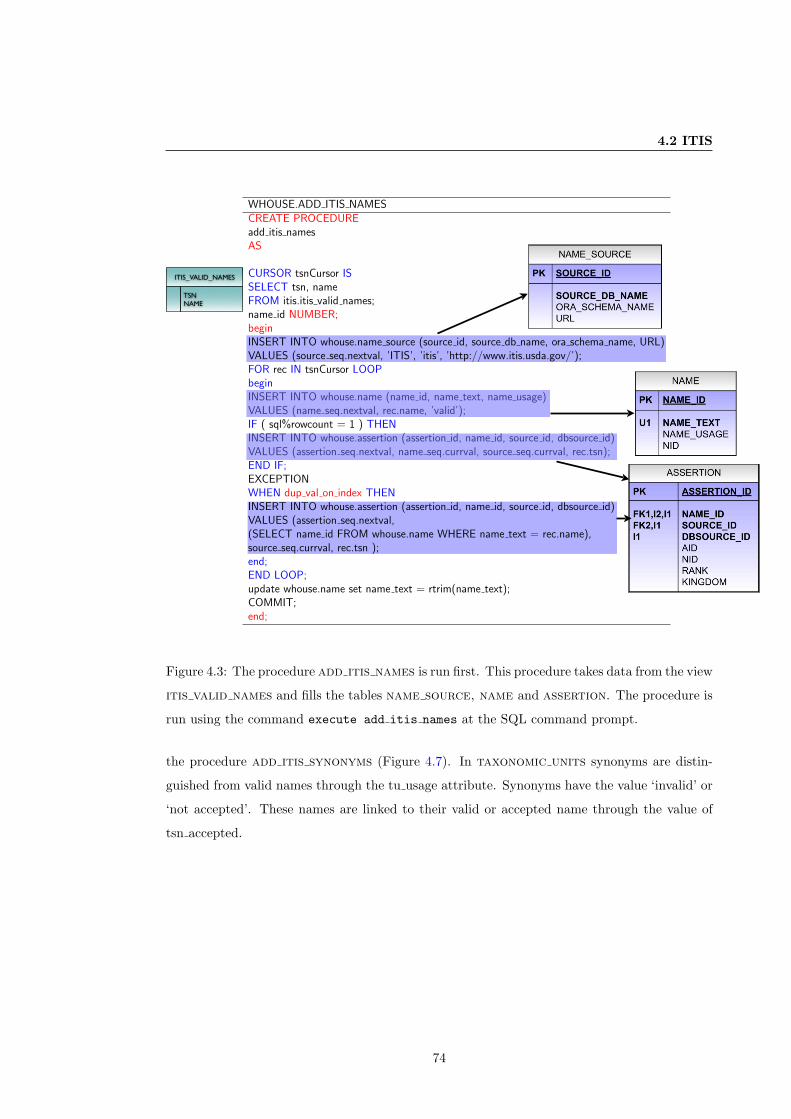
4.2 ITIS
WHOUSE.ADD ITIS NAMESCREATE PROCEDUREadd itis namesAS
CURSOR tsnCursor ISSELECT tsn, nameFROM itis.itis valid names;name id NUMBER;beginINSERT INTO whouse.name source (source id, source db name, ora schema name, URL)VALUES (source seq.nextval, ’ITIS’, ’itis’, ’http://www.itis.usda.gov/’);FOR rec IN tsnCursor LOOPbeginINSERT INTO whouse.name (name id, name text, name usage)VALUES (name seq.nextval, rec.name, ’valid’);IF ( sql%rowcount = 1 ) THENINSERT INTO whouse.assertion (assertion id, name id, source id, dbsource id)VALUES (assertion seq.nextval, name seq.currval, source seq.currval, rec.tsn);END IF;EXCEPTIONWHEN dup val on index THENINSERT INTO whouse.assertion (assertion id, name id, source id, dbsource id)VALUES (assertion seq.nextval,(SELECT name id FROM whouse.name WHERE name text = rec.name),source seq.currval, rec.tsn );end;END LOOP;update whouse.name set name text = rtrim(name text);COMMIT;end;
ITIS_VALID_NAMES
TSNNAME
Figure 4.3: The procedure add itis names is run first. This procedure takes data from the view
itis valid names and fills the tables name source, name and assertion. The procedure is
run using the command execute add itis names at the SQL command prompt.
the procedure add itis synonyms (Figure 4.7). In taxonomic units synonyms are distin-
guished from valid names through the tu usage attribute. Synonyms have the value ‘invalid’ or
‘not accepted’. These names are linked to their valid or accepted name through the value of
tsn accepted.
74
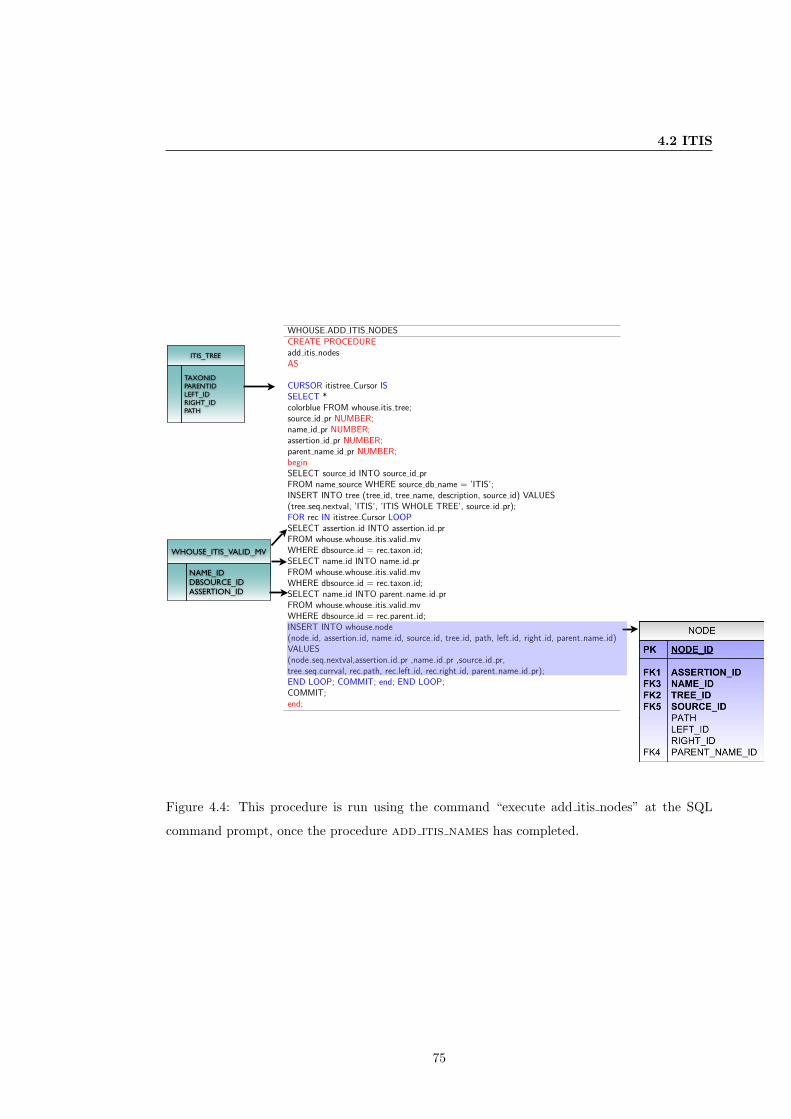
4.2 ITIS
WHOUSE_ITIS_VALID_MV
NAME_IDDBSOURCE_IDASSERTION_ID
WHOUSE.ADD ITIS NODESCREATE PROCEDUREadd itis nodesAS
CURSOR itistree Cursor ISSELECT *colorblue FROM whouse.itis tree;source id pr NUMBER;name id pr NUMBER;assertion id pr NUMBER;parent name id pr NUMBER;beginSELECT source id INTO source id prFROM name source WHERE source db name = ’ITIS’;INSERT INTO tree (tree id, tree name, description, source id) VALUES(tree seq.nextval, ’ITIS’, ’ITIS WHOLE TREE’, source id pr);FOR rec IN itistree Cursor LOOPSELECT assertion id INTO assertion id prFROM whouse.whouse itis valid mvWHERE dbsource id = rec.taxon id;SELECT name id INTO name id prFROM whouse.whouse itis valid mvWHERE dbsource id = rec.taxon id;SELECT name id INTO parent name id prFROM whouse.whouse itis valid mvWHERE dbsource id = rec.parent id;INSERT INTO whouse.node(node id, assertion id, name id, source id, tree id, path, left id, right id, parent name id)VALUES(node seq.nextval,assertion id pr ,name id pr ,source id pr,tree seq.currval, rec.path, rec.left id, rec.right id, parent name id pr);END LOOP; COMMIT; end; END LOOP;COMMIT;end;
ITIS_TREE
TAXONIDPARENTIDLEFT_IDRIGHT_IDPATH
Figure 4.4: This procedure is run using the command “execute add itis nodes” at the SQL
command prompt, once the procedure add itis names has completed.
75
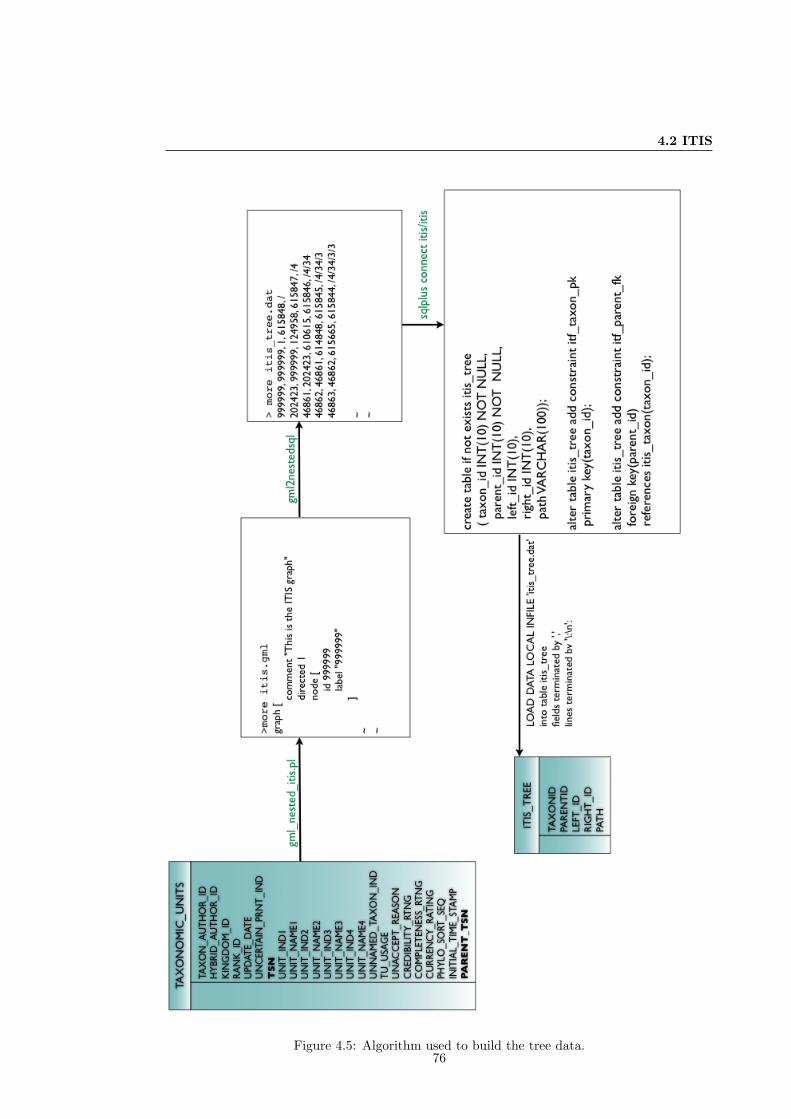
4.2 ITIS
Figure 4.5: Algorithm used to build the tree data.76
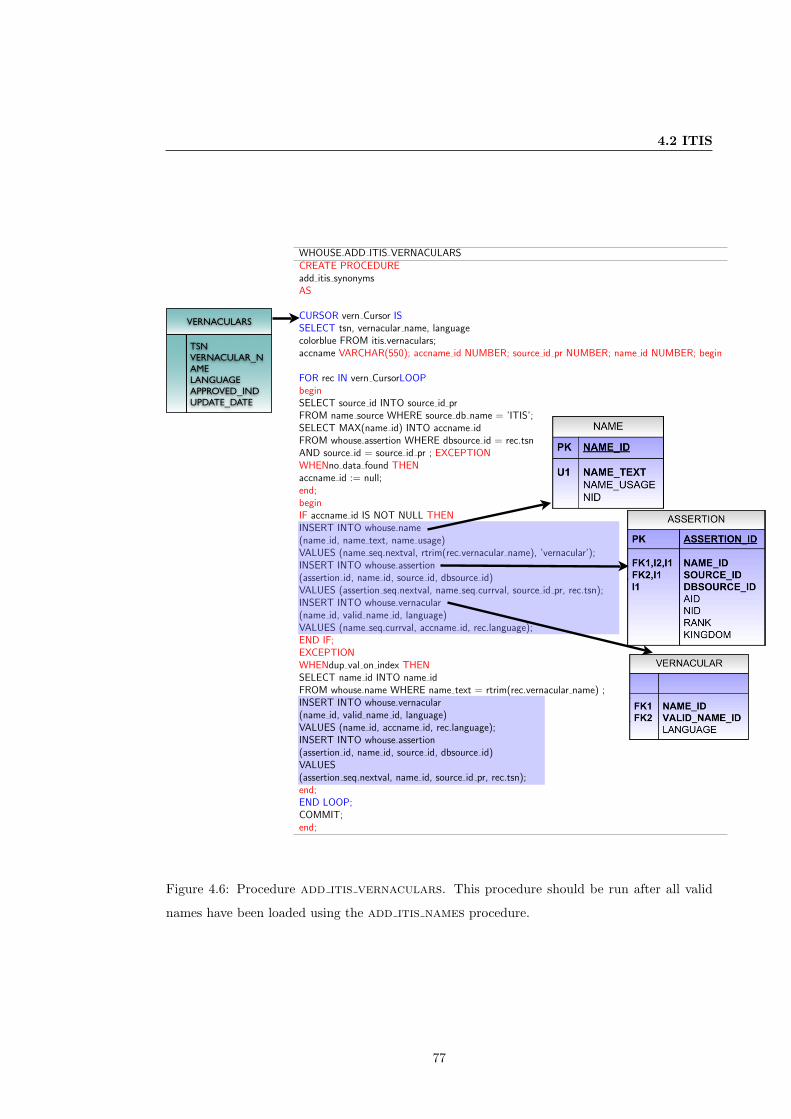
4.2 ITIS
WHOUSE.ADD ITIS VERNACULARSCREATE PROCEDUREadd itis synonymsAS
CURSOR vern Cursor ISSELECT tsn, vernacular name, languagecolorblue FROM itis.vernaculars;accname VARCHAR(550); accname id NUMBER; source id pr NUMBER; name id NUMBER; begin
FOR rec IN vern CursorLOOPbeginSELECT source id INTO source id prFROM name source WHERE source db name = ’ITIS’;SELECT MAX(name id) INTO accname idFROM whouse.assertion WHERE dbsource id = rec.tsnAND source id = source id pr ; EXCEPTIONWHENno data found THENaccname id := null;end;beginIF accname id IS NOT NULL THENINSERT INTO whouse.name(name id, name text, name usage)VALUES (name seq.nextval, rtrim(rec.vernacular name), ’vernacular’);INSERT INTO whouse.assertion(assertion id, name id, source id, dbsource id)VALUES (assertion seq.nextval, name seq.currval, source id pr, rec.tsn);INSERT INTO whouse.vernacular(name id, valid name id, language)VALUES (name seq.currval, accname id, rec.language);END IF;EXCEPTIONWHENdup val on index THENSELECT name id INTO name idFROM whouse.name WHERE name text = rtrim(rec.vernacular name) ;INSERT INTO whouse.vernacular(name id, valid name id, language)VALUES (name id, accname id, rec.language);INSERT INTO whouse.assertion(assertion id, name id, source id, dbsource id)VALUES(assertion seq.nextval, name id, source id pr, rec.tsn);end;END LOOP;COMMIT;end;
VERNACULARS
TSNVERNACULAR_NAMELANGUAGEAPPROVED_INDUPDATE_DATE
Figure 4.6: Procedure add itis vernaculars. This procedure should be run after all valid
names have been loaded using the add itis names procedure.
77
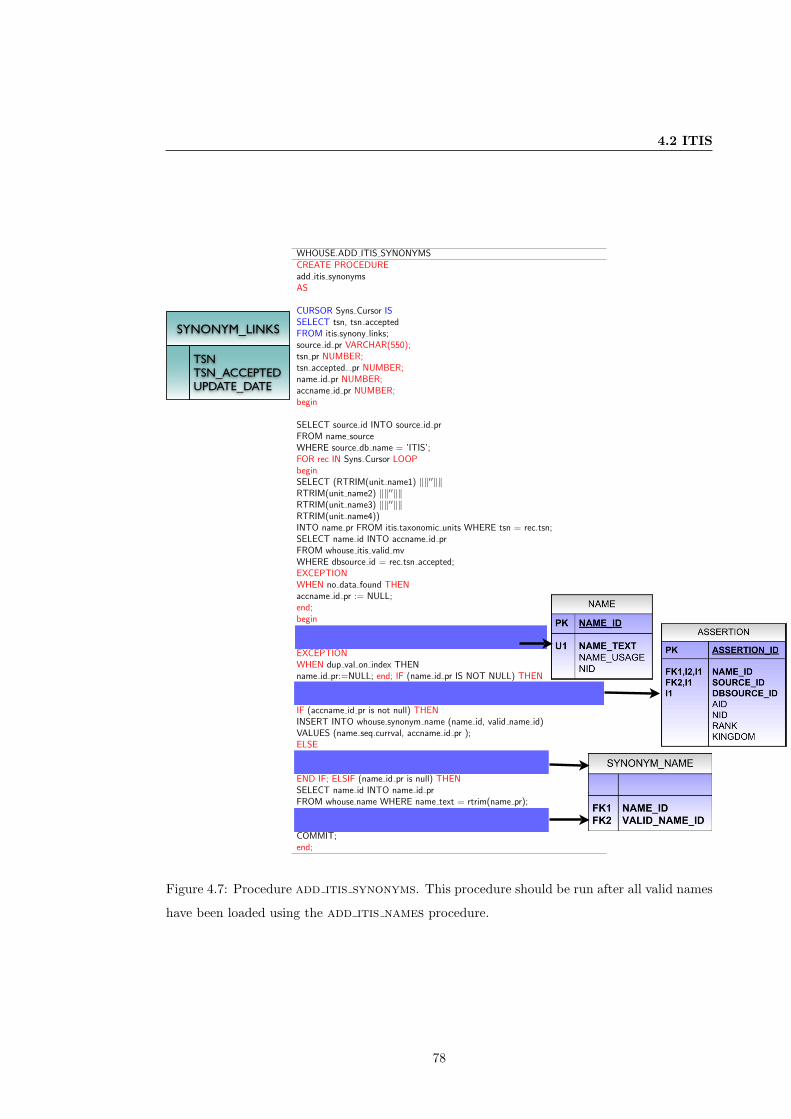
4.2 ITIS
SYNONYM_LINKS
TSNTSN_ACCEPTEDUPDATE_DATE
WHOUSE.ADD ITIS SYNONYMSCREATE PROCEDUREadd itis synonymsAS
CURSOR Syns Cursor ISSELECT tsn, tsn acceptedFROM itis.synony links;source id pr VARCHAR(550);tsn pr NUMBER;tsn accepted pr NUMBER;name id pr NUMBER;accname id pr NUMBER;begin
SELECT source id INTO source id prFROM name sourceWHERE source db name = ’ITIS’;FOR rec IN Syns Cursor LOOPbeginSELECT (RTRIM(unit name1) ‖‖′′‖‖RTRIM(unit name2) ‖‖′′‖‖RTRIM(unit name3) ‖‖′′‖‖RTRIM(unit name4))INTO name pr FROM itis.taxonomic units WHERE tsn = rec.tsn;SELECT name id INTO accname id prFROM whouse itis valid mvWHERE dbsource id = rec.tsn accepted;EXCEPTIONWHEN no data found THENaccname id pr := NULL;end;beginINSERT INTO whouse.name (name id, name text, name usage)VALUES (name seq.nextval, rtrim(name pr), ’synonym’);EXCEPTIONWHEN dup val on index THENname id pr:=NULL; end; IF (name id pr IS NOT NULL) THENINSERT INTO whouse.assertion (assertion id, name id, source id, dbsource id)VALUES (assertion seq.nextval, name seq.currval, source id pr, rec.tsn);IF (accname id pr is not null) THENINSERT INTO whouse.synonym name (name id, valid name id)VALUES (name seq.currval, accname id pr );ELSEINSERT INTO whouse.synonym name (name id, valid name id)VALUES (name seq.currval,name seq.currval);END IF; ELSIF (name id pr is null) THENSELECT name id INTO name id prFROM whouse.name WHERE name text = rtrim(name pr);INSERT INTO whouse.synonym name (name id, valid name id)VALUES (name id pr, accname id pr); end if; END LOOP;COMMIT;end;
Figure 4.7: Procedure add itis synonyms. This procedure should be run after all valid names
have been loaded using the add itis names procedure.
78
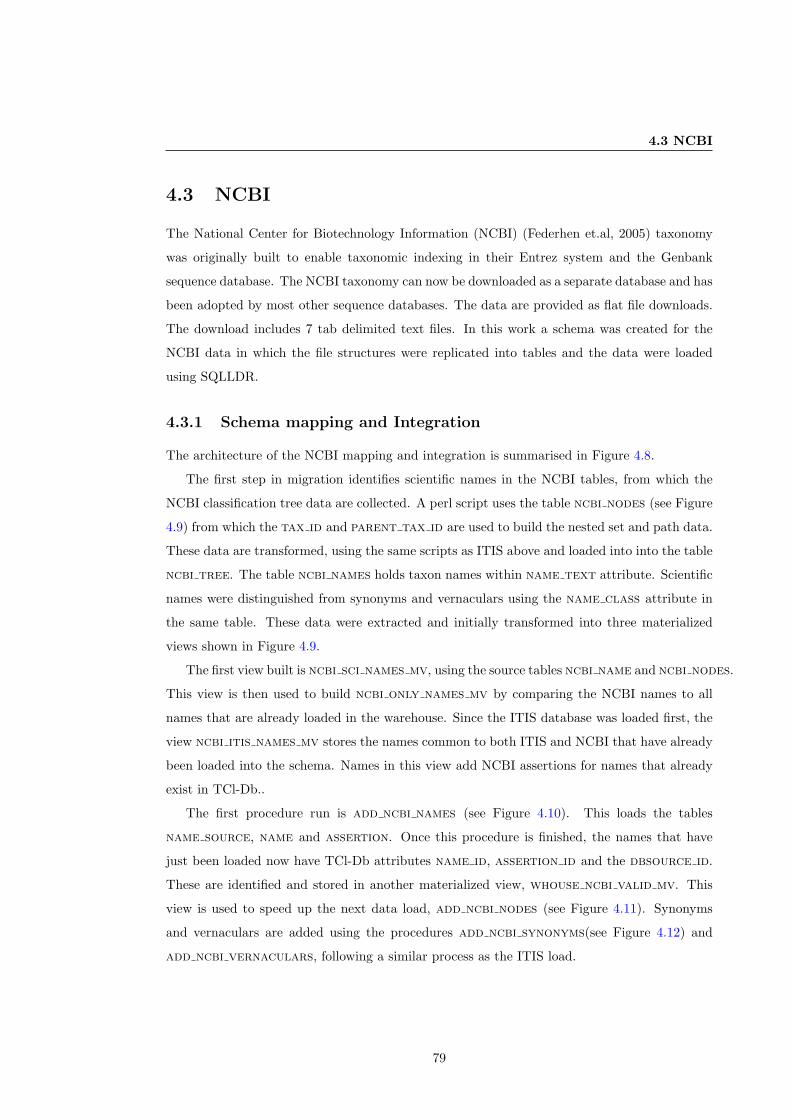
4.3 NCBI
4.3 NCBI
The National Center for Biotechnology Information (NCBI) (Federhen et.al, 2005) taxonomy
was originally built to enable taxonomic indexing in their Entrez system and the Genbank
sequence database. The NCBI taxonomy can now be downloaded as a separate database and has
been adopted by most other sequence databases. The data are provided as flat file downloads.
The download includes 7 tab delimited text files. In this work a schema was created for the
NCBI data in which the file structures were replicated into tables and the data were loaded
using SQLLDR.
4.3.1 Schema mapping and Integration
The architecture of the NCBI mapping and integration is summarised in Figure 4.8.
The first step in migration identifies scientific names in the NCBI tables, from which the
NCBI classification tree data are collected. A perl script uses the table ncbi nodes (see Figure
4.9) from which the tax id and parent tax id are used to build the nested set and path data.
These data are transformed, using the same scripts as ITIS above and loaded into into the table
ncbi tree. The table ncbi names holds taxon names within name text attribute. Scientific
names were distinguished from synonyms and vernaculars using the name class attribute in
the same table. These data were extracted and initially transformed into three materialized
views shown in Figure 4.9.
The first view built is ncbi sci names mv, using the source tables ncbi name and ncbi nodes.
This view is then used to build ncbi only names mv by comparing the NCBI names to all
names that are already loaded in the warehouse. Since the ITIS database was loaded first, the
view ncbi itis names mv stores the names common to both ITIS and NCBI that have already
been loaded into the schema. Names in this view add NCBI assertions for names that already
exist in TCl-Db..
The first procedure run is add ncbi names (see Figure 4.10). This loads the tables
name source, name and assertion. Once this procedure is finished, the names that have
just been loaded now have TCl-Db attributes name id, assertion id and the dbsource id.
These are identified and stored in another materialized view, whouse ncbi valid mv. This
view is used to speed up the next data load, add ncbi nodes (see Figure 4.11). Synonyms
and vernaculars are added using the procedures add ncbi synonyms(see Figure 4.12) and
add ncbi vernaculars, following a similar process as the ITIS load.
79
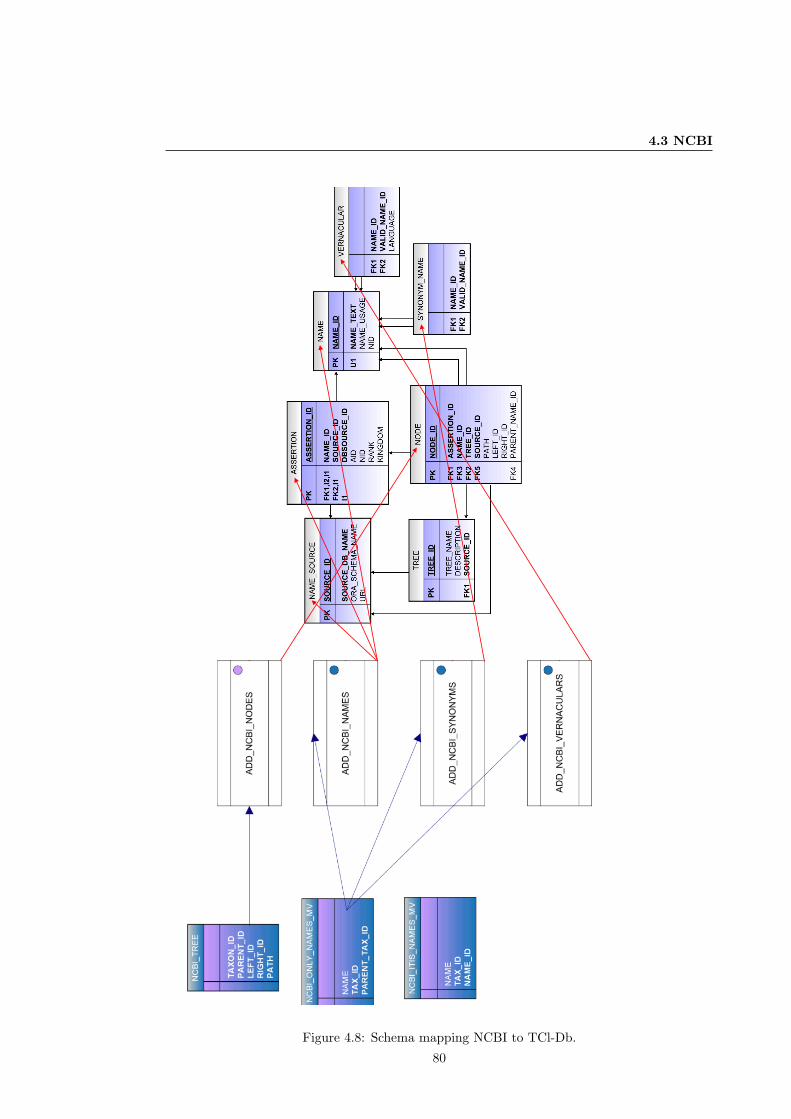
4.3 NCBI
Figure 4.8: Schema mapping NCBI to TCl-Db.
80
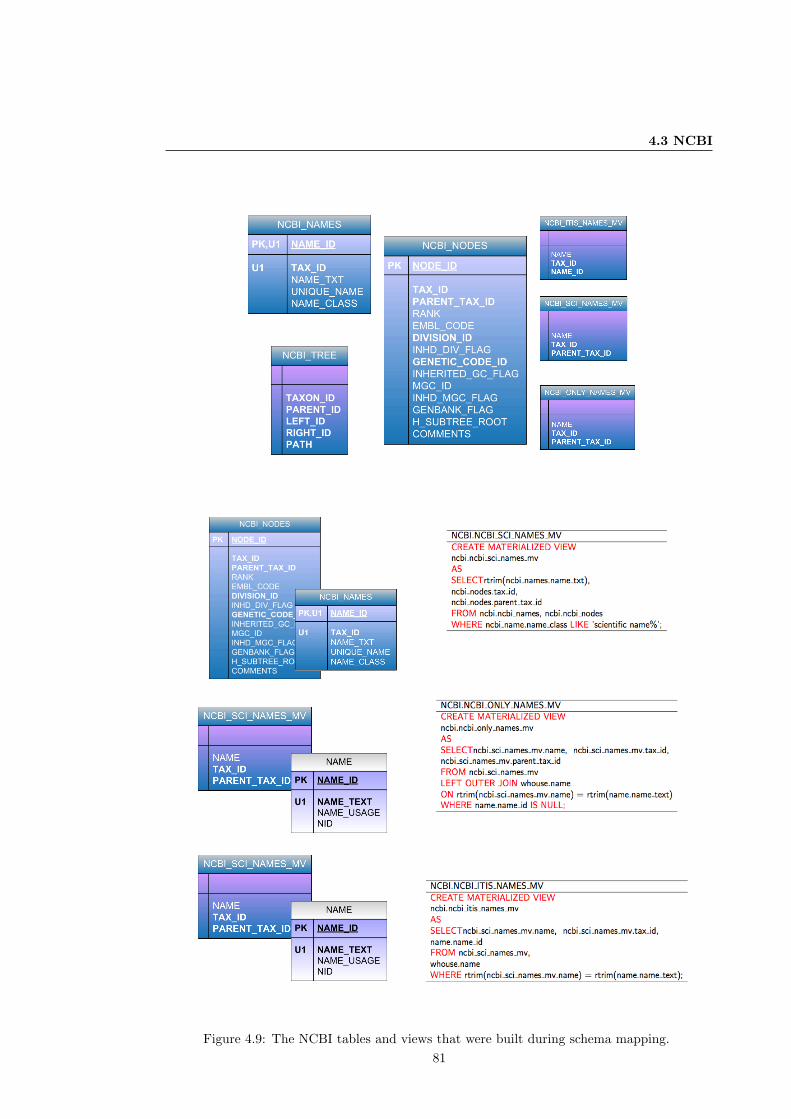
4.3 NCBI
Figure 4.9: The NCBI tables and views that were built during schema mapping.81
4.3 NCBI
WHOUSE.ADD NCBI NAMESCREATE PROCEDUREadd ncbi namesASTYPE names IS TABLE OF ncbi.ncbi names.name txt%type;TYPE taxids IS TABLE OF ncbi.ncbi names.tax id%type;TYPE nameids IS TABLE OF whouse.name.name id%type;
CURSOR ncbi onlyCursor ISSELECT tax id, nameFROM ncbi.ncbi only names mv;
CURSOR ncbi itiscursor ISSELECT tax id, name, name idFROM ncbi.ncbi itis names mv;ncbi names names;ncbi tax id taxids;whouse nids nameids;name id pr NUMBER;
beginINSERT INTO whouse.name source (source id, source db name, ora schema name, URL)VALUESsource seq.NEXTVAL, ’NCBI’, ncbi, ’http://www.ncbi.nlm.nih.gov/taxonomy’);–OPEN ncbi onlyCursor;FETCH ncbi onlyCursor BULK COLLECT INTO ncbi tax id, ncbi names;FOR this IN ncbi names.FIRST .. ncbi names.LAST LOOPbeginINSERT INTO whouse.name (name id, name text, name usage) VALUES(name seq.NEXTVAL, ncbi names(this), ’valid’);EXCEPTIONWHEN dup val on index THENSELECT name id INTO name id pr FROM whouse.name where name text = ncbi names(this);IF name id pr IS NOT NULL THENINSERT INTO whouse.assertion (assertion id, name id, source id dbsource id,) VALUES(assertion seq.NEXTVAL, whouse nids(this), source seq.CURRVAL, ncbi tax idthis));END IF;END LOOP;CLOSE ncbi onlyCursor;–OPEN ncbi itisCursor;FETCH ncbi itisCursor BULK COLLECT INTO ncbi tax id, ncbi names, whouse nids;FOR this IN ncbi names.FIRST .. ncbi names.LAST LOOPINSERT INTO whouse.assertion (assertion id, name id, source id dbsource id,) VALUES(assertion seq.NEXTVAL, whouse nids(this), source seq.CURRVAL, ncbi tax idthis));END LOOP;CLOSE ncbi itisCursor;UPDATE whouse.name SET name text = RTRIM(name text);COMMIT;end;
Figure 4.10: The procedure add ncbi names is run first. This procedure takes data from the
views shown in Figure 4.9 and fills the tables name and assertion. The procedure is run using
the command “execute add ncbi names” at the SQL command prompt.
82
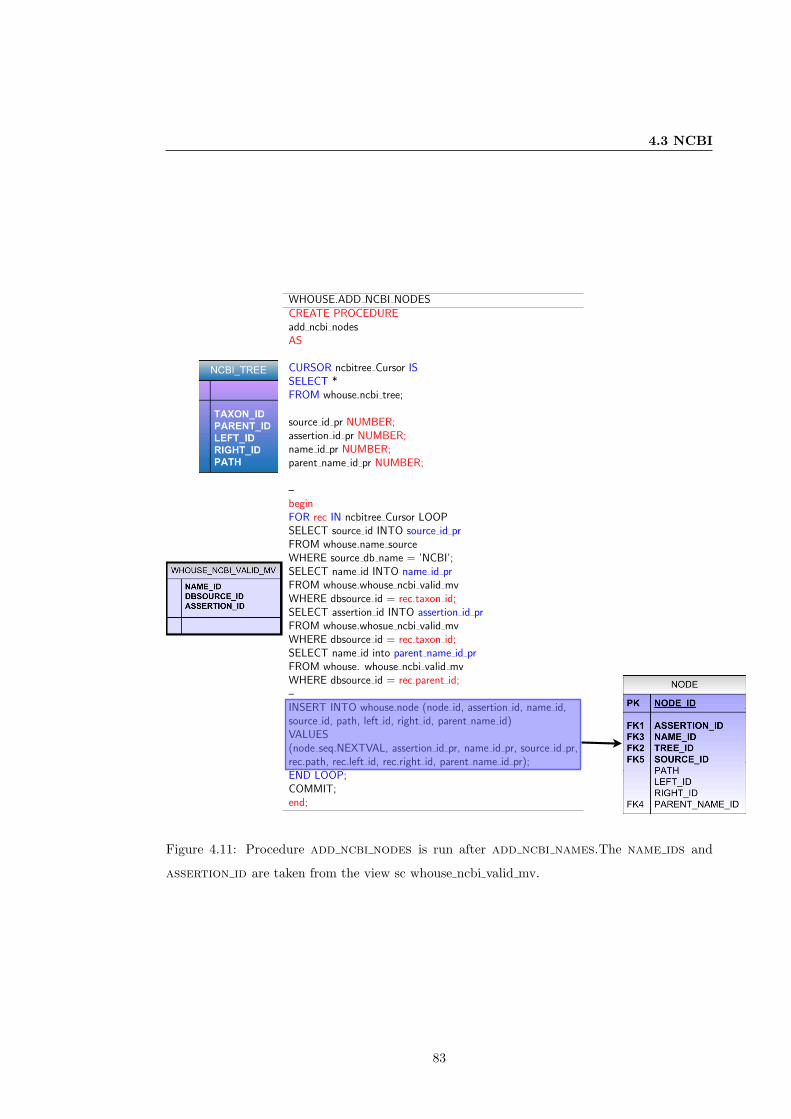
4.3 NCBI
WHOUSE.ADD NCBI NODESCREATE PROCEDUREadd ncbi nodesAS
CURSOR ncbitree Cursor ISSELECT *FROM whouse.ncbi tree;
source id pr NUMBER;assertion id pr NUMBER;name id pr NUMBER;parent name id pr NUMBER;
–beginFOR rec IN ncbitree Cursor LOOPSELECT source id INTO source id prFROM whouse.name sourceWHERE source db name = ’NCBI’;SELECT name id INTO name id prFROM whouse.whouse ncbi valid mvWHERE dbsource id = rec.taxon id;SELECT assertion id INTO assertion id prFROM whouse.whosue ncbi valid mvWHERE dbsource id = rec.taxon id;SELECT name id into parent name id prFROM whouse. whouse ncbi valid mvWHERE dbsource id = rec.parent id;–INSERT INTO whouse.node (node id, assertion id, name id,source id, path, left id, right id, parent name id)VALUES(node seq.NEXTVAL, assertion id pr, name id pr, source id pr,rec.path, rec.left id, rec.right id, parent name id pr);END LOOP;COMMIT;end;
Figure 4.11: Procedure add ncbi nodes is run after add ncbi names.The name ids and
assertion id are taken from the view sc whouse ncbi valid mv.
83
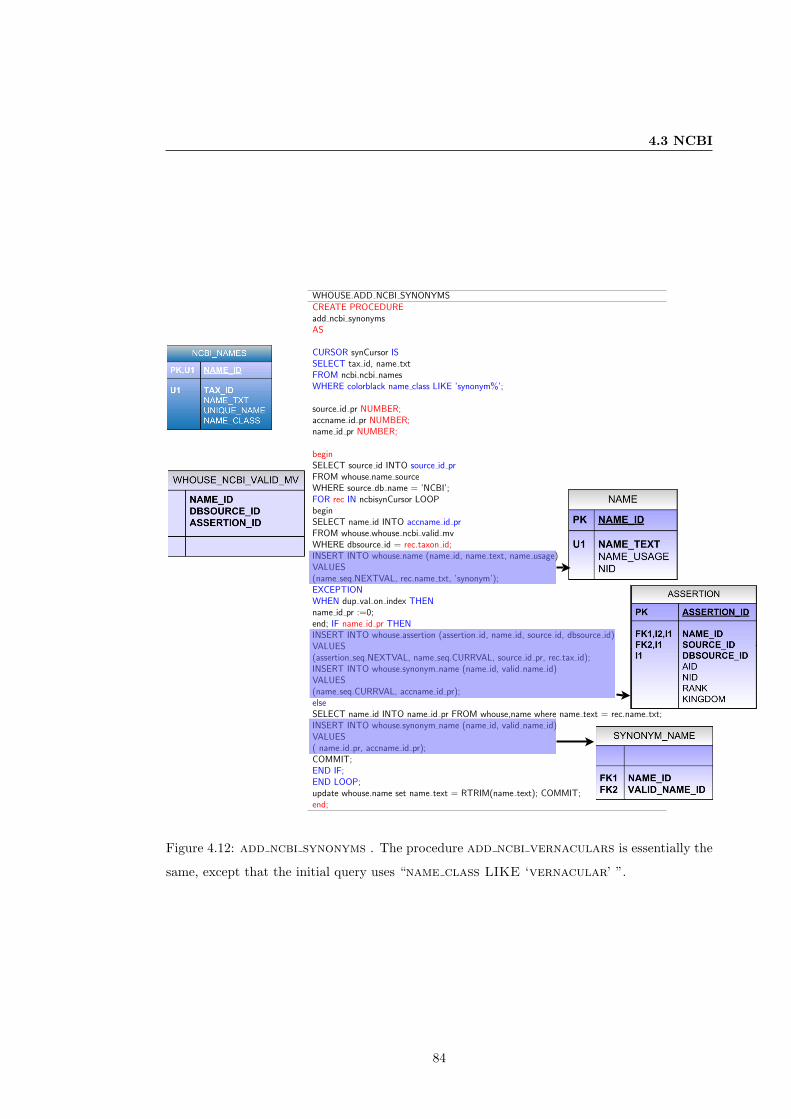
4.3 NCBI
WHOUSE.ADD NCBI SYNONYMSCREATE PROCEDUREadd ncbi synonymsAS
CURSOR synCursor ISSELECT tax id, name txtFROM ncbi.ncbi namesWHERE colorblack name class LIKE ’synonym%’;
source id pr NUMBER;accname id pr NUMBER;name id pr NUMBER;
beginSELECT source id INTO source id prFROM whouse.name sourceWHERE source db name = ’NCBI’;FOR rec IN ncbisynCursor LOOPbeginSELECT name id INTO accname id prFROM whouse.whouse ncbi valid mvWHERE dbsource id = rec.taxon id;INSERT INTO whouse.name (name id, name text, name usage)VALUES(name seq.NEXTVAL, rec.name txt, ’synonym’);EXCEPTIONWHEN dup val on index THENname id pr :=0;end; IF name id pr THENINSERT INTO whouse.assertion (assertion id, name id, source id, dbsource id)VALUES(assertion seq.NEXTVAL, name seq.CURRVAL, source id pr, rec.tax id);INSERT INTO whouse.synonym name (name id, valid name id)VALUES(name seq.CURRVAL, accname id pr);elseSELECT name id INTO name id pr FROM whouse,name where name text = rec.name txt;INSERT INTO whouse.synonym name (name id, valid name id)VALUES( name id pr, accname id pr);COMMIT;END IF;END LOOP;update whouse.name set name text = RTRIM(name text); COMMIT;end;
Figure 4.12: add ncbi synonyms . The procedure add ncbi vernaculars is essentially the
same, except that the initial query uses “name class LIKE ‘vernacular’ ”.
84
4.4 GRIN
4.4 GRIN
The National Germplasm Information Network (GRIN) (USDA, 2000) contains classification
and nomenclature for plant germplasm data held within the (United States) Agricultural Re-
search Service National Plant Germplasm System. The taxonomic data includes scientific
names, classification (up to the rank family), synonyms and common names. The taxonomy is
curated by experts at the Systematic Botany and Mycology Laboratory in collaboration with
world wide experts. Their aim is to reflect the taxonomic opinion of taxonomists from vari-
ous plant groups and their literature. Data are also taken from floras and checklists. Mostly,
the data are guided by expert opinion and, where this is not available, the generally accepted
usage. The data downloads are dbf files from Xbase (a desktop database management system
like Microsoft Access see http://xbase.darwinports.com). The data were extracted from the dbf
files and transformed into SQL insert statements. The SQL scripts for each dbf file were loaded
into a replicated table structure reflecting the original dbf file.
4.4.1 Schema mapping and Integration
The architecture of the GRIN data integration is summarised in Figure 4.13. The GRIN
schema did not conform to standard normalisation or relational rules and the data load was
complicated since data items were stored in multiple places and there were several integrity
issues that needed to be resolved. These problems were resolved into a master table, with the
key data items necessary for TCl-Db. The species, genus and family table were used to
extract hierarchy up to family. The master table was then checked for integrity, one query
found thirty-nine species names whose parent name identifiers were missing. Unfortunately the
identifiers; species (taxno), genus (gno) and family (famno) were not unique across the
three tables and could not be used. To remedy this, a unique identifier was given to each name
as it entered the master table, these were used for the parent child relationships (instead of
the identifiers given by GRIN) for the grin tree table. There were also some data cleaning
necessary on the master table to remove disconnected nodes from the tree, these were mostly
names that had no parent names i.e. they were assigned as valid names in the tables but the
parent names were not valid. In all cases these were leaf nodes in the tree, sub-species names
considered valid but the species were invalid.
Once the grin table was created, the data were initially transformed into materialized views
which were used for the transformation into the TCl-Db schema (see Figures 4.14 and 4.15).
85
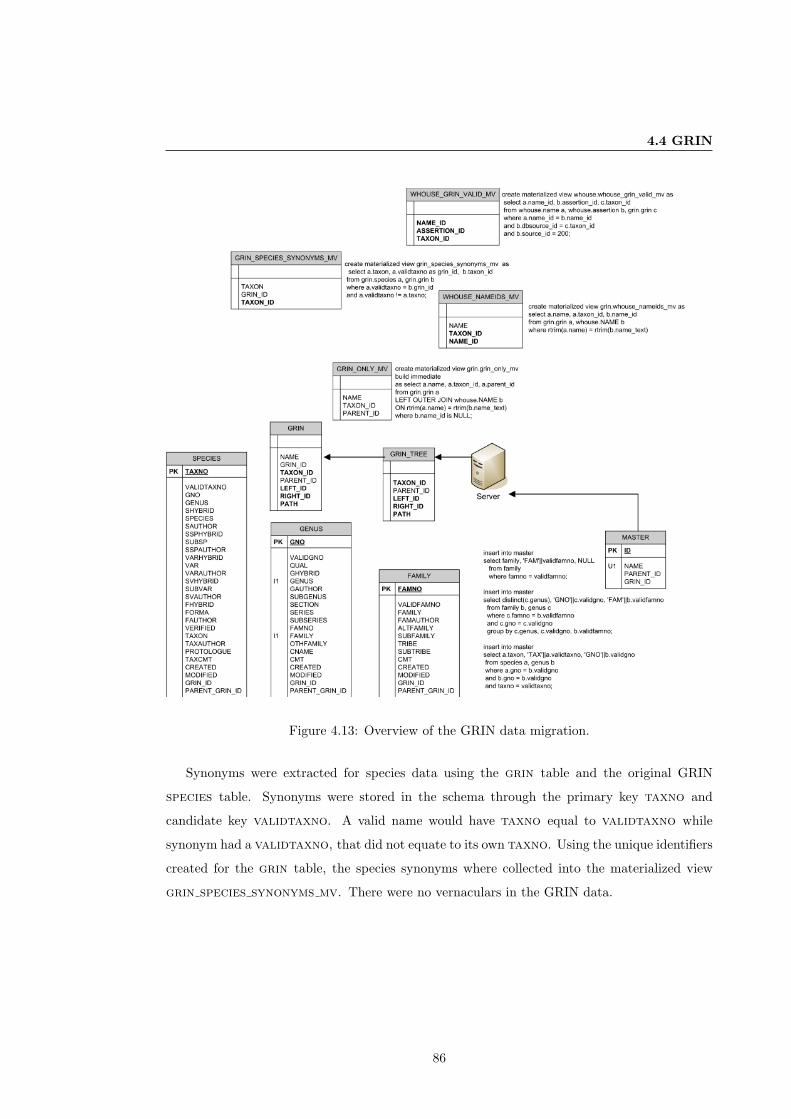
4.4 GRIN
Figure 4.13: Overview of the GRIN data migration.
Synonyms were extracted for species data using the grin table and the original GRIN
species table. Synonyms were stored in the schema through the primary key taxno and
candidate key validtaxno. A valid name would have taxno equal to validtaxno while
synonym had a validtaxno, that did not equate to its own taxno. Using the unique identifiers
created for the grin table, the species synonyms where collected into the materialized view
grin species synonyms mv. There were no vernaculars in the GRIN data.
86
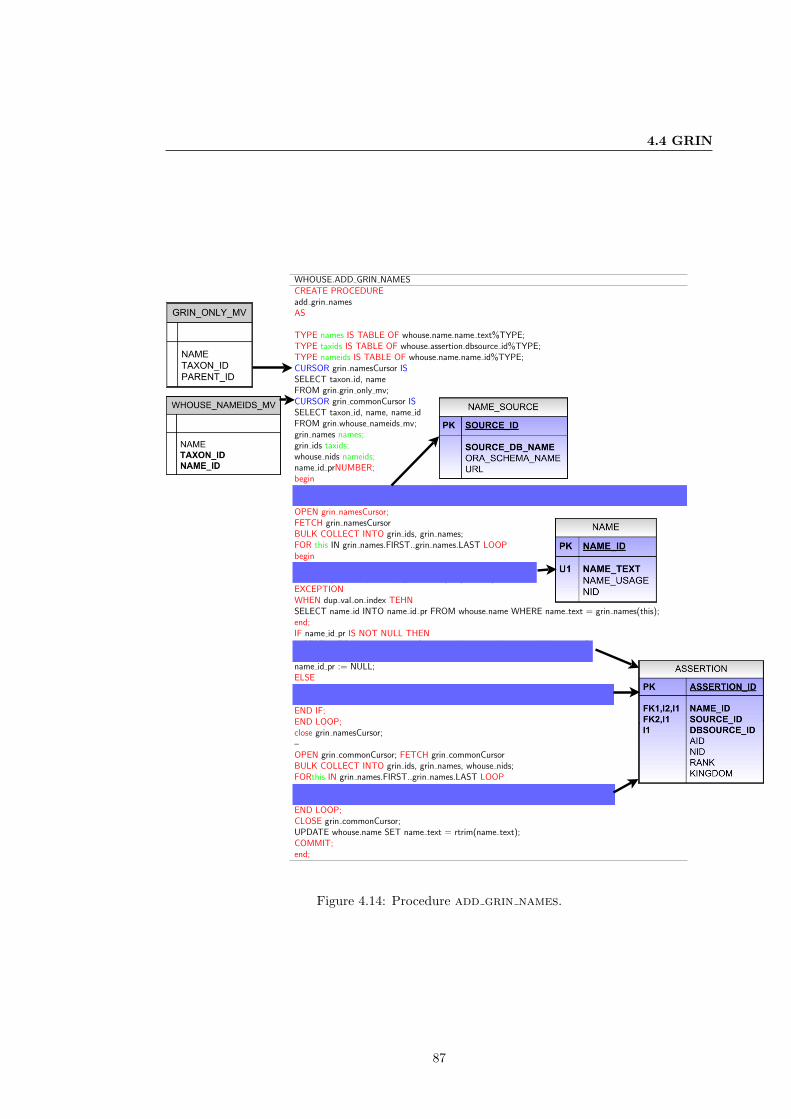
4.4 GRIN
WHOUSE.ADD GRIN NAMESCREATE PROCEDUREadd grin namesAS
TYPE names IS TABLE OF whouse.name.name text%TYPE;TYPE taxids IS TABLE OF whouse.assertion.dbsource id%TYPE;TYPE nameids IS TABLE OF whouse.name.name id%TYPE;CURSOR grin namesCursor ISSELECT taxon id, nameFROM grin.grin only mv;CURSOR grin commonCursor ISSELECT taxon id, name, name idFROM grin.whouse nameids mv;grin names names;grin ids taxids;whouse nids nameids;name id prNUMBER;beginINSERT INTO whouse.name source (SOURCE ID, SOURCE DB NAME, ORA SCHEMA NAME, URL)VALUES (source seq.nextval, ’GRIN’, ’grin’, ’http://www.ars-grin.gov/cgi-bin/npgs/html/index.pl’);OPEN grin namesCursor;FETCH grin namesCursorBULK COLLECT INTO grin ids, grin names;FOR this IN grin names.FIRST..grin names.LAST LOOPbeginINSERT INTO whouse.name (name id, name text, name usage)VALUES (name seq.nextval, grin names(this), ’valid’);EXCEPTIONWHEN dup val on index TEHNSELECT name id INTO name id pr FROM whouse.name WHERE name text = grin names(this);end;IF name id pr IS NOT NULL THENINSERT INTO whouse.assertion (assertion id, name id, source id, dbsource id)VALUES (assertion seq.nextval, name id pr, source seq.currval, grin ids(this));name id pr := NULL;ELSEINSERT INTO whouse.assertion (assertion id, name id, source id, dbsource id)VALUES (assertion seq.nextval, name seq.currval, source seq.currval, grin ids(this));END IF;END LOOP;close grin namesCursor;–OPEN grin commonCursor; FETCH grin commonCursorBULK COLLECT INTO grin ids, grin names, whouse nids;FORthis IN grin names.FIRST..grin names.LAST LOOPINSERT INTO whouse.assertion (assertion id, name id, source id, dbsource id)VALUES (assertion seq.nextval, whouse nids(this), source seq.currval, grin ids(this));END LOOP;CLOSE grin commonCursor;UPDATE whouse.name SET name text = rtrim(name text);COMMIT;end;
Figure 4.14: Procedure add grin names.
87
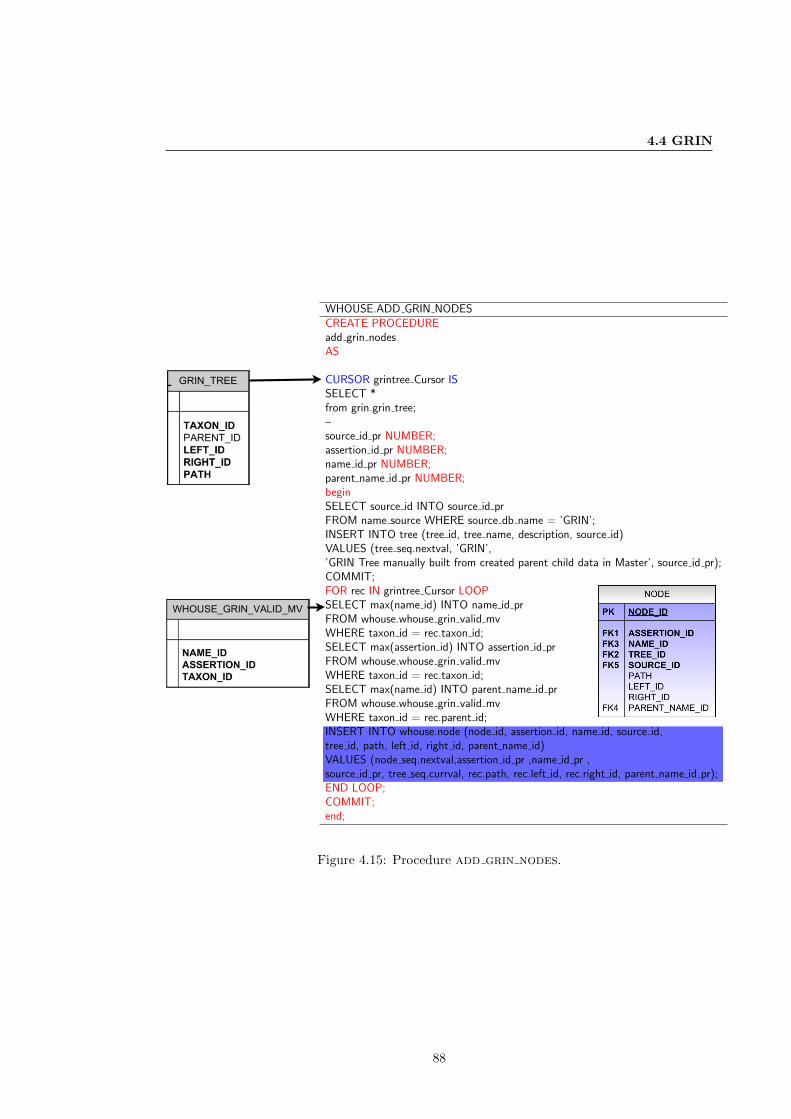
4.4 GRIN
WHOUSE.ADD GRIN NODESCREATE PROCEDUREadd grin nodesAS
CURSOR grintree Cursor ISSELECT *from grin.grin tree;–source id pr NUMBER;assertion id pr NUMBER;name id pr NUMBER;parent name id pr NUMBER;beginSELECT source id INTO source id prFROM name source WHERE source db name = ’GRIN’;INSERT INTO tree (tree id, tree name, description, source id)VALUES (tree seq.nextval, ’GRIN’,’GRIN Tree manually built from created parent child data in Master’, source id pr);COMMIT;FOR rec IN grintree Cursor LOOPSELECT max(name id) INTO name id prFROM whouse.whouse grin valid mvWHERE taxon id = rec.taxon id;SELECT max(assertion id) INTO assertion id prFROM whouse.whouse grin valid mvWHERE taxon id = rec.taxon id;SELECT max(name id) INTO parent name id prFROM whouse.whouse grin valid mvWHERE taxon id = rec.parent id;INSERT INTO whouse.node (node id, assertion id, name id, source id,tree id, path, left id, right id, parent name id)VALUES (node seq.nextval,assertion id pr ,name id pr ,source id pr, tree seq.currval, rec.path, rec.left id, rec.right id, parent name id pr);END LOOP;COMMIT;end;
Figure 4.15: Procedure add grin nodes.
88
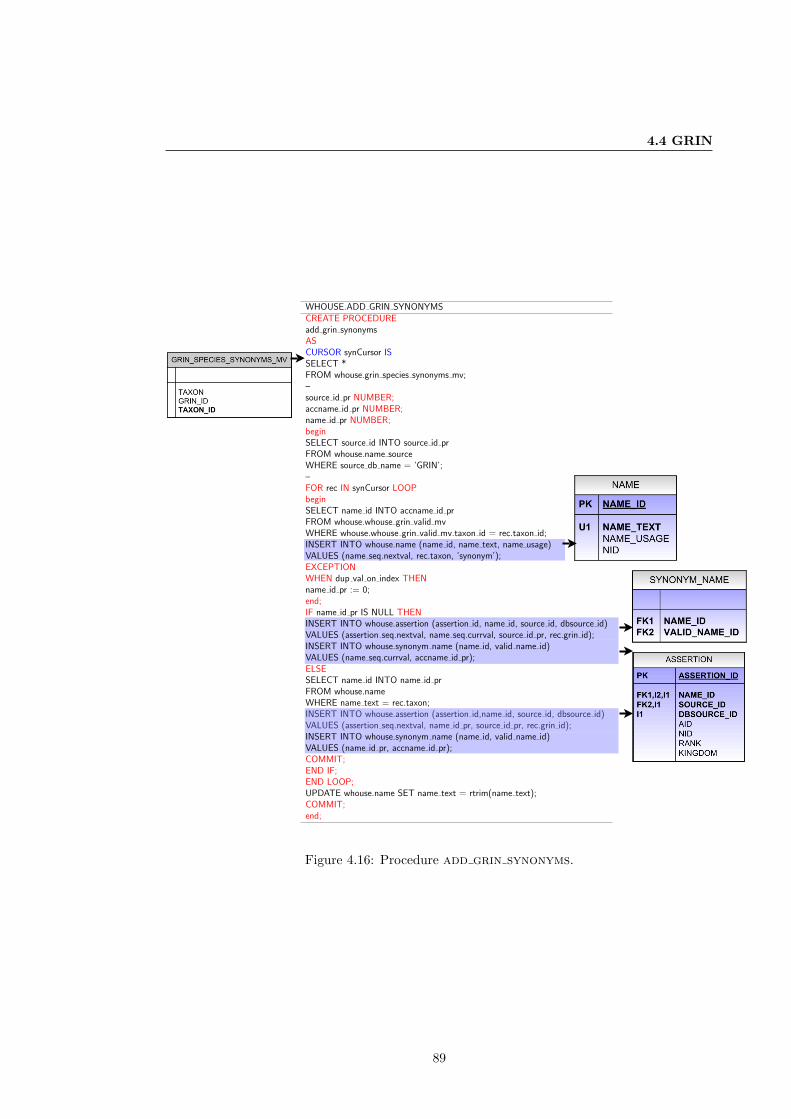
4.4 GRIN
WHOUSE.ADD GRIN SYNONYMSCREATE PROCEDUREadd grin synonymsASCURSOR synCursor ISSELECT *FROM whouse.grin species synonyms mv;–source id pr NUMBER;accname id pr NUMBER;name id pr NUMBER;beginSELECT source id INTO source id prFROM whouse.name sourceWHERE source db name = ’GRIN’;–FOR rec IN synCursor LOOPbeginSELECT name id INTO accname id prFROM whouse.whouse grin valid mvWHERE whouse.whouse grin valid mv.taxon id = rec.taxon id;INSERT INTO whouse.name (name id, name text, name usage)VALUES (name seq.nextval, rec.taxon, ’synonym’);EXCEPTIONWHEN dup val on index THENname id pr := 0;end;IF name id pr IS NULL THENINSERT INTO whouse.assertion (assertion id, name id, source id, dbsource id)VALUES (assertion seq.nextval, name seq.currval, source id pr, rec.grin id);INSERT INTO whouse.synonym name (name id, valid name id)VALUES (name seq.currval, accname id pr);ELSESELECT name id INTO name id prFROM whouse.nameWHERE name text = rec.taxon;INSERT INTO whouse.assertion (assertion id,name id, source id, dbsource id)VALUES (assertion seq.nextval, name id pr, source id pr, rec.grin id);INSERT INTO whouse.synonym name (name id, valid name id)VALUES (name id pr, accname id pr);COMMIT;END IF;END LOOP;UPDATE whouse.name SET name text = rtrim(name text);COMMIT;end;
Figure 4.16: Procedure add grin synonyms.
89
4.5 Sp2000
4.5 Sp2000
The Sp2000 system is based on a loosely federated architecture, where the data sources maintain
autonomy. Although the architecture of Sp2000 is described as an “autonomous federated
system”, the system is distributed as a CD so the data are materialised. The annual CD
checklist in 2003 was distributed within Microsoft Access. Later versions were moved to MySQL
and were much easier to use. The MySQL versions of Sp2000 released in 2005 and 2006 were
added to TCl-Db. The MySQL data structure was replicated first into a local installation of
MySQL, and the data were then loaded into TCl-Db using SQL dumps.
4.5.1 Schema mapping and Integration
The Sp2000 load uses a layer of materialized views to speed up the data load and also greatly
simplify the PL/SQL procedures (Figure 4.17). Names, nodes, synonyms and vernaculars
are loaded in much the same way as the other data sources, using specific views. The first
view, sp2k nameids mv, gathers the names in Sp2000 that are already in TCl-Db. These
data are loaded directly into the assertion table by the add sp2k names procedure. Names
unique to Sp2000 are gathered into the view sp2k only mv and are subsequently loaded into
the name and assertion tables. The table sp2k tree is created using a process similar
to that outlined in Figure 4.5 for ITIS, using the record id and parent id attributes in the
taxa tree table. These data are loaded into TCl-Db, using data gathered into the materialized
view, sp2k valid mv which is built once the add sp2k names procedure has completed. In
Sp2000 synonyms are stored in the taxa table. These have the value 0 in the attribute
is accepted name. Synonyms are loaded after all valid names have been loaded into TCl-
Db, using the add sp2k synonyms procedure. The procedure add sp2k vernaculars takes
data from the sp2k common names mv and sp2k valid mv views and loads these data into
the name, assertion and vernacular tables in TCl-Db.
90
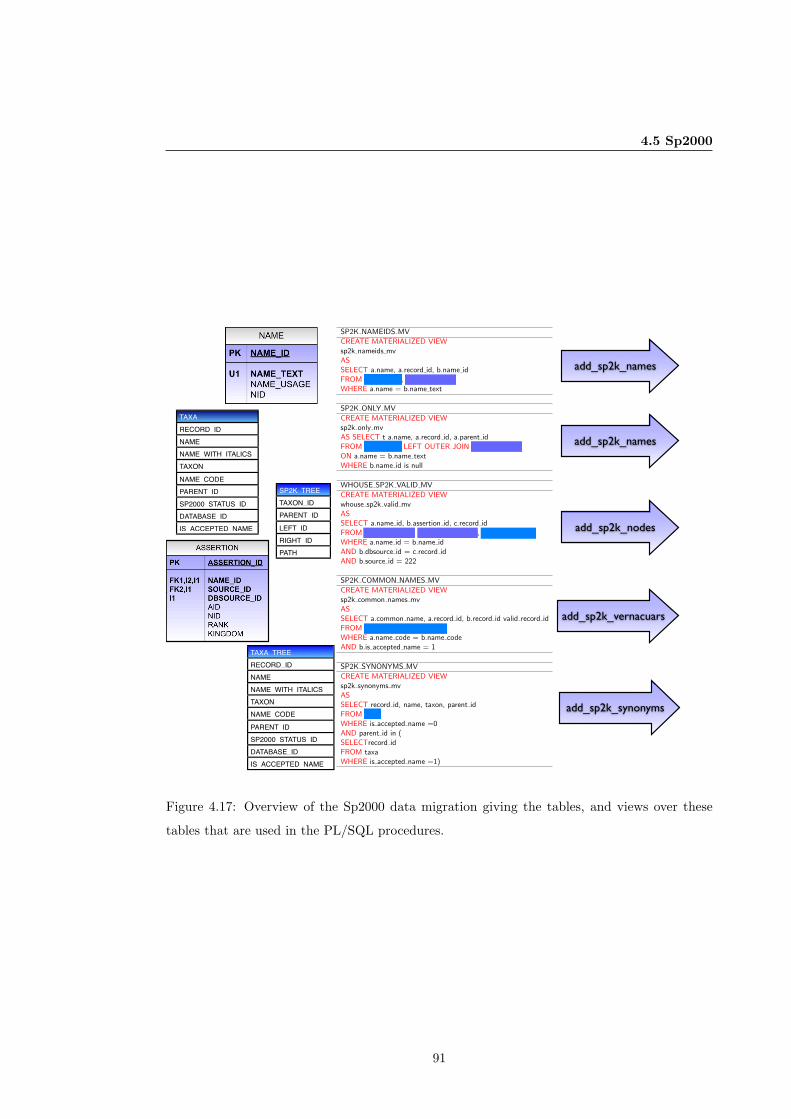
4.5 Sp2000
TAXA RECORD_IDNAMENAME_WITH_ITALICSTAXON
NAME_CODEPARENT_IDSP2000_STATUS_IDDATABASE_IDIS_ACCEPTED_NAME
TAXA_TREE RECORD_IDNAMENAME_WITH_ITALICSTAXONNAME_CODE
PARENT_IDSP2000_STATUS_IDDATABASE_IDIS_ACCEPTED_NAME
add_sp2k_names
SP2K_TREE TAXON_IDPARENT_ID
LEFT_IDRIGHT_IDPATH
SP2K NAMEIDS MV
CREATE MATERIALIZED VIEWsp2k nameids mvASSELECT a.name, a.record id, b.name idFROM sp2k.taxa a, whouse.name bWHERE a.name = b.name text
SP2K ONLY MV
CREATE MATERIALIZED VIEWsp2k only mvAS SELECT t a.name, a.record id, a.parent idFROM sp2k.taxa a LEFT OUTER JOIN whouse.name bON a.name = b.name textWHERE b.name id is null
WHOUSE SP2K VALID MV
CREATE MATERIALIZED VIEWwhouse sp2k valid mvASSELECT a.name id, b.assertion id, c.record idFROM whouse.name a, whouse.assertion b, sp2k.taxa tree cWHERE a.name id = b.name idAND b.dbsource id = c.record idAND b.source id = 222
SP2K COMMON NAMES MV
CREATE MATERIALIZED VIEWsp2k common names mvASSELECT a.common name, a.record id, b.record id valid record idFROM common names a, taxa bWHERE a.name code = b.name codeAND b.is accepted name = 1
SP2K SYNONYMS MV
CREATE MATERIALIZED VIEWsp2k synonyms mvASSELECT record id, name, taxon, parent idFROM taxaWHERE is accepted name =0AND parent id in (SELECTrecord idFROM taxaWHERE is accepted name =1)
add_sp2k_names
add_sp2k_nodes
add_sp2k_vernacuars
add_sp2k_synonyms
Figure 4.17: Overview of the Sp2000 data migration giving the tables, and views over these
tables that are used in the PL/SQL procedures.
91
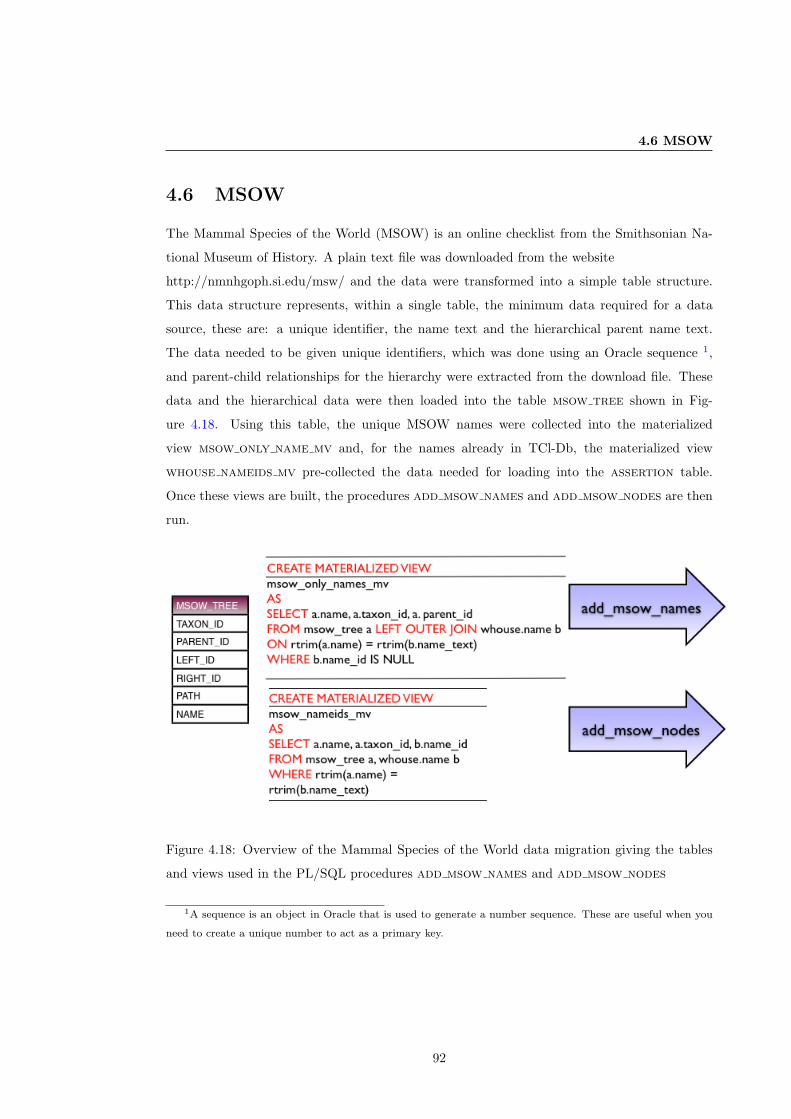
4.6 MSOW
4.6 MSOW
The Mammal Species of the World (MSOW) is an online checklist from the Smithsonian Na-
tional Museum of History. A plain text file was downloaded from the website
http://nmnhgoph.si.edu/msw/ and the data were transformed into a simple table structure.
This data structure represents, within a single table, the minimum data required for a data
source, these are: a unique identifier, the name text and the hierarchical parent name text.
The data needed to be given unique identifiers, which was done using an Oracle sequence 1,
and parent-child relationships for the hierarchy were extracted from the download file. These
data and the hierarchical data were then loaded into the table msow tree shown in Fig-
ure 4.18. Using this table, the unique MSOW names were collected into the materialized
view msow only name mv and, for the names already in TCl-Db, the materialized view
whouse nameids mv pre-collected the data needed for loading into the assertion table.
Once these views are built, the procedures add msow names and add msow nodes are then
run.
Figure 4.18: Overview of the Mammal Species of the World data migration giving the tables
and views used in the PL/SQL procedures add msow names and add msow nodes
1A sequence is an object in Oracle that is used to generate a number sequence. These are useful when you
need to create a unique number to act as a primary key.
92
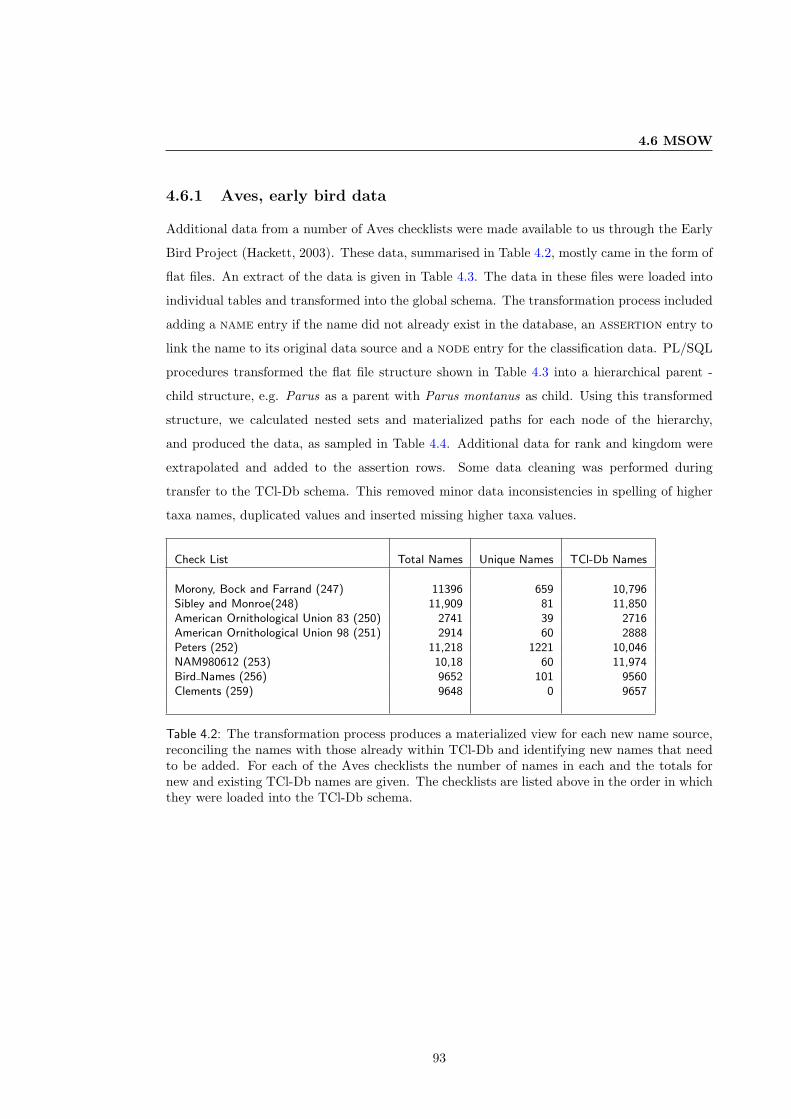
4.6 MSOW
4.6.1 Aves, early bird data
Additional data from a number of Aves checklists were made available to us through the Early
Bird Project (Hackett, 2003). These data, summarised in Table 4.2, mostly came in the form of
flat files. An extract of the data is given in Table 4.3. The data in these files were loaded into
individual tables and transformed into the global schema. The transformation process included
adding a name entry if the name did not already exist in the database, an assertion entry to
link the name to its original data source and a node entry for the classification data. PL/SQL
procedures transformed the flat file structure shown in Table 4.3 into a hierarchical parent -
child structure, e.g. Parus as a parent with Parus montanus as child. Using this transformed
structure, we calculated nested sets and materialized paths for each node of the hierarchy,
and produced the data, as sampled in Table 4.4. Additional data for rank and kingdom were
extrapolated and added to the assertion rows. Some data cleaning was performed during
transfer to the TCl-Db schema. This removed minor data inconsistencies in spelling of higher
taxa names, duplicated values and inserted missing higher taxa values.
Check List Total Names Unique Names TCl-Db Names
Morony, Bock and Farrand (247) 11396 659 10,796Sibley and Monroe(248) 11,909 81 11,850American Ornithological Union 83 (250) 2741 39 2716American Ornithological Union 98 (251) 2914 60 2888Peters (252) 11,218 1221 10,046NAM980612 (253) 10,18 60 11,974Bird Names (256) 9652 101 9560Clements (259) 9648 0 9657
Table 4.2: The transformation process produces a materialized view for each new name source,reconciling the names with those already within TCl-Db and identifying new names that needto be added. For each of the Aves checklists the number of names in each and the totals fornew and existing TCl-Db names are given. The checklists are listed above in the order in whichthey were loaded into the TCl-Db schema.
93
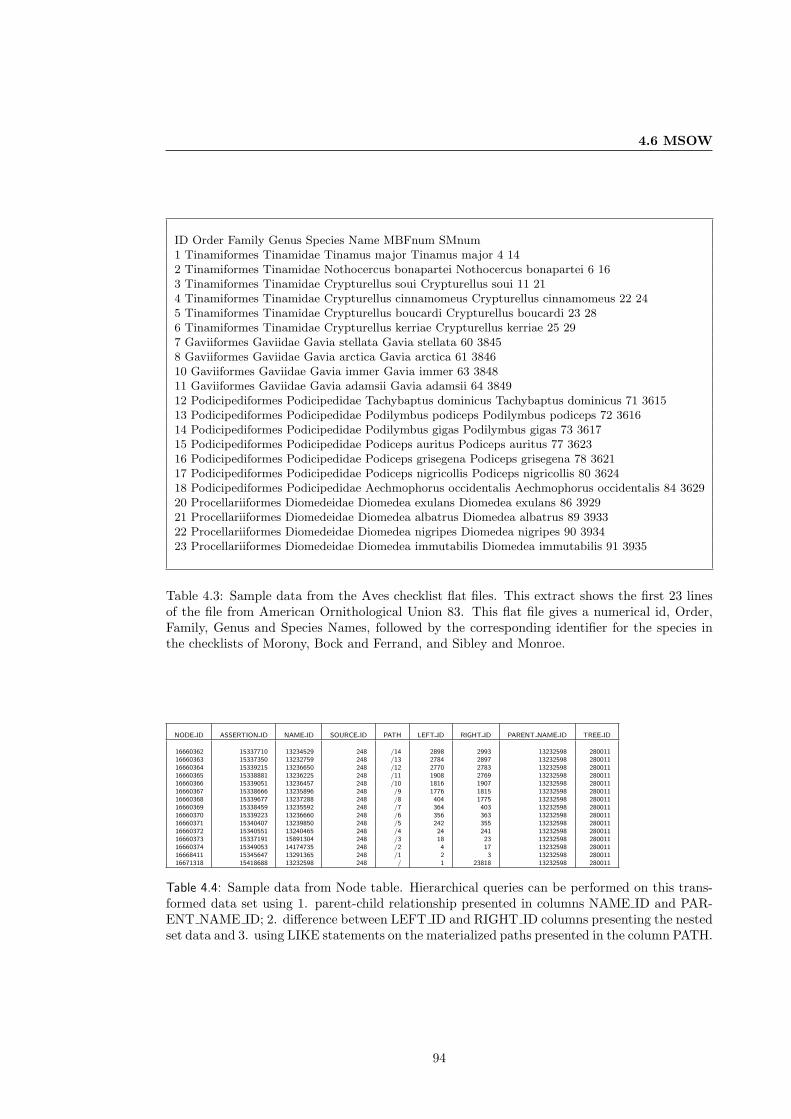
4.6 MSOW
ID Order Family Genus Species Name MBFnum SMnum1 Tinamiformes Tinamidae Tinamus major Tinamus major 4 142 Tinamiformes Tinamidae Nothocercus bonapartei Nothocercus bonapartei 6 163 Tinamiformes Tinamidae Crypturellus soui Crypturellus soui 11 214 Tinamiformes Tinamidae Crypturellus cinnamomeus Crypturellus cinnamomeus 22 245 Tinamiformes Tinamidae Crypturellus boucardi Crypturellus boucardi 23 286 Tinamiformes Tinamidae Crypturellus kerriae Crypturellus kerriae 25 297 Gaviiformes Gaviidae Gavia stellata Gavia stellata 60 38458 Gaviiformes Gaviidae Gavia arctica Gavia arctica 61 384610 Gaviiformes Gaviidae Gavia immer Gavia immer 63 384811 Gaviiformes Gaviidae Gavia adamsii Gavia adamsii 64 384912 Podicipediformes Podicipedidae Tachybaptus dominicus Tachybaptus dominicus 71 361513 Podicipediformes Podicipedidae Podilymbus podiceps Podilymbus podiceps 72 361614 Podicipediformes Podicipedidae Podilymbus gigas Podilymbus gigas 73 361715 Podicipediformes Podicipedidae Podiceps auritus Podiceps auritus 77 362316 Podicipediformes Podicipedidae Podiceps grisegena Podiceps grisegena 78 362117 Podicipediformes Podicipedidae Podiceps nigricollis Podiceps nigricollis 80 362418 Podicipediformes Podicipedidae Aechmophorus occidentalis Aechmophorus occidentalis 84 362920 Procellariiformes Diomedeidae Diomedea exulans Diomedea exulans 86 392921 Procellariiformes Diomedeidae Diomedea albatrus Diomedea albatrus 89 393322 Procellariiformes Diomedeidae Diomedea nigripes Diomedea nigripes 90 393423 Procellariiformes Diomedeidae Diomedea immutabilis Diomedea immutabilis 91 3935
Table 4.3: Sample data from the Aves checklist flat files. This extract shows the first 23 linesof the file from American Ornithological Union 83. This flat file gives a numerical id, Order,Family, Genus and Species Names, followed by the corresponding identifier for the species inthe checklists of Morony, Bock and Ferrand, and Sibley and Monroe.
NODE ID ASSERTION ID NAME ID SOURCE ID PATH LEFT ID RIGHT ID PARENT NAME ID TREE ID
16660362 15337710 13234529 248 /14 2898 2993 13232598 28001116660363 15337350 13232759 248 /13 2784 2897 13232598 28001116660364 15339215 13236650 248 /12 2770 2783 13232598 28001116660365 15338881 13236225 248 /11 1908 2769 13232598 28001116660366 15339051 13236457 248 /10 1816 1907 13232598 28001116660367 15338666 13235896 248 /9 1776 1815 13232598 28001116660368 15339677 13237288 248 /8 404 1775 13232598 28001116660369 15338459 13235592 248 /7 364 403 13232598 28001116660370 15339223 13236660 248 /6 356 363 13232598 28001116660371 15340407 13239850 248 /5 242 355 13232598 28001116660372 15340551 13240465 248 /4 24 241 13232598 28001116660373 15337191 15891304 248 /3 18 23 13232598 28001116660374 15349053 14174735 248 /2 4 17 13232598 28001116668411 15345647 13291365 248 /1 2 3 13232598 28001116671318 15418688 13232598 248 / 1 23818 13232598 280011
Table 4.4: Sample data from Node table. Hierarchical queries can be performed on this trans-formed data set using 1. parent-child relationship presented in columns NAME ID and PAR-ENT NAME ID; 2. difference between LEFT ID and RIGHT ID columns presenting the nestedset data and 3. using LIKE statements on the materialized paths presented in the column PATH.
94
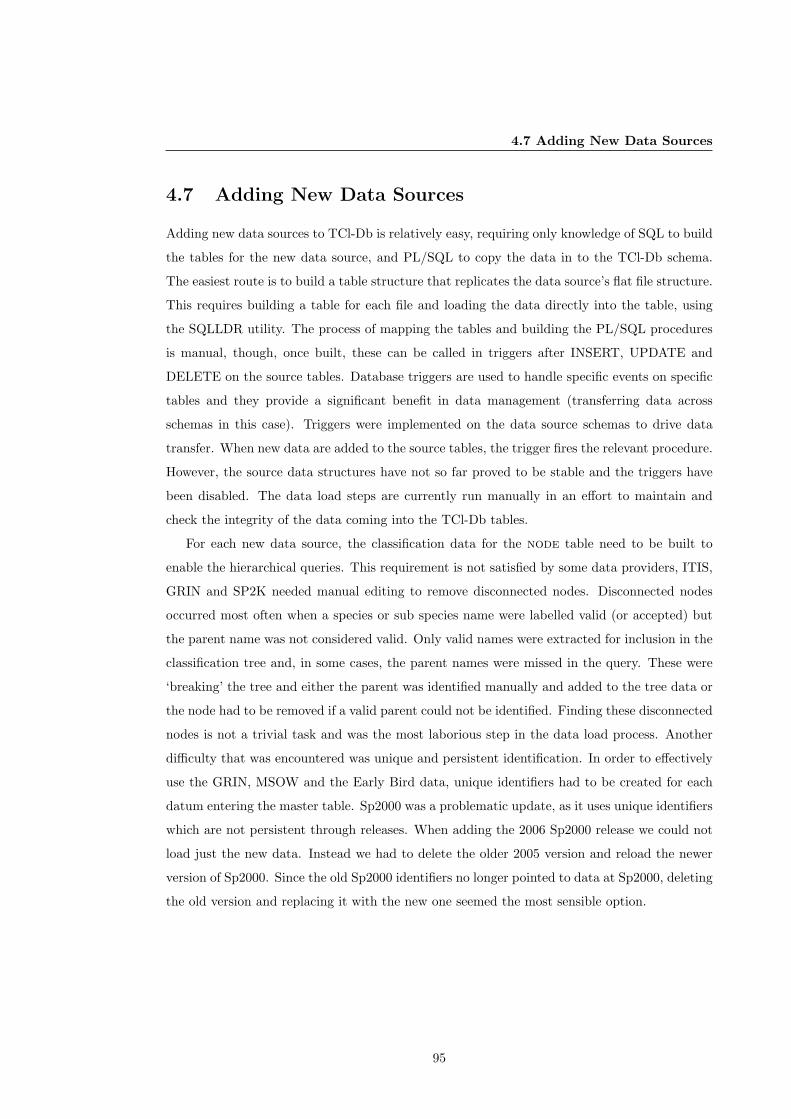
4.7 Adding New Data Sources
4.7 Adding New Data Sources
Adding new data sources to TCl-Db is relatively easy, requiring only knowledge of SQL to build
the tables for the new data source, and PL/SQL to copy the data in to the TCl-Db schema.
The easiest route is to build a table structure that replicates the data source’s flat file structure.
This requires building a table for each file and loading the data directly into the table, using
the SQLLDR utility. The process of mapping the tables and building the PL/SQL procedures
is manual, though, once built, these can be called in triggers after INSERT, UPDATE and
DELETE on the source tables. Database triggers are used to handle specific events on specific
tables and they provide a significant benefit in data management (transferring data across
schemas in this case). Triggers were implemented on the data source schemas to drive data
transfer. When new data are added to the source tables, the trigger fires the relevant procedure.
However, the source data structures have not so far proved to be stable and the triggers have
been disabled. The data load steps are currently run manually in an effort to maintain and
check the integrity of the data coming into the TCl-Db tables.
For each new data source, the classification data for the node table need to be built to
enable the hierarchical queries. This requirement is not satisfied by some data providers, ITIS,
GRIN and SP2K needed manual editing to remove disconnected nodes. Disconnected nodes
occurred most often when a species or sub species name were labelled valid (or accepted) but
the parent name was not considered valid. Only valid names were extracted for inclusion in the
classification tree and, in some cases, the parent names were missed in the query. These were
‘breaking’ the tree and either the parent was identified manually and added to the tree data or
the node had to be removed if a valid parent could not be identified. Finding these disconnected
nodes is not a trivial task and was the most laborious step in the data load process. Another
difficulty that was encountered was unique and persistent identification. In order to effectively
use the GRIN, MSOW and the Early Bird data, unique identifiers had to be created for each
datum entering the master table. Sp2000 was a problematic update, as it uses unique identifiers
which are not persistent through releases. When adding the 2006 Sp2000 release we could not
load just the new data. Instead we had to delete the older 2005 version and reload the newer
version of Sp2000. Since the old Sp2000 identifiers no longer pointed to data at Sp2000, deleting
the old version and replacing it with the new one seemed the most sensible option.
95
4.8 Summary and Preview
4.7.1 Data Availability
The data are available in two forms, Oracle EXP dumps and a MYSQL dump from a version
ported to MySQL. The Oracle download consists of two EXP files, one full export which con-
tains the full data warehouse including the source data silos, and the other is a simple export
containing just the global schema and data. SQL scripts are also provided to replicate the table
structures.
The MySQL download contains the global schema and data. An XML format of the
integrated assertion data of the global schema is also available. These data can be down-
loaded from http://spira.zoology.gla.ac.uk/download.php along with full instructions on their
use. The PL/SQL procedures and views used in the data loads are fully documented at
http://spira.zoology.gla.ac.uk/doc.php.
4.8 Summary and Preview
This chapter described the implementation aspects of data integration undertaken in the course
of constructing TCl-Db. Data loading, cleaning and structuring into trees was carried out using
a mixture of software programs written in C++ and PL/SQL. Database view mechanisms and
stored procedures played a decisive role in the success of this undertaking. Full details of
imports from all the data sources were given. The next chapter will focus on how this data can
now be used to satisfy user information needs.
96
Chapter 5
Database Utility and Web Tools
5.1 Overview
TCl-Db was primarily built to meet the requirements of the systematics/tree building com-
munity. This chapter exemplifies the utility of the database within two contexts: using the
data in TCl-Db to translate search terms into those used in databases such as TreeBASE, and
using TCl-Db for more complex analysis, to synonymise terms across various data sources.
The first section details the queries that are supported by TCl-Db, with examples. We then
go on to extend these queries and display the utility of the data warehouse in contributing to
a better understanding of the individual data sources. Using a warehouse approach to meet
the requirements has the added benefit of enabling queries that compare data sources side by
side. Querying integrated data as a unit is a particular benefit of data warehouses. The final
section details the web tools that were built to search the data in TCl-Db. Finally, we present
a wrapper that uses the data in TCl-Db to deliver taxonomically intelligent queries on a local
copy of TreeBASE.
5.2 Supported Queries
The most important requirement in the development of TCl-Db was to deliver taxonomically
intelligent queries. These queries are: hierarchical queries, where the query term expands to
include subordinate terms in the classification of choice, and the expansion of vernaculars and
synonym queries to include valid names and other names associated with the original search
97
5.2 Supported Queries
term. The TCl-Db data model is described in Chapter 3, while the queries that this model and
the implementation supports are exemplified here.
5.2.1 Hierarchical queries
The most important of the requirements was the capacity to store and query multiple classi-
fications. Although a number of amalgamated database systems stored names from multiple
sources, the classifications of those names were not stored. This was also deemed one of the
most important features lacking in TreeBASE. TreeBASE contains taxon names but no classifi-
cation. TCl-Db provides three mechanisms to query the hierarchical data: the Oracle Connect
By query (Gennick, 2006), nested sets query and the materialised path query (Celko, 2004).
These are outlined below.
Using Parent-Child Relationship on node
Simple queries can be performed using the parent-child relationship stored in the node table.
For example, a very simple query can collect all species within a genus using the query shown
in Appendix A (A1). An alternative form of this query is shown in A2 using rank data from
the assertion table.
Oracle’s connect by statement
The connect by clause is an extension to SQL’s SELECT query implemented within the
Oracle RDBMS, specifically to enable hierarchical queries using parent rows and child rows.
Within TCl-Db the connect by query also uses the parent-child relationship modelled by the
attributes name id and parent name id in the node table. For example, in Appendix A (A3)
the connect by starts with Crocodilia and moves up the tree to the Root node. Queries A4
and A5 use an Oracle function SYS CONNECT BY PATH which produces a delimited path
listing of all names up to the root of the hierarchy.
Hierarchical queries using nested set, left and right IDs and paths
The nested set and path data have been included to make the system more accessible and
portable to other database products, including MySQL. The nested set mechanism is described
by Celko (2004) and these data need to be calculated using graph algorithms. The path string
complements the nested mechanism. It turned out that although the nested set query as in
98
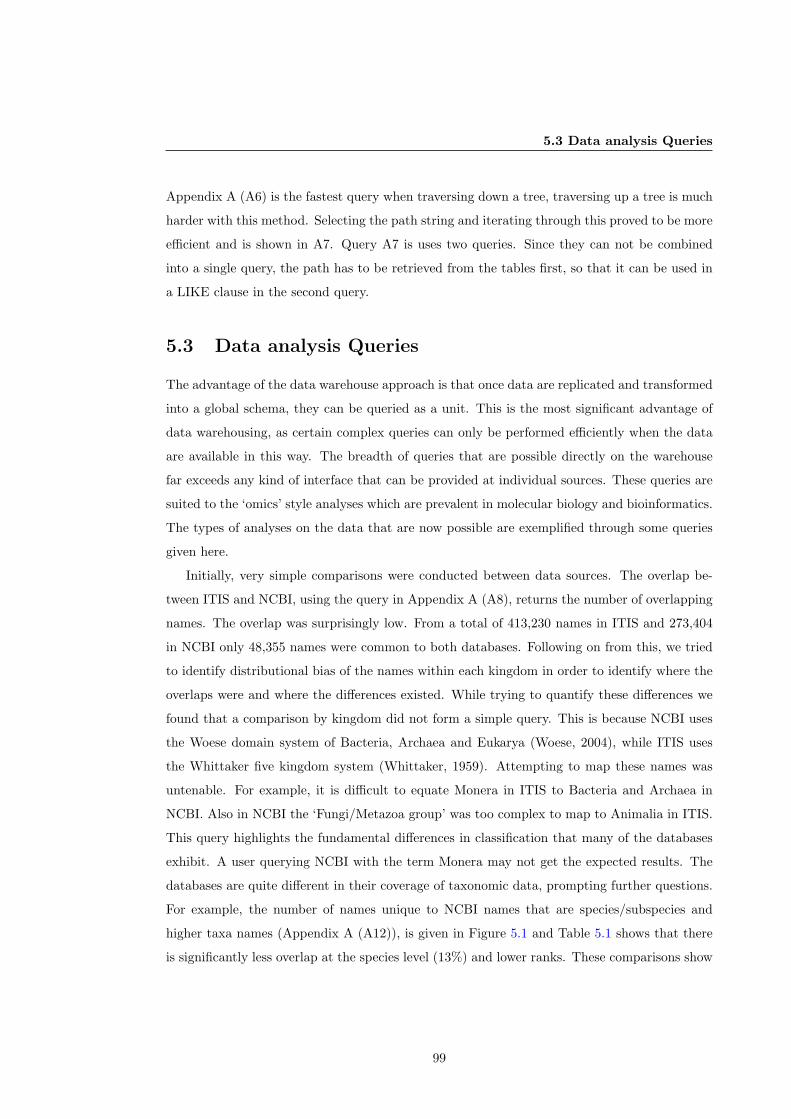
5.3 Data analysis Queries
Appendix A (A6) is the fastest query when traversing down a tree, traversing up a tree is much
harder with this method. Selecting the path string and iterating through this proved to be more
efficient and is shown in A7. Query A7 is uses two queries. Since they can not be combined
into a single query, the path has to be retrieved from the tables first, so that it can be used in
a LIKE clause in the second query.
5.3 Data analysis Queries
The advantage of the data warehouse approach is that once data are replicated and transformed
into a global schema, they can be queried as a unit. This is the most significant advantage of
data warehousing, as certain complex queries can only be performed efficiently when the data
are available in this way. The breadth of queries that are possible directly on the warehouse
far exceeds any kind of interface that can be provided at individual sources. These queries are
suited to the ‘omics’ style analyses which are prevalent in molecular biology and bioinformatics.
The types of analyses on the data that are now possible are exemplified through some queries
given here.
Initially, very simple comparisons were conducted between data sources. The overlap be-
tween ITIS and NCBI, using the query in Appendix A (A8), returns the number of overlapping
names. The overlap was surprisingly low. From a total of 413,230 names in ITIS and 273,404
in NCBI only 48,355 names were common to both databases. Following on from this, we tried
to identify distributional bias of the names within each kingdom in order to identify where the
overlaps were and where the differences existed. While trying to quantify these differences we
found that a comparison by kingdom did not form a simple query. This is because NCBI uses
the Woese domain system of Bacteria, Archaea and Eukarya (Woese, 2004), while ITIS uses
the Whittaker five kingdom system (Whittaker, 1959). Attempting to map these names was
untenable. For example, it is difficult to equate Monera in ITIS to Bacteria and Archaea in
NCBI. Also in NCBI the ‘Fungi/Metazoa group’ was too complex to map to Animalia in ITIS.
This query highlights the fundamental differences in classification that many of the databases
exhibit. A user querying NCBI with the term Monera may not get the expected results. The
databases are quite different in their coverage of taxonomic data, prompting further questions.
For example, the number of names unique to NCBI names that are species/subspecies and
higher taxa names (Appendix A (A12)), is given in Figure 5.1 and Table 5.1 shows that there
is significantly less overlap at the species level (13%) and lower ranks. These comparisons show
99
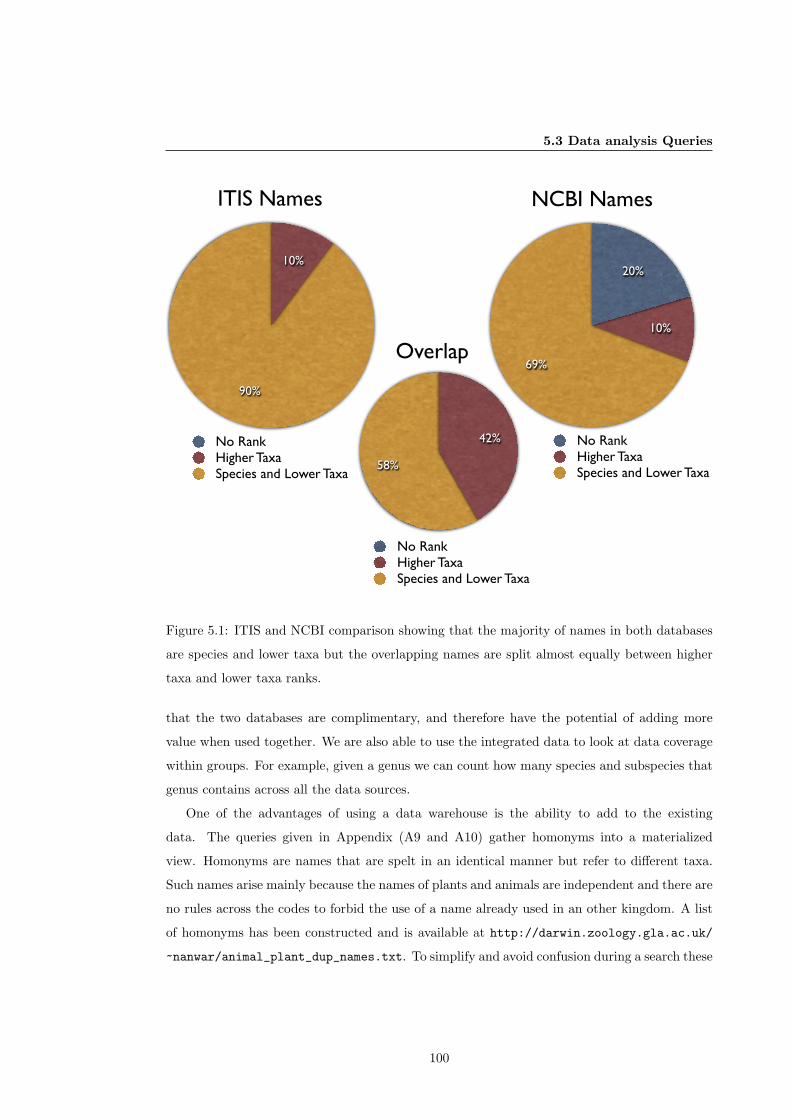
5.3 Data analysis Queries
69%
10%
20%
No RankHigher TaxaSpecies and Lower Taxa
NCBI Names
90%
10%
No RankHigher TaxaSpecies and Lower Taxa
ITIS Names
58%
42%
No RankHigher TaxaSpecies and Lower Taxa
Overlap
Figure 5.1: ITIS and NCBI comparison showing that the majority of names in both databases
are species and lower taxa but the overlapping names are split almost equally between higher
taxa and lower taxa ranks.
that the two databases are complimentary, and therefore have the potential of adding more
value when used together. We are also able to use the integrated data to look at data coverage
within groups. For example, given a genus we can count how many species and subspecies that
genus contains across all the data sources.
One of the advantages of using a data warehouse is the ability to add to the existing
data. The queries given in Appendix (A9 and A10) gather homonyms into a materialized
view. Homonyms are names that are spelt in an identical manner but refer to different taxa.
Such names arise mainly because the names of plants and animals are independent and there are
no rules across the codes to forbid the use of a name already used in an other kingdom. A list
of homonyms has been constructed and is available at http://darwin.zoology.gla.ac.uk/
~nanwar/animal_plant_dup_names.txt. To simplify and avoid confusion during a search these
100
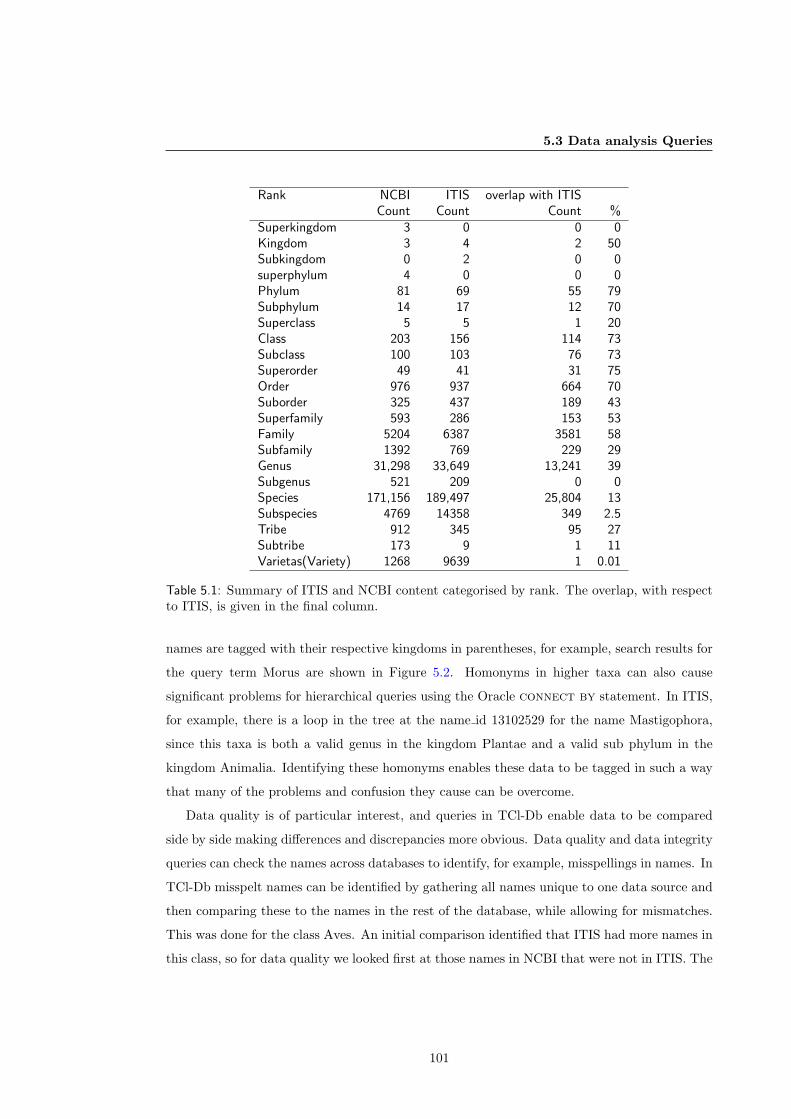
5.3 Data analysis Queries
Rank NCBI ITIS overlap with ITISCount Count Count %
Superkingdom 3 0 0 0Kingdom 3 4 2 50Subkingdom 0 2 0 0superphylum 4 0 0 0Phylum 81 69 55 79Subphylum 14 17 12 70Superclass 5 5 1 20Class 203 156 114 73Subclass 100 103 76 73Superorder 49 41 31 75Order 976 937 664 70Suborder 325 437 189 43Superfamily 593 286 153 53Family 5204 6387 3581 58Subfamily 1392 769 229 29Genus 31,298 33,649 13,241 39Subgenus 521 209 0 0Species 171,156 189,497 25,804 13Subspecies 4769 14358 349 2.5Tribe 912 345 95 27Subtribe 173 9 1 11Varietas(Variety) 1268 9639 1 0.01
Table 5.1: Summary of ITIS and NCBI content categorised by rank. The overlap, with respectto ITIS, is given in the final column.
names are tagged with their respective kingdoms in parentheses, for example, search results for
the query term Morus are shown in Figure 5.2. Homonyms in higher taxa can also cause
significant problems for hierarchical queries using the Oracle connect by statement. In ITIS,
for example, there is a loop in the tree at the name id 13102529 for the name Mastigophora,
since this taxa is both a valid genus in the kingdom Plantae and a valid sub phylum in the
kingdom Animalia. Identifying these homonyms enables these data to be tagged in such a way
that many of the problems and confusion they cause can be overcome.
Data quality is of particular interest, and queries in TCl-Db enable data to be compared
side by side making differences and discrepancies more obvious. Data quality and data integrity
queries can check the names across databases to identify, for example, misspellings in names. In
TCl-Db misspelt names can be identified by gathering all names unique to one data source and
then comparing these to the names in the rest of the database, while allowing for mismatches.
This was done for the class Aves. An initial comparison identified that ITIS had more names in
this class, so for data quality we looked first at those names in NCBI that were not in ITIS. The
101
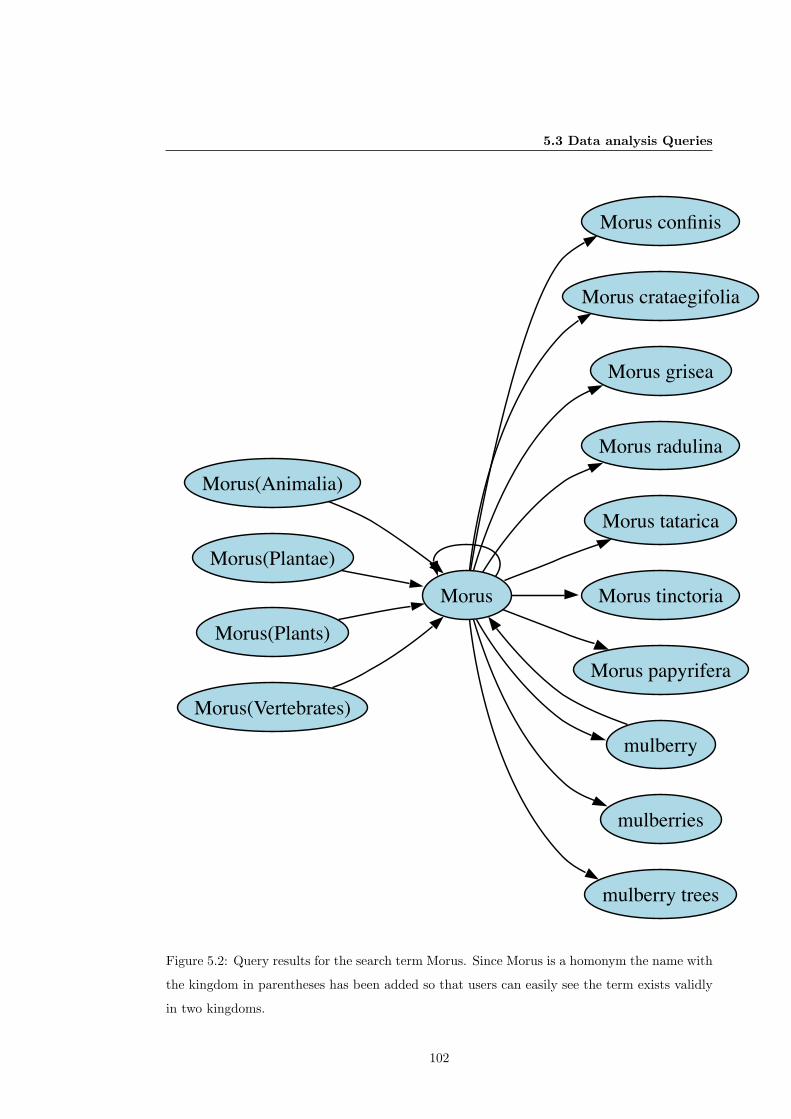
5.3 Data analysis Queries
Morus
Morus confinis
Morus crataegifolia
Morus grisea
Morus radulina
Morus tatarica
Morus tinctoria
Morus papyrifera
mulberry
mulberries
mulberry trees
Morus(Animalia)
Morus(Plantae)
Morus(Plants)
Morus(Vertebrates)
Figure 5.2: Query results for the search term Morus. Since Morus is a homonym the name with
the kingdom in parentheses has been added so that users can easily see the term exists validly
in two kingdoms.
102
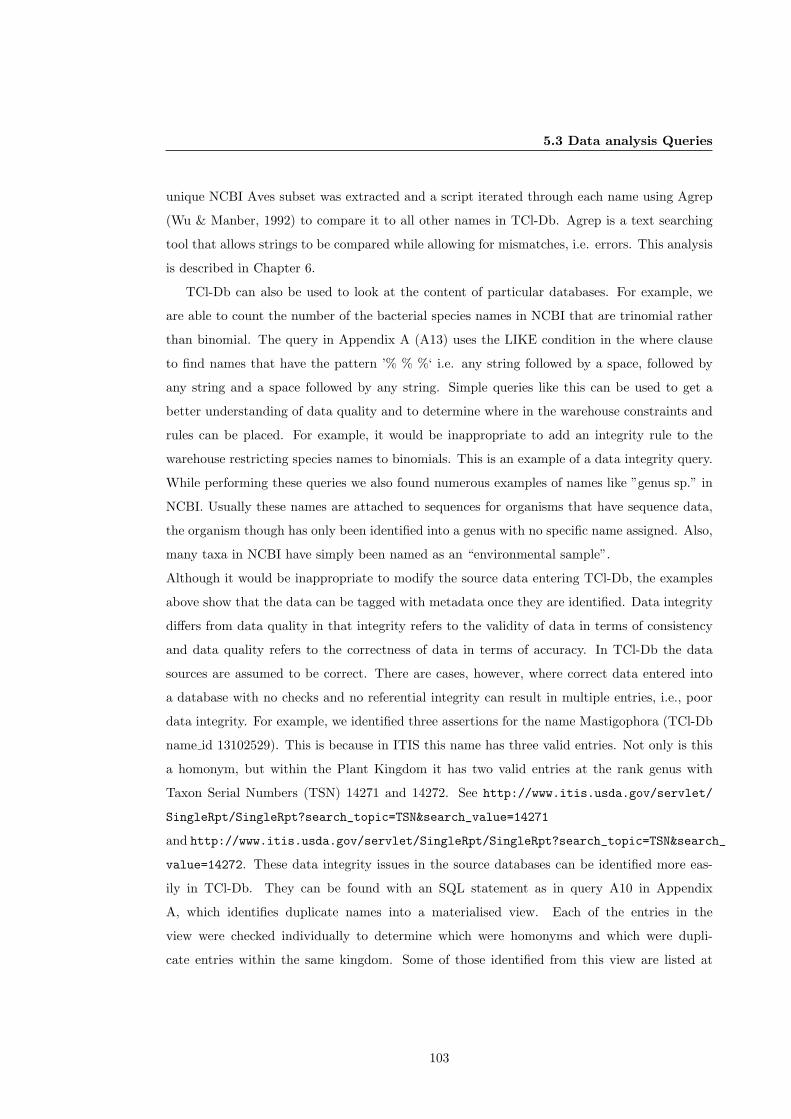
5.3 Data analysis Queries
unique NCBI Aves subset was extracted and a script iterated through each name using Agrep
(Wu & Manber, 1992) to compare it to all other names in TCl-Db. Agrep is a text searching
tool that allows strings to be compared while allowing for mismatches, i.e. errors. This analysis
is described in Chapter 6.
TCl-Db can also be used to look at the content of particular databases. For example, we
are able to count the number of the bacterial species names in NCBI that are trinomial rather
than binomial. The query in Appendix A (A13) uses the LIKE condition in the where clause
to find names that have the pattern ’% % %‘ i.e. any string followed by a space, followed by
any string and a space followed by any string. Simple queries like this can be used to get a
better understanding of data quality and to determine where in the warehouse constraints and
rules can be placed. For example, it would be inappropriate to add an integrity rule to the
warehouse restricting species names to binomials. This is an example of a data integrity query.
While performing these queries we also found numerous examples of names like ”genus sp.” in
NCBI. Usually these names are attached to sequences for organisms that have sequence data,
the organism though has only been identified into a genus with no specific name assigned. Also,
many taxa in NCBI have simply been named as an “environmental sample”.
Although it would be inappropriate to modify the source data entering TCl-Db, the examples
above show that the data can be tagged with metadata once they are identified. Data integrity
differs from data quality in that integrity refers to the validity of data in terms of consistency
and data quality refers to the correctness of data in terms of accuracy. In TCl-Db the data
sources are assumed to be correct. There are cases, however, where correct data entered into
a database with no checks and no referential integrity can result in multiple entries, i.e., poor
data integrity. For example, we identified three assertions for the name Mastigophora (TCl-Db
name id 13102529). This is because in ITIS this name has three valid entries. Not only is this
a homonym, but within the Plant Kingdom it has two valid entries at the rank genus with
Taxon Serial Numbers (TSN) 14271 and 14272. See http://www.itis.usda.gov/servlet/
SingleRpt/SingleRpt?search_topic=TSN&search_value=14271
and http://www.itis.usda.gov/servlet/SingleRpt/SingleRpt?search_topic=TSN&search_
value=14272. These data integrity issues in the source databases can be identified more eas-
ily in TCl-Db. They can be found with an SQL statement as in query A10 in Appendix
A, which identifies duplicate names into a materialised view. Each of the entries in the
view were checked individually to determine which were homonyms and which were dupli-
cate entries within the same kingdom. Some of those identified from this view are listed at
103

5.3 Data analysis Queries
http://spira.zoology.gla.ac.uk/itis_valid_dups.txt. A similar example of poor data
integrity in one of the source databases, SP2K, can be shown in the records for Vertebrata
(record id 2348763), Amphibia (record id 2349507) and Isoptera (record id 2348853) which are
all in the kingdom Animalia. In one version of SP2K these are not accepted names and they
point to the valid name Rhodomelaceae (record id 1248761). These records are incorrect be-
cause the valid name Rhodomelaceae is in the plant kingdom and not the animal kingdom.
The query A11 in Appendix A is used to identify and link names via synonyms and vernaculars
across the databases, answering the question “how many names in the synonym name table
are also considered to be valid names”. Such names could have entered the synonym name
table because at least one data source considers the name a synonym. Using several similar
SQL queries, we found that not only do NCBI and ITIS differ in their coverage of names but
names that do overlap may also be treated differently. For example, 866 ITIS valid names are
considered to be synonyms in NCBI.
All linked names, misspellings, homonyms and data recovered from these queries have been
placed into the table: name search which can be searched using the example query A14 in
Appendix A. The result returned from this query is shown in Figure 5.2.
5.3.1 Comparing classifications.
Comparing classifications is a complex problem that is more easily accomplished through graph
based queries (Zhong et al., 1996, 1999) than the set based queries within SQL. The importance
of mapping taxonomies to each other is demonstrated with queries such as gathering data from
one system using the classification of another. It could be, for example, that a user wishes
to retrieve all sequence data for “Metazoa”. Another example is highlighted by the case of
“Ecdysozoa”. The Ecdysozoa are a group of protostome animals which include the Arthropoda
and Nematoda, and several smaller phyla (Aguinaldo et al., 1997). Proponents of this clade may
wish to use it as a search term, but currently the NCBI taxonomy does not include this term.
To gather sequence data for this group requires mapping the term on to the NCBI classification.
A direct comparison of NCBI nodes and ITIS nodes from query A15 in Appendix A gives
44,320 names common to both classifications. Extending this query (A16) we can tell how many
of these do not have the same parent name and are potentially classified differently. Queries
to map across classifications are also possible using TCl-Db. Using hierarchical queries it is
possible, for example, to take children of specific nodes in one classification and compare them
to the children nodes in another classification. Discrepancies can be identified for those children
104
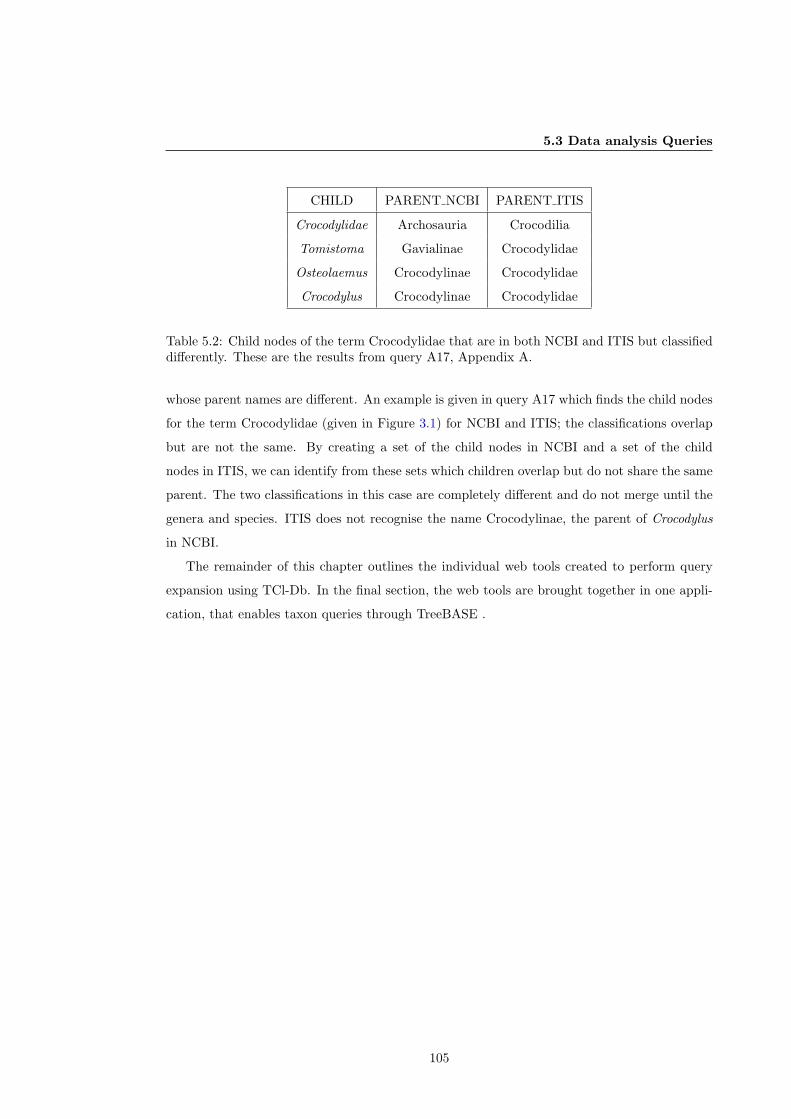
5.3 Data analysis Queries
CHILD PARENT NCBI PARENT ITIS
Crocodylidae Archosauria Crocodilia
Tomistoma Gavialinae Crocodylidae
Osteolaemus Crocodylinae Crocodylidae
Crocodylus Crocodylinae Crocodylidae
Table 5.2: Child nodes of the term Crocodylidae that are in both NCBI and ITIS but classifieddifferently. These are the results from query A17, Appendix A.
whose parent names are different. An example is given in query A17 which finds the child nodes
for the term Crocodylidae (given in Figure 3.1) for NCBI and ITIS; the classifications overlap
but are not the same. By creating a set of the child nodes in NCBI and a set of the child
nodes in ITIS, we can identify from these sets which children overlap but do not share the same
parent. The two classifications in this case are completely different and do not merge until the
genera and species. ITIS does not recognise the name Crocodylinae, the parent of Crocodylus
in NCBI.
The remainder of this chapter outlines the individual web tools created to perform query
expansion using TCl-Db. In the final section, the web tools are brought together in one appli-
cation, that enables taxon queries through TreeBASE .
105
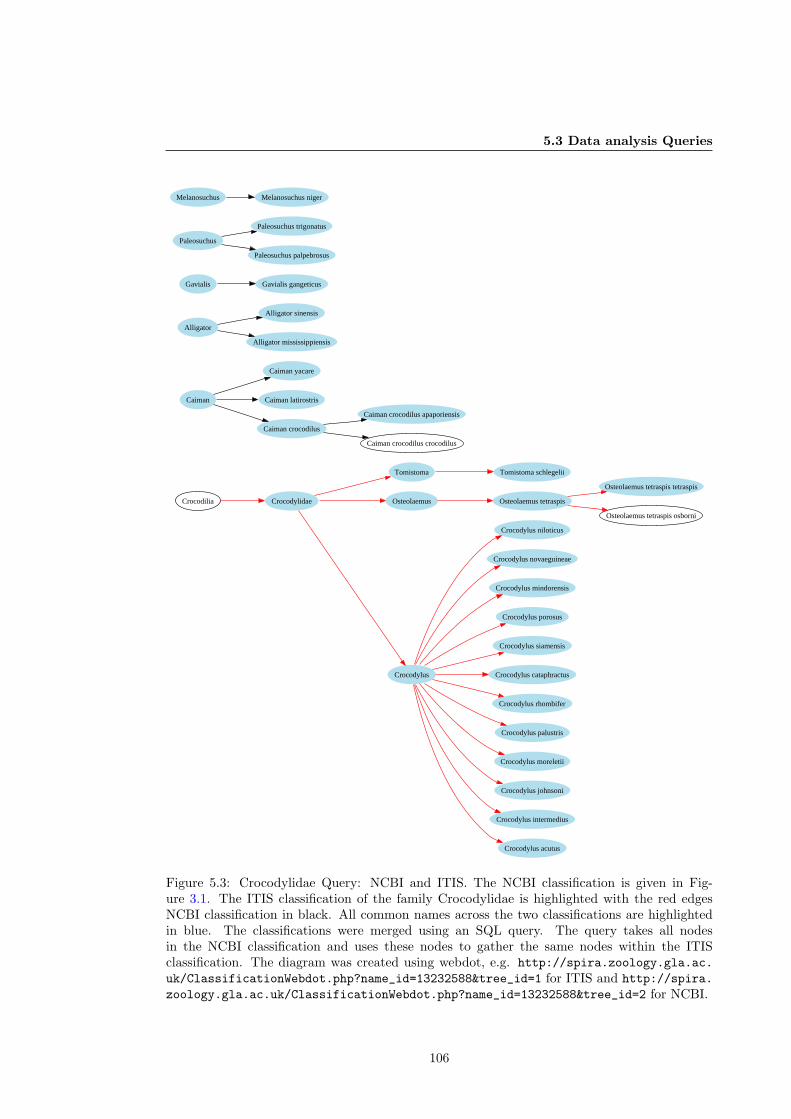
5.3 Data analysis Queries
Crocodylidae
Tomistoma
Osteolaemus
Crocodylus
Crocodylus niloticus
Crocodylus novaeguineae
Tomistoma schlegelii
Crocodylus mindorensis
Crocodylus porosus
Osteolaemus tetraspis tetraspis
Crocodylus siamensis
Crocodylus cataphractus
Crocodylus rhombifer
Crocodylus palustris
Caiman crocodilus apaporiensis
Alligator sinensis
Crocodylus moreletii
Gavialis gangeticus
Alligator mississippiensis
Osteolaemus tetraspis
Paleosuchus trigonatus
Paleosuchus palpebrosus
Melanosuchus niger
Osteolaemus tetraspis osborni
Crocodylus johnsoni
Crocodylus intermedius
Crocodylus acutus
Caiman yacare
Caiman latirostris
Caiman crocodilus
Caiman crocodilus crocodilus
Caiman
Gavialis
Alligator
Melanosuchus
Paleosuchus
Crocodilia
Figure 5.3: Crocodylidae Query: NCBI and ITIS. The NCBI classification is given in Fig-ure 3.1. The ITIS classification of the family Crocodylidae is highlighted with the red edgesNCBI classification in black. All common names across the two classifications are highlightedin blue. The classifications were merged using an SQL query. The query takes all nodesin the NCBI classification and uses these nodes to gather the same nodes within the ITISclassification. The diagram was created using webdot, e.g. http://spira.zoology.gla.ac.uk/ClassificationWebdot.php?name_id=13232588&tree_id=1 for ITIS and http://spira.zoology.gla.ac.uk/ClassificationWebdot.php?name_id=13232588&tree_id=2 for NCBI.
106
5.4 TCl-Db Web Tools
5.4 TCl-Db Web Tools
Taxon names are keys to biological data (Geoffroy, 2001), and in this capacity they are com-
monly used as search terms to retrieve data in many systems. TCl-Db warehouse was developed
primarily to aid information retrieval from TreeBASE, through taxon names. This section de-
scribes web based search tools that utilise the TCl-Db integrated data, and a TreeBASE wrap-
per using a local copy of TreeBASE whose taxon names have been mapped to TCl-Db. Query
terms given in the wrapper are transformed into taxon queries which are then performed on
the mapped TreeBASE taxa in TCl-Db. We first describe the generic tools that may be used
to browse, visualise and search for names stored within TCl-Db.
All the applications described here are located on the TCl-Db web page at spira.zoology.
gla.ac.uk. The tools are built using PHP, PHP Hypertext Processor programming language
(Zend Technologies, 2006), JavaScript, CSS, and the XMLHttpRequest Object is used to pop-
ulate parts of the interface (Darie & Brinzarea, 2006). PHP is a very easy to use scripting
language that makes development of web interfaces from databases such as MySQL and Oracle
quick and cost effective. PHP is used primarily to access the data in the databases through
the Oracle Call Interface (OCI) functions for Oracle. Alongside the traditional web interface
for TCl-Db, there are web services providing a service oriented architecture to enable inter-
operability with other systems. These were also built using PHP, through re-using code already
developed and PHP’s web service development tools for XML-RPC (XML- Remote Procedure
Call) (Winer et al., 1999) and SOAP ( Simple Object Access Protocol) (Gudgin et al., 2003).
5.4.1 TCl-Db Search Tool
This section describes the scripts that were built to query and visualise data in TCl-Db. These
tools can be used to link TCl-Db to other systems that need to support taxonomically intelligent
queries.
Using scientific names as search terms is complicated by the fact that taxon names are in
Latin and are often difficult to spell. This can be overcome using string matching technologies
(Alberga, 1967; Navarro, 2001; Pfeifer et al., 1995, 1996). By using these tools, the system can
provide ‘a catch’ on each query: if no data are found for the query given, then alternatives are
suggested to the user. Taxon names also change from time to time and data linked to an older
usage, a synonym, may not be retrieved when another name takes common use. Linked names
within TCl-Db can be used to expand search terms to include both synonyms and vernaculars.
107
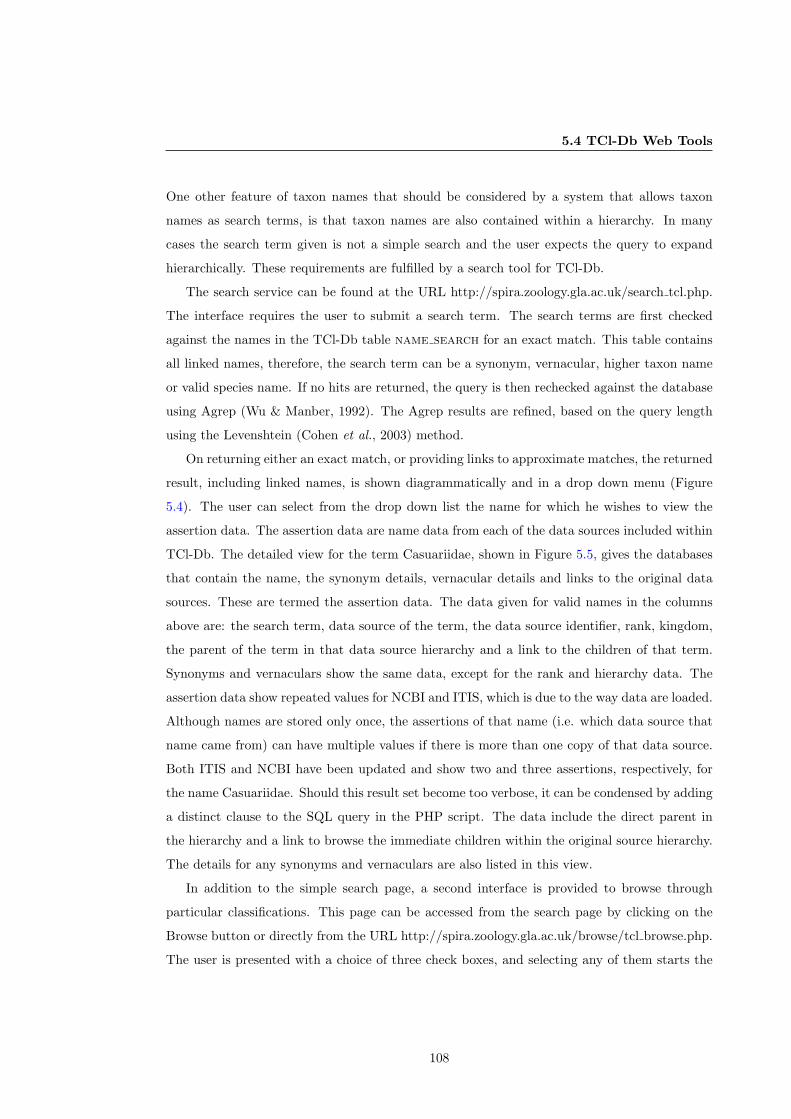
5.4 TCl-Db Web Tools
One other feature of taxon names that should be considered by a system that allows taxon
names as search terms, is that taxon names are also contained within a hierarchy. In many
cases the search term given is not a simple search and the user expects the query to expand
hierarchically. These requirements are fulfilled by a search tool for TCl-Db.
The search service can be found at the URL http://spira.zoology.gla.ac.uk/search tcl.php.
The interface requires the user to submit a search term. The search terms are first checked
against the names in the TCl-Db table name search for an exact match. This table contains
all linked names, therefore, the search term can be a synonym, vernacular, higher taxon name
or valid species name. If no hits are returned, the query is then rechecked against the database
using Agrep (Wu & Manber, 1992). The Agrep results are refined, based on the query length
using the Levenshtein (Cohen et al., 2003) method.
On returning either an exact match, or providing links to approximate matches, the returned
result, including linked names, is shown diagrammatically and in a drop down menu (Figure
5.4). The user can select from the drop down list the name for which he wishes to view the
assertion data. The assertion data are name data from each of the data sources included within
TCl-Db. The detailed view for the term Casuariidae, shown in Figure 5.5, gives the databases
that contain the name, the synonym details, vernacular details and links to the original data
sources. These are termed the assertion data. The data given for valid names in the columns
above are: the search term, data source of the term, the data source identifier, rank, kingdom,
the parent of the term in that data source hierarchy and a link to the children of that term.
Synonyms and vernaculars show the same data, except for the rank and hierarchy data. The
assertion data show repeated values for NCBI and ITIS, which is due to the way data are loaded.
Although names are stored only once, the assertions of that name (i.e. which data source that
name came from) can have multiple values if there is more than one copy of that data source.
Both ITIS and NCBI have been updated and show two and three assertions, respectively, for
the name Casuariidae. Should this result set become too verbose, it can be condensed by adding
a distinct clause to the SQL query in the PHP script. The data include the direct parent in
the hierarchy and a link to browse the immediate children within the original source hierarchy.
The details for any synonyms and vernaculars are also listed in this view.
In addition to the simple search page, a second interface is provided to browse through
particular classifications. This page can be accessed from the search page by clicking on the
Browse button or directly from the URL http://spira.zoology.gla.ac.uk/browse/tcl browse.php.
The user is presented with a choice of three check boxes, and selecting any of them starts the
108
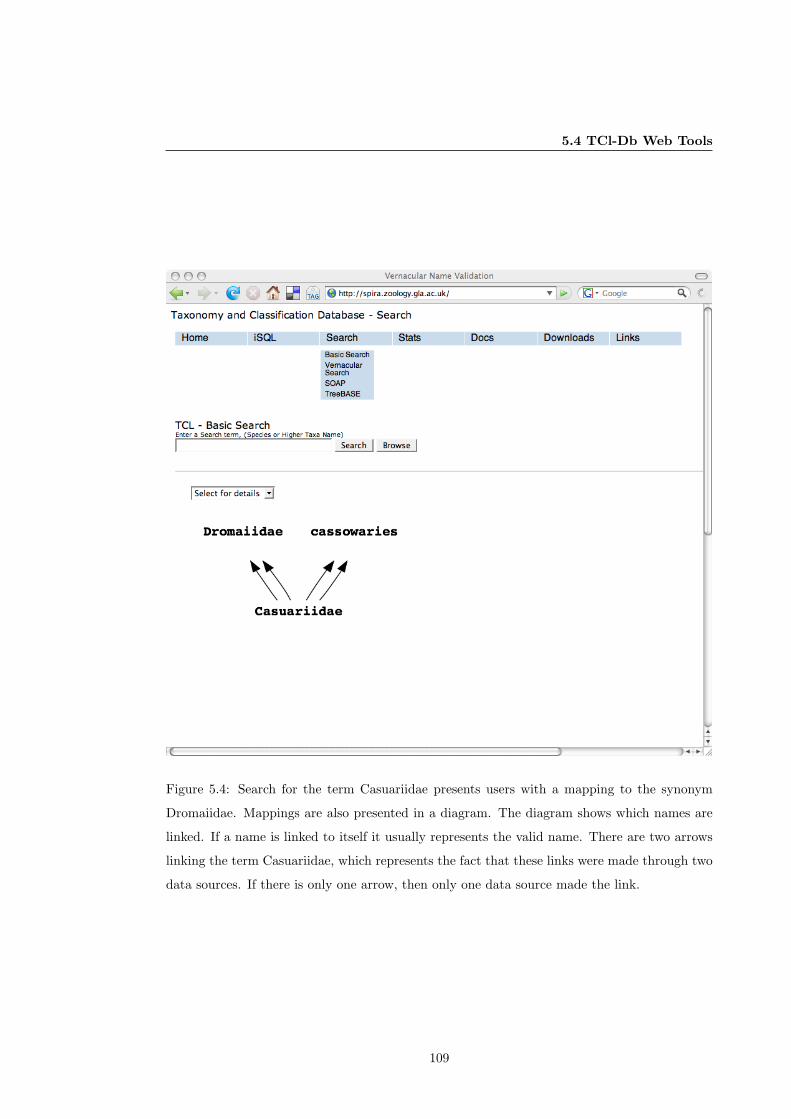
5.4 TCl-Db Web Tools
Figure 5.4: Search for the term Casuariidae presents users with a mapping to the synonym
Dromaiidae. Mappings are also presented in a diagram. The diagram shows which names are
linked. If a name is linked to itself it usually represents the valid name. There are two arrows
linking the term Casuariidae, which represents the fact that these links were made through two
data sources. If there is only one arrow, then only one data source made the link.
109
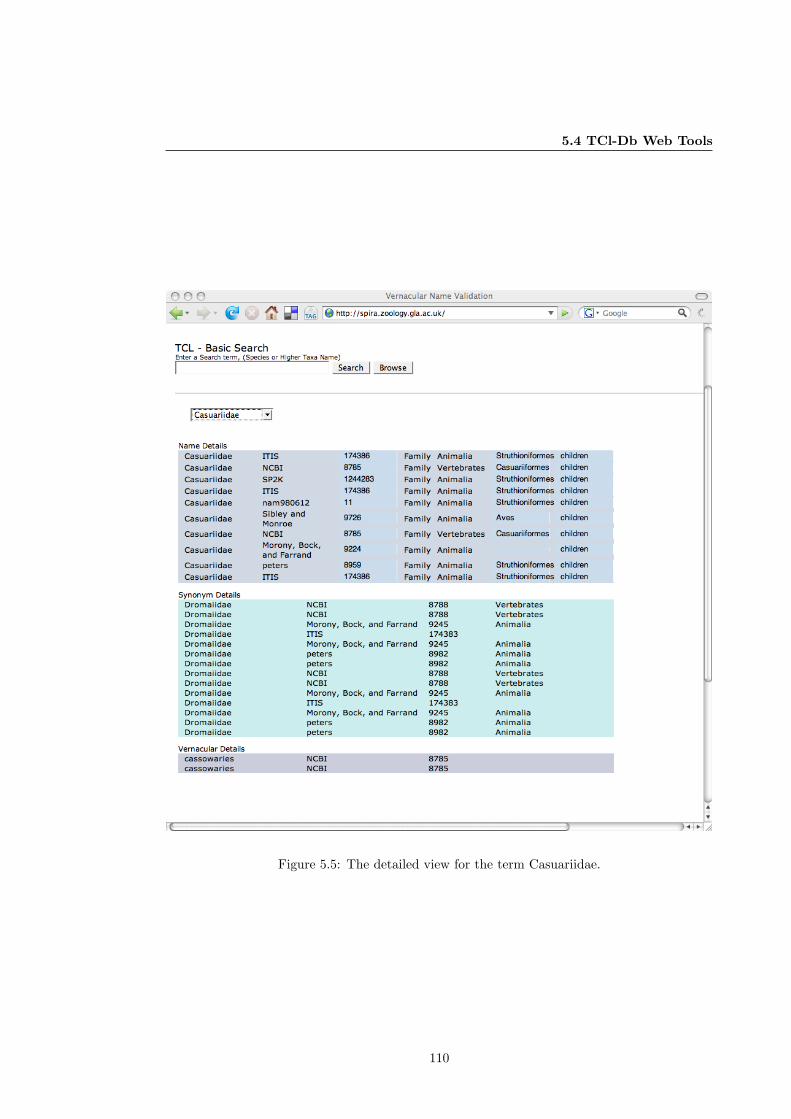
5.4 TCl-Db Web Tools
Figure 5.5: The detailed view for the term Casuariidae.
110
5.4 TCl-Db Web Tools
Figure 5.6: The Classification Browse Interface allows the user to click through the classification.
search. Once selected, the next series of select boxes appears, and the user clicks through the
boxes for the classification path of interest. A double click on a name will display assertion
data.
5.4.2 Visualisation Tools: Linked Names and Classifications with Web-
dot
The Dot command line programme and language (Koutsoos et al., 1996) draws directed graphs,
Webdot (Ellson, 2006) is a CGI program that converts the dot graphs into an image that can be
included into a webpage. Webdot images are used to display linked names produced by TCl-Db
as shown in Figure 5.4 and also Figure 5.15, and are particularly useful for displaying portions
111
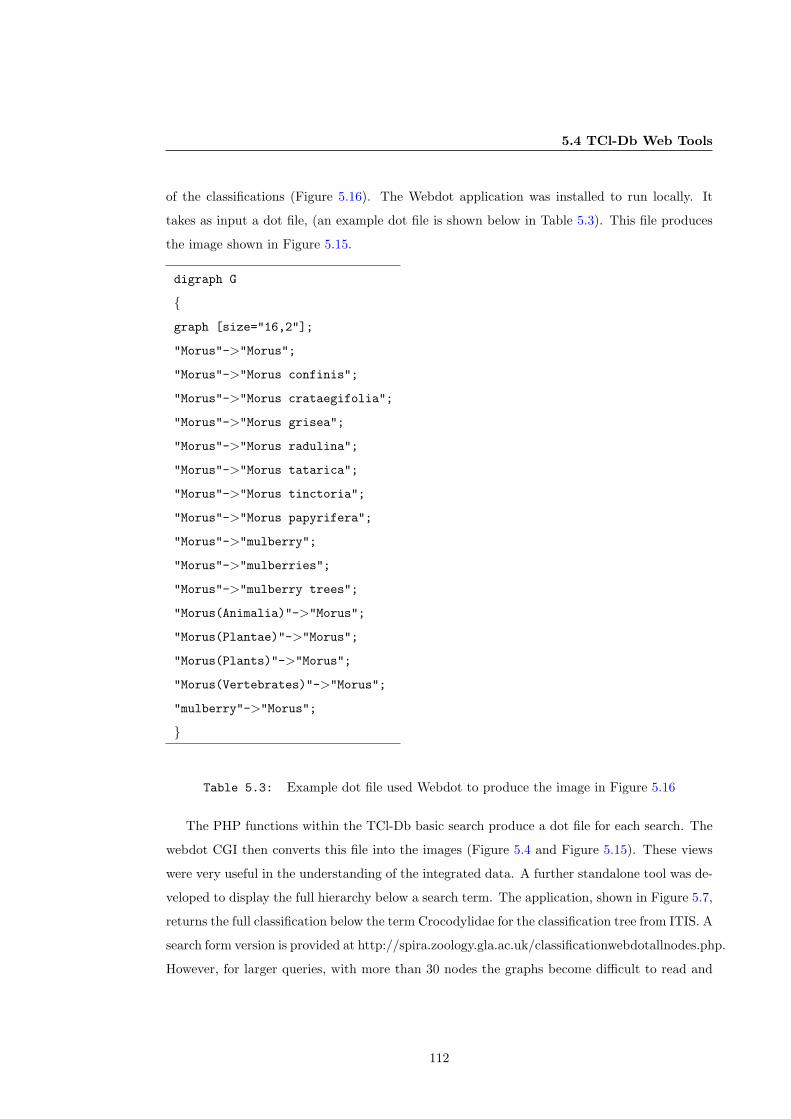
5.4 TCl-Db Web Tools
of the classifications (Figure 5.16). The Webdot application was installed to run locally. It
takes as input a dot file, (an example dot file is shown below in Table 5.3). This file produces
the image shown in Figure 5.15.
digraph G
{graph [size="16,2"];
"Morus"->"Morus";
"Morus"->"Morus confinis";
"Morus"->"Morus crataegifolia";
"Morus"->"Morus grisea";
"Morus"->"Morus radulina";
"Morus"->"Morus tatarica";
"Morus"->"Morus tinctoria";
"Morus"->"Morus papyrifera";
"Morus"->"mulberry";
"Morus"->"mulberries";
"Morus"->"mulberry trees";
"Morus(Animalia)"->"Morus";
"Morus(Plantae)"->"Morus";
"Morus(Plants)"->"Morus";
"Morus(Vertebrates)"->"Morus";
"mulberry"->"Morus";
}
Table 5.3: Example dot file used Webdot to produce the image in Figure 5.16
The PHP functions within the TCl-Db basic search produce a dot file for each search. The
webdot CGI then converts this file into the images (Figure 5.4 and Figure 5.15). These views
were very useful in the understanding of the integrated data. A further standalone tool was de-
veloped to display the full hierarchy below a search term. The application, shown in Figure 5.7,
returns the full classification below the term Crocodylidae for the classification tree from ITIS. A
search form version is provided at http://spira.zoology.gla.ac.uk/classificationwebdotallnodes.php.
However, for larger queries, with more than 30 nodes the graphs become difficult to read and
112
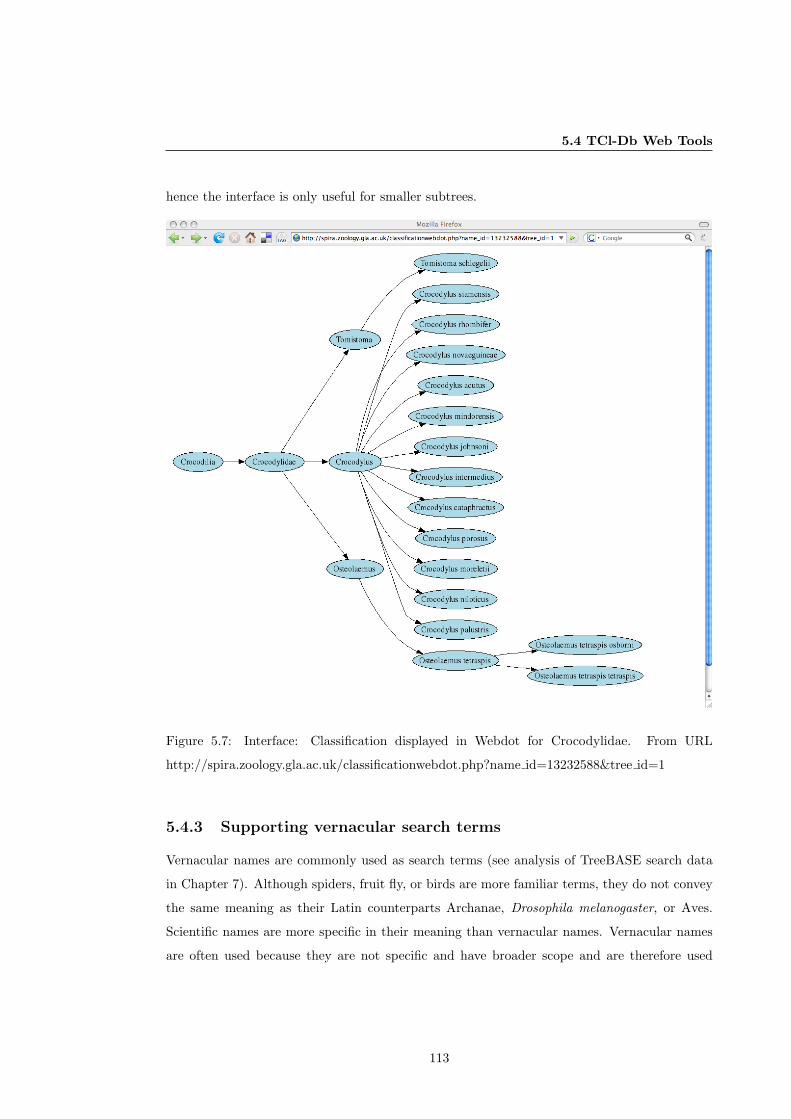
5.4 TCl-Db Web Tools
hence the interface is only useful for smaller subtrees.
Figure 5.7: Interface: Classification displayed in Webdot for Crocodylidae. From URL
http://spira.zoology.gla.ac.uk/classificationwebdot.php?name id=13232588&tree id=1
5.4.3 Supporting vernacular search terms
Vernacular names are commonly used as search terms (see analysis of TreeBASE search data
in Chapter 7). Although spiders, fruit fly, or birds are more familiar terms, they do not convey
the same meaning as their Latin counterparts Archanae, Drosophila melanogaster, or Aves.
Scientific names are more specific in their meaning than vernacular names. Vernacular names
are often used because they are not specific and have broader scope and are therefore used
113
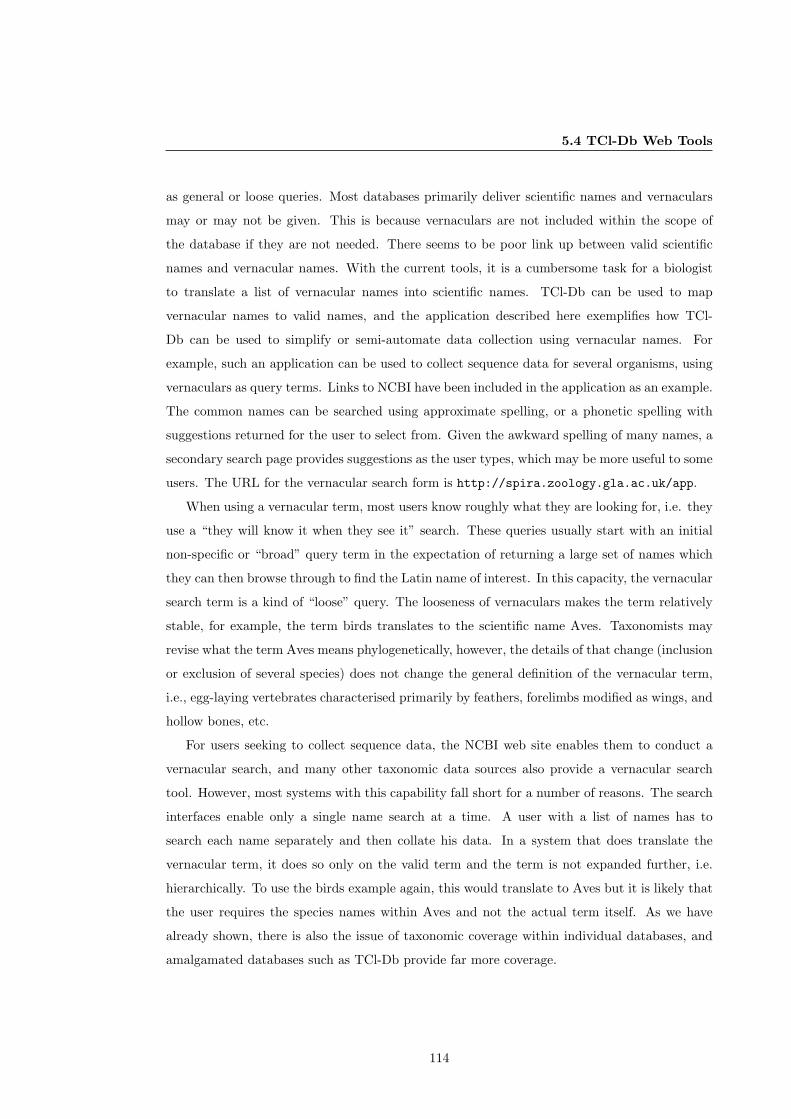
5.4 TCl-Db Web Tools
as general or loose queries. Most databases primarily deliver scientific names and vernaculars
may or may not be given. This is because vernaculars are not included within the scope of
the database if they are not needed. There seems to be poor link up between valid scientific
names and vernacular names. With the current tools, it is a cumbersome task for a biologist
to translate a list of vernacular names into scientific names. TCl-Db can be used to map
vernacular names to valid names, and the application described here exemplifies how TCl-
Db can be used to simplify or semi-automate data collection using vernacular names. For
example, such an application can be used to collect sequence data for several organisms, using
vernaculars as query terms. Links to NCBI have been included in the application as an example.
The common names can be searched using approximate spelling, or a phonetic spelling with
suggestions returned for the user to select from. Given the awkward spelling of many names, a
secondary search page provides suggestions as the user types, which may be more useful to some
users. The URL for the vernacular search form is http://spira.zoology.gla.ac.uk/app.
When using a vernacular term, most users know roughly what they are looking for, i.e. they
use a “they will know it when they see it” search. These queries usually start with an initial
non-specific or “broad” query term in the expectation of returning a large set of names which
they can then browse through to find the Latin name of interest. In this capacity, the vernacular
search term is a kind of “loose” query. The looseness of vernaculars makes the term relatively
stable, for example, the term birds translates to the scientific name Aves. Taxonomists may
revise what the term Aves means phylogenetically, however, the details of that change (inclusion
or exclusion of several species) does not change the general definition of the vernacular term,
i.e., egg-laying vertebrates characterised primarily by feathers, forelimbs modified as wings, and
hollow bones, etc.
For users seeking to collect sequence data, the NCBI web site enables them to conduct a
vernacular search, and many other taxonomic data sources also provide a vernacular search
tool. However, most systems with this capability fall short for a number of reasons. The search
interfaces enable only a single name search at a time. A user with a list of names has to
search each name separately and then collate his data. In a system that does translate the
vernacular term, it does so only on the valid term and the term is not expanded further, i.e.
hierarchically. To use the birds example again, this would translate to Aves but it is likely that
the user requires the species names within Aves and not the actual term itself. As we have
already shown, there is also the issue of taxonomic coverage within individual databases, and
amalgamated databases such as TCl-Db provide far more coverage.
114
5.4 TCl-Db Web Tools
The interface uses PHP and javaScript (Darie & Brinzarea, 2006). There are three separate
PHP scripts. The first gives the initial search page (Figure 5.8) and is found at the URL
http://spira.zoology.gla.ac.uk/app. On this page, users can copy and paste a list of vernacular
names into the text box, while an alternative search page provides users with suggestions as
they type. The suggestions interface is based on the Google suggests
(http://www.google.com/webhp?complete=1&hl=en).
Figure 5.8: Vernacular Query form at http://spira.zoology.gla.ac.uk/app
The script uses a list of names which were dumped into a text file from a TCl-Db table
holding mapped names. The script takes the search terms given and searches each through the
text file of TCl-Db names using Agrep, in order to find initial matches. With a mismatch of two
agrep returns a very large list of matches. The use of Agrep with a mismatch of two is a bit of
a compromise, as the effect of increasing the mismatch returns even more data when the search
term is short and reducing it to one misses too many potential matches when the search term
is longer. This is analogous to the precision and recall measures used in information retrieval,
as good recall returns as many relevant matches as possible while minimising the number of
non-relevant matches (Singhal, 2001). The matches returned from Agrep are refined using the
length of the query term and the Levenshtein method (Cohen et al., 2003). From these results,
115
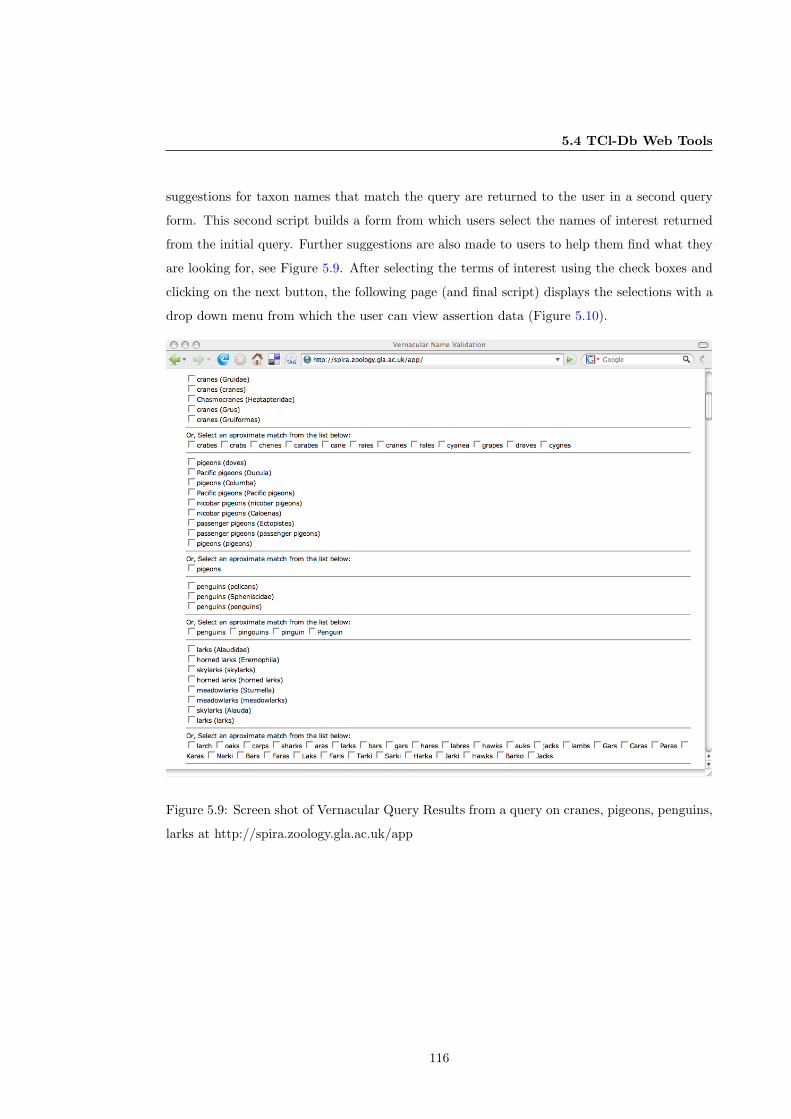
5.4 TCl-Db Web Tools
suggestions for taxon names that match the query are returned to the user in a second query
form. This second script builds a form from which users select the names of interest returned
from the initial query. Further suggestions are also made to users to help them find what they
are looking for, see Figure 5.9. After selecting the terms of interest using the check boxes and
clicking on the next button, the following page (and final script) displays the selections with a
drop down menu from which the user can view assertion data (Figure 5.10).
Figure 5.9: Screen shot of Vernacular Query Results from a query on cranes, pigeons, penguins,
larks at http://spira.zoology.gla.ac.uk/app
116
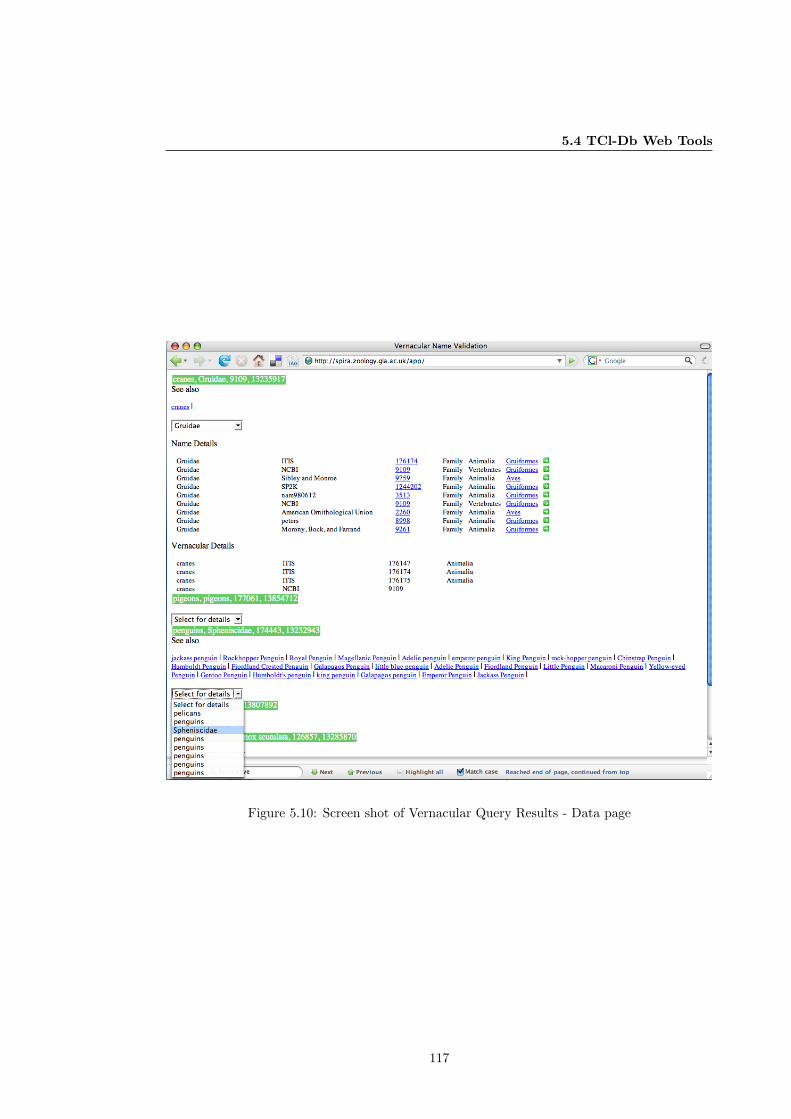
5.4 TCl-Db Web Tools
Figure 5.10: Screen shot of Vernacular Query Results - Data page
117
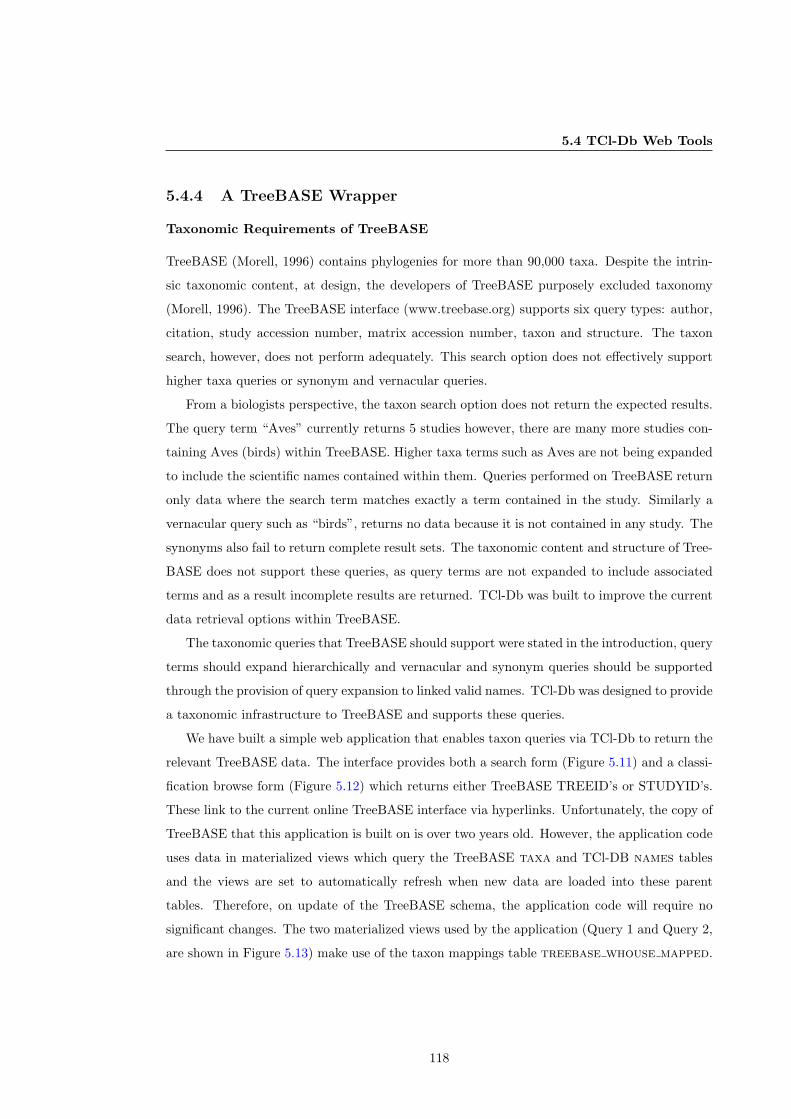
5.4 TCl-Db Web Tools
5.4.4 A TreeBASE Wrapper
Taxonomic Requirements of TreeBASE
TreeBASE (Morell, 1996) contains phylogenies for more than 90,000 taxa. Despite the intrin-
sic taxonomic content, at design, the developers of TreeBASE purposely excluded taxonomy
(Morell, 1996). The TreeBASE interface (www.treebase.org) supports six query types: author,
citation, study accession number, matrix accession number, taxon and structure. The taxon
search, however, does not perform adequately. This search option does not effectively support
higher taxa queries or synonym and vernacular queries.
From a biologists perspective, the taxon search option does not return the expected results.
The query term “Aves” currently returns 5 studies however, there are many more studies con-
taining Aves (birds) within TreeBASE. Higher taxa terms such as Aves are not being expanded
to include the scientific names contained within them. Queries performed on TreeBASE return
only data where the search term matches exactly a term contained in the study. Similarly a
vernacular query such as “birds”, returns no data because it is not contained in any study. The
synonyms also fail to return complete result sets. The taxonomic content and structure of Tree-
BASE does not support these queries, as query terms are not expanded to include associated
terms and as a result incomplete results are returned. TCl-Db was built to improve the current
data retrieval options within TreeBASE.
The taxonomic queries that TreeBASE should support were stated in the introduction, query
terms should expand hierarchically and vernacular and synonym queries should be supported
through the provision of query expansion to linked valid names. TCl-Db was designed to provide
a taxonomic infrastructure to TreeBASE and supports these queries.
We have built a simple web application that enables taxon queries via TCl-Db to return the
relevant TreeBASE data. The interface provides both a search form (Figure 5.11) and a classi-
fication browse form (Figure 5.12) which returns either TreeBASE TREEID’s or STUDYID’s.
These link to the current online TreeBASE interface via hyperlinks. Unfortunately, the copy of
TreeBASE that this application is built on is over two years old. However, the application code
uses data in materialized views which query the TreeBASE taxa and TCl-DB names tables
and the views are set to automatically refresh when new data are loaded into these parent
tables. Therefore, on update of the TreeBASE schema, the application code will require no
significant changes. The two materialized views used by the application (Query 1 and Query 2,
are shown in Figure 5.13) make use of the taxon mappings table treebase whouse mapped.
118
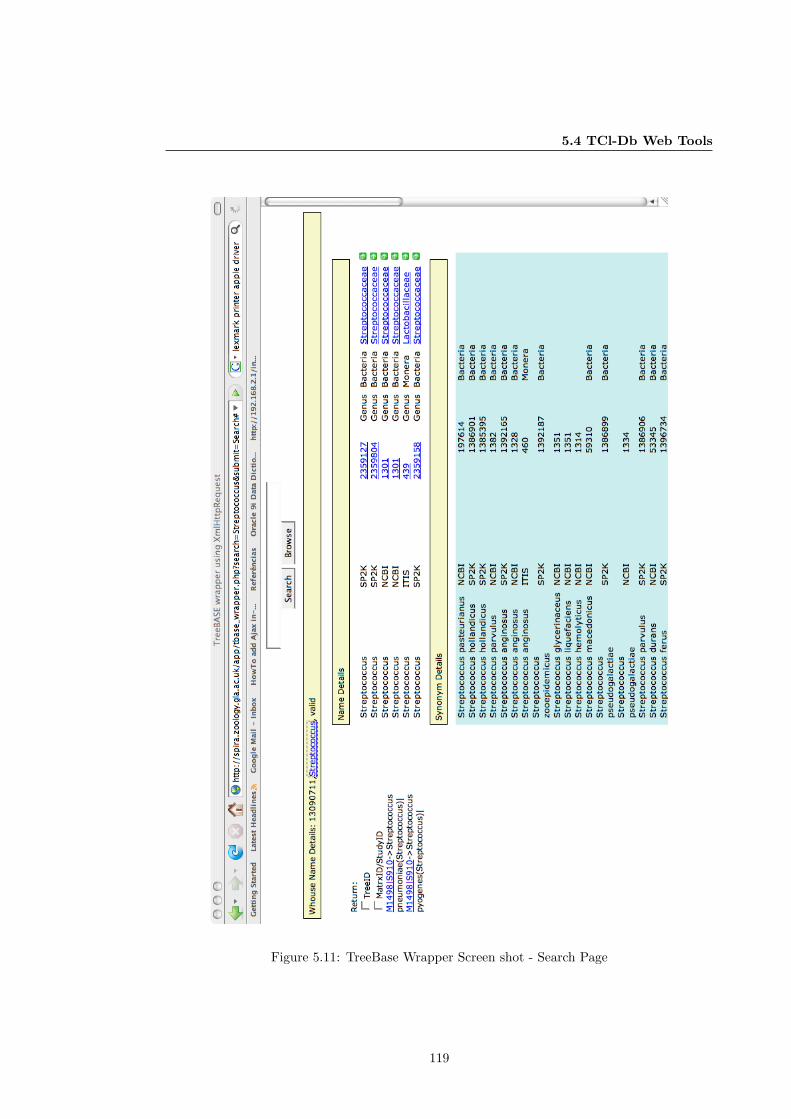
5.4 TCl-Db Web Tools
Figure 5.11: TreeBase Wrapper Screen shot - Search Page
119
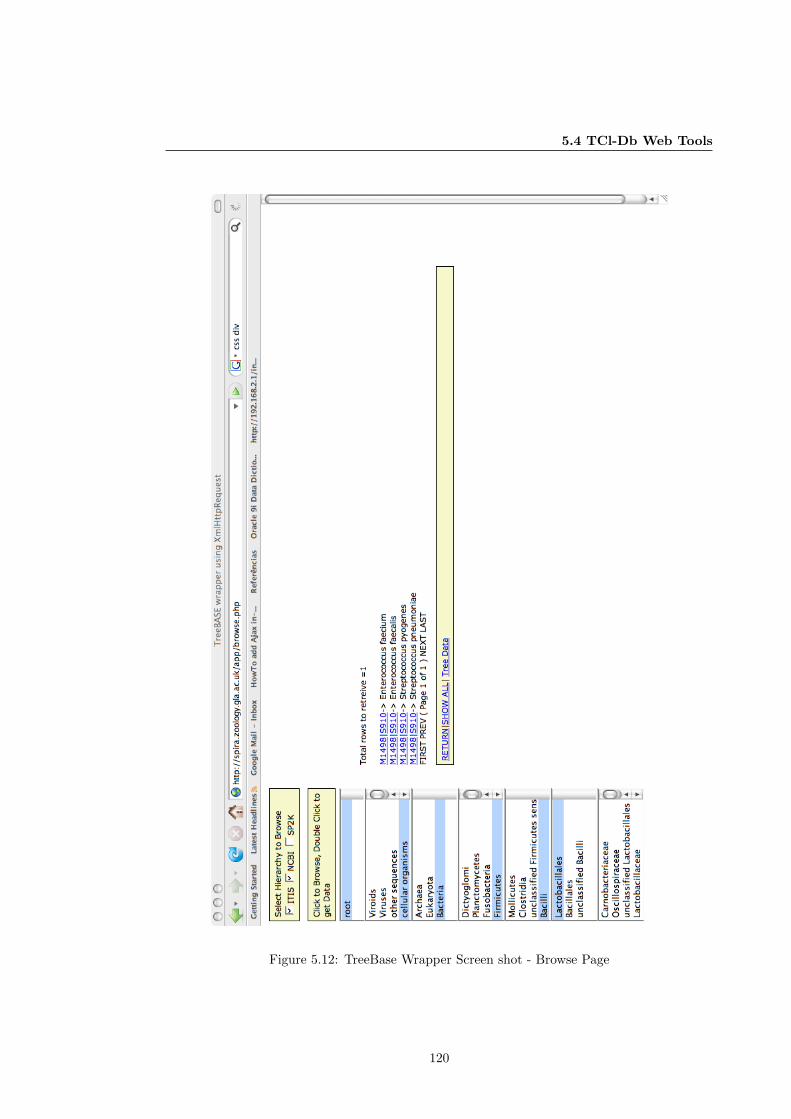
5.4 TCl-Db Web Tools
Figure 5.12: TreeBase Wrapper Screen shot - Browse Page
120
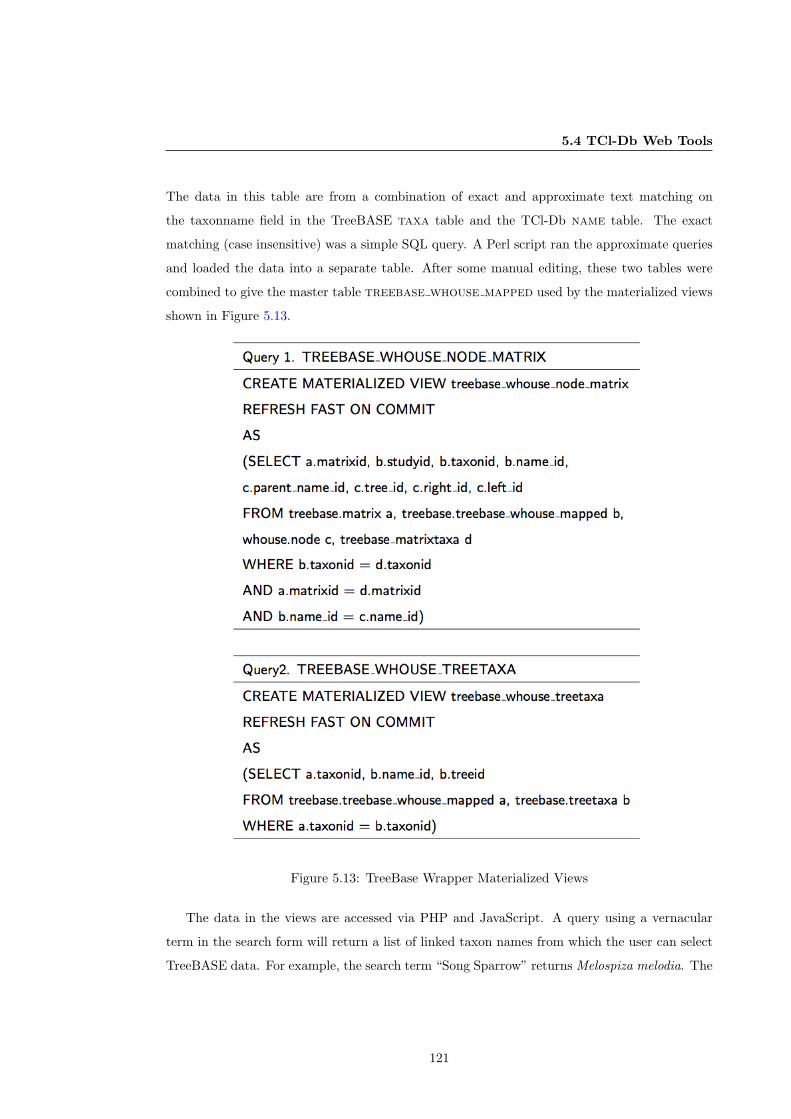
5.4 TCl-Db Web Tools
The data in this table are from a combination of exact and approximate text matching on
the taxonname field in the TreeBASE taxa table and the TCl-Db name table. The exact
matching (case insensitive) was a simple SQL query. A Perl script ran the approximate queries
and loaded the data into a separate table. After some manual editing, these two tables were
combined to give the master table treebase whouse mapped used by the materialized views
shown in Figure 5.13.
Figure 5.13: TreeBase Wrapper Materialized Views
The data in the views are accessed via PHP and JavaScript. A query using a vernacular
term in the search form will return a list of linked taxon names from which the user can select
TreeBASE data. For example, the search term “Song Sparrow” returns Melospiza melodia. The
121
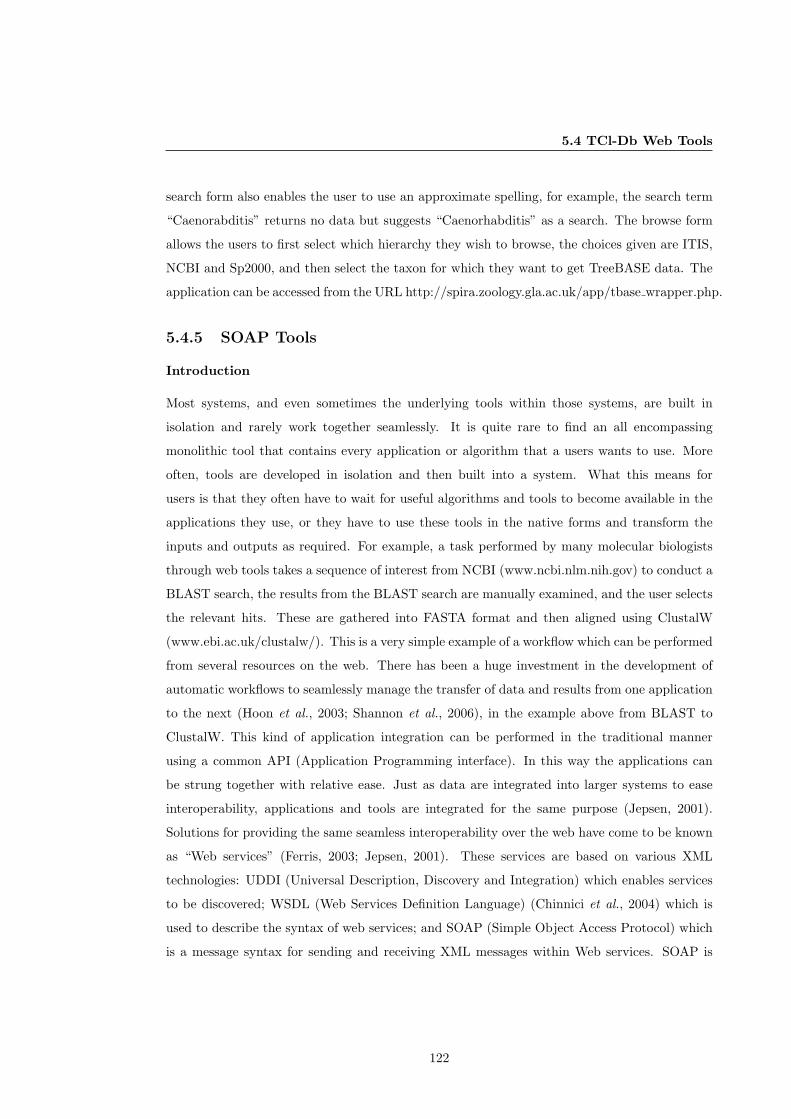
5.4 TCl-Db Web Tools
search form also enables the user to use an approximate spelling, for example, the search term
“Caenorabditis” returns no data but suggests “Caenorhabditis” as a search. The browse form
allows the users to first select which hierarchy they wish to browse, the choices given are ITIS,
NCBI and Sp2000, and then select the taxon for which they want to get TreeBASE data. The
application can be accessed from the URL http://spira.zoology.gla.ac.uk/app/tbase wrapper.php.
5.4.5 SOAP Tools
Introduction
Most systems, and even sometimes the underlying tools within those systems, are built in
isolation and rarely work together seamlessly. It is quite rare to find an all encompassing
monolithic tool that contains every application or algorithm that a users wants to use. More
often, tools are developed in isolation and then built into a system. What this means for
users is that they often have to wait for useful algorithms and tools to become available in the
applications they use, or they have to use these tools in the native forms and transform the
inputs and outputs as required. For example, a task performed by many molecular biologists
through web tools takes a sequence of interest from NCBI (www.ncbi.nlm.nih.gov) to conduct a
BLAST search, the results from the BLAST search are manually examined, and the user selects
the relevant hits. These are gathered into FASTA format and then aligned using ClustalW
(www.ebi.ac.uk/clustalw/). This is a very simple example of a workflow which can be performed
from several resources on the web. There has been a huge investment in the development of
automatic workflows to seamlessly manage the transfer of data and results from one application
to the next (Hoon et al., 2003; Shannon et al., 2006), in the example above from BLAST to
ClustalW. This kind of application integration can be performed in the traditional manner
using a common API (Application Programming interface). In this way the applications can
be strung together with relative ease. Just as data are integrated into larger systems to ease
interoperability, applications and tools are integrated for the same purpose (Jepsen, 2001).
Solutions for providing the same seamless interoperability over the web have come to be known
as “Web services” (Ferris, 2003; Jepsen, 2001). These services are based on various XML
technologies: UDDI (Universal Description, Discovery and Integration) which enables services
to be discovered; WSDL (Web Services Definition Language) (Chinnici et al., 2004) which is
used to describe the syntax of web services; and SOAP (Simple Object Access Protocol) which
is a message syntax for sending and receiving XML messages within Web services. SOAP is
122
5.4 TCl-Db Web Tools
Figure 5.14: The WSDL for the TCl-Db SOAP service can be found at
http://spira.zoology.gla.ac.uk/app/nusoap.
the protocol that builds the interoperability within web services in a platform independent
manner, as it is essentially an agreed standard for accessing a web service. The advantage of
building web services for interoperability of applications are especially seen in Service Oriented
Architectures (SOA). In a SOA the service provider has a service designed for others to use.
Interoperability is a core principle in the development of TCl-Db, since the database was
developed for the purposes of interoperability with other databases, TreeBASE specifically, but
not exclusively (Tsenov, 2004). To this end, the interfaces described below are available as web
services using nuSOAP (Nichol, 2004). The TCl-Db web service provides a WSDL detailing the
interface, the operations and the inputs and outputs of the operations. An example of the client
code in PHP is given in Table 5.4, to exemplify the use of the service (Figure 5.14). Each of
the functions in the WSDL are described briefly below with an example of the expected input
and an example output.
Displaying Linked Names and Classifications with Webdot in SOAP
The outputs created by functions createDot, getchildrendot itis and getchildrendot ncbi
are shown in Figures 5.15 and Figure 5.16.
123
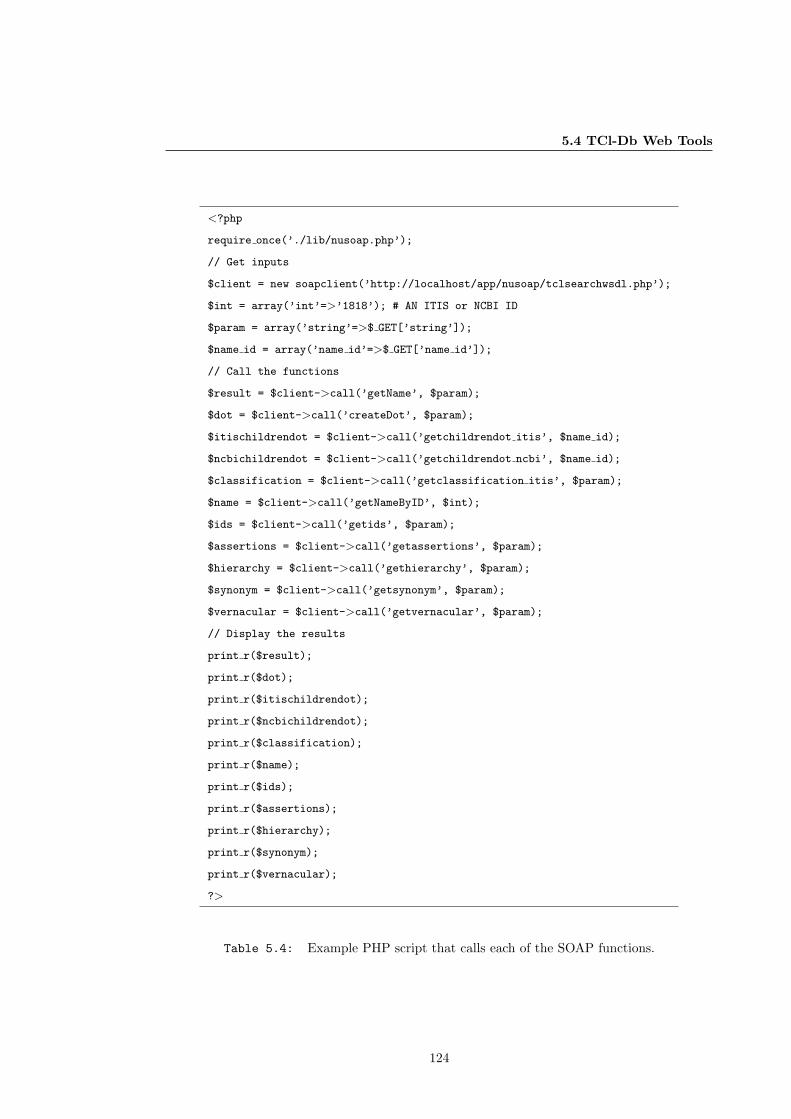
5.4 TCl-Db Web Tools
<?php
require once(’./lib/nusoap.php’);
// Get inputs
$client = new soapclient(’http://localhost/app/nusoap/tclsearchwsdl.php’);
$int = array(’int’=>’1818’); # AN ITIS or NCBI ID
$param = array(’string’=>$ GET[’string’]);
$name id = array(’name id’=>$ GET[’name id’]);
// Call the functions
$result = $client->call(’getName’, $param);
$dot = $client->call(’createDot’, $param);
$itischildrendot = $client->call(’getchildrendot itis’, $name id);
$ncbichildrendot = $client->call(’getchildrendot ncbi’, $name id);
$classification = $client->call(’getclassification itis’, $param);
$name = $client->call(’getNameByID’, $int);
$ids = $client->call(’getids’, $param);
$assertions = $client->call(’getassertions’, $param);
$hierarchy = $client->call(’gethierarchy’, $param);
$synonym = $client->call(’getsynonym’, $param);
$vernacular = $client->call(’getvernacular’, $param);
// Display the results
print r($result);
print r($dot);
print r($itischildrendot);
print r($ncbichildrendot);
print r($classification);
print r($name);
print r($ids);
print r($assertions);
print r($hierarchy);
print r($synonym);
print r($vernacular);
?>
Table 5.4: Example PHP script that calls each of the SOAP functions.
124
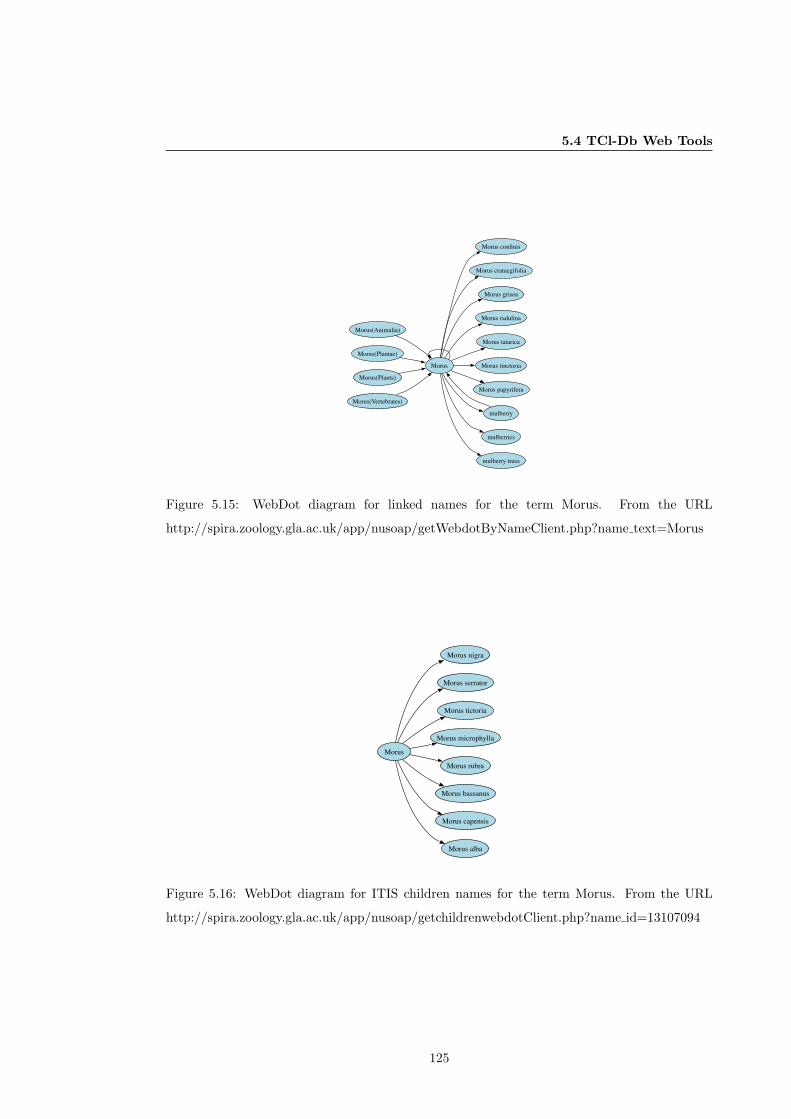
5.4 TCl-Db Web Tools
Morus
Morus confinis
Morus crataegifolia
Morus grisea
Morus radulina
Morus tatarica
Morus tinctoria
Morus papyrifera
mulberry
mulberries
mulberry trees
Morus(Animalia)
Morus(Plantae)
Morus(Plants)
Morus(Vertebrates)
Figure 5.15: WebDot diagram for linked names for the term Morus. From the URL
http://spira.zoology.gla.ac.uk/app/nusoap/getWebdotByNameClient.php?name text=Morus
Morus
Morus nigra
Morus serrator
Morus tictoria
Morus microphylla
Morus rubra
Morus bassanus
Morus capensis
Morus alba
Figure 5.16: WebDot diagram for ITIS children names for the term Morus. From the URL
http://spira.zoology.gla.ac.uk/app/nusoap/getchildrenwebdotClient.php?name id=13107094
125
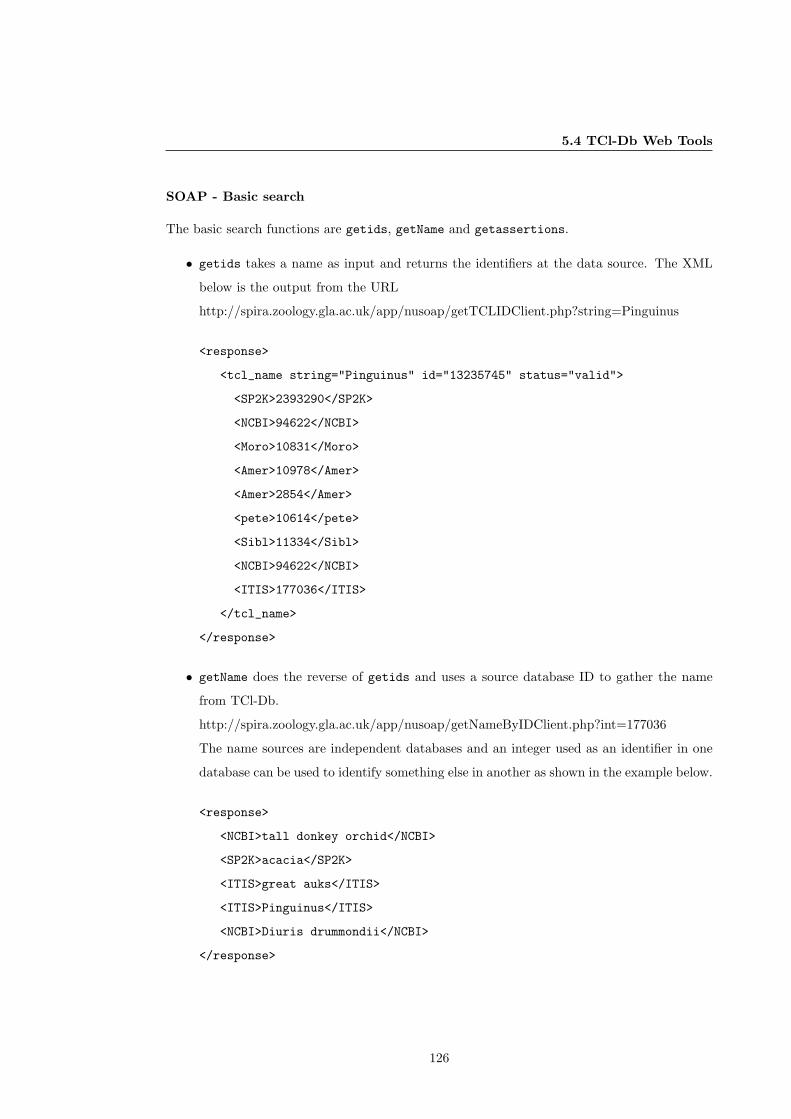
5.4 TCl-Db Web Tools
SOAP - Basic search
The basic search functions are getids, getName and getassertions.
• getids takes a name as input and returns the identifiers at the data source. The XML
below is the output from the URL
http://spira.zoology.gla.ac.uk/app/nusoap/getTCLIDClient.php?string=Pinguinus
<response>
<tcl_name string="Pinguinus" id="13235745" status="valid">
<SP2K>2393290</SP2K>
<NCBI>94622</NCBI>
<Moro>10831</Moro>
<Amer>10978</Amer>
<Amer>2854</Amer>
<pete>10614</pete>
<Sibl>11334</Sibl>
<NCBI>94622</NCBI>
<ITIS>177036</ITIS>
</tcl_name>
</response>
• getName does the reverse of getids and uses a source database ID to gather the name
from TCl-Db.
http://spira.zoology.gla.ac.uk/app/nusoap/getNameByIDClient.php?int=177036
The name sources are independent databases and an integer used as an identifier in one
database can be used to identify something else in another as shown in the example below.
<response>
<NCBI>tall donkey orchid</NCBI>
<SP2K>acacia</SP2K>
<ITIS>great auks</ITIS>
<ITIS>Pinguinus</ITIS>
<NCBI>Diuris drummondii</NCBI>
</response>
126
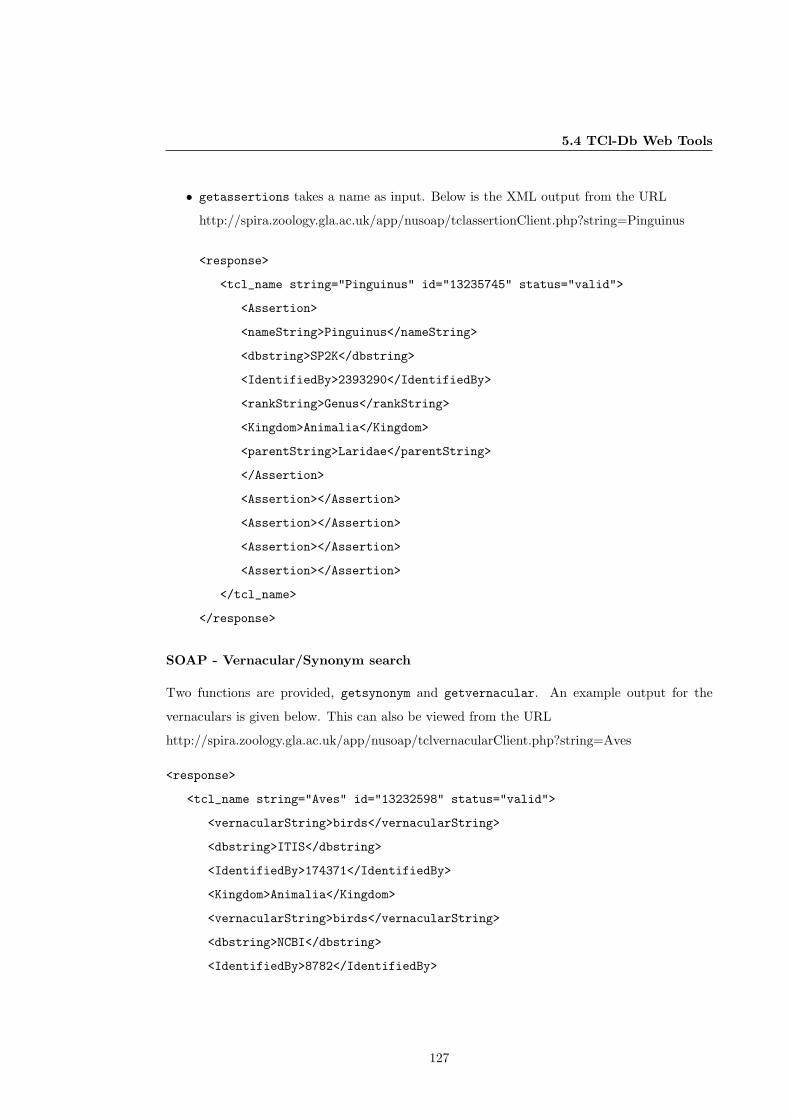
5.4 TCl-Db Web Tools
• getassertions takes a name as input. Below is the XML output from the URL
http://spira.zoology.gla.ac.uk/app/nusoap/tclassertionClient.php?string=Pinguinus
<response>
<tcl_name string="Pinguinus" id="13235745" status="valid">
<Assertion>
<nameString>Pinguinus</nameString>
<dbstring>SP2K</dbstring>
<IdentifiedBy>2393290</IdentifiedBy>
<rankString>Genus</rankString>
<Kingdom>Animalia</Kingdom>
<parentString>Laridae</parentString>
</Assertion>
<Assertion></Assertion>
<Assertion></Assertion>
<Assertion></Assertion>
<Assertion></Assertion>
</tcl_name>
</response>
SOAP - Vernacular/Synonym search
Two functions are provided, getsynonym and getvernacular. An example output for the
vernaculars is given below. This can also be viewed from the URL
http://spira.zoology.gla.ac.uk/app/nusoap/tclvernacularClient.php?string=Aves
<response>
<tcl_name string="Aves" id="13232598" status="valid">
<vernacularString>birds</vernacularString>
<dbstring>ITIS</dbstring>
<IdentifiedBy>174371</IdentifiedBy>
<Kingdom>Animalia</Kingdom>
<vernacularString>birds</vernacularString>
<dbstring>NCBI</dbstring>
<IdentifiedBy>8782</IdentifiedBy>
127
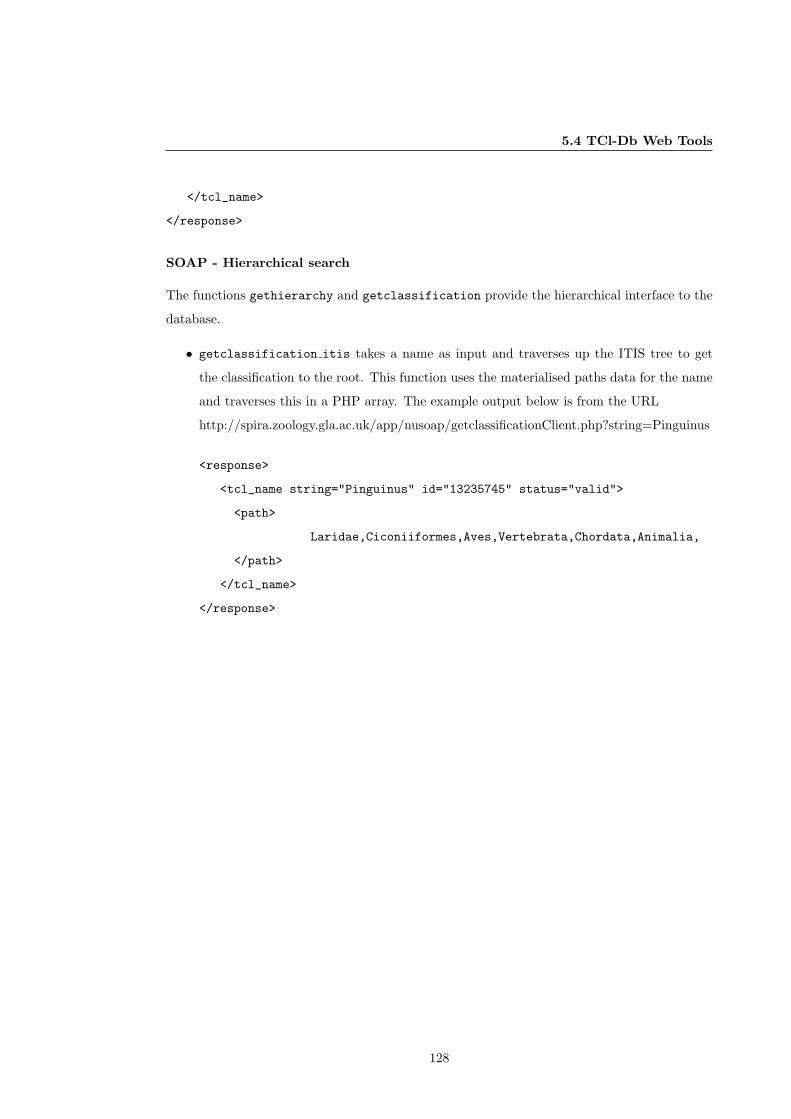
5.4 TCl-Db Web Tools
</tcl_name>
</response>
SOAP - Hierarchical search
The functions gethierarchy and getclassification provide the hierarchical interface to the
database.
• getclassification itis takes a name as input and traverses up the ITIS tree to get
the classification to the root. This function uses the materialised paths data for the name
and traverses this in a PHP array. The example output below is from the URL
http://spira.zoology.gla.ac.uk/app/nusoap/getclassificationClient.php?string=Pinguinus
<response>
<tcl_name string="Pinguinus" id="13235745" status="valid">
<path>
Laridae,Ciconiiformes,Aves,Vertebrata,Chordata,Animalia,
</path>
</tcl_name>
</response>
128
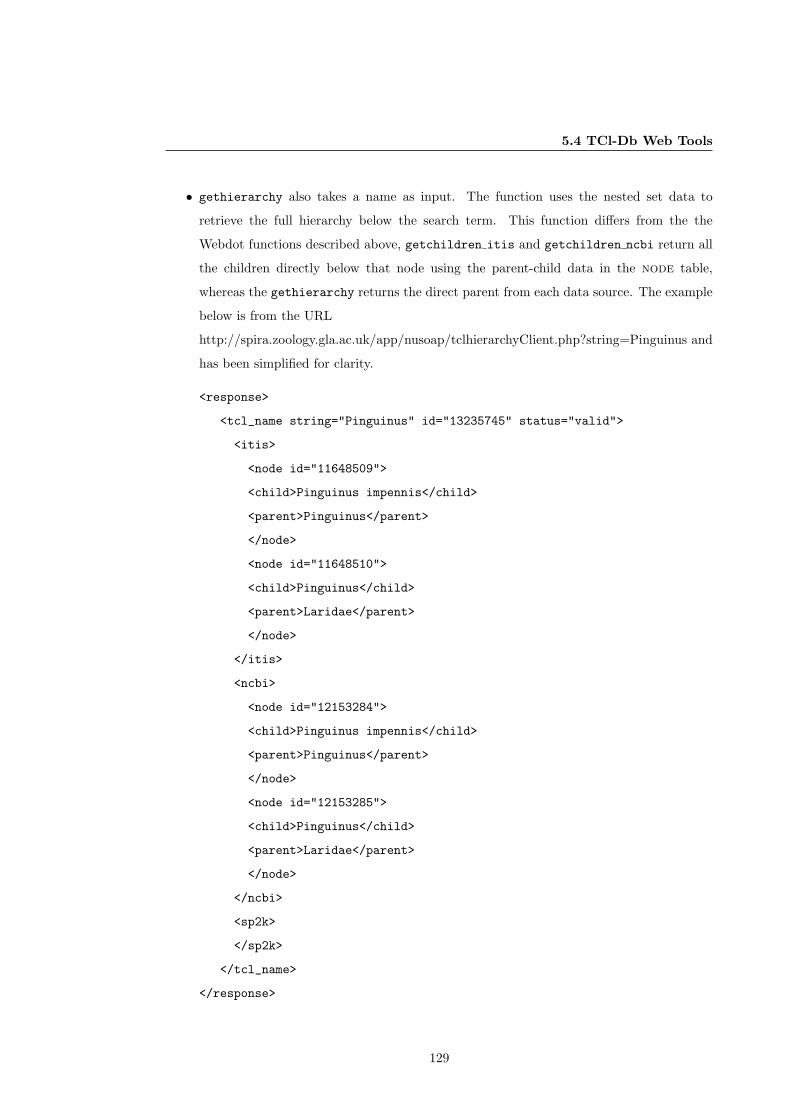
5.4 TCl-Db Web Tools
• gethierarchy also takes a name as input. The function uses the nested set data to
retrieve the full hierarchy below the search term. This function differs from the the
Webdot functions described above, getchildren itis and getchildren ncbi return all
the children directly below that node using the parent-child data in the node table,
whereas the gethierarchy returns the direct parent from each data source. The example
below is from the URL
http://spira.zoology.gla.ac.uk/app/nusoap/tclhierarchyClient.php?string=Pinguinus and
has been simplified for clarity.
<response>
<tcl_name string="Pinguinus" id="13235745" status="valid">
<itis>
<node id="11648509">
<child>Pinguinus impennis</child>
<parent>Pinguinus</parent>
</node>
<node id="11648510">
<child>Pinguinus</child>
<parent>Laridae</parent>
</node>
</itis>
<ncbi>
<node id="12153284">
<child>Pinguinus impennis</child>
<parent>Pinguinus</parent>
</node>
<node id="12153285">
<child>Pinguinus</child>
<parent>Laridae</parent>
</node>
</ncbi>
<sp2k>
</sp2k>
</tcl_name>
</response>
129
5.5 Summary
5.5 Summary
This Chapter shows the queries that TCl-Db supports and gives examples of the types of analysis
that can be performed on integrated data within TCl-Db. The web tools and applications were
developed to search the TCl-Db warehouse of taxonomic names. The tools shown here are
examples of the kind of tools that can be developed. The database, however, has a very broad
scope and with the ease of development using PHP further applications can be built for the
purposes of individual researchers. The examples illustrated here show both a simple standalone
web interface and an interface deployed over another database, TreeBASE. The tools are also
available as a web service through SOAP, enabling interoperability with other systems. Further
work and future considerations will focus on the suggest interface mock up based on Google
suggest. Since the version of TreeBASE shown here is out-of-date, a more recent version of the
data will be installed.
The following two chapters exemplify further the utility of the database. Chapter 6 shows
how the data sources can be compared and reconciled further through the identification of
misspellings and homonyms. Chapter 7 highlights the advantages of using TCl-Db to query
data in TreeBASE.
130
Chapter 6
TCl-Db Reconciling data sources
6.1 Summary
Taxonomic data sources, such as the Integrated Taxonomic Information System (ITIS, 2006),
the Universal Biological Indexer and Organizer (uBio, 2006) and Species 2000 (Bisby & Smith,
2000) do an exemplary job in providing up-to-date taxonomic data to their respective user
communities. As a result, the accessibility of taxonomic data to users has never been easier.
Taxonomists continue to invest in their data by focusing on data accessibility (Patterson et al.,
2006; Remsen et al., 2006), data management (Polaszek, 2005) and now data quality (Chapman,
2005a,b). TCl-Db is a next step in data availability. It provides a global view of taxonomic
names from multiple data sources. The merged data in TCl-Db can be used to determine data
quality in terms of accuracy, consistency and completeness within these taxonomic data sources
(Fox et al., 1994). Described here are the queries and results of a data cleaning and reconciliation
task performed on the class Aves (birds). We have identified spelling inconsistencies, synonym
discrepancies, homonyms and classification differences. These data have been used to add links
between names in the TCl-Db structure, adding value and providing clarity and consistency to
the data provided in TCl-Db.
6.2 Background
As more and more taxonomic data becomes available to the wider user community, focus
is beginning to shift towards understanding the distribution and quality of taxonomic data
131
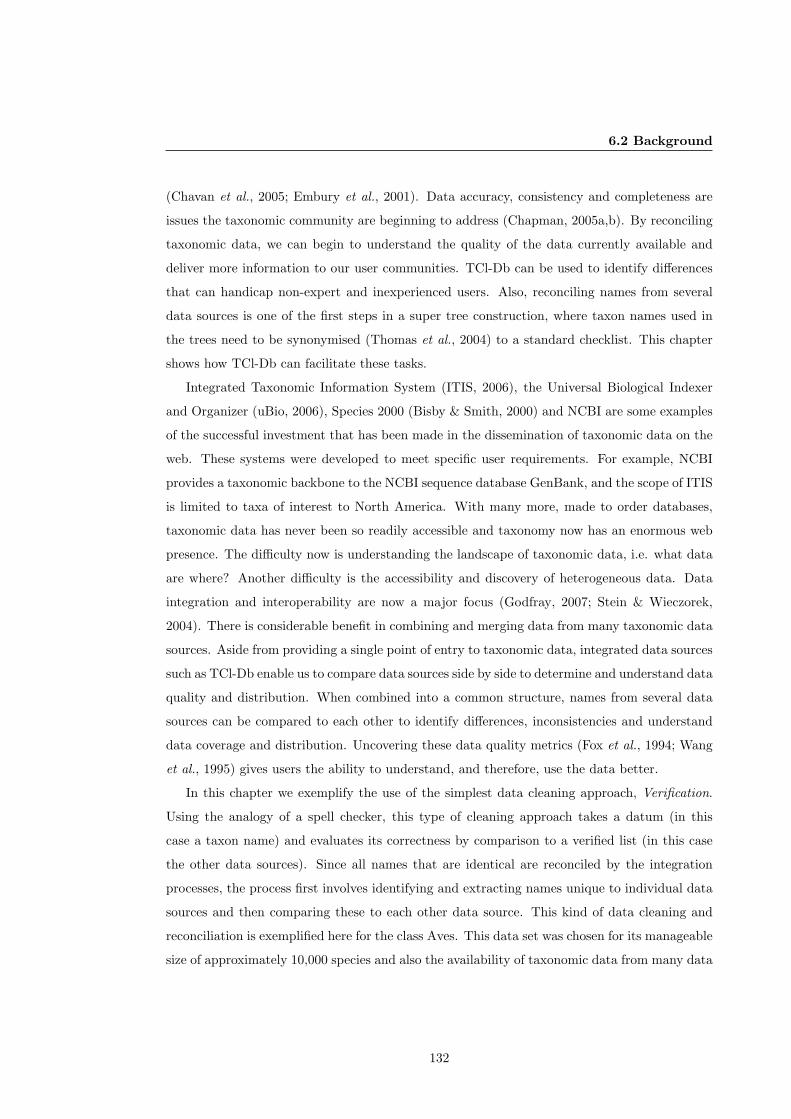
6.2 Background
(Chavan et al., 2005; Embury et al., 2001). Data accuracy, consistency and completeness are
issues the taxonomic community are beginning to address (Chapman, 2005a,b). By reconciling
taxonomic data, we can begin to understand the quality of the data currently available and
deliver more information to our user communities. TCl-Db can be used to identify differences
that can handicap non-expert and inexperienced users. Also, reconciling names from several
data sources is one of the first steps in a super tree construction, where taxon names used in
the trees need to be synonymised (Thomas et al., 2004) to a standard checklist. This chapter
shows how TCl-Db can facilitate these tasks.
Integrated Taxonomic Information System (ITIS, 2006), the Universal Biological Indexer
and Organizer (uBio, 2006), Species 2000 (Bisby & Smith, 2000) and NCBI are some examples
of the successful investment that has been made in the dissemination of taxonomic data on the
web. These systems were developed to meet specific user requirements. For example, NCBI
provides a taxonomic backbone to the NCBI sequence database GenBank, and the scope of ITIS
is limited to taxa of interest to North America. With many more, made to order databases,
taxonomic data has never been so readily accessible and taxonomy now has an enormous web
presence. The difficulty now is understanding the landscape of taxonomic data, i.e. what data
are where? Another difficulty is the accessibility and discovery of heterogeneous data. Data
integration and interoperability are now a major focus (Godfray, 2007; Stein & Wieczorek,
2004). There is considerable benefit in combining and merging data from many taxonomic data
sources. Aside from providing a single point of entry to taxonomic data, integrated data sources
such as TCl-Db enable us to compare data sources side by side to determine and understand data
quality and distribution. When combined into a common structure, names from several data
sources can be compared to each other to identify differences, inconsistencies and understand
data coverage and distribution. Uncovering these data quality metrics (Fox et al., 1994; Wang
et al., 1995) gives users the ability to understand, and therefore, use the data better.
In this chapter we exemplify the use of the simplest data cleaning approach, Verification.
Using the analogy of a spell checker, this type of cleaning approach takes a datum (in this
case a taxon name) and evaluates its correctness by comparison to a verified list (in this case
the other data sources). Since all names that are identical are reconciled by the integration
processes, the process first involves identifying and extracting names unique to individual data
sources and then comparing these to each other data source. This kind of data cleaning and
reconciliation is exemplified here for the class Aves. This data set was chosen for its manageable
size of approximately 10,000 species and also the availability of taxonomic data from many data
132
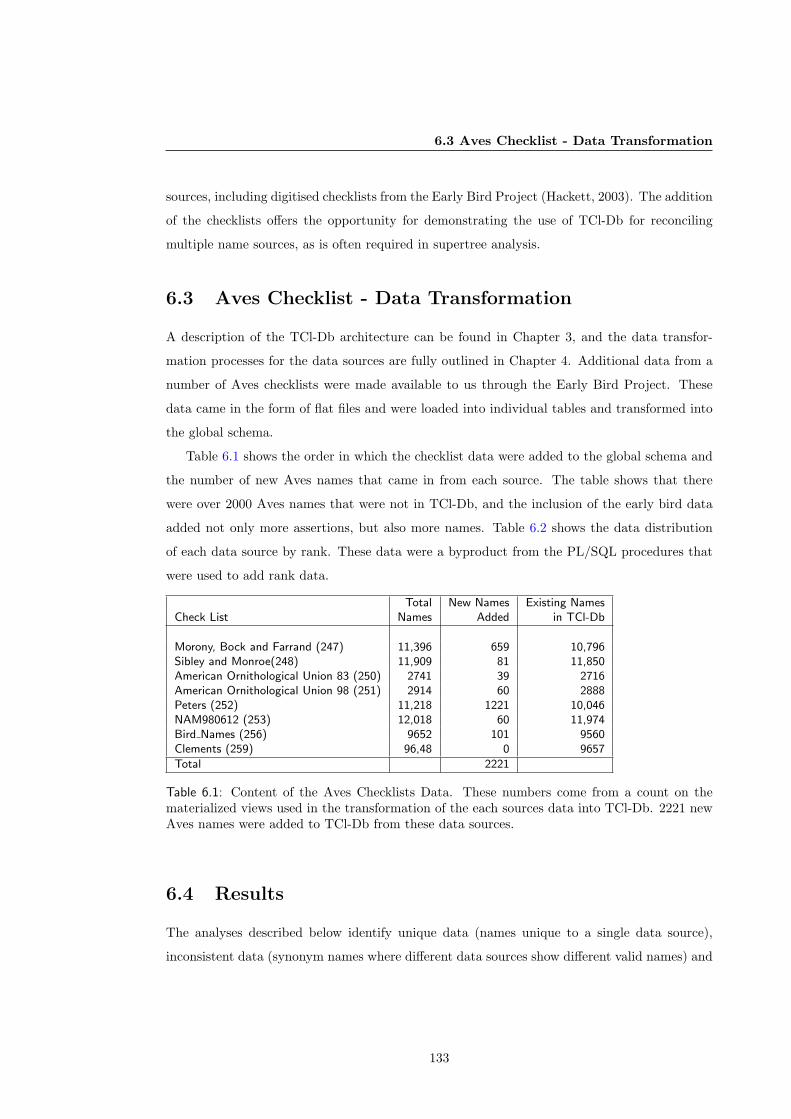
6.3 Aves Checklist - Data Transformation
sources, including digitised checklists from the Early Bird Project (Hackett, 2003). The addition
of the checklists offers the opportunity for demonstrating the use of TCl-Db for reconciling
multiple name sources, as is often required in supertree analysis.
6.3 Aves Checklist - Data Transformation
A description of the TCl-Db architecture can be found in Chapter 3, and the data transfor-
mation processes for the data sources are fully outlined in Chapter 4. Additional data from a
number of Aves checklists were made available to us through the Early Bird Project. These
data came in the form of flat files and were loaded into individual tables and transformed into
the global schema.
Table 6.1 shows the order in which the checklist data were added to the global schema and
the number of new Aves names that came in from each source. The table shows that there
were over 2000 Aves names that were not in TCl-Db, and the inclusion of the early bird data
added not only more assertions, but also more names. Table 6.2 shows the data distribution
of each data source by rank. These data were a byproduct from the PL/SQL procedures that
were used to add rank data.
Total New Names Existing NamesCheck List Names Added in TCl-Db
Morony, Bock and Farrand (247) 11,396 659 10,796Sibley and Monroe(248) 11,909 81 11,850American Ornithological Union 83 (250) 2741 39 2716American Ornithological Union 98 (251) 2914 60 2888Peters (252) 11,218 1221 10,046NAM980612 (253) 12,018 60 11,974Bird Names (256) 9652 101 9560Clements (259) 96,48 0 9657
Total 2221
Table 6.1: Content of the Aves Checklists Data. These numbers come from a count on thematerialized views used in the transformation of the each sources data into TCl-Db. 2221 newAves names were added to TCl-Db from these data sources.
6.4 Results
The analyses described below identify unique data (names unique to a single data source),
inconsistent data (synonym names where different data sources show different valid names) and
133
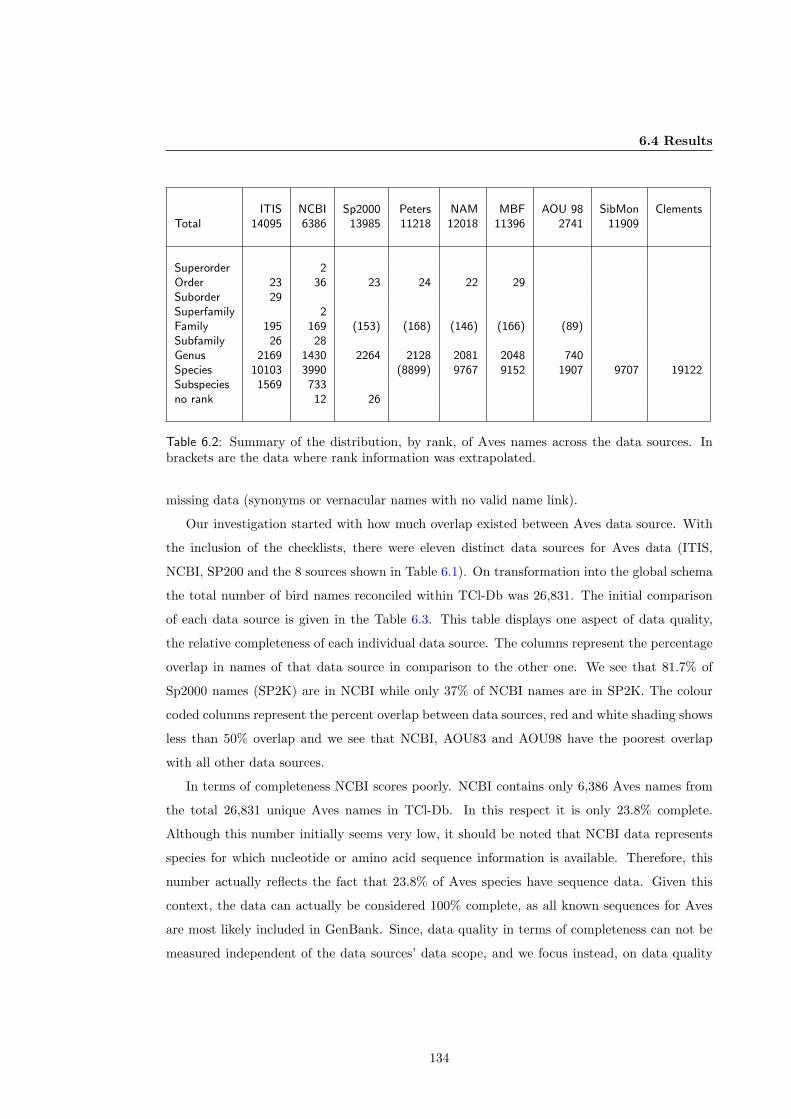
6.4 Results
ITIS NCBI Sp2000 Peters NAM MBF AOU 98 SibMon ClementsTotal 14095 6386 13985 11218 12018 11396 2741 11909
Superorder 2Order 23 36 23 24 22 29Suborder 29Superfamily 2Family 195 169 (153) (168) (146) (166) (89)Subfamily 26 28Genus 2169 1430 2264 2128 2081 2048 740Species 10103 3990 (8899) 9767 9152 1907 9707 19122Subspecies 1569 733no rank 12 26
Table 6.2: Summary of the distribution, by rank, of Aves names across the data sources. Inbrackets are the data where rank information was extrapolated.
missing data (synonyms or vernacular names with no valid name link).
Our investigation started with how much overlap existed between Aves data source. With
the inclusion of the checklists, there were eleven distinct data sources for Aves data (ITIS,
NCBI, SP200 and the 8 sources shown in Table 6.1). On transformation into the global schema
the total number of bird names reconciled within TCl-Db was 26,831. The initial comparison
of each data source is given in the Table 6.3. This table displays one aspect of data quality,
the relative completeness of each individual data source. The columns represent the percentage
overlap in names of that data source in comparison to the other one. We see that 81.7% of
Sp2000 names (SP2K) are in NCBI while only 37% of NCBI names are in SP2K. The colour
coded columns represent the percent overlap between data sources, red and white shading shows
less than 50% overlap and we see that NCBI, AOU83 and AOU98 have the poorest overlap
with all other data sources.
In terms of completeness NCBI scores poorly. NCBI contains only 6,386 Aves names from
the total 26,831 unique Aves names in TCl-Db. In this respect it is only 23.8% complete.
Although this number initially seems very low, it should be noted that NCBI data represents
species for which nucleotide or amino acid sequence information is available. Therefore, this
number actually reflects the fact that 23.8% of Aves species have sequence data. Given this
context, the data can actually be considered 100% complete, as all known sequences for Aves
are most likely included in GenBank. Since, data quality in terms of completeness can not be
measured independent of the data sources’ data scope, and we focus instead, on data quality
134
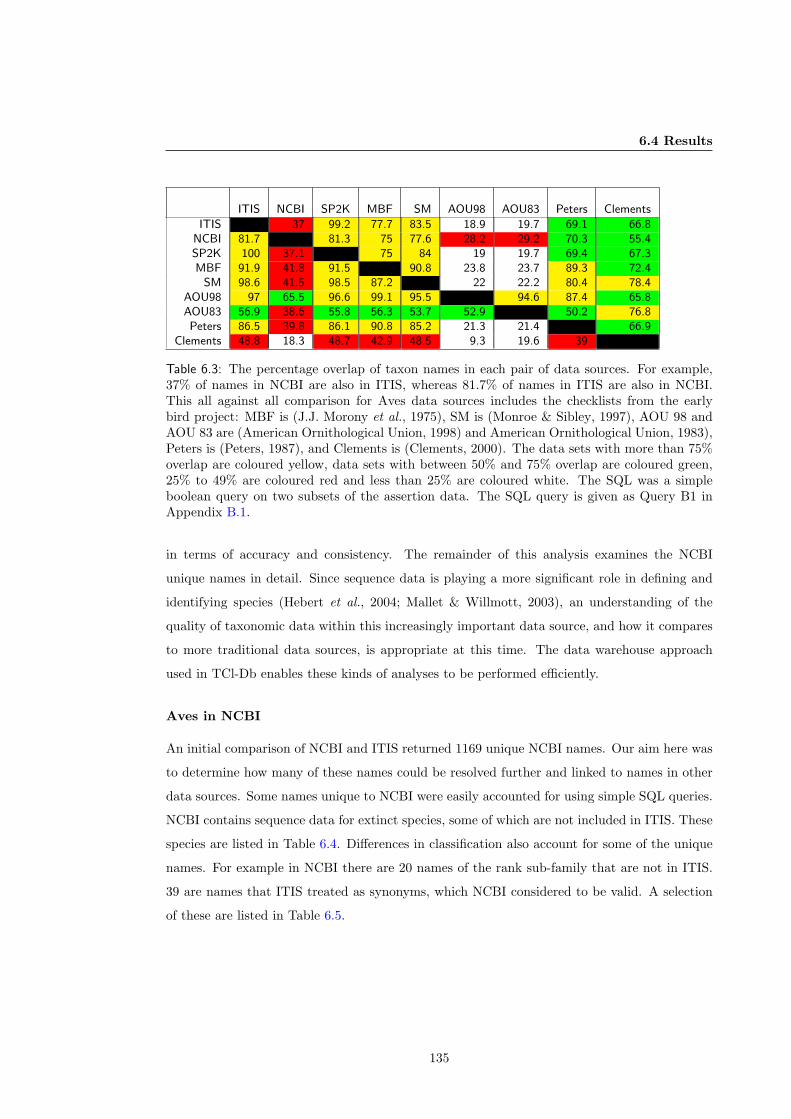
6.4 Results
ITIS NCBI SP2K MBF SM AOU98 AOU83 Peters Clements
ITIS 100 37 99.2 77.7 83.5 18.9 19.7 69.1 66.8NCBI 81.7 100 81.3 75 77.6 28.2 29.2 70.3 55.4SP2K 100 37.1 100 75 84 19 19.7 69.4 67.3MBF 91.9 41.8 91.5 100 90.8 23.8 23.7 89.3 72.4
SM 98.6 41.5 98.5 87.2 100 22 22.2 80.4 78.4AOU98 97 65.5 96.6 99.1 95.5 100 94.6 87.4 65.8AOU83 56.9 38.6 55.8 56.3 53.7 52.9 100 50.2 76.8Peters 86.5 39.8 86.1 90.8 85.2 21.3 21.4 100 66.9
Clements 48.8 18.3 48.7 42.9 48.5 9.3 19.6 39 100
Table 6.3: The percentage overlap of taxon names in each pair of data sources. For example,37% of names in NCBI are also in ITIS, whereas 81.7% of names in ITIS are also in NCBI.This all against all comparison for Aves data sources includes the checklists from the earlybird project: MBF is (J.J. Morony et al., 1975), SM is (Monroe & Sibley, 1997), AOU 98 andAOU 83 are (American Ornithological Union, 1998) and American Ornithological Union, 1983),Peters is (Peters, 1987), and Clements is (Clements, 2000). The data sets with more than 75%overlap are coloured yellow, data sets with between 50% and 75% overlap are coloured green,25% to 49% are coloured red and less than 25% are coloured white. The SQL was a simpleboolean query on two subsets of the assertion data. The SQL query is given as Query B1 inAppendix B.1.
in terms of accuracy and consistency. The remainder of this analysis examines the NCBI
unique names in detail. Since sequence data is playing a more significant role in defining and
identifying species (Hebert et al., 2004; Mallet & Willmott, 2003), an understanding of the
quality of taxonomic data within this increasingly important data source, and how it compares
to more traditional data sources, is appropriate at this time. The data warehouse approach
used in TCl-Db enables these kinds of analyses to be performed efficiently.
Aves in NCBI
An initial comparison of NCBI and ITIS returned 1169 unique NCBI names. Our aim here was
to determine how many of these names could be resolved further and linked to names in other
data sources. Some names unique to NCBI were easily accounted for using simple SQL queries.
NCBI contains sequence data for extinct species, some of which are not included in ITIS. These
species are listed in Table 6.4. Differences in classification also account for some of the unique
names. For example in NCBI there are 20 names of the rank sub-family that are not in ITIS.
39 are names that ITIS treated as synonyms, which NCBI considered to be valid. A selection
of these are listed in Table 6.5.
135
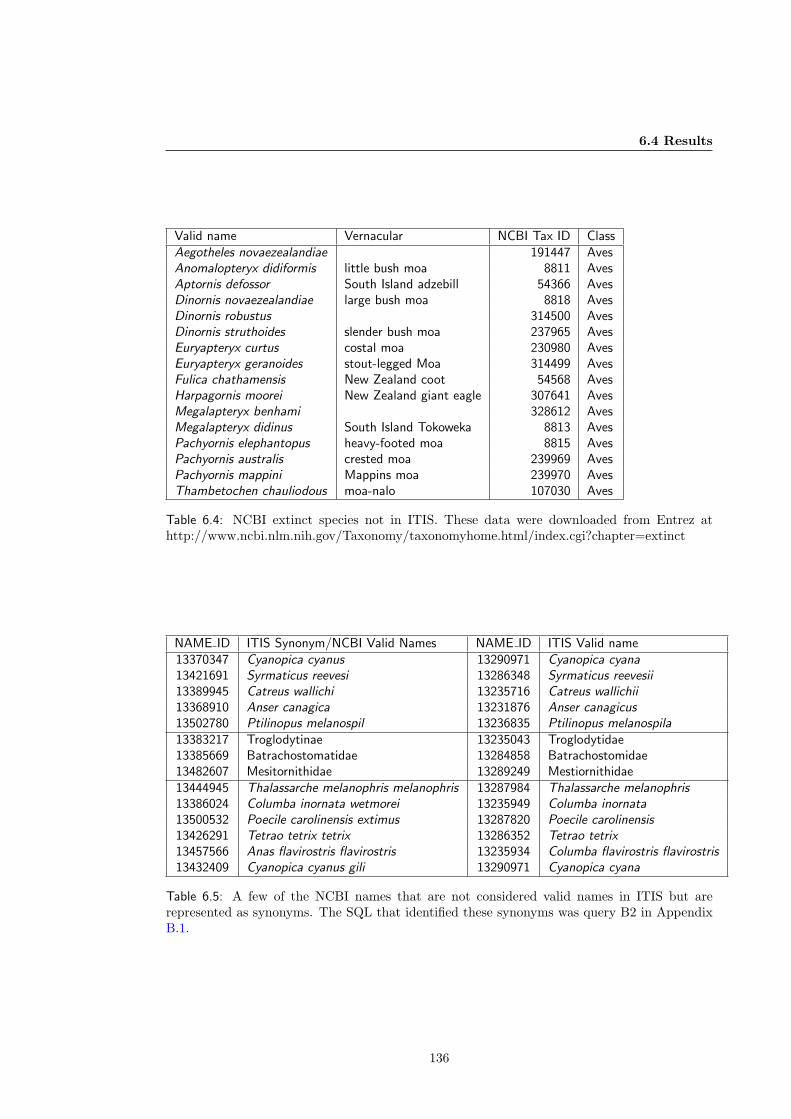
6.4 Results
Valid name Vernacular NCBI Tax ID ClassAegotheles novaezealandiae 191447 AvesAnomalopteryx didiformis little bush moa 8811 AvesAptornis defossor South Island adzebill 54366 AvesDinornis novaezealandiae large bush moa 8818 AvesDinornis robustus 314500 AvesDinornis struthoides slender bush moa 237965 AvesEuryapteryx curtus costal moa 230980 AvesEuryapteryx geranoides stout-legged Moa 314499 AvesFulica chathamensis New Zealand coot 54568 AvesHarpagornis moorei New Zealand giant eagle 307641 AvesMegalapteryx benhami 328612 AvesMegalapteryx didinus South Island Tokoweka 8813 AvesPachyornis elephantopus heavy-footed moa 8815 AvesPachyornis australis crested moa 239969 AvesPachyornis mappini Mappins moa 239970 AvesThambetochen chauliodous moa-nalo 107030 Aves
Table 6.4: NCBI extinct species not in ITIS. These data were downloaded from Entrez athttp://www.ncbi.nlm.nih.gov/Taxonomy/taxonomyhome.html/index.cgi?chapter=extinct
NAME ID ITIS Synonym/NCBI Valid Names NAME ID ITIS Valid name13370347 Cyanopica cyanus 13290971 Cyanopica cyana13421691 Syrmaticus reevesi 13286348 Syrmaticus reevesii13389945 Catreus wallichi 13235716 Catreus wallichii13368910 Anser canagica 13231876 Anser canagicus13502780 Ptilinopus melanospil 13236835 Ptilinopus melanospila13383217 Troglodytinae 13235043 Troglodytidae13385669 Batrachostomatidae 13284858 Batrachostomidae13482607 Mesitornithidae 13289249 Mestiornithidae13444945 Thalassarche melanophris melanophris 13287984 Thalassarche melanophris13386024 Columba inornata wetmorei 13235949 Columba inornata13500532 Poecile carolinensis extimus 13287820 Poecile carolinensis13426291 Tetrao tetrix tetrix 13286352 Tetrao tetrix13457566 Anas flavirostris flavirostris 13235934 Columba flavirostris flavirostris13432409 Cyanopica cyanus gili 13290971 Cyanopica cyana
Table 6.5: A few of the NCBI names that are not considered valid names in ITIS but arerepresented as synonyms. The SQL that identified these synonyms was query B2 in AppendixB.1.
136
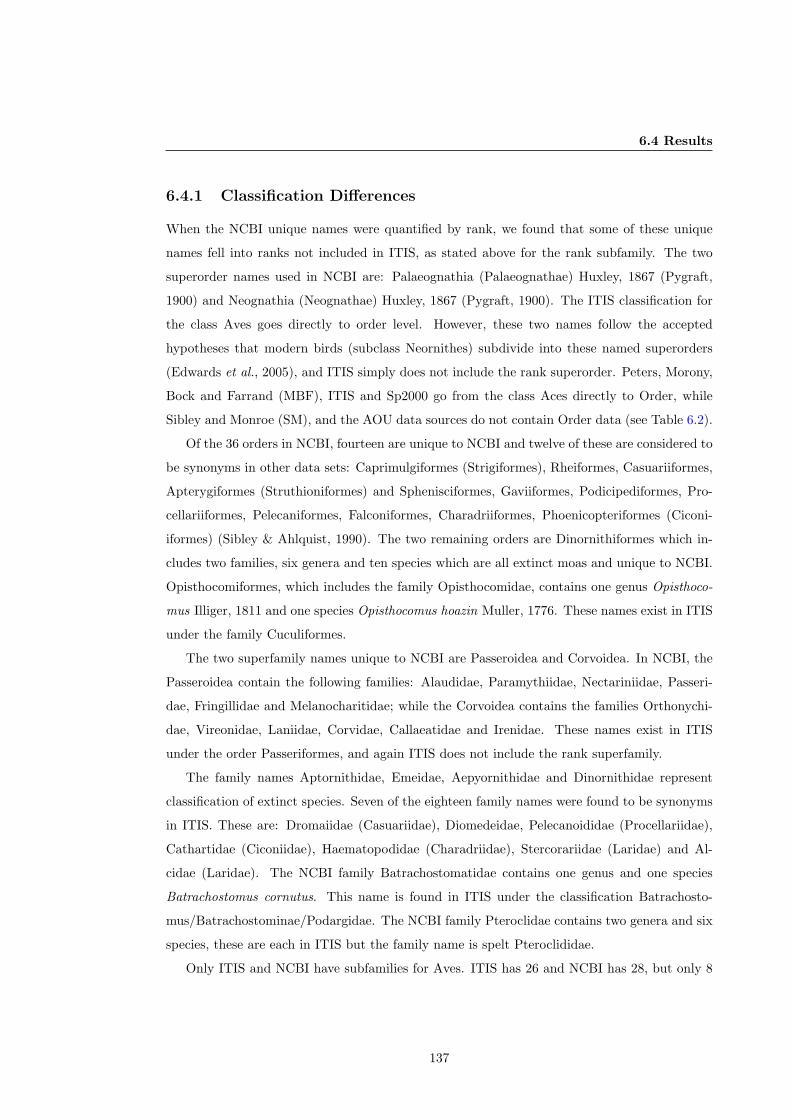
6.4 Results
6.4.1 Classification Differences
When the NCBI unique names were quantified by rank, we found that some of these unique
names fell into ranks not included in ITIS, as stated above for the rank subfamily. The two
superorder names used in NCBI are: Palaeognathia (Palaeognathae) Huxley, 1867 (Pygraft,
1900) and Neognathia (Neognathae) Huxley, 1867 (Pygraft, 1900). The ITIS classification for
the class Aves goes directly to order level. However, these two names follow the accepted
hypotheses that modern birds (subclass Neornithes) subdivide into these named superorders
(Edwards et al., 2005), and ITIS simply does not include the rank superorder. Peters, Morony,
Bock and Farrand (MBF), ITIS and Sp2000 go from the class Aces directly to Order, while
Sibley and Monroe (SM), and the AOU data sources do not contain Order data (see Table 6.2).
Of the 36 orders in NCBI, fourteen are unique to NCBI and twelve of these are considered to
be synonyms in other data sets: Caprimulgiformes (Strigiformes), Rheiformes, Casuariiformes,
Apterygiformes (Struthioniformes) and Sphenisciformes, Gaviiformes, Podicipediformes, Pro-
cellariiformes, Pelecaniformes, Falconiformes, Charadriiformes, Phoenicopteriformes (Ciconi-
iformes) (Sibley & Ahlquist, 1990). The two remaining orders are Dinornithiformes which in-
cludes two families, six genera and ten species which are all extinct moas and unique to NCBI.
Opisthocomiformes, which includes the family Opisthocomidae, contains one genus Opisthoco-
mus Illiger, 1811 and one species Opisthocomus hoazin Muller, 1776. These names exist in ITIS
under the family Cuculiformes.
The two superfamily names unique to NCBI are Passeroidea and Corvoidea. In NCBI, the
Passeroidea contain the following families: Alaudidae, Paramythiidae, Nectariniidae, Passeri-
dae, Fringillidae and Melanocharitidae; while the Corvoidea contains the families Orthonychi-
dae, Vireonidae, Laniidae, Corvidae, Callaeatidae and Irenidae. These names exist in ITIS
under the order Passeriformes, and again ITIS does not include the rank superfamily.
The family names Aptornithidae, Emeidae, Aepyornithidae and Dinornithidae represent
classification of extinct species. Seven of the eighteen family names were found to be synonyms
in ITIS. These are: Dromaiidae (Casuariidae), Diomedeidae, Pelecanoididae (Procellariidae),
Cathartidae (Ciconiidae), Haematopodidae (Charadriidae), Stercorariidae (Laridae) and Al-
cidae (Laridae). The NCBI family Batrachostomatidae contains one genus and one species
Batrachostomus cornutus. This name is found in ITIS under the classification Batrachosto-
mus/Batrachostominae/Podargidae. The NCBI family Pteroclidae contains two genera and six
species, these are each in ITIS but the family name is spelt Pteroclididae.
Only ITIS and NCBI have subfamilies for Aves. ITIS has 26 and NCBI has 28, but only 8
137
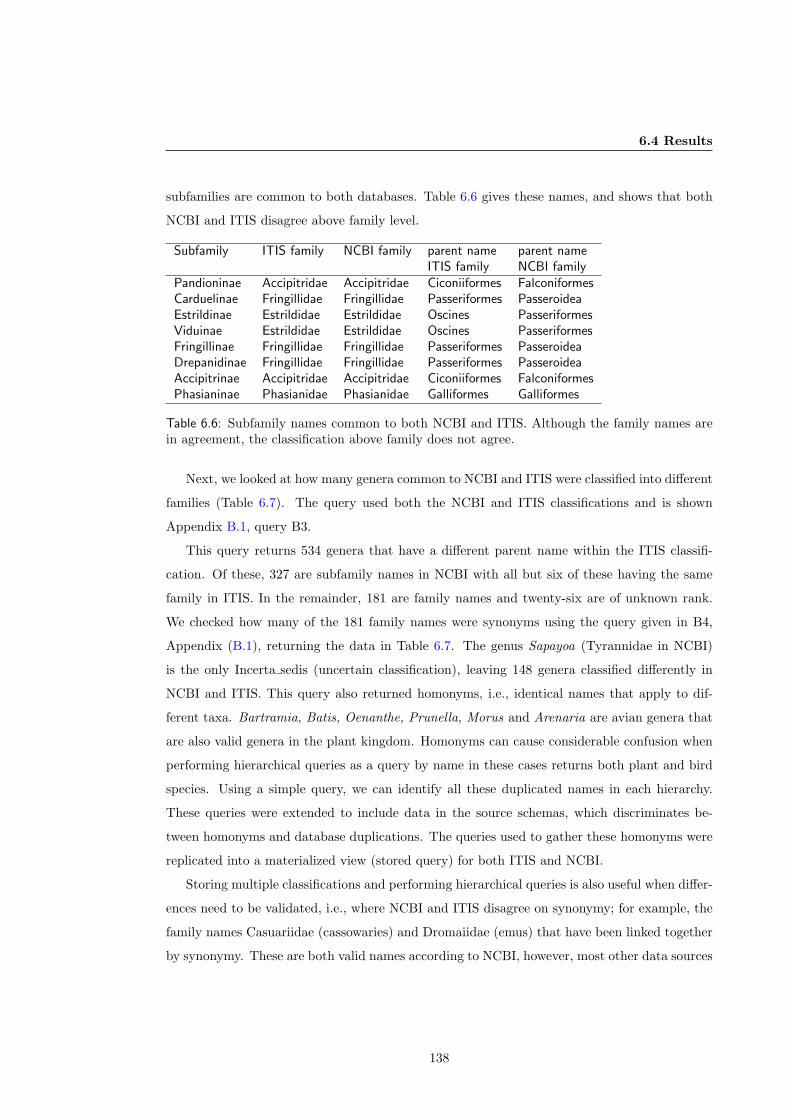
6.4 Results
subfamilies are common to both databases. Table 6.6 gives these names, and shows that both
NCBI and ITIS disagree above family level.
Subfamily ITIS family NCBI family parent name parent nameITIS family NCBI family
Pandioninae Accipitridae Accipitridae Ciconiiformes FalconiformesCarduelinae Fringillidae Fringillidae Passeriformes PasseroideaEstrildinae Estrildidae Estrildidae Oscines PasseriformesViduinae Estrildidae Estrildidae Oscines PasseriformesFringillinae Fringillidae Fringillidae Passeriformes PasseroideaDrepanidinae Fringillidae Fringillidae Passeriformes PasseroideaAccipitrinae Accipitridae Accipitridae Ciconiiformes FalconiformesPhasianinae Phasianidae Phasianidae Galliformes Galliformes
Table 6.6: Subfamily names common to both NCBI and ITIS. Although the family names arein agreement, the classification above family does not agree.
Next, we looked at how many genera common to NCBI and ITIS were classified into different
families (Table 6.7). The query used both the NCBI and ITIS classifications and is shown
Appendix B.1, query B3.
This query returns 534 genera that have a different parent name within the ITIS classifi-
cation. Of these, 327 are subfamily names in NCBI with all but six of these having the same
family in ITIS. In the remainder, 181 are family names and twenty-six are of unknown rank.
We checked how many of the 181 family names were synonyms using the query given in B4,
Appendix (B.1), returning the data in Table 6.7. The genus Sapayoa (Tyrannidae in NCBI)
is the only Incerta sedis (uncertain classification), leaving 148 genera classified differently in
NCBI and ITIS. This query also returned homonyms, i.e., identical names that apply to dif-
ferent taxa. Bartramia, Batis, Oenanthe, Prunella, Morus and Arenaria are avian genera that
are also valid genera in the plant kingdom. Homonyms can cause considerable confusion when
performing hierarchical queries as a query by name in these cases returns both plant and bird
species. Using a simple query, we can identify all these duplicated names in each hierarchy.
These queries were extended to include data in the source schemas, which discriminates be-
tween homonyms and database duplications. The queries used to gather these homonyms were
replicated into a materialized view (stored query) for both ITIS and NCBI.
Storing multiple classifications and performing hierarchical queries is also useful when differ-
ences need to be validated, i.e., where NCBI and ITIS disagree on synonymy; for example, the
family names Casuariidae (cassowaries) and Dromaiidae (emus) that have been linked together
by synonymy. These are both valid names according to NCBI, however, most other data sources
138
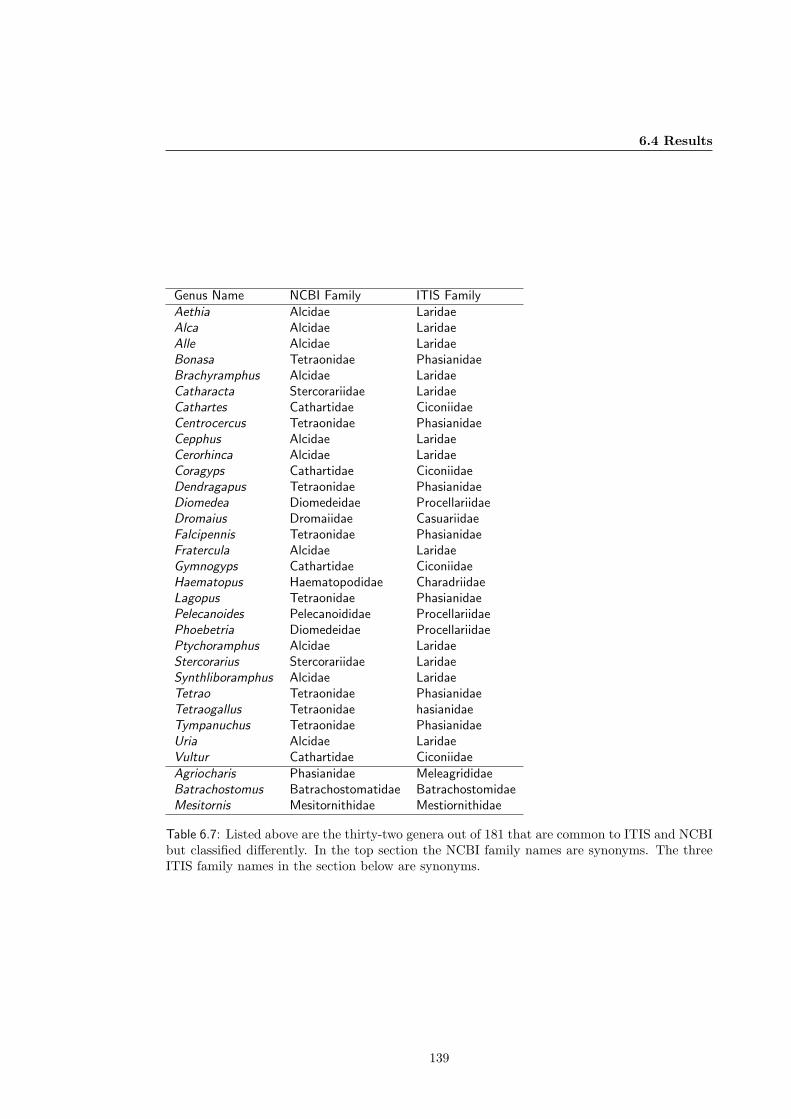
6.4 Results
Genus Name NCBI Family ITIS FamilyAethia Alcidae LaridaeAlca Alcidae LaridaeAlle Alcidae LaridaeBonasa Tetraonidae PhasianidaeBrachyramphus Alcidae LaridaeCatharacta Stercorariidae LaridaeCathartes Cathartidae CiconiidaeCentrocercus Tetraonidae PhasianidaeCepphus Alcidae LaridaeCerorhinca Alcidae LaridaeCoragyps Cathartidae CiconiidaeDendragapus Tetraonidae PhasianidaeDiomedea Diomedeidae ProcellariidaeDromaius Dromaiidae CasuariidaeFalcipennis Tetraonidae PhasianidaeFratercula Alcidae LaridaeGymnogyps Cathartidae CiconiidaeHaematopus Haematopodidae CharadriidaeLagopus Tetraonidae PhasianidaePelecanoides Pelecanoididae ProcellariidaePhoebetria Diomedeidae ProcellariidaePtychoramphus Alcidae LaridaeStercorarius Stercorariidae LaridaeSynthliboramphus Alcidae LaridaeTetrao Tetraonidae PhasianidaeTetraogallus Tetraonidae hasianidaeTympanuchus Tetraonidae PhasianidaeUria Alcidae LaridaeVultur Cathartidae CiconiidaeAgriocharis Phasianidae MeleagrididaeBatrachostomus Batrachostomatidae BatrachostomidaeMesitornis Mesitornithidae Mestiornithidae
Table 6.7: Listed above are the thirty-two genera out of 181 that are common to ITIS and NCBIbut classified differently. In the top section the NCBI family names are synonyms. The threeITIS family names in the section below are synonyms.
139
6.4 Results
show Casuariidae as the current accepted name, and link Dromaiidae to it as a synonym. This
link stems from the reclassification of the emus which were formerly classified in their own
family, Dromaiidae and later added to Casuariidae. This was determined by examining the
children, as shown in Figure 6.1. The first graph shows the ITIS children for Casuariidae and
the second shows that the children in NCBI do not include the genus Dromaius. The Sibley
and Monroe classification agrees with the ITIS classification and can be used to validate the
link created between two valid names within TCl-Db.
6.4.2 Spelling
Next, we examined the accuracy of the names in NCBI. The examples above highlighted not only
classification differences between NCBI and ITIS, but also spelling discrepancies. Specifically,
we were interested in determining the number of names that were not reconciled at the outset,
due to differences in spelling. Using the Agrep algorithm (Wu & Manber, 1992), we compared
the unique names in NCBI against ITIS names. Agrep is a string searching program that
performs approximate pattern matching. Agrep implements several different algorithms for
string matching, including a variant of the Boyer-Moore algorithm and the bitap algorithm
based on the shift-or algorithm of Baeza-Yates and Gonnet (Navarro, 2001; Wu & Manber,
1992). Agrep takes as input an approximate string (or pattern) and uses the inbuilt string
matching algorithms to find that string in a given text file. Using Agrep, names unique to
NCBI were compared against ITIS names, allowing for mismatches. Agrep originally found
202 potential matches and this list was manually inspected to give the data in Table 6.8. Of
these Agrep matches, 101 (˜1.6% of the 6386 NCBI Aves) names were found to be potentially
misspelt.
These names and the ITIS matches are shown in Table 6.8, with the spelling differences
highlighted. Twenty-two are genus names (green in Table 6.8), three are family names (blue
in Table 6.8) and the remaining are species names. The refinement process was largely manual
and removed approximate matches found between a subfamily ending in -idae and a family
ending in -inae. These could be easily identified automatically with simple rules in a PL/SQL
script. For example, a rule can be used to rule out matches where the matching string is the
parent name of the search string.
Two matches in the genus epithet were found, Pipile Nattereri matched to the ITIS name
Pipra nattereri and Turdus abyssinicus matched the ITIS name Turtur abyssinicus. The visual
check could not tell if these were misspellings or actually different genera with the same specific
140
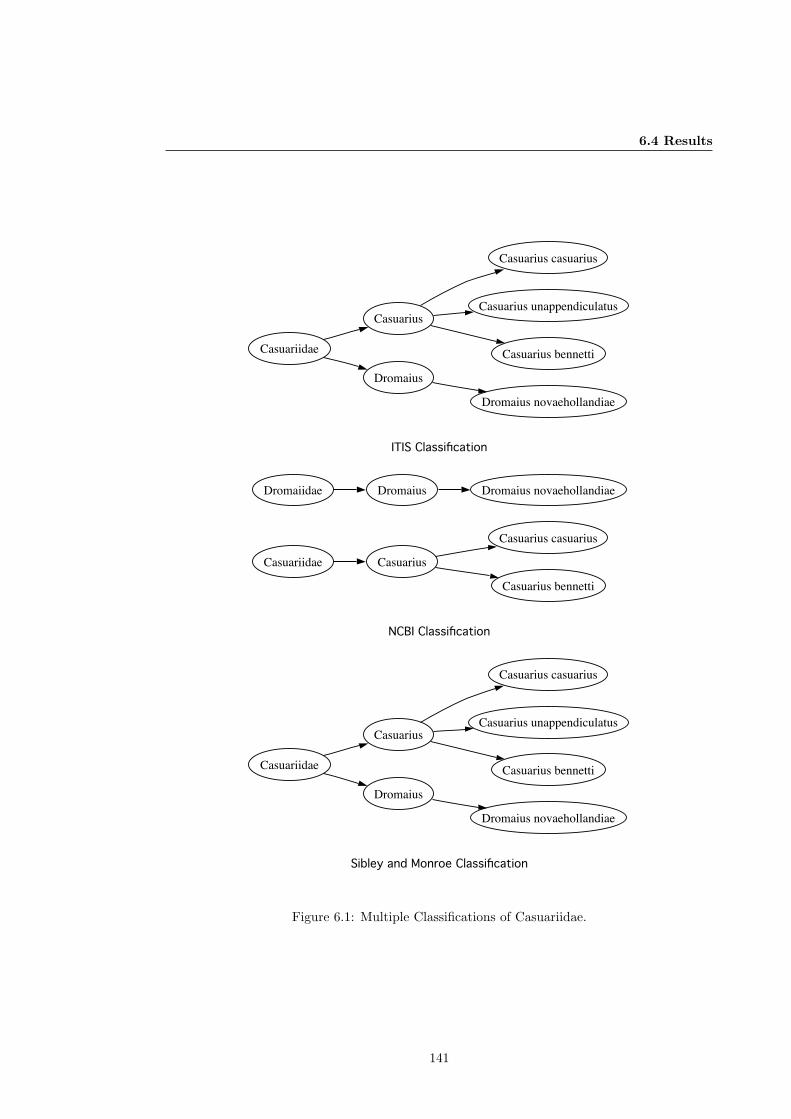
6.4 Results
ITIS Classification
Casuariidae
Casuarius
Dromaius
Casuarius casuarius
Casuarius unappendiculatus
Casuarius bennetti
Dromaius novaehollandiae
NCBI Classification
Casuariidae Casuarius
Casuarius casuarius
Casuarius bennetti
Dromaiidae Dromaius Dromaius novaehollandiae
Sibley and Monroe Classification
Casuariidae
Casuarius
Dromaius
Casuarius casuarius
Casuarius unappendiculatus
Casuarius bennetti
Dromaius novaehollandiae
Figure 6.1: Multiple Classifications of Casuariidae.
141
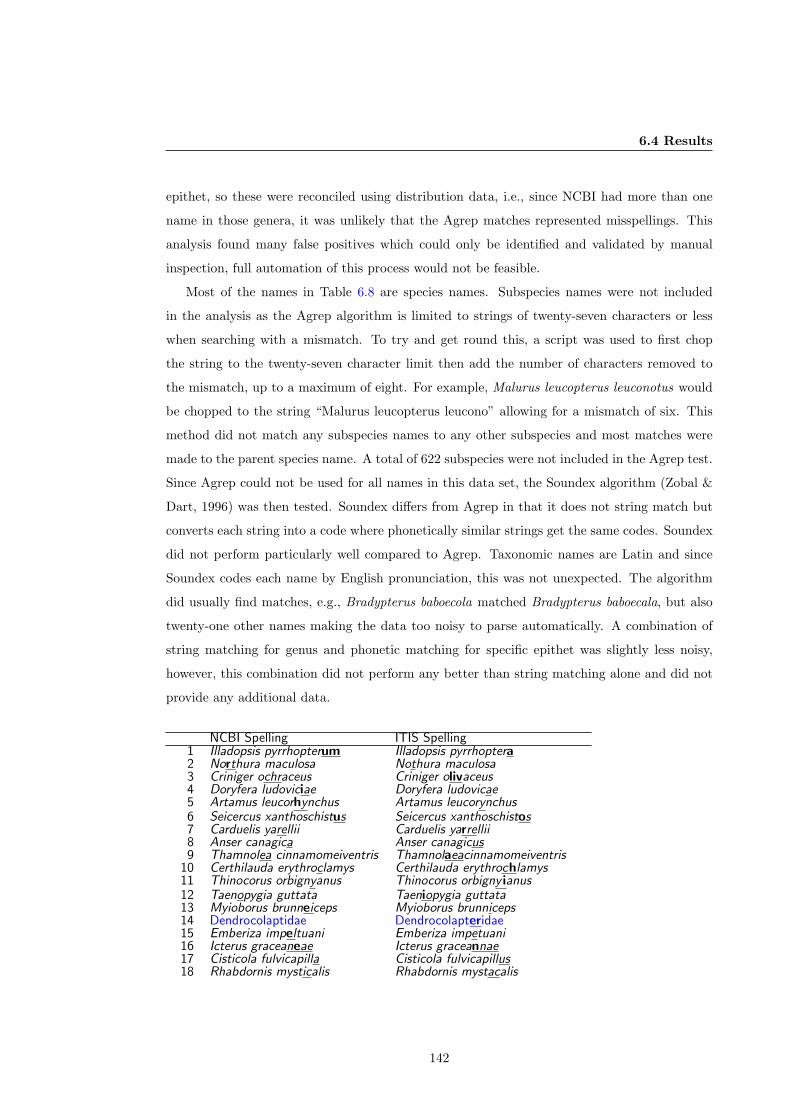
6.4 Results
epithet, so these were reconciled using distribution data, i.e., since NCBI had more than one
name in those genera, it was unlikely that the Agrep matches represented misspellings. This
analysis found many false positives which could only be identified and validated by manual
inspection, full automation of this process would not be feasible.
Most of the names in Table 6.8 are species names. Subspecies names were not included
in the analysis as the Agrep algorithm is limited to strings of twenty-seven characters or less
when searching with a mismatch. To try and get round this, a script was used to first chop
the string to the twenty-seven character limit then add the number of characters removed to
the mismatch, up to a maximum of eight. For example, Malurus leucopterus leuconotus would
be chopped to the string “Malurus leucopterus leucono” allowing for a mismatch of six. This
method did not match any subspecies names to any other subspecies and most matches were
made to the parent species name. A total of 622 subspecies were not included in the Agrep test.
Since Agrep could not be used for all names in this data set, the Soundex algorithm (Zobal &
Dart, 1996) was then tested. Soundex differs from Agrep in that it does not string match but
converts each string into a code where phonetically similar strings get the same codes. Soundex
did not perform particularly well compared to Agrep. Taxonomic names are Latin and since
Soundex codes each name by English pronunciation, this was not unexpected. The algorithm
did usually find matches, e.g., Bradypterus baboecola matched Bradypterus baboecala, but also
twenty-one other names making the data too noisy to parse automatically. A combination of
string matching for genus and phonetic matching for specific epithet was slightly less noisy,
however, this combination did not perform any better than string matching alone and did not
provide any additional data.
NCBI Spelling ITIS Spelling1 Illadopsis pyrrhopterum Illadopsis pyrrhoptera2 Northura maculosa Nothura maculosa3 Criniger ochraceus Criniger olivaceus4 Doryfera ludoviciae Doryfera ludovicae5 Artamus leucorhynchus Artamus leucorynchus6 Seicercus xanthoschistus Seicercus xanthoschistos7 Carduelis yarellii Carduelis yarrellii8 Anser canagica Anser canagicus9 Thamnolea cinnamomeiventris Thamnolaeacinnamomeiventris
10 Certhilauda erythroclamys Certhilauda erythrochlamys11 Thinocorus orbignyanus Thinocorus orbigny ianus12 Taenopygia guttata Taeniopygia guttata13 Myioborus brunneiceps Myioborus brunniceps14 Dendrocolaptidae Dendrocolapteridae15 Emberiza impeltuani Emberiza impetuani16 Icterus graceaneae Icterus graceannae17 Cisticola fulvicapilla Cisticola fulvicapillus18 Rhabdornis mysticalis Rhabdornis mystacalis
142
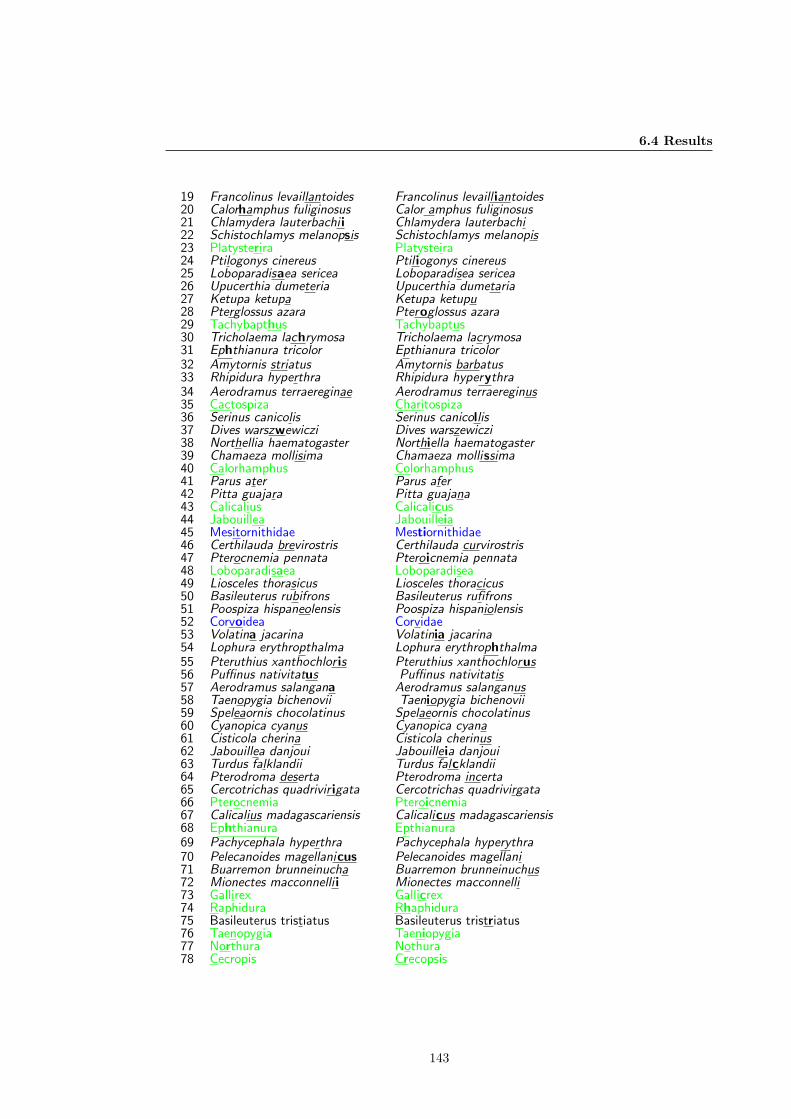
6.4 Results
19 Francolinus levaillantoides Francolinus levaill iantoides20 Calorhamphus fuliginosus Calor amphus fuliginosus21 Chlamydera lauterbachi i Chlamydera lauterbachi22 Schistochlamys melanopsis Schistochlamys melanopis23 Platysterira Platysteira24 Ptilogonys cinereus Ptil iogonys cinereus25 Loboparadisaea sericea Loboparadisea sericea26 Upucerthia dumeteria Upucerthia dumetaria27 Ketupa ketupa Ketupa ketupu28 Pterglossus azara Pteroglossus azara29 Tachybapthus Tachybaptus30 Tricholaema lachrymosa Tricholaema lacrymosa31 Ephthianura tricolor Epthianura tricolor32 Amytornis striatus Amytornis barbatus33 Rhipidura hyperthra Rhipidura hyperythra34 Aerodramus terraereginae Aerodramus terraereginus35 Cactospiza Charitospiza36 Serinus canicolis Serinus canicollis37 Dives warszwewiczi Dives warszewiczi38 Northellia haematogaster Northiella haematogaster39 Chamaeza mollisima Chamaeza mollissima40 Calorhamphus Colorhamphus41 Parus ater Parus afer42 Pitta guajara Pitta guajana43 Calicalius Calicalicus44 Jabouillea Jabouilleia45 Mesitornithidae Mestiornithidae46 Certhilauda brevirostris Certhilauda curvirostris47 Pterocnemia pennata Pteroicnemia pennata48 Loboparadisaea Loboparadisea49 Liosceles thorasicus Liosceles thoracicus50 Basileuterus rubifrons Basileuterus rufifrons51 Poospiza hispaneolensis Poospiza hispaniolensis52 Corvoidea Corvidae53 Volatina jacarina Volatinia jacarina54 Lophura erythropthalma Lophura erythrophthalma55 Pteruthius xanthochlor is Pteruthius xanthochlorus56 Puffinus nativitatus Puffinus nativitatis57 Aerodramus salangana Aerodramus salanganus58 Taenopygia bichenovii Taeniopygia bichenovii59 Speleaornis chocolatinus Spelaeornis chocolatinus60 Cyanopica cyanus Cyanopica cyana61 Cisticola cherina Cisticola cherinus62 Jabouillea danjoui Jabouilleia danjoui63 Turdus falklandii Turdus falcklandii64 Pterodroma deserta Pterodroma incerta65 Cercotrichas quadrivir igata Cercotrichas quadrivirgata66 Pterocnemia Pteroicnemia67 Calicalius madagascariensis Calicalicus madagascariensis68 Ephthianura Epthianura69 Pachycephala hyperthra Pachycephala hyperythra70 Pelecanoides magellanicus Pelecanoides magellani71 Buarremon brunneinucha Buarremon brunneinuchus72 Mionectes macconnelli i Mionectes macconnelli73 Gallirex Gallicrex74 Raphidura Rhaphidura75 Basileuterus tristiatus Basileuterus tristriatus76 Taenopygia Taeniopygia77 Northura Nothura78 Cecropis Crecopsis
143
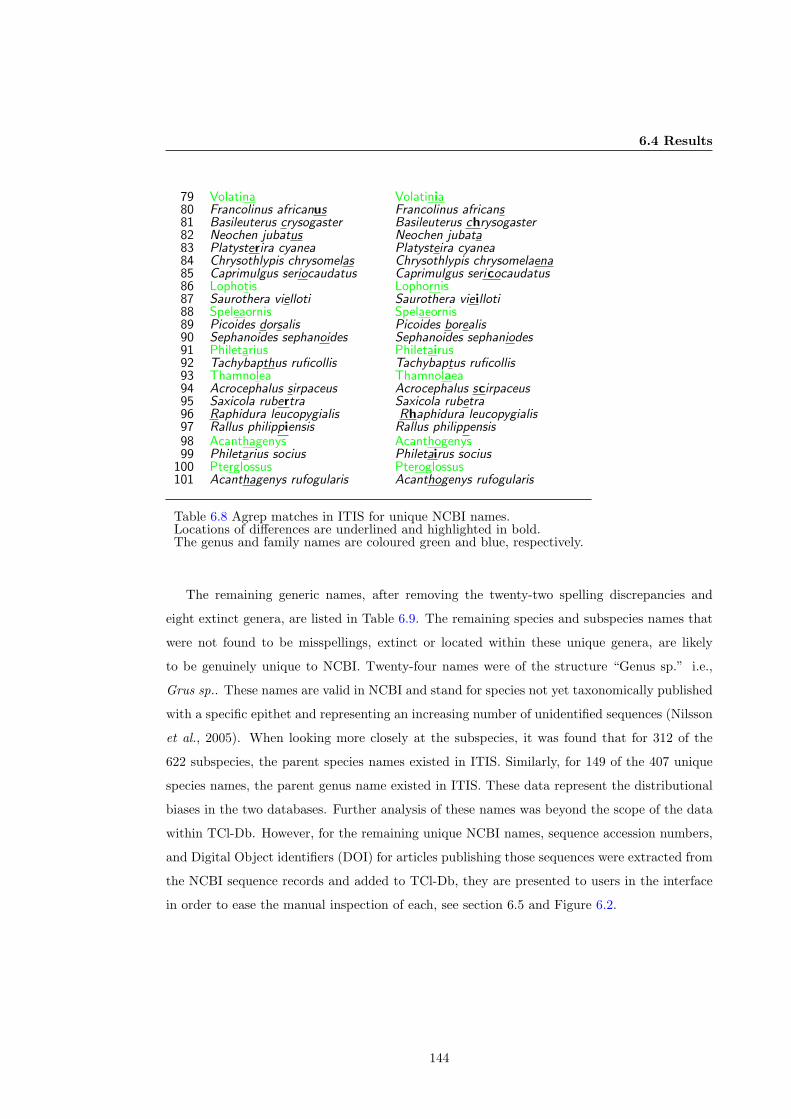
6.4 Results
79 Volatina Volatinia80 Francolinus africanus Francolinus africans81 Basileuterus crysogaster Basileuterus chrysogaster82 Neochen jubatus Neochen jubata83 Platysterira cyanea Platysteira cyanea84 Chrysothlypis chrysomelas Chrysothlypis chrysomelaena85 Caprimulgus seriocaudatus Caprimulgus sericocaudatus86 Lophotis Lophornis87 Saurothera vielloti Saurothera vieilloti88 Speleaornis Spelaeornis89 Picoides dorsalis Picoides borealis90 Sephanoides sephanoides Sephanoides sephaniodes91 Philetarius Philetairus92 Tachybapthus ruficollis Tachybaptus ruficollis93 Thamnolea Thamnolaea94 Acrocephalus sirpaceus Acrocephalus scirpaceus95 Saxicola rubertra Saxicola rubetra96 Raphidura leucopygialis Rhaphidura leucopygialis97 Rallus philippiensis Rallus philippensis98 Acanthagenys Acanthogenys99 Philetarius socius Philetairus socius
100 Pterglossus Pteroglossus101 Acanthagenys rufogularis Acanthogenys rufogularis
Table 6.8 Agrep matches in ITIS for unique NCBI names.Locations of differences are underlined and highlighted in bold.The genus and family names are coloured green and blue, respectively.
The remaining generic names, after removing the twenty-two spelling discrepancies and
eight extinct genera, are listed in Table 6.9. The remaining species and subspecies names that
were not found to be misspellings, extinct or located within these unique genera, are likely
to be genuinely unique to NCBI. Twenty-four names were of the structure “Genus sp.” i.e.,
Grus sp.. These names are valid in NCBI and stand for species not yet taxonomically published
with a specific epithet and representing an increasing number of unidentified sequences (Nilsson
et al., 2005). When looking more closely at the subspecies, it was found that for 312 of the
622 subspecies, the parent species names existed in ITIS. Similarly, for 149 of the 407 unique
species names, the parent genus name existed in ITIS. These data represent the distributional
biases in the two databases. Further analysis of these names was beyond the scope of the data
within TCl-Db. However, for the remaining unique NCBI names, sequence accession numbers,
and Digital Object identifiers (DOI) for articles publishing those sequences were extracted from
the NCBI sequence records and added to TCl-Db, they are presented to users in the interface
in order to ease the manual inspection of each, see section 6.5 and Figure 6.2.
144
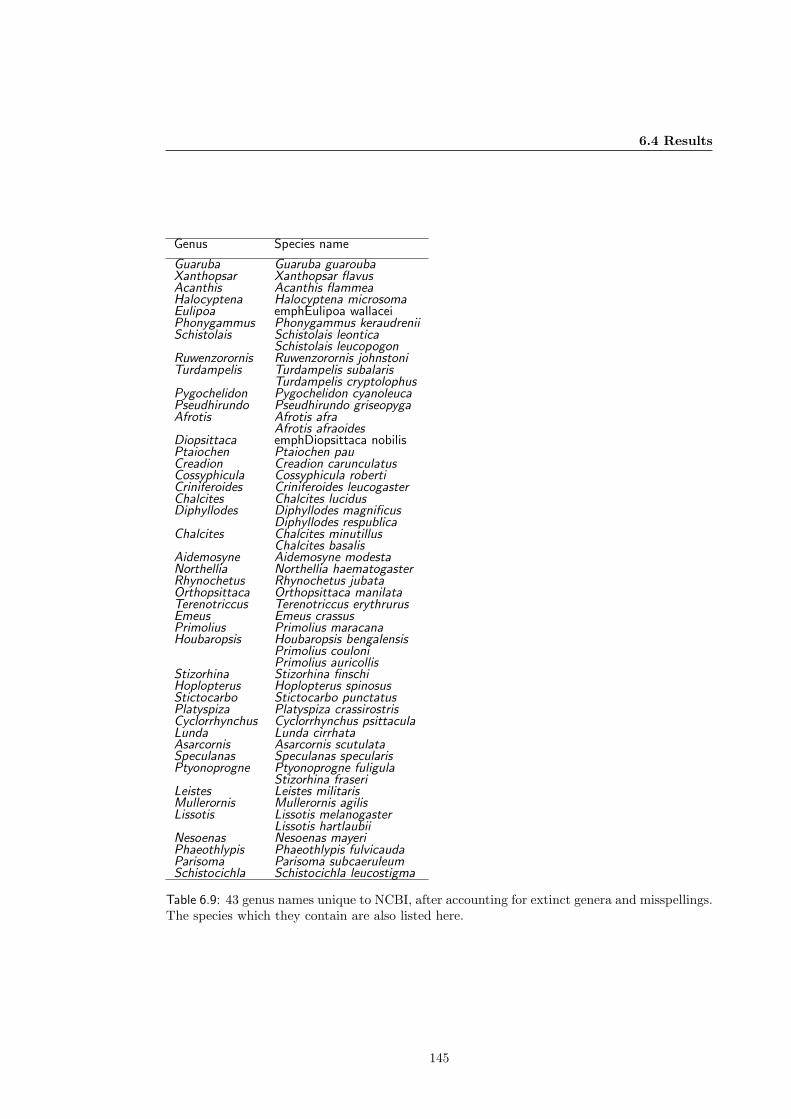
6.4 Results
Genus Species name
Guaruba Guaruba guaroubaXanthopsar Xanthopsar flavusAcanthis Acanthis flammeaHalocyptena Halocyptena microsomaEulipoa emphEulipoa wallaceiPhonygammus Phonygammus keraudreniiSchistolais Schistolais leontica
Schistolais leucopogonRuwenzorornis Ruwenzorornis johnstoniTurdampelis Turdampelis subalaris
Turdampelis cryptolophusPygochelidon Pygochelidon cyanoleucaPseudhirundo Pseudhirundo griseopygaAfrotis Afrotis afra
Afrotis afraoidesDiopsittaca emphDiopsittaca nobilisPtaiochen Ptaiochen pauCreadion Creadion carunculatusCossyphicula Cossyphicula robertiCriniferoides Criniferoides leucogasterChalcites Chalcites lucidusDiphyllodes Diphyllodes magnificus
Diphyllodes respublicaChalcites Chalcites minutillus
Chalcites basalisAidemosyne Aidemosyne modestaNorthellia Northellia haematogasterRhynochetus Rhynochetus jubataOrthopsittaca Orthopsittaca manilataTerenotriccus Terenotriccus erythrurusEmeus Emeus crassusPrimolius Primolius maracanaHoubaropsis Houbaropsis bengalensis
Primolius couloniPrimolius auricollis
Stizorhina Stizorhina finschiHoplopterus Hoplopterus spinosusStictocarbo Stictocarbo punctatusPlatyspiza Platyspiza crassirostrisCyclorrhynchus Cyclorrhynchus psittaculaLunda Lunda cirrhataAsarcornis Asarcornis scutulataSpeculanas Speculanas specularisPtyonoprogne Ptyonoprogne fuligula
Stizorhina fraseriLeistes Leistes militarisMullerornis Mullerornis agilisLissotis Lissotis melanogaster
Lissotis hartlaubiiNesoenas Nesoenas mayeriPhaeothlypis Phaeothlypis fulvicaudaParisoma Parisoma subcaeruleumSchistocichla Schistocichla leucostigma
Table 6.9: 43 genus names unique to NCBI, after accounting for extinct genera and misspellings.The species which they contain are also listed here.
145
6.5 Data Cleaning and Presentation
6.5 Data Cleaning and Presentation
Data cleaning is an important aspect of data integration. The quality of data within the data
sources reflects the quality of data in TCl-Db. While some data is cleaned on transformation,
the data analysis described above shows how such queries can be used for further integration i.e.,
explicating links that were previously not obvious, such as the link between Opisthocomiformes
and Cuculiformes, for example. This data cleaning adds value and validates the links that are
created within TCl-Db.
We chose not to correct the misspellings given in Table 6.8, since this would assume that
all ITIS spellings are correct. Instead, the two names are linked together in the same way
that synonyms are linked to valid names. This way, a search on one spelling will return the
alternative spelling. The classification differences between NCBI and ITIS reflect the different
schools of thought which present valid hypotheses that are not necessarily incorrect. Therefore,
removing the name Dromaiidae from the NCBI classification and moving its children to reflect
the other classifications would be inappropriate. However, linking the data together creates
transparency by potentially dispelling any confusion that could arise.
One issue that has not been addressed is how the data and queries that have been presented
here are performed on other data sets, updated, maintained and delivered to user communi-
ties. This analysis could be done in TC-Db using any generic name source. A set of names
from phylogenetic trees, for example, can be synonymised using simple SQL queries. The data
presented were derived using SQL queries, highlighted by the few examples included in Ap-
pendix B.1. SQL is relatively easy to learn, however, we acknowledge that it is difficult to
master and efficient queries require an intimate understanding of the database schema. Build-
ing simple efficient queries is easy for developers, but considerable development effort would be
required to make this kind of analysis simpler and accessible to others. The examples given
here present the ability of TCl-Db, given its structure and data content, to perform large
scale data quality analyses. The TCl-Db database is available for direct SQL access via iSQL
at http://spira.zoology.gla.ac.uk:5561/isqlplus/. The Aves example presented here
shows that these analyses are possible within a data warehouse like TCl-Db, while these queries
could not be performed using the interfaces provided by the individual data sources or through
systems like uBio and Sp2000.
A simple search interface has been provided to allow users to search through the data pre-
sented in TCl-Db at http://spira.zoology.gla.ac.uk/search_tcl.php, which is described
146
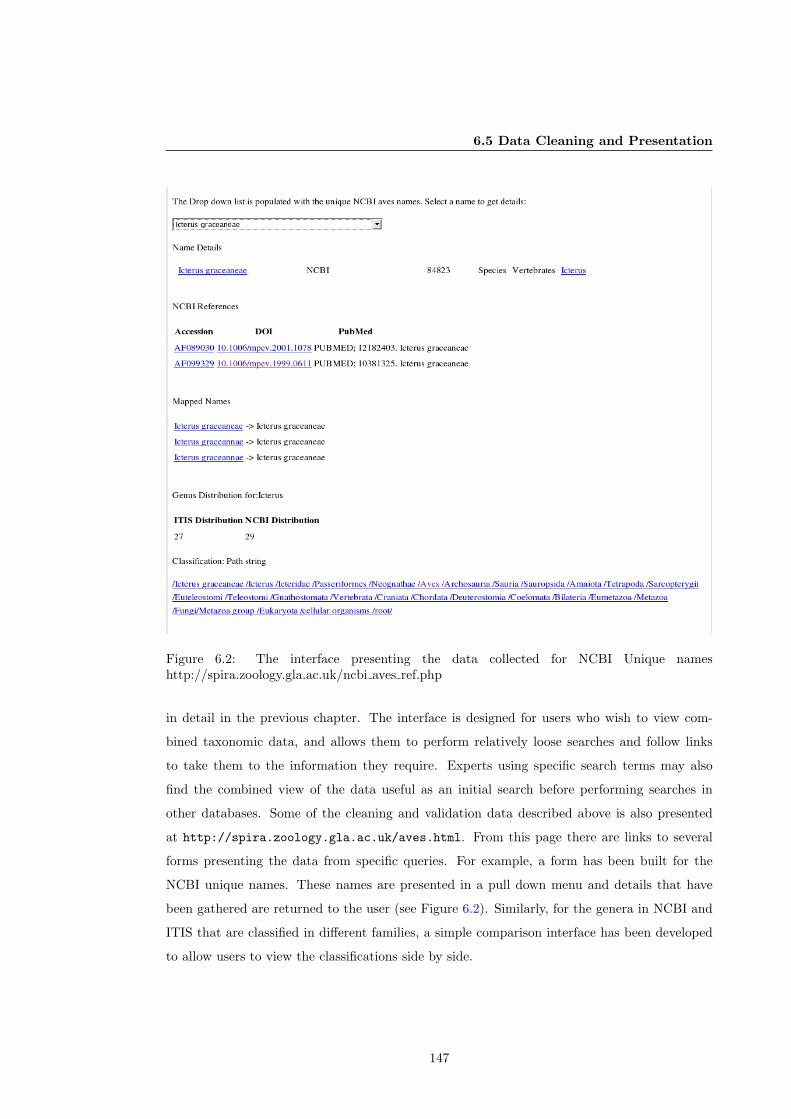
6.5 Data Cleaning and Presentation
Figure 6.2: The interface presenting the data collected for NCBI Unique nameshttp://spira.zoology.gla.ac.uk/ncbi aves ref.php
in detail in the previous chapter. The interface is designed for users who wish to view com-
bined taxonomic data, and allows them to perform relatively loose searches and follow links
to take them to the information they require. Experts using specific search terms may also
find the combined view of the data useful as an initial search before performing searches in
other databases. Some of the cleaning and validation data described above is also presented
at http://spira.zoology.gla.ac.uk/aves.html. From this page there are links to several
forms presenting the data from specific queries. For example, a form has been built for the
NCBI unique names. These names are presented in a pull down menu and details that have
been gathered are returned to the user (see Figure 6.2). Similarly, for the genera in NCBI and
ITIS that are classified in different families, a simple comparison interface has been developed
to allow users to view the classifications side by side.
147
6.6 Conclusions
6.6 Conclusions
We now understand more clearly the main differences between NCBI and ITIS data and we
are better equipped to find these differences. With this knowledge, we can use the data better.
For example, knowing that only approximately 18% of known Aves species are represented in
GenBank we can better judge species assignments that are based on sequence searches (Hebert
et al., 2004). Understanding the distributional biases within databases has applications for
users in ecology and conservation, where the use of names from only one database may be
inappropriate.
TCl-Db contains integrated, reconciled taxonomic data from multiple data sources. At a
basic level, a combined, global view of taxonomic data is presented to users. A combined view
of data in a single database enables data validation in terms of corroborating the spelling,
status or classification of any given taxonomic name. This is one of the main advantages of the
data warehouse approach. The queries performed and described here for the class Aves have
identified data that do not reconcile and inconsistencies that can cause confusion. The value
added data from these queries enhances further the data content in TCl-Db, creating links
across spelling differences and highlighting synonym and classification differences, and thus
improving clarity of the data delivered in TCl-Db. Such data analyses are only possible when
all data sources are available in a single structure and the data can be compared side by side.
This chapter highlights an analysis that is an important initial step in our understanding of data
quality and distribution. The following chapter goes on to show the importance of taxonomic
data quality and coverage in a phylogenetic database and the effect on data retrieval.
148
Chapter 7
Using TCl-Db to Improve the
Querying of TreeBASE
7.1 Summary
At the outset of TreeBASE (Morell, 1996) design a decision was taken to shelve the issue of
taxonomy and as a result, it is fair to say that TreeBASE under performs taxonomically. The
database is not taxonomically intelligent and queries do not translate to return all relevant hits.
A biologist expects a query on a higher taxa name to translate hierarchically, i.e. return all
data contained within the original search term. Likewise, a vernacular query should translate
to the accepted name and both queries should be performed automatically for the user. Here,
we analyse the queries performed on TreeBASE thus far. We show that vernacular and hierar-
chical queries are common searches performed by users. The poor performance of these queries
displays the importance of biological taxonomy for information retrieval. We use the TCl-Db
database to exemplify how the inclusion of taxonomy overcomes the poor data retrieval users
are currently experiencing.
7.2 Introduction
In previous chapters we have shown that some classifications do not support some commonly
used ranks and that data coverage varies across the taxonomic data sources. While it would be
unfitting to apply one classification to TreeBASE, without a classification, TreeBASE does not
149
7.3 Background
effectively support higher taxon queries. However, with a taxonomy, it is possible to perform
a search using terms linked by association and content. There are many taxonomic databases,
electronically available, that can easily be included into a phylogenetic data store. The reasons
for TreeBASE not including a taxonomy are now outdated and a simple solution is presented
in the form of TCl-Db.
7.3 Background
Currently, systematists prefer to gather the data they require for their analysis through lit-
erature searches. In most cases, once data are retrieved, the search results are examined by
eye to determine if they contain the phylogenetic data of interest. Unlike the major sequence
databases, phylogenetic tree data does not have to be deposited in a database before it can be
published. Currently, the deposition of data in TreeBASE has been voluntary. Also, TreeBASE
is not used because data are difficult to retrieve using search terms that are intuitive to users.
Although TreeBASE provides a Taxon name search, the returned data are often incomplete.
The example given in Section 1.5 for the query term “Aves”, shows that data can only be
retrieved by exact or partial text matching on taxon names.
Our hypothesis that an integrated taxonomic data source could alleviate the problems of
using taxonomic names to retrieve data from TreeBASE is tested through a comparison of the
data retrieval of a set of taxon queries performed on a local copy of TreeBASE, and the same
queries performed through TCl-Db tables linked to TreeBASE.
Examination of the taxon query logs shows that the taxonomic capacity of TreeBASE is
ineffective. The types of queries performed using TreeBASE and the results returned are anal-
ysed. In the first section of this chapter we examine the taxon queries that have been performed
on the TreeBASE user interface and inspect the retrieval capacity of these queries. These data
are then compared to the results found by searches mediated by TCl-Db. Queries performed
through TCl-Db show marked improvement in data retrieval. Finally, we show some interesting
insights within the recently released AOL search data. We see the taxonomic searches in this
data set echoing the trend towards higher taxa and vernacular queries, as seen within the Tree-
BASE data, thus reiterating the use of taxonomy and ontologies as key information retrieval
tools.
150
7.4 Taxonomic Infrastructure requirements
7.4 Taxonomic Infrastructure requirements
The taxonomic queries that TreeBASE should support are as follows.
• Search terms should expand to include subordinate terms in the classification if they are
higher taxa.
• Vernacular queries should be supported and expand appropriately to include the data
linked to the scientific names.
• Any given query should also expand to include data associated with synonyms and out
of date usage of a taxon name.
These queries are supported in TCl-Db and demonstrated below.
7.5 TreeBASE Taxon Search Log
The TreeBASE web interface can be found at the URL www.treebase.org. The interface allows
users to conduct taxon queries, queries by a specific matrix identifier, study, or tree identi-
fier. These queries return the number of phylogenetic studies that contain the term that was
used in the search. The database structure of TreeBASE was replicated locally so that SQL
queries could be performed on specific tables within TreeBASE and TCl-Db tables linked to
TreeBASE. The taxon queries on TreeBASE came from a script given to us by the TreeBASE
developers. The script returned all queries performed using the taxon field in the TreeBASE
user interface. This query log contains the queries and the number of times these queries had
been performed. The query log was loaded into a database table and given unique identifiers.
The data were initially trimmed to remove trailing spaces. Duplicates were then removed and
non taxon searches, such as queries based on TreeBASE identifiers, were also removed. Searches
for study authors were removed by comparing the queries to the author names stored in Tree-
BASE. Genbank Accession number queries were also removed from the data set. The remaining
62,126 queries were then mapped to TCl-Db giving, 27,239 queries in the query log with exact
matches to a taxon name in TCl-Db. These are stored in the materialized view given in query
C1 in Appendix C. The queries were compared to the taxon names in TCl-Db for a second
time, allowing, this time, for case insensitive matches and single letter mismatches. Including
mismatches, a total of 29,035 queries were mapped to a taxon name in TCl-Db. Using these
151
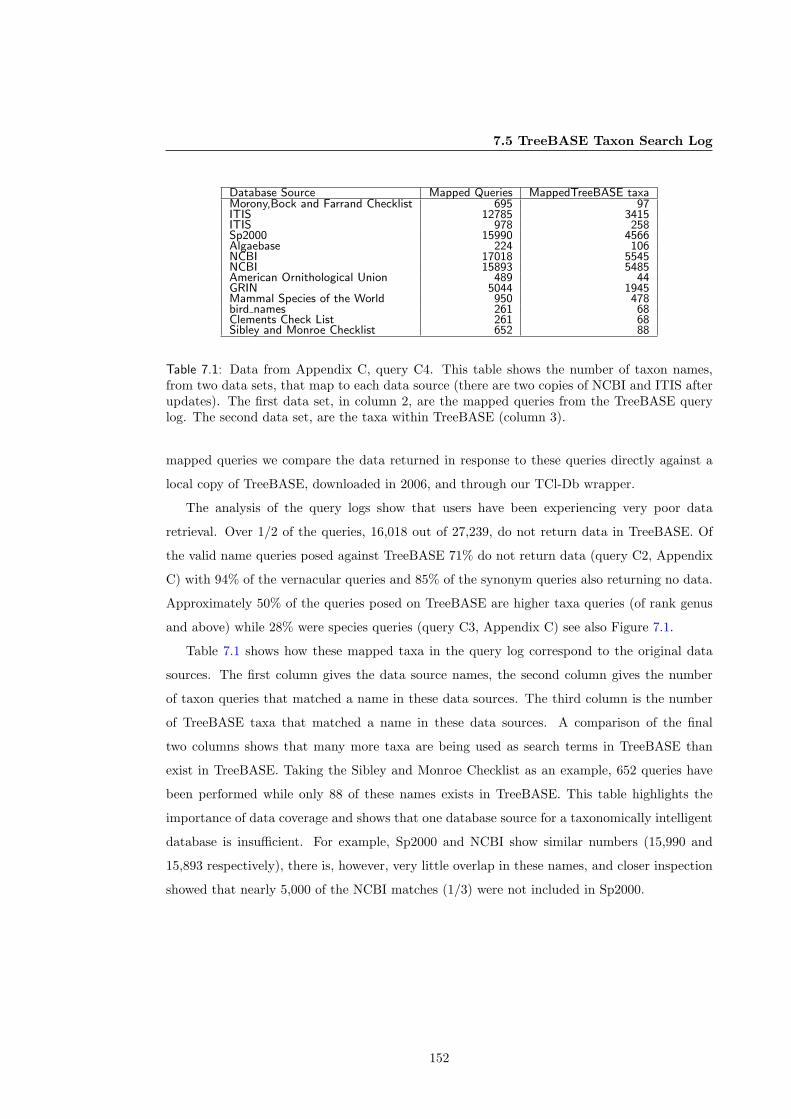
7.5 TreeBASE Taxon Search Log
Database Source Mapped Queries MappedTreeBASE taxaMorony,Bock and Farrand Checklist 695 97ITIS 12785 3415ITIS 978 258Sp2000 15990 4566Algaebase 224 106NCBI 17018 5545NCBI 15893 5485American Ornithological Union 489 44GRIN 5044 1945Mammal Species of the World 950 478bird names 261 68Clements Check List 261 68Sibley and Monroe Checklist 652 88
Table 7.1: Data from Appendix C, query C4. This table shows the number of taxon names,from two data sets, that map to each data source (there are two copies of NCBI and ITIS afterupdates). The first data set, in column 2, are the mapped queries from the TreeBASE querylog. The second data set, are the taxa within TreeBASE (column 3).
mapped queries we compare the data returned in response to these queries directly against a
local copy of TreeBASE, downloaded in 2006, and through our TCl-Db wrapper.
The analysis of the query logs show that users have been experiencing very poor data
retrieval. Over 1/2 of the queries, 16,018 out of 27,239, do not return data in TreeBASE. Of
the valid name queries posed against TreeBASE 71% do not return data (query C2, Appendix
C) with 94% of the vernacular queries and 85% of the synonym queries also returning no data.
Approximately 50% of the queries posed on TreeBASE are higher taxa queries (of rank genus
and above) while 28% were species queries (query C3, Appendix C) see also Figure 7.1.
Table 7.1 shows how these mapped taxa in the query log correspond to the original data
sources. The first column gives the data source names, the second column gives the number
of taxon queries that matched a name in these data sources. The third column is the number
of TreeBASE taxa that matched a name in these data sources. A comparison of the final
two columns shows that many more taxa are being used as search terms in TreeBASE than
exist in TreeBASE. Taking the Sibley and Monroe Checklist as an example, 652 queries have
been performed while only 88 of these names exists in TreeBASE. This table highlights the
importance of data coverage and shows that one database source for a taxonomically intelligent
database is insufficient. For example, Sp2000 and NCBI show similar numbers (15,990 and
15,893 respectively), there is, however, very little overlap in these names, and closer inspection
showed that nearly 5,000 of the NCBI matches (1/3) were not included in Sp2000.
152
7.5 TreeBASE Taxon Search Log
7.5.1 Data Retrieval in TreeBASE Vs TCl-Db
We used the taxon queries in the TreeBASE search log to determine if the current taxonomic
capabilities of TreeBASE could be improved with the addition of TCl-Db. Since only half of the
mapped queries returned a tree in TreeBASE, we were convinced that this could be improved
using TCl-Db. A comparison of the query capacity of these queries against TreeBASE and
against TCl-Db linked to TreeBASE is given below.
The comparison is based on the number of trees returned by the queries. In the web interface
of TreeBASE, studyids are returned. The data given here are tree counts and not study counts,
and therefore are not directly reproducible on the TreeBASE web site. We found that in the
version of TreeBASE we had, studyids could not be used as a stable measure of retrieval. In
order to determine the number of studies returned for each taxon query, four tables need to be
joined. The joins proved to be unstable since the data lacked referential integrity. However,
the table treetaxa with the key TreeID linked directly to the taxa table which provides
stable queries and an efficient and reliable measure of data retrieval. A few queries to return
studies were performed to confirm and double check the results. Where available these have
been shown in the data below.
The data retrieval capacity of TreeBASE for each taxon query was calculated using the
query C1 in Appendix C.1. The total number of trees returned by the taxon query data
set from directly searching the TreeBASE taxa table was 2,962 distinct trees (1,775 distinct
matrices). The distribution of TreeBASE taxa and the TreeBASE queries by taxonomic rank
is summarised in Figure 7.1 . The total higher taxa queries were calculated from subgenus and
above and the species count includes subspecies and lower rank queries. The pie charts show
that the majority of TreeBASE names are Species while the majority of queries performed on
TreeBASE are higher taxa names. Table 7.2 shows more detail by rank, of the TreeBASE taxon
query log. The percentage of queries of Species and lower ranks is 30%, for higher taxa 50%,
and 38% for NULL rank values (rank data was not available). The reason these numbers do not
add up to 100 is due to duplicated taxon names across ranks and differences in ranking between
data sources. Some examples of this are shown in the last column of Table 7.2 where taxa are
included in more than one rank, due to differences in classification across the data sources as
highlighted in bold. With the exception of a few examples in Genus and Subgenus, this was
more prevalent in the ranks above Family. There are instances where some data sources did
not give rank data for particular names but the rank was available from other data sources,
e.g. Myxomycota, Oomycota. In the ranks Class and Subclass there are examples of different
153
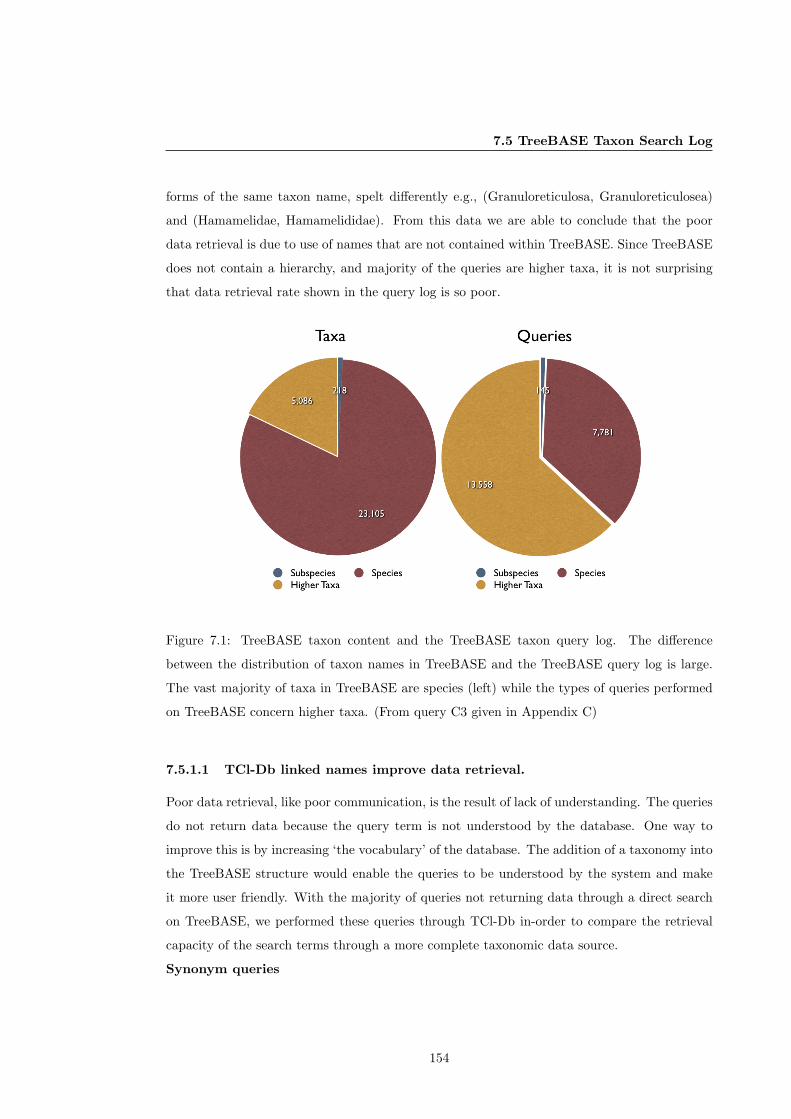
7.5 TreeBASE Taxon Search Log
forms of the same taxon name, spelt differently e.g., (Granuloreticulosa, Granuloreticulosea)
and (Hamamelidae, Hamamelididae). From this data we are able to conclude that the poor
data retrieval is due to use of names that are not contained within TreeBASE. Since TreeBASE
does not contain a hierarchy, and majority of the queries are higher taxa, it is not surprising
that data retrieval rate shown in the query log is so poor.
Figure 7.1: TreeBASE taxon content and the TreeBASE taxon query log. The difference
between the distribution of taxon names in TreeBASE and the TreeBASE query log is large.
The vast majority of taxa in TreeBASE are species (left) while the types of queries performed
on TreeBASE concern higher taxa. (From query C3 given in Appendix C)
7.5.1.1 TCl-Db linked names improve data retrieval.
Poor data retrieval, like poor communication, is the result of lack of understanding. The queries
do not return data because the query term is not understood by the database. One way to
improve this is by increasing ‘the vocabulary’ of the database. The addition of a taxonomy into
the TreeBASE structure would enable the queries to be understood by the system and make
it more user friendly. With the majority of queries not returning data through a direct search
on TreeBASE, we performed these queries through TCl-Db in-order to compare the retrieval
capacity of the search terms through a more complete taxonomic data source.
Synonym queries
154
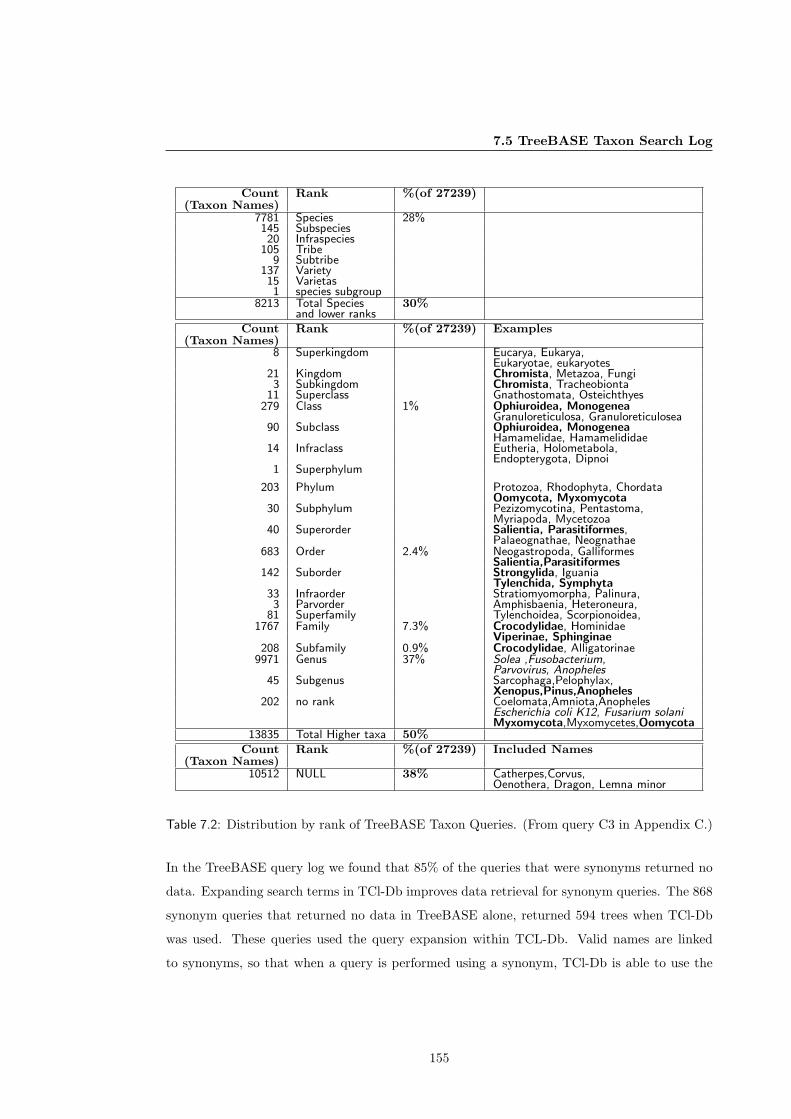
7.5 TreeBASE Taxon Search Log
Count Rank %(of 27239)(Taxon Names)
7781 Species 28%145 Subspecies20 Infraspecies
105 Tribe9 Subtribe
137 Variety15 Varietas1 species subgroup
8213 Total Species 30%and lower ranks
Count Rank %(of 27239) Examples(Taxon Names)
8 Superkingdom Eucarya, Eukarya,Eukaryotae, eukaryotes
21 Kingdom Chromista, Metazoa, Fungi3 Subkingdom Chromista, Tracheobionta
11 Superclass Gnathostomata, Osteichthyes279 Class 1% Ophiuroidea, Monogenea
Granuloreticulosa, Granuloreticulosea90 Subclass Ophiuroidea, Monogenea
Hamamelidae, Hamamelididae14 Infraclass Eutheria, Holometabola,
Endopterygota, Dipnoi1 Superphylum
203 Phylum Protozoa, Rhodophyta, ChordataOomycota, Myxomycota
30 Subphylum Pezizomycotina, Pentastoma,Myriapoda, Mycetozoa
40 Superorder Salientia, Parasitiformes,Palaeognathae, Neognathae
683 Order 2.4% Neogastropoda, GalliformesSalientia,Parasitiformes
142 Suborder Strongylida, IguaniaTylenchida, Symphyta
33 Infraorder Stratiomyomorpha, Palinura,3 Parvorder Amphisbaenia, Heteroneura,
81 Superfamily Tylenchoidea, Scorpionoidea,1767 Family 7.3% Crocodylidae, Hominidae
Viperinae, Sphinginae208 Subfamily 0.9% Crocodylidae, Alligatorinae
9971 Genus 37% Solea ,Fusobacterium,Parvovirus, Anopheles
45 Subgenus Sarcophaga,Pelophylax,Xenopus,Pinus,Anopheles
202 no rank Coelomata,Amniota,AnophelesEscherichia coli K12, Fusarium solaniMyxomycota,Myxomycetes,Oomycota
13835 Total Higher taxa 50%
Count Rank %(of 27239) Included Names(Taxon Names)
10512 NULL 38% Catherpes,Corvus,Oenothera, Dragon, Lemna minor
Table 7.2: Distribution by rank of TreeBASE Taxon Queries. (From query C3 in Appendix C.)
In the TreeBASE query log we found that 85% of the queries that were synonyms returned no
data. Expanding search terms in TCl-Db improves data retrieval for synonym queries. The 868
synonym queries that returned no data in TreeBASE alone, returned 594 trees when TCl-Db
was used. These queries used the query expansion within TCL-Db. Valid names are linked
to synonyms, so that when a query is performed using a synonym, TCl-Db is able to use the
155
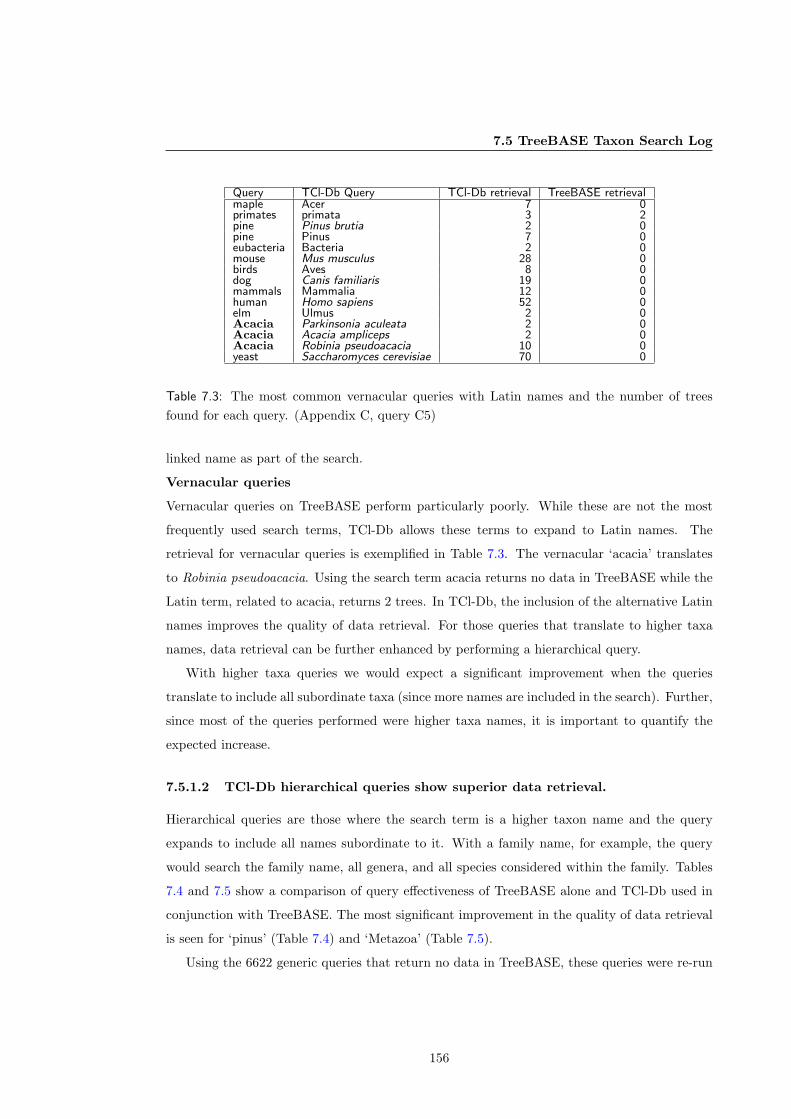
7.5 TreeBASE Taxon Search Log
Query TCl-Db Query TCl-Db retrieval TreeBASE retrievalmaple Acer 7 0primates primata 3 2pine Pinus brutia 2 0pine Pinus 7 0eubacteria Bacteria 2 0mouse Mus musculus 28 0birds Aves 8 0dog Canis familiaris 19 0mammals Mammalia 12 0human Homo sapiens 52 0elm Ulmus 2 0Acacia Parkinsonia aculeata 2 0Acacia Acacia ampliceps 2 0Acacia Robinia pseudoacacia 10 0yeast Saccharomyces cerevisiae 70 0
Table 7.3: The most common vernacular queries with Latin names and the number of treesfound for each query. (Appendix C, query C5)
linked name as part of the search.
Vernacular queries
Vernacular queries on TreeBASE perform particularly poorly. While these are not the most
frequently used search terms, TCl-Db allows these terms to expand to Latin names. The
retrieval for vernacular queries is exemplified in Table 7.3. The vernacular ‘acacia’ translates
to Robinia pseudoacacia. Using the search term acacia returns no data in TreeBASE while the
Latin term, related to acacia, returns 2 trees. In TCl-Db, the inclusion of the alternative Latin
names improves the quality of data retrieval. For those queries that translate to higher taxa
names, data retrieval can be further enhanced by performing a hierarchical query.
With higher taxa queries we would expect a significant improvement when the queries
translate to include all subordinate taxa (since more names are included in the search). Further,
since most of the queries performed were higher taxa names, it is important to quantify the
expected increase.
7.5.1.2 TCl-Db hierarchical queries show superior data retrieval.
Hierarchical queries are those where the search term is a higher taxon name and the query
expands to include all names subordinate to it. With a family name, for example, the query
would search the family name, all genera, and all species considered within the family. Tables
7.4 and 7.5 show a comparison of query effectiveness of TreeBASE alone and TCl-Db used in
conjunction with TreeBASE. The most significant improvement in the quality of data retrieval
is seen for ‘pinus’ (Table 7.4) and ‘Metazoa’ (Table 7.5).
Using the 6622 generic queries that return no data in TreeBASE, these queries were re-run
156
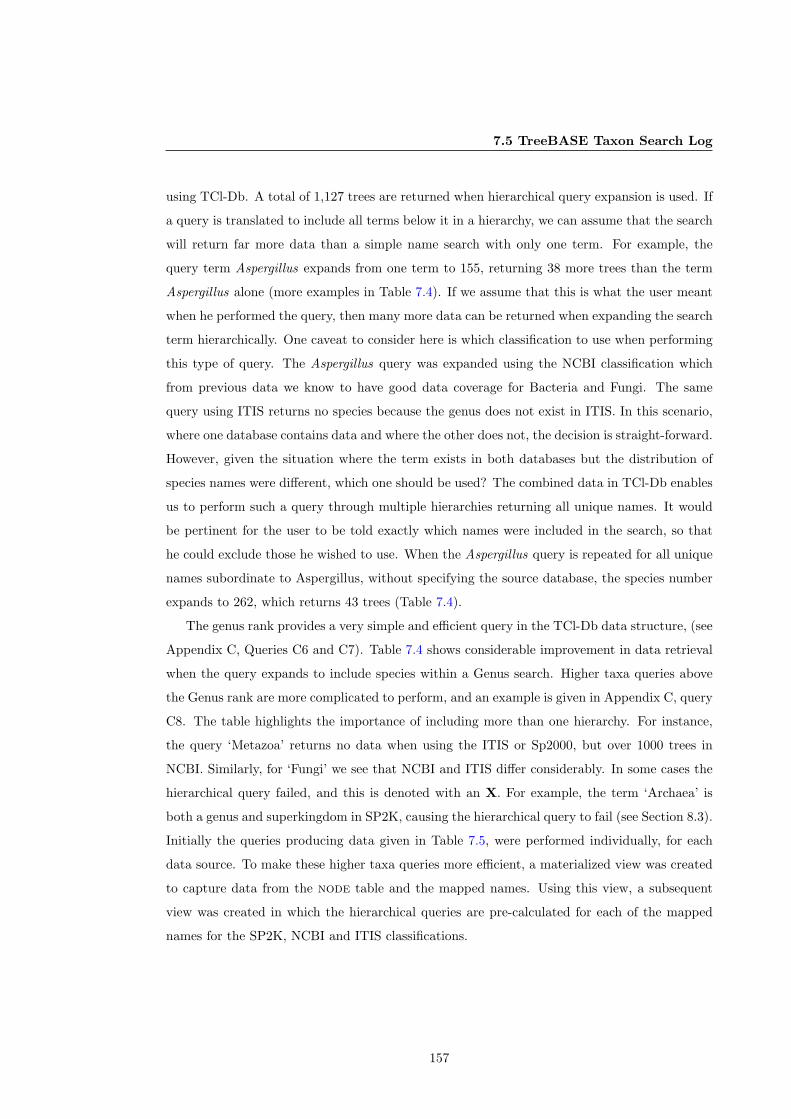
7.5 TreeBASE Taxon Search Log
using TCl-Db. A total of 1,127 trees are returned when hierarchical query expansion is used. If
a query is translated to include all terms below it in a hierarchy, we can assume that the search
will return far more data than a simple name search with only one term. For example, the
query term Aspergillus expands from one term to 155, returning 38 more trees than the term
Aspergillus alone (more examples in Table 7.4). If we assume that this is what the user meant
when he performed the query, then many more data can be returned when expanding the search
term hierarchically. One caveat to consider here is which classification to use when performing
this type of query. The Aspergillus query was expanded using the NCBI classification which
from previous data we know to have good data coverage for Bacteria and Fungi. The same
query using ITIS returns no species because the genus does not exist in ITIS. In this scenario,
where one database contains data and where the other does not, the decision is straight-forward.
However, given the situation where the term exists in both databases but the distribution of
species names were different, which one should be used? The combined data in TCl-Db enables
us to perform such a query through multiple hierarchies returning all unique names. It would
be pertinent for the user to be told exactly which names were included in the search, so that
he could exclude those he wished to use. When the Aspergillus query is repeated for all unique
names subordinate to Aspergillus, without specifying the source database, the species number
expands to 262, which returns 43 trees (Table 7.4).
The genus rank provides a very simple and efficient query in the TCl-Db data structure, (see
Appendix C, Queries C6 and C7). Table 7.4 shows considerable improvement in data retrieval
when the query expands to include species within a Genus search. Higher taxa queries above
the Genus rank are more complicated to perform, and an example is given in Appendix C, query
C8. The table highlights the importance of including more than one hierarchy. For instance,
the query ‘Metazoa’ returns no data when using the ITIS or Sp2000, but over 1000 trees in
NCBI. Similarly, for ‘Fungi’ we see that NCBI and ITIS differ considerably. In some cases the
hierarchical query failed, and this is denoted with an X. For example, the term ‘Archaea’ is
both a genus and superkingdom in SP2K, causing the hierarchical query to fail (see Section 8.3).
Initially the queries producing data given in Table 7.5, were performed individually, for each
data source. To make these higher taxa queries more efficient, a materialized view was created
to capture data from the node table and the mapped names. Using this view, a subsequent
view was created in which the hierarchical queries are pre-calculated for each of the mapped
names for the SP2K, NCBI and ITIS classifications.
157
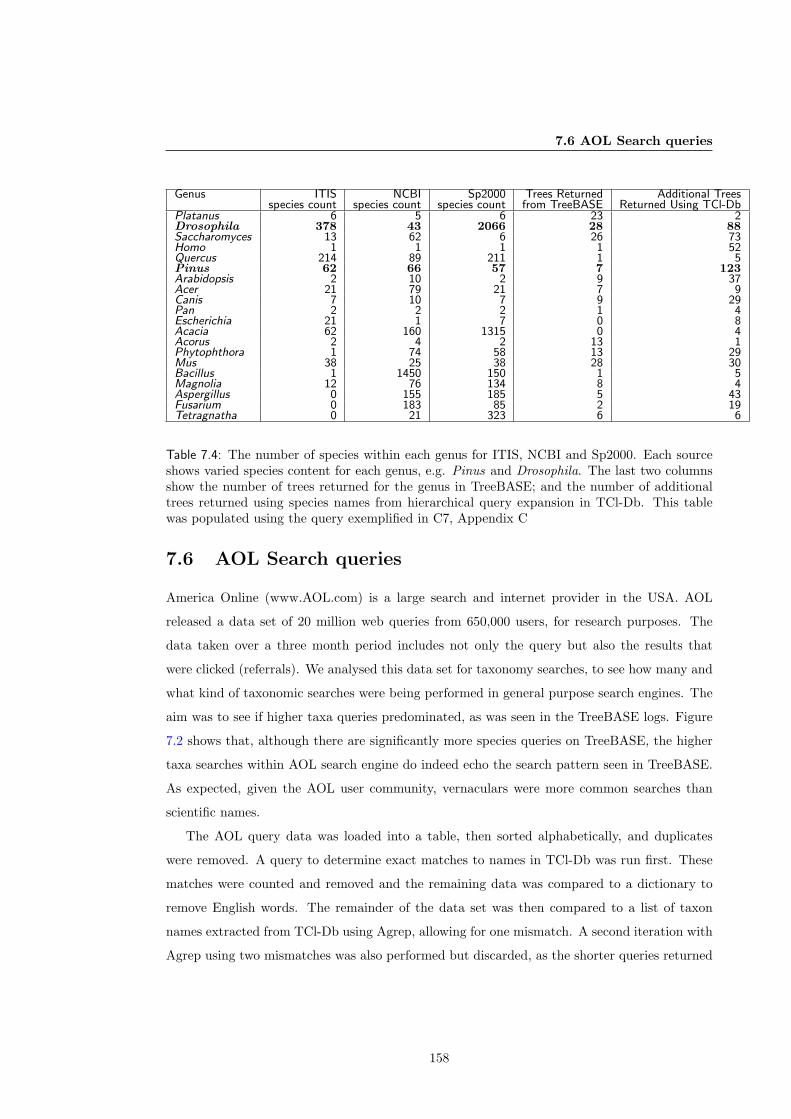
7.6 AOL Search queries
Genus ITIS NCBI Sp2000 Trees Returned Additional Treesspecies count species count species count from TreeBASE Returned Using TCl-Db
Platanus 6 5 6 23 2Drosophila 378 43 2066 28 88Saccharomyces 13 62 6 26 73Homo 1 1 1 1 52Quercus 214 89 211 1 5Pinus 62 66 57 7 123Arabidopsis 2 10 2 9 37Acer 21 79 21 7 9Canis 7 10 7 9 29Pan 2 2 2 1 4Escherichia 21 1 7 0 8Acacia 62 160 1315 0 4Acorus 2 4 2 13 1Phytophthora 1 74 58 13 29Mus 38 25 38 28 30Bacillus 1 1450 150 1 5Magnolia 12 76 134 8 4Aspergillus 0 155 185 5 43Fusarium 0 183 85 2 19Tetragnatha 0 21 323 6 6
Table 7.4: The number of species within each genus for ITIS, NCBI and Sp2000. Each sourceshows varied species content for each genus, e.g. Pinus and Drosophila. The last two columnsshow the number of trees returned for the genus in TreeBASE; and the number of additionaltrees returned using species names from hierarchical query expansion in TCl-Db. This tablewas populated using the query exemplified in C7, Appendix C
7.6 AOL Search queries
America Online (www.AOL.com) is a large search and internet provider in the USA. AOL
released a data set of 20 million web queries from 650,000 users, for research purposes. The
data taken over a three month period includes not only the query but also the results that
were clicked (referrals). We analysed this data set for taxonomy searches, to see how many and
what kind of taxonomic searches were being performed in general purpose search engines. The
aim was to see if higher taxa queries predominated, as was seen in the TreeBASE logs. Figure
7.2 shows that, although there are significantly more species queries on TreeBASE, the higher
taxa searches within AOL search engine do indeed echo the search pattern seen in TreeBASE.
As expected, given the AOL user community, vernaculars were more common searches than
scientific names.
The AOL query data was loaded into a table, then sorted alphabetically, and duplicates
were removed. A query to determine exact matches to names in TCl-Db was run first. These
matches were counted and removed and the remaining data was compared to a dictionary to
remove English words. The remainder of the data set was then compared to a list of taxon
names extracted from TCl-Db using Agrep, allowing for one mismatch. A second iteration with
Agrep using two mismatches was also performed but discarded, as the shorter queries returned
158
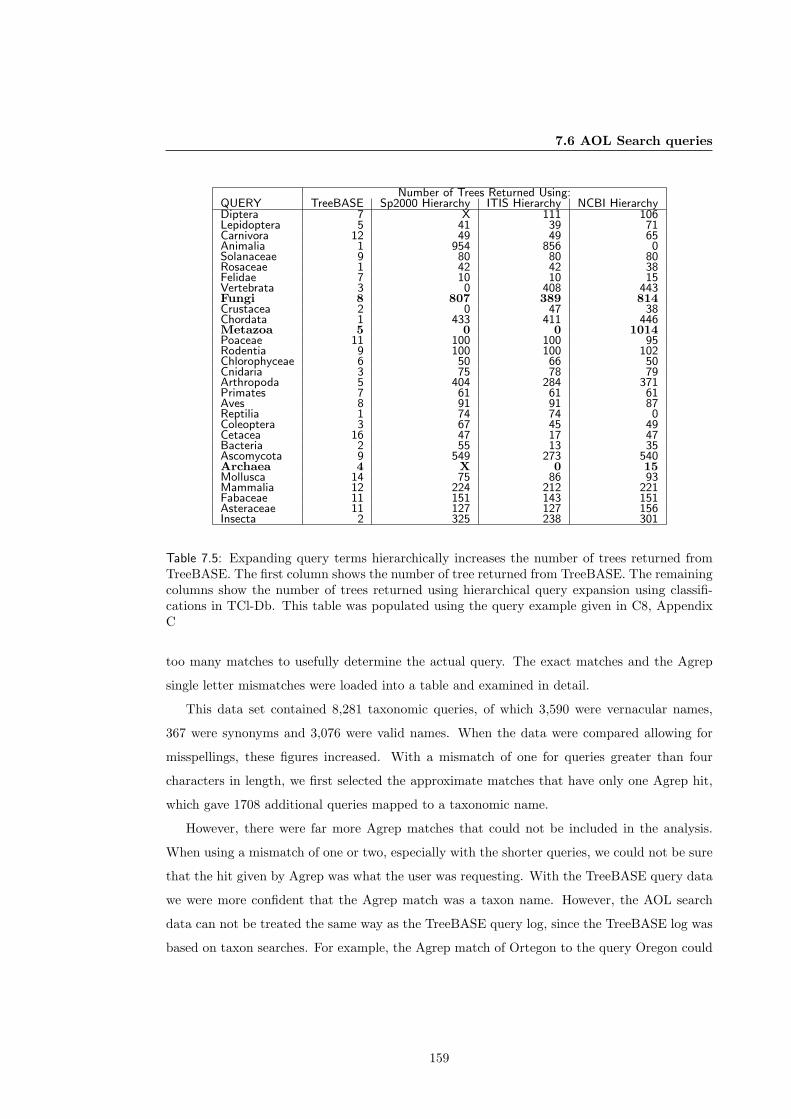
7.6 AOL Search queries
Number of Trees Returned Using:QUERY TreeBASE Sp2000 Hierarchy ITIS Hierarchy NCBI HierarchyDiptera 7 X 111 106Lepidoptera 5 41 39 71Carnivora 12 49 49 65Animalia 1 954 856 0Solanaceae 9 80 80 80Rosaceae 1 42 42 38Felidae 7 10 10 15Vertebrata 3 0 408 443Fungi 8 807 389 814Crustacea 2 0 47 38Chordata 1 433 411 446Metazoa 5 0 0 1014Poaceae 11 100 100 95Rodentia 9 100 100 102Chlorophyceae 6 50 66 50Cnidaria 3 75 78 79Arthropoda 5 404 284 371Primates 7 61 61 61Aves 8 91 91 87Reptilia 1 74 74 0Coleoptera 3 67 45 49Cetacea 16 47 17 47Bacteria 2 55 13 35Ascomycota 9 549 273 540Archaea 4 X 0 15Mollusca 14 75 86 93Mammalia 12 224 212 221Fabaceae 11 151 143 151Asteraceae 11 127 127 156Insecta 2 325 238 301
Table 7.5: Expanding query terms hierarchically increases the number of trees returned fromTreeBASE. The first column shows the number of tree returned from TreeBASE. The remainingcolumns show the number of trees returned using hierarchical query expansion using classifi-cations in TCl-Db. This table was populated using the query example given in C8, AppendixC
too many matches to usefully determine the actual query. The exact matches and the Agrep
single letter mismatches were loaded into a table and examined in detail.
This data set contained 8,281 taxonomic queries, of which 3,590 were vernacular names,
367 were synonyms and 3,076 were valid names. When the data were compared allowing for
misspellings, these figures increased. With a mismatch of one for queries greater than four
characters in length, we first selected the approximate matches that have only one Agrep hit,
which gave 1708 additional queries mapped to a taxonomic name.
However, there were far more Agrep matches that could not be included in the analysis.
When using a mismatch of one or two, especially with the shorter queries, we could not be sure
that the hit given by Agrep was what the user was requesting. With the TreeBASE query data
we were more confident that the Agrep match was a taxon name. However, the AOL search
data can not be treated the same way as the TreeBASE query log, since the TreeBASE log was
based on taxon searches. For example, the Agrep match of Ortegon to the query Oregon could
159
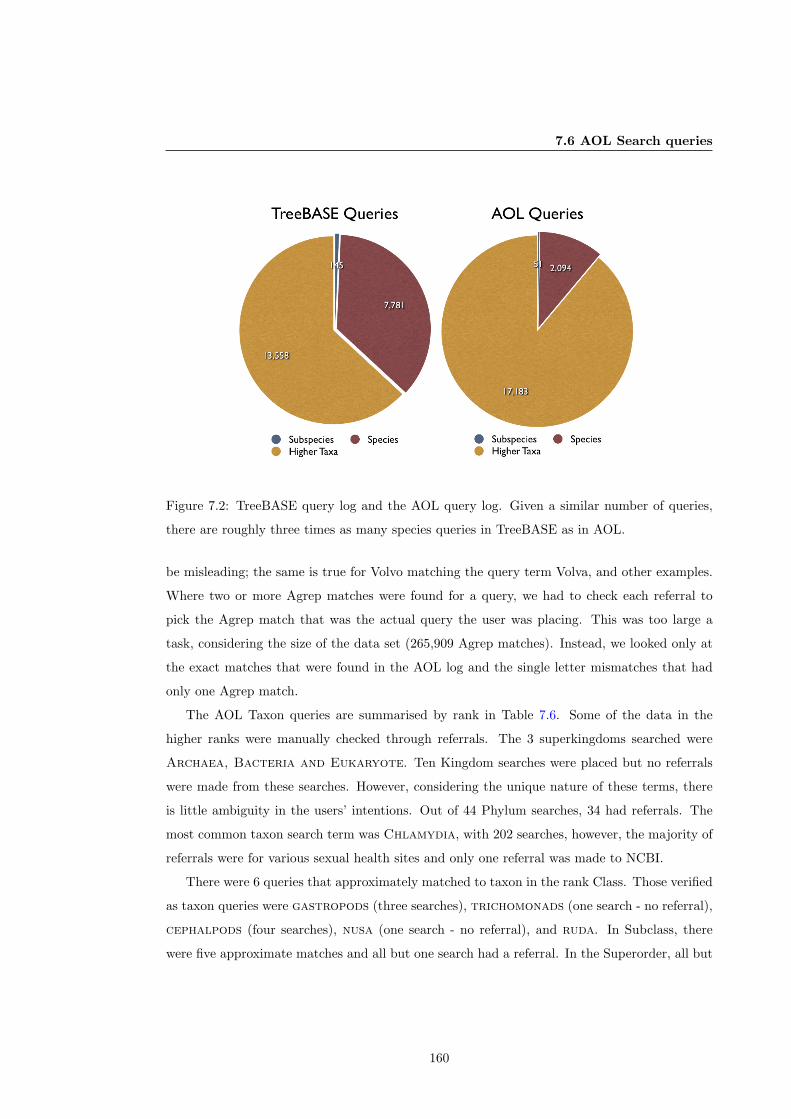
7.6 AOL Search queries
Figure 7.2: TreeBASE query log and the AOL query log. Given a similar number of queries,
there are roughly three times as many species queries in TreeBASE as in AOL.
be misleading; the same is true for Volvo matching the query term Volva, and other examples.
Where two or more Agrep matches were found for a query, we had to check each referral to
pick the Agrep match that was the actual query the user was placing. This was too large a
task, considering the size of the data set (265,909 Agrep matches). Instead, we looked only at
the exact matches that were found in the AOL log and the single letter mismatches that had
only one Agrep match.
The AOL Taxon queries are summarised by rank in Table 7.6. Some of the data in the
higher ranks were manually checked through referrals. The 3 superkingdoms searched were
Archaea, Bacteria and Eukaryote. Ten Kingdom searches were placed but no referrals
were made from these searches. However, considering the unique nature of these terms, there
is little ambiguity in the users’ intentions. Out of 44 Phylum searches, 34 had referrals. The
most common taxon search term was Chlamydia, with 202 searches, however, the majority of
referrals were for various sexual health sites and only one referral was made to NCBI.
There were 6 queries that approximately matched to taxon in the rank Class. Those verified
as taxon queries were gastropods (three searches), trichomonads (one search - no referral),
cephalpods (four searches), nusa (one search - no referral), and ruda. In Subclass, there
were five approximate matches and all but one search had a referral. In the Superorder, all but
160
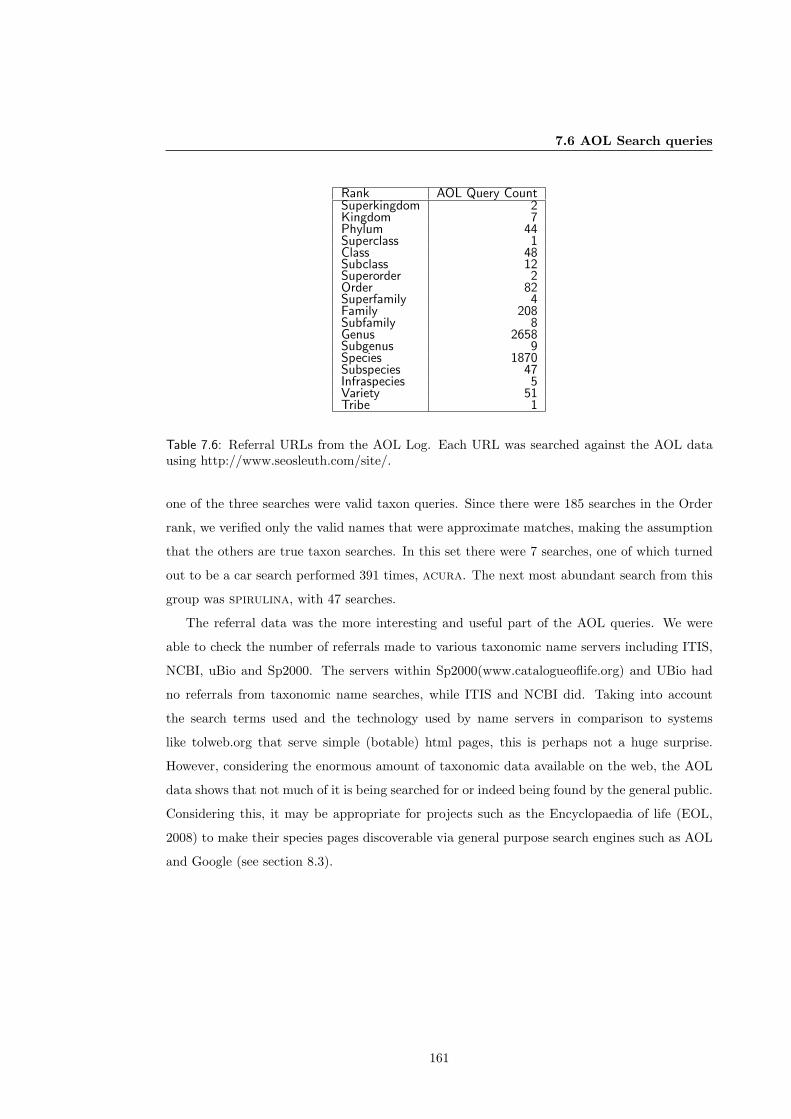
7.6 AOL Search queries
Rank AOL Query CountSuperkingdom 2Kingdom 7Phylum 44Superclass 1Class 48Subclass 12Superorder 2Order 82Superfamily 4Family 208Subfamily 8Genus 2658Subgenus 9Species 1870Subspecies 47Infraspecies 5Variety 51Tribe 1
Table 7.6: Referral URLs from the AOL Log. Each URL was searched against the AOL datausing http://www.seosleuth.com/site/.
one of the three searches were valid taxon queries. Since there were 185 searches in the Order
rank, we verified only the valid names that were approximate matches, making the assumption
that the others are true taxon searches. In this set there were 7 searches, one of which turned
out to be a car search performed 391 times, acura. The next most abundant search from this
group was spirulina, with 47 searches.
The referral data was the more interesting and useful part of the AOL queries. We were
able to check the number of referrals made to various taxonomic name servers including ITIS,
NCBI, uBio and Sp2000. The servers within Sp2000(www.catalogueoflife.org) and UBio had
no referrals from taxonomic name searches, while ITIS and NCBI did. Taking into account
the search terms used and the technology used by name servers in comparison to systems
like tolweb.org that serve simple (botable) html pages, this is perhaps not a huge surprise.
However, considering the enormous amount of taxonomic data available on the web, the AOL
data shows that not much of it is being searched for or indeed being found by the general public.
Considering this, it may be appropriate for projects such as the Encyclopaedia of life (EOL,
2008) to make their species pages discoverable via general purpose search engines such as AOL
and Google (see section 8.3).
161

7.7 Discussion
Referral URL Total No. of Searches Total Unique Keywords referredwww.itis.usda.gov 36 28www.ubio.org 0 0ubio.mbl.edu 0 0www.ncbi.nlm.nih.gov 16180 12674darwin.zoology.gla.ac.uk 9 8www.otlweb.org 4 4www.ipni.org 7 6www.indexfungorum.org 3 3www.mbl.edu 26 22www.catalogueoflife 0 0www.sp2000.org 2 2www.gbif.org 0 0
Table 7.7: Referral URLs from the AOL Log. Each URL was searched against the AOL datausing http://www.seosleuth.com/site/.
7.7 Discussion
We have shown that the inclusion of TCl-Db data makes a significant impact on information
retrieval by linking vernaculars and higher taxa queries to their related terms. As stated, one
explanation for the queries returning no data is the taxon content of TreeBASE, as there is
no data to retrieve for these names. For example, given that most TreeBASE taxa are valid
species names, it is not surprising that vernacular names return little data. Through TCl-Db,
however, the vernacular queries that did not return data were extended to include linked valid
names, resulting in the retrieval of 868 trees (426 matrices). Similarly, for the synonym queries
that were returning no data, queries routed through TCl-Db’s linked names returned 594 trees
(252 matrices). Also, for the valid names that returned no TreeBASE data we performed a
hierarchical query for 6,622 genera, returning 1,127 trees (671 matrices). Therefore, using TCl-
Db we can retrieve more data from TreeBASE using search terms that are not contained within
TreeBASE.
There were a significant number of queries that mapped to a name in TCl-Db but did not
return data in TreeBASE. 16,018 were valid taxon queries (queries mapped to a name TCl-Db)
and did not retrieve data in TreeBASE. This is because the vast majority of queries posed on
TreeBASE are higher taxa terms that are not contained in any trees within TreeBASE.
The analysis above shows that TreeBASE displays both poor data retrieval and poor infor-
mation retrieval. From 62,126 queries, 2,962 trees are returned, giving a 4.7% data retrieval
rate. From the complete query log, 27,239 queries were mapped to taxa in TCl-Db, returning
a total number of 2,748 trees with a higher retrieval rate of 10.8%. While the ratio of data
retrieval from the mapped names is better, the actual numbers of trees returned are similar.
162
7.7 Discussion
This is because both data sets are searched through the same data content, i.e. the taxa table
in TreeBASE. The poor data retrieval rate is therefore a property of the taxonomic content of
TreeBASE, specifically, the limited taxonomic content of TreeBASE and the fact that most of
the queries posed are not names contained in TreeBASE.
The taxonomic data content in the version of TreeBASE used was 56,712 taxa. As stated
above, 27,239 mapped to a name in the TCl-Db database and 31,459 were extensively mapped
by Page (2007), using a number of data sources including uBio. Over 25,000 taxa in TreeBASE
can not be mapped to an online taxonomic data source. These figures suggest that the Taxon
content of TreeBASE is of poor quality, and the mapping performed showed that not all the
data labelled as taxon names are in fact proper taxon names. Including TCl-Db taxa into
TreeBASE did show a substantial increase in data retrieval (from 4.7% to 10.8%). However,
part of the problem is also the taxon content of TreeBASE, and cleaning the taxa data in
TreeBASE would significantly improve the data retrieval further.
While the improvements described above could be achieved using any taxonomy database,
the multiple data sources and the storage of more than one hierarchy in TCl-Db is an important
factor in terms of data coverage as shown in Table 7.2. The number of queries that mapped to
a taxon in TCl-Db were 27,239. The distribution of these across the data sources in TCl-Db
is shown in column 2 of Table 7.1. Although there is a significant overlap in the taxa across
the data sources, NCBI and Sp2000 show the best coverage. Similarly, the taxon content of
TreeBASE mapped to the TCl-Db data sources shows NCBI and Sp2000 fairing almost equally.
However, the classification differences between Sp2000 and NCBI are significant, and picking
one over the other would impair some users. Table 7.4 also highlights the data distribution in
genera across ITIS, NCBI and Sp2000. The most commonly performed genus queries are given
in the first column and the number of children within each data source is given in columns 2,
3 and 4. The last two columns show the substantial improvement in data retrieval achieved by
using TCl-Db. Also, Table 7.5 shows the data retrieval of the most frequent higher taxon queries
across different hierarchies. ITIS and Sp2000 performed similarly in most cases. Aves and Fungi
are the most notable exceptions and highlights the effect of the differences in taxonomic content
of the different databases.
163
7.8 Conclusions
7.8 Conclusions
TreeBASE is an example of a data set that has not been equipped with complete metadata,
rendering the retrieval of data difficult and cumbersome. The data retrieval capacity afforded
by the inclusion of metadata such as ontologies and taxonomies is well established in this the-
sis. Given that taxonomic names are such an integral part of this data, it is inexcusable not
to force the inclusion of taxonomy, especially now, with the technology and databases cur-
rently available. The analysis here shows the importance of taxonomic data for more efficient
data retrieval in TreeBASE and the use of an amalgamated taxonomy data warehouse to ac-
commodate coverage and differing opinions in taxonomy. The TCl-Db warehouse provides an
infrastructure to support effective data retrieval from TreeBASE. An application has been built
to wrap taxon queries through TreeBASE was described in Chapter 5. The wrapper returns
the expected treeids and matrixids which are linked directly to the TreeBASE website for the
user to continue their download.
164
Chapter 8
Discussion and Conclusion
We have shown in the previous Chapter that TCl-Db improves data retrieval through Tree-
BASE, corroborating the hypothesis given in Chapter 1. In this Chapter, we revisit the original
requirements that were laid out and address the contribution that TCl-Db has made in context
of other work in this area. This Chapter concludes with a discussion of an alternative method
that, in future, could be used to address data integration more economically and finally, further
work and improvements that have been highlighted through the course of writing this thesis.
8.1 Overview
This research project aimed to address the taxonomic requirements of the systematics com-
munity and was motivated by the inadequate taxonomic data retrieval in TreeBASE. A data
warehouse solution to this problem, TCl-Db, the Taxonomy and Classification Database, ad-
dresses the taxonomic requirements of TreeBASE. The data structure is described in Chapter
3, and Chapter 4 gives an overview of the data that contribute to the warehouse and how these
were loaded into the integrated TCl-Db schema. Queries enabled by TCl-Db are described and
web tools that were built to use TCl-Db are presented in Chapter 5. TCl-Db provides breadth
of coverage by integrating multiple taxonomic data sources. As shown in Chapter 6, there are
significant differences in the data held by different data sources. Chapter 6 also highlighted the
classification differences that required TCl-Db to store and deliver hierarchical queries through
a choice of classifications. In Chapter 7 we demonstrated the improved data retrieval that
can be achieved by including a taxonomic infrastructure within TreeBASE. This Chapter high-
lighted the use of query expansion for higher taxa, synonyms and vernaculars that significantly
improved data retrieval. This current chapter discusses this work and an alternative technology
165
8.2 Contribution
that can be used in the future developments of TCl-Db.
8.2 Contribution
TCl-Db was designed for two specific types of consumers: those who require access to data
through taxon name queries in TreeBASE and those who gather data from multiple sources
where names need to be reconciled before analysis, for example in a supertree analysis. The first
requirement was delivered and demonstrated in Chapter 7 and the second was demonstrated
in Chapter 6. These requirements are now also being addressed by the wider community and
will eventually be superseded by TreeBASEII and Global Taxonomic Initiative and its partners.
For the time being, these requirements are met by TCl-Db.
The core of TCl-Db development consisted of data integration. Data integration addresses
several aspects of taxonomic data that cause difficulty in the user community. Integrated
taxonomic data increases accessibility of disparate data, as data redundancy is reduced by
combining data from several sources into a single structure, and combined data can be compared
to highlight differences and discrepancies. In Chapter 6 we showed how the data sources used in
TCl-Db can be compared side by side. In Section 5.3 we presented SQL queries which identify
homonyms, differences in name usage (synonyms and valid names) across the data sources and
classification differences between data sources (Section 5.3.1).
These analysis queries were extended in Chapter 6 and used to add data to TCl-Db. The
integrated data were used to make complete the information, through the addition of, for
example, rank information to data sources that did not hold these data. Additional linked
names were generated via the identification of spelling differences, and queries were formulated
that easily map names to different classifications (Table 6.7). In Chapter 6 we were also able
to corroborate links that were created through usage differences. For example, in Chapter 5 we
showed that Casuariidae and Dromaiidae were linked as synonyms. The comparison of NCBI
and ITIS alone could not corroborate this link, however, the addition of Aves check lists enable
this link to be validated. Queries to corroborate the links that are created in TCl-Db are easy
to specify, since the original data sources are linked in to the global TCl-Db schema.
The integrated data in TCl-Db are used as a taxonomic infrastructure for TreeBASE.
In Chapter 7 we demonstrated significantly improved data retrieval using taxonomic queries
through TCl-Db linked to TreeBASE. TCl-Db enables query expansion of higher taxa query
terms, synonym and vernacular query terms and provides breadth of taxonomic coverage.
166
8.3 Discussion
The user requirements laid out in Chapter 1 have been met and demonstrated through this
work. Several aspects were highlighted for improvement through the course of writing this
thesis, particularly, aspects of the data model and the user interface that can be improved. An
alternative method that is increasingly being used in the taxonomic and biodiversity community
are semantic web technologies. These technologies were briefly explored and an evaluation
exercise highlighted their potential use in the future developments of TCl-Db. This chapter
continues with a listing of further work proposed from these discussions.
8.3 Discussion
8.3.1 Related Work
The motivation for developing TCl-Db was to deliver a taxonomic infrastructure that could be
used with TreeBASE. The current version of TreeBASE is soon to be replaced by Cyberinfras-
tructure for Phylogenetic Research (CIPRES) TreeBASEII (CIPRES, 2006). A prototype was
due for release in July 2006 but is not yet available. The new improved TreeBASE schema
has been published (CIPRES, 2006) and contains a Taxon module which looks to rectify many
of the data retrieval issues currently experienced by users. At this stage, with only architec-
ture and structural documentation, it is difficult to see exactly how hierarchical and vernacular
queries will be supported in TreeBASEII.
The schema contains a taxon module describing the objects TaxonLabel, TaxonLabelSet,
Taxon, TaxonSet, TaxonLink and others. The documentation states that the Taxon object
holds a unique taxon name. Through the TaxonLink this will connect users to an external
taxon authority. The TaxonAuthority object makes reference to NCBI, uBio and SEEK, as
examples. TreeBASEII also plans to make use of LSIDs (Life Science IDentifiers (Miranker
et al., 2008)) as a mode of unique identification and information integration with other data
authorities. Creating these links will also require extensive data mappings of each TreeBASE
taxon to taxa names in each data authority, similar to the exercise performed in this research
for TreeBASE names in Chapter 6. Without actually testing the prototype it is difficult to tell
if this new improved data structure will support the queries users are performing on the current
version of TreeBASE. Until the TreeBASEII system comes online, TCl-Db offers a solution that
enables more effective data retrieval using taxon names, as demonstrated in Chapter 7.
Attaching a taxonomic infrastructure to TreeBASE can be achieved in a number of ways.
167
8.3 Discussion
A recent solution was provided by Phylofinder (Duhong et al., 2008). Phylofinder offers a
taxonomic backbone to TreeBASE via TBmap and the NCBI classification. The solution offered
by TCl-Db is superior to the simple approach used in Phylofinder. A comparison of TreeBASE
queries using Phylofinder and TCl-Db shows that while Phylofinder does indeed improve data
retrieval, it has some severe limitations resulting from using only one classification. Higher
taxa queries from the ITIS classification that are not used in NCBI, or that have not been
mapped in TBmap fail to return data. TCl-Db does not have this limitation, since TCl-Db
contains full classifications and TreeBASE mappings to ITIS and other resources. TBmap will
also expire with time, while the mappings to TreeBASE made via TCl-Db can be maintained
very efficiently with SQL queries that can be rerun after each new update
uBio has a very similar scope and remit to TCl-Db, however, it is only available through
web services, which means that their data can not be physically integrated into TreeBASE.
The performance of SOAP services provided by uBio could be severely limiting. Performance
of web service mediated data queries does not compare to queries performed through physical
integration, and this was one of the reasons that we choose a data warehouse approach.
Since this project used data integration in order to deliver data coverage, and data trans-
formation was required to deliver hierarchical queries, a data warehouse within the relational
data model was deemed to be the most appropriate method.
TreeBASE, and most of the other taxonomic databases, are built using relational database
technology. Technologies developed by the W3C for the semantic web have been highlighted as
an alternative solution for data integration. This alternative method was briefly explored (see
Appendix D), since it offers to deliver all the advantages offered by a data warehouse without
replicating data within a warehouse and the technologies offer a mediated solution that would
be far easier to maintain than traditional web mediated services.
8.3.2 Semantic Data Integration
From a database perspective, data integration assembles data from several data silos and maps
those into a shared schema. Integration is achieved by applying queries on this schema. On the
web, data are not integrated but are linked together using URLs. This is achieved through the
addition of a href tags around URLs within documents marked up in HTML or XHTML.
These tags enable a user to browse from the current data to relevant data, as linked by the
author. Using semantic web technologies (Berners-Lee & Hendler, 2001) resources on the web,
given correct metadata (Resnik, 1995), new resources can be discovered which would remove
168
8.3 Discussion
the need for human mediated links. With the addition of metadata, the resources become
semantically rich and have meaning to computers as well as the users browsing them (Amann
et al., 2000). Since computers have the capacity to use the metadata, data discovery on the
web can be made possible.
Data integration was highlighted as one of the core uses of semantic web technologies (Heflin
& Hendler, 2001). Making taxonomic data interoperable across the web (Williams, 1997) would
be of great benefit, considering the investments made so far and also the distributed nature
of the science. The potential use of the semantic web (Berners-Lee et al., 2001b) for data
integration is now well acknowledged and solutions are being implemented in several areas of
life sciences (Good & Wilkinson, 2006; Stevens et al., 2006) of which, the taxonomic community
has also taken note of these developments (Page, 2007).
The semantic web uses several layers of technology (W.3.C., 2006). When these are used
together, they add increasingly richer expressivity to data (via metadata). In the bottom
layer a global naming scheme, through URI’s is required. A URI, Uniform Resource Identifier,
is simply a web identifier and any data object in the semantic model must have a unique
URI. Currently GUIDs 1 and LSIDs 2 are being tested as solutions within the biodiversity
community (Page, 2008). Above this layer is XML and XML Schema. These languages have
been in use for many years already. XML adds surface syntax to data and XML schema is
used to describe the structure of data in an XML document. The taxonomic community has
invested in this area also through the adoption of a data exchange format in XML (Kennedy,
2005) and controlled vocabularies such as Darwin Core for geographic occurrence and specimen
information. Layered over XML and XML-S, is the core semantic web technology technology,
RDF, the Resource Description Framework (http://www.w3.org/RDF/).
RDF provides a standard syntax for describing data and is the layer at which data can be
brought together. RDF provides a consistent standardised way to describe and query resources
with syntactic interoperability. In essence, RDF is a data model that describes relationships be-
tween things, web resources, data elements, or objects. Data in RDF are represented as triples:
a subject (with a unique URI), a relation (the predicate) that describes the relationship to an
object or data value. In RDF, data are annotated with metadata in a machine readable way
though these relations (or properties). To enable interoperability a common shared vocabulary
is required and this is provided via RDF-Schema, an RDF vocabulary dictionary. RDF is also1Globally Unique Identifier2Life Science Identifier
169
8.3 Discussion
being adopted. IPNI offers their data in RDF and uBio offers a tool (http://www.ubio.org/rss/)
that can collect taxonomic names from data provided by the RSS 1 feeds from publishers of
scientific literature.
The Web Ontology language, OWL, adds even more expressiveness to the data. So far, not
much progress has been made in this area, but this is undoubtedly where future investment
will be focused, as current efforts progress and the base layers described above are in place.
The Biodiversity community are making significant strides towards delivering and using data
from these technologies. The Encyclopaedia of Life (Wilson, 2003) is one project following the
semantic web ethos (Saaed et al., 2008).
With Oracle providing support for RDF within the Oracle spatial product, we were able
to get a feel for this technology by using the integrated data in TCl-Db and a local copy of
TreeBASE (see Appendix D). Several observations were made while this technology was tested.
These are as follows.
• Conversion from relational data into RDF is fairly simple and several tools exist that
support this (Bizer, 2003). Serialising RDF using SQLX was trivial, and XSLT scripts
also took very little time and effort to write. The N3 notation (Berners-Lee, 1998) is
much more user friendly and easier to handle than the RDF/XML format (Beckett et al.,
2003).
• Queries were very intuitive, following SQL and SPARQL like syntax, but more complex
queries required an intimate understanding of the graph structure where a visualisation
of the graph would have been useful. Oracle provides the ability to query data in the
RDF network and relational tables together through SQL which was incredibly powerful.
• On the whole, the experiences gained were very useful and it is clear that this has the
potential to be a more cost effective integration technology.
• From this small exercise we conducted, performance and scalability are still limiting.
• Systems that have fully adopted the semantic web ethos are still few and far between and
it will be sometime before the advantages are fully realised.
• We do see the advantages offered by the semantic web and TCl-Db will in the future move
towards delivering data that can be used and discovered automatically. The web services1RDF Site Summary
170
8.3 Discussion
described in Chapter 5 go some way to provide this already and this will be extended and
progressed.
The experiences gained from testing these technologies allowed us to develop ideas for future
developments and additions to TCl-Db.
8.3.3 RSS Feeds and Data Update
One of the biggest challenges in a data warehouse system is maintenance and keeping data
up to date. Currently, data refresh is manual and laborious, though it could be automated
using database triggers. This was touched upon in section 4.7 and was attempted. However,
only NCBI’s data worked through this mechanism. The ITIS and Sp2000 updates had to be
performed manually. As more data sources move toward providing their data in RDF via RSS
feeds, the possibilities for maintenance and data update through these data feeds will enable
the data in the system to be more easily kept up to date.
RSS, RDF Site Summary, is already used to aggregate content form multiple web resources
(Hammond et al., 2004). Google news, for example, uses RSS feeds from various news sources
and aggregates the contents into a single page. As mentioned above, this technology is also
being used by uBio to gather new names that are published in the scientific literature (Leary
et al., 2007). In the same way that these applications gather data, TCl-Db can use RSS feeds to
collect data from databases that publish updates through RSS. Currently, few database provide
updates to their data sources in this manner, however, NCBI are moving in this direction (Sahoo
et al., 2007) and it will not be long before this becomes a more popular method of content
delivery.
To this end, the future development will primarily focus on maintaining TCl-Db data in
RDF. In the proposed architecture, the assertion data in TCl-Db would be stored as a single
RDF graph. New assertions can easily be added. This requires the data sources to set up an
RSS feed, and the data in the feeds can then be automatically sent to a software client that
converts the assertions into the TCl-Db RDF graph. This would be one mechanism that could
keep assertions up to date within the database. However, this would only work well for lower
taxa, where there is no impact on the source classification. Higher taxa names that are changed
or added from the sources would require a full update in order to build the nested set and
materialised path data. Additionally, by maintaining the assertion data in RDF, these data
can be syndicated to other aggregators or resources on the web.
171
8.3 Discussion
8.3.4 The Data Model
There are two aspects of the TCl-Db data model that could be improved in the future. Since
these did not affect the function of TCl-Db significantly, they were not implemented, how-
ever, these improvements could enable further uses of the TCl-Db data by databases other
than TreeBASE. These improvements concern the way the database stores synonyms and their
provenance and the implementation of hierarchical queries.
Synonyms are stored in the database through the use of the name status attribute in the
name table. The placement of name status in the assertion table would have been more
appropriate. The placement of name status in the name table may result in data loss during
transformation. Since different databases treat taxonomic names differently, there were many
situations where names considered valid in some databases and considered synonyms in others.
Therefore, by attaching name status as an attribute of name, we lose the different status
opinions from other databases databases and fail to preserve data provenance Buneman et al.
(2000).
As ITIS was the first data source loaded, the names from ITIS were the first to fill the
attributes in name. During subsequent data loads from NCBI and other data sources, the
status of the name, if it was already in the database came from ITIS , and if the status was
different from that recorded in ITIS this data would be lost. When this was observed, a simple
solution was put in place. Since we maintained each copy of the data sources in individual data
silos, we were able to gather this data by querying individual silos. These data are stored in
a materialised view, however, this is not a permanent fix and the model should be adjusted in
future work to enable name status from the different data sources to be maintained in the data
model. Since this had no effect on querying TreeBASE, it was not deemed important to change,
but this does limit other uses of TCl-Db and therefore will be addressed in future versions.
Homonyms caused problems with hierarchical queries using Oracle’s connect by utility.
There were several situations where a single name is placed in several ranks within the same
database. Examples mentioned in previous chapters are: Drosophila which in NCBI is in the
rank Genus and the rank subgenus and Archaea in Sp2000, which is both a kingdom and
a genus in the Animalia kingdom. While performing the data analysis queries described in
Chapter 5, it was discovered that the homonyms in hierarchical queries would fail. In the TCl-
Db data model, homonyms have the same name id but different parent name ids in the node
table, and having a name id in the tree twice creates a loop in the connect by query. One
resolution to this would be to use an assertion id and parent assertion id in place of name id
172
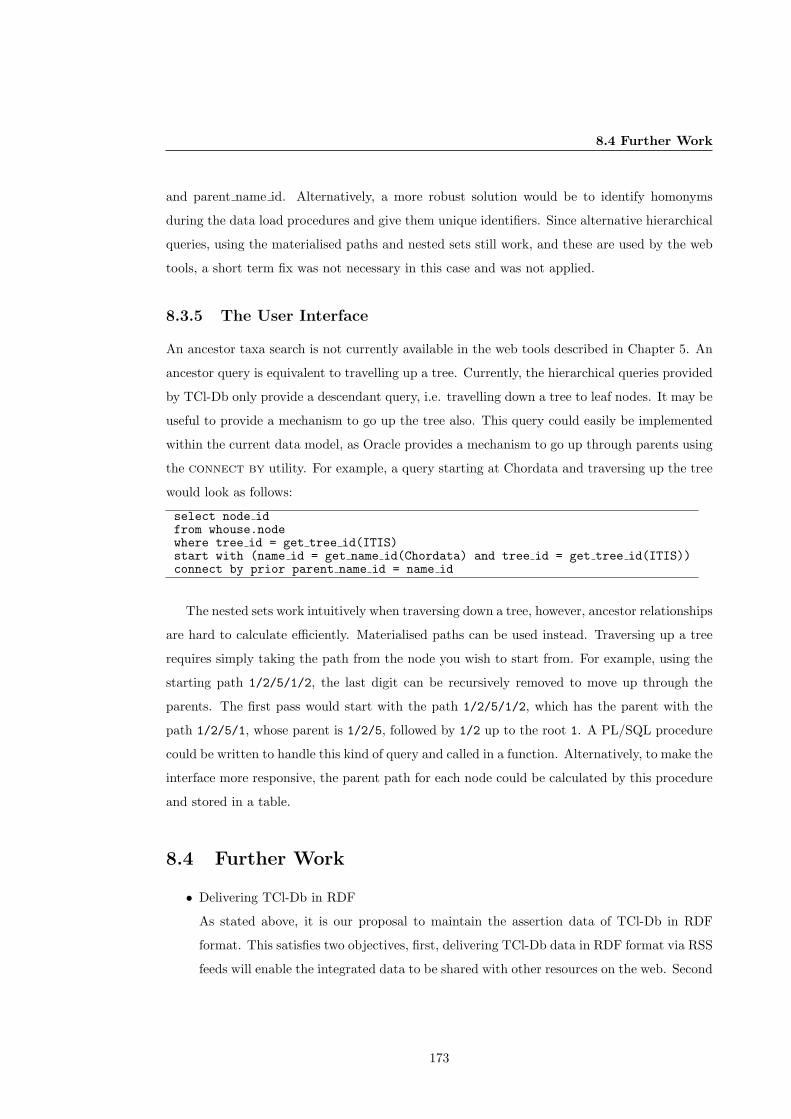
8.4 Further Work
and parent name id. Alternatively, a more robust solution would be to identify homonyms
during the data load procedures and give them unique identifiers. Since alternative hierarchical
queries, using the materialised paths and nested sets still work, and these are used by the web
tools, a short term fix was not necessary in this case and was not applied.
8.3.5 The User Interface
An ancestor taxa search is not currently available in the web tools described in Chapter 5. An
ancestor query is equivalent to travelling up a tree. Currently, the hierarchical queries provided
by TCl-Db only provide a descendant query, i.e. travelling down a tree to leaf nodes. It may be
useful to provide a mechanism to go up the tree also. This query could easily be implemented
within the current data model, as Oracle provides a mechanism to go up through parents using
the connect by utility. For example, a query starting at Chordata and traversing up the tree
would look as follows:
select node idfrom whouse.nodewhere tree id = get tree id(ITIS)start with (name id = get name id(Chordata) and tree id = get tree id(ITIS))connect by prior parent name id = name id
The nested sets work intuitively when traversing down a tree, however, ancestor relationships
are hard to calculate efficiently. Materialised paths can be used instead. Traversing up a tree
requires simply taking the path from the node you wish to start from. For example, using the
starting path 1/2/5/1/2, the last digit can be recursively removed to move up through the
parents. The first pass would start with the path 1/2/5/1/2, which has the parent with the
path 1/2/5/1, whose parent is 1/2/5, followed by 1/2 up to the root 1. A PL/SQL procedure
could be written to handle this kind of query and called in a function. Alternatively, to make the
interface more responsive, the parent path for each node could be calculated by this procedure
and stored in a table.
8.4 Further Work
• Delivering TCl-Db in RDF
As stated above, it is our proposal to maintain the assertion data of TCl-Db in RDF
format. This satisfies two objectives, first, delivering TCl-Db data in RDF format via RSS
feeds will enable the integrated data to be shared with other resources on the web. Second
173
8.5 Other Possible Work Directions
once the data sources used by TCl-Db move towards delivering data and updates via
subscribed RSS feeds, this provides a very convenient mechanism of automated updates
to the data that can be propagated into the database.
• Data Update
The classification data in TCl-Db is not amenable to automatic updates, since these
data need to be converted into nested sets and materialised paths before they can be
loaded. Experience of manual data updates so far has enabled us to recognise where
manual intervention is most often required in these updates. So far, misplaced synonyms
in the classification and homonyms have caused problems. It is possible to now to make
provisions for these scenarios and deal with them within an automated script.
• New Data Sources
As stated in Chapter 3, adding new data sources to TCl-Db is very simple. Data sources
are usually replicated into a separate silo and PL/SQL procedures copy the data into the
TCl-Db schema. New data sources can be added within hours as need arises.
• Data Model Improvements
Improvements to the data model will be made to better handle they way homonyms and
synonyms are dealt with. These improvements will also have a positive impact on the
data updates.
• Web Interface Improvements
Additional queries will be added to the web interface and SOAP service. An ancestor
query has been identified as a requirement and further additions will be made as user
requirements dictate.
8.5 Other Possible Work Directions
One could imagine this research extended in a number of dimensions. The first of those is
visualisation. The Treebolic viewer used in the work of E. Grant (see Chapter 2 Figure 2.3) was
a good solution, but since this work was carried out, new visualisations have become available,
developed mainly by the University of Maryland (http://www.cs.umd.edu/hcil/biodiversity/).
One could also investigate the usability of such tree comparisons and how well they support a
scientist in understanding the data and its complexities.
174
8.6 Conclusion
One could also work on the algorithmic efficiency of querying, as with the advent of even
larger classifications and tree databases, more efficient data access may be required. Alternative
tree representations and additional indexes could help in this work. One would typically carry
out performance measurement to decide between alternative data and index layouts.
Another angle on the issues of querying would be furnished by the investigation of the
changes in classification, as done in the work of (Pullan et al., 2000). This will be relevant as
more classifications become available and are subject to minor and major adjustments, due to
our improving knowledge of phylogeny.
8.6 Conclusion
This thesis addressed data integration and query problems observed in taxonomy and system-
atics. Based on an analysis of query logs, we showed that the majority of queries submitted to
the main phylogeny database, TreeBASE, or submitted on the web by naive users do not find
the information which the users require. Based on this material, we derived a number of user
requirements, and then we produced a solution which fulfils those requirements. The solution
presented here consisted of a supporting database warehouse which performs query expansion
with synonyms, vernaculars and hierarchically structured classification terms. This solution
was evaluated and shown to be far superior to the standalone version of TreeBASE. Future
work extending this thesis would consist in adding new data sources, extending the semantic
power of this database warehouse, and provision and testing of improved user interfaces for tree
visualisation and traversal.
This closes the thesis with the conclusion that the newly implemented database warehouse
satisfies the needs of taxonomic research to a far greater extent than other existing solution
and proves the research hypothesis presented at the start of the thesis.
175
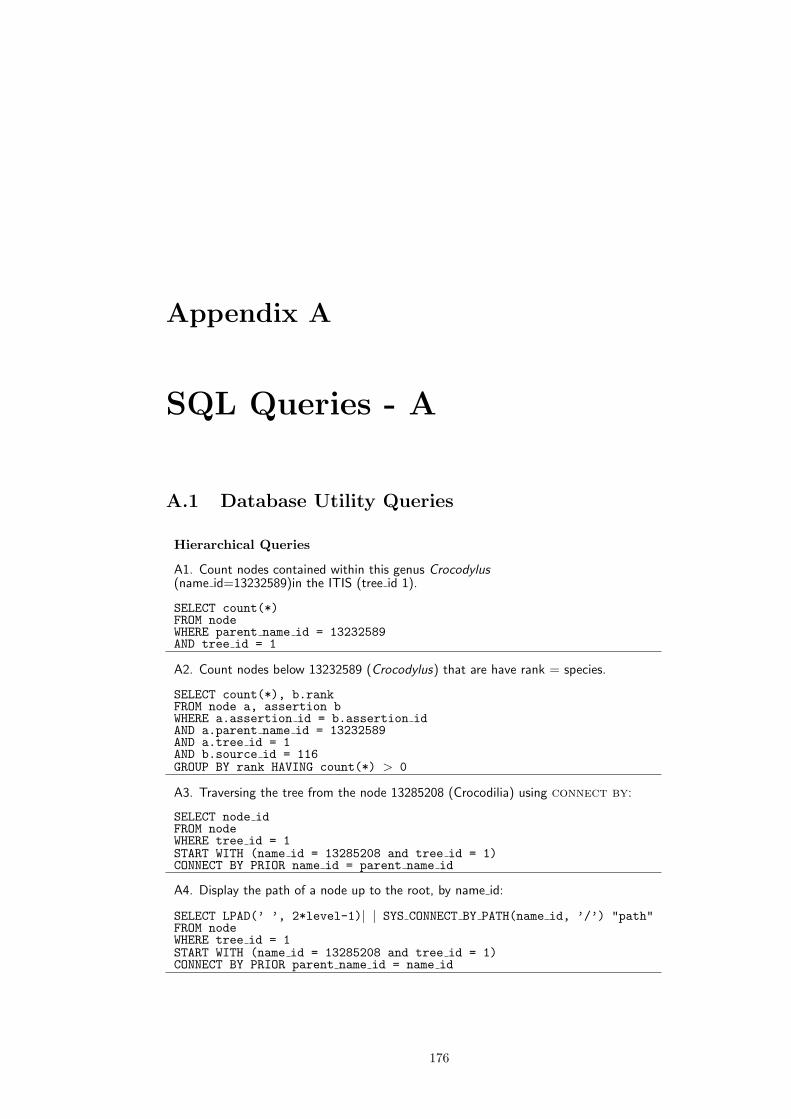
Appendix A
SQL Queries - A
A.1 Database Utility Queries
Hierarchical Queries
A1. Count nodes contained within this genus Crocodylus(name id=13232589)in the ITIS (tree id 1).
SELECT count(*)FROM nodeWHERE parent name id = 13232589AND tree id = 1
A2. Count nodes below 13232589 (Crocodylus) that are have rank = species.
SELECT count(*), b.rankFROM node a, assertion bWHERE a.assertion id = b.assertion idAND a.parent name id = 13232589AND a.tree id = 1AND b.source id = 116GROUP BY rank HAVING count(*) > 0
A3. Traversing the tree from the node 13285208 (Crocodilia) using connect by:
SELECT node idFROM nodeWHERE tree id = 1START WITH (name id = 13285208 and tree id = 1)CONNECT BY PRIOR name id = parent name id
A4. Display the path of a node up to the root, by name id:
SELECT LPAD(’ ’, 2*level-1)| | SYS CONNECT BY PATH(name id, ’/’) "path"FROM nodeWHERE tree id = 1START WITH (name id = 13285208 and tree id = 1)CONNECT BY PRIOR parent name id = name id
176
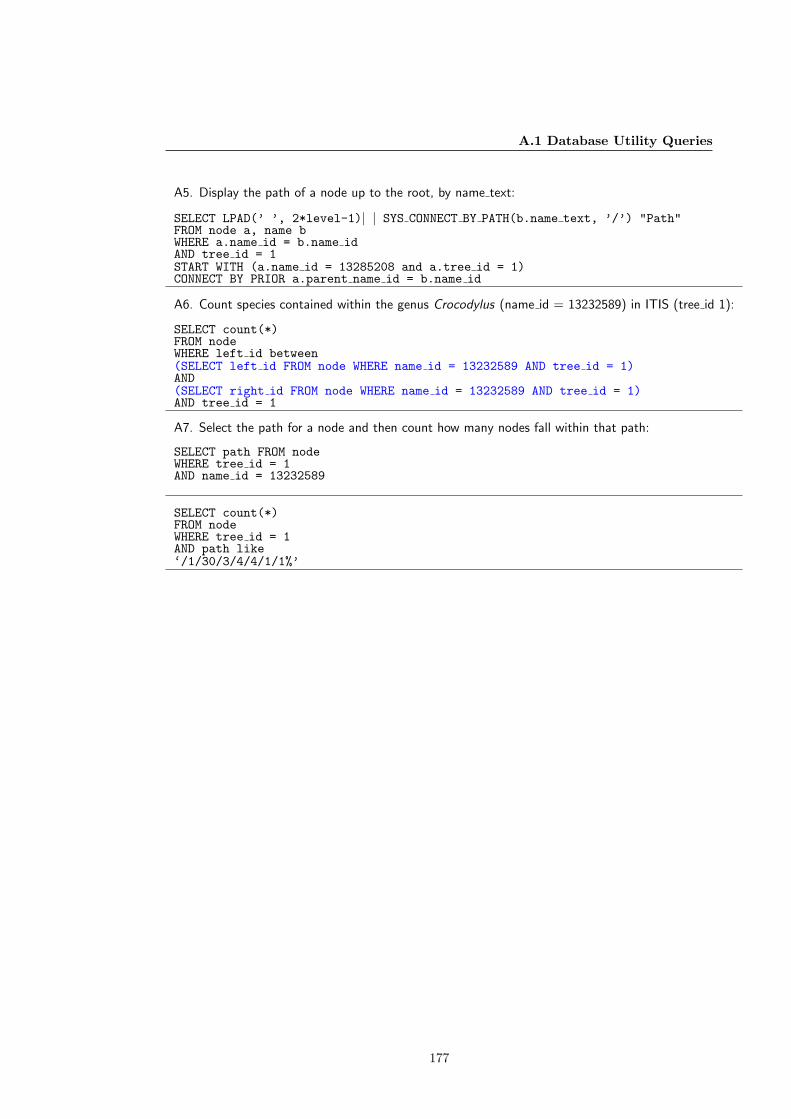
A.1 Database Utility Queries
A5. Display the path of a node up to the root, by name text:
SELECT LPAD(’ ’, 2*level-1)| | SYS CONNECT BY PATH(b.name text, ’/’) "Path"FROM node a, name bWHERE a.name id = b.name idAND tree id = 1START WITH (a.name id = 13285208 and a.tree id = 1)CONNECT BY PRIOR a.parent name id = b.name id
A6. Count species contained within the genus Crocodylus (name id = 13232589) in ITIS (tree id 1):
SELECT count(*)FROM nodeWHERE left id between(SELECT left id FROM node WHERE name id = 13232589 AND tree id = 1)AND(SELECT right id FROM node WHERE name id = 13232589 AND tree id = 1)AND tree id = 1
A7. Select the path for a node and then count how many nodes fall within that path:
SELECT path FROM nodeWHERE tree id = 1AND name id = 13232589
SELECT count(*)FROM nodeWHERE tree id = 1AND path like‘/1/30/3/4/4/1/1%’
177
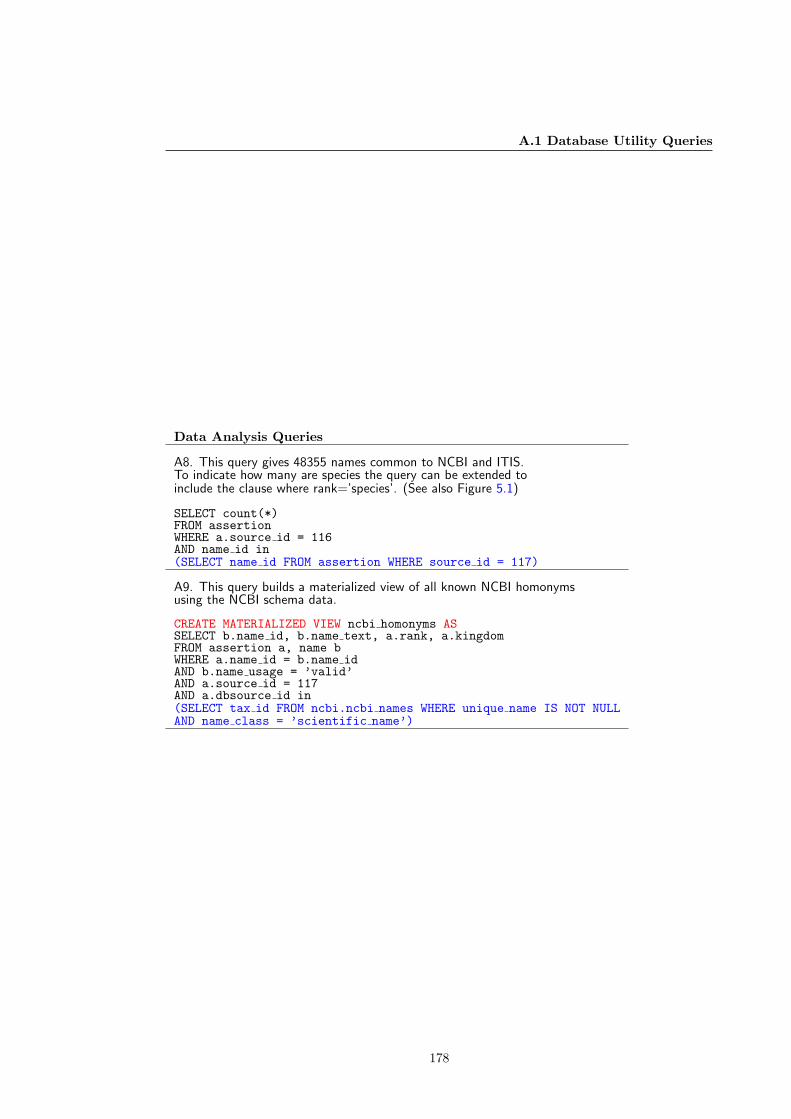
A.1 Database Utility Queries
Data Analysis Queries
A8. This query gives 48355 names common to NCBI and ITIS.To indicate how many are species the query can be extended toinclude the clause where rank=’species’. (See also Figure 5.1)
SELECT count(*)FROM assertionWHERE a.source id = 116AND name id in(SELECT name id FROM assertion WHERE source id = 117)
A9. This query builds a materialized view of all known NCBI homonymsusing the NCBI schema data.
CREATE MATERIALIZED VIEW ncbi homonyms ASSELECT b.name id, b.name text, a.rank, a.kingdomFROM assertion a, name bWHERE a.name id = b.name idAND b.name usage = ’valid’AND a.source id = 117AND a.dbsource id in(SELECT tax id FROM ncbi.ncbi names WHERE unique name IS NOT NULLAND name class = ’scientific name’)
178
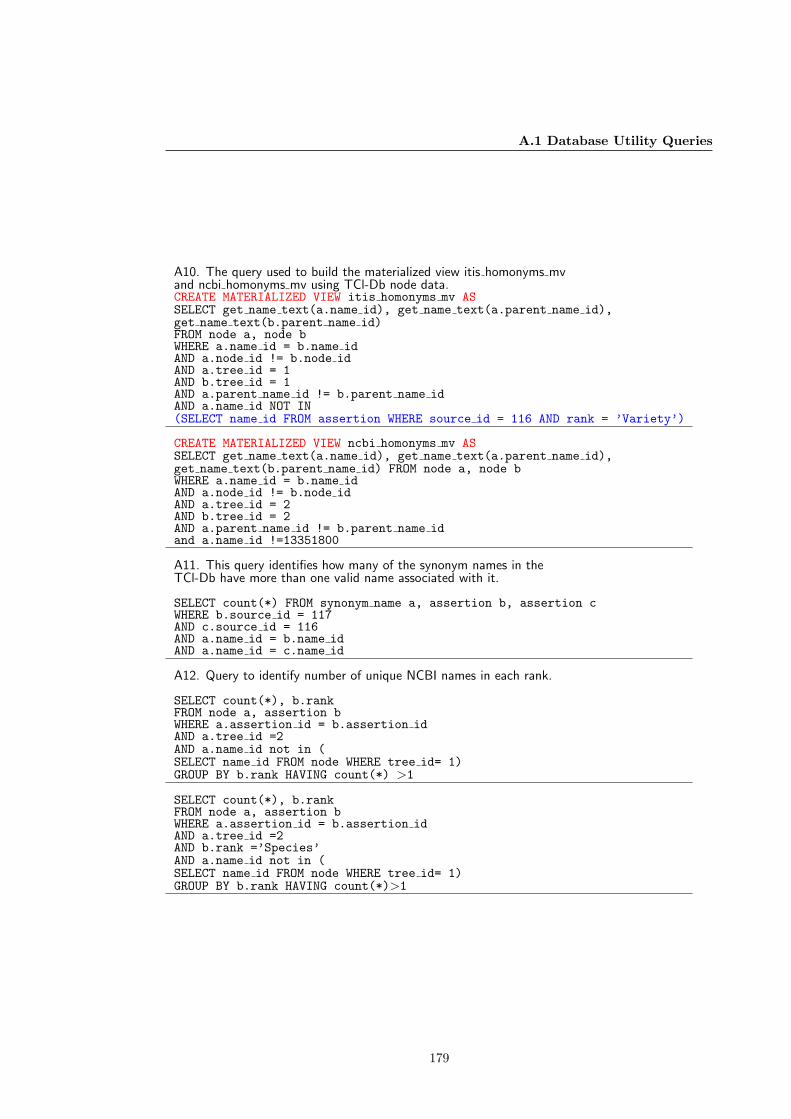
A.1 Database Utility Queries
A10. The query used to build the materialized view itis homonyms mvand ncbi homonyms mv using TCl-Db node data.CREATE MATERIALIZED VIEW itis homonyms mv ASSELECT get name text(a.name id), get name text(a.parent name id),get name text(b.parent name id)FROM node a, node bWHERE a.name id = b.name idAND a.node id != b.node idAND a.tree id = 1AND b.tree id = 1AND a.parent name id != b.parent name idAND a.name id NOT IN(SELECT name id FROM assertion WHERE source id = 116 AND rank = ’Variety’)
CREATE MATERIALIZED VIEW ncbi homonyms mv ASSELECT get name text(a.name id), get name text(a.parent name id),get name text(b.parent name id) FROM node a, node bWHERE a.name id = b.name idAND a.node id != b.node idAND a.tree id = 2AND b.tree id = 2AND a.parent name id != b.parent name idand a.name id !=13351800
A11. This query identifies how many of the synonym names in theTCl-Db have more than one valid name associated with it.
SELECT count(*) FROM synonym name a, assertion b, assertion cWHERE b.source id = 117AND c.source id = 116AND a.name id = b.name idAND a.name id = c.name id
A12. Query to identify number of unique NCBI names in each rank.
SELECT count(*), b.rankFROM node a, assertion bWHERE a.assertion id = b.assertion idAND a.tree id =2AND a.name id not in (SELECT name id FROM node WHERE tree id= 1)GROUP BY b.rank HAVING count(*) >1
SELECT count(*), b.rankFROM node a, assertion bWHERE a.assertion id = b.assertion idAND a.tree id =2AND b.rank =’Species’AND a.name id not in (SELECT name id FROM node WHERE tree id= 1)GROUP BY b.rank HAVING count(*)>1
179
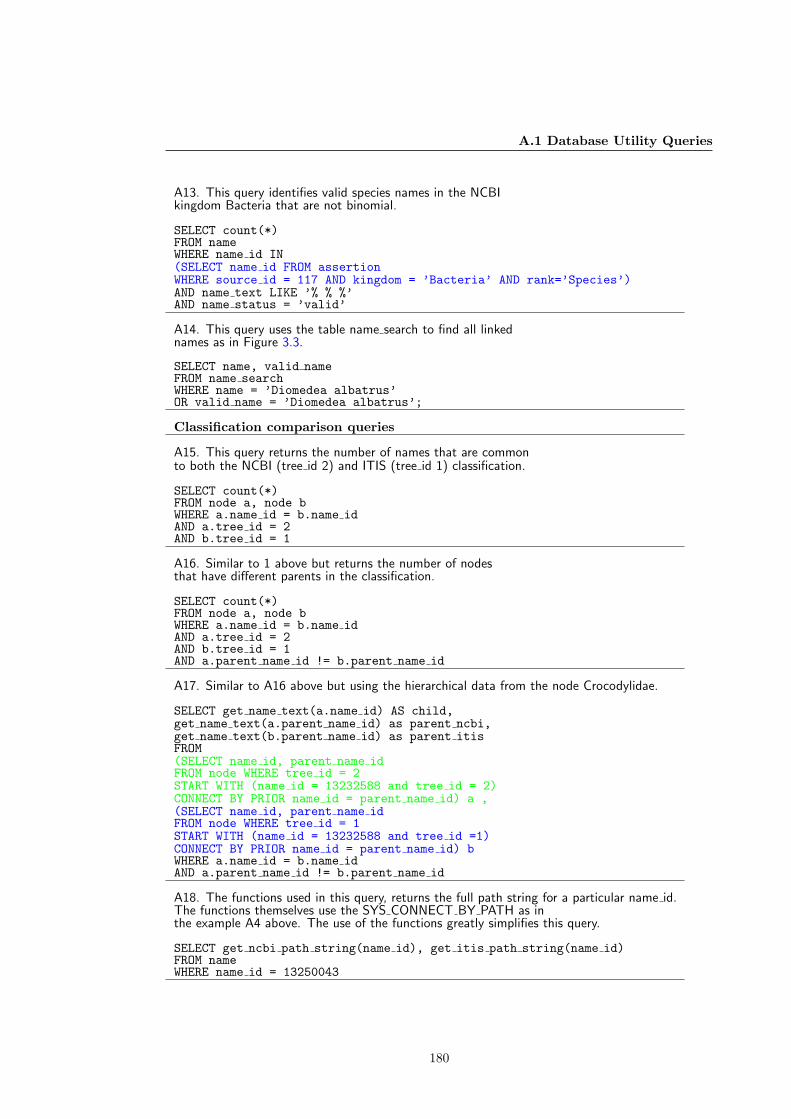
A.1 Database Utility Queries
A13. This query identifies valid species names in the NCBIkingdom Bacteria that are not binomial.
SELECT count(*)FROM nameWHERE name id IN(SELECT name id FROM assertionWHERE source id = 117 AND kingdom = ’Bacteria’ AND rank=’Species’)AND name text LIKE ’% % %’AND name status = ’valid’
A14. This query uses the table name search to find all linkednames as in Figure 3.3.
SELECT name, valid nameFROM name searchWHERE name = ’Diomedea albatrus’OR valid name = ’Diomedea albatrus’;
Classification comparison queries
A15. This query returns the number of names that are commonto both the NCBI (tree id 2) and ITIS (tree id 1) classification.
SELECT count(*)FROM node a, node bWHERE a.name id = b.name idAND a.tree id = 2AND b.tree id = 1
A16. Similar to 1 above but returns the number of nodesthat have different parents in the classification.
SELECT count(*)FROM node a, node bWHERE a.name id = b.name idAND a.tree id = 2AND b.tree id = 1AND a.parent name id != b.parent name id
A17. Similar to A16 above but using the hierarchical data from the node Crocodylidae.
SELECT get name text(a.name id) AS child,get name text(a.parent name id) as parent ncbi,get name text(b.parent name id) as parent itisFROM(SELECT name id, parent name idFROM node WHERE tree id = 2START WITH (name id = 13232588 and tree id = 2)CONNECT BY PRIOR name id = parent name id) a ,(SELECT name id, parent name idFROM node WHERE tree id = 1START WITH (name id = 13232588 and tree id =1)CONNECT BY PRIOR name id = parent name id) bWHERE a.name id = b.name idAND a.parent name id != b.parent name id
A18. The functions used in this query, returns the full path string for a particular name id.The functions themselves use the SYS CONNECT BY PATH as inthe example A4 above. The use of the functions greatly simplifies this query.
SELECT get ncbi path string(name id), get itis path string(name id)FROM nameWHERE name id = 13250043
180
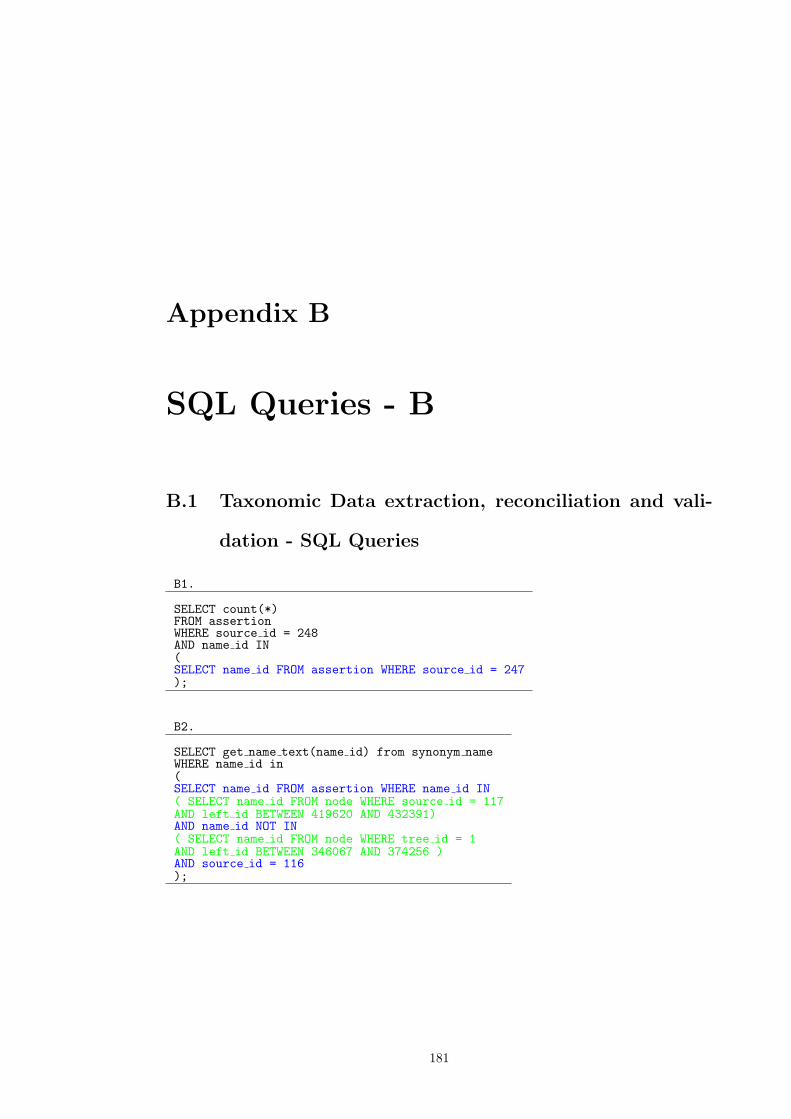
Appendix B
SQL Queries - B
B.1 Taxonomic Data extraction, reconciliation and vali-
dation - SQL Queries
B1.
SELECT count(*)FROM assertionWHERE source id = 248AND name id IN(SELECT name id FROM assertion WHERE source id = 247);
B2.
SELECT get name text(name id) from synonym nameWHERE name id in(SELECT name id FROM assertion WHERE name id IN( SELECT name id FROM node WHERE source id = 117AND left id BETWEEN 419620 AND 432391)AND name id NOT IN( SELECT name id FROM node WHERE tree id = 1AND left id BETWEEN 346067 AND 374256 )AND source id = 116);
181

B.1 Taxonomic Data extraction, reconciliation and validation - SQL Queries
B3.
SELECT distinct(get name text(b.name id)) as genus,get name text(b.parent name id) as ncbi,get name text(a.parent name id) as itisFROM node a, node bWHERE a.tree id =1AND b.tree id = 2AND a.name id = b.name idAND a.parent name id != b.parent name idAND b.name id IN(SELECT name id FROM assertionWHERE source id = 117 AND rank = ’Genus’ AND name id IN(SELECT name id FROM node WHERE tree id = 2AND left id BETWEEN 419620 and 432391))AND a.name id IN(SELECT name id FROM assertionWHERE source id = 116 AND rank = ’Genus’ AND name id IN(SELECT name id FROM nodeWHERE tree id = 1 AND left id BETWEEN 346067 AND 374256));
B4.
SELECT distinct(get name text(b.name id)) as genus,get name text(b.parent name id) as family,get name text(a.parent name id) as itisFROM node a, node bWHERE a.tree id =1AND b.tree id = 2AND a.name id = b.name idAND a.parent name id != b.parent name idAND b.name id IN(SELECT name id FROM assertionWHERE source id = 117 AND rank = ’Genus’ AND name id IN(SELECT name id FROM node WHERE tree id = 2AND left id BETWEEN 419620 AND 432391))AND a.name id IN(SELECT name id FROM assertionWHERE source id = 116 AND rank = ’Genus’ AND name id IN(SELECT name id FROM node WHERE tree id = 1AND left id BETWEEN 346067 AND 374256))AND b.parent name id IN(SELECT name id FROM assertionWHERE source id = 117 AND rank = ’Family’ AND name id IN(SELECT name id FROM node WHERE tree id = 2AND left id BETWEEN 419620 AND 432391))AND b.parent name id IN(SELECT name id FROM synonym name);
182
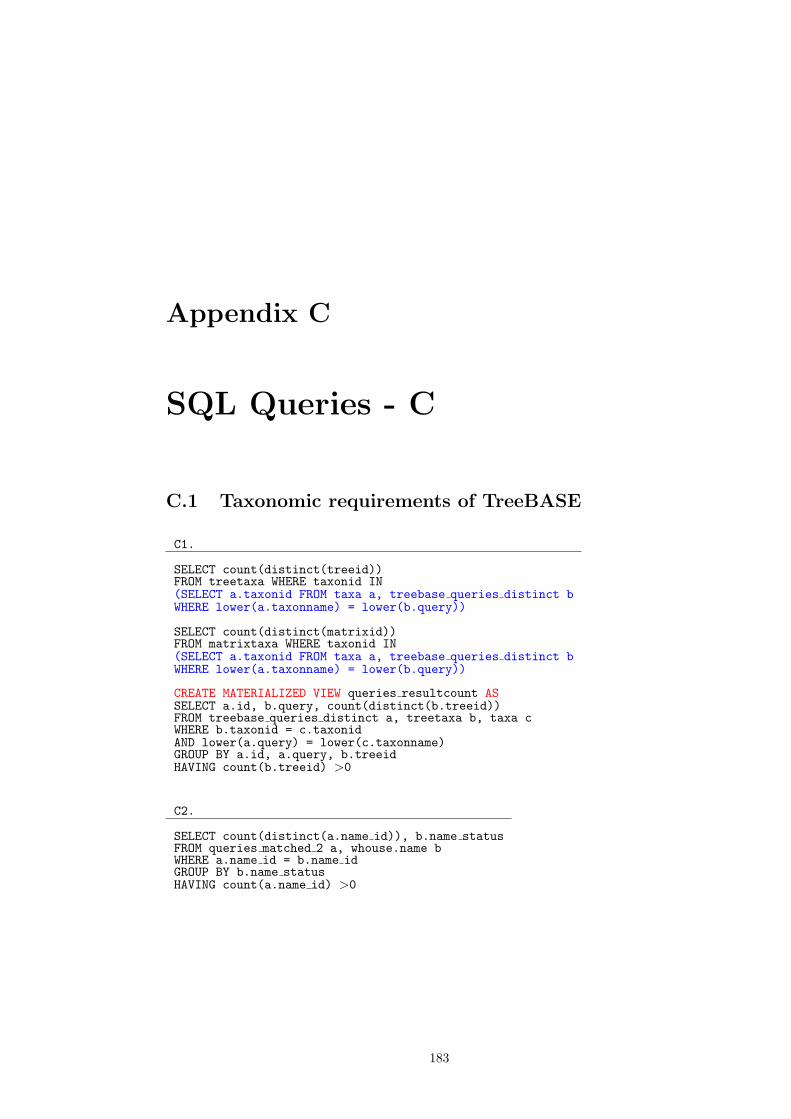
Appendix C
SQL Queries - C
C.1 Taxonomic requirements of TreeBASE
C1.
SELECT count(distinct(treeid))FROM treetaxa WHERE taxonid IN(SELECT a.taxonid FROM taxa a, treebase queries distinct bWHERE lower(a.taxonname) = lower(b.query))
SELECT count(distinct(matrixid))FROM matrixtaxa WHERE taxonid IN(SELECT a.taxonid FROM taxa a, treebase queries distinct bWHERE lower(a.taxonname) = lower(b.query))
CREATE MATERIALIZED VIEW queries resultcount ASSELECT a.id, b.query, count(distinct(b.treeid))FROM treebase queries distinct a, treetaxa b, taxa cWHERE b.taxonid = c.taxonidAND lower(a.query) = lower(c.taxonname)GROUP BY a.id, a.query, b.treeidHAVING count(b.treeid) >0
C2.
SELECT count(distinct(a.name id)), b.name statusFROM queries matched 2 a, whouse.name bWHERE a.name id = b.name idGROUP BY b.name statusHAVING count(a.name id) >0
183
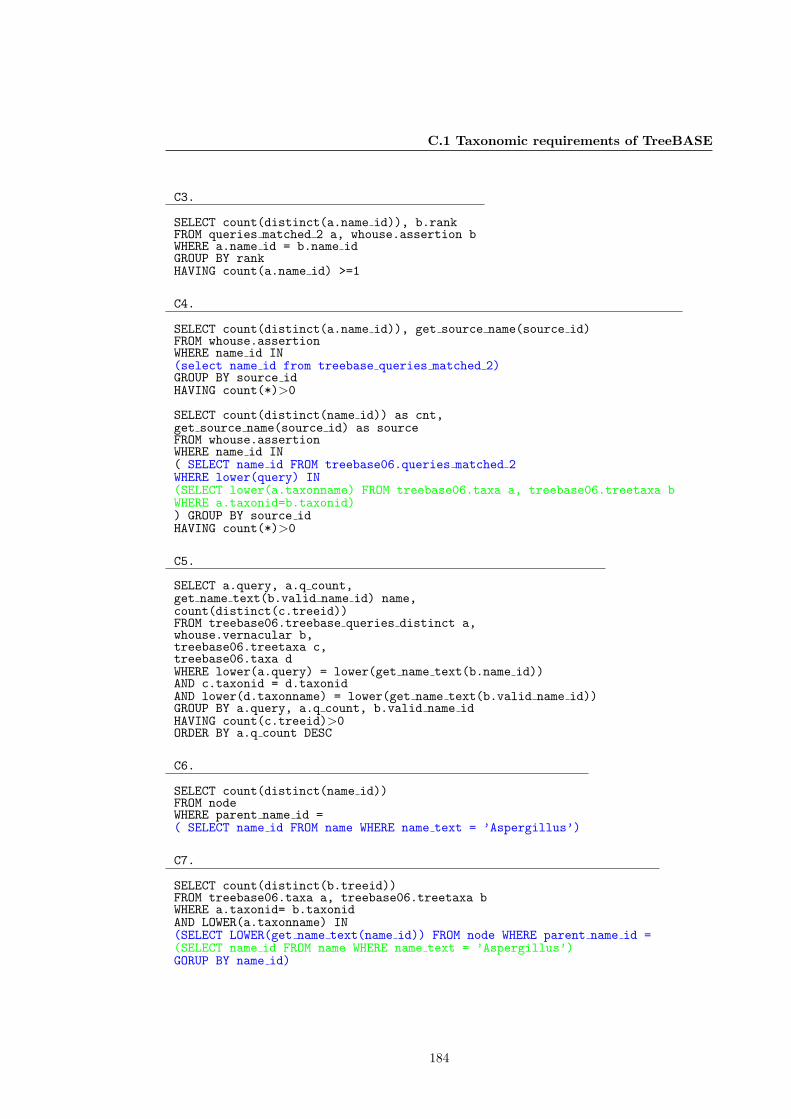
C.1 Taxonomic requirements of TreeBASE
C3.
SELECT count(distinct(a.name id)), b.rankFROM queries matched 2 a, whouse.assertion bWHERE a.name id = b.name idGROUP BY rankHAVING count(a.name id) >=1
C4.
SELECT count(distinct(a.name id)), get source name(source id)FROM whouse.assertionWHERE name id IN(select name id from treebase queries matched 2)GROUP BY source idHAVING count(*)>0
SELECT count(distinct(name id)) as cnt,get source name(source id) as sourceFROM whouse.assertionWHERE name id IN( SELECT name id FROM treebase06.queries matched 2WHERE lower(query) IN(SELECT lower(a.taxonname) FROM treebase06.taxa a, treebase06.treetaxa bWHERE a.taxonid=b.taxonid)) GROUP BY source idHAVING count(*)>0
C5.
SELECT a.query, a.q count,get name text(b.valid name id) name,count(distinct(c.treeid))FROM treebase06.treebase queries distinct a,whouse.vernacular b,treebase06.treetaxa c,treebase06.taxa dWHERE lower(a.query) = lower(get name text(b.name id))AND c.taxonid = d.taxonidAND lower(d.taxonname) = lower(get name text(b.valid name id))GROUP BY a.query, a.q count, b.valid name idHAVING count(c.treeid)>0ORDER BY a.q count DESC
C6.
SELECT count(distinct(name id))FROM nodeWHERE parent name id =( SELECT name id FROM name WHERE name text = ’Aspergillus’)
C7.
SELECT count(distinct(b.treeid))FROM treebase06.taxa a, treebase06.treetaxa bWHERE a.taxonid= b.taxonidAND LOWER(a.taxonname) IN(SELECT LOWER(get name text(name id)) FROM node WHERE parent name id =(SELECT name id FROM name WHERE name text = ’Aspergillus’)GORUP BY name id)
184
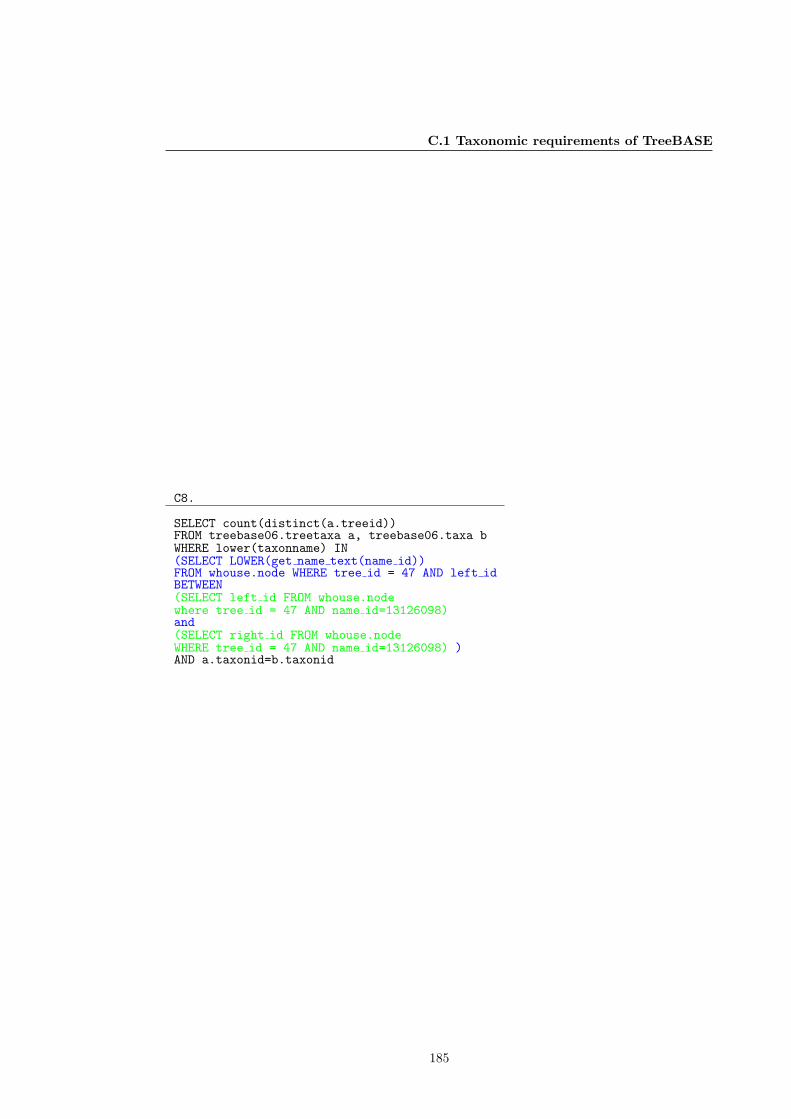
C.1 Taxonomic requirements of TreeBASE
C8.
SELECT count(distinct(a.treeid))FROM treebase06.treetaxa a, treebase06.taxa bWHERE lower(taxonname) IN(SELECT LOWER(get name text(name id))FROM whouse.node WHERE tree id = 47 AND left idBETWEEN(SELECT left id FROM whouse.nodewhere tree id = 47 AND name id=13126098)and(SELECT right id FROM whouse.nodeWHERE tree id = 47 AND name id=13126098) )AND a.taxonid=b.taxonid
185

Appendix D
TCl-Db in RDF
Support for RDF is provided through the Oracle Database 10g RDF Data Model (Alexander
et al., 2004; Murray, 2005). There are several RDF data stores with, 3store (Harris & Gibbins,
2003), Sesame (Broekstra et al., 2002) and Jena2 (Wilkinson et al., 2003) being the most
popular (and robust). Apart from the fact that TCl-Db was already implemented within
an Oracle database, the advantage of using Oracle is that queries are SQL based therefore,
queries already performed in previous chapters could be easily translated. The Oracle RDF
implementation is delivered within Oracle spatial which consists of a network data model (data
are modelled in nodes and links). RDF triples are stored as a logical graph within spatial.
The subject and objects are mapped to nodes and predicates are mapped to links, the start
node of a link being the subject and the end node being the object. The way data are stored
there are no repeated values, an object or subject are stored only once. This optimised storage
structure maintains fidelity and means it can scale to very large datasets. RDF fits into the
network model within Oracle spatial and the features that Oracle has already provided within
this product for storage and retrieval of network data made this the system of choice for testing
the use of RDF within TCl-Db.
The basic steps to using RDF in Oracle require first creating an RDF network, then creating
the table to store the references to the RDF triples and finally creating a model that references
the table in which the triples are referenced. These steps are outlined below.
1. Create tables to store the references to the RDF data
CREATE TABLE assertions_rdf (id NUMBER, triple SDO_RDF_TRIPLE_S);
CREATE TABLE names_rdf (id NUMBER, triple SDO_RDF_TRIPLE_S);
186
2. Create the RDF Models
EXECUTE SDO_RDF.CREATE_RDF_MODEL(’assertions’, ’assertions_rdf’, ’triple’);
EXECUTE SDO_RDF.CREATE_RDF_MODEL(’names’, ’names_rdf’, ’triple’);
3. Create Oracle database indexes on conditions that will be specified in the WHERE clause
of SELECT statements, to provide better performance for such queries.
CREATE INDEX asertions_sub_idx ON assertions_rdf (triple.GET_SUBJECT());
CREATE INDEX asertions_prop_idx ON assertions_rdf (triple.GET_PROPERTY());
CREATE INDEX asertions_obj_idx ON assertions_rdf (TO_CHAR(triple.GET_OBJECT()));
CREATE INDEX asertions_tri_idx ON assertions_rdf (triple.rdf_t_id);
CREATE INDEX names_sub_idx ON names_rdf (triple.GET_SUBJECT());
CREATE INDEX names_prop_idx ON names_rdf (triple.GET_PROPERTY());
CREATE INDEX names_obj_idx ON names_rdf (TO_CHAR(triple.GET_OBJECT()));
CREATE INDEX names_tri_idx ON names_rdf (triple.rdf_t_id);
TCl-Db in RDF
The default method used for describing RDF data models is the RDF graph, these are simple
directed graphs with labelled nodes and edges. While RDF graph is used to model the data
the format for delivering the data in an RDF graph is through serialisation using RDF/XML
(Beckett et al., 2003). The TCl data mapped into RDF is shown in Figure D.1. Relational tables
are easily serialised into RDF/XML using SQLX. The SQLX queries for the tables assertion,
187
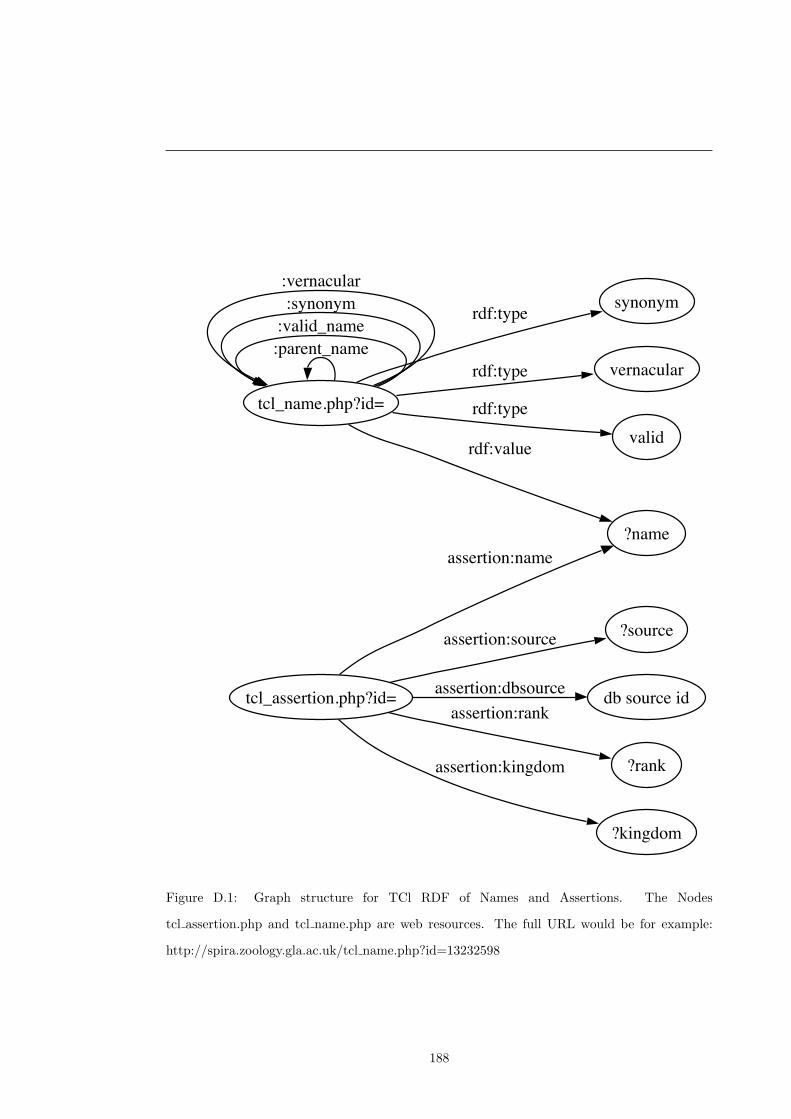
tcl_name.php?id=
:parent_name:valid_name:synonym
:vernacularsynonymrdf:type
vernacularrdf:type
validrdf:type
?name
rdf:value
tcl_assertion.php?id=
assertion:name
?sourceassertion:source
db source idassertion:dbsource
?rank
assertion:rank
?kingdom
assertion:kingdom
Figure D.1: Graph structure for TCl RDF of Names and Assertions. The Nodes
tcl assertion.php and tcl name.php are web resources. The full URL would be for example:
http://spira.zoology.gla.ac.uk/tcl name.php?id=13232598
188
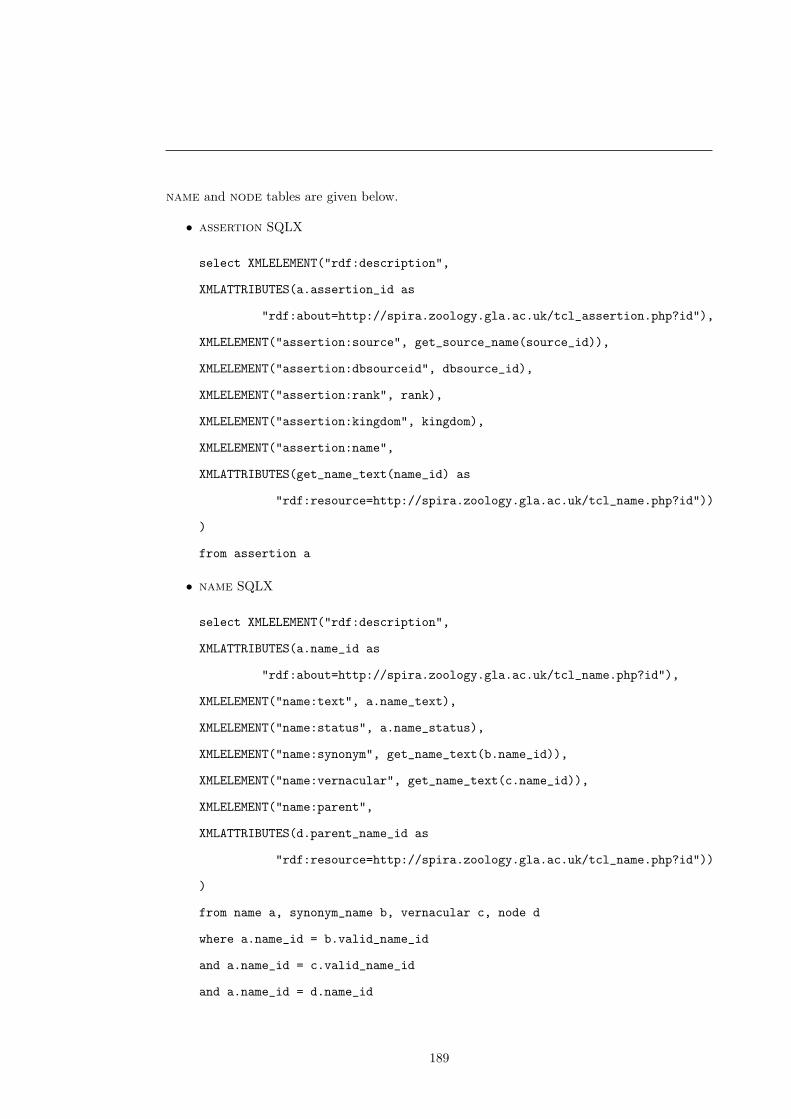
name and node tables are given below.
• assertion SQLX
select XMLELEMENT("rdf:description",
XMLATTRIBUTES(a.assertion_id as
"rdf:about=http://spira.zoology.gla.ac.uk/tcl_assertion.php?id"),
XMLELEMENT("assertion:source", get_source_name(source_id)),
XMLELEMENT("assertion:dbsourceid", dbsource_id),
XMLELEMENT("assertion:rank", rank),
XMLELEMENT("assertion:kingdom", kingdom),
XMLELEMENT("assertion:name",
XMLATTRIBUTES(get_name_text(name_id) as
"rdf:resource=http://spira.zoology.gla.ac.uk/tcl_name.php?id"))
)
from assertion a
• name SQLX
select XMLELEMENT("rdf:description",
XMLATTRIBUTES(a.name_id as
"rdf:about=http://spira.zoology.gla.ac.uk/tcl_name.php?id"),
XMLELEMENT("name:text", a.name_text),
XMLELEMENT("name:status", a.name_status),
XMLELEMENT("name:synonym", get_name_text(b.name_id)),
XMLELEMENT("name:vernacular", get_name_text(c.name_id)),
XMLELEMENT("name:parent",
XMLATTRIBUTES(d.parent_name_id as
"rdf:resource=http://spira.zoology.gla.ac.uk/tcl_name.php?id"))
)
from name a, synonym_name b, vernacular c, node d
where a.name_id = b.valid_name_id
and a.name_id = c.valid_name_id
and a.name_id = d.name_id
189
These queries return three XML files, when edited to include the appropriate headers, these
would then be parsed using XSLT (using for example the XALAN processor) into Notation 3
format (N3) (Berners-Lee, 2006). The XSLT script is given in Appendix A. The Oracle RDF
loader uses Java to load data in N3 format. Similarly, XSLT can be used to build SQL insert
statements that can be directly executed from sqlplus utility, however the Java loader performs
much better than individual insert statements. The command line:
java -classpath .:$ORACLE_HOME/jdbc/lib/ojdbc14.jar:./sdordfclient.jar
TestNTriple2NDM name.nt name_rdf names 12
for example, would load the name file in N3 format into the table names rdf, these data
would be associated with the model names which has a model id of 12.
TreeBASE in RDF
The RDF model for TreeBASE is given in Figure D.2. Using the TreeBASE schema that was
replicated into the local Oracle database, a similar SQLX query would serialise the data into
RDF/XML. The queries for the treetaxa and the matrixtaxa tables are given below. Again,
with the addition of the appropriate headers, these files would be parsed with XSLT (Appendix
B) into N3 format and loaded into Oracle as shown above.
• treebase.matrixtaxa SQLX
select XMLELEMENT("rdf:description",
XMLATTRIBUTES(b.matrixid as
rdf:about="http://spira.zoology.gla.ac.uk/treebase_matrix.php?id),
XMLELEMENT("matrixtaxa:taxonid",
XMLATTRIBUTES(b.taxonid as
rdf:resource="http://spira.zoology.gla.ac.uk/treebase_taxon.php?id)),
XMLELEMENT("taxa:name", c.taxonname)
)
from matrixtaxa b, taxa c
where b.taxonid = c.taxonid
190
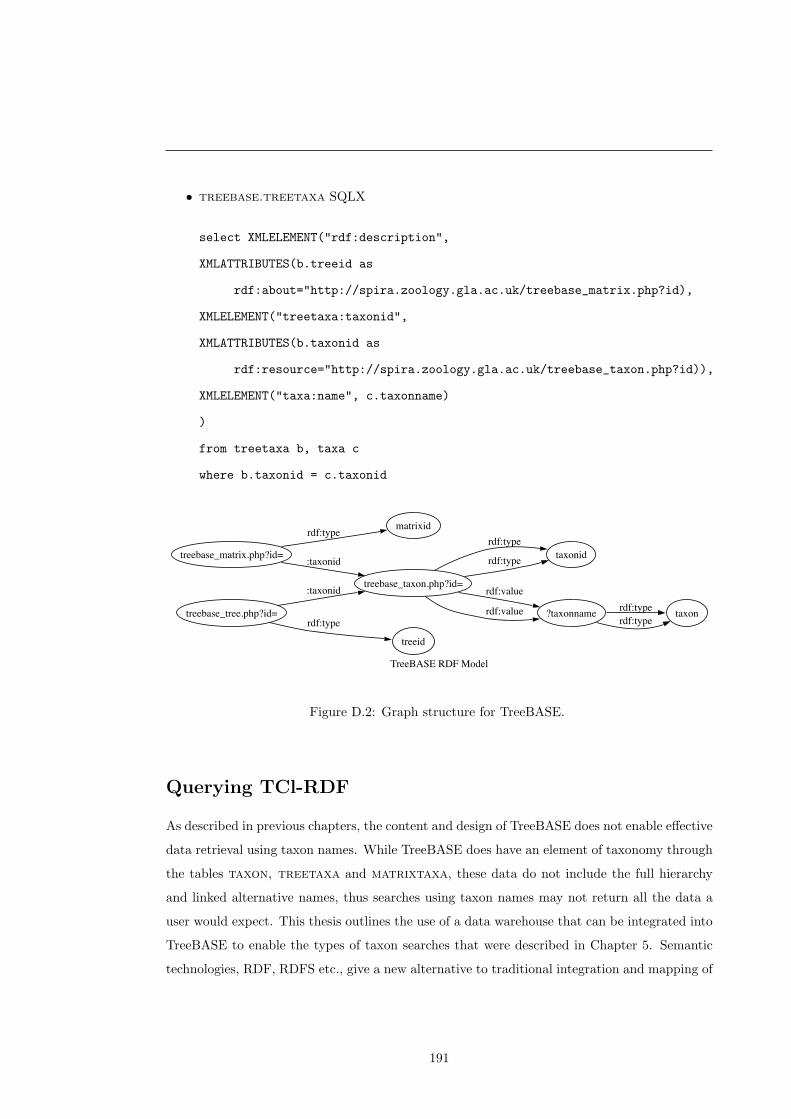
• treebase.treetaxa SQLX
select XMLELEMENT("rdf:description",
XMLATTRIBUTES(b.treeid as
rdf:about="http://spira.zoology.gla.ac.uk/treebase_matrix.php?id),
XMLELEMENT("treetaxa:taxonid",
XMLATTRIBUTES(b.taxonid as
rdf:resource="http://spira.zoology.gla.ac.uk/treebase_taxon.php?id)),
XMLELEMENT("taxa:name", c.taxonname)
)
from treetaxa b, taxa c
where b.taxonid = c.taxonid
TreeBASE RDF Model
treebase_matrix.php?id=
treebase_taxon.php?id=
:taxonid
matrixidrdf:type
taxonidrdf:type
rdf:type
?taxonname
rdf:value
rdf:value taxonrdf:typerdf:type
treebase_tree.php?id=
:taxonid
treeid
rdf:type
Figure D.2: Graph structure for TreeBASE.
Querying TCl-RDF
As described in previous chapters, the content and design of TreeBASE does not enable effective
data retrieval using taxon names. While TreeBASE does have an element of taxonomy through
the tables taxon, treetaxa and matrixtaxa, these data do not include the full hierarchy
and linked alternative names, thus searches using taxon names may not return all the data a
user would expect. This thesis outlines the use of a data warehouse that can be integrated into
TreeBASE to enable the types of taxon searches that were described in Chapter 5. Semantic
technologies, RDF, RDFS etc., give a new alternative to traditional integration and mapping of
191
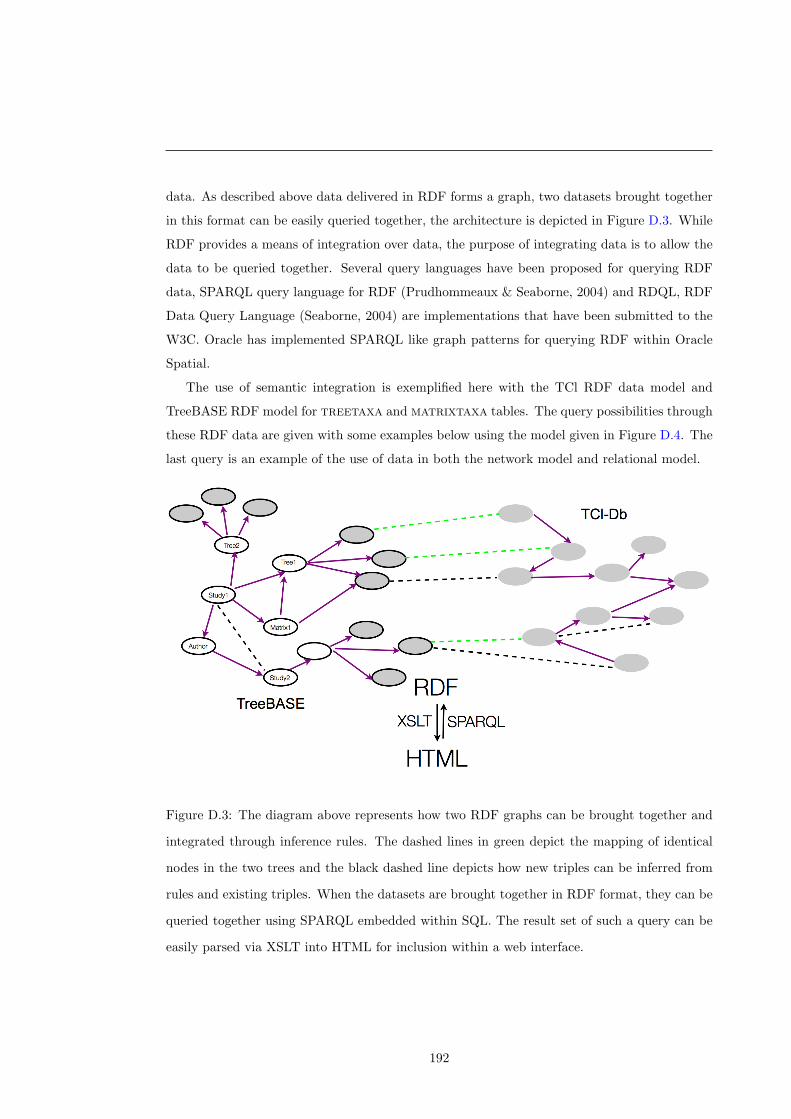
data. As described above data delivered in RDF forms a graph, two datasets brought together
in this format can be easily queried together, the architecture is depicted in Figure D.3. While
RDF provides a means of integration over data, the purpose of integrating data is to allow the
data to be queried together. Several query languages have been proposed for querying RDF
data, SPARQL query language for RDF (Prudhommeaux & Seaborne, 2004) and RDQL, RDF
Data Query Language (Seaborne, 2004) are implementations that have been submitted to the
W3C. Oracle has implemented SPARQL like graph patterns for querying RDF within Oracle
Spatial.
The use of semantic integration is exemplified here with the TCl RDF data model and
TreeBASE RDF model for treetaxa and matrixtaxa tables. The query possibilities through
these RDF data are given with some examples below using the model given in Figure D.4. The
last query is an example of the use of data in both the network model and relational model.
Figure D.3: The diagram above represents how two RDF graphs can be brought together and
integrated through inference rules. The dashed lines in green depict the mapping of identical
nodes in the two trees and the black dashed line depicts how new triples can be inferred from
rules and existing triples. When the datasets are brought together in RDF format, they can be
queried together using SPARQL embedded within SQL. The result set of such a query can be
easily parsed via XSLT into HTML for inclusion within a web interface.
192
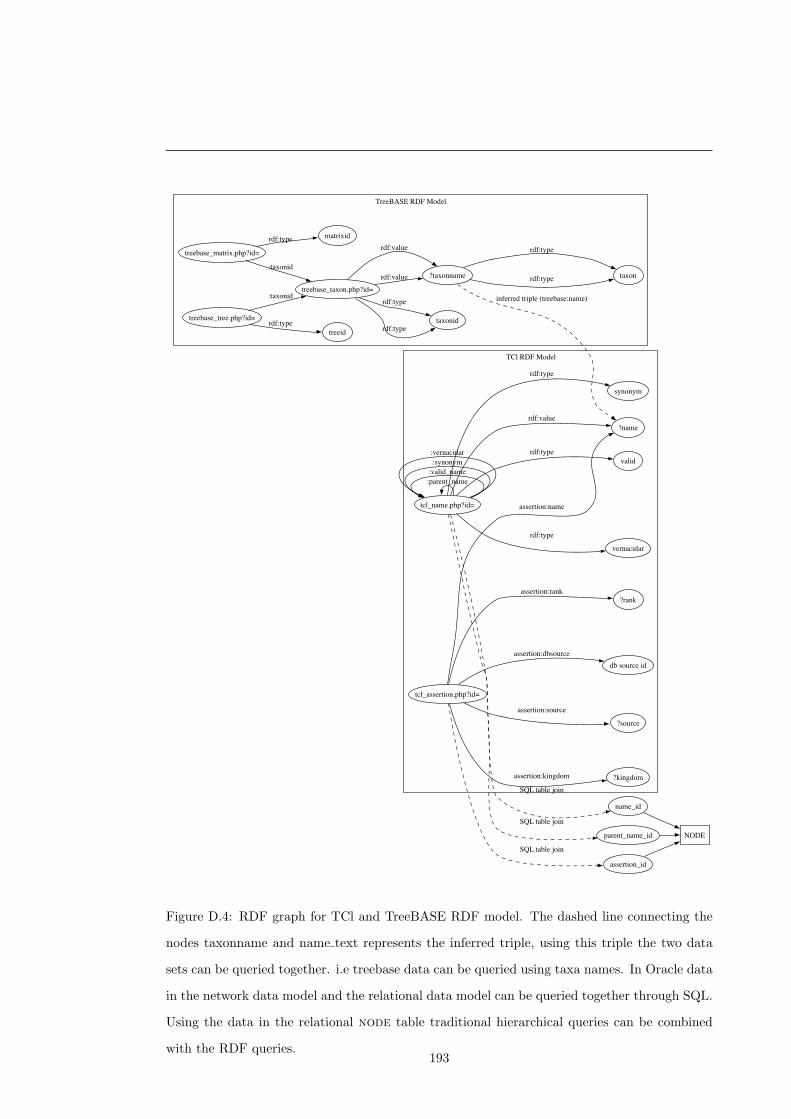
TreeBASE RDF Model
TCl RDF Model
treebase_matrix.php?id=
treebase_taxon.php?id=
:taxonid
matrixidrdf:type
taxonidrdf:type
rdf:type
?taxonnamerdf:value
rdf:value
taxonrdf:type
rdf:type
?name
inferred triple (treebase:name)
treebase_tree.php?id=
:taxonid
treeidrdf:type
tcl_name.php?id=
:parent_name:valid_name:synonym
:vernacular
synonym
rdf:type
vernacular
rdf:type
validrdf:type
rdf:value
name_id
SQL table join
parent_name_id
SQL table join
tcl_assertion.php?id=
assertion:name
?source
assertion:source
db source idassertion:dbsource
?rankassertion:rank
?kingdomassertion:kingdom
assertion_id
SQL table join
NODE
Figure D.4: RDF graph for TCl and TreeBASE RDF model. The dashed line connecting the
nodes taxonname and name text represents the inferred triple, using this triple the two data
sets can be queried together. i.e treebase data can be queried using taxa names. In Oracle data
in the network data model and the relational data model can be queried together through SQL.
Using the data in the relational node table traditional hierarchical queries can be combined
with the RDF queries.193
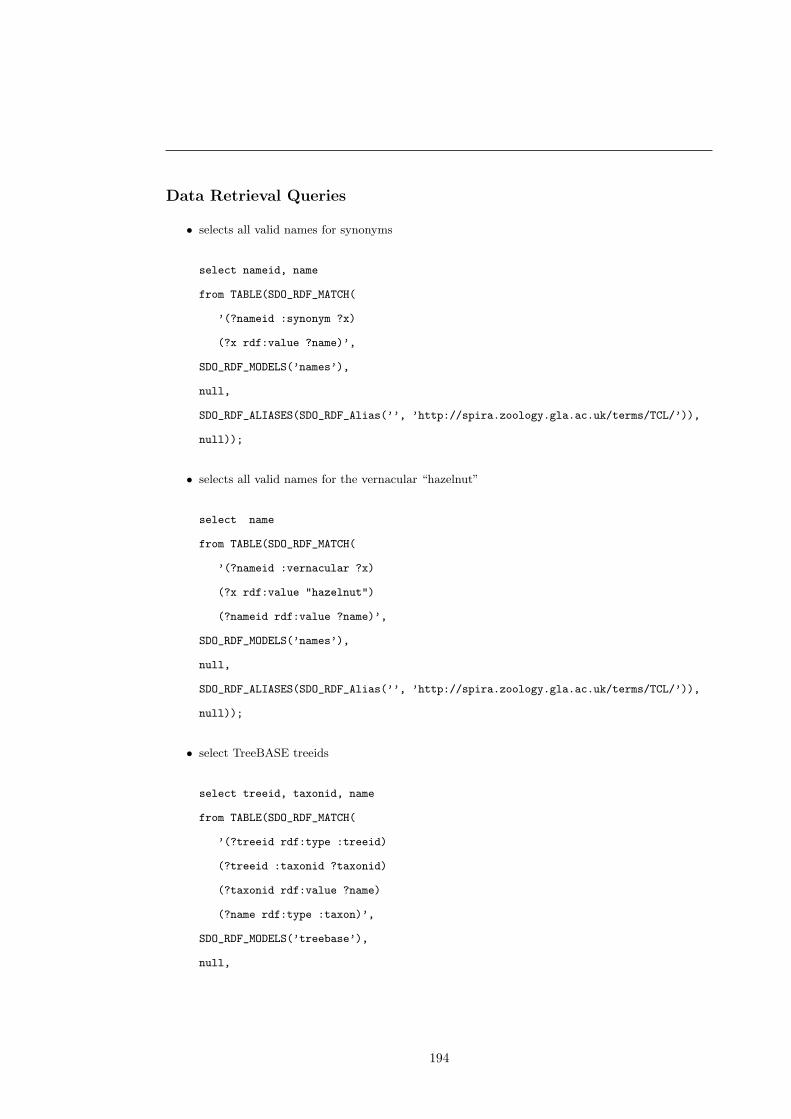
Data Retrieval Queries
• selects all valid names for synonyms
select nameid, name
from TABLE(SDO_RDF_MATCH(
’(?nameid :synonym ?x)
(?x rdf:value ?name)’,
SDO_RDF_MODELS(’names’),
null,
SDO_RDF_ALIASES(SDO_RDF_Alias(’’, ’http://spira.zoology.gla.ac.uk/terms/TCL/’)),
null));
• selects all valid names for the vernacular “hazelnut”
select name
from TABLE(SDO_RDF_MATCH(
’(?nameid :vernacular ?x)
(?x rdf:value "hazelnut")
(?nameid rdf:value ?name)’,
SDO_RDF_MODELS(’names’),
null,
SDO_RDF_ALIASES(SDO_RDF_Alias(’’, ’http://spira.zoology.gla.ac.uk/terms/TCL/’)),
null));
• select TreeBASE treeids
select treeid, taxonid, name
from TABLE(SDO_RDF_MATCH(
’(?treeid rdf:type :treeid)
(?treeid :taxonid ?taxonid)
(?taxonid rdf:value ?name)
(?name rdf:type :taxon)’,
SDO_RDF_MODELS(’treebase’),
null,
194
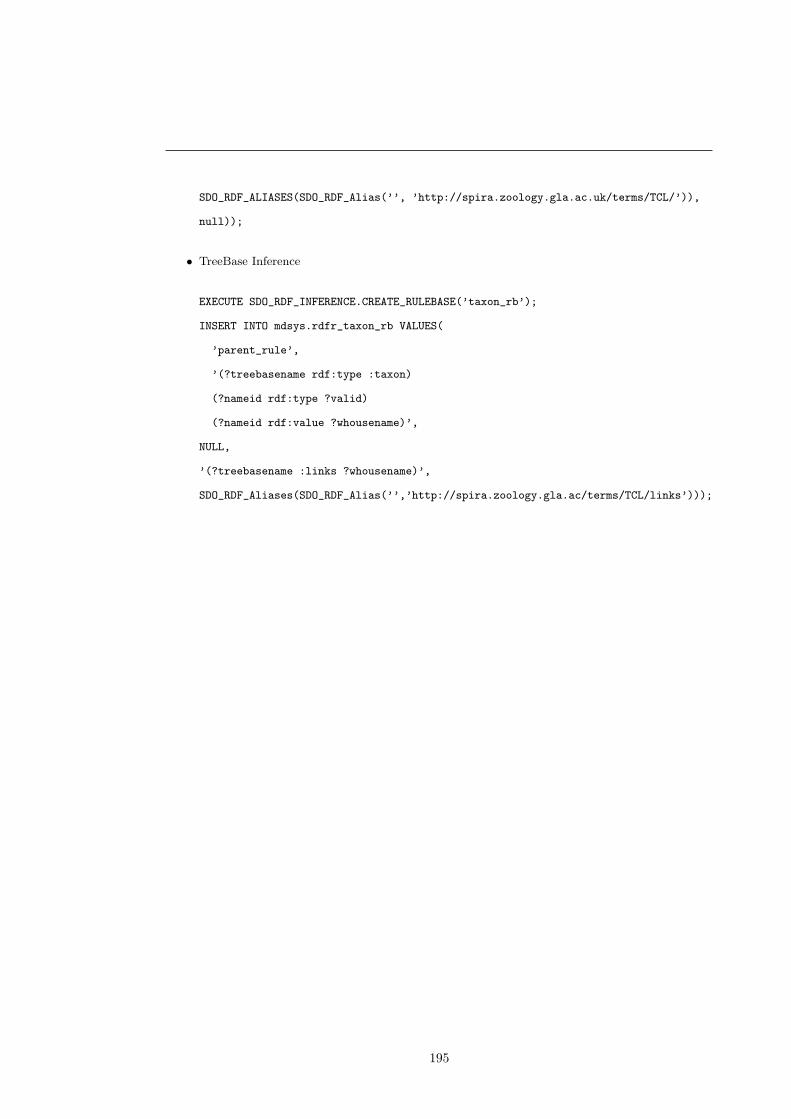
SDO_RDF_ALIASES(SDO_RDF_Alias(’’, ’http://spira.zoology.gla.ac.uk/terms/TCL/’)),
null));
• TreeBase Inference
EXECUTE SDO_RDF_INFERENCE.CREATE_RULEBASE(’taxon_rb’);
INSERT INTO mdsys.rdfr_taxon_rb VALUES(
’parent_rule’,
’(?treebasename rdf:type :taxon)
(?nameid rdf:type ?valid)
(?nameid rdf:value ?whousename)’,
NULL,
’(?treebasename :links ?whousename)’,
SDO_RDF_Aliases(SDO_RDF_Alias(’’,’http://spira.zoology.gla.ac/terms/TCL/links’)));
195
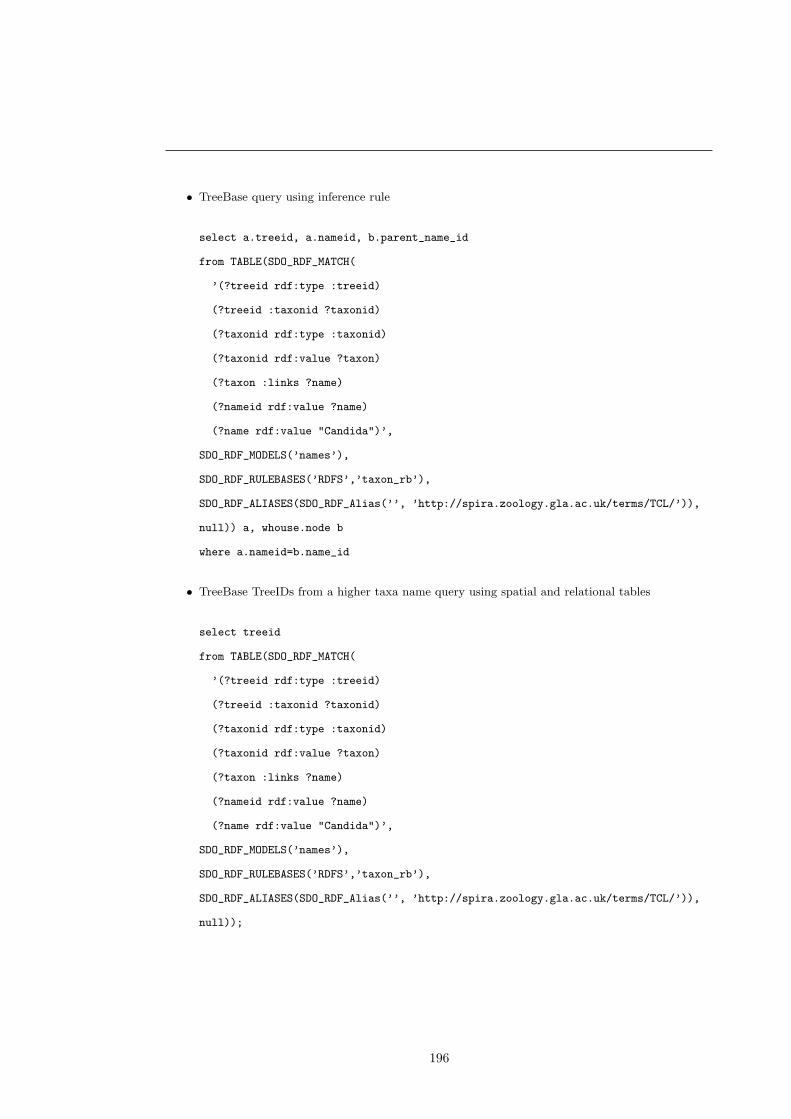
• TreeBase query using inference rule
select a.treeid, a.nameid, b.parent_name_id
from TABLE(SDO_RDF_MATCH(
’(?treeid rdf:type :treeid)
(?treeid :taxonid ?taxonid)
(?taxonid rdf:type :taxonid)
(?taxonid rdf:value ?taxon)
(?taxon :links ?name)
(?nameid rdf:value ?name)
(?name rdf:value "Candida")’,
SDO_RDF_MODELS(’names’),
SDO_RDF_RULEBASES(’RDFS’,’taxon_rb’),
SDO_RDF_ALIASES(SDO_RDF_Alias(’’, ’http://spira.zoology.gla.ac.uk/terms/TCL/’)),
null)) a, whouse.node b
where a.nameid=b.name_id
• TreeBase TreeIDs from a higher taxa name query using spatial and relational tables
select treeid
from TABLE(SDO_RDF_MATCH(
’(?treeid rdf:type :treeid)
(?treeid :taxonid ?taxonid)
(?taxonid rdf:type :taxonid)
(?taxonid rdf:value ?taxon)
(?taxon :links ?name)
(?nameid rdf:value ?name)
(?name rdf:value "Candida")’,
SDO_RDF_MODELS(’names’),
SDO_RDF_RULEBASES(’RDFS’,’taxon_rb’),
SDO_RDF_ALIASES(SDO_RDF_Alias(’’, ’http://spira.zoology.gla.ac.uk/terms/TCL/’)),
null));
196
References
Aguinaldo, A., Turbeville, J., Linford, L., Rivera, M., Garey, J., Raff, R. &
Lake, J. (1997). Evidence for a clade of nematodes, arthropods and other moulting animals.
Nature, 387, 489–493. 104
Alberga, C. (1967). String similarity and misspellings. Communications of the ACM , 10,
302–313. 107
Alexander, N., Lopez, X., Ravada, S., Stephens, S. & Wang, J. (2004). RDF Data
Model in Oracle. W3C Workshop on Semantic Web for Life Sciences. 186
Alroy, J. (2002). How many named species are valid? Proceedings of the National Academy
of Sciences, 99, 3706–3711. 28
Amann, B., Fundulaki, I. & Scholl, M. (2000). Integrating ontologies and thesauri for
RDF schema creation and metadata querying. International Journal on Digital Libraries, 3,
221–236. 169
Angles, R. & Gutierrez, C. (2008). Survey of graph database models. ACM New York,
NY, USA. 34, 35, 36
AOU, A.O.U. (1983). Check-list of north american birds.
http://members.aol.com/darwinpage/zoo/AOUcommittee.htm. 71
AOU, A.O.U. (1998). Check-list of north american birds.
http://members.aol.com/darwinpage/zoo/AOUcommittee.htm. 71
Beck, R., Bininda-Emonds, O., Cardillo, M., Liu, F. & Purvis, A. (2006). A higher-
level MRP supertree of placental mammals. BMC Evolutionary Biology , 6, 93. 5
197
REFERENCES
Beckett, D. et al. (2003). RDF/XML Syntax Specification (Revised). W3C Working Draft ,
23. 170, 187
Berendsohn, W. (1995). The Concept of “Potential Taxa” in Databases. Taxon, 44, 207–212.
22, 59
Berendsohn, W. (2003). MoReTax: handling factual information linked to taxonomic concepts
in biology . Federal Agency for Nature Conservation, Bonn, Germany. 24
Berners-Lee, T. (1998). Notation 3 (N3)–a readable RDF syntax. 170
Berners-Lee, T. (2006). Notation 3. The World Wide Web Consortium(W3C) MIT, INRIA,
http://www. w3. org/DesignIssues/Notation3. html. Design Suggestion. 190
Berners-Lee, T. & Hendler, J. (2001). Publishing on the semantic web. Nature, 410,
1023–1024. 168
Berners-Lee, T., Hendler, J. & Lassila, O. (2001a). The semantic Web. Scientific Amer-
ican, 284, 28–37. 40
Berners-Lee, T., Hendler, J. & Lassila, O. (2001b). The Semantic Web. Scientific Amer-
ican Magazine, 284, 34–43. 169
Bininda-Emonds, O. (2004). Phylogenetic Supertrees: Combining Information To Reveal The
Tree Of Life. Kluwer Academic Pub. 5
Bisby, F. & Smith, P. (2000). Species 2000: indexing the worlds known species, Project Plan
Version 3. www.Species2000.org. 18, 21, 23, 45, 67, 131, 132
Bisby, F., Shimura, J., Ruggiero, M., Edwards, J. & Haeuser, C. (2002). Taxonomy,
at the click of a mouse. Nature, 418, 367. 16, 18, 46
Bizer, C. (2003). D2R MAP, A Database to RDF Mapping Language. Proceedings of the 12th
International World Wide Web Conference, 20–24. 170
Borgen, L., Greuter, W., Hawksworth, D., Nicolson, D., Zimmer, B. & Commit-
tee, I. (1998). (88-95) Proposals to Implement Mandatory Registration of New Names.
Taxon, 47, 899–904. 16
198
REFERENCES
Bouchet, P. (1999). Recording and registration of new scientific names: a simulation of the
mechanism proposed (but not adopted) for the International Code of Zoological Nomencla-
ture. Bulletin of Zoological Nomenclature, 56, 6–15. 16
Bouzeghoub, M. & Lenzerini, M. (2001). Introduction to: data extraction, cleaning, and
reconciliation, Special issue. Information Systems, 26. 37
Broekstra, J., Kampman, A. & van Harmelen, F. (2002). Sesame: A Generic Archi-
tecture for Storing and Querying RDF and RDF Schema. The Semantic Web-ISWC , 2342,
54–68. 186
Buneman, P., Khanna, S. & Tan, W. (2000). Data Provenance: Some Basic Issues. Fst
Tcs 2000: Foundations of Software Technology and Theoretical Computer Science: 20th
Conference, New Delhi, India, December 13-15, 2000: Proceedings. 172
Cain, A. (1958). Logic and memory in Linnaeuss system of taxonomy. Proceedings of the
Linnaean Society of London, 169, 144–163. 3
Cain, A. (1959). The Post-Linnaean Development of Taxonomy.. printed by Adlard,
Bartholomew Press. 49
Calvanese, D., De Giacomo, G., Lenzerini, M., Nardi, D. & Rosati, R. (1999). A prin-
cipled approach to data integration and reconciliation in data warehousing. Proc. DMDW ,
99. 37
Celko, J. (2004). Joe Celko’s Trees and hierarchies in SQL for smarties. Morgan Kaufmann
Boston. 54, 61, 63, 98
Celko, J. & McDonald, J. (1995). Don’t warehouse dirty data. Datamation, 15, 42–52. 61
Chapman, A. (2005a). Principles and Methods of Data Cleaning. Report for Global Biodiversity
Information Facility, Copenhagen. 21, 45, 131, 132
Chapman, A. (2005b). Principles of Data Quality. Report for Global Biodiversity Information
Facility, Copenhagen. 45, 131, 132
Chaudhuri, S. & Dayal, U. (1997). An overview of data warehousing and OLAP technology.
ACM SIGMOD Record , 26, 65–74. 40
199
REFERENCES
Chavan, V., Rane, N., Watve, A. & Ruggiero, M. (2005). Resolving Taxonomic Discrep-
ancies: Role of electronic catalogues of known organisms. Biodiversity Informatics, 2, 70–78.
45, 132
Chinnici, R., Gudgin, M., Moreau, J., Schlimmer, J. & Weerawarana, S. (2004).
Web Services Description Language (WSDL) Version 2.0. W3C Working Draft , 26. 122
CIPRES (2006). Cyberinfrastructure for phylogenetic research.
http://www.phylo.org/sub sections/databases.htm. 4, 167
Clements, J. (2000). Birds of the world: A checklist: Ibis Publishing Company. Vista, Cali-
fornia, 270. 71, 135
Codd, E. (1970). A relational model of data for large shared data banks. Communications of
the ACM , 13, 377–387. 33
Cohen, W., Ravikumar, P. & Fienberg, S. (2003). A comparison of string distance metrics
for name-matching tasks. Proceedings of the IJCAI-2003 Workshop on Information Integra-
tion on the Web (IIWeb-03). 108, 115
Coues, E. (1866). Critical review of the Family Procellariidae. Part V. Embracing the
Diomedeinae and the Halodrominae. Proceedings of the Academy of Natural Sciences of
Philadelphia, 18, 172–197. 4
Cracraft, J. & Donoghue, M. (2004). Assembling the tree of life. Oxford University Press.
2, 5
Darie, C. & Brinzarea, B. (2006). AJAX and PHP: Building Responsive Web Applications.
Packt Publishing. 107, 115
de Queiroz, K. & Cantino, P. (2001). Taxon Names, Not Taxa, Are Defined. Taxon, 50,
821–826. 15
de Queiroz, K. & Gauthier, J. (1992). Phylogenetic Taxonomy. Annual Review of Ecology
and Systematics, 23, 449–480. 15
Deprez, T., Vanden Berghe, E. & Vincx, M. (2004). NeMys: a multidisciplinary biological
information system. Proceedings The colour of ocean datafit: international symposium on
oceanographic data and information management with special attention to biological data.
Brussels, Belgium. IOC Workshop Report (UNESCO, Paris), 188, 57–63. 46
200
REFERENCES
DeSalle, R., Giribet, G. & Wheeler, W. (2002). Techniques in Molecular Systematics
and Evolution. Birkhauser. 1
Dubois, A. (2003). The relationships between taxonomy and conservation biology in the cen-
tury of extinctions. Comptes rendus biologies, 326, 9–21. 12
Duhong, C., Gordon, B., Mukul, B. & David, F. (2008). PhyloFinder: An intelligent
search engine for phylogenetic tree databases. BMC Evolutionary Biology , 8. 168
Edwards, S.V., Jennings, W.B. & Shedlock, A.M. (2005). Phylogenetics of modern birds
in the era of genomics. Proc. R. Soc., 272, 979–992. 137
Ellson, J. (2006). WebDot Home Page. http://www. graphviz. org/webdot . 111
Embury, S., Brandt, S., Robinson, J., Sutherland, I., Bisby, F., Gray, W., Jones,
A. & White, R. (2001). Adapting integrity enforcement techniques for data reconciliation.
Information Systems, 26, 657–689. 45, 132
Emery, C. (2003). Taxonomy takes off online. Fronteirs In Ecology and the Environment , 1,
278–278. 16
EOL (2008). Encyclopaedia of life. www.eol.org . 161
Ereshefsky, M. (2001). Names, numbers and indentations: a guide to post-Linnaean taxon-
omy. Studies in History and Philosophy of Science Part C: Biological and Biomedical Sci-
ences, 32, 361–383. 14
Fast, K., Leise, F. & Steckel, M. (2002). All About Facets & Controlled Vocabularies.
Boxes & Arrows. 25, 49
Federhen et.al (2005). The national center for biotechnology information (ncbi) taxonomy
database. http://www.ncbi.nlm.nih.gov/Taxonomy/taxonomyhome.html . 17, 26, 46, 67, 79
Ferris, C. (2003). What are Web services? Communications of the ACM , 46. 122
Fox, C., Levitin, A. & Redman, T. (1994). The notion of data and its quality dimensions.
Information Processing and Management: an International Journal , 30, 9–19. 45, 131, 132
Franz, N. (2005). On the lack of good scientific reasons for the growing phylogeny/classification
gap. Cladistics, 21, 495–500. 14
201
REFERENCES
Franz, N. (2006). On the Use of Taxonomic Concepts in Support of Biodiversity Research
and Taxonomy. www.bio.unc.edu/faculty/peet/pubs/Cardiff.pdf . 22
Franz, N., Peet, R. & A.S., W. (2006). On the Use of Taxonomic Concepts in Support of
Biodiversity Research and Taxonomy. New Taxonomy Proceedings. 22
Froese, R., Capuli, E. & Ranola, M. (1990). Challenges to Taxonomic Information Man-
agement: How to Deal with Changes in Scientific Names. http://filaman.uni-kiel.de/ifm-
geomar/rfroese/scientific names.pdf . 13, 52
Garrity, G. & Lyons, C. (2003). Future-Proofing Biological Nomenclature. Omics A Journal
of Integrative Biology , 7, 31–33. 5
Gaston, K. (2000). Biodiversity: higher taxon richness. Progress in Physical Geography , 24,
117–127. 4
GBIF (2006). Global Biodiversity Information Facility. www.gbif.org/ . 17, 23
Gennick, J. (2006). SQL Pocket Guide, Hierarchical Queries pp 66-72 . O’Reilly. 98
Geoffroy, M. (2001). Relationships between taxonomic concepts and transmittability of
linked information. http://www.bgbm.fu-berlin.de/BioDivInf/Projects/MoreTax/ . 13, 107
Gewin, V. (2002). Taxonomy: All living things, online. Nature, 418, 362–363. 16, 46
Godfray, H. (2002). Challenges for taxonomy. Nature, 417, 17–19. 16
Godfray, H. (2007). The Web and the Structure of Taxonomy. Systematic Biology , 56, 943–
955. 132
Good, B. & Wilkinson, M. (2006). The Life Sciences Semantic Web is Full of Creeps!
Briefings in Bioinformatics, 7, 275. 169
Gradstein, S., Sauer, M., Braun, W., Koperski, M. & Ludwig, G. (2001). TaxLink, a
Program for Computer-Assisted Documentation of Different Circumscriptions of Biological
Taxa. Taxon, 50, 1075–1084. 22
Grant, E. (2004). Comparison and Visualisation of Taxonomic Hierarchies. University of
Glasgow, MA Thesis. 29
Greenwald, R., Stackowiak, R. & Stern, J. (1999). Oracle essentials. O&Reilly. 32, 33
202
REFERENCES
Greuter, W. et al. (1994). International code of botanical nomenclature. Koeltz Scientific
Books Konigstein, Germany. 10
Gudgin, M., Hadley, M., Mendelsohn, N., Moreau, J. & Nielsen, H. (2003). SOAP
Version 1.2 Part 1: Messaging Framework. 107
Hackett, S. (2003). Assembling the tree of life: Early bird.
http://www.fieldmuseum.org/research collections/zoology/zoo sites/early bird/ . 19, 93,
133
Hammond, T., Hannay, T. & Lund, B. (2004). The Role of RSS in Science Publishing.
D-Lib Magazine, 10, 1082–9873. 171
Harris, S. & Gibbins, N. (2003). 3store: Efficient Bulk RDF Storage. 186
Hebert, P., Stoeckle, M., Zemlak, T. & Francis, C. (2004). Identification of birds
through DNA barcodes. PLoS Biol , 2, 1657–1663. 135, 148
Hedges, S. & Sibley, C. (1994). Molecule vs. Morphology in Avian Evolution: The Case of
the ”Pelecaniform” Birds. PNAS , 91, 9861–9865. 4, 14
Heflin, J. & Hendler, J. (2001). A Portrait of the Semantic Web in Action. IEEE Computer
Society . 169
Hoon, S., Ratnapu, K.K., Chia, J.m., Kumarasamy, B., Juguang, X., Clamp, M.,
Stabenau, A., Potter, S., Clarke, L. & Stupka, E. (2003). Biopipe: A Flexible
Framework for Protocol-Based Bioinformatics Analysis. Genome Res., 13, 1904–1915. 122
Hoven, J. (1998). Data Warehousing: Bringing it All Together. Information Systems Manage-
ment , 15, 1–5. 40
ICZN, International Commission on Zoological Nomenclature and IUBS, Inter-
national Union of Biological Sciences (1999). International code of zoological nomen-
clature. International Trust for Zoological Nomenclature. 10
International Union of Biological Sciences (2006). Taxonomic databases working
group. www.nhm.ac.uk/hosted sites/tdwg/. 3
IPNI (2006). International plant names index. www.ipni.org . 17, 19
203
REFERENCES
ITIS (2006). Integrated Taxonomic Information System. www.itis.usda.gov . 17, 23, 45, 67, 71,
131, 132
Jeffrey, C. (1989). Biological nomenclature. Edward Arnold London. 3, 10, 13
Jepsen, T. (2001). SOAP cleans up interoperability problems on the Web. IT Professional , 3,
52–55. 122
J.J. Morony, J., Bock, W. & J. Farrand, J. (1975). Reference list to the birds of the
world.american museum of natural history. 71, 135
Jones, A., Xu, X., Pittas, N., Gray, W., Fiddian, N., White, R., Robinson, J., Bisby,
F. & Brandt, S. (2000). SPICE: A Flexible Architecture for Integrating Autonomous
Databases to Comprise a Distributed Catalogue of Life. Proceedings of the 11th International
Conference on Database and Expert Systems Applications, 981–992. 18
Karasavvas, K., Baldock, R. & Burger, A. (2004). Bioinformatics integration and agent
technology. Journal of Biomedical Informatics, 37, 205–219. 39
Kennedy, J. (2005). Taxonomic concept transfer schema.
http://tdwg.napier.ac.uk/index.php?pagename=VotingDraftIntroduction. 169
Kennedy, J., Kukla, R. & Paterson, T. (2005). Scientific names are ambiguous as identi-
fiers for biological taxa: their context and definition are required for accurate data integration.
Data Integration in the Life Sciences: Proceedings of the Second International Workshop, San
Diego, CA, USA, July 20 , 22, 80–95. 22
Knapp, S. (2000). What’s in a name? Nature, 408, 33. 5
Knapp, S., Polaszek, A. & Watson, M. (20077). Spreading the word. Nature, 446, 261–
262. 16
Knox, E. (1998). The use of hierarchies as organizational models in systematics. Biological
Journal of the Linnean Society , 63, 1–49. 14, 15
Koutsoos, E., North, S. et al. (1996). Drawing graphs with dot. Technicalreport,
AT&TBellLaboratories, November . 111
Lapage, S. (1992). International Code of Nomenclature of Bacteria: Bacteriological code: 1990
revision.... ASM Press. 10
204
REFERENCES
Leary, P., Remsen, D., Norton, C., Patterson, D. & Sarkar, I. (2007). uBioRSS:
Tracking taxonomic literature using RSS. Bioinformatics, 23, 1434. 171
Lenzerini, M. (2002). Data integration: a theoretical perspective. Proceedings of the twenty-
first ACM SIGMOD-SIGACT-SIGART symposium on Principles of database systems, 233–
246. 37
Lughadha, E. (2004). Towards a working list of all known plant species. Philosophical Trans-
actions of the Royal Society of London. Series B, Biological Sciences, 359, 681–687. 20
Mackey, A. (2002). Relational Modeling of Biological Data: Trees and Graphs.
www.oreillynet.com/pub/a/network/2002/11/27/bioconf.html . 58
Mallet, J. & Willmott, K. (2003). Taxonomy: renaissance or Tower of Babel. Trends Ecol.
Evol , 18, 57–59. 14, 135
Mayr, E. (1998). Two empires or three? Proc Natl Acad Sci US A, 95, 9720–9723. 3
Miranker, D., Bafna, S. & Humphries, J. (2008). Schema Driven Assignment and Imple-
mentation of Life Science Identifiers (LSIDs). 167
Monroe, B. & Sibley, C. (1997). A World Checklist of Birds. Yale University Press. 5, 16,
71, 135
Moore, G. (2003). Should Taxon Names Be Explicitly Defined? The Botanical Review , 69,
2–21. 15
Morell, V. (1996). TreeBASE: the roots of phylogeny. Science, 273, 569–0. 2, 5, 7, 24, 118,
149
Murray, C. (2005). Oracle Spatial Resource Description Framework (RDF), 10g Release 2
(10.2). Oracle.com. 186
MySQL, A. (2006). MySQL Database Server. http://www. mysql. com. 54
Nakhleh, L., Miranker, D. & Barbancon, F. (2003). Requirements of phylogenetic
databases. Bioinformatics and Bioengineering, 2003. Proceedings. Third IEEE Symposium
on, 141–148. 2
Navarro, G. (2001). A guided tour to approximate string matching. ACM Computing Surveys
(CSUR), 33, 31–88. 107, 140
205
REFERENCES
Navathe, S., Sashidhar, T. & Elmasri, R. (1984). Relationship Merging in Schema Inte-
gration. Proceedings of the Tenth International Conference on Very Large Data Bases, 78–90.
42
Nichol, S. (2004). Programming with NuSOAP. 123
Nilsson, R., Kristiansson, E., Ryberg, M. & Larsson, K. (2005). Approaching the
taxonomic affiliation of unidentified sequences in public databases an example from the my-
corrhizal fungi. BMC Bioinformatics, 2005, 178. 144
Nixon, K. (2000). On the OtherPhylogenetic Systematics. Cladistics, 16, 298–318. 15
Nunn, C., Altizer, S., Jones, K. & Sechrest, W. (2003). Comparative Tests of Parasite
Species Richness in Primates. American Naturalist , 162, 597–614. 5
O’Kane, K. & Lockner, M.J. (2004). Indexing genomic sequence libraries. Information
Processing and Management , 41, 265–274. 32
O’Kane, K.C. (2006). MDH: The Multi-Dimensional and Hierarchical Database Toolkit Pro-
grammer’s Guide . 31
Oracle (2006). Oracle 10g: Database. Oracle Corporation, Redwood Shores, CA. 54
Page, R. (2002). Tangled Trees: Phylogeny, Cospeciation, and Coevolution. University of
Chicago Press Chicago, USA. 4
Page, R. (2005). A Taxonomic Search Engine: Federating taxonomic databases using web
services. BMC Bioinformatics, 6, 48–48. 45, 46, 53
Page, R. (2007). TBMap: A taxonomic perspective on the phylogenetic database TreeBASE.
BMC Bioinformatics, 8, 158. 163, 169
Page, R. (2008). Biodiversity informatics: the challenge of linking data and the role of shared
identifiers. Nature Publishing Group. 169
Patterson, D., Remsen, D. & Norton, C. (2003). Comment on Zoological Record and
registration of new names in zoology. Bull. Zool. Nomencl , 60, 297–299. 16
Patterson, D., Remsen, D., Marino, W. & Norton, C. (2006). Taxonomic IndexingEx-
tending the Role of Taxonomy. Systematic Biology , 55, 367–373. 20, 131
206
REFERENCES
Peters, J. (1987). Checklist of birds of the world.
http://worldbirdinfo.net/peters family list.htm. 71, 135
Petsko, G. (2002). What’s in a name? Genome Biol , 3, 1–1005. 5
Pfeifer, U., Poersch, T. & Fuhr, N. (1995). Searching proper names in databases. Hy-
pertext— Information Retrieval— Multimedia, Proceedings HIM , 95, 259–275. 107
Pfeifer, U., Poersch, T. & Fuhr, N. (1996). Retrieval Effectiveness of Proper Name Search
Methods. Information Processing and Management , 32, 667–679. 107
Polaszek, A. (2005). A universal register for animal names. Nature, 437, 477. 131
Prudhommeaux, E. & Seaborne, A. (2004). SPARQL Query Language for RDF. World
Wide Web Consortium. 192
Pullan, M., Watson, M., Kennedy, J., Raguenaud, C. & Hyam, R. (2000). The
Prometheus Taxonomic Model: A Practical Approach to Representing Multiple Classifi-
cations. Taxon, 49, 55–75. 24, 175
Pyle, R. (2004). Taxonomer: a relational data model for managing information relevant to
taxonomic research. PhyloInformatics, 1, 1–54. 17, 19, 59
Remsen, D., Norton, C. & Patterson, D. (2006). Taxonomic Informatics Tools for the
Electronic Nomenclator Zoologicus. The Biological Bulletin, 210, 18. 131
Resnik, P. (1995). Using information content to evaluate semantic similarity in a taxonomy.
Proceedings of the 14th International Joint Conference on Artificial Intelligence, 1, 448–453.
168
Rothschild, L. (1989). Protozoa, protista, protoctista: What’s in a name? Journal of the
History of Biology , 22, 277–305. 27
Saaed, A., Stocker, A., Hoefler, P. & Tochtermann, K. (2008).
Learning with the Web 2.0: The Encyclopedia of Life. http://telearn.noe-
kaleidoscope.org/warehouse/128 Final Paper (001664v1).pdf. 170
Saarenmaa, H. (1999). The Global Biodiversity Information Facility: Architectural and im-
plementation issues. European Environment Agency, Technical Reports, 34, 34. 3, 21
207
REFERENCES
Sahoo, S., Bodenreider, O., Zeng, K. & Sheth, A. (2007). An experiment in integrating
large biomedical knowledge resources with RDF: Application to associating genotype and
phenotype information. workshop on Health Care and Life Sciences Data Integration for the
Semantic Web at the 16th International World Wide Web Conference (WWW2007). 171
Saleem, K., Bellahsene, Z. & Hunt, E. (2008). PORSCHE: Performance ORiented
SCHEma mediation. Information Systems. 42
Schuh, R. (2003). The Linnaean System and Its 250-Year Persistence. The Botanical Review ,
69, 59–78. 15
Scoble, M. (2004). Unitary or unified taxonomy? Philosophical Transactions: Biological
Sciences, 359, 699–710. 3
Scotland, R. & Pennington, T. (2000). Homology and Systematics: Coding Characters for
Phylogenetic Analysis. CRC Press. 1
Seaborne, A. (2004). RDQL-A Query Language for RDF. W3C Member Submission, 9. 192
SEEK (2006). Partnership for biodiversity informatics. http://seek.ecoinformatics.org/ . 22
Shannon, P., Reiss, D., Bonneau, R. & Baliga, N. (2006). The Gaggle: an open-source
software system for integrating bioinformatics software and data sources. BMC Bioinformat-
ics, 7, 176. 122
Sibley, C. & Ahlquist, J. (1990). Phylogeny and Classification of Birds. Yale University
Press, New Haven, Conn. 137
Silberschatz, A., Korth, H. & Sudarshan, S. (1996). Data models. ACM Computing
Surveys (CSUR), 28, 105–108. 33
Singhal, A. (2001). Modern Information Retrieval: A Brief Overview. IEEE Data Engineering
Bulletin, 24, 35–43. 115
Soberon, J. & Peterson, T. (2004). Biodiversity informatics: managing and applying pri-
mary biodiversity data. Philosophical Transactions: Biological Sciences, 359, 689–698. 3
Stein, B. & Wieczorek, J. (2004). Mammals of the world: MaNIS as an example of data
integration in a distributed network environment. Biodiversity Informatics, 1, 14–22. 132
208
REFERENCES
Stevens, R., Bodenreider, O. & Lussier, Y. (2006). Semantic Webs for Life Sciences. In
Pacific Symposium on Biocomputing 2006 , 112–115, World Scientific Publishing Co. 169
Strickland, J., Uhrowczik, P. & Watts, V. (1982). IMS/VS: An Evolving System. IBM
Systems Journal , 21, 490–510. 31
Stuessy, T. (2001). Taxon Names Are Still Not Defined. Taxon, 50, 185–186. 15
Taylor, R. & Frank, R. (1976). CODASYL Data-Base Management Systems. ACM Com-
puting Surveys (CSUR), 8, 67–103. 32
Thiele, K. & Yeates, D. (2002). Tension arises from duality at the heart of taxonomy.
Nature, 419, 337. 3, 12
Thomas, G., Wills, M. & Szekely, T. (2004). A supertree approach to shorebird phylogeny.
BMC Evol Biol , 4, 28. 5, 132
Thorne, J. (2003). Zoological Record and registration of new names in zoology. Bulletin of
Zoological Nomenclature, 60, 7–11. 16
Tropashko, V. (2002). Trees in SQL: Nested Sets and Materialized Path.
www.dbazine.com/tropashko4.shtml . 55
Tsenov, M. (2004). Soap/XML method used for data exchange between distributed databases.
Intelligent Systems, 2004. Proceedings. 2004 2nd International IEEE Conference, 3. 123
uBio (2006). Universal biological indexer and organizer. www.ubio.org . 21, 23, 45, 131, 132
Ullman, J., Garcia-Molina, H. & Widom, J. (2001). Database Systems: The Complete
Book . Prentice Hall PTR Upper Saddle River, NJ, USA. 53
USDA, A. (2000). National Genetic Resources Program. Germplasm Resources Information
Network-(GRIN).[Online Database] National Germplasm Resources Laboratory, Beltsville,
Maryland. MD . 67, 85
W.3.C. (2006). Semantic web stack. http://www.w3.org/2007/03/layerCake.png/. 169
Wang, Y., Diane, M. & Guarascio, L. (1995). Beyond Accuracy: What Data Quality
Means to Data Consumers. International Financial Services Research Center, Sloan School
of Management, Massachusetts Institute of Technology. 45, 132
209

REFERENCES
Wheeler, D., Barrett, T., Benson, D., Bryant, S., Canese, K., Chetvernin, V.,
Church, D., DiCuccio, M., Edgar, R., Federhen, S. et al. (2007). Database resources
of the National Center for Biotechnology Information. Nucleic Acids Research, 35, D5. 2, 26
Whittaker, R. (1959). On the Broad Classification of Organisms. The Quarterly Review of
Biology , 34, 210–226. 99
Widom, J. (1995). Research problems in data warehousing. Proceedings of the fourth interna-
tional conference on Information and knowledge management , 25–30. 41
Wilkinson, K., Sayers, C., Kuno, H. & Reynolds, D. (2003). Efficient RDF Storage and
Retrieval in Jena2. Proceedings of SWDB , 3, 7–8. 186
Williams, N. (1997). How to get databases talking the same language. Science, 275, 301–2.
169
Wilson, D. & Reeder, D. (1993). Mammal Species of the World: A Taxonomic and Geo-
graphic Reference. Smithsonian Institution Press. 5, 19, 67
Wilson, E. (2003). The encyclopedia of life. Trends in Ecology and Evolution, 18, 77–80. 3,
16, 170
Winer, D. et al. (1999). XML-RPC Specification. www.xmlrpc.com/spec, 15, 7. 107
Woese, C. (2004). Default taxonomy: Ernst Mayr’s view of the microbial world. Int J Syst
Evol Microbiol , 54, 279–281. 99
Wu, S. & Manber, U. (1992). AGREP-a fast approximate pattern-matching tool. Proceedings
of the USENIX Winter 1992 Technical Conference, 153–162. 103, 108, 140
Zend Technologies (2006). PHP, PHP: Hypertext Processor. 107
Zhong, Y., Jung, S., Pramanik, S. & Beaman, J. (1996). Data Model and Comparison
and Query Methods for Interacting Classifications in a Taxonomic Database. Taxon, 45,
223–241. 104
Zhong, Y., Luo, Y., Pramanik, S. & Beaman, J. (1999). HICLAS: a taxonomic database
system for displaying and comparing biological classification and phylogenetic trees. Bioin-
formatics, 15, 149–156. 104
210
REFERENCES
Zobal, J. & Dart, P. (1996). Phonetic string matching: Lessons from information retrieval.
Proceedings of the 19th annual international ACM SIGIR. 142
Zusi, R., Wood, D. & Jenkinson, M. (1982). Remarks on a World-Wide Inventory of Avian
Anatomical Specimens. The Auk , 99, 740–757. 1
211


![Untitled-1 [] · taxonomic characters. Zoological Nomenclature, origin of code, ICZN. UNIT V : Taxonomic Records And Publications Taxonomic keys, Taxonomic characters description,](https://img.pdfslide.net/doc/110x75/5e60819b810ee55ab507dd7d/untitled-1-taxonomic-characters-zoological-nomenclature-origin-of-code-iczn.jpg)