Embed Size (px)
Citation preview
This PDF document was made available from www.rand.org as a public
service of the RAND Corporation.
6Jump down to document
Visit RAND at www.rand.org
Explore RAND Education
View document details
This document and trademark(s) contained herein are protected by law as indicated in a notice appearing later in this work. This electronic representation of RAND intellectual property is provided for non-commercial use only. Permission is required from RAND to reproduce, or reuse in another form, any of our research documents for commercial use.
Limited Electronic Distribution Rights
For More Information
CHILDREN AND ADOLESCENTS
CIVIL JUSTICE
EDUCATION
ENERGY AND ENVIRONMENT
HEALTH AND HEALTH CARE
INTERNATIONAL AFFAIRS
POPULATION AND AGING
PUBLIC SAFETY
SCIENCE AND TECHNOLOGY
SUBSTANCE ABUSE
TERRORISM AND HOMELAND SECURITY
TRANSPORTATION ANDINFRASTRUCTURE
U.S. NATIONAL SECURITY
The RAND Corporation is a nonprofit research organization providing objective analysis and effective solutions that address the challenges facing the public and private sectors around the world.
Browse Books & Publications
Make a charitable contribution
Support RAND

This product is part of the RAND Corporation technical report series. Reports may
include research findings on a specific topic that is limited in scope; present discus-
sions of the methodology employed in research; provide literature reviews, survey
instruments, modeling exercises, guidelines for practitioners and research profes-
sionals, and supporting documentation; or deliver preliminary findings. All RAND
reports undergo rigorous peer review to ensure that they meet high standards for re-
search quality and objectivity.
A Review of the Research Literature onTeacher Recruitment and RetentionCASSANDRA GUARINO, LUCRECIA SANTIBAÑEZ,
GLENN DALEY, DOMINIC BREWER
TR-164-EDU
May 2004
Prepared for the Education Commission of the States

The RAND Corporation is a nonprofit research organization providing objective analysisand effective solutions that address the challenges facing the public and private sectorsaround the world. RAND’s publications do not necessarily reflect the opinions of its researchclients and sponsors.
R® is a registered trademark.
© Copyright 2004 RAND Corporation
All rights reserved. No part of this book may be reproduced in any form by any electronic ormechanical means (including photocopying, recording, or information storage and retrieval)without permission in writing from RAND.
Published 2004 by the RAND Corporation1700 Main Street, P.O. Box 2138, Santa Monica, CA 90407-2138
1200 South Hayes Street, Arlington, VA 22202-5050201 North Craig Street, Suite 202, Pittsburgh, PA 15213-1516
RAND URL: http://www.rand.org/To order RAND documents or to obtain additional information, contact
Distribution Services: Telephone: (310) 451-7002; Fax: (310) 451-6915; Email: [email protected]
The research described in this report was prepared for the Education Commission of the States.
iii
PREFACE
This literature review represents a comprehensive and critical examination of research published
since 1980 on the topic of teacher recruitment and retention in the United States. It is designed to provide
a broad understanding of the patterns governing the entry and exit of individuals into and from teaching
and the evidence regarding the types of policies that affect teacher recruitment and retention. We
included only published research that was empirical in nature and deemed to be of sufficiently rigorous
quality to be considered reliably informative.
This review should be of interest to policymakers, educators, researchers, and the general public.
This study was sponsored by the Education Commission of the States.

v
THE RAND CORPORATION QUALITY ASSURANCE PROCESS
Peer review is an integral part of all RAND research projects. Prior to publication, this document,
as with all documents in the RAND technical report series, was subject to a quality assurance process to
ensure that the research meets several standards, including the following: The problem is well
formulated; the research approach is well designed and well executed; the data and assumptions are
sound; the findings are useful and advance knowledge; the implications and recommendations follow
logically from the findings and are explained thoroughly; the documentation is accurate, understandable,
cogent, and temperate in tone; the research demonstrates understanding of related previous studies; and
the research is relevant, objective, independent, and balanced. Peer review is conducted by research
professionals who were not members of the project team.
RAND routinely reviews and refines its quality assurance process and also conducts periodic
external and internal reviews of the quality of its body of work. For additional details regarding the
RAND quality assurance process, visit http://www.rand.org/standards/.

vii
TABLE OF CONTENTS
PREFACE................................................................................................................................................................... iii The RAND Corporation Quality Assurance Process.............................................................................................v EXECUTIVE SUMMARY .........................................................................................................................................ix ACKNOWLEDGMENTS....................................................................................................................................... xiii CHAPTER I: INTRODUCTION...............................................................................................................................1 CHAPTER II: A CONCEPTUAL FRAMEWORK FOR SYNTHESIZING THE LITERATURE ON
TEACHER RECRUITMENT AND RETENTION........................................................................................3 II.1. Supply and Demand in the Teacher Labor Market ............................................................................3 II.2. The Relationship of Teacher Quality to the Supply and Demand Framework ..............................5
CHAPTER III: METHODOLOGY ...........................................................................................................................9 III.1. Criteria for the Selection of Research Included in the Review.........................................................9 III.2. Elaboration of Quality Criteria for Selection....................................................................................10
Specific Quality Criteria for Quantitative Research .......................................................................10 Specific Quality Criteria for Qualitative Research..........................................................................12
III.3. Search Strategy and Results................................................................................................................13 III.4. Structure of the Literature Review ....................................................................................................14 III.5. Caveats ..................................................................................................................................................15
CHAPTER IV: THE CHARACTERISTICS OF INDIVIDUALS WHO ENTER AND LEAVE TEACHING 17 IV.1. Individuals Who Enter Teaching.......................................................................................................17 What the Literature Says...............................................................................................................................18
Gender ..................................................................................................................................................18 Race/Ethnicity.....................................................................................................................................19 Ability ...................................................................................................................................................21 Psychological Factors..........................................................................................................................23 Reentrants to Teaching .......................................................................................................................25
Summary.........................................................................................................................................................27 IV.2. Individuals Who Remain in Teaching ..............................................................................................27 What the Literature Says...............................................................................................................................28
Teaching Versus Other Occupations ................................................................................................28 Age and Experience ............................................................................................................................29 Gender, Family Characteristics, and Socioeconomic Status..........................................................31 Race/Ethnicity.....................................................................................................................................33 Ability, Field, and Qualifications ......................................................................................................33 Psychological Predictors.....................................................................................................................38
Summary.........................................................................................................................................................39 CHAPTER V: THE EXTERNAL CHARACTERISTICS OF DISTRICTS AND SCHOOLS THAT
SUCCESSFULLY RECRUIT AND RETAIN TEACHERS.........................................................................41 What the Literature Says...............................................................................................................................41 Summary.........................................................................................................................................................45
CHAPTER VI: POLICIES TO PROMOTE RECRUITMENT AND RETENTION ...........................................47 VI.1. Compensation Policies ........................................................................................................................47
viii
What the Literature Says...............................................................................................................................48 Summary.........................................................................................................................................................54 VI.2. Pre-service Policies ..............................................................................................................................55 What the Literature Says...............................................................................................................................55 Summary.........................................................................................................................................................58 VI.3. In-service Policies.................................................................................................................................59 What the Literature Says...............................................................................................................................59 Summary.........................................................................................................................................................61
CHAPTER VII: SUMMARY, CONCLUSIONS, AND SUGGESTIONS FOR FUTURE RESEARCH ...........63 VII.1. Summary of the Research Findings .................................................................................................63 VII.2. Conclusions .........................................................................................................................................64 VII.3. What Is Needed for Future Research...............................................................................................65
REFERENCES OF REVIEWED STUDIES..............................................................................................................69 OTHER REFERENCES.............................................................................................................................................75 APPENDIX: Summaries of Reviewed Research Studies....................................................................................77
ix
EXECUTIVE SUMMARY
This literature review provides a summary and critical evaluation of the research on the topic of
teacher recruitment and retention. It focuses on empirical studies that were published between 1980 and
the end of 2003. As a means of organizing the large body of research relating to this broad topic, we
grouped the studies into the following categories: (1) studies that examined the characteristics of
individuals who enter teaching, (2) studies that focused on the characteristics of individuals who remain
in teaching, (3) studies that investigated the external characteristics of districts and schools that affect
recruitment and retention, (4) studies of compensation policies that affected recruitment and retention, (5)
studies of pre-service policies that affected recruitment and retention, and (6) studies of in-service policies
that affected recruitment and retention.
The reviewed research offered several consistent findings. The strongest set of results were those
relating to the influence of various factors on attrition due to the widespread availability of longitudinal
datasets that track the employment of teachers. Below, we summarize the findings that emerged in the
research literature.
(1) The results that arose fairly consistently in research regarding the characteristics of individuals
who enter the teaching profession were as follows:
• Females formed greater proportions of new teachers than males.
• Whites formed greater proportions of new teachers than minorities.
• College graduates with higher measured ability were less likely to enter teaching than other
college graduates. It is possible, however, that these differences may be driven by the
measured ability of elementary school teachers, who represent the majority of teachers.
• Reentrants to teaching formed a significant proportion of newly hired teachers in the 1980s.
Science and math teachers were less likely to return than other teachers, whereas elementary
teachers and teachers with more prior experience were more likely to return.
• A more tentative finding based on a small number of weaker studies is that an altruistic
desire to serve society is one of the primary motivations for pursuing teaching.
(2) There were several findings that emerged with a strong degree of consistency in research
regarding the characteristics of individuals who leave the teaching profession. They were as follows:
• The highest attrition rates seen for teachers occurred in their first years of teaching and after
many years of teaching when they were near retirement, thus producing a U-shaped pattern
of attrition with respect to age or experience.
• Minority teachers tended to have lower attrition rates than white teachers.
• Teachers in the fields of science and mathematics were more likely to leave teaching than
teachers in other fields.
• Teachers with higher measured ability were more likely to leave teaching.
• Female teachers typically had higher attrition rates than male teachers.
• Family-related situations, such as marriage and children, were related to higher teacher
attrition, particularly for women, although the data supporting these hypotheses are old.
(3) Regarding the external characteristics of schools and districts that are related to teacher
• Schools with higher proportions of minority students, students in poverty, and low-
performing students tended to have higher attrition rates.
• In most studies, urban school districts had higher attrition rates than suburban and rural
districts.
• Teacher retention was generally found to be higher in public schools than in private schools.
(4) The following statements summarize the consistent research findings regarding compensation
policies and their relationship to teacher retention:
• Higher salaries were associated with lower teacher attrition.
• Teachers were responsive to salaries outside their districts and outside of teaching.
• When asked their reasons for leaving teaching, teachers often cited low salaries as an
important reason for job dissatisfaction.
(5) The studies we reviewed revealed the following findings regarding pre-service policies and
teacher recruitment and retention:
• Nontraditional and alternative teacher education programs appeared to attract more diverse
student populations, and their graduates appeared to have higher rates of entry into and
retention in teaching than graduates of traditional programs.
• Minority representation in teaching appeared to be adversely affected by teacher-testing
requirements.
(6) Findings from the research on in-service policies that affect teacher retention were as follows:
• Schools that provided mentoring and induction programs, particularly those related to
collegial support, had lower rates of turnover among beginning teachers.
• Schools that provided teachers with more autonomy and administrative support had lower
levels of teacher attrition and migration.
• Schools with fewer disciplinary problems or those that gave teachers discretion over setting
disciplinary policies had lower levels of teacher attrition and dissatisfaction.
• In at least two states (Texas and New York), larger class sizes were associated with higher
teacher attrition rates.
The entry, mobility, and attrition patterns summarized above indicate that teachers exhibit
preferences for higher salaries, better working conditions, and greater intrinsic rewards and will tend to
move to other teaching positions or jobs or activities outside of teaching that offer these characteristics
x
recruitment and retention rates, the research provided the following fairly consistent findings:
xi
when possible. In particular, the finding that higher compensation is associated with increased retention
is well established.
It is evident that urban schools and schools with high percentages of minority students are difficult
to staff, and that teachers tend to leave these schools when more attractive opportunities present
themselves. It is also evident, however, that factors that can be altered through policy can have an impact
on the decisions of individuals to enter teaching and on teachers’ decisions to migrate to other schools or
quit teaching. The research findings support the notion that individual schools and districts can affect
their attractiveness to current and prospective teachers relative to other opportunities available to these
individuals. The research also offers information on the effectiveness of a number of different options in
the areas of compensation, pre-service policies, and in-service policies, although rigorous research
evaluating the latter two types of policies is relatively scarce.
Although reliable ongoing information on the labor market for teachers is vital to monitoring
trends and averting movements toward a shortage in a productive and preemptive manner, our literature
review highlights the absence of recent data on key indicators and the need for increased and improved
data collection efforts. In particular, there is a noticeable lack of rigorous policy evaluation research. In
addition to updated and more complete national and state data on the movements of teachers, more
reliable data tied to specific policy interventions are needed. While the education literature abounds with
articles and reports describing or advocating particular policies, very few of them contain empirical data
and analysis, and even fewer contain analysis conducted in accordance with rigorous research quality
standards. We believe that policy goals at every institutional level—school, district, state, and federal
government—would be well served by committing the resources needed to ensure rigorous evaluations
whenever new policies are put in place. In the end, this will be a cost-effective means of answering many
questions currently unanswered in the research literature. Researchers have, for the most part, been
fairly thorough in investigating issues relating to recruitment and retention when data are available.
Answering the pressing questions regarding the recruitment and retention of effective teachers will
require new quantitative and qualitative research based on improved data collection efforts, the further
application of theoretical and methodological rigor to the study of teacher labor markets, the further
subjection of theory to empirical testing at the state and local labor-market level, and a commitment on
the part of policymakers at all levels to provide support for useful evaluation research when new policies
are implemented.

xiii
ACKNOWLEDGMENTS
The authors wish to thank the Education Commission of the States for sponsoring this literature
review and, in particular, Michael Allen, whose continued support and helpful comments were of great
assistance. In addition, thanks go to Sheila Kirby and four anonymous outside reviewers for their very
helpful comments. Shelley Wiseman and Nancy Del Favero provided editorial assistance, and
Christopher Dirks and Sharon Koga provided clerical support.

1
CHAPTER I: INTRODUCTION
It is the goal of the elementary and secondary public school system in the United States to provide
a high-quality education to every student. To do so requires an adequate supply of competent
individuals who are willing and able to serve as teachers. Districts and schools—the entities that employ
teachers—are constantly engaged in activities relating to the recruitment and retention of their
instructional staff. In the face of a growing school-aged population, schools and districts must struggle to
maintain standards for teaching quality while continuously recruiting bright new teachers and seeking to
retain their most effective existing teachers.
The dual goals of recruiting and retaining effective teachers are often difficult to realize due to
insufficient and sometimes dwindling resources. Current U.S. economic conditions are causing many
states to roll back their expenditures on public education. Although the 2001 reauthorization of the
Elementary and Secondary Education Act (the No Child Left Behind Act) authorized $3.175 billion in
federal funds to be appropriated for the training and recruitment of high-quality teachers across the
nation, those who dispense federal, state, and local funds to education will be hard pressed to find
programs that raise the quality of teaching in the most cost-effective manner.
It is, therefore, of particular importance at this point in time that we turn to reliable empirical
research to inform the policy community of the advantages and shortcomings of various policies to
recruit and retain effective teachers. In June 2002, the Education Commission of the States commissioned
the RAND Corporation to undertake a review of the research literature on teacher recruitment and
retention. The intent of the proposed literature review is to assemble and discuss the published evidence
that helps answer the following question: What strategies promote the recruitment and retention of
effective teachers?
In order to develop our understanding of the context within which policies affecting the supply of
teachers are formed, this broad question was broken down into four main sub-questions:
• What are the characteristics of individuals who enter the teaching profession?
• What are the characteristics of individuals who remain in teaching?
• What are the characteristics of schools and districts that successfully recruit and retain
effective teachers?
• What types of policies show evidence of efficacy in recruiting and retaining effective
teachers?
Our review answers questions that are somewhat broader than those listed above for the following
reason: Although there are many studies that focus on the recruitment and retention of teachers, few
focus on the recruitment and retention of effective teachers. We, therefore, review the broader empirical
literature that deals with teacher recruitment and retention and do not restrict ourselves solely to the
2
small number of studies that focus on the recruitment and retention of effective teachers. We discuss the
issue of teacher quality in a conceptual framework in Chapter II, however, and make an effort to tie the
broader literature to this issue wherever possible throughout our review.
The goal of this report is to provide researchers and policymakers with a review of the research
relating to teacher recruitment and retention that is both comprehensive and evaluative. Thus, our
review of the empirical studies selected for discussion is intended to serve not only as a compendium of
available research on the topic of teacher recruitment and retention but also as a guide to the merit and
importance of these studies.
The review is structured as follows: Chapter II presents a conceptual framework that outlines the
factors influencing supply and demand in the teacher labor market. Chapter III describes our
methodology for selecting and evaluating research for review. Chapters IV through VI contain our
review of the literature pertaining to the four questions listed above, and Chapter VII presents our
summary, conclusions, and suggestions for future research. The appendix is a matrix containing detailed
summaries and critiques of all studies reviewed in this document.
3
CHAPTER II: A CONCEPTUAL FRAMEWORK FOR SYNTHESIZING THE LITERATURE ON TEACHER RECRUITMENT AND RETENTION
II.1. Supply and Demand in the Teacher Labor Market
Teacher recruitment and retention are two aspects of the overall labor market for teachers. From
the standpoint of the districts and schools that hire teachers, recruitment and retention policies have a
direct impact on their ability to fill their desired numbers of teaching slots. From the standpoint of
teachers or prospective teachers, these policies together with current market conditions have a direct
impact on their decisions to enter or remain in teaching.
Using terminology borrowed from economic labor market theory, we define the demand for
teachers as the number of teaching positions offered at a given level of overall compensation and the
supply of teachers as the number of qualified individuals willing to teach at a given level of overall
compensation. By overall compensation, we mean not only salaries (including bonuses, other forms of
monetary compensation, and expected future earnings) and benefits but also any other type of reward
derived from teaching that can be encompassed under the heading of “working conditions” or “personal
satisfaction.” Under these definitions, the prevailing or negotiated levels of salaries, benefits, and
working conditions in a given school district will determine the number of teachers the district will be
willing to employ and the number of qualified teachers who will be willing to teach. These principles of
supply and demand and the factors that influence them provide a logical framework within which
policies relating to recruitment and retention can be investigated, understood, and evaluated.
The basic principle driving the supply of teachers is the following: Individuals will become or
remain teachers if teaching represents the most attractive activity to pursue among all those activities
available to them. By attractive, we mean desirable in terms of ease of entry and overall compensation
(salary, benefits, working conditions, and personal satisfaction). These elements of attractiveness are the
policy levers that can be manipulated at the school, district, or state levels in order to bring supply in line
with demand.
The demand for teachers is driven by student enrollments, class-size targets, teaching load norms,
and budgetary constraints. Within the parameters set by demographics and district or school policies, the
number of teachers that a district is willing to employ in a given year varies inversely with the cost, in
terms of salaries and benefits, of employing them. Well designed recruitment and retention strategies can
assist a district or school in achieving its educational goals while meeting budgetary constraints.
Teacher shortages occur in a labor market when demand is greater than supply. This can be the
result of either increases in demand or decreases in supply or of both simultaneously. Conversely,
teacher surpluses result when supply is greater than demand. The extent to which the demand for
teachers is either unmet or exceeded will generally determine the motivation for changes in policy. Thus,
4
the interplay of supply and demand in the teacher labor market and in all other labor markets that draw
individuals away from teaching will continually exert forces to develop policies that either promote
change or aim for stability. The labor market for teachers is nested within and continuously influenced
by a larger labor market that includes the markets for all other occupations requiring roughly similar
levels of education or skill.
Within the supply-and-demand framework, studies that focus on recruitment might investigate
factors that affect an individual’s decision to choose teaching as a career. In choosing teaching over other
available occupations, an individual will lose the opportunity to experience the rewards, in terms of
overall compensation, of those other occupations. These lost rewards are considered the “opportunity
costs” of teaching. Those individuals who would incur high opportunity costs by choosing teaching will
be less likely to make this choice.
In constructing policies that promote the recruitment of teachers, the goal of policymakers would
be to increase the rewards of teaching relative to those of the competing occupations available to the
types of people they want to attract. Because ease of entry, monetary compensation, working conditions,
and personal satisfaction are elements of the attractiveness of teaching that can be affected by policy
levers, studies that focus on recruitment might examine, for example, changes in policies related to
credentialing and alternative certification requirements, early recruitment strategies, and entry-level
teacher compensation. Such studies might also focus on prospects for future compensation and career
paths, since teaching may be attractive at later points in the lifecycle, and people will compare trajectories
for rewards that are available in teaching with those that are available in other occupations.
Studies focusing on retention, on the other hand, might identify factors that relate to teacher
attrition. Attrition can be either voluntary or involuntary, although most attrition from teaching is
voluntary, given widespread tenure rates and the prevalence of unionized grievance policies regarding
termination. Again, with respect to voluntary attrition, the notion of opportunity costs comes into play.
Individuals whose opportunity costs outweigh the rewards gained from teaching will be more likely to
leave the teaching profession. Similar opportunity costs might induce teachers to leave specific schools or
districts for others, thus creating school- or district-specific attrition.
Policies that promote retention would focus on adjusting the rewards offered by teaching relative
to those offered by competing occupations or activities. Studies of retention might discuss factors that
determine whether a teacher decides to leave teaching because he or she wishes to retire, take another
form of employment, stop out for a period of time, remain unemployed, or switch to another school or
district. These studies might, for example, investigate policies that improve working conditions, raise
salaries to reflect a value placed upon experience, alter tenure or retirement rules, or promote personal
satisfaction through programs that foster mentoring, professional development, and career advancement
opportunities or campaigns to augment the prestige of the teaching profession.
5
Because policies that promote recruitment and those that promote retention must both focus on
mechanisms to adjust the attractiveness of teaching relative to other occupations—i.e., mechanisms to
create rewards that outweigh the opportunity costs of becoming or remaining a teacher—it is often
difficult to separate the two issues. In fact, much of the research cited in this literature review does not
fall neatly into one of the two categories of recruitment or retention. Often, a study will provide
information that relates to both categories. We, therefore, report on and review the information provided
in such studies in more than one section of our review, when appropriate.
II.2. The Relationship of Teacher Quality to the Supply and Demand Framework
Conceptually speaking, there is another issue that plays an important role within this
framework—the issue of teacher quality or effectiveness. Consider the example of a school district in
which the supply of teachers does not meet the demand. In this case, the resultant pressure to fill
vacancies will most likely eventually induce the district to adjust salaries, benefits, or working conditions
in some manner—either by raising salaries and other elements of the compensation package, offering
better benefits, or improving working conditions. If these adjustments are not made, or if the district’s
resources are so constrained as to make them prohibitive, one of two scenarios will ensue—either (1) the
district will face a persistent shortage of teachers that could, in fact, grow if vacancies are not filled and
existing teachers must take on greater workloads, thus decreasing the attractiveness of teaching even
further; or (2) the district will lower its standards of quality and hire less qualified individuals to serve as
teachers. By “standards of quality,” we mean any set of qualifications that the district uses to determine
entry into teaching. In this section, we discuss the relationship between teacher quality and the supply-
and-demand framework and the difficulty of conducting empirical work that focuses on quality as well
as recruitment and retention.
The issue of teacher quality is integrally related to the interplay of supply and demand. Since not
all teachers are alike, quality is an important variable that can be adjusted by policymakers in their efforts
to bring supply in line with demand. It could be said, for example, that just as districts and schools form
a demand for teachers of various types—English teachers, math teachers, etc.— they form, in a similar
manner, a demand for teachers of various levels of instructional expertise within particular subject
disciplines. Although schools and districts would prefer teachers of the highest caliber if all else were
equal, in reality trade-offs exist when resources must be allocated among competing needs.
Ideally, our literature review would contain only research that focuses on the recruitment and
retention of effective teachers, since it is the goal of educational institutions to employ these types of
teachers. Very few research studies exist, however, that combine issues of recruitment and retention with
the issue of teacher quality. The primary reasons for the scarcity of this research are that (1) it is difficult
to establish an agreed-upon definition of teacher quality and (2) few sources of data exist that permit

6
researchers to identify effective teachers and examine the factors that promote their recruitment and
retention.
Recent research suggests that teachers exert an influence on student achievement (e.g., Rowan,
Correnti, and Miller, 2002; Rivkin, Hanushek, and Kain, 2000; Sanders and Rivers, 1996; Wright, Horn,
and Sanders, 1997), but the evidence is not always clear regarding the observable characteristics of
effective teachers. Studies that have examined available indicators of teacher preparation or quality, such
as academic ability, certification status, and experience, find that the effects of these indicators are often
mixed or very small, suggesting that the research community has not as yet come to a consensus as to
what characteristics influence achievement. Some of these studies have suggested that background
characteristics, such as verbal ability (Ehrenberg and Brewer, 1995), ACT scores (Ferguson and Ladd,
1996), or the selectivity of a teacher’s undergraduate institution (Ehrenberg and Brewer, 1994), are
positively correlated with student achievement.
Prior research focusing on the impact of credentials and pre-service training on the quality of
instruction, however, has found mixed results regarding the impact of teaching credentials and small
positive effects with regard to subject-area preparation. Hawk, Coble, and Swanson (1985) found that
studying with teachers who are fully certified in mathematics instruction tends to raise a student’s
achievement in that subject. Fetler (1999) found a negative correlation between high school mathematics
scores and the percentage of teachers with emergency credentials at the school level. In an analysis using
individual student data, Goldhaber and Brewer (2000) found that the performance of high school
students on standardized mathematics and science tests did not differ according to whether their teachers
held standard or emergency teaching credentials. They found, however, that students of teachers who
were uncertified or who held a private school certification had somewhat lower achievement levels than
students of teachers with a standard, probationary, or emergency certification in mathematics. With
regard to subject-matter preparation, Goldhaber and Brewer found that students of mathematics teachers
who were certified out of field performed worse on standardized tests than students whose teachers had
standard credentials. Monk (1994) found a small effect of teacher coursework in mathematics and science
on student test scores.
Evidence that teaching experience is related to student achievement has been inconsistent. Fetler
(1999) found a positive relationship between the average number of years of teaching experience of
mathematics teachers and high school mathematics scores at the school level. Rowan, Correnti, and
Miller (2002) found a positive effect of teaching experience on growth in mathematics achievement for
students going from third to sixth grade. Ferguson and Ladd (1996) found no relationship between
achievement and the experience of teachers with five or more years of experience. Murnane and Phillips
(1981) found a nonlinear relationship between the test scores of black inner-city elementary school
students and teaching experience, which became positive when teachers had more than 14 years of
experience.
7
If standardized tests provided unambiguous and reliable indicators of student achievement and if
more data existed that linked the performance of students directly to their teachers, we could learn a
great deal about the observable characteristics of teachers that contribute to effectiveness. If data on
hiring and turnover contained a detailed list of teacher characteristics, we could learn a great deal about
efforts to recruit or retain teachers with those characteristics. Unfortunately, few datasets are as complete
as we would like them to be, and, as a result, few studies are able to focus on the recruitment and
retention of effective teachers.
The fact that teachers can vary in their effectiveness, however, raises an important issue regarding
the value of particular policies in promoting recruitment or retention. One cannot assume that an
improvement in recruitment or retention rates is, per se, a valuable outcome. If these improvements are
achieved at the expense of quality, then students may experience more harm than benefit from such a
policy. Throughout this review, we reiterate the notion that high rates of recruitment or retention may
not, in and of themselves, be desirable outcomes. They are desirable only when student learning
improves or remains constant as a result.
From this perspective, therefore, low levels of recruitment or high levels of turnover may not
necessarily be viewed as undesirable. Although inexperienced teachers or the “churning” of staff may
disrupt the learning process, compensatory effects may exist if better teachers fill vacancies and stay long
enough to have a positive impact on student learning. Policies designed to hold on to teachers
indiscriminately, such as across-the-board policies to increase all teaching salaries at the same rate, for
example, may result in the increased retention of low-performing teachers. If effective teaching is related
to attributes that other potential employers value, then this type of policy will foster the retention of
individuals with the lowest opportunity costs along with those with the highest, when it might have been
preferable to target only the latter. That said, however, it is important to remain cognizant of the
potentially high costs of turnover to districts and schools. The struggle to fill vacancies, the search for
new teachers, and the introduction and mentoring of teachers in a new school setting are all
administrative activities that bear considerable costs. Therefore, all else equal, turnover is undesirable.
This is particularly the case with regard to turnover at the school or district level that is not due to
teachers leaving the educational system, but to teachers migrating from one school to another. The cost
to the individual school or district is the same for teacher mobility as it is for teacher attrition from the
system. In addition, both types of turnover, but teacher mobility in particular, often change the
distribution of teaching skills throughout the system. Changes in the distribution of skills may be
beneficial or harmful. Generally, when teachers with high skill levels migrate to schools and districts that
have more pleasant working conditions and higher achievement scores, the concern arises that the system
may become less equitable. It is, therefore, important to remain aware of the possible financial and
distributional consequences of turnover as well as the forms—mobility across districts or schools and

8
attrition from the system—that it can take. In designing policies or conducting research, it is important to
identify, account for, and distinguish among these forms of turnover and their consequences.
A large portion of the research on teacher recruitment and retention has studied these two
phenomena without reference to the issue of quality. In this report, therefore, we review all studies on
the general topic of teacher recruitment and retention that meet our selection criteria and do not restrict
our search to studies that deal only with the recruitment and retention of effective teachers. We organize
our discussion of the literature around the following four research questions—similar to but slightly
broader than those listed in Chapter I:
• What are the characteristics of individuals who enter teaching and what factors motivate
their decisions?
• What are the characteristics of individuals who remain in teaching and what factors motivate
their decisions?
• What are the characteristics of districts and schools that successfully recruit and retain
teachers?
• What is the evidence regarding the effectiveness of different types of policies that aim to
promote recruitment and retention?
Although we do not restrict our search to studies that deal with the recruitment and retention of
effective teachers, a number of the studies included in this review, however, do discuss some of the
observable characteristics of teachers that appear to be related to effectiveness—such as measured ability,
credentials, experience, and subject-matter preparation—and we are careful to point this out in our
treatment of these studies.
9
CHAPTER III: METHODOLOGY
III.1. Criteria for the Selection of Research Included in the Review
Our literature review included all studies that we found that met a set of specific criteria. The
selections were made on the basis of the following four general criteria:
• relevance
• scholarship
• empirical nature, and
• quality.
To assess relevance, we first determined whether or not the study provided insight into issues
surrounding the recruitment and retention of teachers in the United States. We limited studies to those
performed on teacher labor markets in the United States and to those published after 1980. We ended our
search at the end of 2003. These restrictions were imposed to provide readers with access to the set of
studies most directly relevant to our research questions. In addition, due to limited time and resources,
we did not review the large body of research that focused exclusively on the recruitment and retention of
special education and vocational education teachers.
We restricted our review to those research endeavors of a scholarly nature. As indicators of this,
we looked to peer-reviewed journals and organizations with well established peer-review processes, such
as the National Center for Education Statistics, the Educational Testing Service, the Urban Institute, and
the RAND Corporation, among others, as sources of publications. In addition, books, book chapters, and
monographs that offered empirical evidence and analysis were included. We excluded publications by
organizations that are set up to provide information to the public, advocate particular reforms, and
influence policy but are not research institutions with a well established peer-review process. Although
some of these organizations may provide information of interest,1 we were unable to systematically
search for these organizations. In addition, working papers were excluded because they are not peer
reviewed, it was not possible to systematically search for them, and their findings are subject to change.
Newspaper and magazine articles were also excluded.
In addition, we considered only those studies that were empirical in nature. By this, we mean that
they offered evidence—quantitative or qualitative, or both—for conclusions, rather than simply opinion,
theory, or principles. We excluded simple program descriptions that were not analytical or evaluative
and publications that offered only opinions, theory, or principles without offering new or original
1 See, for example, Darling-Hammond, L. (2002) “Solving the Dilemmas of Teacher Supply, Demand, and
Standards: How Can We Ensure a Competent, Caring, and Qualified Teacher for Every Child” published by the National Commission on Teaching and America’s Future, and Farkas, Johnson, and Foleno (2000).
10
evidence to support conclusions. Therefore literature reviews and publications that only cited research
performed by others were excluded. Finally, we reviewed only those articles, books, and monographs
that we considered to be rigorous in quality, according to generally accepted standards for quality in
empirical research. We elaborate on our method for determining rigor below.
III.2. Elaboration of Quality Criteria for Selection
We included a study in our review if its research design and analytic strategy were appropriate to
the topic under study, its methodology was applied in a careful manner, its focus was relevant to our
research questions, and its interpretation was well supported.
Although the preponderance of empirical studies that we found on the subject of teacher
recruitment and retention were statistical in nature, we included research of both a quantitative and a
qualitative nature in our search and applied a similar baseline standard of rigor to each type of research—
i.e., a determination of the appropriateness and adequacy of the design, methods, and interpretation. We
describe our criteria for selection in greater detail in the next paragraphs, focusing first on our standards
for the evaluation of quantitative research studies and then on those applied to research of a more
qualitative nature. Our quality guidelines were developed with a dual purpose in mind—as criteria for
determining whether to include a study in our review and as criteria to assist us in developing a useful
critique of those studies that were included.
Specific Quality Criteria for Quantitative Research
Quantitative methods are the research tools of choice when the phenomena being studied are well
described by large quantities of numerical or categorical data. When sufficient data are available,
quantitative methods can yield findings that are generalizable to larger populations and tease out general
stylized facts or trends from those embedded in and unique to particular contexts. Labor market trends
and policies, such as those pertaining to the recruitment and retention of teachers, are generally studied
using quantitative methods, and the majority of the studies included in this review of the research
literature are quantitative. A way of viewing quantitative research that emphasizes its relationship to
qualitative research, however, is to think of it as grounded in qualitative pieces of information that can be
described and gathered in quantifiable units in sufficient quantity to permit the use of statistical tools.
Thus, quantitative and qualitative research are complementary, and a qualitative understanding of the
phenomena being studied is needed before quantitative data can be gathered.
In our determination of the quality of a quantitative study, we focused on four issues:
• sample characteristics
• measurement procedures
• model specification, and
• interpretation.
11
With regard to characteristics of the sample, several issues were given attention. They can be
grouped into the following four categories: (1) sample size, (2) sample selection, (3) sample completeness,
and (4) sampling units. To support credible inferences, samples must be of adequate size and
representative of the appropriate population.
Thus, whether existing or primary data were used, we questioned whether the sample that was
used in the analyses was appropriately selected and surveyed. If survey data were used, we checked for
sample sizes that provided adequate power to detect effects of a reasonable size2 and for response rates
that ensured a large degree of representation. We expected that characteristics of nonrespondents be
reported and relatively similar to those of respondents. In addition, we looked for inclusion and
exclusion criteria that were clearly explained and reasonable. We also attempted to understand whether
there were circumstances surrounding the data collection that could have influenced the rate or nature of
the responses in a nonrandom way. If data were used that required sample weights for over-sampling or
nonresponse, we checked for the application of the weights in the analysis or for a discussion of whether
or not they were appropriate to the particular analyses performed. In addition, the sample should
provide an appropriate unit for analysis. If aggregated data were used to support analyses that answered
questions that pertained to a smaller unit of analysis, a study might offer biased results. Thus, if sample
sizes were inadequate, if the potential for sample selection bias was present and thought to have
influenced outcomes, if data were flawed by differential nonresponse patterns, or if the information
required to assess these issues was left out of the published report, we were less apt to include the study
in the review, or, if we included it, we mentioned these issues in our critique.
We were also concerned with the proper measurement of variables. In general, variables used in an
analysis had to appear or be shown to be valid and reliably measured. It was important that researchers
describe variables in detail, present means and standard deviations where necessary, and report on tests
of reliability if complex constructs were utilized.
Third, we looked for an appropriate model specification. Well specified statistical models aim for
unbiasedness and efficiency in their estimation of parameters. In general, we looked for an awareness of
and attention to issues relating to bias and variance computation. The potential for bias or inefficiency
could arise in many forms. For example, selection bias arising in comparisons of two groups that are not
truly comparable with respect to some underlying unobservable dimension could lead to a false
conclusion regarding the differences between the two groups. If the potential for this type of bias was
present in a study, we looked for designs that employed random assignment, matched comparison
groups, or some form of statistical correction for bias. Bias in multivariate analyses might arise from
correlation among error terms or between error terms and covariates. If clustered, grouped, or panel data
2 Hard-and-fast rules, such as power calculations, were not used in determining the adequacy of sample sizes.
It was generally clear when a sample was too small to support an analysis.

12
were used, for example, we looked for attempts to account for correlation among error terms in the
estimation process and to compensate for design effects in the computation of variance. The use of
appropriate “control” variables, for example, reduced the possibility of omitted variable bias in
regression analyses—in these cases, the omission of a variable that was correlated with both the
dependent variable and an independent variable of interest would have resulted in a biased coefficient on
the independent variable of interest. Reverse causality between dependent and independent variables
was another issue that could create bias and required attention from the study authors. For the attrition
and retention analyses, we checked to see that researchers addressed issues relating to the truncation or
censoring of samples and the loss of sample respondents over time.
Finally, we were concerned with the interpretation placed on the findings. If researchers drew
conclusions that seemed to overstate or misinterpret their results, the study was less likely to be included
in the review or, if included, was critiqued accordingly.
In summary, our quality criteria for the selection of quantitative studies were based on satisfactory
answers to the following questions:
• Did the sample adequately support the analyses performed?
• Did the measures appear to be valid and reliable?
• Did the researchers choose a statistical approach that appropriately modeled the phenomena
under study?
• Was the interpretation chosen by the researchers warranted by the findings?
A quantitative study was considered sufficiently rigorous to be included in the literature review if
these criteria were addressed well enough to produce convincing findings. In addition, these criteria
served to guide our evaluation of those studies included in the review.
Specific Quality Criteria for Qualitative Research
A qualitative approach generally yields useful information when a quantitative approach is not
possible because the phenomena being studied are too few to permit a large sample size, too
impressionistic or word-dependent to quantify in a helpful manner, or too new or under-researched to
allow researchers to formulate an appropriate set of hypotheses or analytic approach. In addition, a
qualitative approach may be useful in providing a context for the interpretation of phenomena of interest.
Thus, qualitative research is often useful in hypothesis generation and essential when concepts cannot be
reliably captured via quantitative methods. Qualitative research often precedes and serves as a
foundation for quantitative research, as it provides insight into meaningful distinctions that can then be
used to categorize, quantify, and collect data on a large scale.
We included qualitative studies that we deemed to be of high quality with regard to the following
dimensions:
• methodology
13
• use of evidence, and
• analysis and interpretation.
We looked first at whether the choice of methodology was appropriate to the research question.
Thus, a case study or an ethnographic study that investigates a particular program or set of programs and
falls into the “small N” (small sample size) research category might be included in the list of potential
studies for review, since the choice of methodology is appropriate to the phenomenon being studied.
Similarly, we considered valid a study that codes, assembles, and analyzes interview data in which
contextual descriptions that resist quantification are important to the outcomes of the study. Finally, we
considered research that provides descriptions of programs that are unlike other programs and relatively
understudied as possible candidates for review.
The next step was to determine whether the research presented evidence and had enough analytic
strength to warrant its inclusion in the literature review. For our purposes, we included only those
qualitative studies that resulted in an informative interpretation or the formulation of relevant hypotheses.
In other words, studies could be included if the researchers chose variables and identified relationships
that were of interest to others in the field. Our criteria for the selection of qualitative studies for review
were based on satisfactory answers to the following questions:
• Was the method justified because the study was characterized by a small sample size, data
that were difficult to quantify, or phenomena for which no existing hypotheses had
previously been developed?
• Did the study offer sufficient evidence to support its conclusions?
• Did the study reveal relationships between carefully identified variables that were of interest
to other researchers in the field?
If the answer to each of these questions tended to be in the affirmative, then we included the study
in our review. Under these criteria, a qualitative study could be included if it contained a sufficient level
of evidence and analysis.
III.3. Search Strategy and Results
We performed electronic database searches of Education Abstracts, Social Science Abstracts,
Econlit, ERIC, and JSTOR. We performed table-of-contents searches on widely recognized journals
including the American Educational Research Journal, Educational Evaluation and Policy Analysis, the Journal of
Policy Analysis and Management, the Economics of Education Review, and the Journal of Education Finance. We
also searched the National Center for Education Statistics publications index, the Educational Testing
Service publications index, the RAND report index, the Urban Institute report index, the American
Institutes for Research report index, and the book index of the University of California libraries.
14
Some of these search tools allowed screening for peer-reviewed articles, but we discovered that
these results were inconsistent. Occasionally, journals were listed as peer reviewed in some places but
not in other places in the same database. We also chose to study non-peer-reviewed publications of high
enough quality and relevance to justify inclusion. Thus, we re-ran all searches without the peer-reviewed
screen and assessed the quality of the publications on a case-by-case basis.
In addition, we asked a number of scholars for their suggestions of relevant works to include in
this study.
These searches returned a total of more than 5,600 items, which was reduced to 4,773 after
elimination of duplicates. Of these, 2,989 were on topics insufficiently relevant to this project; 1,475 were
either non-empirical in nature or located in journals not widely regarded as quality scholarly publications
even though they might be peer-reviewed; and 213 were of interest, but were either reviews of other
work, early publications superseded by later work we included, not quite on target regarding our specific
research questions, or rejected under our quality criteria as described in the previous section. This left 96
items in our final review.
III.4. Structure of the Literature Review
We have organized the next three chapters of our literature review in a manner intended to
facilitate the use of the review as a reference tool for researchers and policymakers. We begin each
chapter with an introductory section describing the substantive and methodological issues relating to the
chapter’s focus and relating the discussion to the conceptual framework developed in Chapter II. We
then proceed with a section entitled “What the Literature Says.” This section is divided into discussions
of subtopics within the chapter’s overall focus.
Within each subtopic, we discuss each relevant study in bulleted paragraphs containing a
distillation of the study findings that pertain to the subtopic. The bulleted paragraphs representing each
study are ordered chronologically from most to least recent by date of publication to enable the reader to
distinguish easily more recent from older work. On occasion, however, relatively recent publications
utilize old data; therefore, the ordering does not always reflect the recentness of the data. Each paragraph
describing a study contains a brief description of essential information needed to understand the
characteristics of the sample of individuals or institutions being studied, the size of the sample, and the
study results.
Since many studies address more than one subtopic, bulleted paragraphs on the same study may
appear in more than one place. To avoid excessive repetition, we provide more detail on the study the
first time it is mentioned in a particular chapter and less detail in subsequent discussions. Therefore, if
background information regarding the study is missing in a bulleted item, it can be found in an earlier
bulleted item in the chapter. Each study is more fully described in the appendix to this report, which
15
includes detailed information regarding the research questions, data, methods, and findings of the study
and a brief critique.
At the end of each of the next three chapters, we summarize the main findings that have emerged
from the review of the literature pertaining to the topic of the chapter. These are later reiterated,
synthesized, and discussed in the concluding chapter of our review.
III.5. Caveats
Our methodology carries with it some limitations:
First, we searched for published documents; thus, the findings listed in the review, as in most
literature reviews, may be subject to “publication bias”—i.e., studies that supported the null hypothesis
of “no effect” were less likely to be published or offered for publication.
Second, given the large number of studies contained in various literature databases and the
imperfect functioning of keywords as search tools, it may be that useful studies that contained
information pertaining to our topic but not explicitly described as such were overlooked. Third, many
organizations exist that offer information of interest. The Internet alone offers a plethora of
downloadable publications, some of which may contain valuable research findings, but limited resources
did not permit a full search for these types of items.
Last, in applying our quality criteria, we were able to distinguish studies that should be included
from those that should not, but the studies that met the threshold for acceptance were by no means
homogeneous in quality. We note important flaws in various studies in our paragraphs describing them,
and the appendix discusses these flaws in greater detail, but we ask the reader to bear in mind that
variations in quality exist among the studies included for review.

17
CHAPTER IV: THE CHARACTERISTICS OF INDIVIDUALS WHO ENTER AND LEAVE TEACHING
IV.1. Individuals Who Enter Teaching
The first question we addressed in our review was: Who goes into teaching? As outlined in our
conceptual framework, the basic principle motivating individuals to enter the teaching profession is the
following: Individuals will choose teaching if it represents the most attractive activity to pursue among
all those activities available to them. By attractive, we mean desirable in terms of ease of entry and total
compensation (salary, benefits, working conditions, and personal satisfaction).
Theoretical models used to study the entry into teaching would fall under the category of
individual choice models. In this case, these are models of behavior that identify the individual
characteristics and other factors that motivate a decision to enter or not to enter teaching. Such
characteristics and factors might be age, sex, socioeconomic status, ability, parental education or
occupation, entry-level wages of teachers relative to entry-level wages of other available occupations, and
local unemployment rates. The richness of the empirical models developed depends upon the data
available and the researcher’s ability to identify contributing influences.
Research to determine the characteristics of individuals who enter teaching can take three
approaches: (1) It can compare those who choose teaching with those who do not to ascertain the
distinguishing characteristics or motivations of teachers; (2) it can simply examine the characteristics of
individuals who choose teaching; or (3) it can examine the characteristics of individuals who choose to
teach and are chosen to teach by school districts. The first approach would draw a sample from a
population of potential applicants to teaching, the second type would draw from the population of actual
applicants to teaching, and the third would sample only those who had applied and been accepted.
Within the group of studies that were included in our review, we found few that compared entrants to
teaching with those who chose not to enter teaching, almost none that surveyed actual applicant pools,
and several that focused on individuals who had already self-selected and been selected into teaching.
The first approach is preferable, because it allows us to obtain a sense of the possibilities open to
college graduates and the reasons why one path might appear more attractive than another. Data that
support this approach are relatively rare and generally somewhat old, however (a few examples are the
High School and Beyond, the National Longitudinal Study of the High School Class of 1972, the National
Longitudinal Survey of Youth, the Baccalaureate and Beyond, and the Survey of Recent College
Graduates), which explains the relative scarcity of studies that take this approach. If such data are not
used, researchers must explore retrospective data on the motivations of entrants to teaching, which could
be subject to recall bias. In addition, these data provide no information regarding the choices of those
who may have considered teaching but decided against it. Thus, such data are less informative than
18
those collected from individuals with the potential to become teachers prior to their choice of post-college
activities. Therefore, in presenting the studies that focus on this research question, we regard those that
were conducted using samples of potential teachers as the most useful and those conducted using
samples of new teachers as secondary in importance.
What the Literature Says
The literature provided fairly consistent information on the demographic characteristics of
entering teachers and on the relationship between ability and the decision to teach. In addition, since
newly hired teachers can be first-time teachers or returning teachers, we found a few studies that
examined the characteristics of the reserve pool and those individuals most likely to resume teaching
after a period of stopping out. A very small number of studies provided evidence of psychological
factors motivating individuals to enter teaching.
Gender
Women are and were more likely than men to enter teaching. As a number of studies have
documented, however, the proportion of female college graduates entering teaching has declined over
time.
• Broughman and Rollefson (2000), in descriptive analyses from the 1987–1989 and 1993–1994
Schools and Staffing Survey, reported that 73 percent of new hires to teaching were female in
1993–1994.
• Henke et al. (2000), in a longitudinal study of more than 11,000 college graduates from the
class of 1992–1993 in the Baccalaureate and Beyond, found that women were more likely than
men to enter the teacher pipeline (i.e., to have taught in a school, to have become certified to
teach, to have applied for a teaching position, or to be considering teaching).
• Flyer and Rosen (1997) reported that nearly half of women graduating from college in 1960
went into teaching, whereas fewer than 10 percent went into teaching in 1990 due to the
increase in female labor force participation rates and the opening of a wider variety of job
opportunities to women. The source for female labor market participation rates is the
Current Population Survey from the 1960s to 1990.
• Hanushek and Pace (1995), using data from the High School and Beyond, which followed a
cohort of 1,325 high school seniors from the class of 1980 through 1986, found that, of those
who completed a bachelor’s degree, white females were more likely to obtain a degree in
education than white males. At sample means, the white male teacher preparation rate was
10 percentage points lower than it was for white females.
19
• Murnane et al. (1991), using data on more than 2,000 individuals in the National Longitudinal
Survey, found that female college graduates were more likely to become teachers than male
college graduates in the late 1960s, the 1970s, and the early 1980s.
• Berry (1986), using interview data on 80 members of the 1985 college graduation class at six
different universities, found that women were more likely than men to consider the teaching
profession to be attractive. In addition, he found that students with low socioeconomic status
and students from rural backgrounds were more favorably disposed than others to teaching.
Berry’s study did not follow up on the actual career decisions made by these individuals,
however.
Race/Ethnicity
Minority student enrollments have increased dramatically in the past few decades, yet researchers
such as Kirby, Berends, and Naftel (1999) have pointed out that the recruitment of minority individuals
into the teaching profession did not keep pace with enrollment increases in the 1980s and early 1990s.
Even though some studies report that the proportion of minority teachers has been on the rise, according
to a number of studies, new teachers continue to be predominantly white. Although an empirical
relationship between teacher diversity and minority student outcomes has not been firmly established in
the literature, most of the studies discussed below suggest that hiring minority teachers is nonetheless a
desirable goal, given the increase in minority enrollments, and commonly cite the need for teachers to
serve as role models, understand minority students, and use a culturally meaningful pedagogy (King,
1993).
• Broughman and Rollefson (2000), in their descriptive analysis of the Schools and Staffing
Survey 1993–1994 data, found that 84 percent of newly hired teachers in 1993 were
categorized as white non-Hispanic. Despite the fact that the majority of new hires were
white, however, the authors found that between 1987–1988 and 1993–1994, the proportion of
new minority teachers in public schools doubled and in private schools quadrupled.
• Henke et al. (2000), in their study of more than 11,000 college graduates in Baccalaureate and
Beyond, found that Asians/Pacific Islanders were less likely to enter the teacher pipeline (i.e.,
to have taught in a school, to have become certified to teach, to have applied for a teaching
position, or to be considering teaching) than graduates of other racial/ethnic backgrounds.
• Gitomer, Latham, and Ziomek (1999) found that, among ethnic groups of teacher candidates
taking the Praxis I test for admission to schools of education between 1994 and 1997 (the
sample size was over 88,000 for this analysis), white candidates passed at the highest rate (87
percent) and black candidates at the lowest rate (53 percent). Among ethnic groups of
teacher candidates taking the Praxis II test for licensure during the same period (the sample
size for this analysis was over 272,000), white candidates passed at the highest rate (92
20
percent) and black candidates at the lowest rate (65 percent). The authors observe that the
teacher applicant pool was disproportionately white even before testing, so the effect of
testing was to make an already homogeneous pool even more so. Significance tests for
differences in proportions were not performed in this study, however.
• Rong and Preissle (1997) analyzed 1990 census microdata representing 5 percent of the U.S.
population and found that in 1990, Asian-Americans constituted 2.8 percent of the U.S. labor
force overall but only 1.2 percent of elementary and secondary teachers. Hispanics were also
underrepresented in teaching—they made up 7.5 percent of the U.S. labor force overall but
only 4.7 percent of elementary and secondary teachers. In contrast, African-Americans
constituted 9.8 percent of the U.S. labor force and 9.6 percent of elementary and secondary
teachers.
• Hanushek and Pace (1995), using data from High School and Beyond, which followed a
cohort of high school seniors from the class of 1980 through 1986, found that, of those who
completed a bachelor’s degree, Asians and blacks were less likely to obtain a degree in
education than whites.
• Gordon (1994) used interview data on 140 minority teachers in California in the early 1990s
who expressed the opinion that students of color were discouraged from entering the
teaching profession because they had had negative experiences in school, were concerned
about a lack of student discipline and lack of respect in the classroom, perceived teaching to
be low in status and pay, and perceived the image of a teacher to be a white, middle-class
female. Since the author provides only limited information on the characteristics of the
interviewees, however, it is difficult to assess the generalizability of these findings.
• Murnane et al. (1991), in an earlier period, found that the representation of black college
graduates among teaching licensees had declined in North Carolina in the early 1980s and
that minority representation in the national teaching force had declined dramatically from
the 1960s to the 1980s. They attribute the decline to the increased usage of more stringent
testing requirements for teachers and the fact that alternative labor market opportunities for
minorities expanded during the decades in question.
• Dometrius and Sigelman (1988) found that, of those who took the Texas Examination of
Current Administrators and Teachers in 1982, some 0.1 percent of whites, 1.1 percent of
Hispanics, and 4.6 percent of black teachers did not pass, suggesting that barriers to entry
may have influenced the representation of minorities in the teaching profession. The sample
size is 169,608 public school teachers from the 1982 survey of teachers in public school
districts in Texas conducted by the Equal Employment Opportunity Commission.
21
Ability
A fairly consistent finding in the literature was that, among college graduates, those with the
highest measured ability tended not to go into teaching.
• Henke et al. (2000), in their study of Baccalaureate and Beyond, found that graduates whose
college entrance examination (CEE) scores fell in the top quartile were less likely than those
in the bottom quartile (32 versus 41 percent) to enter the teacher pipeline, and 6 percent of
graduates in the top quartile had prepared to teach and taught versus 12 percent in the
bottom quartile.
• Ballou (1996) used data on more than 50,000 new bachelor’s degree recipients from the
Survey of Recent College Graduates conducted from 1976 through 1991 and found that
college graduates from more selective institutions were less likely to choose a teaching major
and less likely to choose to teach after certification than those from less selective institutions.
• Hanushek and Pace (1995), using High School and Beyond data on high school seniors from
the class of 1980 who were followed through 1986, found that higher-ability students, as
measured by performance on cognitive tests, were less likely than lower-ability students to
pursue a bachelor’s degree in education, holding constant race and gender. The mean
probability of obtaining a bachelor’s degree in education was 12 percent, and a move from
the mean to one standard deviation above the mean test score implied a 5.5 percentage point
drop in that probability. They also found that, among individuals obtaining a bachelor’s
degree in any field, those with higher ability were less likely to be actively teaching in an
elementary or secondary school by 1986. The study followed high school seniors for only six
years, however, thus the results could not take into account those students who took a longer
time to complete their education or choose an occupation.
• Murnane et al. (1991), using data on more than 2,000 individuals in the National Longitudinal
Survey, found that nationally, high-IQ college graduates were less likely than those with
average IQs to enter teaching during the late 1960s and the 1970s.
• Murnane and Schwinden (1989) found that among individuals who had obtained a teaching
certificate in North Carolina between 1975 and 1985, the probability of actual entry into
teaching was lower for those with higher National Teacher Examination (NTE) scores.
• Berry’s (1986) college student interview data from 1985 distinguished high and low achievers
and found that the brightest students did not view teaching as an attractive career.
• Manski (1987), using data on working college graduates in the National Longitudinal Study
of the High School Class of 1972 that followed high school seniors until 1979, found that the
probability of becoming a teacher was inversely related to academic ability, as measured by
SAT scores and class rank. In the case of males in the 400–800 SAT range, 16 percent became
teachers and 22 percent entered other professions. In the 1201–1600 SAT range for males, 55
22
percent were non-teaching professionals and only 5 percent were teachers. In the case of
females in the 400–800 SAT range, 34 percent became teachers and 14 percent entered other
professions. In the 1201–1600 SAT range, 9 percent were teachers and 46 percent were non-
teaching professionals.
• Pigge (1985) found that, among several thousand graduates of a teacher-training program at
an Ohio university in the 1970s and 1980s, those with higher ACT scores were less likely to
go into teaching and that this relationship was stronger in the 1980s than in the 1970s.
In seeming contrast to the above studies, a large national study conducted by Gitomer, Latham,
and Ziomek (1999) for the Educational Testing Service found that individuals who passed standardized
tests to qualify for teacher education programs were comparable to or exceeded other college-bound
seniors in measured ability. This study also revealed, however, that the average measured ability of
candidates passing licensure tests to qualify for elementary school teaching positions was substantially
below that of college graduates, whereas the average measured ability of candidates passing licensure
tests for teaching academic subjects was higher than that of college graduates. Since elementary teachers
constitute a majority of teachers, these findings are thus consistent with those in the studies listed above
and may explain why teachers, taken as a whole, show lower average measured ability than the college-
educated population.
• Gitomer, Latham, and Ziomek (1999), in a study that used data on more than 300,000
prospective teachers who took the Praxix I and II between the years 1994 and 1997 and could
be matched to earlier SAT or ACT data, found that the group of individuals who passed the
Praxis I test for admission to schools of education had math scores comparable to, and verbal
scores higher than, the average scores of all college-bound seniors (an average math score of
514 versus an average math score of 511, and an average verbal scores of 525 versus an
average verbal score of 505, respectively). Teacher candidates who passed the Praxis II
teacher licensure test had SAT scores that were lower than the average for college graduates
(507 versus 542 in math, and 522 versus 543 in verbal). After disaggregating their data, the
authors found that elementary education candidates passing the Praxis II had lower SAT
scores than college graduates (507 versus 542 in math, and 522 versus 543 in verbal). In
contrast, candidates passing the Praxis II for an academic content area had higher verbal SAT
scores than college graduates in general, and those pursuing mathematics or science subject-
matter licensure had math SAT scores that were higher than college graduates in general. The
study reports only mean scores and does not provide significance tests. In addition, it is
limited to test takers who also took the SAT or ACT and does not necessarily generalize to
the entire population of applicants to teacher education programs or teacher candidates.
The generally observed inverse relationship between measured ability and entry into teaching may
be partially attributable to public district hiring practices. Some studies suggest that principals do not
23
regard high academic ability as the main characteristic they look for in a teacher when hiring. Some
authors even suggest that school district officials are not particularly interested in hiring individuals with
high academic ability. Although individuals can choose or not choose to enter the teaching profession, it
is important to keep in mind that the hiring practices of districts and schools can influence the
characteristics of teachers, particularly in regions or times in which there is a surplus of applicants.
• Abernathy, Forsyth, and Mitchell (2001) reported on a survey of 57 teacher education
students, 10 education faculty, and 75 school principals in the Rocky Mountain region during
the late 1990s that asked respondents to assess the importance of various qualifications and
attributes in a teacher’s ability to obtain a job. Principals reported that cooperative teacher
evaluation (a concept only vaguely defined in the paper), prior successful teaching
experience, a portfolio demonstrating class management skills, good character, ability to
work with diverse learners, interpersonal skills, and a variety of teaching strategies were
important. Student and faculty responses were highly correlated with the principals’
responses, although students tended to overrate the importance of grade point average and
faculty tended to overrate the importance of faculty recommendations. The shortcomings of
the study are the relatively small sample sizes, a distribution of principals that is skewed
toward the elementary level, and questionable generalizability to all education students and
faculty and school principals.
• Ballou (1996) in his analysis of the 1976–1991 Survey of Recent College Graduates found that
graduates of more selective institutions were less likely to be hired as teachers after applying,
suggesting that schools did not consider ability, as signaled by college selectivity, to be of
high value.
• Wise, Darling-Hammond, and Berry (1987) conducted case studies of six school districts
spread throughout the United States and reported that although academic qualifications
were considered in the hiring process, in some districts, principals and district personnel
valued interpersonal skills more highly. In some cases, administrators believed that the
smarter a teacher candidate was, the worse he or she would perform as a teacher.
• Berry, Noblitt, and Hare (1985) provided evidence drawn from 107 interviews of public
school administrators and 73 interviews of education officials at universities in the Southeast
in the early 1980s that both groups valued the ability to relate to children or participation in
extracurricular activities as much as or more than intelligence or academic ability.
Psychological Factors
Few studies provided information on psychological factors, including altruistic ideals, that drew
individuals into teaching, and, with the exception of Shipp (1999) and Hanushek and Pace (1995), those
that did were generally hampered by retrospective responses or lack of a comparison group.
24
• Farkas et al. (2000), using nationwide survey data from 660 public school teachers with five
or fewer years of experience, reported that the majority said they loved teaching (96 percent),
they would choose teaching again if starting over (80 percent), and they got a lot of
satisfaction out of teaching (68 percent). To a question about the importance of job
characteristics, 83 percent of teachers responded that it was absolutely essential that a job
involve work one loved to do, and 96 percent responded that their current teaching position
had this characteristic. Eighty-one percent said that it was absolutely essential that a job
allow time for family, with 79 percent reporting that their current teaching job did this, and
72 percent said that a job must contribute to society and help others, with 97 percent
reporting that their current position does this. One limitation of this portion of the study is
that the questions were designed in such a way as to elicit positive responses. The authors
also surveyed a national sample of 802 college graduates under the age of 30 who were not in
teaching and reported that many believed that teachers often had to worry about their safety
(89 percent), were seriously underpaid (78 percent), were often made the scapegoat for the
problems facing education (76 percent), and lacked opportunities for advancement (69
percent). When asked what would make them more likely to consider becoming a teacher, 70
percent identified making a difference in the lives of at-risk kids, 55 percent said they would
consider it if they could become teachers without going back to school, 54 percent said that
they would want to teach kids who were well behaved and eager to learn, while 47 percent
said they would be more likely to consider teaching if teaching paid more.
• Shipp (1999), using data from 263 questionnaires answered by African-American college
students at two universities during 1992, found that education majors placed significantly
greater importance on the “contribution to society” factor than did non-education majors.
Non-education majors placed more importance on the “salary,” “job-security,” “prestige,”
and “advancement opportunities” factors than did education majors. The author suggests
that non-education majors were put off by a perceived lack of sufficient compensation and
opportunities for promotion within teaching.
• Hanushek and Pace (1995), using data from High School and Beyond, which followed one
cohort of 1980 high school seniors through 1986, found that most of those individuals who
ended up in teacher education programs had not expressed an aspiration to teach while in
high school. In fact, only a small proportion (22 percent) of those aspiring to teach in high
school ever completed a teacher education program. Moreover, of those individuals who
completed a bachelor’s degree in education, only 41 percent had expressed some interest in
teaching before starting college.
• King (1993) surveyed a small group of 41 prospective and beginning African-American
teachers from one institution of higher education in 1988–1990 and found that intrinsic
25
rewards, such as the opportunity to work with young people, the perception that their
abilities were well matched to teaching, the belief that teaching contributed to the betterment
of society, and the opportunity to be creative, outweighed considerations related to salary
and prestige, according to self-reported perceptions. Salary, prestige, and autonomy,
however, were cited as more important motivators for men than for women, whereas
vacation time and the ability to couple teaching with child-rearing were cited as more
important motivators for women than for men. Almost all respondents said that salary
increases and better working conditions would lead to greater recruitment of minority
teachers. Due to the small sample size, however, and the fact that all subjects were drawn
from one institution, it is difficult to generalize these findings to the population of either all
education students or all African-American education students.
• DeLong (1987) used retrospective interview data from 139 teachers in an intermountain state
during the mid-1980s and found that the desire to work with children and to help others to
develop and learn were the most commonly cited reasons for having entered the teaching
profession.
• Andrew (1983), in an analysis of a survey of 248 teacher-education students in their
sophomore year at the University of New Hampshire between 1975 and 1981, offered
retrospective information on motives for pursuing teaching training. The desire to perform a
social service was reported as the primary motive drawing them to teacher education, with
enjoyment of children and love of the subject being of secondary importance.
Reentrants to Teaching
According to Grissmer and Kirby (1997), the queue of new teachers in the pipeline appeared to
decrease between the 1980s and the 1990s. They indicated that in the mid-1990s about one-third of
education graduates did not teach in the year following graduation. Flyer and Rosen (1997), using data
from the National Longitudinal Survey of Youth in the period between 1979 and 1991, found that female
elementary teachers experienced a smaller wage penalty for stopping out of teaching than women in
other careers, suggesting that the reserve pool of former teachers could contribute significantly to total
new hires at any given point in time.
Therefore, the reserve pool composed of individuals who possess a teaching credential but retire
temporarily from teaching could provide an important source of teachers. A small number of generally
rigorous studies offered information on reentering teachers. A consistent finding in these studies was
that elementary teachers were more likely to return to teaching after a career interruption than were
secondary teachers. Physics, chemistry, and mathematics teachers were the least likely to return. Most of
these studies use data from the 1970s and 1980s, however, and are thus of limited relevance to the
present.
26
• Stinebrickner (2002), using data from 422 female teachers and 1,028 female non-teachers in
the National Longitudinal Study of the High School Class of 1972 followed until 1986, found
that 33 percent of teachers who left the workforce and were observed five or more years later
returned to teaching. Forty-five percent of teachers who left teaching and 77 percent of non-
teachers who left their jobs returned to some type of work within five years of leaving.
• Grissmer and Kirby (1997) performed a descriptive analysis of National Center for Education
Statistics data and other sources and found that during the 1980s returning teachers
composed about 40 percent of all entering teachers.
• Beaudin (1995), using data collected in 1985 from 898 teachers in Michigan public schools
who started their careers in the early 1970s, found that female teachers, as well as teachers
who interrupted their careers at an older age, were more likely than males to return to their
original districts. In general, black teachers were more likely than others to return to their
original district, particularly if that district had a higher percentage of black residents.
• Beaudin (1993) analyzed data on more than 3,000 teachers who began their careers in
Michigan public schools between 1972 and 1974 and left teaching within four years of entry
to explore the characteristics of those who resumed teaching versus the characteristics of
those who did not return. She found that reentrants were a significant source of new hires
and that elementary and more experienced teachers were more likely to return than other
types of teachers. Teachers who began their careers with a bachelor’s degree were more
likely to leave initially and return later than those with advanced degrees, suggesting that
many of these teachers stopped out to pursue further education. Physics, chemistry, and
math teachers were less likely to return than teachers in other fields.
• Kirby, Grissmer, and Hudson (1991) found that the reserve pool of former teachers formed an
increasing proportion of new hires in Indiana in the late 1980s. For example, in 1971,
inexperienced teachers accounted for 60 percent of all new hires and returning teachers for 15
percent, with migrating teachers accounting for the rest. By 1988, the proportions of
inexperienced and returning teachers were 40 and 30 percent, respectively.
• Murnane, Singer, and Willett (1991) found in both Michigan and North Carolina that women
under the age of 30 were more likely to return to teaching after an absence than women over
30 and men of all ages, and, while away from teaching, these younger women were less likely
to be employed full time in another occupation.
• Murnane and Olsen (1989b) followed North Carolina, Michigan, and Colorado teachers who
began their careers in the 1970s and had either stayed in teaching or had left and returned to
teaching by the late 1980s. They found that mathematics, chemistry, and physics teachers
were the least likely to return to teaching. Elementary teachers were the most likely to return
to the classroom after an interruption of at least five years.
27
Summary
In summary, the literature reveals a number of fairly consistent findings regarding the
characteristics of new teachers over the past several decades that are, for the most part, consistent with
the supply-and-demand framework that views the decision to teach as a choice embedded among a set of
alternative occupations and activities and implies that those individuals with more attractive options will
make other choices. These findings are as follows:
• Females formed greater proportions of new teachers than males.
• Whites formed greater proportions of new teachers than minorities.
• College graduates with higher measured ability were less likely to enter teaching than other
college graduates. It is possible, however, that these differences may be driven by the
measured ability of elementary school teachers, who represent the majority of teachers.
• Reentrants to teaching formed a significant proportion of newly hired teachers in the 1980s.
Science and math teachers were less likely to return than other teachers, whereas elementary
teachers and teachers with more prior experience were more likely to return.
• A more tentative finding based on a small number of weaker studies is that an altruistic
desire to serve society is one of the primary motivations for pursuing teaching.
IV.2. Individuals Who Remain in Teaching
The second research question under consideration is the following: Who remains in teaching? The
decision to continue teaching shares the same motivating principle that led to entry into teaching—
namely, the perception that among all available alternate activities, teaching remains the most attractive
in terms of compensation, working conditions, and intrinsic rewards.
We found a large number of empirical studies devoted to answering this research question. This is
because data on persistence in or attrition from the teaching profession abound. Many states keep
extensive records of the movements of their public school teachers in and out of the profession and often
make these data available to researchers, complete with the characteristics of the teachers and the schools
they work in and identifiers that allow teachers to be followed over time. Some of the most notable of
these datasets are collected in the states of New York, Texas, and Michigan. In addition, some nationally
representative datasets, such as the Schools and Staffing Survey, contain longitudinal data on teachers.
In addition to the relative abundance of data on this issue, there exist well developed statistical
models of attrition or persistence, many of which arose out of biomedical research, that investigated the
causes and incidence of mortality and illness. Researchers whose studies are cited later in this chapter
have applied various types of hazard and duration models to the study of the duration of teaching
careers. Although our conceptual framework describes the process by which individuals form their
decision to teach, one caveat to keep in mind is that not all teacher attrition is the result of choices made
28
by the teachers themselves. Singer and Willet (1988) discuss the possibility of bias in studies that assume
all attrition to be voluntary.
It is also important to keep in mind that teacher turnover is not synonymous with overall attrition
from teaching. More than one-half of all teacher turnover consists of migration from one school to
another (Ingersoll, 2001a). Many studies deal with teacher turnover by studying movements of teachers
across schools or districts. While this type of teacher turnover represents “attrition” from individual
schools or districts, it does not represent overall attrition from teaching. We try to note, whenever it is
appropriate, whether the study in question deals with teacher mobility (movements from one school to
another) or teacher attrition (leaving the occupation).
What the Literature Says
Teaching Versus Other Occupations
To place the issue of teacher retention in context, we first report on three studies that compare
rates of turnover in the teaching profession with those in other occupations. Two of the studies compare
turnover in teaching with turnover in nursing—a similarly female-dominated profession requiring some
degree of higher education—and other occupations. Taken together, these three studies suggest that the
teaching profession may have lower retention rates than the nursing profession but may not be an outlier
among the general group of occupations that employ college graduates. The studies all use somewhat
different measures of turnover, however, so it is difficult to compare numbers across the studies.
• Harris and Adams (Forthcoming), using data from the Current Population Survey over the
period from 1992 and 2001, found that the probability that teachers would leave their
profession was 1.16 percentage points higher than the same probability for accountants and
2.01 percentage points higher than that for nurses, but 4.8 percentage points lower than that
for all college graduates.
• Ingersoll (2001a) found that the 14-percent turnover rate for teachers in the Schools and
Staffing Survey in the early 1990s was relatively high when compared with an 11 percent
nationwide turnover rate for employees in all occupations published by the Bureau of
National Affairs and a 12-percent turnover rate published by a human resource consulting
firm for nurses in hospitals in the mid-1990s, although his definition of turnover
encompasses migration and his comparison of turnover rates from different data sources
carries with it some disadvantages.3
3 Harris and Adams (Forthcoming) point out that Ingersoll’s definition of turnover may be more inclusive
than the definition used by the Bureau of National Affairs, thus overstating the difference in rates. In addition, they point out that the human resource firm’s study of turnover in nursing was conducted in a different year than that of the Schools and Staffing Survey used by Ingersoll, thus reducing comparability.
29
• Henke, Zahn, and Carroll (2001) analyzed longitudinal data on 1993 college graduates from
the 1994 and 1997 waves of the Baccalaureate and Beyond Longitudinal Study and found that
among those who began teaching right after college and worked as full-time teachers in 1994
and who were working in 1997, 18 percent were no longer teaching in the later period, a rate
that was similar to rates for graduates who entered jobs in health, law enforcement, the
military, engineering, science, and legal support, but lower than rates for graduates entering
all other occupations. This attrition rate pertains only to those individuals who were
working in the second period, however, and thus underestimates the rate of all attrition from
teaching or other occupations.
Age and Experience
In reviewing the research on attrition, we found that many themes arose with a great deal of
consistency, a testament to the reliability of results based on good data and well developed methods.
One very stable finding is that retention varies considerably with the age and experience of individuals.
We know from several studies that attrition is high for young or new teachers and lower for older or
more experienced teachers until they reach ages at which retirement is feasible. This phenomenon
produces the well documented U-shaped plot of attrition against age or experience.
The following studies focus on the effects of age and experience on attrition. Some of these
studies—those using state public school or district-level databases—define entry and attrition as entering
and leaving teaching in the particular state or district system under consideration. Although it is likely
that teachers who entered or left the public school system left teaching altogether, it is possible that these
teachers may have come from or migrated to other states or private schools or gone into other education
positions, such as administration.
• Hanushek, Kain, and Rivkin (Forthcoming) analyzed data on more than 300,000 Texas
teachers during 1993–1996 and found that those who left Texas public schools were generally
either very young teachers in their first two years of teaching or very experienced teachers
nearing retirement eligibility.
• Kirby, Berends, and Naftel (1999) reported that approximately 16 percent of those who
entered teaching in Texas between 1987 and 1996 left the public school system within their
first year and 26 percent left within two years, although the rates of early attrition declined
somewhat with successive cohorts over the time period studied. In addition, they found that
second-year attrition rates were lower for slightly older teachers.
• Stinebrickner (1999) used the National Longitudinal Study of the High School Class of 1972, a
dataset that followed members of the high school class of 1972 in several waves through 1986,
and found that the probability of exiting teaching increased in the first four years of the
teaching career but then declined dramatically.
30
• Grissmer and Kirby (1992), using state administrative data on teachers in Indiana between
1965 and 1987, found that teachers who were 20–24 years old had higher-than-average
attrition rates (23 percent versus 12.4 percent on average in 1965 and 13 percent versus 5.6
percent on average in 1985).
• Murnane et al. (1991) found that the first year of teaching had the highest attrition rate,
although early attrition rates were higher in Michigan than they were in North Carolina.
First-year attrition for Michigan teachers was 21 percent, versus 11 percent for North
Carolina teachers. The authors suggest that this was due, in part, to anticipated student
declines and economic weakness in Michigan.
• Singer and Willet (1988), using data on newly hired teachers in districts in the St. Louis,
Missouri, area during 1969–1982, found that the risk of leaving teaching was greatest during
the first year of teaching (with a 25-percent probability of leaving) and remained high for the
next five years (with probabilities of leaving between 10 and 16 percent) but declined
considerably thereafter and was very small after year nine. The authors highlighted the
importance of detecting involuntary layoffs in survival and hazard analyses to avoid
erroneous conclusions. They found, for example, that the probability of leaving among
teachers hired after 1975 in the St. Louis area increased significantly during 1982 due to
layoffs caused by federal budget cuts.
• Dworkin (1980) analyzed responses to a questionnaire completed by more than 3,000 teachers
in one large Southwestern school district in the late 1970s and found that 30 percent of
teachers under the age of 36 reported that they were “seriously considering leaving the field
of education,” whereas only 17 percent of teachers above that age gave this answer. The
author also used follow-up data and found that 83 percent of the teachers who quit the
district at the end of the year had indicated they were seriously considering leaving and that
the majority of the teachers who indicated that they wanted to quit had not yet left teaching.
Unfortunately, the author did not compare the demographic characteristics of those who
actually quit with those who did not and relate those findings to demographic differences on
the perception questions. In addition, although the author claims to have investigated for
non-response bias and found none, the 44 percent response rate for this study was a cause for
concern.
The following studies address general teacher turnover (i.e., both attrition and mobility):
• Ingersoll (2001a) found the U-shaped pattern of attrition versus age and experience in his
analysis of turnover using data on more than 6,000 teachers in the Schools and Staffing
Surveys of the late 1980s and the early and mid-1990s.
• Boe et al. (1997) found the U-shaped turnover pattern using data on more than 4,000 teachers
from the Schools and Staffing Survey from the late 1980s, with younger and older teachers
31
more likely to leave teaching or transfer to another school than those in the group between
the ages of 30 and 49.
• Adams (1996) analyzed data on 2,327 elementary teachers hired by a large school district in
Texas between 1985 and 1991 and found that while the median length of a teacher’s duration
in a district was 71 months, approximately 25 percent of teachers left the district within two
years.
• Murnane (1984), using data on 104 elementary school teachers who worked in the early 1970s
in one urban school system, found that teacher turnover in that district was highest during
the first five years of the teaching career.
Gender, Family Characteristics, and Socioeconomic Status
In a number of studies, women were found to have higher attrition rates than men. In addition, a
few studies found that family-related reasons, such as maternity or marriage, were predictors of teacher
attrition. In general, these variables were found to affect female teacher attrition more than male teacher
attrition. Most of these studies were conducted using data from the 1970s and 1980s, with the most recent
using data from the early 1990s, however, and trends may have changed in the last decade.
• Stinebrickner (2002), using data on 422 female teachers and 1,028 female non-teachers in the
National Longitudinal Study of the High School Class of 1972 followed until 1986, found that
a large amount of teacher attrition was directly related to marriage and fertility events. For
example, the probability of exiting the workforce when a new birth occurs was 0.60 for a
female teacher and 0.31 for a female non-teacher.
• Stinebrickner (2001a), using data from the National Longitudinal Study of the High School
Class of 1972 on 450 individuals who were certified to teach and were followed until 1986,
found that female teachers had a higher probability than male teachers of leaving the
teaching profession at each year of duration of their first spell of teaching. The gap was
narrow at first, but widened with each year. In the case of female teachers, the probability of
remaining a teacher declined with marriage or as the number of children increased.
• Ingersoll (2001a), using the 1991–1992 Schools and Staffing Survey and Teacher Follow-up
Survey, found that male teachers were less likely to quit teaching than female teachers.
• Kirby, Berends, and Naftel (1999) using longitudinal data on public school teachers in Texas
from 1980–1996 found that, on average, white male teachers in Texas had a 5-percent lower
adjusted rate of attrition (i.e., leaving teaching) than white females.
• Stinebrickner (1998, 1999), using the National Longitudinal Study of the High School Class of
1972 through 1986, found that males tended to stay in teaching longer than females, even
after controlling for marriage and fertility. The 1998 study found that marriage was
32
associated with shorter teaching careers, while having children was associated with longer
careers.
• Ingersoll and Alsalam (1997), in a multi-level analysis of more than 53,000 teachers in the
1990–1991 Schools and Staffing Survey, found that self-reported commitment to the teaching
profession among working teachers was higher for women than men.
• Gritz and Theobald (1996), using data on white teachers in Washington State who began their
careers during the 1981–1990 time period and were followed through the 1991–1992 school
year, found that males remained in their teaching positions longer than females.
• Adams (1996), in a study of voluntary turnover among elementary teachers in a large Texas
school district in the late 1980s, found that women were 37 percent more likely to leave
teaching than men.
• Rees (1991), using education personnel data from New York State from 1975 through 1978,
found that male and female teachers before marriage had similar quit rates, but, after
marriage, women were more likely to quit than men.
• Kirby, Grissmer and Hudson (1991), using data on teachers in Indiana who taught during
1987–1988 but not the following year, found that pregnancy and childrearing were the most
frequently cited reasons for leaving teaching.
• Murnane et al. (1991) found in both Michigan and North Carolina that entering teachers who
were women over 30 years of age were less likely to leave teaching than men of any age,
whereas men, in turn, were less likely to leave teaching than women 30 years of age or
younger.
• Theobald (1990), using Washington State personnel records for the years 1984–1987, found
that older males were more likely than older females to leave the district.
• Allred and Smith (1984), using district files and survey data collected during the early 1980s
on 233 rural teachers and 834 urban teachers in Utah, found that the most often cited reason
for leaving rural districts during the school year was maternity (39 percent of teachers cited
this reason).
• Dworkin (1980) analyzed responses to a questionnaire completed by more than 3,000 teachers
in one large Southwestern school district in the late 1970s and found that teachers who came
from high-status families (measured by the status of the occupation of the head of household)
were more likely than those from medium- or low-status families to seriously consider
quitting teaching—28.1 percent from high-status families planned to quit versus 23.6 percent
from medium-status families, and 13.9 percent from low-status families. The response rate
for this study was only 44 percent, however, raising the potential for non-response bias.
33
Race/Ethnicity
Another finding that emerged from several studies was that minority teachers tended to have
lower attrition rates than white teachers.
• Ingersoll (2001a), using the 1991–1992 Schools and Staffing Survey and Teacher Follow-up
Survey to investigate factors related to teacher attrition, found that minority teachers were
less likely to quit teaching than white teachers.
• Kirby, Berends, and Naftel (1999), in their study of Texas cohorts who entered teaching
between 1987 and 1996, found that Hispanic teachers had the lowest early attrition rates.
Median teaching spells were six years for white female teachers, seven years for white male
teachers, ten years for Hispanic females and males, nine years for black females, and six years
for black males.
• Adams (1996), in a study of elementary school teachers in a large Texas school district in the
late 1980s, found that African-American teachers had lower attrition rates than teachers of
other races. Whites were 385 percent more likely than African-Americans to leave the district
and 57 percent more likely than Hispanics to leave the district. The district in question had a
predominantly non-white enrollment.
• Shin (1995), using the 1986 follow-up questionnaire in the National Longitudinal Study of the
High School Class of 1972 that included 455 teachers and 331 former teachers, found that the
median teaching spell for minority teachers was 9.8 years versus 6.1 years for white teachers.
• Murnane et al. (1991), using state administrative data from North Carolina and Michigan,
found that black teachers were more likely to work in large, poor, urban districts than white
teachers. After controlling for district-level fixed effects, black teachers had higher retention
rates than white teachers.
• Murnane and Olsen (1989a) used longitudinal data on teachers who began teaching in
Michigan between 1972 and 1975 and found that black teachers had longer teaching spells
than white teachers employed by the same district.
• Dworkin (1980) analyzed responses to a questionnaire completed by more than 3,000 teachers
in one large Southwestern school district in the late 1970s and found that more white teachers
than minority teachers reported that they were “seriously considering leaving the field of
education”—27.8 percent of whites versus 15.5 percent of blacks and 17.8 percent of Latinos.
The response rate for the study was only 44 percent, which could have resulted in non-
response bias.
Ability, Field, and Qualifications
Attrition may be detrimental to teaching for a number of reasons. For example, replacement
teachers may be inexperienced, class sizes may increase in response to hard-to-fill vacancies, or schools
34
and districts may be forced to spend valuable administrative resources on hiring and mentoring new
teachers. If effective teachers are less likely to leave than less effective teachers, however, then high levels
of teacher attrition may not necessarily be detrimental to the overall quality of the teaching workforce. In
an attempt to shed light on this question, a number of studies have investigated the relationship between
attrition and measured ability or qualifications. Retention rates tended to vary by level of certification
and field, and, while the preponderance of evidence suggests that teachers with higher measured ability
have a higher probability of leaving, some studies find that the relationship is nonlinear or insignificant.
Therefore the findings in the literature on this point are somewhat mixed.
• Lankford, Loeb, and Wyckoff (2002), using personnel data on a cohort of all public school
teachers who began teaching in New York State in 1993, found evidence to support the
hypothesis that more qualified teachers have higher rates of turnover, both in terms of
attrition (leaving the system altogether) and migration (switching schools and districts).
Teachers leaving the system were somewhat less likely to have failed their certification exam
on their first attempt and 60 percent more likely to have received their bachelor’s degree from
a highly competitive college. Teachers transferring to districts that were different from the
district in which they began their careers were half as likely to have failed their certification
exam and 35 percent more likely to have received their degree from a highly competitive
institution than teachers who stayed in the same district. Receiving schools had, on average,
four percentage points fewer poor students and two percentage points fewer nonwhite
students. Teachers generally left schools in which the proportion of nonwhite and poor
students was about 75 to 100 percent greater than in the schools to which they transferred.
• Stinebrickner (2001a), using data from the National Longitudinal Study of the High School
Class of 1972 on 450 individuals who were certified to teach and followed through 1986,
found that the probability of remaining in teaching declined more rapidly over time for
teachers in the high-SAT group versus those in the low-SAT group. The author also found
that high-SAT individuals received wage premiums in non-teaching jobs but not in teaching.
Stinebrickner (2001b) found similar results.
• Henke et al. (2000), in their study of longitudinal data on more than 11,000 college graduates
from the class of 1992–1993 in Baccalaureate and Beyond, found that graduates who became
teachers and had college entrance examination scores in the top quartile were twice as likely
to have left teaching within four years as those with scores in the bottom quartile. In
addition, among those who were teaching four years after graduation, only two-fifths of
those in top quartile reported that they expected to be teaching three years later, in contrast
to three-quarters of teachers with scores in the bottom three quartiles.
• Marso and Pigge (1997) and Pigge and Marso (1992) studied 550 teacher candidates who
began their first required course at an Ohio university in 1985 and were followed up five
35
years later in the first study and seven years later in the second study. Of the initial cohort
candidates, those who persisted through the teacher preparation program and became
teachers had slightly higher grade point averages and Comprehensive Tests of Basic Skills
(CTBS) scores, but did not differ from non-persisters with respect to ACT scores.
• Shin (1995), using the 1986 follow-up questionnaire in the National Longitudinal Study of the
High School Class of 1972 that included 455 teachers and 331 former teachers, found that
teachers with grade point averages (GPAs) in the middle range were more likely to remain in
teaching than teachers in either the top or the bottom range of the GPA distribution.
• Murnane and Olsen (1990) found in two North Carolina teacher cohorts—one beginning in
the period from 1975 to 1979 and the other beginning in the period from 1980 to 1984—that
teachers with higher NTE scores had shorter teaching spells, but teachers with the highest
NTE scores had longer spells; thus, the relationship was nonlinear.
• Murnane, Singer, and Willett (1989) found that, among whites who began teaching secondary
school in North Carolina between 1976-1978 and were later tracked through 1986, those with
high NTE scores were nearly twice as likely to leave after one year than teachers with low
scores. In addition, high NTE score teachers were less likely to return after a career
interruption.
• Schlechty and Vance (1981), using administrative data on 32,131 entering teachers in North
Carolina from 1973 to 1980, found that those with higher NTE scores left teaching at a faster
rate than those with lower NTE scores. For white females hired in 1973 with the highest 10
percent of NTE scores, only 37.3 percent remained in teaching after seven years, compared
with 62.5 percent of the corresponding group with the lowest 10 percent of NTE scores;
individuals between these extremes consistently exhibited the same negative relationship
between test scores and retention. Findings for white males were similar although less
consistent; findings for black males and females were similar although less pronounced in
magnitude.
The following studies found that secondary teachers, particularly science teachers and sometimes
math teachers, were more likely to leave than elementary teachers.
• Henke, Zahn, and Carroll (2001), in their study of more than 700 college graduates in the 1994
and 1997 waves of the Baccalaureate and Beyond Longitudinal Study, found that first-time
teachers in 1994 who had majored in engineering, math, or natural science were less likely to
be found teaching in 1997 than teachers who had majored in education, with an attrition rate
of 30 percent versus 14 percent, respectively. As mentioned previously, caution is necessary
in comparing these numbers with those in other studies because of the particular definition
of turnover used in this study.

36
• Ingersoll (2001a), using the 1991–1992 Schools and Staffing Survey and Teacher Follow-up
Survey found that mathematics and science teachers were more likely to leave than teachers
in other subject specialties.
• Kirby, Berends, and Naftel (1999), in their study of Texas cohorts entering teaching between
1987 and 1996, found that departmental teachers, and especially science teachers, had higher
attrition rates than elementary teachers.
• Shin (1995), using the National Longitudinal Study of the High School Class of 1972 through
1986, found that elementary teachers stayed longer than secondary teachers, with average
survival times of 8.34 and 5.66 years, respectively.
• Arnold, Choy, and Bobbit (1993) found that math and computer science teachers were three
times more likely to leave than other secondary teachers in their analysis of the 1987–1988
Schools and Staffing Survey and its Teacher Follow-up a year later.
• Beaudin (1993) in a study of first-time teachers in 1972–1975 who left Michigan public schools
within four years of entry, found that physics, chemistry, and math teachers had the lowest
probability among all teachers in all fields of returning to the classroom by 1985.
Approximately one-third of the elementary teachers and one-fourth of English teachers who
left returned subsequently to teaching in a public school. In contrast, physics, chemistry, and
math teachers had the lowest probabilities of returning. Close to 20 percent of mathematics
teachers and 12 percent of physics or chemistry teachers who left returned to public school
teaching.
• Grissmer and Kirby (1992), in their study of teachers in Indiana between the years of 1965
and 1987, found that secondary school teachers had higher permanent attrition rates than
elementary teachers, and science teachers had particularly high rates. Physics and chemistry
teachers had rates that were 80 percent higher than those of elementary teachers. Biology
teachers had rates that were 65 percent higher, and English teachers had rates that were 20–
25 percent higher.
• Murnane et al. (1991) found greater attrition and a lower likelihood of return among
chemistry and physics teachers. They also found that retention was higher among
elementary teachers than among secondary teachers.
• Murnane and Olsen (1990), in their study of North Carolina teacher cohorts who began in the
1970s, found that the average adjusted length of a first teaching spell was shorter for high
school teachers than for elementary school teachers. Among high school teachers, chemistry
and physics teachers had the shortest first spells (a predicted median spell of 4.8 years) and
mathematics teachers had the longest spells (a predicted median spell of 12 or more years).
• Murnane and Olsen (1989b) followed North Carolina, Michigan, and Colorado teachers who
began their careers in the 1970s and had either stayed in teaching or had left and returned to
37
teaching during the late 1980s. They found that high school teachers were more likely to
leave teaching than elementary teachers. The median first-spell length of elementary
teachers was 13.5, 16.4, and 6.6 years in North Carolina, Michigan, and Colorado,
respectively (note that sample sizes for Colorado are less than one-fifth of sample sizes for
the other two states). Chemistry and physics teachers had the lowest median first-spell
lengths of all teachers, with 4.1 and 4.9 years in North Carolina and Michigan, respectively.
After leaving, elementary teachers were more likely to return than high school teachers. In
North Carolina and Michigan, 28 percent and 33 percent of elementary teachers returned for
a second spell less than six years after finishing their first spell (the average for all teachers
was 25 percent and 30 percent in both states, respectively). Mathematics and
physics/chemistry teachers had the lowest reentry rates, 19 percent and 16 percent,
respectively, in North Carolina, and 22 percent and 15 percent in Michigan.
One study found evidence to contradict the pattern of higher attrition by field, although this study
used a relatively small sample and older data.
• Mont and Rees (1996) analyzed ten years of longitudinal data on 525 high school teachers
hired in the State of New York in 1979 and found that math and science teachers’ turnover
patterns did not differ significantly from those of teachers of other subjects.
One study found evidence that better job matches improved retention rates, and two others posit
that poor matches increased dissatisfaction, but the data used in these studies are old.
• Boe et al.’s (1997) analysis of the 1987–1989 Schools and Staffing Survey found that teachers
with a full certification in their main assignment were less likely to leave teaching.
• Rumberger (1985), in an analysis of the Survey of 1979–1980 College Graduates, found that
more than one-third of college graduates certified to teach science or mathematics were not
teaching those subjects and suggested that one reason for shortages in these fields was mis-
assignment.
• Dworkin (1980) analyzed responses to a questionnaire completed by more than 3,000 teachers
in one large Southwestern school district in the late 1970s and found that teachers assigned to
a school in which they preferred not to teach were more likely to report that they were
“seriously considering leaving the field of education” than were teachers who said they
preferred to teach in their current school (43.8 percent versus 20.5 percent). The author did
not correlate these responses to actual attrition, however, and the study’s response rate was
only 44 percent, which raised the possibility of non-response bias.
The evidence on whether teachers with post-graduate degrees stayed in teaching longer is mixed.
The following studies found that teachers with more education were more likely to leave teaching.
38
• Kirby, Berends, and Naftel (1999), in their study of Texas cohorts who entered teaching
between 1987 and 1996, found that teachers with advanced degrees at entry tended to have
higher attrition rates than those entering with a bachelor’s degree.
• Ingersoll and Alsalam (1997), in their analysis of teacher reports of a sense of commitment to
the teaching profession the 1990–1991 Schools and Staffing Survey, found that commitment
was lower for teachers with graduate degrees than those with bachelor’s degrees or less.
• Rees (1991), in his study of teachers in New York State in the 1975–1978 time period, found
that more highly educated teachers were more likely to quit, all else equal.
• Theobald (1990), using Washington State data on teachers for the years 1984–1987, found that
male teachers with graduate degrees were nearly 50 percent more likely to leave their
positions than were similar males without these degrees. The effect of graduate degrees was
not statistically significant for females.
Two studies found the contrary, however—i.e., that teachers with only a bachelor’s degree were
more likely to leave.
• Adams (1996), using data on elementary teachers hired by a large school district in Texas
between 1985 and 1991, found that teachers with only a bachelor’s degree were 68 percent
more likely to leave than those with graduate degrees.
• Shin (1995), using the National Longitudinal Study of the High School Class of 1972, found
that median “survival” times were higher for teachers with master’s degrees (10.60 years)
than for teachers with bachelor’s (5.24 years), doctoral (2.98), and associate’s degrees (2.96
years).
The fact that these studies analyze people with various lengths of experience may confound the
differential effect of education on teacher attrition. The following study points to factors that may help
reconcile these contradictory findings, although the data used in this study are quite old.
• Beaudin (1993), using data from Michigan on public school teachers who began their careers
in the early 1970s and were followed until 1985, found that teachers who began their careers
with a bachelor’s degree were more likely to return to teaching. Attrition and having a
master’s degree were positively correlated in the case of inexperienced teachers, but
negatively correlated when teachers had more than three years of experience, suggesting that
teachers with only a bachelor’s degree may interrupt their careers at an early stage to obtain
more education.
Psychological Predictors
A few studies pointed to psychological factors that appeared to influence the decision to leave
teaching and the length of teaching spells.
39
• Johnson and Birkeland (2003), in a descriptive analysis of longitudinal interview data
collected in 1999, 2000, and 2001 from 50 first- and second-year teachers in Massachusetts
public schools, found that those who left the profession within the three-year period either
saw their careers as short-term occupations or had experienced frustration or a sense of
failure.
• Marso and Pigge (1997) found that, among approximately 550 teacher candidates in 1985
who were surveyed seven years later, those who were initially very certain about their
decision to teach were more likely to persist.
• Miech and Elder (1996), using data from the National Longitudinal Study of the High School
Class of 1972 followed through 1986, found that people who could be categorized as
“idealists” were more likely to leave the teaching profession. They also looked at data that
tracked a cohort of 1961 college seniors who were followed through 1964 and found that
male idealists who went into teaching were more likely than male non-idealists to leave
teaching by 1964, whereas attrition among female idealists was indistinguishable from that of
female non-idealists. They speculate that since women had fewer labor market choices in the
earlier period, psychological factors did not play as much of a role in their choice of
occupation as they did later on.
• Chapman and Hutcheson (1982), using survey data on more than 500 alumni of teacher-
education programs in three public universities in Indiana who graduated between 1967 and
1978, found that individuals who assigned a higher value to recognition by administrators
but a lower value to salary increases, job responsibility and autonomy, the opportunity to
learn new things, and the chance to contribute important decisions, were more likely to
remain in elementary school teaching. Those who assigned more importance to approval
from family and friends and recognition by administrators but less importance to job
responsibility and autonomy were more likely to remain in teaching high school. Survey
responses could reflect retrospective justifications for decisions rather than causes of those
decisions, however.
Summary
There are several themes that arise fairly consistently in the teacher attrition literature. For the
most part, these findings are consistent with the supply-and-demand framework outlined in Chapter II
and tend to support the notion that individuals with higher “opportunity costs” are more likely to leave
teaching. These themes are as follows:

40
• The highest attrition rates seen for teachers occurred in their first years of teaching and after
many years of teaching when they were near retirement, thus producing a U-shaped pattern
of attrition with respect to age or experience.
• Minority teachers tended to have lower attrition rates than white teachers.
• Teachers in the fields of science and mathematics were more likely to leave teaching than
teachers in other fields.
• Teachers with higher measured ability were more likely to leave teaching.
• Female teachers typically had higher attrition rates than male teachers.
• Family-related situations, such as marriage and children, were related to higher teacher
attrition, particularly for women, although the data supporting these hypotheses are old.
41
CHAPTER V: THE EXTERNAL CHARACTERISTICS OF DISTRICTS AND SCHOOLS THAT SUCCESSFULLY RECRUIT AND RETAIN TEACHERS
Ease of recruitment and retention can vary substantially from school to school or district to district.
In order to fill in the context within which policies can be formed, we examined a number of studies that
drew associations between district or school characteristics and their ability to attract or retain teachers.
In deciding whether to continue or leave teaching, teachers make ongoing assessments of the
attractiveness of teaching relative to alternative occupations or activities that they might pursue. The
school environment plays a large role in these decisions. In this chapter, we consider only the external
characteristics of schools and districts that affect recruitment and retention—i.e., those that are not
generally within their control but are instead based on the demographics of the population they serve.
Examples of these external characteristics are wealth, urban/rural status, or minority status. In addition,
we include a discussion of differences in recruitment or retention rates between private and public
schools in this chapter. We reserve our discussion of features of a school or district environment that can
be determined internally for our later chapter on policies that promote recruitment and retention.
What the Literature Says
In reviewing these studies of the external characteristics of schools or districts that were successful
in recruiting and retaining teachers along some dimension, we found that size, location, wealth, student
composition, school grade level, and school type appeared to play a role, although the relationships
tended to vary somewhat from study to study.
• Smith and Ingersoll (2004) used data from the 1990–2000 Schools and Staffing Survey and its
Teacher Follow-up Survey and found that in the sample of more than 3,000 beginning
teachers, attrition and migration to different schools varied by school characteristics. Public
school teachers in high-poverty schools were more likely than their counterparts in medium-
poverty schools to leave (16 percent versus 9 percent) and less likely to move (13 percent
versus 19 percent). Charter schools had high attrition rates—about a quarter of beginning
charter-school teachers left after their first year.
• Using personnel data on all new public school teachers in New York State who began
teaching in 1993, Lankford, Loeb, and Wyckoff (2002) found that fewer than 40 percent of
new teachers hired in that year were still teaching by 1998 in the same school in which they
began their careers. There were significant differences in turnover rates depending on the
type of school. For example, teacher turnover rates tend to be higher in urban schools,
particularly those in large urban areas: 28 percent of teachers in the New York City region
were still in the same school five years later compared with 46 percent in suburban schools.
42
• Hanushek, Kain, and Rivkin (Forthcoming) analyzed data on more than 300,000 Texas
teachers during 1993–1996 and found that school characteristics played a large role in
influencing teacher movements across schools and exits from the system. Schools serving
academically disadvantaged students and greater proportions of minority students had
greater difficulty retaining teachers than high-achieving, low-minority schools. This was
mainly due to the movements of white teachers (the majority), who appeared to gravitate
toward schools with non-minority, higher-income students. African-American teachers, on
the other hand, tended to move into schools with higher black enrollments than the schools
they left.
• Ingersoll (2001a), using the Schools and Staffing Survey in the 1980s and 1990s, found that
large schools had lower turnover rates than small schools. In addition, he found that
wealthier schools and rural schools tended to experience less teacher turnover than poorer or
urban schools.
• Carter and Carter (2000) analyzed the survey responses of education majors in North
Carolina and Virginia and found that middle schools were considered less desirable to these
prospective teachers, due primarily to concern over disciplinary and attitudinal problems
among adolescents. Respondents reported that salary incentives or small class sizes would
compensate for the undesirable characteristics of middle schools. With a sample size of 170
and no response rate provided, however, it is difficult to assess the validity of their findings.
• Ingersoll and Alsalam (1997), in a multi-level analysis of more than 53,000 teachers in more
than 11,000 schools in the 1990–1991 Schools and Staffing Survey, found that self-reported
commitment to the teaching profession among working teachers was lower for teachers in
secondary schools than for those in combined schools and higher for teachers in urban and
suburban schools than for those in rural schools.
• Shen (1997), using data from the Schools and Staffing Survey from 1990–1991 and the Teacher
Follow-up Survey from 1991–1992, found that teachers who stayed in the same school from
1991 to 1992 were more likely to be teaching in schools with fewer inexperienced teachers
and lower percentages of minority and free-lunch-eligible students.
• Murnane et al. (1991), in their studies of Michigan and North Carolina teachers, found that
large, poor, urban districts had high attrition rates and were less successful at retaining their
white teachers than their nonwhite teachers.
• Rees (1991), using education personnel data from New York State from 1974 to 1978, found
that teachers of below-average students and teachers in urban districts had higher
probabilities of leaving than teachers of above-average students or those in suburban
districts. In addition, increases in county unemployment rates were linked to reductions in
the probability of quitting.
43
• Allred and Smith (1984), using district data on 233 rural teachers and 834 urban teachers,
found that attrition rates in Utah in the early 1980s were higher in rural districts than in
urban districts, although their analysis was based on a simple presentation of means and did
not include covariates or statistical tests. It appeared that most of the departing teachers in
rural schools were female elementary teachers.
Most of the previous studies support the notion that schools with more minority students and
lower academic achievement have higher teacher attrition rates. The following study provides
contradictory findings. The empirical strategy in this study, however, casts some doubt on the
interpretation placed on the findings.
• Shin (1995), using the 1986 follow-up questionnaire in the National Longitudinal Study of the
High School Class of 1972, found that teachers in schools with higher proportions of low-
ability students stayed about a year longer than teachers in schools with higher proportions
of high-ability students. In addition, he found that teachers in schools with mixed economic
status populations stayed nearly twice as long as teachers in schools with student
populations that were strictly upper or strictly lower in socioeconomic status. They also
found that smaller schools had more teacher attrition than larger schools, with median
survival times of 5.31 years and 7.30 years, respectively. An important shortcoming of the
empirical strategy used here was that the effects were derived for each variable
independently rather than from a multivariate approach that analyzed one variable while
controlling for other potentially important factors.
One study looked at the effects of attrition on the distribution of teacher qualifications across
different types of schools and districts.
• Carroll et al. (2000) found higher attrition and vacancy rates in high-minority districts than in
low-minority districts in California in the late 1990s. This finding, combined with the fact
that class-size reduction mandates produced teacher shortages and that high-minority
districts were less successful in recruiting credentialed teachers, resulted over the late 1990s
in a sorting of teachers such that schools with disproportionate shares of minority children
employed teachers with lower qualifications than schools with fewer minority students.
A number of studies investigated differences in recruitment and retention between public and
private schools.
• Smith and Ingersoll (2004), in their analysis of the 1990–2000 Schools and Staffing Survey and
its Teacher Follow-up Survey, found that beginning teachers in private schools were less
likely to migrate among schools than those in public schools (10 percent versus 16 percent)
but more than twice as likely to leave (26 percent versus 11 percent), but most of this
difference was driven by leaving rates in non-Catholic private schools versus Catholic
schools (36 percent versus 16 percent).
44
• Ingersoll (2001a and 2001b) found that private schools had higher annual turnover rates (18.9
percent) than did public schools (12.4 percent). The bulk of the difference was made up of
those who left teaching; both private and public schools had about 7 percent annual rates of
teachers moving to other schools. Among private schools, non-Catholic religious schools had
the highest turnover at 21.5 percent, with Catholic schools at 17.7 percent, and non-sectarian
schools at 16.1 percent. The difference between public and private schools was related to the
fact that private schools tended to be smaller than public schools. Large private schools (600
or more students) had a 9.8 percent annual turnover, and small private schools had a 22.8
percent annual turnover. Of all school categories studied, large private schools had the
lowest rate of teachers moving to other schools (about 3 percent), while small private schools
were comparable to public schools in the rate of teachers moving to other schools (about 8
percent).
• Ballou and Podgursky (1998) compared public school and private school principals’ ratings
of their teachers from the 1990–1991 Schools and Staffing Survey and found that while new
teachers were rated similarly by public and private school principals, experienced teachers
were rated significantly higher by private school principals than by public school principals,
but these results were not followed up by an analysis of actual attrition in public versus
private schools or by an analysis of the mechanisms by which private schools may be able to
retain higher quality staff.
• Whitener et al. (1997), in their analysis of data on more than 7,000 teachers from the 1994-
1995 Teacher Followup to the 1993-1994 Schools and Staffing Survey, found that the attrition
rate for public school teachers was 6.6 percent, compared with 11.9 percent for private school
teachers. Public school teachers were more likely than private school teachers to leave for
reasons related to retirement and child rearing, and private school teachers were more likely
than public school teachers to leave to pursue other types of employment. Of the group of
public school teachers who left due to dissatisfaction with teaching as a career, 17.9 percent
cited student discipline problems, 17.6 percent cited poor student motivation to learn, and
15.3 percent cited inadequate support from administration as the main reasons for
dissatisfaction. Among private school teachers who left due to dissatisfaction, lack of
recognition and support from administration (30.2 percent) and poor opportunity for
professional advancement (14.6 percent) were cited as the main reasons for dissatisfaction.
• Ingersoll and Alsalam (1997), in their analysis of data from the 1990–1991 Schools and
Staffing Survey, found that teachers in private schools reported a greater sense of
commitment to the teaching profession than those in public schools.
• Shin (1995), using the 1986 follow-up questionnaire from the National Longitudinal Study of
the High School Class of 1972, found that public schools experienced higher teacher retention
45
than private schools, with medians of 8.26 years and 3.83 years, respectively. Most of the
attrition in private schools occurred during the first few years. As mentioned in the previous
section, however, their empirical strategy is limited by a lack of control variables.
• Arnold, Choy, and Bobbit (1993) found that public schools had a slightly lower first-year
attrition rate than private schools (6 percent versus 11 percent, respectively) in their analysis
of the 1987–1988 Schools and Staffing Survey and its Teacher Follow-up a year later.
Summary
Regarding the external characteristics of schools and districts that have higher teacher recruitment
and retention rates, these studies provided some fairly consistent findings that suggested that certain
characteristics of the school environment might have a impact on retention rates:
• Schools with higher proportions of minority students, students in poverty, and low-
performing students tended to have higher attrition rates.
• In most studies, urban school districts had higher attrition rates than suburban and rural
districts.
• Teacher retention was generally found to be higher in public schools than in private schools.
It appeared from the research evidence that urban schools with high minority enrollments and
many students in poverty are difficult to staff, particularly if these schools are trying to attract non-
minority teachers. Unless the trends reported here have changed in recent years, the research suggests
that hard-to-staff schools must devise adequate compensatory policies to attract and retain teachers.


47
CHAPTER VI: POLICIES TO PROMOTE RECRUITMENT AND RETENTION
In this chapter, we discuss research that focuses upon specific policies to promote recruitment and
retention. In the supply-and-demand framework outlined in Chapter II, we maintained that individuals
based their decisions to enter or remain in the teaching workforce upon their assessment of the
attractiveness of the teaching profession relative to alternative opportunities accessible to them.
Individuals measure the relative attractiveness of teaching by comparing the compensation levels,
working conditions, and intrinsic rewards it offers with those of other occupations available to them.
Districts, schools, and other educational institutions, therefore, can undertake measures to change
compensation, working conditions, and the factors that contribute to personal satisfaction when they
wish to increase, shrink, or otherwise influence—e.g., affect the quality of—the supply of both new and
continuing teachers.
Upon reading the research literature regarding these policy levers and the results that might be
expected of them, we found it helpful to group policies into three categories: (1) compensation policies,
(2) pre-service policies, and (3) in-service policies. While the policies studied in the literature that relate
directly to the issue of compensation are fairly similar in nature, the pre-service and in-service policies
that are the focus of published research are far less homogenous. In the three sections below, we discuss
the research that falls within each policy category in turn.
VI.1. Compensation Policies
We reviewed a large number of studies that dealt explicitly with the relationship of compensation
to recruitment and retention. Flyer and Rosen (1997) maintained that between 1960 and 1990, the “true”
real wages of teachers (adjusting for education, experience and other variables), particularly teachers in
elementary schools, declined relative to wages for other college graduates. If so, then specific districts
and schools could have acted to increase the relative attractiveness of the teaching profession by
increasing salaries to offset the general decline. In our review of the research, we consistently found that
cross-sectional variation in salary was indeed associated with teacher recruitment and retention. Even
authors of previously reviewed studies citing psychological factors, such as a desire to help young people
or to contribute to the betterment of society, as among the reasons to enter teaching cited salary, as well,
as an important factor motivating teacher dissatisfaction and decisions to quit (e.g., Hounshell and
Griffin, 1989; King, 1993; Allred and Smith, 1984; Hall, Pearson and Carroll, 1992; Chapman and
Hutcheson, 1982) as did many other authors.
The sheer volume of empirical work on the topic of teacher compensation and its effect on
recruitment and retention stems from three sources: (1) the existence of several sources of data on teacher
48
salaries, (2) the fact that information on cross-sectional variation in salaries can be used to infer the effect
of increases or decreases, and (3) the high policy interest in teacher compensation. In general, the
reported effects of compensation found in the research have been derived from coefficients on salary in
turnover or attrition analyses.
What the Literature Says
A large number of studies offered evidence suggesting that higher teacher salaries were associated
with greater retention.
• Using data from teacher personnel files, Lankford, Loeb, and Wyckoff (2002) found that
teachers transferring to other districts in New York State between 1993 and 1998 experienced
increases in salary of between 4 and 15 percent.
• Hanushek, Kain, and Rivkin (Forthcoming) analyzed data on more than 300,000 Texas
teachers during 1993–1996 and found that salary increases were positively related to teachers’
decisions to switch schools, particularly for male teachers.
• Kirby, Berends, and Naftel (1999), in studying Texas teacher cohorts from 1987 to 1995, found
that a $1,000 increase in salary was associated with reduced attrition from the state education
system of about 2.9 percent overall and 5 to 6 percent among Hispanic and black teachers.
• Stinebrickner (1998, 1999), using data from National Longitudinal Study of the High School
Class of 1972 on 341 individuals who were certified to teach and followed until 1986, found
that wages were significantly related to duration. A person with a wage that was one
standard deviation above the mean had about a 9-percent greater probability of staying in
teaching for more than five years.
• Boe et al.’s (1997) study of early attrition in the 1987–1989 Schools and Staffing Survey found
that base salary was a positive and significant predictor of retention.
• Mont and Rees (1996), using ten years of longitudinal data on 525 high school teachers hired
in the State of New York in 1979, found that higher salaries were associated with lower
attrition. This study indicated that, all else equal, a 10-percent increase in starting salaries
would result in 6 percent less attrition.
• Gritz and Theobald (1996), in a study using data on approximately 10,000 white teachers
from Washington State from 1981 through 1992, found that white female teachers were less
likely to leave if their districts’ salaries were high relative to those in other districts and that
white male teachers were less likely to leave if their districts’ salaries were high relative to
salaries in other occupations.
• Brewer (1996) found a positive association between teacher salaries and the retention rates of
female teachers in New York between 1975 and 1990. He also found that higher alternative
49
rewards, measured by teaching salaries outside the district, were related to higher attrition
rates, and that, for men, higher district salaries for administrators were linked to higher
retention rates, suggesting that the prospect of future earnings induced men to stay in
teaching.
• Beaudin (1995), using data collected in 1985 from 898 teachers in Michigan public schools
who started their careers in the early 1970s, found that teachers who had begun working in
districts that paid higher starting salaries, had higher per-pupil expenditures, and lower
student-teacher ratios, were more likely to return to teach in those districts after a career
interruption.
• Grissmer and Kirby (1992), using state administrative data on teachers in Indiana between
the years of 1965 and 1987, found that a 10-percent increase in salary was associated with
about a 10-percent reduction in attrition among men and a 4 percent reduction in attrition
among women.
• Murnane et al. (1991) and Murnane, Singer, and Willet (1989) found evidence that higher
salaries were associated with reduced attrition in a study of several thousand white North
Carolina secondary school teachers who began teaching in the late 1970s. They found that
the association disappeared, however, by the eighth year of a teacher’s career.
• Rickman and Parker (1990), using data from the Current Population Survey, found that
approximately 5 percent of the respondents who said they were teaching in 1984 were no
longer teaching in 1985. The data suggested that when the wage differential (i.e., actual
teacher wages relative to wages in other occupation) increased by 1 percent, the probability
of leaving was reduced by 1.75–2.11 percent (depending on the occupations selected for the
denominator of the wage differential).
• Theobald (1990), using Washington State personnel records for the years 1984–1987, found
that a teacher’s estimated next-year salary was positively correlated with the decision to
remain. If teachers could predict that they would earn 10 percent more next year in their
current district, they were 6.9 percent more likely to stay, holding all else constant.
• Murnane and Olsen (1990), using data on two cohorts of North Carolina teachers that began
teaching in the 1970s and were followed until 1986 (the sample size was 13,890), found that a
$1,000 increase in salary (1987 dollars) was associated with an increase in the median first
teaching-spell duration of two to three years for a teacher who started in 1975. An interaction
between salary and year of entry showed that this effect declined over time, however. For
teachers beginning teaching in 1979, the association was about half the association for
teachers beginning in 1975.
• Murnane and Olsen (1989a) found a fairly large positive effect of salaries on retention in the
cohort of nearly 8,000 Michigan teachers who began teaching between 1972 and 1975. The
50
same authors found that higher salaries were also associated with longer teaching spells in
their study of 1975–1979 and 1980–1984 teacher cohorts in North Carolina, but that the effect
diminished in the later cohort.
• Jacobson (1988) performed a comparison of district salaries and retention rates in New York
State in years 1974–1975 and 1984–1985 and found that suburban districts that improved
salaries for experienced teachers had higher overall teacher retention rates than districts that
did not. The effect was strongest for female suburban teachers. This was not the case in rural
areas, where districts with unchanged salary rankings for senior and mid-career teachers
experienced higher teacher retention rates, particularly in the case of male teachers. The
study suffers from methodological issues, however, such as censoring problems and sample
attrition (e.g., the study does not follow teachers who started in 1974 until 1985, but looked
only at average retention rates from the two periods).
• Seyfarth and Bost (1986), in a simple correlation analysis, found that superintendents
reported lower teacher turnover in districts with higher salaries.
Two small, older studies found a relationship between compensation and recruitment.
• Hounshell and Griffin (1989) surveyed 37 graduates of the science teacher-education
program at the University of North Carolina, Chapel Hill, from 1977–1983 who had left
teaching and reported that roughly a third of the interviewees said that higher salaries would
encourage them to reenter teaching. The small sample size in this study, however, limits the
generalizability of its results.
• Reed and Busby (1985) analyzed surveys of rural school administrators in Virginia and found
that 76 percent of reported new hires were made in districts offering high levels of starting
salaries or benefits and that 72 percent of reported attrition was in districts offering low
amounts of tuition for coursework or money for instructional materials.
Three older studies offered evidence that salary differentials may have an impact on teachers in
fields in which there are shortages.
• Rumberger (1987), using data from the 1980 U.S. Census and the 1983 Survey of Teacher
Demand and Shortage administered to 453 districts in large Metropolitan Statistical Areas,
found that the percentage of uncertified math and science teachers was positively related to
the salary differential between engineers and teachers in the area. In addition, he found that
the same salary differential was positively related to overall turnover in the district.
• Evans (1987) administered questionnaires to a sample of engineering freshmen at a medium-
sized Midwestern university in 1983 to investigate attitudes toward science or mathematics
teaching as a career choice. Within the sample, the author distinguished those who were
teaching oriented (e.g., had expressed interest in teaching at some point and taken some kind
of action in that direction) from those who were not teaching oriented (e.g., had never
51
expressed an interest in teaching, or had expressed some interest but did not take any action).
Among both teaching-oriented students (N=20) and non-teaching-oriented students (N=77),
low salaries ranked first among the reasons that discouraged them from pursuing a teaching
career. Small sample sizes may limit the generalizability of these results to a larger
population, however.
• Levin (1985), using salary survey datasets, provided evidence that salary offers to college
graduates in business and industry sectors were higher than those in teaching and that this
differential was particularly high for science and math majors.
The studies cited in the previous paragraphs inferred the effect of an increase in salary on the
observable behavior of teachers—i.e., whether they stayed or left teaching. We found a small number of
studies that surveyed current and former teachers and asked those who left to explain their reasons for
doing so. Even though there are self-reported data available in large-scale surveys, such as the Schools
and Staffing Survey and its follow-up, that asked teachers about the effect of salary on their reasons for
entering and leaving teaching, we found only a handful of reliable studies that actually used these (or
other) self-reported data to look at the effect of salary on teachers’ reasons for staying or leaving the
profession.
• Johnson and Birkeland (2003), in a descriptive analysis of longitudinal interview data
collected in 1999, 2000, and 2001 from 50 first- and second-year teachers in Massachusetts
public schools, found that teachers who left within the three-year period cited low pay and
lack of prestige as factors in their decision to leave.
• Ingersoll (2001a), using self-reported data from the Schools and Staffing Survey of 1988–1989,
1990–1991, and 1993–1994 and the Teacher Follow-up Survey of 1991–1992 (linked with the
Schools and Staffing Survey of 1990–1991), found that the level of compensation for advanced
teachers (with a master’s degree and 20 years of experience) had a significant positive but
small effect on voluntary teacher turnover after controlling for teacher and school
characteristics. A difference of $1,000 in salary was associated with a difference of 3 percent
in the odds of voluntary teacher departure. The most important reason for turnover seemed
to be job dissatisfaction, and the most frequently reported causes of job dissatisfaction both
for migrating teachers and teachers who left the profession were low salaries, lack of support
from the school administration, and student discipline problems.
• Weiss (1999), using data on first-year teachers from the Schools and Staffing Survey in 1987–
1988 and 1990–1991, found that salary did not appear to affect first-year teachers’ morale but,
in the 1987–1988 sample, was likely to influence their plans to continue teaching.
• Ingersoll and Alsalam (1997), in a multi-level analysis of more than 53,000 teachers in more
than 11,000 schools in the 1990–1991 Schools and Staffing Survey, found that self-reported
52
commitment to the teaching profession among working teachers was positively associated
with the maximum possible salary level in the school.
• Hall, Pearson, and Carroll (1992) asked 416 teachers in a large Florida school district during
the early 1990s whether they planned to continue teaching. Those who were contemplating
quitting cited salary as one among a number of factors (mostly related to working conditions)
in their decision.
• Hounshell and Griffin (1989), in their survey of a small cohort of individuals who graduated
from a science-teacher-education program in North Carolina between 1977–1983 (the sample
size was 37), found that, initially, graduates were attracted to a career in teaching by its
humanitarian qualities and its involvement with young people. Once there, however, almost
half found teaching to be worse than they had expected. The most commonly cited reason
for leaving teaching for another job was salary. The small sample size limits the
generalizability of this study, however.
• Allred and Smith (1984), using district files and survey data on 233 rural and 834 urban
teachers in Utah collected during the early 1980s, found that 43 percent of teachers who left
rural districts at the end of a school year did so for reasons relating to salary.
• Chapman and Hutcheson (1982), using survey data on more than 500 alumni of teacher-
education programs in three public universities in Indiana who graduated between 1967 and
1978, found that those who left teaching placed a higher value on job autonomy and wage
increases, while those who continued to teach placed a higher value on approval from family
and friends and recognition by other people.
It appears from the literature discussed above that higher salaries tend to reduce attrition, and, as
Brewer (1996) and Theobald (1990) suggest, the prospect of high future salaries may contribute to
retention as well. These studies do not address, however, the question of whether or not retention is
desirable.
We searched for studies that investigated the effect of salary increases on the quality of newly
recruited or retained teachers. A small number of papers offered evidence that raising salaries,
particularly if raises can somehow be targeted toward high-ability teachers, may increase teacher quality.
• Figlio (2002) analyzed restricted data from the Schools and Staffing Survey and
administrative data that linked districts in the 1987–1988 and 1993–1994 waves and found
that districts that raised their salaries relative to other teaching salaries in their county
increased the possibility of hiring new teachers (both first-time and experienced transfer
teachers) from more selective undergraduate institutions and with college majors in their
teaching field. As he pointed out, however, these results held for districts that unilaterally
raised salaries relative to those in the surrounding districts. The findings, therefore, do not
53
generalize to a situation in which salaries are increased across the board in all districts within
a large geographical area.
• Stinebrickner (2001a, 2001b), using data on more than 400 individuals in the National
Longitudinal Survey of the High School Class of 1972 who were certified to teach and were
followed until 1986, found that individuals with high SAT scores received higher wages
when they worked in non-teaching jobs than when they worked in teaching jobs (the study
measures annual wages during spells in and out of teaching, not initial offers). The author
examined two wage-increase scenarios and found that a 25-percent wage increase under a
traditional rigid schedule would increase the proportion of certified individuals who chose to
work in teaching versus other alternatives and decrease the hazard of leaving. A 25-percent
wage increase targeted toward high-SAT teachers would decrease the probability of their
leaving. Under both scenarios, however, males were more responsive to the increases than
were females.
• Loeb and Page (2000) used Public Use Microdata Samples from the U.S. Census to construct
state-level panels with ten-year intervals from 1960 through 1990 and found that high school
dropout rates declined and college attendance rates increased in states that increased their
teaching wages relative to the wages of college-educated women in other occupations,
suggesting that raising relative salaries for teachers may promote teaching quality measured
through student outcomes.
• Ballou and Podgursky (1995) used data from the National Longitudinal Study of the High
School Class of 1972 and found that a 20-percent across-the-board teacher wage increase
would be associated with an increase in the share of teachers of high academic ability
(measured by SAT scores) in the workforce from 5.1 to 7.6 percent and the share of mid-to
high-ability teachers from 28.2 percent to 34.5 percent. If all districts attached a high weight
to academic ability when hiring, the shares of high-ability and mid- to high-ability teachers
rose to 9 percent and 39.9 percent, respectively. If the wage increase was targeted toward
high-ability teachers, the shares of high-ability and mid- to high-ability teachers rose to 9.2
and 45.5 percent, respectively, even without placing a high priority on ability when hiring.
• Manski (1987) simulated an occupational choice model using data from the National
Longitudinal Study of the High School Class of 1972 through the 1979 wave and found that
earnings increases, on their own, would have had slight effects on the average academic
ability of teachers. For example, a 40-percent increase in weekly teacher salaries would have
increased the average teacher SAT score from 950 to 972. If earnings increases were coupled
with a minimum-ability requirement, however, the average ability of the teacher workforce
increased substantially, even with smaller pay increases. For example, a 10-percent pay
increase for teachers, coupled with a minimum SAT requirement of 800, increased average

54
teacher ability to a 1,020 SAT score (very close to the average for all college graduates). If
salaries were not increased, a minimum-ability requirement would still raise the average
ability of teachers, but would reduce the size of the teacher supply.
A few researchers have claimed that raising salaries across the board can lead to a decrease, or no
meaningful increase, in the quality of teachers, although their studies offer only weak evidence to support
this claim.
• Ballou and Podgursky (1997) offered national survey evidence that teacher quality measures
(e.g., the share of mathematics and science teachers and the average SAT scores of high
school students who say they wish to teach) rose modestly during the 1980s at the same time
that teacher salaries increased. They regressed these and other quality variables on state-
level salary growth, however, and found no association of quality with compensation.
• In Ballou and Podgursky (1995), the authors found that a 20-percent across-the-board teacher
wage increase, under the scenario that districts did not attach a high weight to academic
ability when hiring, was associated with a slight increase in the share of high-ability teachers
in the workforce, from 5.1 percent to 5.4 percent, which they claim would be offset by a
slowed rate of exit of older individuals in the teaching force.
• Galchus (1994) claimed that, among Arkansas districts in the 1984–1985 school year, a 10-
percent increase in average teacher salaries would lead to a 4.1-percent drop in the
percentage of teachers that passed the Arkansas basic skills test, although the methodology
used in the study raises questions.
Summary
In our estimation, the evidence appears convincing that salary has been positively associated with
teacher retention. Nevertheless, the policy question regarding the impact of a salary increase on teacher
quality has not yet been adequately addressed in the research. Figlio’s (2002) study provides a first step,
but again, it is important to note that his results would not generalize to a context in which a large-scale
policy intervention had been attempted. The Loeb and Page (2000) study provides some evidence that
higher wages for teachers relative to those of other occupations may lead to improved student outcomes,
but it leaves many questions unanswered regarding the intermediate stages by which this is
accomplished. Manski’s simulated results on data from the 1970s are suggestive but need to be updated
and reinforced by empirical realities. In addition, all these studies, with the exception of Loeb and Page
(2000), used exam results or the selectivity of undergraduate institutions to measure teacher quality.
Research establishing the link between these proxies and effectiveness in improving student outcomes is
still tenuous.
55
The following statements summarize the consistent research findings regarding compensation
policies:
• Higher salaries were associated with lower teacher attrition.
• Teachers were responsive to salaries outside their districts and outside of teaching.
• When asked their reasons for leaving teaching, teachers often cited low salaries as an
important reason for job dissatisfaction.
Many of the authors offered evidence that teacher compensation policies should take into account
the relative level of teacher salaries (compared with other occupations with similar education
requirements) in addition to the absolute level. Some researchers offered evidence that indicated that
across-the-board salary increases were less effective than targeted increases in recruiting and retaining
teachers of higher measured ability or teachers in fields of scarcity. In addition, salary increases in hard-
to-staff schools tend to offset unfavorable working conditions. The above findings all suggest that the
conceptual framework, outlined in Chapter II, based on the relative attractiveness of available
occupations and activities is applicable to the teaching profession.
VI.2. Pre-service Policies
The literature on pre-service policies is fairly sparse, with the exception of studies that focus on
nontraditional and alternative certification programs. Many of these studies suffer from measurement
and methodological issues, however. We found few studies that controlled for self-selection in their
discussion of program effects on recruitment or retention. If participants in alternative programs are in
some way different from those in traditional programs, and if these differences have effects on
recruitment and retention that are independent of teacher program effects, then it is difficult to tease out
true program outcomes. In addition, the duration of teaching spells is not well measured in many of
these studies. Teachers in alternative as well as traditional programs typically spend a year in an
internship, but whether this is included as a year of teaching may not be treated consistently. We
reviewed a few studies on alternative certification programs that were carefully conducted and some
that, although flawed, provided useful insights. Apart from studies that dealt with alternative
certification, we found two sufficiently empirical studies that focused on policy effects on minority
recruitment into teaching.
What the Literature Says
Nontraditional or alternative certification programs frequently appeared to recruit individuals
whose characteristics differed from those in standard teacher-education programs and sometimes
produced higher retention rates than did traditional programs.
56
• Clewell and Villegas (2001) and Villegas and Clewell (1998) evaluated the Pathways to
Teaching Careers Program launched in 1989 by the DeWitt Wallace-Reader’s Digest Fund to
target minority paraprofessionals and emergency-certified teachers in urban school districts.
At 40 separate sites, a total of 2,593 participants had been enrolled through the date of the
later report. Compared with the national pool of newly prepared teachers, Pathways
participants were 63 percent minority (versus 18 percent nationally), 70 percent female
(versus 73 percent nationally), and had a mean age of 35 (versus 28 nationally). The report
also tracked retention using follow-up surveys and found that 75 percent of Pathways
graduates were still employed as teachers three or more years after completion and another
13 percent were employed in education-related jobs. These rates were higher than commonly
reported national averages for alternative credentialing programs.
• Davis et al. (2001), using data from a survey administered in 2000 to three cohorts (the
sample size was 72) of program graduates of the Teacher Fellows Program in Texas, found
that all 39 members of the 1998–1999 and 1999–2000 cohorts were recruited by Texas districts
and that 83 percent of the 1997–1998 cohort were still teaching two years later. Through the
program, Teacher Fellows were contracted to work in a school district (their salary paid for
by the university), while the district contributed master teachers to serve as Faculty Exchange
Teachers. These findings may suffer from selection bias.
• Andrew and Schwab (1995), using survey data from 1,390 graduates of teacher-education
programs between 1985-1990 in an 11-university consortium and data from their school
principals collected in 1991, found that teacher preparation programs that had undergone
reforms that included extended five-year programs, increased liberal arts coursework, and
increased clinical experience were successful in increasing teacher recruitment and retention
rates. These alternative programs had program entry rates that were higher than the national
average and lower attrition rates. Within the 11 universities, graduates of five-year programs
had higher entry and retention rates than those of four-year programs. The study did not
adequately describe the data, however. If most of the students came from the 1990 cohort
and the survey was conducted in 1991, it would capture only one year of retention.
• Natriello and Zumwalt (1993) compared 129 graduates of the Provisional Teacher Program in
New Jersey with 187 graduates of college-based teacher-education programs from 1987 to
1992 and found that the alternative-route teachers were more likely to be drawn from an
urban background and have a facility for foreign language. They also expressed a greater
preference for teaching disadvantaged students and for teaching in urban districts.
• Kirby, Darling-Hammond, and Hudson (1989) and Darling-Hammond, Hudson, and Kirby
(1989), using a survey of 481 nontraditional teacher-education program participants and
graduates, found that recruits from nontraditional programs appeared to enter and remain in
57
teaching at similar or slightly higher rates than other college graduates prepared for teaching.
Excluding former teachers, 86 percent of nontraditional-program graduates entered teaching
and about 75 percent were still teaching within two years of program completion. These
percentages were roughly comparable to those for teachers in general. In addition, the
authors found that nontraditional programs recruited higher proportions of older and female
candidates to science and math teaching than national proportions of science and math
teachers with these demographic characteristics. Those that came from working
backgrounds in science tended to come from lower-paying, technical, support, and service
fields than from professional or managerial fields. Those who come from non-science
occupations were also drawn disproportionately from lower salary ranges.
• Applegate and Shaklee (1988) provided some evidence that persistence through the
Alternative Teacher Education Program at Kent State University in the mid-1980s was higher
than persistence through the traditional program (76 percent versus 46 percent). The
program described was quite small, however, with a capacity for only 25 students per year,
and self-selection into the two programs was not addressed.
A few studies provided evidence that pre-service policies that raised requirements for entry into
teaching might discourage or prevent minority students from teaching, but one study (Hanushek and
Pace, 1995) suggested that minorities might not be adversely affected.
• Gitomer, Latham, and Ziomek (1999) found that the predominantly white applicant pool
became even less diverse after testing. Among ethnic groups of teacher candidates taking the
Praxis I test for admission to schools of education between 1994 and 1997 (the sample size
was over 88,000 for this analysis), white candidates passed at the highest rate (87 percent)
and black candidates at the lowest rate (53 percent). Among ethnic groups of teacher
candidates taking the Praxis II test for licensure during the same period (the sample size for
this analysis was over 272,000), white candidates passed at the highest rate (92 percent) and
black candidates at the lowest rate (65 percent).
• Hanushek and Pace (1995), using data from the High School and Beyond, which followed
high school seniors from the class of 1980 through 1986, found that state certification
requirements appeared to inhibit the supply of teachers. The authors’ analysis indicated that,
all else equal, teacher preparation would be 4 percentage points lower in a state requiring a
state certification exam, such as the National Teacher Examination (NTE). This was not a
trivial effect considering that the mean probability of entering a teacher-preparation program
was 12 percent. In addition, they found that increasing teacher-preparation course
requirements by 10 credits appeared to decrease teacher supply by 1.2 percentage points.
• Murnane and Schwinden (1989), using data from North Carolina between 1975 and 1985,
found that the net effect of reinstating the NTE certification requirement in North Carolina
58
(the NTE was not required between 1975 and 1977) appeared to have had a negative effect on
the percentage of schoolteachers who were black.
• Case et al. (1988), using survey data collected in 1986 from administrators at 73 institutions
that were members of the Association of Colleges and Schools of Education in State
Universities and Land Grant Colleges and the Affiliated Private Universities, found that
university officials had mixed views regarding the obstacles that college admissions criteria
posed to minority students. Thirty-eight percent of the surveyed institutions viewed the
admissions criteria at their own colleges as hindering minority acceptance into the college,
while the same percentage answered that admission criteria were not a significant problem.
The authors also provided limited support for the hypothesis that competency testing of
candidates exiting a teacher-education program (such as the NTE) was disproportionately
affecting minorities.
• Dometrius and Sigelman (1988), using data from the Equal Employment Opportunity
Commission surveys of public school teachers in 1978, 1979, 1980, and 1982, investigated the
hypothetical effects of a new testing regime implemented in Texas on the diversity of the
teacher workforce in that state from 1987-1996. Assuming an attrition rate of 46 percent for
blacks, an optimistic entry rate of 6.6 percent, and an annual system growth of 2 percent, the
share of black teachers in the Texas workforce under a no-testing regime was predicted to be
11.4 percent in 1996. Under the testing-regime scenario, however, the share of black teachers
in 1996 would fall to 8.8 percent. This was due mainly to the fact that minorities had lower
pass rates than whites on teacher credentialing tests. These results, however, hinged on the
assumption that entry and pass rates for different groups would remain constant into the
future.
Summary
The studies we reviewed revealed the following findings regarding pre-service policies and
teacher recruitment and retention:
• Nontraditional and alternative teacher education programs appeared to attract more diverse
student populations, and their graduates appeared to have higher rates of entry into and
retention in teaching than graduates of traditional programs.
• Minority representation in teaching appeared to be adversely affected by teacher-testing
requirements.
59
VI.3. In-service Policies
In reviewing the research that discussed in-service policies, we found that a number of “working
conditions” were related to success in recruitment and retention. Mentoring and induction programs,
class sizes, disciplinary issues, the matching of teaching assignments to teachers’ skills, the level of
autonomy granted to teachers, the amount of administrative support teachers receive, the way in which
grievances were handled, and the ability of the students taught often appeared to play a prominent role
in teachers’ decisions to quit or remain on the job.
What the Literature Says
• Smith and Ingersoll (2004) used data from the 1990–2000 Schools and Staffing Survey and its
Teacher Follow-up Survey and found that in the sample of more than 3,000 beginning
teachers those who experienced induction and mentoring support in their first year of
teaching were less likely to leave teaching or change schools. They also found that the more
types of support teachers experienced, the lower the likelihood of their leaving or changing
schools. On average, 29 percent of beginning teachers either changed schools (15 percent) or
left teaching (14 percent). Sixteen percent received none of the identified induction or
mentoring supports, and the predicted probability of their leaving was 40 percent. The types
of induction support that had the strongest positive association with retention were having a
mentor in the same field, having common planning time with other teachers in the same
subject, having regularly scheduled collaboration with other teachers, and being part of an
external network of teachers.
• Johnson and Birkeland (2003), in their descriptive analysis of a small sample of 50 first- and
second-year teachers in Massachusetts public schools, found that the 22 percent of teachers
who left felt that they had not received adequate support or resources to perform their job
successfully. Teachers who switched schools (also 22 percent of the original sample)
expressed similar feelings but attributed them to their particular school setting rather than to
the teaching profession. All of the switchers transferred to schools that offered more
supportive environments or were wealthier. In general, teachers were more likely to stay in
schools with “integrated professional cultures” organized around collegial efforts rather than
schools organized around veteran- or novice-oriented activities.
• Ingersoll (2001a), using the Schools and Staffing Survey in the 1980s and 1990s and the
Teacher Follow-up Survey in 1991–1992, found that schools providing greater autonomy,
influence, and administrative support (as reported by the teachers themselves) and schools
with fewer disciplinary problems had lower levels of teacher attrition.
60
• Kirby, Berends and Naftel (1999), using longitudinal data on public school teachers in Texas
from 1980–1996, found that higher per-pupil expenditures and increased professional
support staff were associated with reduced attrition from teaching. In addition, large class
sizes were associated with higher attrition.
• Weiss (1999), using data on first-year teachers from the Schools and Staffing Survey in 1987–
1988 and 1990–1991, found that perceived school leadership and culture along with teacher
autonomy and discretion were the main factors predicting high teacher morale (measured by
first-year teacher perceptions that it was worthwhile to give teaching their best effort).
Perceived school leadership and culture were also strong predictors of teachers’ intention to
remain in teaching. The author found that the more influence teachers felt they had over
disciplinary policies, the more likely they were to say they would continue teaching. The
study did not link these perceptions to actual teacher behavior, however.
• Ingersoll and Alsalam (1997), in their analysis of the 1990–1991 Schools and Staffing Survey
data, found that self-reported commitment to the teaching profession among working
teachers was positively associated with the school-level measures of teacher autonomy and
faculty influence. They also found that commitment was negatively associated with the
presence of mentoring programs in the school, although no explanation is offered for this
finding.
• Shen (1997), using data from the Schools and Staffing Survey of 1990–1991 and the Teacher
Follow-up Survey of 1991–1992, found that teachers who stayed in the same school from 1991
to 1992 were more likely than those who did not stay in the same school to perceive that they
had influence over school and teaching policies and that administrators understood their
problems.
• Gritz and Theobald (1996) followed white teachers in Washington State who began teaching
in the 1980s through 1992 and found that the attrition of beginning teachers was higher in
districts that spent more per teacher on central administration or instructional aides. To
explain this surprising effect, they advanced the hypothesis that teachers do not like to
supervise aides in the classroom and are discouraged by these extra duties.
• Mont and Rees (1996) followed the careers of 525 New York high school teachers and found
that class size and the proportion of classes taught in a teacher’s subject area were related to
turnover—smaller class sizes and better subject area matching were associated with a
reduced probability of leaving.
• Odell and Ferraro (1992), using a follow-up survey conducted during the late 1980s of two
cohorts of K-5 teachers in New Mexico (the sample size was 160) who had participated in a
mentoring/internship program, found that participants in the program had lower attrition
rates than the statewide average. Statewide data from the same time period showed an
61
attrition rate for beginning teachers of more than 9 percent per year, whereas the
mentoring/internship participants had an annual attrition rate of 4 percent. The statewide
average, however, may not represent an appropriate comparison group given that a great
deal of within-state variation exists at the school and district level.
• Rees (1991) studied contractual relationships between districts and teachers and found that
these relationships appeared to influence retention, although the data are from the late 1970s
and quite old. The author found that teacher turnover was significantly lower in New York
districts that had grievance procedures involving binding arbitration for contract disputes
and either binding or advisory arbitration for non-contract disputes than in districts without
these particular procedures. In addition, he asserted that a salary premium of 11 percent
would be needed to offset the effect on turnover of moving from binding arbitration to no
procedure for non-contract disputes, suggesting that arbitration may provide a cost-effective
alternative to salary hikes.
• Hounshell and Griffin (1989), in their survey of 37 individuals who graduated from a science-
teacher-education program in North Carolina between 1977 and 1983, found that those who
did not enjoy their teaching experience cited excessive time commitments, greater workload
than expected, and problems with student discipline and apathy as the main reasons for
dissatisfaction. The small sample size limits the generalizability of this study, however.
• Seyfarth and Bost (1986), in a simple correlation analysis, found that superintendents
reported lower turnover in districts that offered teachers more leaves of absence, autonomy,
and convenient and safe working environments.
• Berry, Noblitt, and Hare (1985) provided evidence drawn from 82 interviews of teachers who
had left a large public school district in the Southeast in the early 1980s that the primary
reasons cited for dissatisfaction were difficulty in handling disadvantaged children and
disciplinary problems in the classroom.
Summary
Working conditions that can be ameliorated through policy appear to have an impact on teachers’
decisions to migrate to other schools or to quit teaching. The research findings support the notion that
individual schools and districts can increase their attractiveness to current and prospective teachers
relative to other opportunities available to these individuals. The literature presented in this section
suggests that teacher turnover is related to school characteristics that are not purely external—such as
minority enrollments or urban/rural status—but within the control of school administrators. A summary
of the findings in this literature is as follows:
62
• Schools that provided mentoring and induction programs, particularly those related to
collegial support, had lower rates of turnover among beginning teachers.
• Schools that provided teachers with more autonomy and administrative support had lower
levels of teacher attrition and migration.
• Schools with fewer disciplinary problems or those that gave teachers discretion over setting
disciplinary policies had lower levels of teacher attrition and dissatisfaction.
• In at least two states (Texas and New York), larger class sizes were associated with higher
teacher attrition rates.
63
CHAPTER VII: SUMMARY, CONCLUSIONS, AND SUGGESTIONS FOR FUTURE RESEARCH
VII.1. Summary of the Research Findings
The research literature on teacher recruitment and retention offers several consistent findings. We
reviewed research that investigated (1) the characteristics of individuals who enter teaching, (2) the
characteristics of individuals who remain in teaching, (3) the external characteristics of districts and
schools that affect recruitment and retention, (4) compensation policies that affect recruitment and
retention, (5) pre-service policies that affect recruitment and retention, and (6) in-service policies that
affect recruitment and retention. The strongest set of results were those relating to the influence of
various factors on attrition due to the widespread availability of longitudinal datasets that track the
employment of teachers. Below, we summarize the findings that have emerged in the research literature.
(1) The results that arose fairly consistently in research regarding the characteristics of individuals
who enter the teaching profession were as follows:
• Females formed greater proportions of new teachers than males.
• Whites formed greater proportions of new teachers than minorities.
• College graduates with higher measured ability were less likely to enter teaching than other
college graduates. It is possible, however, that these differences may be driven by the
measured ability of elementary school teachers, who represent the majority of teachers.
• Reentrants to teaching formed a significant proportion of newly hired teachers in the 1980s.
Science and math teachers were less likely to return than other teachers, whereas elementary
teachers and teachers with more prior experience were more likely to return.
• A more tentative finding based on a small number of weaker studies is that an altruistic
desire to serve society is one of the primary motivations for pursuing teaching.
(2) There were several findings that emerged with a strong degree of consistency in research
regarding the characteristics of individuals who leave the teaching profession. They were as follows:
• The highest attrition rates seen for teachers occurred in their first years of teaching and after
many years of teaching when they were near retirement, thus producing a U-shaped pattern
of attrition with respect to age or experience.
• Minority teachers tended to have lower attrition rates than white teachers.
• Teachers in the fields of science and mathematics were more likely to leave teaching than
teachers in other fields.
• Teachers with higher measured ability were more likely to leave teaching.
• Female teachers typically had higher attrition rates than male teachers.
64
• Family-related situations, such as marriage and children, were related to higher teacher
attrition, particularly for women, although the data supporting these hypotheses are old.
(3) Regarding the external characteristics of schools and districts that are related to teacher
recruitment and retention rates, the research provided the following fairly consistent Findings:
• Schools with higher proportions of minority students, students in poverty, and low-
performing students tended to have higher attrition rates.
• In most studies, urban school districts had higher attrition rates than suburban and rural
districts.
• Teacher retention was generally found to be higher in public schools than in private schools.
(4) The following summarize the consistent research findings regarding compensation policies and
their relationship to teacher retention:
• Higher salaries were associated with lower teacher attrition.
• Teachers were responsive to salaries outside their districts and outside of teaching.
• When asked their reasons for leaving teaching, teachers often cited low salaries as an
important reason for job dissatisfaction.
(5) The studies we reviewed revealed the following findings regarding pre-service policies and
teacher recruitment and retention:
• Nontraditional and alternative teacher education programs appeared to attract more diverse
student populations, and their graduates appeared to have higher rates of entry into and
retention in teaching than graduates of traditional programs.
• Minority representation in teaching appeared to be adversely affected by teacher-testing
requirements.
(6) Findings from the research on in-service policies that affect teacher retention were as follows:
• Schools that provided mentoring and induction programs, particularly those related to
collegial support, had lower rates of turnover among beginning teachers.
• Schools that provided teachers with more autonomy and administrative support had lower
levels of teacher attrition and migration.
• Schools with fewer disciplinary problems or those that gave teachers discretion over setting
disciplinary policies had lower levels of teacher attrition and dissatisfaction.
• In at least two states (Texas and New York), larger class sizes were associated with higher
teacher attrition rates.
VII.2. Conclusions
It is evident from the findings summarized above that, despite controls in teacher labor markets
due to licensing requirements, government regulation, and union contracts, the generalized labor-market
65
framework outlined in Chapter II is, to a large degree, applicable to the teaching profession, and its
predictions are substantiated in the literature.
Teacher entry, mobility, and attrition patterns show that teachers do exhibit preferences for higher
salaries, better working conditions, and greater intrinsic rewards and will tend to either move to other
teaching positions that offer these when possible or leave teaching when these are less attractive relative
to job offers or activities available outside of teaching. In particular, the finding that compensation affects
retention is well established.
It is evident that urban schools and schools with high percentages of minority students are difficult
to staff, and that teachers tend to leave these schools when other opportunities are present. It is also
evident, however, that factors that can be altered through policy can have an impact on the decisions of
individuals to enter teaching and on teachers’ decisions to quit teaching or migrate to other schools. The
research findings support the notion that individual schools and districts can increase their attractiveness
to current and prospective teachers relative to other opportunities available to these individuals. The
research also offers information on the effectiveness of a number of different options in the areas of
compensation, pre-service policies, and in-service policies, although rigorous research evaluating the
latter two types of policies is relatively scarce.
Although higher teacher salaries have been associated with higher-quality teachers, it is still
questionable whether raising salaries across the board will lead to significant increases in teacher quality,
whether it is a cost-effective method of improving teacher quality, or how much of a salary increase
would be needed to produce the desired improvement. A few studies suggest that higher-quality
teachers will be drawn to districts that pay more and that higher salaries for teaching relative to other
types of salaries earned by female college graduates might improve student outcomes. Some research
also suggests that targeted salary increases for teachers in fields where there are shortages will facilitate
the recruitment of qualified teachers in those areas. More research, supported by more recent and better
data, however, is needed to solidify these findings.
VII.3. What Is Needed for Future Research
Reliable ongoing information on the labor market for teachers is vital to monitoring trends and
averting movements toward a teacher shortage in a productive and preemptive manner. Yet, few data-
collection efforts exist to support this effort, and those that do exist could, in many cases, be improved.
Data on the characteristics and movements of teachers, the hiring and firing activities of districts and
schools, and the effects of particular policies are not currently available in the quantities needed.
First, more recent data are needed. The research we have reviewed uses, for the most part, data
from the 1970s and 1980s. In a few cases, the studies we have reviewed utilize data from the early to mid-
1990s. Research utilizing more recent data is needed. Many of the studies we reviewed were based on

66
information from the Schools and Staffing Survey, and the recently released wave of this survey should
produce several new and important studies within the next few years. This will fill the gap in only one of
the many types of data that are needed, however. Up-to-date longitudinal data on individuals who
might consider teaching among a set of alternative choices are also needed. In addition, it would greatly
contribute to our understanding of the issues surrounding teacher recruitment and retention if more
states kept and made available data on the movements of teachers.
National data-collection efforts such as the Schools and Staffing Survey are extremely helpful, but
they are large and expensive undertakings. The Schools and Staffing Survey, for example, tracks teachers
only for one year and, in order to obtain representative samples of teachers in every state, must gather
survey information from more than 40,000 individuals. It is impractical to do this on an annual basis.
Furthermore, from a sampling design perspective, it is difficult to generate sufficient sample sizes to
make generalizations regarding teachers in various subfields in different regions. This suggests that
although improvements could certainly be made in the Schools and Staffing Survey, and the federal
government might consider more regular kinds of "snapshot" studies to provide useful information, it is
state administrative data that holds the most promise.
Some states already collect detailed information on individual teachers and their assignments. In
almost all states, these data-collection efforts could be improved by adding more detailed information on
teachers' education, experience, and compensation. In addition, states collect data from schools and
districts on an annual basis, and it would be of great importance to add additional items on vacancies,
turnover, hiring plans, difficulties in filling slots, recruitment activities, and so on by teaching field. It
would be feasible to obtain a series of annual measures of the state of the teacher labor market from
school districts.
Aside from the lack of this type of supplementary information, two major omissions characterize
nearly all statewide data collection efforts:
First, there is a lack of data on the movements of teachers. Within the educational system itself, it
should be possible to identify teachers and schools and to track teachers’ movements in and out of
specific districts. But this is only part of the information needed to complete the picture. It is also
necessary to track the movements of teachers in and out of the educational system. If state educational
data-collection agencies would collaborate with state employment and unemployment insurance
agencies, it would then be possible to build longitudinal records capable of sustaining the type of analysis
necessary for the understanding of teacher labor-market transitions. The importance of gathering this
information as a means of assessing the possibility of shortages and surpluses cannot be overemphasized.
Second, data on teacher characteristics indicative of quality are scarce. In order to assess whether
districts are substituting teachers of lower quality for those of higher quality over time—an important
indicator of a shortage—and to assess the effect of policy interventions, researchers must have a means of
distinguishing the different quality levels of teachers. This is a problem that is endemic to all educational
67
research due to the difficulty of determining adequate quality measures. Despite this difficulty, however,
many states do not collect even simple quality measures, such as scores on standardized tests taken by all
teachers. In particular, changes in the performance of students after exposure to particular teachers are
rarely tracked, yet this information would provide extremely valuable data on teacher quality. Thus, we
need a great deal more data to support research on the characteristics of effective teachers, defined as
those who raise pupil learning and improve other student outcomes.
Third, there is a noticeable and regrettable dearth of rigorous policy evaluation research. Our
discussion of specific pre-service and in-service policies reviewed only 25 studies. While the education
literature abounds with articles and reports describing or advocating particular policies, very few of them
contain empirical data and analysis, and even fewer contain analysis conducted in accordance with
rigorous research-quality standards. We believe that policymakers at every institutional level—school,
district, state, and federal government—should commit sufficient resources to ensure a well designed
evaluation whenever new policies are put in place. In the end, this will be a cost-effective strategy and
will help answer many unanswered questions in the current research literature. Researchers have, for the
most part, been fairly thorough in investigating the issues relating to recruitment and retention using
existing data. What is needed, in addition to updated and more complete national and state data on
teachers, are more reliable data tied to specific policy interventions.
Our literature review highlights the absence of data on key indicators and the need for more and
improved state data-collection efforts. In addition, it points to the need for further work in the
development of multivariate behavioral models capable of explaining all the relevant trends. At the
current state of the art, teacher attrition has been modeled in some detail, but models of entry into the
teaching profession, student course-taking decisions, district course-offering decisions, district hiring
decisions, and state and local funding allocations are still underdeveloped. It is also important to apply
more of the types of behavioral models we have seen in the literature to teachers and potential teachers in
fields of shortage.
Answering the pressing questions regarding the recruitment and retention of effective teachers will
require new quantitative and qualitative research, improved data collection efforts, the further
application of theoretical and methodological rigor to the study of teacher labor markets, the further
subjection of theory to empirical testing at the state and local labor-market level, and a commitment on
the part of policymakers at all levels to provide support for useful evaluation research when new policies
are implemented.

69
REFERENCES OF REVIEWED STUDIES
Abernathy, T. V., Forsyth, A., & Mitchell, J. (2001). The Bridge from Student to Teacher: What Principals, Teacher Education Faculty, and Students Value in a Teaching Applicant. Teacher Education Quarterly, 28(4), 109–119.
Adams, G. J. (1996). Using a Cox Regression Model to Examine Voluntary Teacher Turnover. Journal of Experimental Education, 64(3), 267–285.
Allred, W. E., & Smith, R. B. (1984). Profile of Utah Teachers Leaving the Teaching Profession. Rural Educator, 5(3), 2–5.
Andrew, M. D. (1983). The Characteristics of Students in a Five-Year Teacher Education Program. Journal of Teacher Education, 34(1), 20–23.
Andrew, M. D., & Schwab, R. L. (1995). Has Reform in Teacher Education Influenced Teacher Performance? An Outcome Assessment of Graduates of an Eleven-University Consortium. Action in Teacher Education, 17(3), 43–53.
Applegate, J. H., & Shaklee, B. (1988). Some Observations about Recruiting Bright Students for Teacher Preparation. Peabody Journal of Education, 65(2), 52–65.
Arnold, C. L., Choy, S. P., & Bobbitt, S. A. (1993). Modeling Teacher Supply and Demand, with Commentary: National Center for Education Statistics.
Ballou, D. (1996). Do Public Schools Hire the Best Applicants? Quarterly Journal of Economics, 111(1), 97–133.
Ballou, D., & Podgursky, M. (1995). Recruiting Smarter Teachers. Journal of Human Resources, 30(2), 326–338.
Ballou, D., & Podgursky, M. (1997). Teacher Pay and Teacher Quality. Kalamazoo, Mich.: W.E. Upjohn Institute.
Ballou, D., & Podgursky, M. (1998). Teacher Recruitment and Retention in Public and Private Schools. Journal of Policy Analysis and Management, 17(3), 393–417.
Beaudin, B. Q. (1993). Teachers Who Interrupt Their Careers: Characteristics of Those Who Return to the Classroom. Educational Evaluation and Policy Analysis, 15(1), 51–64.
Beaudin, B. Q. (1995). Former Teachers Who Return to Public Schools: District and Teacher Characteristics of Teachers Who Return to the Districts They Left. Educational Evaluation & Policy Analysis, 17, 462–475.
Berry, B. (1986). Why Bright College Students Won't Teach. Urban Review, 18(4), 269–280.
Berry, B., Noblit, G. W., & Hare, R. D. (1985). A Qualitative Critique of Teacher Labor Market Studies. Urban Review, 17(2), 98–110.
70
Boe, E. E., Bobbitt, S. A., Cook, L., Whitener, S. D., & Weber, A. L. (1997). Why Didst Thou Go? Predictors of Retention, Transfer, and Attrition of Special and General Education Teachers from a National Perspective. The Journal of Special Education, 30, 390–411.
Brewer, D. J. (1996). Career Paths and Quit Decisions: Evidence from Teaching. Journal of Labor Economics, 14(2), 313–339.
Broughman, S. P. & Rollefson, M. R. (2000). Teacher Supply in the United States: Sources of Newly Hired Teachers in Public and Private Schools: 1987-88 to 1993-94. Education Statistics Quarterly, 2(3), 28–32.
Carroll, S., Reichardt, R., & Guarino, C., assisted by Mejia, A. (2000). The Distribution of Teachers Among California's School Districts and Schools Santa Monica, Calif.: RAND Corporation. MR-1298.0-JIF.
Carter, M., & Carter, C. M. (2000). How Principals Can Attract Teachers to the Middle Grades. Schools in the Middle, 9(8), 22–25.
Case, C. W., Shive, R. J., Ingebretson, K., & Spiegel, V.M. (1988). Minority Teacher Education: Recruitment and Retention Methods. Journal of Teacher Education, 33(4), 54–57.
Chapman, D. W., & Hutcheson, S. M. (1982). Attrition from Teaching Careers: A Discriminant Analysis. American Educational Research Journal, 19(1), 93–105.
Clewell, B. C., & Villegas, A. M. (2001) Evaluation of the DeWitt Wallace-Reader’s Digest Fund’s Pathways to Teaching Careers Program. Washington, D.C.: The Urban Institute.
Darling-Hammond, L., Kirby, S. N. & Hudson, L. (1989). Redesigning Teacher Education: Opening the Door for New Recruits to Science and Mathematics Teaching. Santa Monica, Calif.: RAND Corporation. R-3661-FF/CSTP.
Davis, B. H., Higdon, K. A., Resta, V. K., & Latiolais, L. L. (2001). Teacher Fellows: A Graduate Program for Beginning Teachers. Action In Teacher Education, 23(2), 43–49.
DeLong, T. J. (1987). Teachers and Their Careers: Why Do They Choose Teaching? Journal of Career Development, 14(2), 118–125.
Dometrius, N. C., & Sigelman, L. (1988). The Cost of Quality: Teacher Testing and Racial-Ethnic Representativeness in Public Education. Social Science Quarterly, 69(1), 70–82.
Dworkin, A. G. (1980). The Changing Demography of Public School Teachers: Some Implications for Faculty Turnover in Urban Areas. Sociology of Education, 53(2), 65–73.
Evans, R. H. (1987). Factors Which Deter Potential Science/Math Teachers from Teaching; Changes Necessary to Ameliorate their Concerns. Journal of Research in Science Teaching, 24(1), 77–85.
Farkas, S., Johnson, J., and Foleno, T. (2000), A Sense of Calling: Who Teaches and Why, New York: Public Agenda.
Figlio, D. N. (2002). Can Public Schools Buy Better-Qualified Teachers? Industrial and Labor Relations Review, 55(4), 686–697.
Flyer, F., & Rosen, S. (1997). The New Economics of Teachers and Education. Journal of Labor Economics, 15(1), S104–139.
71
Galchus, K. E. (1994). An Analysis of the Factors Affecting the Supply and Demand for Teacher Quality. Journal of Economics and Finance, 18(2), 165–178.
Gitomer, D. H., Latham, A. S., & Ziomek, R. (1999). The Academic Quality of Prospective Teachers: The Impact of Admissions and Licensure Testing. Princeton, New Jersey: Educational Testing Service.
Gordon, J. A. (1994). Why Students of Color Are Not Entering Teaching: Reflections From Minority Teachers. Journal of Teacher Education, 45, 346–353.
Grissmer, D. W., & Kirby, S. N. (1992). Patterns of Attrition Among Indiana Teachers: 1965–1987. Santa Monica, Calif.: RAND Corporation, R-4076-LE.
Grissmer, D. W., & Kirby, S. N. (1997). Teacher Turnover and Teacher Quality. Teachers College Record, 99(1), 45–56.
Gritz, R. M., & Theobald, N. D. (1996). The Effects of School District Spending Priorities on Length of Stay in Teaching. Journal of Human Resources, 31(3), 477–512.
Hall, B. W., Pearson, L. C., & Carroll, D. (1992). Teachers' Long-Range Teaching Plans: A Discriminant Analysis. Journal of Educational Research, 85(4), 221–225.
Hanushek, E. A., Kain, J. F., & Rivkin, S. G. (Forthcoming) Why Public Schools Lose Teachers. Journal of Human Resources.
Hanushek, E. A. & Pace, R. R. (1995). Who Chooses to Teach (and Why)? Economics of Education Review, 14(2), 101–117.
Harris, D. N., & Adams, S. (Forthcoming). Putting Teacher Labor Markets in Context: A Comparison of Turnover Across Professions and Industries. Washington D.C.: Economic Policy Institute.
Henke, R. R., Chen, X., Geis, S., & Knepper, P. (2000). Progress Through the Teacher Pipeline: 1992–93 College Graduates and Elementary/Secondary Teaching as of 1997. Washington, D.C.: National Center for Education Statistics.
Henke, R. R., Zahn, L., & Carroll, C. D. (2001). Attrition of New Teachers Among Recent College Graduates: Comparing Occupational Stability Among 1992–1993 College Graduates Who Taught and Those Who Worked in Other Occupations. Washington, D.C.: National Center for Education Statistics.
Hounshell, P. B., & Griffin, S. S. (1989). Science Teachers Who Left: A Survey Report. Science Education, 73(4), 433–443.
Ingersoll, R. M. (2001a). Teacher Turnover and Teacher Shortages: An Organizational Analysis. American Educational Research Journal, 38(3), 499–534.
Ingersoll, R. M. (2001b). Teacher Turnover, Teacher Shortages, and the Organization of Schools. Seattle, Wash.: Center for the Study of Teaching and Policy.
Ingersoll, R. M., & Alsalam, N. (1997). Teacher Professionalization and Teacher Commitment: A Multilevel Analysis. Washington, D.C.: National Center for Education Statistics. NCES 97-069.
Jacobson, S. L. (1988). The Distribution of Salary Increments and Its Effect on Teacher Retention. Educational Administration Quarterly, 24(2), 178–199.
72
Johnson, S. M., & Birkeland, S. E. (2003). Pursuing a ‘Sense of Success’: New Teachers Explain Their Career Decisions. American Educational Research Association, 40 (3), 581–617.
King, S. H. (1993). Why Did We Choose Teaching Careers and What Will Enable Us to Stay? Insights from One Cohort of the African-American Teaching Pool. Journal of Negro Education, 62(4), 475–492.
Kirby, S. N., Berends, M., & Naftel, S. (1999). Supply and Demand of Minority Teachers in Texas: Problems and Prospects. Educational Evaluation and Policy Analysis, 21(1), 47–66.
Kirby, S. N., Darling-Hammond, L., & Hudson, L. (1989). Nontraditional Recruits to Mathematics and Science Teaching. Educational Evaluation and Policy Analysis, 11(3), 301–323.
Kirby, S. N., Grissmer, D., & Hudson, L. (1991). Sources of Teacher Supply: Some New Evidence from Indiana. Educational Evaluation and Policy Analysis, 13(3), 256–268.
Lankford, M., Loeb, S., & Wyckoff, J. (2002). Teacher Sorting and the Plight of Urban Schools. A Descriptive Analysis. Educational Evaluation and Policy Analysis, 24(1), 37–62.
Latham, A.S., Gitomer, D. H., & Ziomek, R. (1999). What the Tests Tell Us About new Teachers. Educational Leadership, 56(8), 23–26.
Levin, H. M. (1985). Solving the Shortage of Mathematics and Science Teachers. Educational Evaluation & Policy Analysis, 7, 371–382.
Loeb, S., & Page, M. E. (2000). Examining the Link Between Teacher Wages and Student Outcomes: The Importance of Alternative Labor Market Opportunities and Non-Pecuniary Variation. The Review of Economics and Statistics, 82(3), 393–408.
Manski, C. F. (1987). “Academic Ability, Earnings, and the Decision to Become a Teacher: Evidence from the National Longitudinal Study of the High School Class of 1972,” in D. A. Wise (ed.). Public Sector Payrolls. Chicago: University of Chicago Press.
Marso, R. N., & Pigge, F. L. (1997). A Longitudinal Study of Persisting and Nonpersisting Teachers' Academic and Personal Characteristics. The Journal of Experimental Education, 65, 243–254.
Miech, R. A., & Elder, G. H., Jr. (1996). The Service Ethic and Teaching. Sociology of Education, 69, 237–253.
Mont, D., & Rees, D. I. (1996). The Influence of Classroom Characteristics on High School Teacher Turnover. Economic Inquiry, 34(1), 152–167.
Murnane, R. J. (1984). Selection and Survival in the Teacher Labor Market. The Review of Economics and Statistics, 66, 513–518.
Murnane, R. J., & Olsen, R. J. (1989a). The Effects of Salaries and Opportunity Costs on Duration in Teaching: Evidence from Michigan. Review of Economics and Statistics, 71(2), 347–352.
Murnane, R. J., & Olsen, R. J. (1989b). Will There Be Enough Teachers? The American Economic Review, 79, 242–246.
Murnane, R. J., & Olsen, R. J. (1990). The Effect of Salaries and Opportunity Costs on Length of Stay in Teaching. Evidence from North Carolina. The Journal of Human Resources, 25(1), 106–124.

73
Murnane, R. J., & Schwinden, M. (1989). Race, Gender, and Opportunity: Supply and Demand for New Teachers in North Carolina, 1975–1985. Educational Evaluation and Policy Analysis, 11(2), 93–108.
Murnane, R. J., Singer, J. D., & Willett, J. B. (1989). The Influences of Salaries and "Opportunity Costs" on Teachers' Career Choices: Evidence from North Carolina. Harvard Educational Review, 59(3), 325–346.
Murnane, R. J., Singer, J. D., Willett, J. B., Kemple, J. J., & Olsen, R. J. (1991). Who Will Teach? Policies That Matter. Cambridge, Mass.: Harvard University Press.
Natriello, G., & Zumwalt, K. (1993). New Teachers for Urban Schools? The Contribution of the Provisional Teacher Program in New Jersey. Education and Urban Society, 26(1), 49–62.
Odell, S. J., & Ferraro, D. P. (1992). Teacher Mentoring and Teacher Retention. Journal of Teacher Education, 43(3), 200–204.
Pigge, F. L. (1985). Teacher Education Graduates: Comparisons of Those Who Teach and Do Not Teach. Journal of Teacher Education, 36(4), 27–28.
Pigge, F. L., & Marso, R. N. (1992). A Longitudinal Comparison of the Academic, Affective, and Personal Characteristics of Persisters and Nonpersisters in Teacher Preparation. Journal of Experimental Education, 61(1), 19–26.
Reed, D. F., & Busby, D. W. (1985). Teacher Incentives in Rural Schools. Research in Rural Education, 3(2), 69–73.
Rees, D. I. (1991). Grievance Procedure Strength and Teacher Quits. Industrial and Labor Relations Review, 45(1), 31–43.
Rickman, B. D., & Parker, C. D. (1990). Alternative Wages and Teacher Mobility: A Human Capital Approach. Economics of Education Review, 9(1), 73–79.
Rong, X. L., & Preissle, J. (1997). The Continuing Decline in Asian-American Teachers. American Educational Research Journal, 34(2), 267–293.
Rumberger, R. W. (1985). The Shortage of Mathematics and Science Teachers: A Review of the Evidence. Educational Evaluation and Policy Analysis, 7(4), 355–369.
Rumberger, R. W. (1987). The Impact of Salary Differentials on Teacher Shortages and Turnover: The Case of Mathematics and Science Teachers. Economics of Education Review, 6(4), 389–399.
Schlechty, P. C., & Vance, V. S. (1981). Do Academically Able Teachers Leave Education? The North Carolina Case. Phi Delta Kappan, 63(2), 106–112.
Seyfarth, J. T., & Bost, W. A. (1986). Teacher Turnover and the Quality of Worklife in Schools: An Empirical Study. Journal of Research and Development in Education, 20(1), 1–6.
Shen, J. (1997). Teacher Retention and Attrition in Public Schools: Evidence from SASS91. Journal of Educational Research, 91(2), 81–88.
Shin, H. (1995). Estimating Future Teacher Supply: Any Policy Implications for Educational Reform? International Journal of Educational Reform, 4(4), 422–433.
74
Shipp, V. H. (1999). Factors Influencing the Career Choices of African-American Collegians: Implications for Minority Teacher Recruitment. Journal of Negro Education, 68(3), 343–351.
Singer, J. D., & Willett, J. B. (1988). Detecting Involuntary Layoffs in Teacher Survival Data: The Year of Leaving Dangerously. Educational Evaluation & Policy Analysis, 10, 212–224.
Smith, T. M., & Ingersoll, R. M. (2004). Reducing Teacher Turnover: What Are the Components of Effective Induction? American Educational Research Journal, 41(2).
Stinebrickner, T. R. (1998). An Empirical Investigation of Teacher Attrition. Economics of Education Review, 17(2), 127–136.
Stinebrickner, T. R. (1999). Estimation of a Duration Model in the Presence of Missing Data. Review of Economics and Statistics, 81(3), 529–542.
Stinebrickner, T. R. (2001a). A Dynamic Model of Teacher Labor Supply. Journal of Labor Economics, 19(1), 196–230.
Stinebrickner, T. R. (2001b). Compensation Policies And Teacher Decisions. International Economic Review, 42(3), 751–779.
Stinebrickner, T. R. (2002). An Analysis of Occupational Change and Departure from the Labor Force. Evidence of the Reasons that Teachers Leave. Journal of Human Resources, 37(1), 192–216.
Theobald, N. D. (1990). An Examination of the Influence of Personal, Professional, and School District Characteristics on Public School Teacher Retention. Economics of Education Review, 9(3), 241–250.
Villegas, A. M., & Clewell, B. C. (1998). Increasing the Number Of Teachers of Color for Urban Schools: Lessons from the Pathways National Evaluation. Education and Urban Society, 31(1), 42–61.
Weiss, E. M. (1999). Perceived Workplace Conditions and First-Year Teachers' Morale, Career Choice Commitment, and Planned Retention: A Secondary Analysis. Teaching and Teacher Education, 15(8), 861–879.
Whitener, S. D., Gruber, K. J., Lynch, H., Tingos, K., Perona M., & Fondelier, S. (1997). Characteristics of Stayers, Movers, and Leavers: Results from the Teacher Followup Survey: 1994-95, Washington, D.C.: National Center for Education Statistics, NCES 97-450.
Wise, A. E., Darling-Hammond, L., Berry, B., Berliner, D. C., Haller, E., Praskac, A., & Schlechty, P. C. (1987). Effective Teacher Selection: From Recruitment To Retention. Santa Monica, Calif.: RAND Corporation. R-3462-NIE/CSTP.

75
OTHER REFERENCES
Darling-Hammond, L. (2002) Solving the Dilemmas of Teacher Supply, Demand, and Standards: How Can We Ensure a Competent, Caring, and Qualified Teacher for Every Child? Washington, D.C.: National Commission on Teaching and America’s Future.
Ehrenberg, R. G., & Brewer, D. J. (1994). Do School and Teacher Characteristics Matter? Evidence from High School and Beyond. Economics of Education Review, 13(1), 1–17.
Ehrenberg, R. G., & Brewer, D. J. (1995). Did Teachers' Verbal Ability and Race Matter in the 1960s? Coleman Revisited. Economics of Education Review, 14(1), 1–21.
Ferguson, R. and Ladd, H. (1996). How and Why Money Matters: An Analysis of Alabama Schools. In H.F. Ladd, (ed.). Holding Schools Accountable: Performance-Based Reform in Education. Washington, D.C.: Brookings Institution.
Fetler, M. (1999). High School Characteristics and Mathematics Test Results. Education Policy Analysis Archives, 7(9).
Goldhaber, D. D., & Brewer, D. J. (2000). Does Teacher Certification Matter? High School Teacher Certification Status and Student Achievement. Educational Evaluation and Policy Analysis, 22(2), 129–145.
Hawk, P., Coble, C., & Swanson, M. (1985). Certification: It Does Matter. Journal of Teacher Education, 36(3), 13–15.
Monk, D. H. (1994). Subject Area Preparation of Secondary Mathematics and Science Teachers and Student Achievement. Economics of Education Review, 13(2), 125–145.
Murnane, R. J., & Phillips, B. R. (1981). What Do Effective Teachers of Inner-city Children Have in Common? Social Science Research, 10, 83–100.
Rivkin, S. G., Hanushek, E. A., & Kain, J. F. (2000). Teachers, Schools, and Academic Achievement. Unpublished manuscript.
Rowan, B., Correnti, R., and Miller, R. (2002). What Large-Scale Survey Research Tells Us About Teacher Effects on Student Achievement: Insights from the Prospects Study of Elementary Schools. Teachers College Record. 104(8), 1525–67.
Sanders, W. L., & Rivers, J. C. (1996). Cumulative and Residual Effects of Teachers on Future Student Academic Achievement. Tennessee Value-Added Assessment System (TVAAS). (http://www.mdk12.org/practice/ensure/tva/tva_2.htm; last accessed September 2000).
Wright, S. P., Horn, S. P., & Sanders, W. L. (1997). Teacher and Classroom Context Effects on Student Achievement: Implications for Teacher Evaluation. Journal of Personnel Evaluation in Education, 11, 57–67.

77
APPENDIX: SUMMARIES OF REVIEWED RESEARCH STUDIES

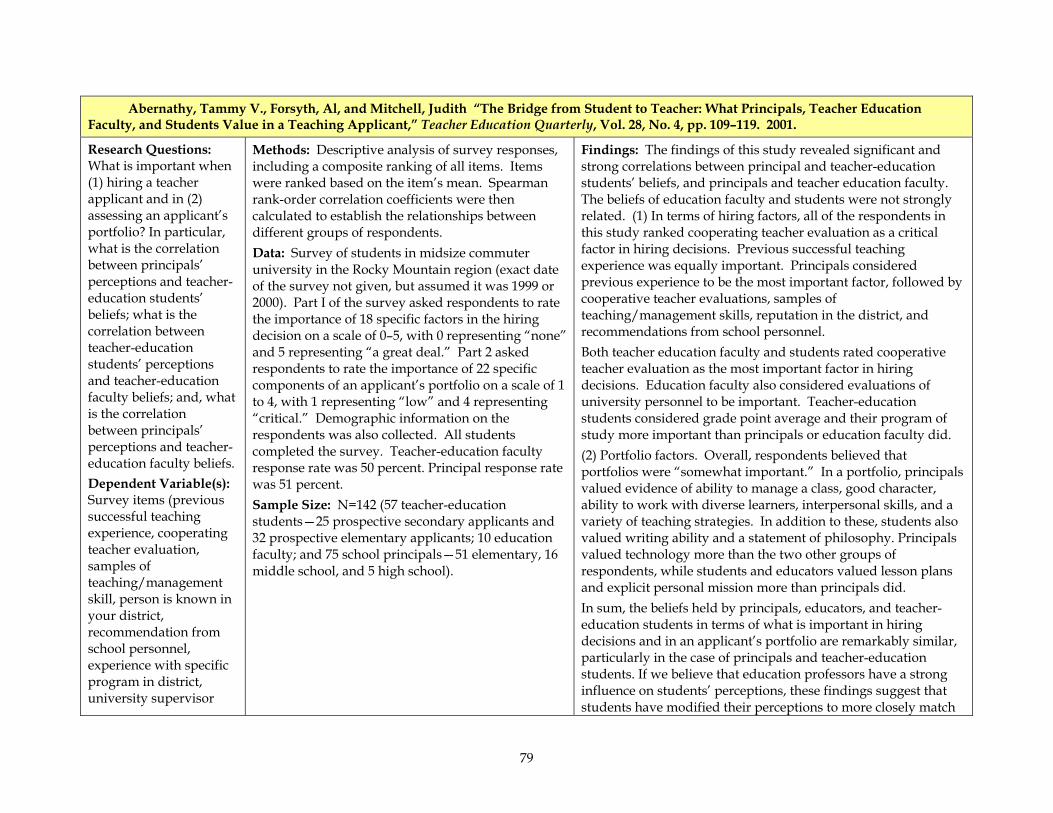
79
Abernathy, Tammy V., Forsyth, Al, and Mitchell, Judith “The Bridge from Student to Teacher: What Principals, Teacher Education Faculty, and Students Value in a Teaching Applicant,” Teacher Education Quarterly, Vol. 28, No. 4, pp. 109–119. 2001.
Research Questions: What is important when (1) hiring a teacher applicant and in (2) assessing an applicant’s portfolio? In particular, what is the correlation between principals’ perceptions and teacher-education students’ beliefs; what is the correlation between teacher-education students’ perceptions and teacher-education faculty beliefs; and, what is the correlation between principals’ perceptions and teacher-education faculty beliefs. Dependent Variable(s): Survey items (previous successful teaching experience, cooperating teacher evaluation, samples of teaching/management skill, person is known in your district, recommendation from school personnel, experience with specific program in district, university supervisor
Methods: Descriptive analysis of survey responses, including a composite ranking of all items. Items were ranked based on the item’s mean. Spearman rank-order correlation coefficients were then calculated to establish the relationships between different groups of respondents. Data: Survey of students in midsize commuter university in the Rocky Mountain region (exact date of the survey not given, but assumed it was 1999 or 2000). Part I of the survey asked respondents to rate the importance of 18 specific factors in the hiring decision on a scale of 0–5, with 0 representing “none” and 5 representing “a great deal.” Part 2 asked respondents to rate the importance of 22 specific components of an applicant’s portfolio on a scale of 1 to 4, with 1 representing “low” and 4 representing “critical.” Demographic information on the respondents was also collected. All students completed the survey. Teacher-education faculty response rate was 50 percent. Principal response rate was 51 percent. Sample Size: N=142 (57 teacher-education students—25 prospective secondary applicants and 32 prospective elementary applicants; 10 education faculty; and 75 school principals—51 elementary, 16 middle school, and 5 high school).
Findings: The findings of this study revealed significant and strong correlations between principal and teacher-education students’ beliefs, and principals and teacher education faculty. The beliefs of education faculty and students were not strongly related. (1) In terms of hiring factors, all of the respondents in this study ranked cooperating teacher evaluation as a critical factor in hiring decisions. Previous successful teaching experience was equally important. Principals considered previous experience to be the most important factor, followed by cooperative teacher evaluations, samples of teaching/management skills, reputation in the district, and recommendations from school personnel. Both teacher education faculty and students rated cooperative teacher evaluation as the most important factor in hiring decisions. Education faculty also considered evaluations of university personnel to be important. Teacher-education students considered grade point average and their program of study more important than principals or education faculty did. (2) Portfolio factors. Overall, respondents believed that portfolios were “somewhat important.” In a portfolio, principals valued evidence of ability to manage a class, good character, ability to work with diverse learners, interpersonal skills, and a variety of teaching strategies. In addition to these, students also valued writing ability and a statement of philosophy. Principals valued technology more than the two other groups of respondents, while students and educators valued lesson plans and explicit personal mission more than principals did. In sum, the beliefs held by principals, educators, and teacher-education students in terms of what is important in hiring decisions and in an applicant’s portfolio are remarkably similar, particularly in the case of principals and teacher-education students. If we believe that education professors have a strong influence on students’ perceptions, these findings suggest that students have modified their perceptions to more closely match
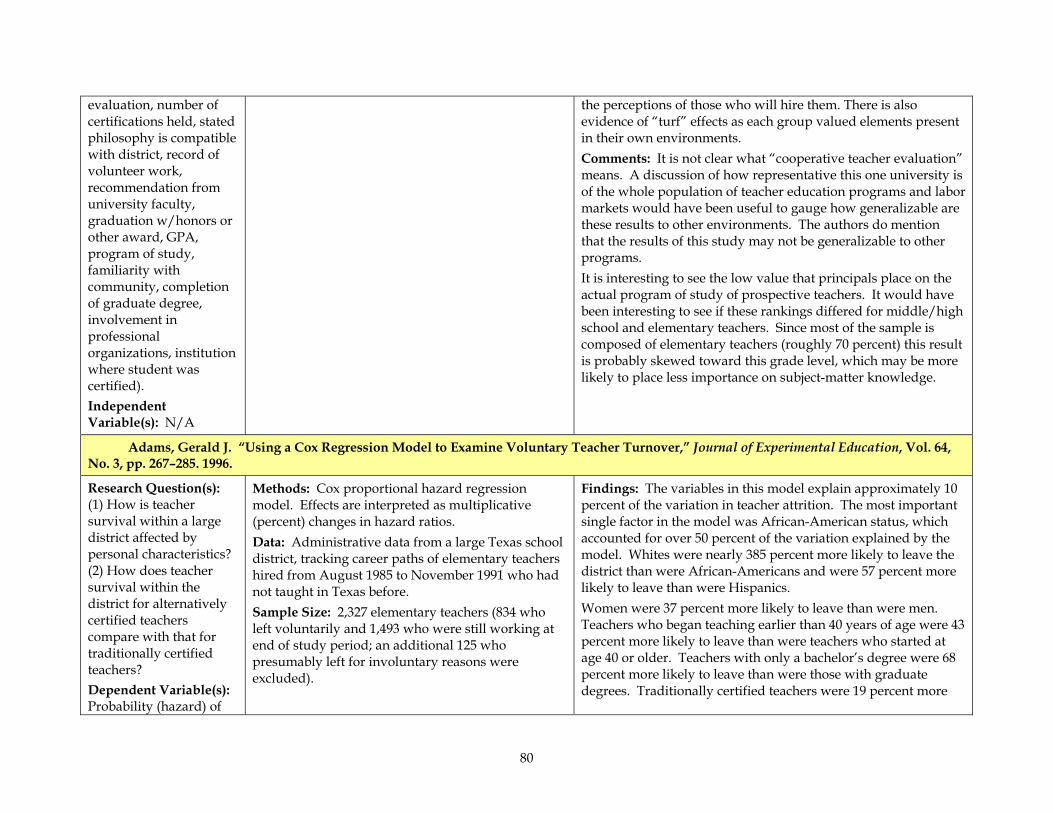
80
evaluation, number of certifications held, stated philosophy is compatible with district, record of volunteer work, recommendation from university faculty, graduation w/honors or other award, GPA, program of study, familiarity with community, completion of graduate degree, involvement in professional organizations, institution where student was certified). Independent Variable(s): N/A
the perceptions of those who will hire them. There is also evidence of “turf” effects as each group valued elements present in their own environments. Comments: It is not clear what “cooperative teacher evaluation” means. A discussion of how representative this one university is of the whole population of teacher education programs and labor markets would have been useful to gauge how generalizable are these results to other environments. The authors do mention that the results of this study may not be generalizable to other programs. It is interesting to see the low value that principals place on the actual program of study of prospective teachers. It would have been interesting to see if these rankings differed for middle/high school and elementary teachers. Since most of the sample is composed of elementary teachers (roughly 70 percent) this result is probably skewed toward this grade level, which may be more likely to place less importance on subject-matter knowledge.
Adams, Gerald J. “Using a Cox Regression Model to Examine Voluntary Teacher Turnover,” Journal of Experimental Education, Vol. 64, No. 3, pp. 267–285. 1996.
Research Question(s): (1) How is teacher survival within a large district affected by personal characteristics? (2) How does teacher survival within the district for alternatively certified teachers compare with that for traditionally certified teachers? Dependent Variable(s): Probability (hazard) of
Methods: Cox proportional hazard regression model. Effects are interpreted as multiplicative (percent) changes in hazard ratios. Data: Administrative data from a large Texas school district, tracking career paths of elementary teachers hired from August 1985 to November 1991 who had not taught in Texas before. Sample Size: 2,327 elementary teachers (834 who left voluntarily and 1,493 who were still working at end of study period; an additional 125 who presumably left for involuntary reasons were excluded).
Findings: The variables in this model explain approximately 10 percent of the variation in teacher attrition. The most important single factor in the model was African-American status, which accounted for over 50 percent of the variation explained by the model. Whites were nearly 385 percent more likely to leave the district than were African-Americans and were 57 percent more likely to leave than were Hispanics. Women were 37 percent more likely to leave than were men. Teachers who began teaching earlier than 40 years of age were 43 percent more likely to leave than were teachers who started at age 40 or older. Teachers with only a bachelor’s degree were 68 percent more likely to leave than were those with graduate degrees. Traditionally certified teachers were 19 percent more
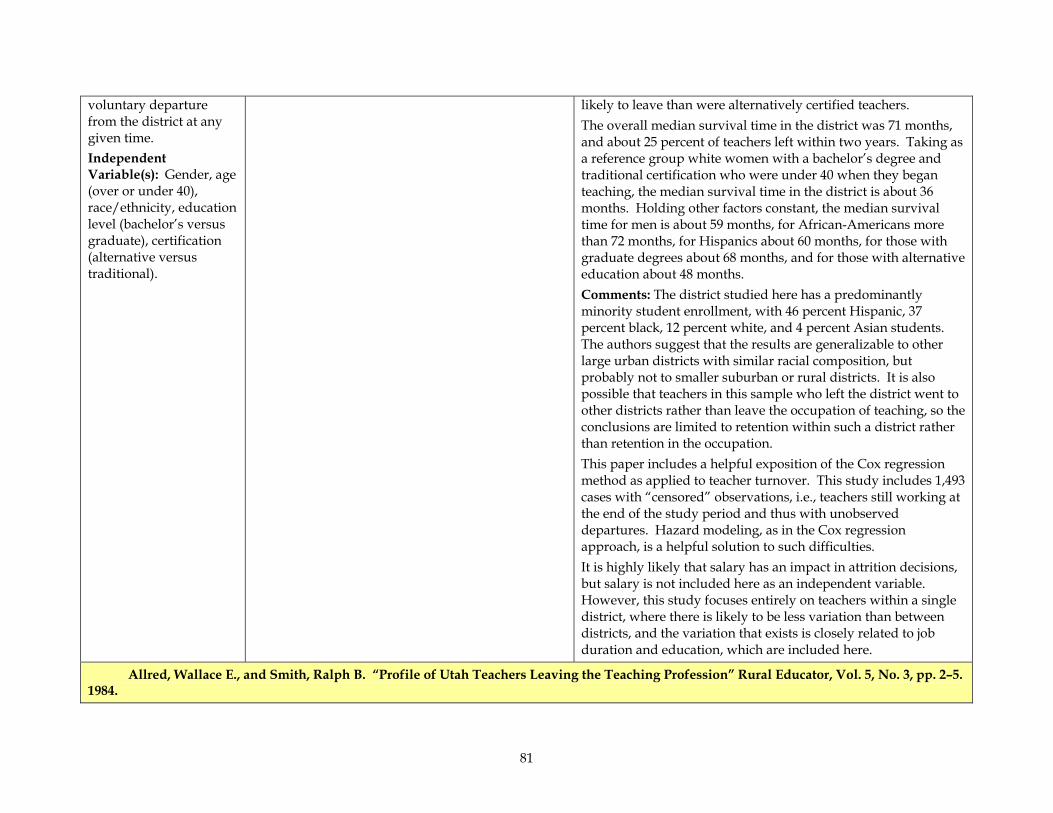
81
voluntary departure from the district at any given time. Independent Variable(s): Gender, age (over or under 40), race/ethnicity, education level (bachelor’s versus graduate), certification (alternative versus traditional).
likely to leave than were alternatively certified teachers. The overall median survival time in the district was 71 months, and about 25 percent of teachers left within two years. Taking as a reference group white women with a bachelor’s degree and traditional certification who were under 40 when they began teaching, the median survival time in the district is about 36 months. Holding other factors constant, the median survival time for men is about 59 months, for African-Americans more than 72 months, for Hispanics about 60 months, for those with graduate degrees about 68 months, and for those with alternative education about 48 months. Comments: The district studied here has a predominantly minority student enrollment, with 46 percent Hispanic, 37 percent black, 12 percent white, and 4 percent Asian students. The authors suggest that the results are generalizable to other large urban districts with similar racial composition, but probably not to smaller suburban or rural districts. It is also possible that teachers in this sample who left the district went to other districts rather than leave the occupation of teaching, so the conclusions are limited to retention within such a district rather than retention in the occupation. This paper includes a helpful exposition of the Cox regression method as applied to teacher turnover. This study includes 1,493 cases with “censored” observations, i.e., teachers still working at the end of the study period and thus with unobserved departures. Hazard modeling, as in the Cox regression approach, is a helpful solution to such difficulties. It is highly likely that salary has an impact in attrition decisions, but salary is not included here as an independent variable. However, this study focuses entirely on teachers within a single district, where there is likely to be less variation than between districts, and the variation that exists is closely related to job duration and education, which are included here.
Allred, Wallace E., and Smith, Ralph B. “Profile of Utah Teachers Leaving the Teaching Profession” Rural Educator, Vol. 5, No. 3, pp. 2–5. 1984.
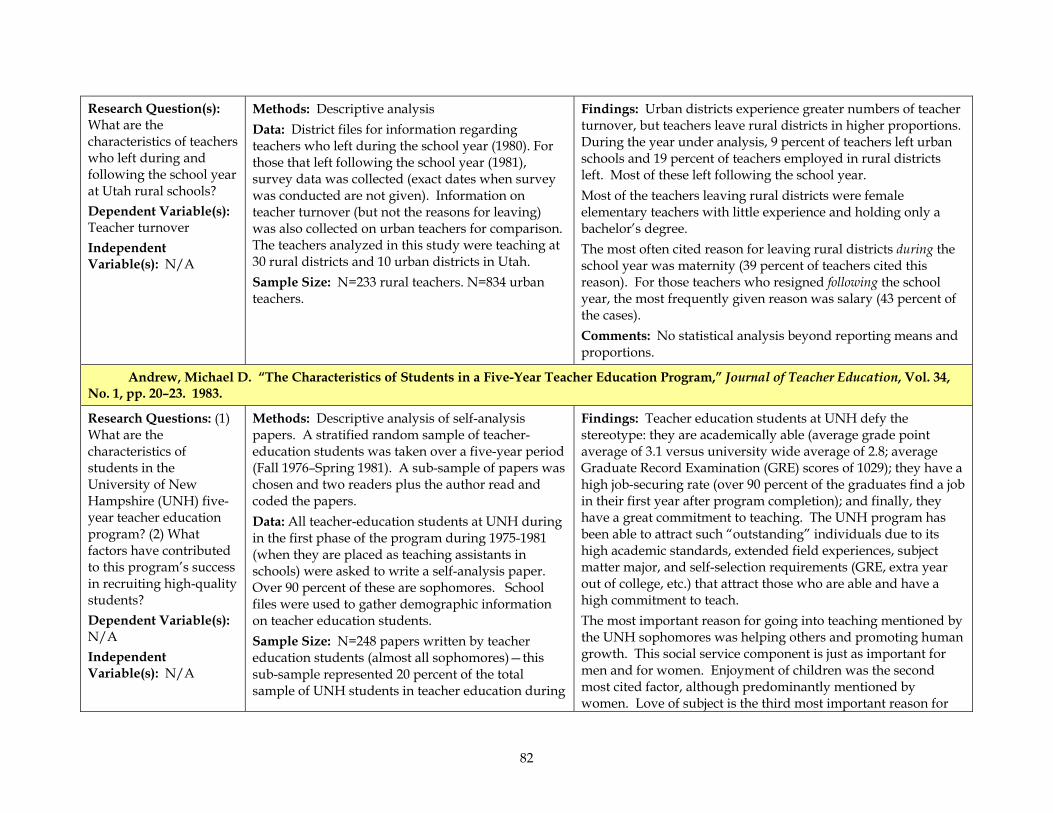
82
Research Question(s): What are the characteristics of teachers who left during and following the school year at Utah rural schools? Dependent Variable(s): Teacher turnover Independent Variable(s): N/A
Methods: Descriptive analysis Data: District files for information regarding teachers who left during the school year (1980). For those that left following the school year (1981), survey data was collected (exact dates when survey was conducted are not given). Information on teacher turnover (but not the reasons for leaving) was also collected on urban teachers for comparison. The teachers analyzed in this study were teaching at 30 rural districts and 10 urban districts in Utah. Sample Size: N=233 rural teachers. N=834 urban teachers.
Findings: Urban districts experience greater numbers of teacher turnover, but teachers leave rural districts in higher proportions. During the year under analysis, 9 percent of teachers left urban schools and 19 percent of teachers employed in rural districts left. Most of these left following the school year. Most of the teachers leaving rural districts were female elementary teachers with little experience and holding only a bachelor’s degree. The most often cited reason for leaving rural districts during the school year was maternity (39 percent of teachers cited this reason). For those teachers who resigned following the school year, the most frequently given reason was salary (43 percent of the cases). Comments: No statistical analysis beyond reporting means and proportions.
Andrew, Michael D. “The Characteristics of Students in a Five-Year Teacher Education Program,” Journal of Teacher Education, Vol. 34, No. 1, pp. 20–23. 1983.
Research Questions: (1) What are the characteristics of students in the University of New Hampshire (UNH) five-year teacher education program? (2) What factors have contributed to this program’s success in recruiting high-quality students? Dependent Variable(s): N/A Independent Variable(s): N/A
Methods: Descriptive analysis of self-analysis papers. A stratified random sample of teacher-education students was taken over a five-year period (Fall 1976–Spring 1981). A sub-sample of papers was chosen and two readers plus the author read and coded the papers. Data: All teacher-education students at UNH during in the first phase of the program during 1975-1981 (when they are placed as teaching assistants in schools) were asked to write a self-analysis paper. Over 90 percent of these are sophomores. School files were used to gather demographic information on teacher education students. Sample Size: N=248 papers written by teacher education students (almost all sophomores)—this sub-sample represented 20 percent of the total sample of UNH students in teacher education during
Findings: Teacher education students at UNH defy the stereotype: they are academically able (average grade point average of 3.1 versus university wide average of 2.8; average Graduate Record Examination (GRE) scores of 1029); they have a high job-securing rate (over 90 percent of the graduates find a job in their first year after program completion); and finally, they have a great commitment to teaching. The UNH program has been able to attract such “outstanding” individuals due to its high academic standards, extended field experiences, subject matter major, and self-selection requirements (GRE, extra year out of college, etc.) that attract those who are able and have a high commitment to teach. The most important reason for going into teaching mentioned by the UNH sophomores was helping others and promoting human growth. This social service component is just as important for men and for women. Enjoyment of children was the second most cited factor, although predominantly mentioned by women. Love of subject is the third most important reason for
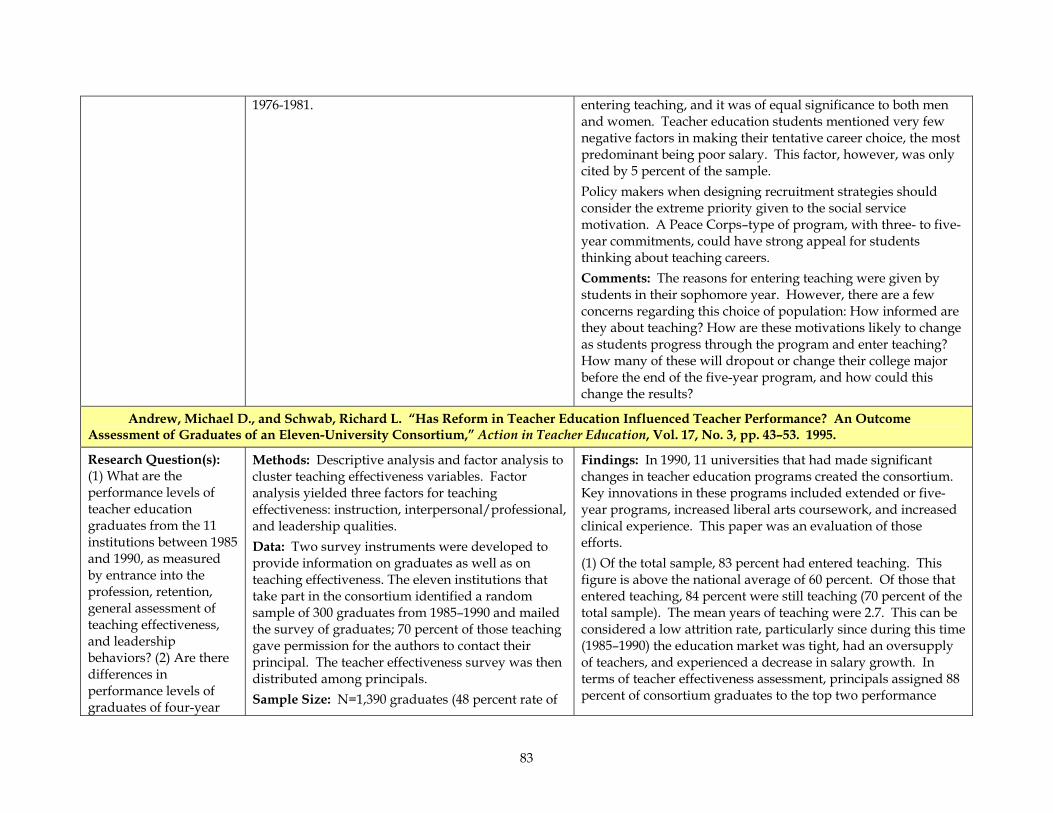
83
1976-1981. entering teaching, and it was of equal significance to both men and women. Teacher education students mentioned very few negative factors in making their tentative career choice, the most predominant being poor salary. This factor, however, was only cited by 5 percent of the sample. Policy makers when designing recruitment strategies should consider the extreme priority given to the social service motivation. A Peace Corps–type of program, with three- to five-year commitments, could have strong appeal for students thinking about teaching careers. Comments: The reasons for entering teaching were given by students in their sophomore year. However, there are a few concerns regarding this choice of population: How informed are they about teaching? How are these motivations likely to change as students progress through the program and enter teaching? How many of these will dropout or change their college major before the end of the five-year program, and how could this change the results?
Andrew, Michael D., and Schwab, Richard L. “Has Reform in Teacher Education Influenced Teacher Performance? An Outcome Assessment of Graduates of an Eleven-University Consortium,” Action in Teacher Education, Vol. 17, No. 3, pp. 43–53. 1995.
Research Question(s): (1) What are the performance levels of teacher education graduates from the 11 institutions between 1985 and 1990, as measured by entrance into the profession, retention, general assessment of teaching effectiveness, and leadership behaviors? (2) Are there differences in performance levels of graduates of four-year
Methods: Descriptive analysis and factor analysis to cluster teaching effectiveness variables. Factor analysis yielded three factors for teaching effectiveness: instruction, interpersonal/professional, and leadership qualities. Data: Two survey instruments were developed to provide information on graduates as well as on teaching effectiveness. The eleven institutions that take part in the consortium identified a random sample of 300 graduates from 1985–1990 and mailed the survey of graduates; 70 percent of those teaching gave permission for the authors to contact their principal. The teacher effectiveness survey was then distributed among principals. Sample Size: N=1,390 graduates (48 percent rate of
Findings: In 1990, 11 universities that had made significant changes in teacher education programs created the consortium. Key innovations in these programs included extended or five-year programs, increased liberal arts coursework, and increased clinical experience. This paper was an evaluation of those efforts. (1) Of the total sample, 83 percent had entered teaching. This figure is above the national average of 60 percent. Of those that entered teaching, 84 percent were still teaching (70 percent of the total sample). The mean years of teaching were 2.7. This can be considered a low attrition rate, particularly since during this time (1985–1990) the education market was tight, had an oversupply of teachers, and experienced a decrease in salary growth. In terms of teacher effectiveness assessment, principals assigned 88 percent of consortium graduates to the top two performance
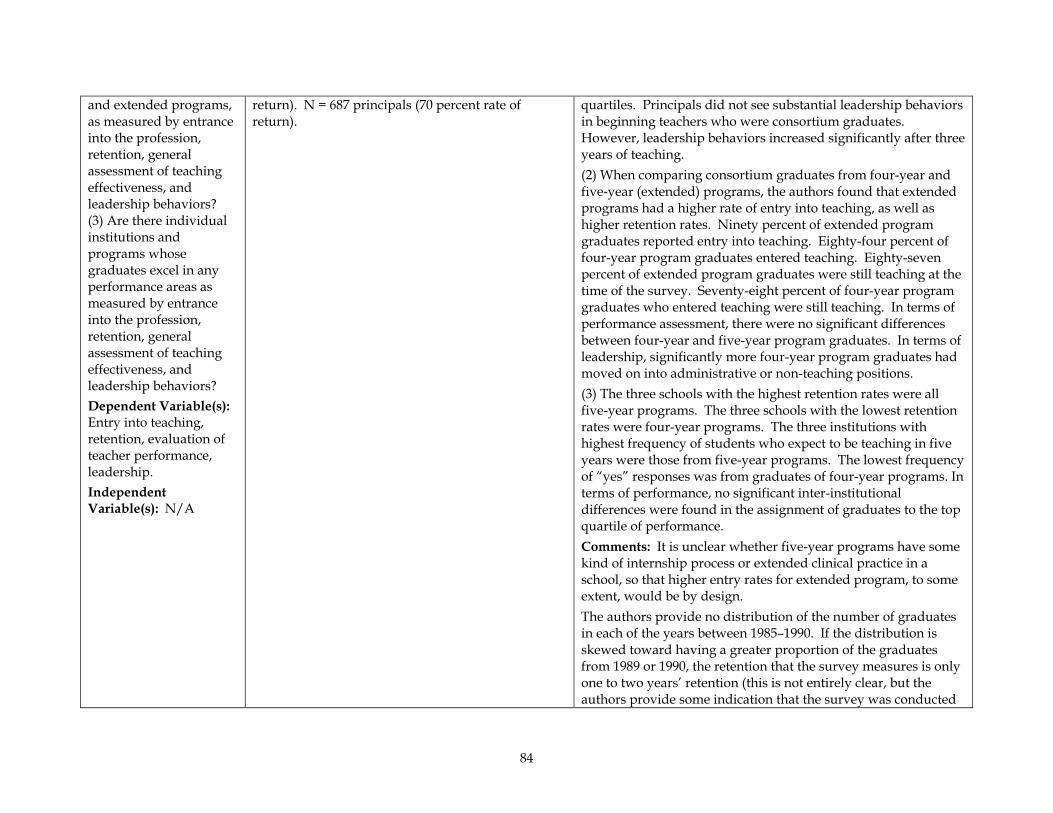
84
and extended programs, as measured by entrance into the profession, retention, general assessment of teaching effectiveness, and leadership behaviors? (3) Are there individual institutions and programs whose graduates excel in any performance areas as measured by entrance into the profession, retention, general assessment of teaching effectiveness, and leadership behaviors? Dependent Variable(s): Entry into teaching, retention, evaluation of teacher performance, leadership. Independent Variable(s): N/A
return). N = 687 principals (70 percent rate of return).
quartiles. Principals did not see substantial leadership behaviors in beginning teachers who were consortium graduates. However, leadership behaviors increased significantly after three years of teaching. (2) When comparing consortium graduates from four-year and five-year (extended) programs, the authors found that extended programs had a higher rate of entry into teaching, as well as higher retention rates. Ninety percent of extended program graduates reported entry into teaching. Eighty-four percent of four-year program graduates entered teaching. Eighty-seven percent of extended program graduates were still teaching at the time of the survey. Seventy-eight percent of four-year program graduates who entered teaching were still teaching. In terms of performance assessment, there were no significant differences between four-year and five-year program graduates. In terms of leadership, significantly more four-year program graduates had moved on into administrative or non-teaching positions. (3) The three schools with the highest retention rates were all five-year programs. The three schools with the lowest retention rates were four-year programs. The three institutions with highest frequency of students who expect to be teaching in five years were those from five-year programs. The lowest frequency of “yes” responses was from graduates of four-year programs. In terms of performance, no significant inter-institutional differences were found in the assignment of graduates to the top quartile of performance. Comments: It is unclear whether five-year programs have some kind of internship process or extended clinical practice in a school, so that higher entry rates for extended program, to some extent, would be by design. The authors provide no distribution of the number of graduates in each of the years between 1985–1990. If the distribution is skewed toward having a greater proportion of the graduates from 1989 or 1990, the retention that the survey measures is only one to two years’ retention (this is not entirely clear, but the authors provide some indication that the survey was conducted
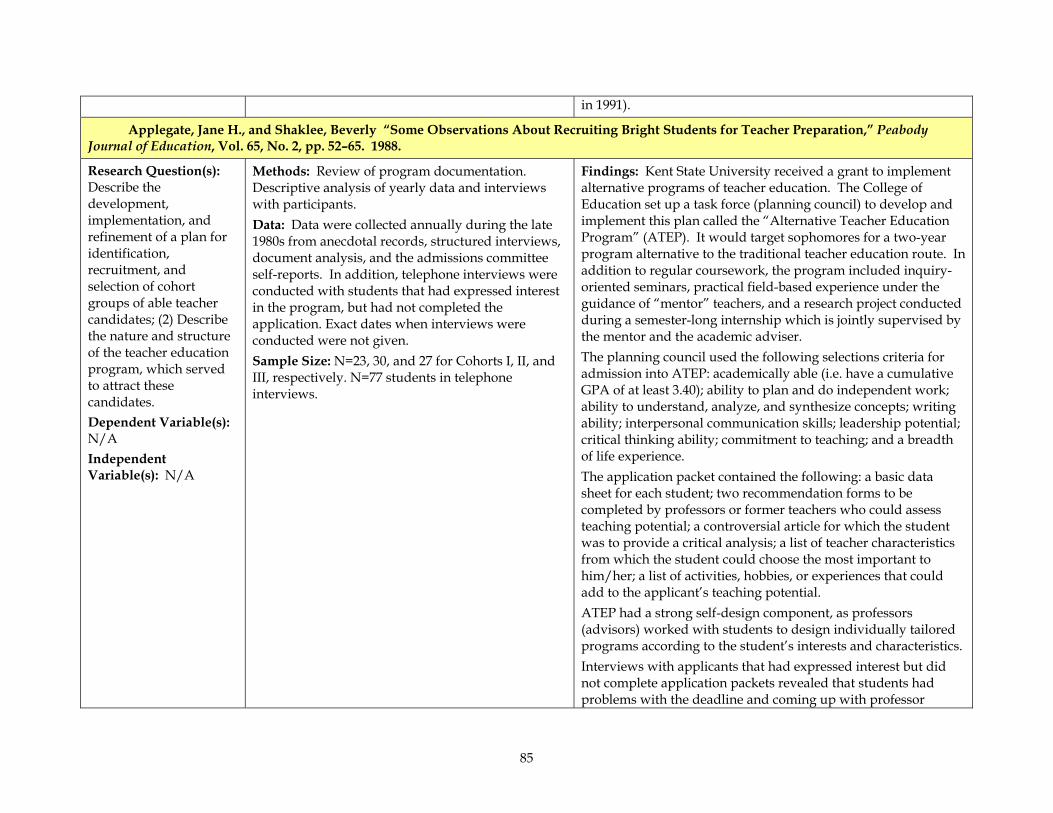
85
in 1991).
Applegate, Jane H., and Shaklee, Beverly “Some Observations About Recruiting Bright Students for Teacher Preparation,” Peabody Journal of Education, Vol. 65, No. 2, pp. 52–65. 1988.
Research Question(s): Describe the development, implementation, and refinement of a plan for identification, recruitment, and selection of cohort groups of able teacher candidates; (2) Describe the nature and structure of the teacher education program, which served to attract these candidates. Dependent Variable(s): N/A Independent Variable(s): N/A
Methods: Review of program documentation. Descriptive analysis of yearly data and interviews with participants. Data: Data were collected annually during the late 1980s from anecdotal records, structured interviews, document analysis, and the admissions committee self-reports. In addition, telephone interviews were conducted with students that had expressed interest in the program, but had not completed the application. Exact dates when interviews were conducted were not given. Sample Size: N=23, 30, and 27 for Cohorts I, II, and III, respectively. N=77 students in telephone interviews.
Findings: Kent State University received a grant to implement alternative programs of teacher education. The College of Education set up a task force (planning council) to develop and implement this plan called the “Alternative Teacher Education Program” (ATEP). It would target sophomores for a two-year program alternative to the traditional teacher education route. In addition to regular coursework, the program included inquiry-oriented seminars, practical field-based experience under the guidance of “mentor” teachers, and a research project conducted during a semester-long internship which is jointly supervised by the mentor and the academic adviser. The planning council used the following selections criteria for admission into ATEP: academically able (i.e. have a cumulative GPA of at least 3.40); ability to plan and do independent work; ability to understand, analyze, and synthesize concepts; writing ability; interpersonal communication skills; leadership potential; critical thinking ability; commitment to teaching; and a breadth of life experience. The application packet contained the following: a basic data sheet for each student; two recommendation forms to be completed by professors or former teachers who could assess teaching potential; a controversial article for which the student was to provide a critical analysis; a list of teacher characteristics from which the student could choose the most important to him/her; a list of activities, hobbies, or experiences that could add to the applicant’s teaching potential. ATEP had a strong self-design component, as professors (advisors) worked with students to design individually tailored programs according to the student’s interests and characteristics. Interviews with applicants that had expressed interest but did not complete application packets revealed that students had problems with the deadline and coming up with professor
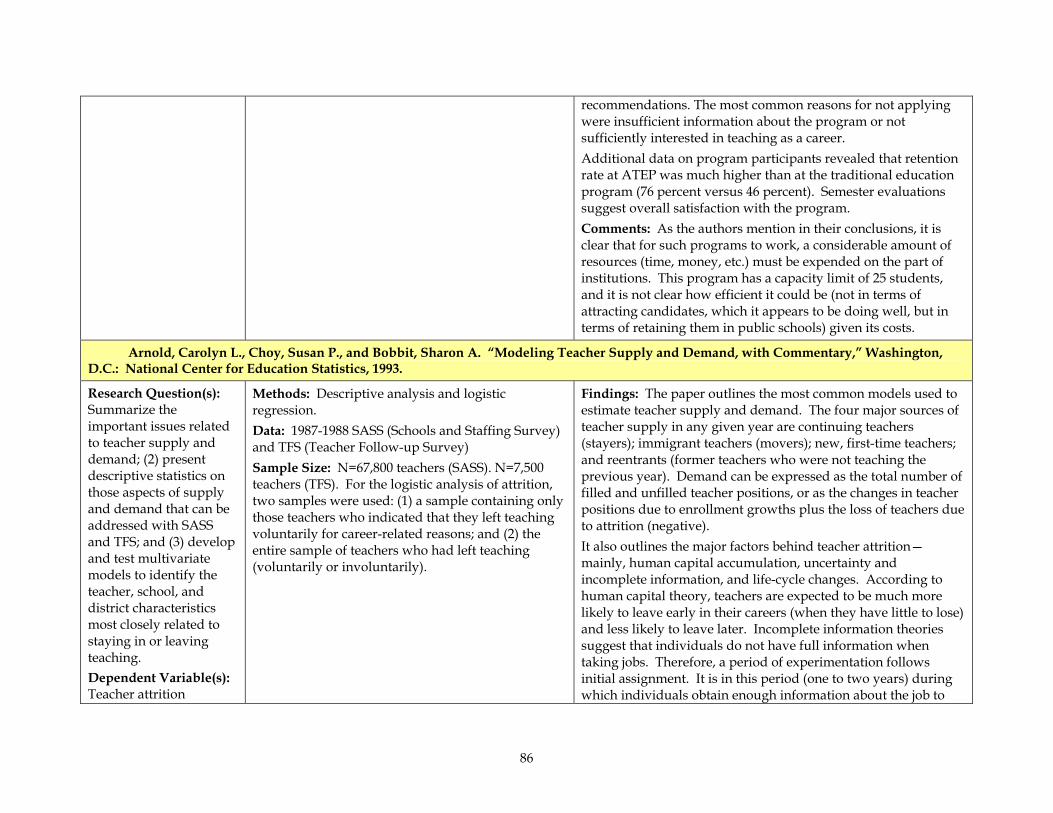
86
recommendations. The most common reasons for not applying were insufficient information about the program or not sufficiently interested in teaching as a career. Additional data on program participants revealed that retention rate at ATEP was much higher than at the traditional education program (76 percent versus 46 percent). Semester evaluations suggest overall satisfaction with the program. Comments: As the authors mention in their conclusions, it is clear that for such programs to work, a considerable amount of resources (time, money, etc.) must be expended on the part of institutions. This program has a capacity limit of 25 students, and it is not clear how efficient it could be (not in terms of attracting candidates, which it appears to be doing well, but in terms of retaining them in public schools) given its costs.
Arnold, Carolyn L., Choy, Susan P., and Bobbit, Sharon A. “Modeling Teacher Supply and Demand, with Commentary,” Washington, D.C.: National Center for Education Statistics, 1993.
Research Question(s): Summarize the important issues related to teacher supply and demand; (2) present descriptive statistics on those aspects of supply and demand that can be addressed with SASS and TFS; and (3) develop and test multivariate models to identify the teacher, school, and district characteristics most closely related to staying in or leaving teaching. Dependent Variable(s): Teacher attrition
Methods: Descriptive analysis and logistic regression. Data: 1987-1988 SASS (Schools and Staffing Survey) and TFS (Teacher Follow-up Survey) Sample Size: N=67,800 teachers (SASS). N=7,500 teachers (TFS). For the logistic analysis of attrition, two samples were used: (1) a sample containing only those teachers who indicated that they left teaching voluntarily for career-related reasons; and (2) the entire sample of teachers who had left teaching (voluntarily or involuntarily).
Findings: The paper outlines the most common models used to estimate teacher supply and demand. The four major sources of teacher supply in any given year are continuing teachers (stayers); immigrant teachers (movers); new, first-time teachers; and reentrants (former teachers who were not teaching the previous year). Demand can be expressed as the total number of filled and unfilled teacher positions, or as the changes in teacher positions due to enrollment growths plus the loss of teachers due to attrition (negative). It also outlines the major factors behind teacher attrition—mainly, human capital accumulation, uncertainty and incomplete information, and life-cycle changes. According to human capital theory, teachers are expected to be much more likely to leave early in their careers (when they have little to lose) and less likely to leave later. Incomplete information theories suggest that individuals do not have full information when taking jobs. Therefore, a period of experimentation follows initial assignment. It is in this period (one to two years) during which individuals obtain enough information about the job to
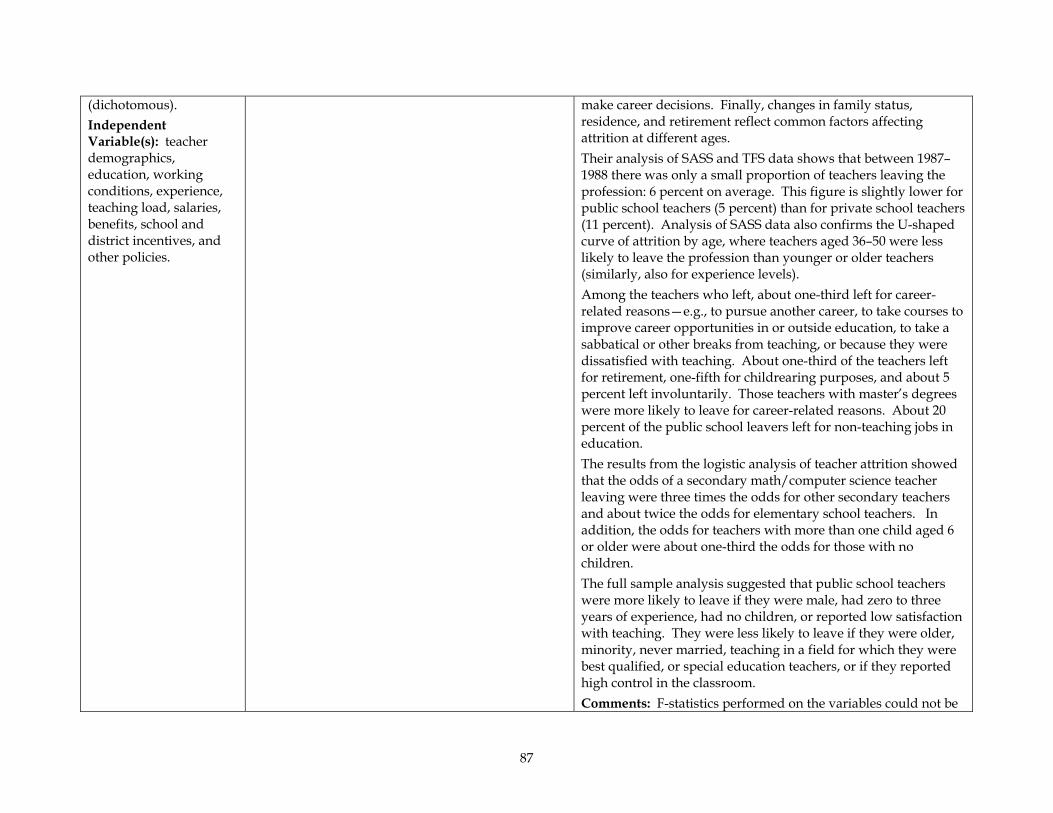
87
(dichotomous). Independent Variable(s): teacher demographics, education, working conditions, experience, teaching load, salaries, benefits, school and district incentives, and other policies.
make career decisions. Finally, changes in family status, residence, and retirement reflect common factors affecting attrition at different ages. Their analysis of SASS and TFS data shows that between 1987–1988 there was only a small proportion of teachers leaving the profession: 6 percent on average. This figure is slightly lower for public school teachers (5 percent) than for private school teachers (11 percent). Analysis of SASS data also confirms the U-shaped curve of attrition by age, where teachers aged 36–50 were less likely to leave the profession than younger or older teachers (similarly, also for experience levels). Among the teachers who left, about one-third left for career-related reasons—e.g., to pursue another career, to take courses to improve career opportunities in or outside education, to take a sabbatical or other breaks from teaching, or because they were dissatisfied with teaching. About one-third of the teachers left for retirement, one-fifth for childrearing purposes, and about 5 percent left involuntarily. Those teachers with master’s degrees were more likely to leave for career-related reasons. About 20 percent of the public school leavers left for non-teaching jobs in education. The results from the logistic analysis of teacher attrition showed that the odds of a secondary math/computer science teacher leaving were three times the odds for other secondary teachers and about twice the odds for elementary school teachers. In addition, the odds for teachers with more than one child aged 6 or older were about one-third the odds for those with no children. The full sample analysis suggested that public school teachers were more likely to leave if they were male, had zero to three years of experience, had no children, or reported low satisfaction with teaching. They were less likely to leave if they were older, minority, never married, teaching in a field for which they were best qualified, or special education teachers, or if they reported high control in the classroom. Comments: F-statistics performed on the variables could not be
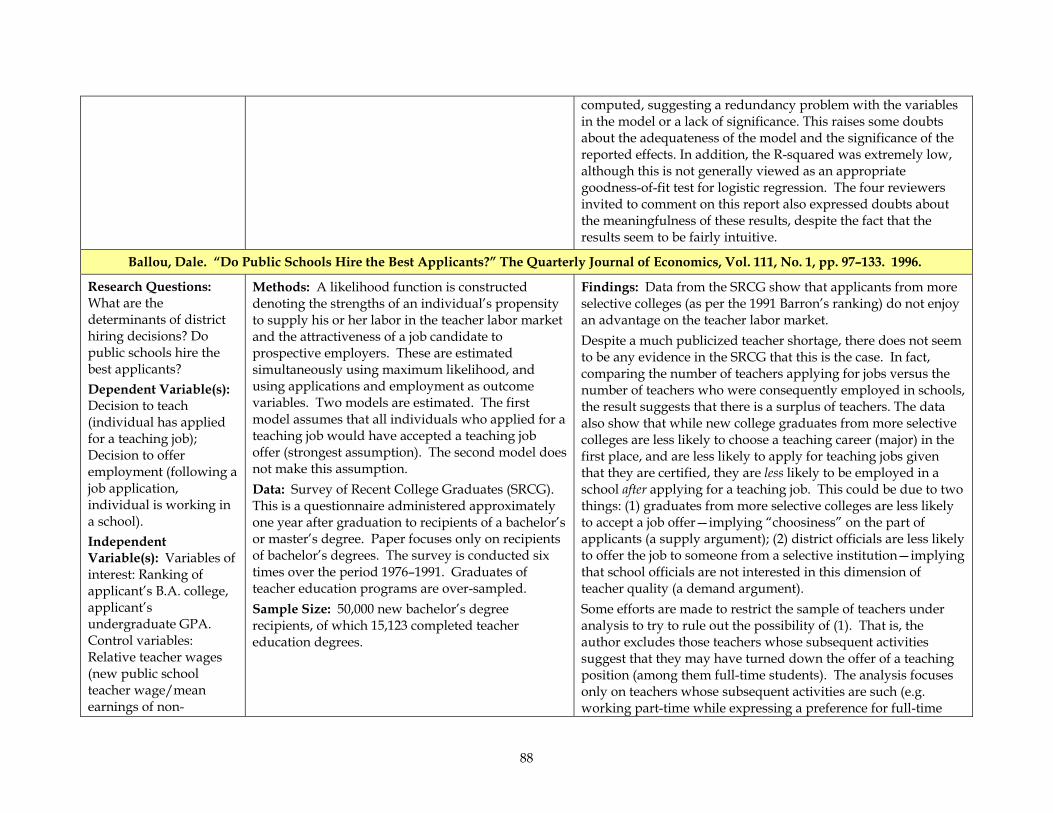
88
computed, suggesting a redundancy problem with the variables in the model or a lack of significance. This raises some doubts about the adequateness of the model and the significance of the reported effects. In addition, the R-squared was extremely low, although this is not generally viewed as an appropriate goodness-of-fit test for logistic regression. The four reviewers invited to comment on this report also expressed doubts about the meaningfulness of these results, despite the fact that the results seem to be fairly intuitive.
Ballou, Dale. “Do Public Schools Hire the Best Applicants?” The Quarterly Journal of Economics, Vol. 111, No. 1, pp. 97–133. 1996.
Research Questions: What are the determinants of district hiring decisions? Do public schools hire the best applicants? Dependent Variable(s): Decision to teach (individual has applied for a teaching job); Decision to offer employment (following a job application, individual is working in a school). Independent Variable(s): Variables of interest: Ranking of applicant’s B.A. college, applicant’s undergraduate GPA. Control variables: Relative teacher wages (new public school teacher wage/mean earnings of non-
Methods: A likelihood function is constructed denoting the strengths of an individual’s propensity to supply his or her labor in the teacher labor market and the attractiveness of a job candidate to prospective employers. These are estimated simultaneously using maximum likelihood, and using applications and employment as outcome variables. Two models are estimated. The first model assumes that all individuals who applied for a teaching job would have accepted a teaching job offer (strongest assumption). The second model does not make this assumption. Data: Survey of Recent College Graduates (SRCG). This is a questionnaire administered approximately one year after graduation to recipients of a bachelor’s or master’s degree. Paper focuses only on recipients of bachelor’s degrees. The survey is conducted six times over the period 1976–1991. Graduates of teacher education programs are over-sampled. Sample Size: 50,000 new bachelor’s degree recipients, of which 15,123 completed teacher education degrees.
Findings: Data from the SRCG show that applicants from more selective colleges (as per the 1991 Barron’s ranking) do not enjoy an advantage on the teacher labor market. Despite a much publicized teacher shortage, there does not seem to be any evidence in the SRCG that this is the case. In fact, comparing the number of teachers applying for jobs versus the number of teachers who were consequently employed in schools, the result suggests that there is a surplus of teachers. The data also show that while new college graduates from more selective colleges are less likely to choose a teaching career (major) in the first place, and are less likely to apply for teaching jobs given that they are certified, they are less likely to be employed in a school after applying for a teaching job. This could be due to two things: (1) graduates from more selective colleges are less likely to accept a job offer—implying “choosiness” on the part of applicants (a supply argument); (2) district officials are less likely to offer the job to someone from a selective institution—implying that school officials are not interested in this dimension of teacher quality (a demand argument). Some efforts are made to restrict the sample of teachers under analysis to try to rule out the possibility of (1). That is, the author excludes those teachers whose subsequent activities suggest that they may have turned down the offer of a teaching position (among them full-time students). The analysis focuses only on teachers whose subsequent activities are such (e.g. working part-time while expressing a preference for full-time
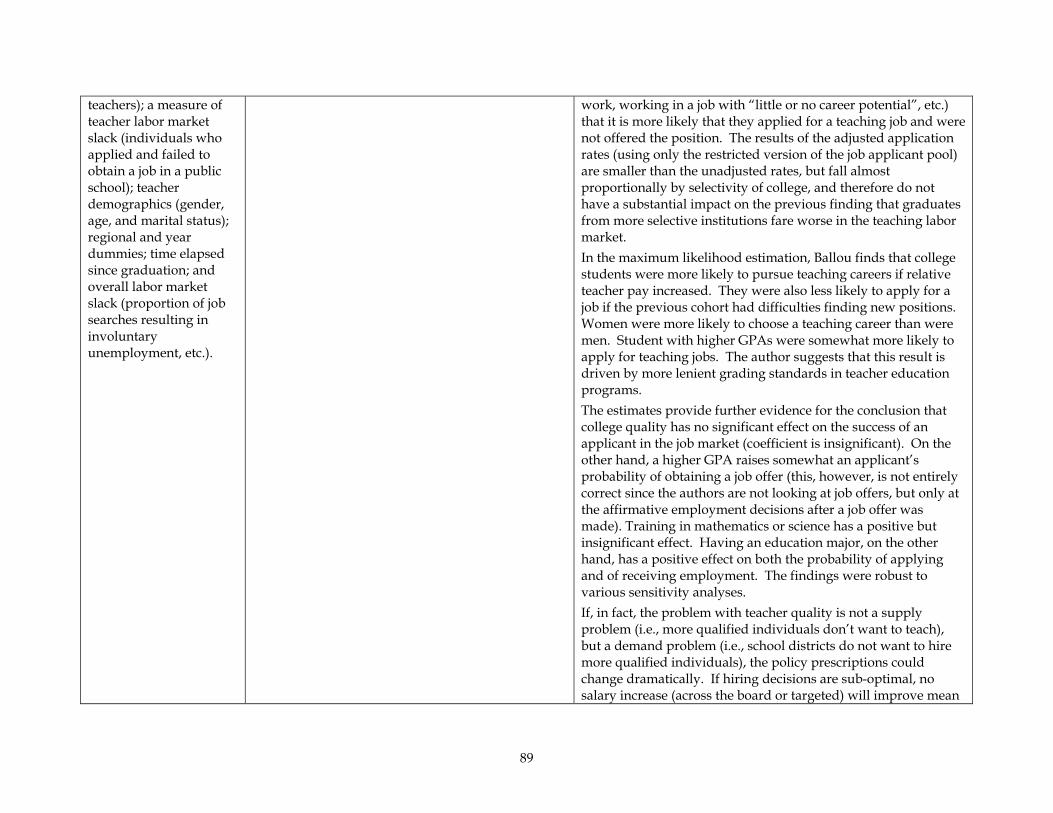
89
teachers); a measure of teacher labor market slack (individuals who applied and failed to obtain a job in a public school); teacher demographics (gender, age, and marital status); regional and year dummies; time elapsed since graduation; and overall labor market slack (proportion of job searches resulting in involuntary unemployment, etc.).
work, working in a job with “little or no career potential”, etc.) that it is more likely that they applied for a teaching job and were not offered the position. The results of the adjusted application rates (using only the restricted version of the job applicant pool) are smaller than the unadjusted rates, but fall almost proportionally by selectivity of college, and therefore do not have a substantial impact on the previous finding that graduates from more selective institutions fare worse in the teaching labor market. In the maximum likelihood estimation, Ballou finds that college students were more likely to pursue teaching careers if relative teacher pay increased. They were also less likely to apply for a job if the previous cohort had difficulties finding new positions. Women were more likely to choose a teaching career than were men. Student with higher GPAs were somewhat more likely to apply for teaching jobs. The author suggests that this result is driven by more lenient grading standards in teacher education programs. The estimates provide further evidence for the conclusion that college quality has no significant effect on the success of an applicant in the job market (coefficient is insignificant). On the other hand, a higher GPA raises somewhat an applicant’s probability of obtaining a job offer (this, however, is not entirely correct since the authors are not looking at job offers, but only at the affirmative employment decisions after a job offer was made). Training in mathematics or science has a positive but insignificant effect. Having an education major, on the other hand, has a positive effect on both the probability of applying and of receiving employment. The findings were robust to various sensitivity analyses. If, in fact, the problem with teacher quality is not a supply problem (i.e., more qualified individuals don’t want to teach), but a demand problem (i.e., school districts do not want to hire more qualified individuals), the policy prescriptions could change dramatically. If hiring decisions are sub-optimal, no salary increase (across the board or targeted) will improve mean
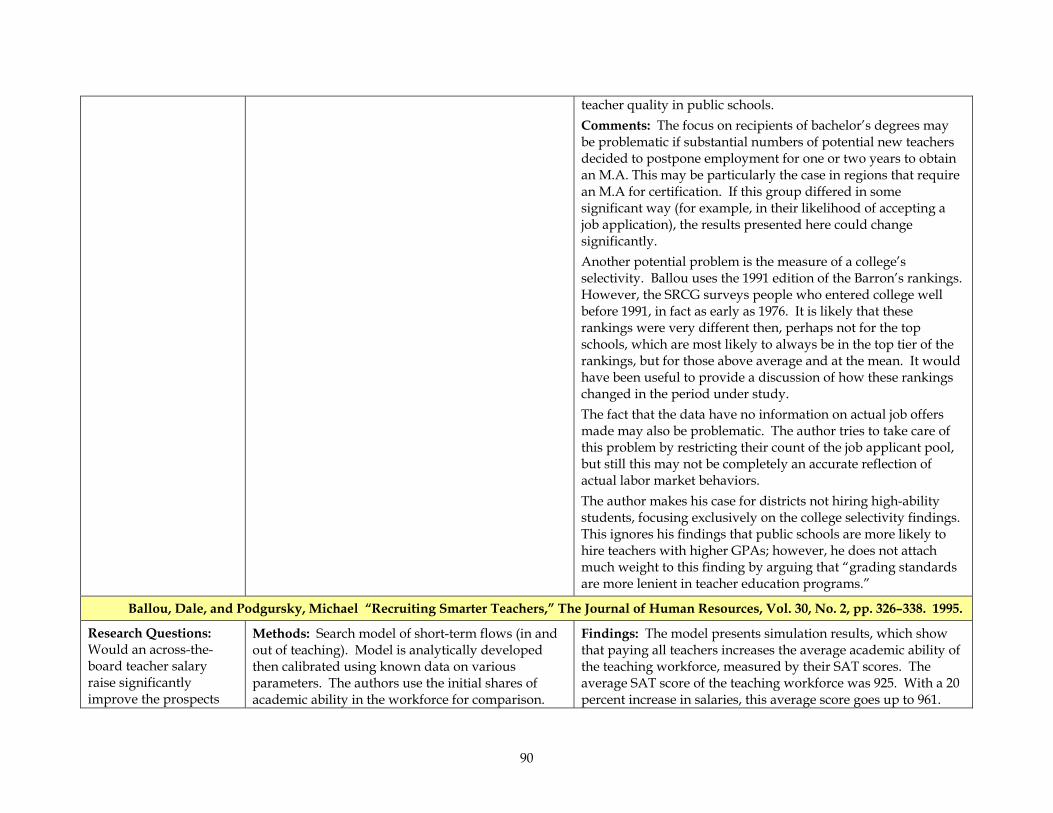
90
teacher quality in public schools. Comments: The focus on recipients of bachelor’s degrees may be problematic if substantial numbers of potential new teachers decided to postpone employment for one or two years to obtain an M.A. This may be particularly the case in regions that require an M.A for certification. If this group differed in some significant way (for example, in their likelihood of accepting a job application), the results presented here could change significantly. Another potential problem is the measure of a college’s selectivity. Ballou uses the 1991 edition of the Barron’s rankings. However, the SRCG surveys people who entered college well before 1991, in fact as early as 1976. It is likely that these rankings were very different then, perhaps not for the top schools, which are most likely to always be in the top tier of the rankings, but for those above average and at the mean. It would have been useful to provide a discussion of how these rankings changed in the period under study. The fact that the data have no information on actual job offers made may also be problematic. The author tries to take care of this problem by restricting their count of the job applicant pool, but still this may not be completely an accurate reflection of actual labor market behaviors. The author makes his case for districts not hiring high-ability students, focusing exclusively on the college selectivity findings. This ignores his findings that public schools are more likely to hire teachers with higher GPAs; however, he does not attach much weight to this finding by arguing that “grading standards are more lenient in teacher education programs.”
Ballou, Dale, and Podgursky, Michael “Recruiting Smarter Teachers,” The Journal of Human Resources, Vol. 30, No. 2, pp. 326–338. 1995.
Research Questions: Would an across-the-board teacher salary raise significantly improve the prospects
Methods: Search model of short-term flows (in and out of teaching). Model is analytically developed then calibrated using known data on various parameters. The authors use the initial shares of academic ability in the workforce for comparison.
Findings: The model presents simulation results, which show that paying all teachers increases the average academic ability of the teaching workforce, measured by their SAT scores. The average SAT score of the teaching workforce was 925. With a 20 percent increase in salaries, this average score goes up to 961.
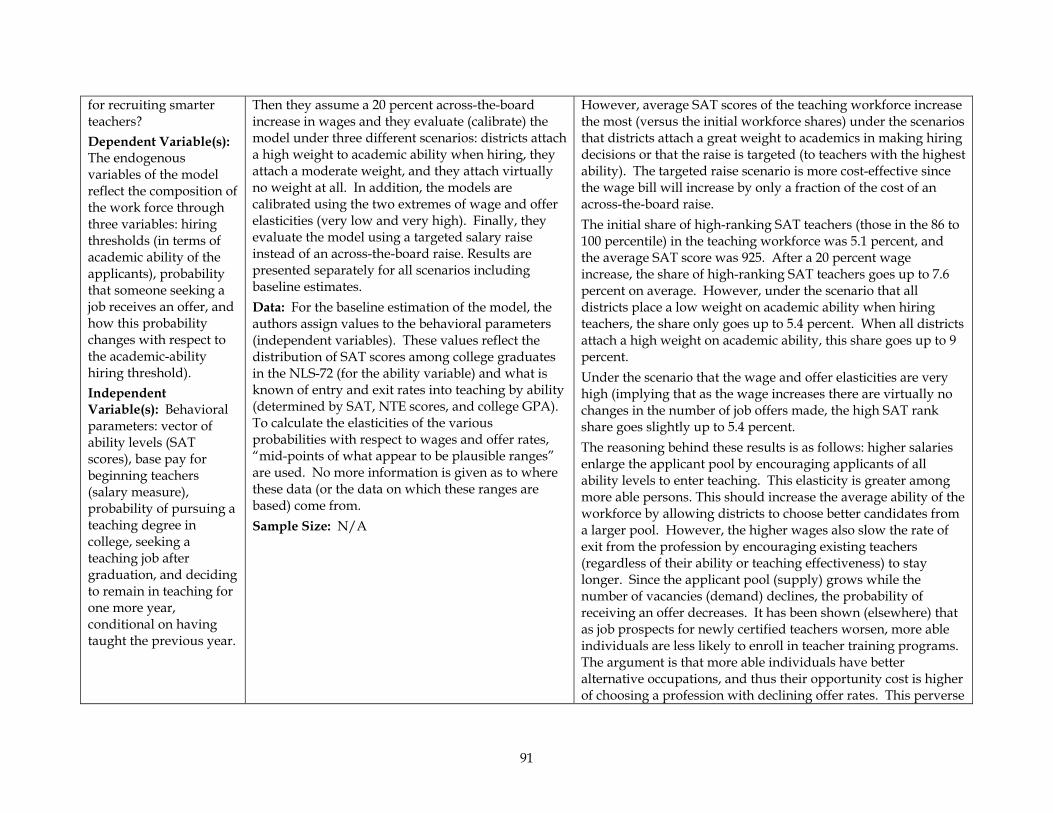
91
for recruiting smarter teachers? Dependent Variable(s): The endogenous variables of the model reflect the composition of the work force through three variables: hiring thresholds (in terms of academic ability of the applicants), probability that someone seeking a job receives an offer, and how this probability changes with respect to the academic-ability hiring threshold). Independent Variable(s): Behavioral parameters: vector of ability levels (SAT scores), base pay for beginning teachers (salary measure), probability of pursuing a teaching degree in college, seeking a teaching job after graduation, and deciding to remain in teaching for one more year, conditional on having taught the previous year.
Then they assume a 20 percent across-the-board increase in wages and they evaluate (calibrate) the model under three different scenarios: districts attach a high weight to academic ability when hiring, they attach a moderate weight, and they attach virtually no weight at all. In addition, the models are calibrated using the two extremes of wage and offer elasticities (very low and very high). Finally, they evaluate the model using a targeted salary raise instead of an across-the-board raise. Results are presented separately for all scenarios including baseline estimates. Data: For the baseline estimation of the model, the authors assign values to the behavioral parameters (independent variables). These values reflect the distribution of SAT scores among college graduates in the NLS-72 (for the ability variable) and what is known of entry and exit rates into teaching by ability (determined by SAT, NTE scores, and college GPA). To calculate the elasticities of the various probabilities with respect to wages and offer rates, “mid-points of what appear to be plausible ranges” are used. No more information is given as to where these data (or the data on which these ranges are based) come from. Sample Size: N/A
However, average SAT scores of the teaching workforce increase the most (versus the initial workforce shares) under the scenarios that districts attach a great weight to academics in making hiring decisions or that the raise is targeted (to teachers with the highest ability). The targeted raise scenario is more cost-effective since the wage bill will increase by only a fraction of the cost of an across-the-board raise. The initial share of high-ranking SAT teachers (those in the 86 to 100 percentile) in the teaching workforce was 5.1 percent, and the average SAT score was 925. After a 20 percent wage increase, the share of high-ranking SAT teachers goes up to 7.6 percent on average. However, under the scenario that all districts place a low weight on academic ability when hiring teachers, the share only goes up to 5.4 percent. When all districts attach a high weight on academic ability, this share goes up to 9 percent. Under the scenario that the wage and offer elasticities are very high (implying that as the wage increases there are virtually no changes in the number of job offers made, the high SAT rank share goes slightly up to 5.4 percent. The reasoning behind these results is as follows: higher salaries enlarge the applicant pool by encouraging applicants of all ability levels to enter teaching. This elasticity is greater among more able persons. This should increase the average ability of the workforce by allowing districts to choose better candidates from a larger pool. However, the higher wages also slow the rate of exit from the profession by encouraging existing teachers (regardless of their ability or teaching effectiveness) to stay longer. Since the applicant pool (supply) grows while the number of vacancies (demand) declines, the probability of receiving an offer decreases. It has been shown (elsewhere) that as job prospects for newly certified teachers worsen, more able individuals are less likely to enroll in teacher training programs. The argument is that more able individuals have better alternative occupations, and thus their opportunity cost is higher of choosing a profession with declining offer rates. This perverse
92
effect, in conjunction with the effect of older individuals staying longer, will tend to offset the positive effect of enlarging the applicant pool. Comments: It is interesting that the authors argue in their conclusions that they have established “the result that paying teachers more will not improve the work force by very much,” when their own results show that a 20 percent pay raise would increase the share of high-ranking SAT teachers by almost 50 percent (from 5.1 percent to 7.6 percent) and decrease the share of low-ranking SAT teachers (those in the 0 to 14 percentiles) by more than a quarter (from 26 percent to 19 percent). These results notwithstanding, the authors decide to focus on the finding that this change is only “slight” (from 5.1 percent to 5.4 percent) under the scenario that all districts attach a low weight on academics, and thus conclude that higher salaries improve the average ability of the teacher workforce by very little. In their arguments to explain why more able teachers would be discouraged from entering teacher training programs when the prospects of job offers decline, the authors cite Weaver (1983). No further details are given as to how these results were obtained and for what time period. It is likely that even when the number of vacancies declines, so that the probability of obtaining an offer also declines, more able candidates are precisely those that have the best chances of getting hired. When demand for teachers increases very fast (e.g., California after the class-size reduction reform) schools may begin hiring under-qualified teachers after the pool of qualified teachers has been exhausted. It could be the case that as demand for new teachers declines, the least qualified individuals become most discouraged. Furthermore, more able teachers may not necessarily come from teacher education programs, and thus would not be discouraged by current offer rates, if they have a major that allows them to pursue other careers. The authors recommend lowering the cost of credential programs (e.g. by lowering the requisites for certification); this could, in fact, increase teacher supply without having the perverse effect on
93
teacher retention.
Ballou, Dale, and Podgursky, Michael. Teacher Pay and Teacher Quality. Kalamazoo: W. E. Upjohn Institute for Employment Research, 1997.
Research Questions: Have higher salaries (from the 1970s to 1990s) improved the quality of newly recruited teachers? If not, why not? What reforms are likely to work better? Dependent Variable(s): Measures of teacher quality: quality of undergraduate school, academic subject degree versus education degree for secondary teachers, math or science major for secondary teachers, undergraduate GPA, SAT scores. Independent Variable(s): The increase in average teacher salaries during the 1980s compared with gender-weighted earnings of college-educated workers in general in the same states during the same period. Controls for demographic and economic characteristics
Methods: Comparison of means on quality scores between time periods with different mean wages. Regression of quality indicators with state wage variables. Schools and Staffing Survey (SASS) data were grouped into three levels of pay increase (high, low, moderate) because of the small sample size in most states. Intra-rater comparisons for principal ratings of teachers to avoid bias due to subjectivity of ratings. Data: SAT scores and career preferences of high school students from Education Testing Service (ETS), SASS 1987–1988 and 1990–1991, and Surveys of Recent College Graduates (SRCG) 1981–1991. Sample Size: SASS: More than 60,000 public and private school teachers in each of two years. SRCG: From about 4,000 to about 17,000 teachers per wave.
Findings: Based on the measures included in this study, the quality of newly recruited teachers improved modestly during the 1980s. The share of secondary teachers with majors in science or math rose during that period, the strongest effect noted. The average SAT scores of students intending to major in education also rose, but these were not recruited teachers, merely high school students stating their intentions as of the test date. Virtually no change was noted in how the quality of undergraduate schools was distributed among new teachers, although the cross-sectional method used was limited in power to answer this question unambiguously. A slight improvement was noted in the percentage of new secondary school teachers with academic subject rather than education majors. Little change in undergraduate GPAs of incoming teachers was observed after accounting for a change in the measurement method. Essentially no relationship could be established between state-level changes in teacher salaries during the 1980s and the SAT scores of students planning to teach. Nor could a strong relationship be found between salary increases and changes in the percentage of high school students intending to major in education. No evidence showed any link between increased teacher pay and recruitment of graduates of selective colleges. In general, no relationship between salary changes and teacher quality could be established. The authors discuss the possibility of error in measuring salaries and endogeneity in the relationship between teaching salaries and education and experience. They show that 95 percent of the state-level variation in salary growth during the decade studied can be explained by shifts in pay schedules rather than shifts in the average education and experience of teachers. They also discuss the possibility of composition effects between more and less desirable school systems, since salary growth might have
94
of school districts.
been greatest where the jobs were hardest to fill for other reasons. An examination of school district characteristics shows no systematic variation with salary growth. The authors also study principals’ ratings of teachers as a measure of quality. To control for differences between principals in this subjective measure, they base their analysis on the differences between new and experienced teachers in the same year in the same school. They find that new teachers receive relatively higher evaluations in schools that raised relative salaries the most. However, this difference is both statistically insignificant and very small in absolute size. There is a discussion of possible bias due to basing the analysis primarily on the comparison of new teachers with inexperienced teachers. Test comparisons of restricted samples such as returning teachers, different cohorts, and out-of-state recruits fail to reverse any of the findings. The possibility that better teachers might be more sensitive to pay levels, resulting in attrition bias, is dismissed on the basis of other published evidence that better teachers are either less or equally sensitive to salary as are other teachers. The authors also perform several tests for omitted policy variables and find their results robust to these changes in specification. In their analysis of the reasons for the failure of salary increases to improve the quality of new teaching recruits, the authors restate the model and conclusions published in Ballou and Podgursky (1995). This shows that across-the-board pay increases make only a slight difference in the average academic quality of the teaching workforce. While higher salaries enlarge the potential applicant pool, they also slow the attrition of existing teachers. The excess supply of potential teachers could in theory allow districts to be more selective in hiring, but the evidence is that districts do not use the authors’ measures of academic ability (quality of undergraduate institution, SAT scores) in screening applicants. Given the high costs of teacher preparation and job search, and the relatively better opportunities for these individuals outside teaching, it appears
95
that the higher-ability candidates may have less interest than other candidates in pursuing a limited number of openings for which their abilities do not give them a competitive advantage. Thus, higher salaries do not translate into an in increase in the quality of actual entrants to teaching. The authors do not conclude that salary incentives have no value. Rather, they argue that structural features of teacher compensation tend to nullify the potential value of salary incentives on the quality of the teaching workforce. Some of these features include rigid pay structures based on length of experience and quantity of education rather than quality of education and opportunity costs for higher ability candidates or those with specialized training, official tenure and unofficial reluctance to discharge long-term teachers, and lack of emphasis on academic quality in screening applicants. They suggest policies such as salary differentiation on the basis of specialization and measured competencies; however, they argue against merit pay based on poorly specified criteria and the discretion of school administrators. They also suggest lowering the certification barriers to entering the teaching field, which appear to be more of an impediment to high-quality candidates than to others. They discuss the possibility of raising standards for teachers and/or students in an attempt to change the hiring and firing decisions of school administrators, but warn strongly against the use of single measures with standardized passing thresholds as indicators of teacher quality. They discuss the private-school-teacher market (Ballou and Podgursky 1988), and suggest that reforms based on competition and market mechanisms would have a beneficial impact on the quality of teaching. However, they acknowledge the political challenges in implementing any of their major recommendations. Comments: The authors’ conclusion that their data show a modest improvement in the quality of incoming teachers seems overstated given the weakness of each of the pieces of evidence presented. The only unambiguous finding from observations of actual entrants to teaching is that more secondary teachers had math and science degrees than previously. However, their
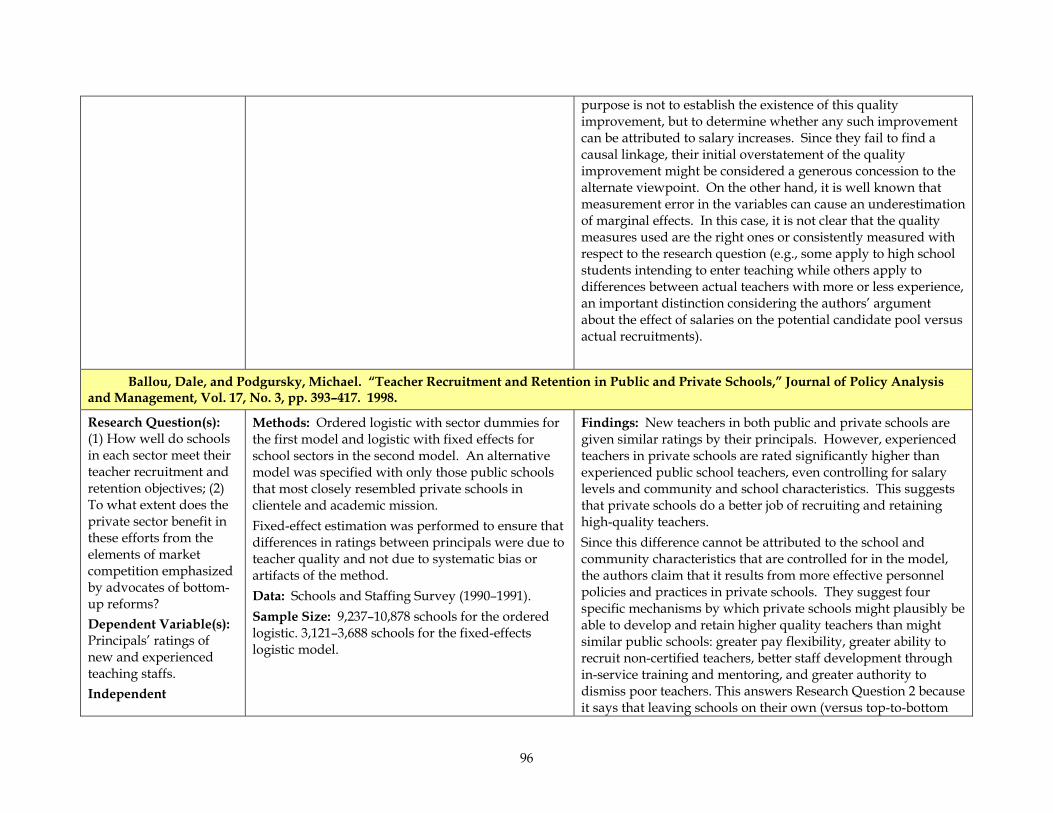
96
purpose is not to establish the existence of this quality improvement, but to determine whether any such improvement can be attributed to salary increases. Since they fail to find a causal linkage, their initial overstatement of the quality improvement might be considered a generous concession to the alternate viewpoint. On the other hand, it is well known that measurement error in the variables can cause an underestimation of marginal effects. In this case, it is not clear that the quality measures used are the right ones or consistently measured with respect to the research question (e.g., some apply to high school students intending to enter teaching while others apply to differences between actual teachers with more or less experience, an important distinction considering the authors’ argument about the effect of salaries on the potential candidate pool versus actual recruitments).
Ballou, Dale, and Podgursky, Michael. “Teacher Recruitment and Retention in Public and Private Schools,” Journal of Policy Analysis and Management, Vol. 17, No. 3, pp. 393–417. 1998.
Research Question(s): (1) How well do schools in each sector meet their teacher recruitment and retention objectives; (2) To what extent does the private sector benefit in these efforts from the elements of market competition emphasized by advocates of bottom-up reforms? Dependent Variable(s): Principals’ ratings of new and experienced teaching staffs. Independent
Methods: Ordered logistic with sector dummies for the first model and logistic with fixed effects for school sectors in the second model. An alternative model was specified with only those public schools that most closely resembled private schools in clientele and academic mission. Fixed-effect estimation was performed to ensure that differences in ratings between principals were due to teacher quality and not due to systematic bias or artifacts of the method. Data: Schools and Staffing Survey (1990–1991). Sample Size: 9,237–10,878 schools for the ordered logistic. 3,121–3,688 schools for the fixed-effects logistic model.
Findings: New teachers in both public and private schools are given similar ratings by their principals. However, experienced teachers in private schools are rated significantly higher than experienced public school teachers, even controlling for salary levels and community and school characteristics. This suggests that private schools do a better job of recruiting and retaining high-quality teachers. Since this difference cannot be attributed to the school and community characteristics that are controlled for in the model, the authors claim that it results from more effective personnel policies and practices in private schools. They suggest four specific mechanisms by which private schools might plausibly be able to develop and retain higher quality teachers than might similar public schools: greater pay flexibility, greater ability to recruit non-certified teachers, better staff development through in-service training and mentoring, and greater authority to dismiss poor teachers. This answers Research Question 2 because it says that leaving schools on their own (versus top-to-bottom

97
Variable(s): School type (public, Catholic, non-Catholic religious, non-religious private), school and community characteristics, principal characteristics, teacher pay, cost of living.
reforms like requiring more credentials—another year of education, master’s degree, etc.) actually allows them to recruit better and retain better—basically implying that privatization is the kind of bottom-up reform that we need. Comments: Maybe it would be a good idea to list the key assumptions of the model—for example, the results of Tables 1 and 2 (the ordered logistic results) depend largely on the assumption that (1) there is no sectoral bias (in ratings) and (2) there are no cohort effects. Since all conclusions stem from using one year of data (1990–1991), comparing veteran versus new teachers who belong to different cohorts may be problematic (i.e., new teachers ten years ago [today’s experienced teachers] could have been rated in such a way that the conclusion of retention of their higher-quality staff in private schools would not hold). Furthermore, we cannot be sure that principal ratings of quality correlate with actual teacher quality. The principals’ ratings are not related in this analysis to any measures of teacher retention, so it is difficult to see how principals’ ratings relate to hiring and firing practices.
Beaudin, Barbara Q. “Teachers Who Interrupt Their Careers: Characteristics of Those Who Return to the Classroom” Educational Evaluation and Policy Analysis, Vol. 15, No. 1, pp. 51–64. 1993.
Research Questions: (1) What are the characteristics that distinguish teachers who return to public school teaching after a career interruption? (2) What specific characteristics predict whether a teacher who has left the system will return? Dependent Variable(s): Dichotomous variable
Methods: (1) Descriptive analysis. (2) Maximum likelihood logistic analysis. Data: All teachers who started their teaching careers in a Michigan public school in 1972, 1973, 1974 or 1975 ended the first spell of teaching within four years of entry and taught an elementary or English, social studies, mathematics, biology, physics, or chemistry class in a middle or high school. Data on each teacher ends with the 1984–1985 school year. Sample Size: 3,060 (41.2 percent of all beginning Michigan public school teachers).
Findings: (1) Returning teachers are a significant source of new hires into the Michigan public school system. Of the 3,060 teachers in the sample who left within their first five years of teaching, 29 percent returned to teach in Michigan’s public schools by the beginning of the 1984–1985 school year. The pool of returning teachers contains a larger proportion of female teachers and teachers who began their careers with only a bachelor’s degree than the entire pool of beginning teachers. Elementary teachers and teachers with more years of experience compose a larger proportion of the returning teachers than of the pool of leavers. (2) Knowing a teacher’s subject area improves predicting whether a teacher will return or not return to teaching after a
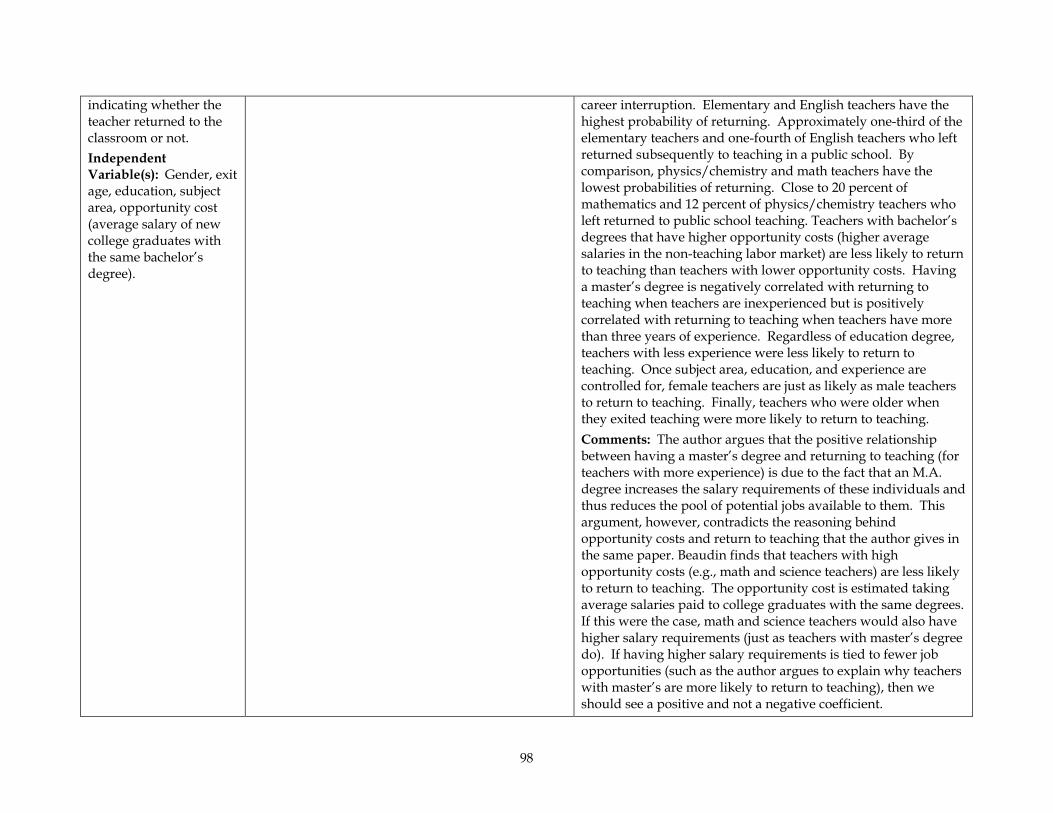
98
indicating whether the teacher returned to the classroom or not. Independent Variable(s): Gender, exit age, education, subject area, opportunity cost (average salary of new college graduates with the same bachelor’s degree).
career interruption. Elementary and English teachers have the highest probability of returning. Approximately one-third of the elementary teachers and one-fourth of English teachers who left returned subsequently to teaching in a public school. By comparison, physics/chemistry and math teachers have the lowest probabilities of returning. Close to 20 percent of mathematics and 12 percent of physics/chemistry teachers who left returned to public school teaching. Teachers with bachelor’s degrees that have higher opportunity costs (higher average salaries in the non-teaching labor market) are less likely to return to teaching than teachers with lower opportunity costs. Having a master’s degree is negatively correlated with returning to teaching when teachers are inexperienced but is positively correlated with returning to teaching when teachers have more than three years of experience. Regardless of education degree, teachers with less experience were less likely to return to teaching. Once subject area, education, and experience are controlled for, female teachers are just as likely as male teachers to return to teaching. Finally, teachers who were older when they exited teaching were more likely to return to teaching. Comments: The author argues that the positive relationship between having a master’s degree and returning to teaching (for teachers with more experience) is due to the fact that an M.A. degree increases the salary requirements of these individuals and thus reduces the pool of potential jobs available to them. This argument, however, contradicts the reasoning behind opportunity costs and return to teaching that the author gives in the same paper. Beaudin finds that teachers with high opportunity costs (e.g., math and science teachers) are less likely to return to teaching. The opportunity cost is estimated taking average salaries paid to college graduates with the same degrees. If this were the case, math and science teachers would also have higher salary requirements (just as teachers with master’s degree do). If having higher salary requirements is tied to fewer job opportunities (such as the author argues to explain why teachers with master’s are more likely to return to teaching), then we should see a positive and not a negative coefficient.
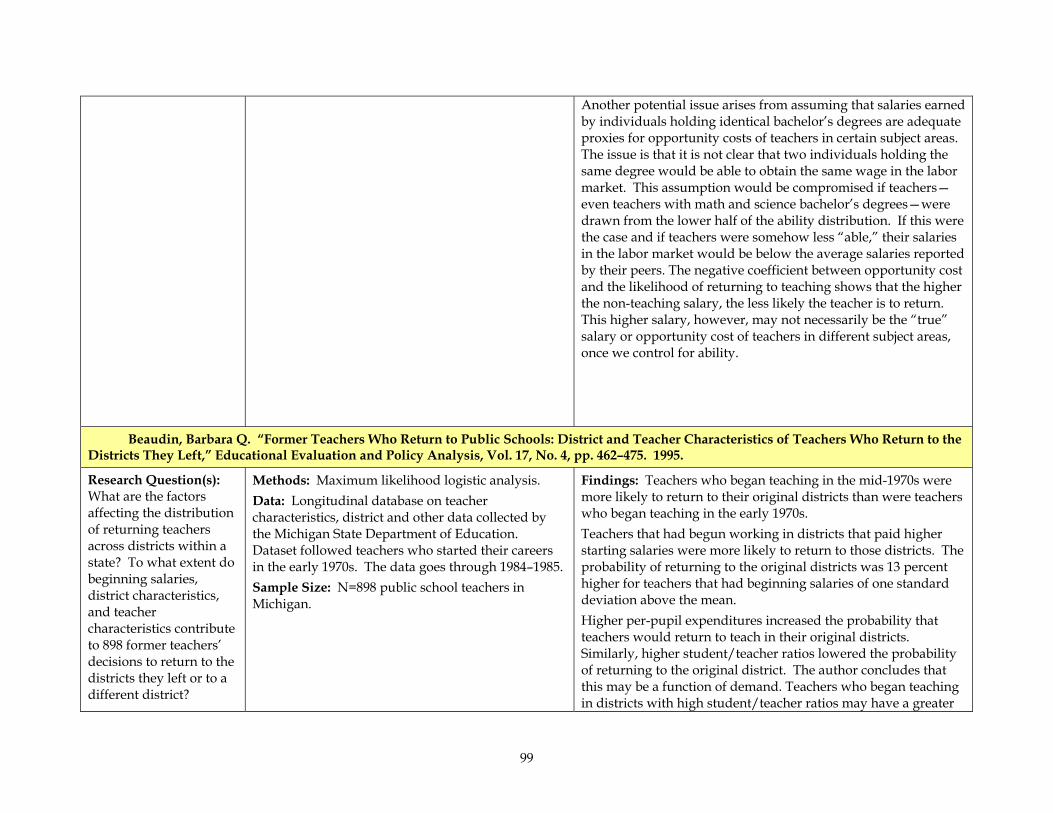
99
Another potential issue arises from assuming that salaries earned by individuals holding identical bachelor’s degrees are adequate proxies for opportunity costs of teachers in certain subject areas. The issue is that it is not clear that two individuals holding the same degree would be able to obtain the same wage in the labor market. This assumption would be compromised if teachers—even teachers with math and science bachelor’s degrees—were drawn from the lower half of the ability distribution. If this were the case and if teachers were somehow less “able,” their salaries in the labor market would be below the average salaries reported by their peers. The negative coefficient between opportunity cost and the likelihood of returning to teaching shows that the higher the non-teaching salary, the less likely the teacher is to return. This higher salary, however, may not necessarily be the “true” salary or opportunity cost of teachers in different subject areas, once we control for ability.
Beaudin, Barbara Q. “Former Teachers Who Return to Public Schools: District and Teacher Characteristics of Teachers Who Return to the Districts They Left,” Educational Evaluation and Policy Analysis, Vol. 17, No. 4, pp. 462–475. 1995.
Research Question(s): What are the factors affecting the distribution of returning teachers across districts within a state? To what extent do beginning salaries, district characteristics, and teacher characteristics contribute to 898 former teachers’ decisions to return to the districts they left or to a different district?
Methods: Maximum likelihood logistic analysis. Data: Longitudinal database on teacher characteristics, district and other data collected by the Michigan State Department of Education. Dataset followed teachers who started their careers in the early 1970s. The data goes through 1984–1985. Sample Size: N=898 public school teachers in Michigan.
Findings: Teachers who began teaching in the mid-1970s were more likely to return to their original districts than were teachers who began teaching in the early 1970s. Teachers that had begun working in districts that paid higher starting salaries were more likely to return to those districts. The probability of returning to the original districts was 13 percent higher for teachers that had beginning salaries of one standard deviation above the mean. Higher per-pupil expenditures increased the probability that teachers would return to teach in their original districts. Similarly, higher student/teacher ratios lowered the probability of returning to the original district. The author concludes that this may be a function of demand. Teachers who began teaching in districts with high student/teacher ratios may have a greater
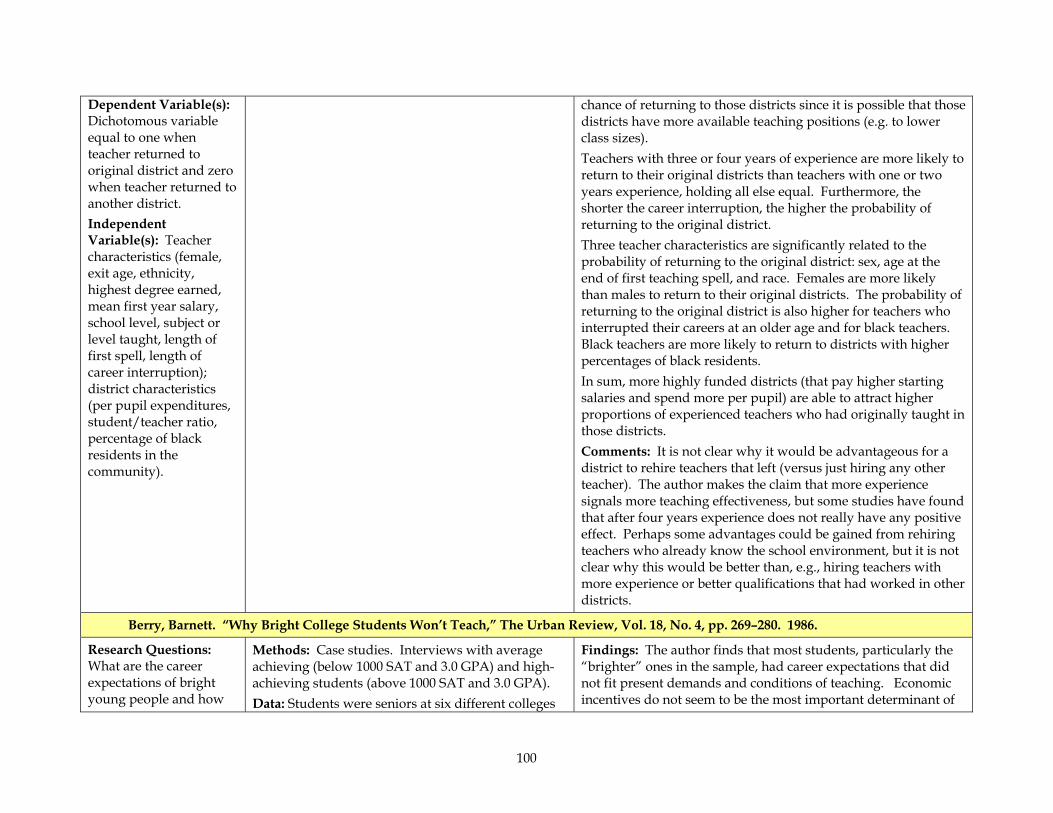
100
Dependent Variable(s): Dichotomous variable equal to one when teacher returned to original district and zero when teacher returned to another district. Independent Variable(s): Teacher characteristics (female, exit age, ethnicity, highest degree earned, mean first year salary, school level, subject or level taught, length of first spell, length of career interruption); district characteristics (per pupil expenditures, student/teacher ratio, percentage of black residents in the community).
chance of returning to those districts since it is possible that those districts have more available teaching positions (e.g. to lower class sizes). Teachers with three or four years of experience are more likely to return to their original districts than teachers with one or two years experience, holding all else equal. Furthermore, the shorter the career interruption, the higher the probability of returning to the original district. Three teacher characteristics are significantly related to the probability of returning to the original district: sex, age at the end of first teaching spell, and race. Females are more likely than males to return to their original districts. The probability of returning to the original district is also higher for teachers who interrupted their careers at an older age and for black teachers. Black teachers are more likely to return to districts with higher percentages of black residents. In sum, more highly funded districts (that pay higher starting salaries and spend more per pupil) are able to attract higher proportions of experienced teachers who had originally taught in those districts. Comments: It is not clear why it would be advantageous for a district to rehire teachers that left (versus just hiring any other teacher). The author makes the claim that more experience signals more teaching effectiveness, but some studies have found that after four years experience does not really have any positive effect. Perhaps some advantages could be gained from rehiring teachers who already know the school environment, but it is not clear why this would be better than, e.g., hiring teachers with more experience or better qualifications that had worked in other districts.
Berry, Barnett. “Why Bright College Students Won’t Teach,” The Urban Review, Vol. 18, No. 4, pp. 269–280. 1986.
Research Questions: What are the career expectations of bright young people and how
Methods: Case studies. Interviews with average achieving (below 1000 SAT and 3.0 GPA) and high-achieving students (above 1000 SAT and 3.0 GPA). Data: Students were seniors at six different colleges
Findings: The author finds that most students, particularly the “brighter” ones in the sample, had career expectations that did not fit present demands and conditions of teaching. Economic incentives do not seem to be the most important determinant of
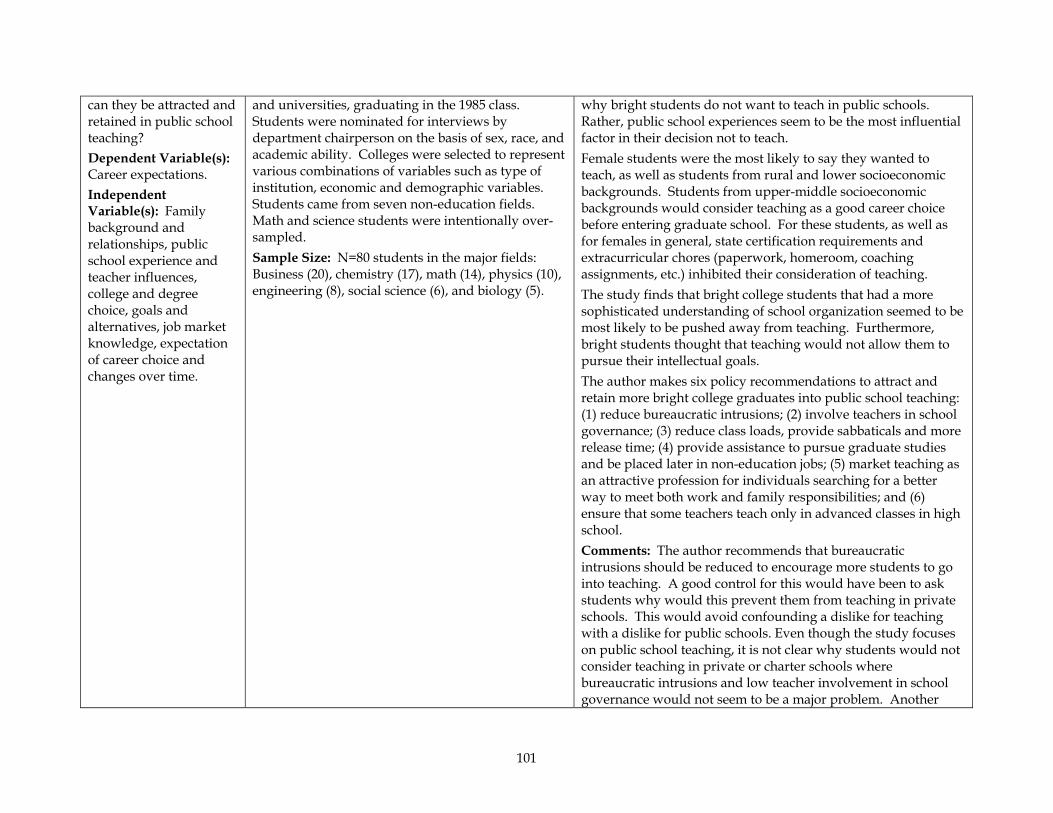
101
can they be attracted and retained in public school teaching? Dependent Variable(s): Career expectations. Independent Variable(s): Family background and relationships, public school experience and teacher influences, college and degree choice, goals and alternatives, job market knowledge, expectation of career choice and changes over time.
and universities, graduating in the 1985 class. Students were nominated for interviews by department chairperson on the basis of sex, race, and academic ability. Colleges were selected to represent various combinations of variables such as type of institution, economic and demographic variables. Students came from seven non-education fields. Math and science students were intentionally over-sampled. Sample Size: N=80 students in the major fields: Business (20), chemistry (17), math (14), physics (10), engineering (8), social science (6), and biology (5).
why bright students do not want to teach in public schools. Rather, public school experiences seem to be the most influential factor in their decision not to teach. Female students were the most likely to say they wanted to teach, as well as students from rural and lower socioeconomic backgrounds. Students from upper-middle socioeconomic backgrounds would consider teaching as a good career choice before entering graduate school. For these students, as well as for females in general, state certification requirements and extracurricular chores (paperwork, homeroom, coaching assignments, etc.) inhibited their consideration of teaching. The study finds that bright college students that had a more sophisticated understanding of school organization seemed to be most likely to be pushed away from teaching. Furthermore, bright students thought that teaching would not allow them to pursue their intellectual goals. The author makes six policy recommendations to attract and retain more bright college graduates into public school teaching: (1) reduce bureaucratic intrusions; (2) involve teachers in school governance; (3) reduce class loads, provide sabbaticals and more release time; (4) provide assistance to pursue graduate studies and be placed later in non-education jobs; (5) market teaching as an attractive profession for individuals searching for a better way to meet both work and family responsibilities; and (6) ensure that some teachers teach only in advanced classes in high school. Comments: The author recommends that bureaucratic intrusions should be reduced to encourage more students to go into teaching. A good control for this would have been to ask students why would this prevent them from teaching in private schools. This would avoid confounding a dislike for teaching with a dislike for public schools. Even though the study focuses on public school teaching, it is not clear why students would not consider teaching in private or charter schools where bureaucratic intrusions and low teacher involvement in school governance would not seem to be a major problem. Another
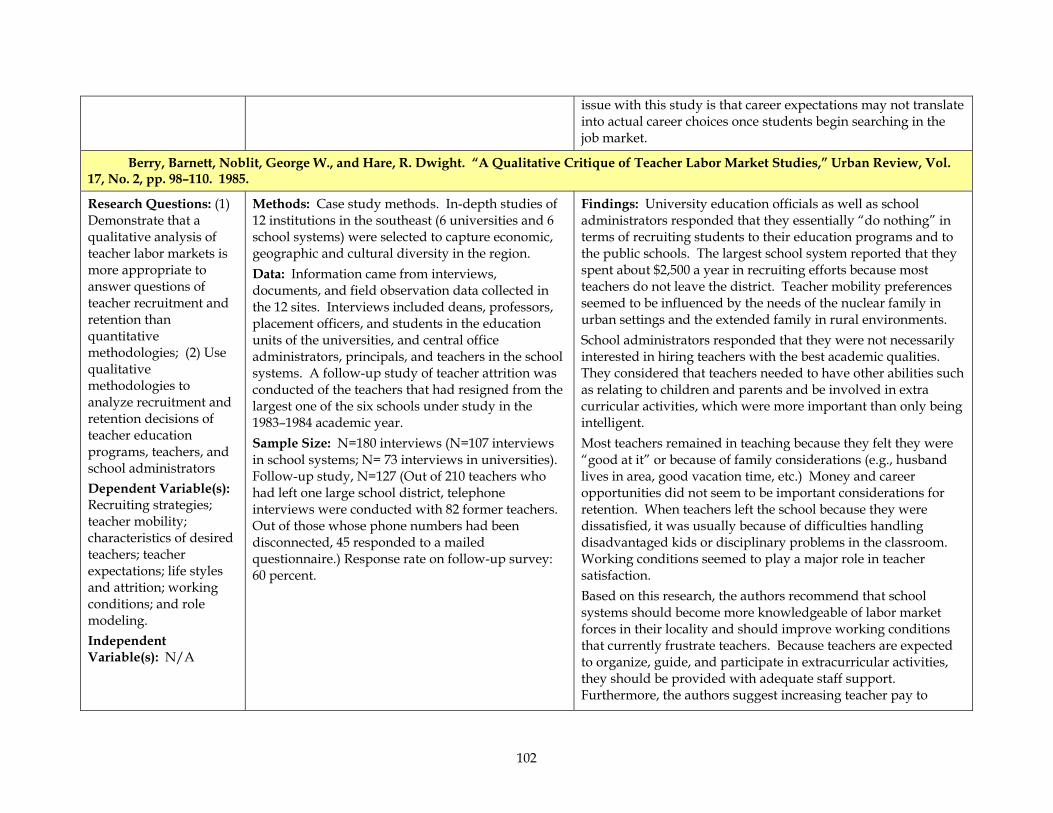
102
issue with this study is that career expectations may not translate into actual career choices once students begin searching in the job market.
Berry, Barnett, Noblit, George W., and Hare, R. Dwight. “A Qualitative Critique of Teacher Labor Market Studies,” Urban Review, Vol. 17, No. 2, pp. 98–110. 1985.
Research Questions: (1) Demonstrate that a qualitative analysis of teacher labor markets is more appropriate to answer questions of teacher recruitment and retention than quantitative methodologies; (2) Use qualitative methodologies to analyze recruitment and retention decisions of teacher education programs, teachers, and school administrators Dependent Variable(s): Recruiting strategies; teacher mobility; characteristics of desired teachers; teacher expectations; life styles and attrition; working conditions; and role modeling. Independent Variable(s): N/A
Methods: Case study methods. In-depth studies of 12 institutions in the southeast (6 universities and 6 school systems) were selected to capture economic, geographic and cultural diversity in the region. Data: Information came from interviews, documents, and field observation data collected in the 12 sites. Interviews included deans, professors, placement officers, and students in the education units of the universities, and central office administrators, principals, and teachers in the school systems. A follow-up study of teacher attrition was conducted of the teachers that had resigned from the largest one of the six schools under study in the 1983–1984 academic year. Sample Size: N=180 interviews (N=107 interviews in school systems; N= 73 interviews in universities). Follow-up study, N=127 (Out of 210 teachers who had left one large school district, telephone interviews were conducted with 82 former teachers. Out of those whose phone numbers had been disconnected, 45 responded to a mailed questionnaire.) Response rate on follow-up survey: 60 percent.
Findings: University education officials as well as school administrators responded that they essentially “do nothing” in terms of recruiting students to their education programs and to the public schools. The largest school system reported that they spent about $2,500 a year in recruiting efforts because most teachers do not leave the district. Teacher mobility preferences seemed to be influenced by the needs of the nuclear family in urban settings and the extended family in rural environments. School administrators responded that they were not necessarily interested in hiring teachers with the best academic qualities. They considered that teachers needed to have other abilities such as relating to children and parents and be involved in extra curricular activities, which were more important than only being intelligent. Most teachers remained in teaching because they felt they were “good at it” or because of family considerations (e.g., husband lives in area, good vacation time, etc.) Money and career opportunities did not seem to be important considerations for retention. When teachers left the school because they were dissatisfied, it was usually because of difficulties handling disadvantaged kids or disciplinary problems in the classroom. Working conditions seemed to play a major role in teacher satisfaction. Based on this research, the authors recommend that school systems should become more knowledgeable of labor market forces in their locality and should improve working conditions that currently frustrate teachers. Because teachers are expected to organize, guide, and participate in extracurricular activities, they should be provided with adequate staff support. Furthermore, the authors suggest increasing teacher pay to

103
improve the status of the teaching profession. The authors recommend loosening the certification requirements and recruit non-certified college graduates in high-demand areas (e.g., math and science). These are based on principals’ responses that they were not necessarily that concerned with academic qualifications. Therefore, they recommend that legislatures and state agencies provide more flexibility to schools for their recruiting/hiring processes. The authors find that quantitative studies are not able to explore teacher labor market characteristics with sufficient depth to understand all its complexities. Quantitative studies often rely on large-scale data sets that do not necessarily ask the right questions. So even though they provide the policy maker with “a scientific analysis of an outsider,” they usually fail to go beyond suggesting general trends and making a statement of the overall situation. Therefore, quantitative research cannot provide policy recommendations that can be locally implemented. Comments: Using large-scale data sets that were not necessarily designed to address the specific questions that the researcher wants to ask does present some problems in the research design of quantitative analyses. It is not clear, however, and the authors don’t really have a strong case to conclude that this shortcoming discredits quantitative analysis and invalidates their results, or to say that none of the findings of quantitative analyses have the potential to be locally implemented. Still, quantitative research is limited by available data, and it would benefit greatly from qualitative analyses that complement the information that large-scale datasets yield. Perhaps the issue is not quantitative techniques per se, but the data that quantitative researchers often have to rely upon.
Boe, Erling E., Bobbitt, Sharon A., Cook, Lynne H., Whitener, Summer D., and Weber, Anita L. “Why Didst Thou Go? Predictors of Retention, Transfer, and Attrition of Special and General Education Teachers from a National Perspective,” The Journal of Special Education, Vol. 30, No. 4, pp. 390–411. 1997.
Research Questions: Methods: Chi-square tests of associations between Findings: The percentage of those transferring to other schools
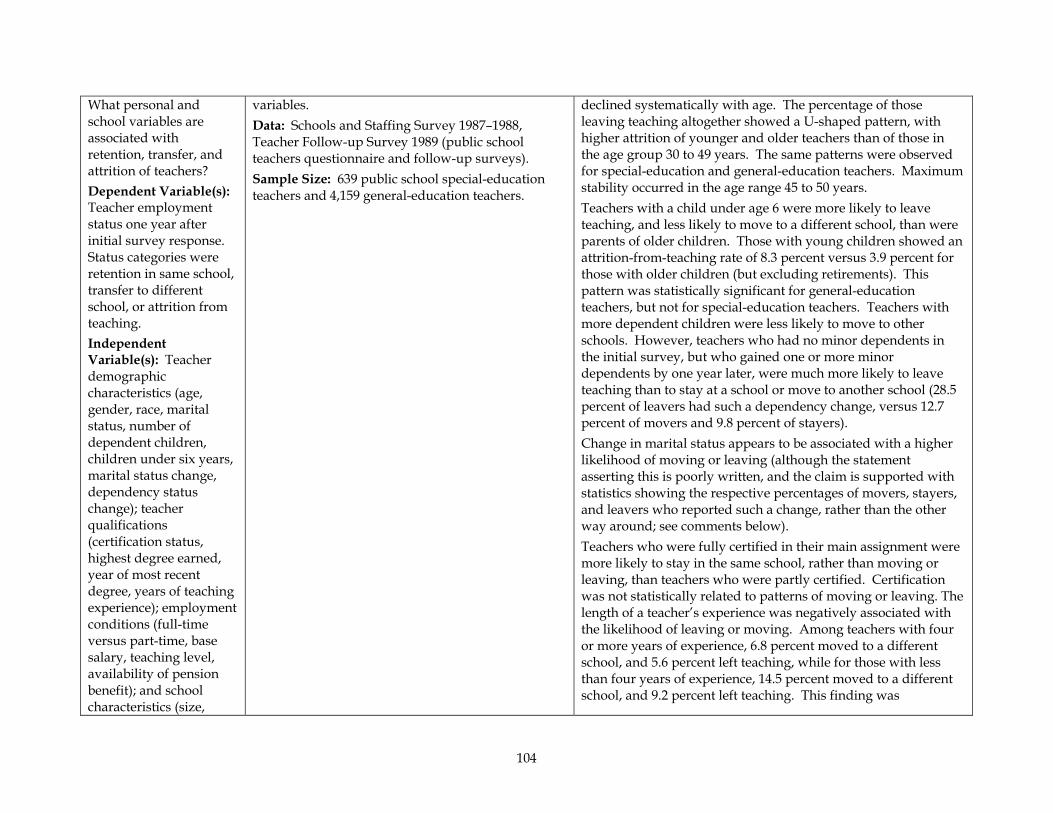
104
What personal and school variables are associated with retention, transfer, and attrition of teachers? Dependent Variable(s): Teacher employment status one year after initial survey response. Status categories were retention in same school, transfer to different school, or attrition from teaching. Independent Variable(s): Teacher demographic characteristics (age, gender, race, marital status, number of dependent children, children under six years, marital status change, dependency status change); teacher qualifications (certification status, highest degree earned, year of most recent degree, years of teaching experience); employment conditions (full-time versus part-time, base salary, teaching level, availability of pension benefit); and school characteristics (size,
variables. Data: Schools and Staffing Survey 1987–1988, Teacher Follow-up Survey 1989 (public school teachers questionnaire and follow-up surveys). Sample Size: 639 public school special-education teachers and 4,159 general-education teachers.
declined systematically with age. The percentage of those leaving teaching altogether showed a U-shaped pattern, with higher attrition of younger and older teachers than of those in the age group 30 to 49 years. The same patterns were observed for special-education and general-education teachers. Maximum stability occurred in the age range 45 to 50 years. Teachers with a child under age 6 were more likely to leave teaching, and less likely to move to a different school, than were parents of older children. Those with young children showed an attrition-from-teaching rate of 8.3 percent versus 3.9 percent for those with older children (but excluding retirements). This pattern was statistically significant for general-education teachers, but not for special-education teachers. Teachers with more dependent children were less likely to move to other schools. However, teachers who had no minor dependents in the initial survey, but who gained one or more minor dependents by one year later, were much more likely to leave teaching than to stay at a school or move to another school (28.5 percent of leavers had such a dependency change, versus 12.7 percent of movers and 9.8 percent of stayers). Change in marital status appears to be associated with a higher likelihood of moving or leaving (although the statement asserting this is poorly written, and the claim is supported with statistics showing the respective percentages of movers, stayers, and leavers who reported such a change, rather than the other way around; see comments below). Teachers who were fully certified in their main assignment were more likely to stay in the same school, rather than moving or leaving, than teachers who were partly certified. Certification was not statistically related to patterns of moving or leaving. The length of a teacher’s experience was negatively associated with the likelihood of leaving or moving. Among teachers with four or more years of experience, 6.8 percent moved to a different school, and 5.6 percent left teaching, while for those with less than four years of experience, 14.5 percent moved to a different school, and 9.2 percent left teaching. This finding was
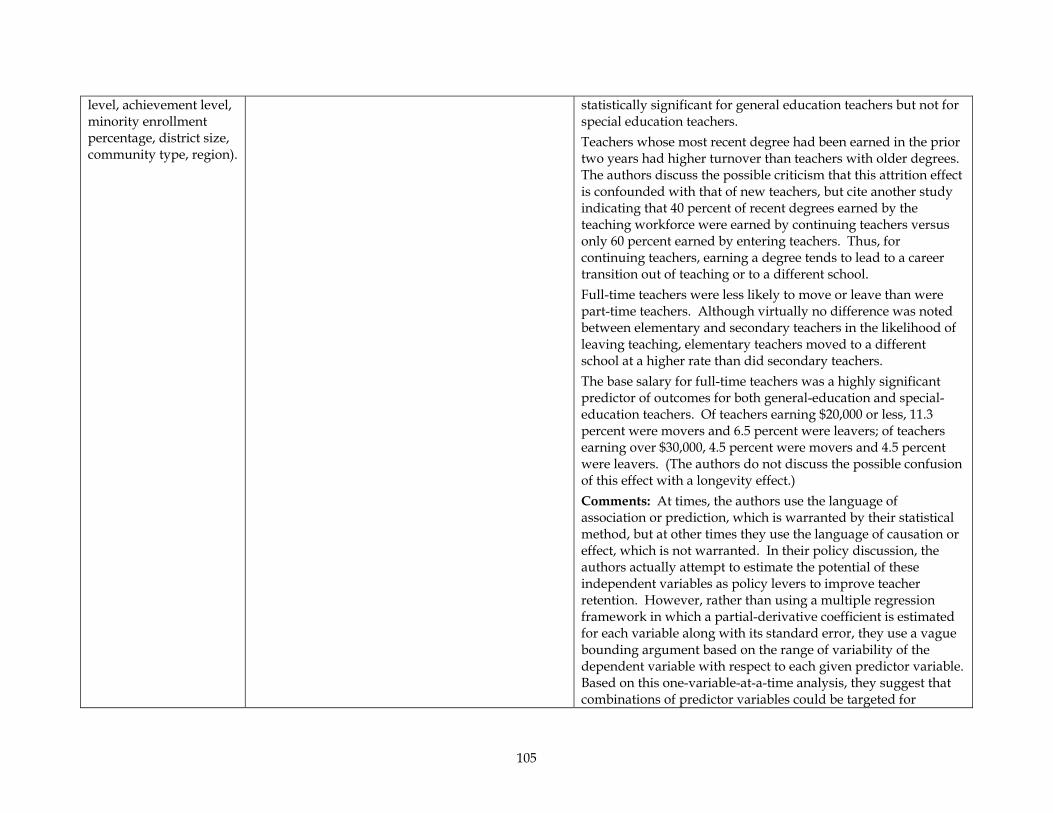
105
level, achievement level, minority enrollment percentage, district size, community type, region).
statistically significant for general education teachers but not for special education teachers. Teachers whose most recent degree had been earned in the prior two years had higher turnover than teachers with older degrees. The authors discuss the possible criticism that this attrition effect is confounded with that of new teachers, but cite another study indicating that 40 percent of recent degrees earned by the teaching workforce were earned by continuing teachers versus only 60 percent earned by entering teachers. Thus, for continuing teachers, earning a degree tends to lead to a career transition out of teaching or to a different school. Full-time teachers were less likely to move or leave than were part-time teachers. Although virtually no difference was noted between elementary and secondary teachers in the likelihood of leaving teaching, elementary teachers moved to a different school at a higher rate than did secondary teachers. The base salary for full-time teachers was a highly significant predictor of outcomes for both general-education and special-education teachers. Of teachers earning $20,000 or less, 11.3 percent were movers and 6.5 percent were leavers; of teachers earning over $30,000, 4.5 percent were movers and 4.5 percent were leavers. (The authors do not discuss the possible confusion of this effect with a longevity effect.) Comments: At times, the authors use the language of association or prediction, which is warranted by their statistical method, but at other times they use the language of causation or effect, which is not warranted. In their policy discussion, the authors actually attempt to estimate the potential of these independent variables as policy levers to improve teacher retention. However, rather than using a multiple regression framework in which a partial-derivative coefficient is estimated for each variable along with its standard error, they use a vague bounding argument based on the range of variability of the dependent variable with respect to each given predictor variable. Based on this one-variable-at-a-time analysis, they suggest that combinations of predictor variables could be targeted for
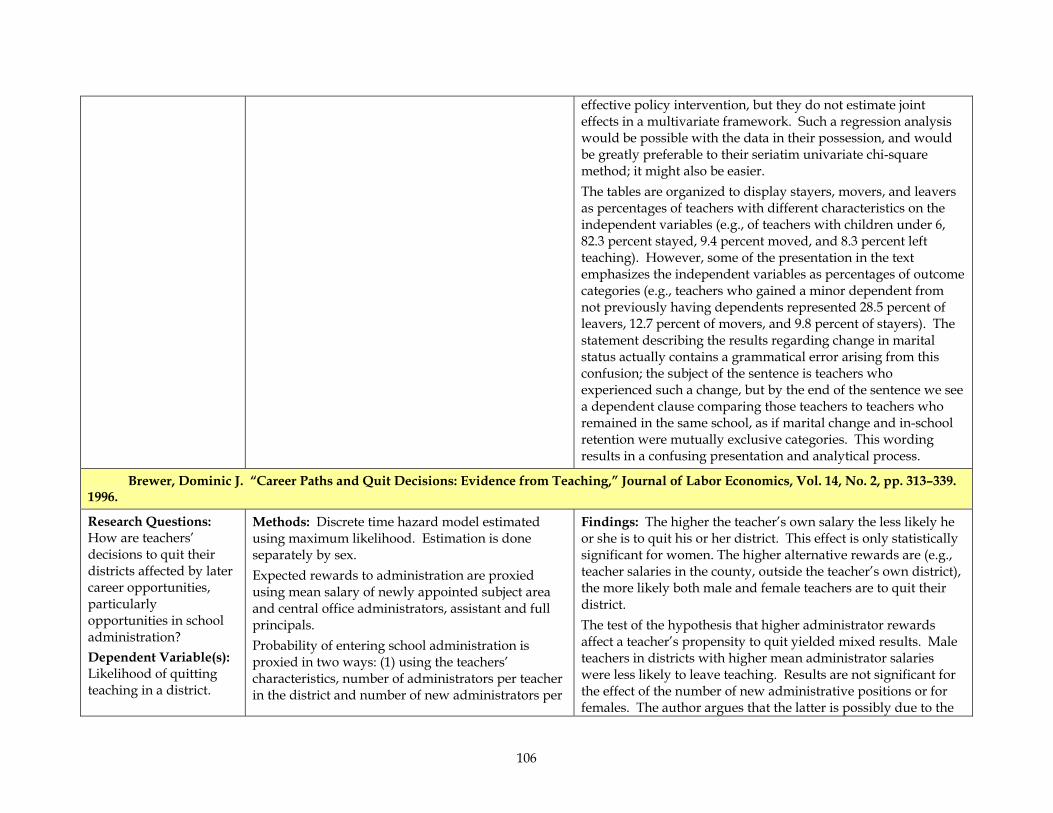
106
effective policy intervention, but they do not estimate joint effects in a multivariate framework. Such a regression analysis would be possible with the data in their possession, and would be greatly preferable to their seriatim univariate chi-square method; it might also be easier. The tables are organized to display stayers, movers, and leavers as percentages of teachers with different characteristics on the independent variables (e.g., of teachers with children under 6, 82.3 percent stayed, 9.4 percent moved, and 8.3 percent left teaching). However, some of the presentation in the text emphasizes the independent variables as percentages of outcome categories (e.g., teachers who gained a minor dependent from not previously having dependents represented 28.5 percent of leavers, 12.7 percent of movers, and 9.8 percent of stayers). The statement describing the results regarding change in marital status actually contains a grammatical error arising from this confusion; the subject of the sentence is teachers who experienced such a change, but by the end of the sentence we see a dependent clause comparing those teachers to teachers who remained in the same school, as if marital change and in-school retention were mutually exclusive categories. This wording results in a confusing presentation and analytical process.
Brewer, Dominic J. “Career Paths and Quit Decisions: Evidence from Teaching,” Journal of Labor Economics, Vol. 14, No. 2, pp. 313–339. 1996.
Research Questions: How are teachers’ decisions to quit their districts affected by later career opportunities, particularly opportunities in school administration? Dependent Variable(s): Likelihood of quitting teaching in a district.
Methods: Discrete time hazard model estimated using maximum likelihood. Estimation is done separately by sex. Expected rewards to administration are proxied using mean salary of newly appointed subject area and central office administrators, assistant and full principals. Probability of entering school administration is proxied in two ways: (1) using the teachers’ characteristics, number of administrators per teacher in the district and number of new administrators per
Findings: The higher the teacher’s own salary the less likely he or she is to quit his or her district. This effect is only statistically significant for women. The higher alternative rewards are (e.g., teacher salaries in the county, outside the teacher’s own district), the more likely both male and female teachers are to quit their district. The test of the hypothesis that higher administrator rewards affect a teacher’s propensity to quit yielded mixed results. Male teachers in districts with higher mean administrator salaries were less likely to leave teaching. Results are not significant for the effect of the number of new administrative positions or for females. The author argues that the latter is possibly due to the
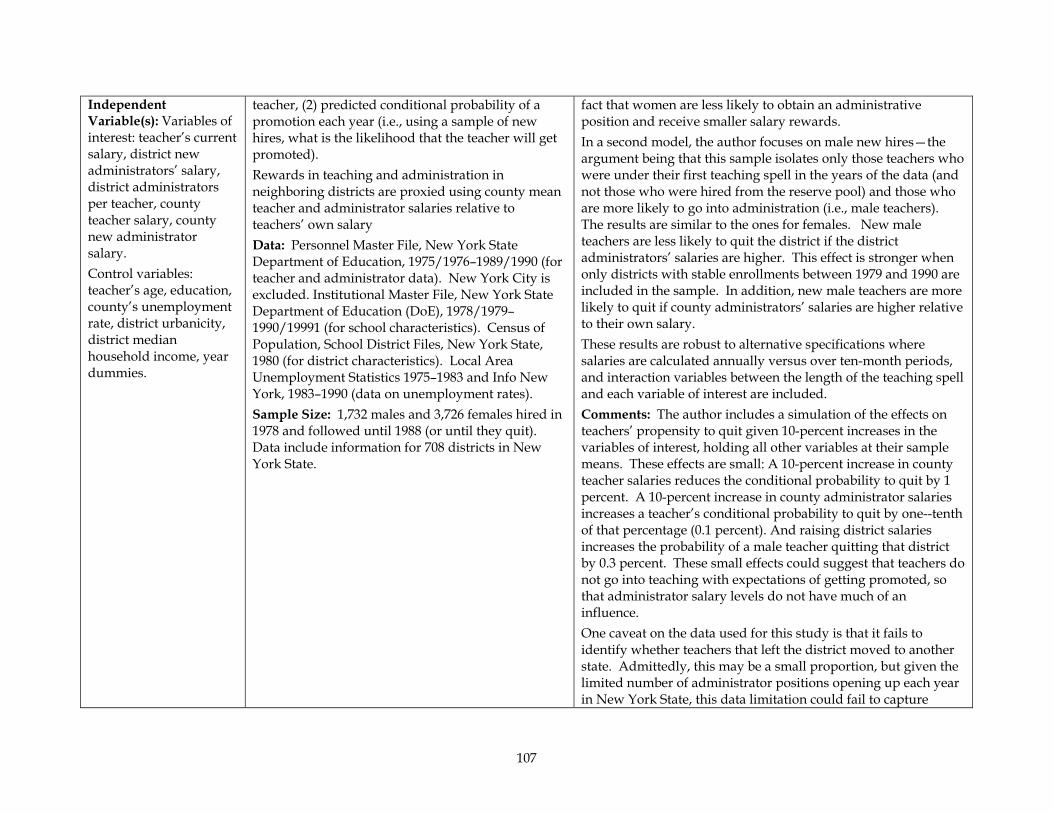
107
Independent Variable(s): Variables of interest: teacher’s current salary, district new administrators’ salary, district administrators per teacher, county teacher salary, county new administrator salary. Control variables: teacher’s age, education, county’s unemployment rate, district urbanicity, district median household income, year dummies.
teacher, (2) predicted conditional probability of a promotion each year (i.e., using a sample of new hires, what is the likelihood that the teacher will get promoted). Rewards in teaching and administration in neighboring districts are proxied using county mean teacher and administrator salaries relative to teachers’ own salary Data: Personnel Master File, New York State Department of Education, 1975/1976–1989/1990 (for teacher and administrator data). New York City is excluded. Institutional Master File, New York State Department of Education (DoE), 1978/1979–1990/19991 (for school characteristics). Census of Population, School District Files, New York State, 1980 (for district characteristics). Local Area Unemployment Statistics 1975–1983 and Info New York, 1983–1990 (data on unemployment rates). Sample Size: 1,732 males and 3,726 females hired in 1978 and followed until 1988 (or until they quit). Data include information for 708 districts in New York State.
fact that women are less likely to obtain an administrative position and receive smaller salary rewards. In a second model, the author focuses on male new hires—the argument being that this sample isolates only those teachers who were under their first teaching spell in the years of the data (and not those who were hired from the reserve pool) and those who are more likely to go into administration (i.e., male teachers). The results are similar to the ones for females. New male teachers are less likely to quit the district if the district administrators’ salaries are higher. This effect is stronger when only districts with stable enrollments between 1979 and 1990 are included in the sample. In addition, new male teachers are more likely to quit if county administrators’ salaries are higher relative to their own salary. These results are robust to alternative specifications where salaries are calculated annually versus over ten-month periods, and interaction variables between the length of the teaching spell and each variable of interest are included. Comments: The author includes a simulation of the effects on teachers’ propensity to quit given 10-percent increases in the variables of interest, holding all other variables at their sample means. These effects are small: A 10-percent increase in county teacher salaries reduces the conditional probability to quit by 1 percent. A 10-percent increase in county administrator salaries increases a teacher’s conditional probability to quit by one--tenth of that percentage (0.1 percent). And raising district salaries increases the probability of a male teacher quitting that district by 0.3 percent. These small effects could suggest that teachers do not go into teaching with expectations of getting promoted, so that administrator salary levels do not have much of an influence. One caveat on the data used for this study is that it fails to identify whether teachers that left the district moved to another state. Admittedly, this may be a small proportion, but given the limited number of administrator positions opening up each year in New York State, this data limitation could fail to capture
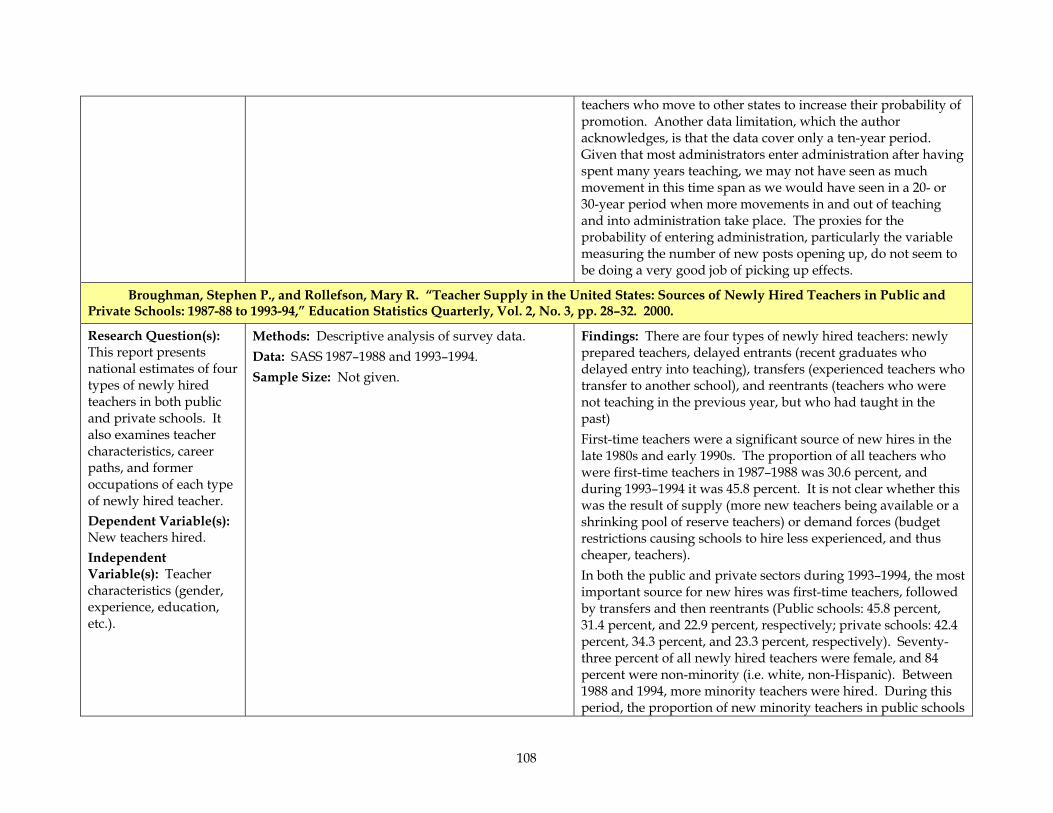
108
teachers who move to other states to increase their probability of promotion. Another data limitation, which the author acknowledges, is that the data cover only a ten-year period. Given that most administrators enter administration after having spent many years teaching, we may not have seen as much movement in this time span as we would have seen in a 20- or 30-year period when more movements in and out of teaching and into administration take place. The proxies for the probability of entering administration, particularly the variable measuring the number of new posts opening up, do not seem to be doing a very good job of picking up effects.
Broughman, Stephen P., and Rollefson, Mary R. “Teacher Supply in the United States: Sources of Newly Hired Teachers in Public and Private Schools: 1987-88 to 1993-94,” Education Statistics Quarterly, Vol. 2, No. 3, pp. 28–32. 2000.
Research Question(s): This report presents national estimates of four types of newly hired teachers in both public and private schools. It also examines teacher characteristics, career paths, and former occupations of each type of newly hired teacher. Dependent Variable(s): New teachers hired. Independent Variable(s): Teacher characteristics (gender, experience, education, etc.).
Methods: Descriptive analysis of survey data. Data: SASS 1987–1988 and 1993–1994. Sample Size: Not given.
Findings: There are four types of newly hired teachers: newly prepared teachers, delayed entrants (recent graduates who delayed entry into teaching), transfers (experienced teachers who transfer to another school), and reentrants (teachers who were not teaching in the previous year, but who had taught in the past) First-time teachers were a significant source of new hires in the late 1980s and early 1990s. The proportion of all teachers who were first-time teachers in 1987–1988 was 30.6 percent, and during 1993–1994 it was 45.8 percent. It is not clear whether this was the result of supply (more new teachers being available or a shrinking pool of reserve teachers) or demand forces (budget restrictions causing schools to hire less experienced, and thus cheaper, teachers). In both the public and private sectors during 1993–1994, the most important source for new hires was first-time teachers, followed by transfers and then reentrants (Public schools: 45.8 percent, 31.4 percent, and 22.9 percent, respectively; private schools: 42.4 percent, 34.3 percent, and 23.3 percent, respectively). Seventy-three percent of all newly hired teachers were female, and 84 percent were non-minority (i.e. white, non-Hispanic). Between 1988 and 1994, more minority teachers were hired. During this period, the proportion of new minority teachers in public schools
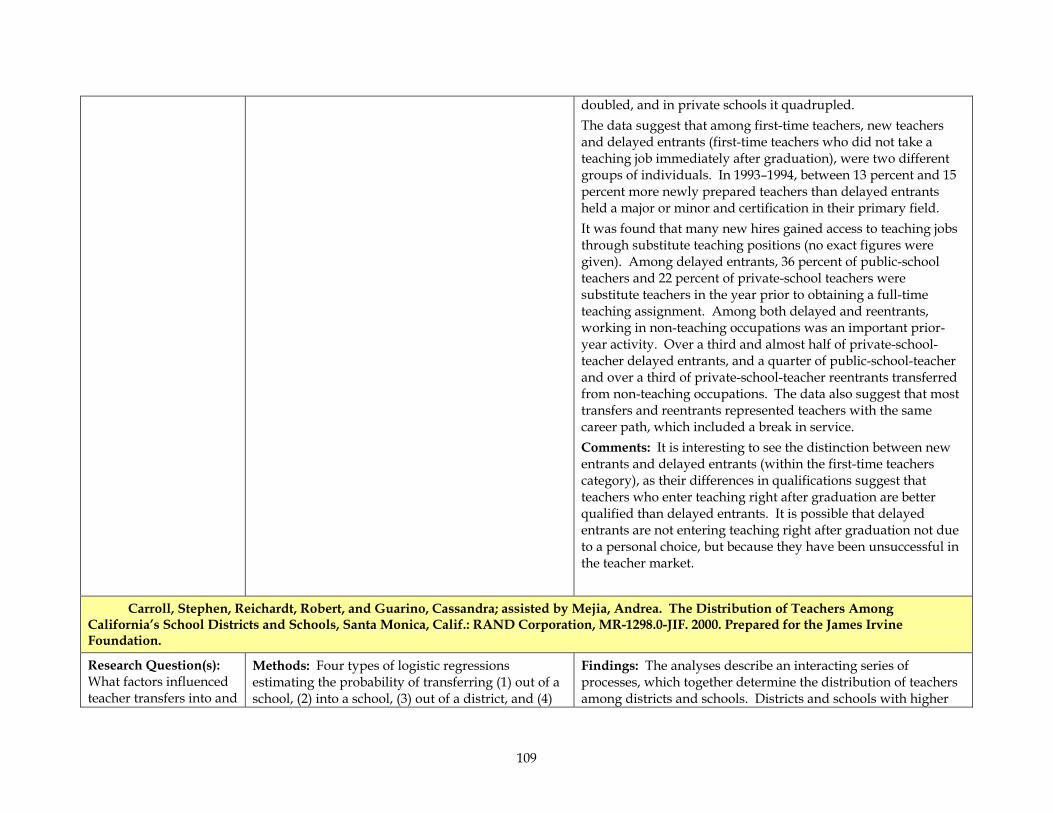
109
doubled, and in private schools it quadrupled. The data suggest that among first-time teachers, new teachers and delayed entrants (first-time teachers who did not take a teaching job immediately after graduation), were two different groups of individuals. In 1993–1994, between 13 percent and 15 percent more newly prepared teachers than delayed entrants held a major or minor and certification in their primary field. It was found that many new hires gained access to teaching jobs through substitute teaching positions (no exact figures were given). Among delayed entrants, 36 percent of public-school teachers and 22 percent of private-school teachers were substitute teachers in the year prior to obtaining a full-time teaching assignment. Among both delayed and reentrants, working in non-teaching occupations was an important prior-year activity. Over a third and almost half of private-school-teacher delayed entrants, and a quarter of public-school-teacher and over a third of private-school-teacher reentrants transferred from non-teaching occupations. The data also suggest that most transfers and reentrants represented teachers with the same career path, which included a break in service. Comments: It is interesting to see the distinction between new entrants and delayed entrants (within the first-time teachers category), as their differences in qualifications suggest that teachers who enter teaching right after graduation are better qualified than delayed entrants. It is possible that delayed entrants are not entering teaching right after graduation not due to a personal choice, but because they have been unsuccessful in the teacher market.
Carroll, Stephen, Reichardt, Robert, and Guarino, Cassandra; assisted by Mejia, Andrea. The Distribution of Teachers Among California’s School Districts and Schools, Santa Monica, Calif.: RAND Corporation, MR-1298.0-JIF. 2000. Prepared for the James Irvine Foundation.
Research Question(s): What factors influenced teacher transfers into and
Methods: Four types of logistic regressions estimating the probability of transferring (1) out of a school, (2) into a school, (3) out of a district, and (4)
Findings: The analyses describe an interacting series of processes, which together determine the distribution of teachers among districts and schools. Districts and schools with higher
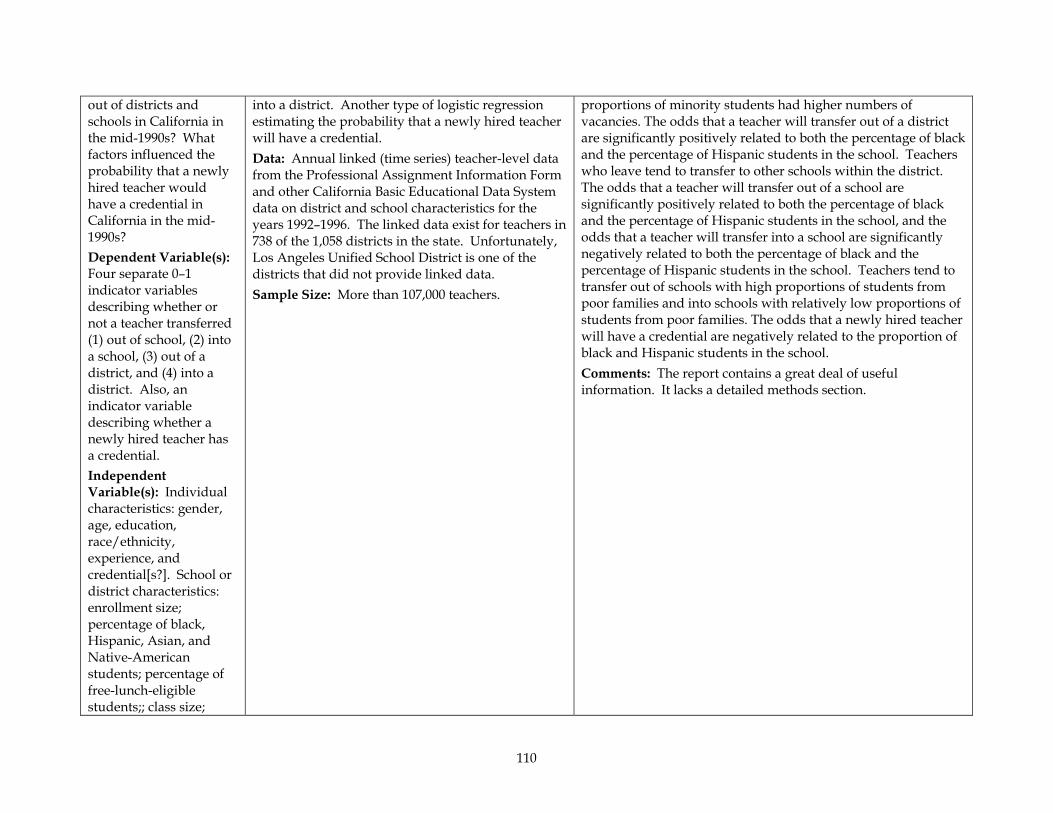
110
out of districts and schools in California in the mid-1990s? What factors influenced the probability that a newly hired teacher would have a credential in California in the mid-1990s? Dependent Variable(s): Four separate 0–1 indicator variables describing whether or not a teacher transferred (1) out of school, (2) into a school, (3) out of a district, and (4) into a district. Also, an indicator variable describing whether a newly hired teacher has a credential. Independent Variable(s): Individual characteristics: gender, age, education, race/ethnicity, experience, and credential[s?]. School or district characteristics: enrollment size; percentage of black, Hispanic, Asian, and Native-American students; percentage of free-lunch-eligible students;; class size;
into a district. Another type of logistic regression estimating the probability that a newly hired teacher will have a credential. Data: Annual linked (time series) teacher-level data from the Professional Assignment Information Form and other California Basic Educational Data System data on district and school characteristics for the years 1992–1996. The linked data exist for teachers in 738 of the 1,058 districts in the state. Unfortunately, Los Angeles Unified School District is one of the districts that did not provide linked data. Sample Size: More than 107,000 teachers.
proportions of minority students had higher numbers of vacancies. The odds that a teacher will transfer out of a district are significantly positively related to both the percentage of black and the percentage of Hispanic students in the school. Teachers who leave tend to transfer to other schools within the district. The odds that a teacher will transfer out of a school are significantly positively related to both the percentage of black and the percentage of Hispanic students in the school, and the odds that a teacher will transfer into a school are significantly negatively related to both the percentage of black and the percentage of Hispanic students in the school. Teachers tend to transfer out of schools with high proportions of students from poor families and into schools with relatively low proportions of students from poor families. The odds that a newly hired teacher will have a credential are negatively related to the proportion of black and Hispanic students in the school. Comments: The report contains a great deal of useful information. It lacks a detailed methods section.
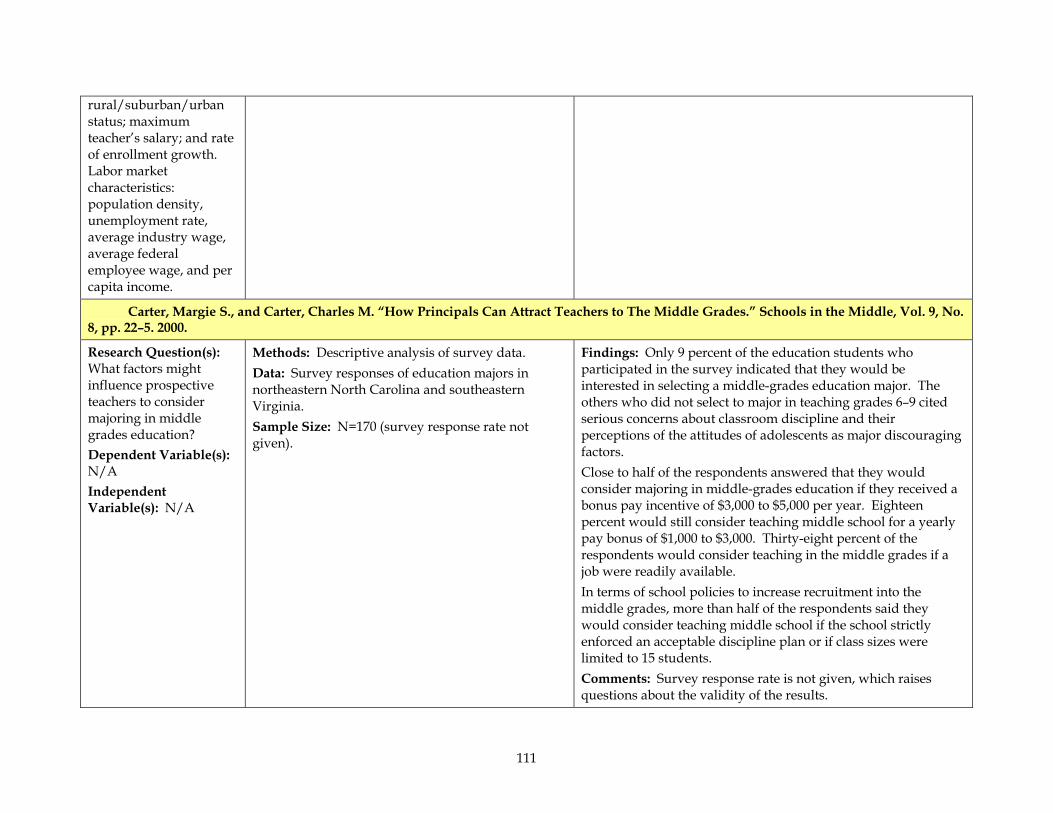
111
rural/suburban/urban status; maximum teacher’s salary; and rate of enrollment growth. Labor market characteristics: population density, unemployment rate, average industry wage, average federal employee wage, and per capita income.
Carter, Margie S., and Carter, Charles M. “How Principals Can Attract Teachers to The Middle Grades.” Schools in the Middle, Vol. 9, No. 8, pp. 22–5. 2000.
Research Question(s): What factors might influence prospective teachers to consider majoring in middle grades education? Dependent Variable(s): N/A Independent Variable(s): N/A
Methods: Descriptive analysis of survey data. Data: Survey responses of education majors in northeastern North Carolina and southeastern Virginia. Sample Size: N=170 (survey response rate not given).
Findings: Only 9 percent of the education students who participated in the survey indicated that they would be interested in selecting a middle-grades education major. The others who did not select to major in teaching grades 6–9 cited serious concerns about classroom discipline and their perceptions of the attitudes of adolescents as major discouraging factors. Close to half of the respondents answered that they would consider majoring in middle-grades education if they received a bonus pay incentive of $3,000 to $5,000 per year. Eighteen percent would still consider teaching middle school for a yearly pay bonus of $1,000 to $3,000. Thirty-eight percent of the respondents would consider teaching in the middle grades if a job were readily available. In terms of school policies to increase recruitment into the middle grades, more than half of the respondents said they would consider teaching middle school if the school strictly enforced an acceptable discipline plan or if class sizes were limited to 15 students. Comments: Survey response rate is not given, which raises questions about the validity of the results.
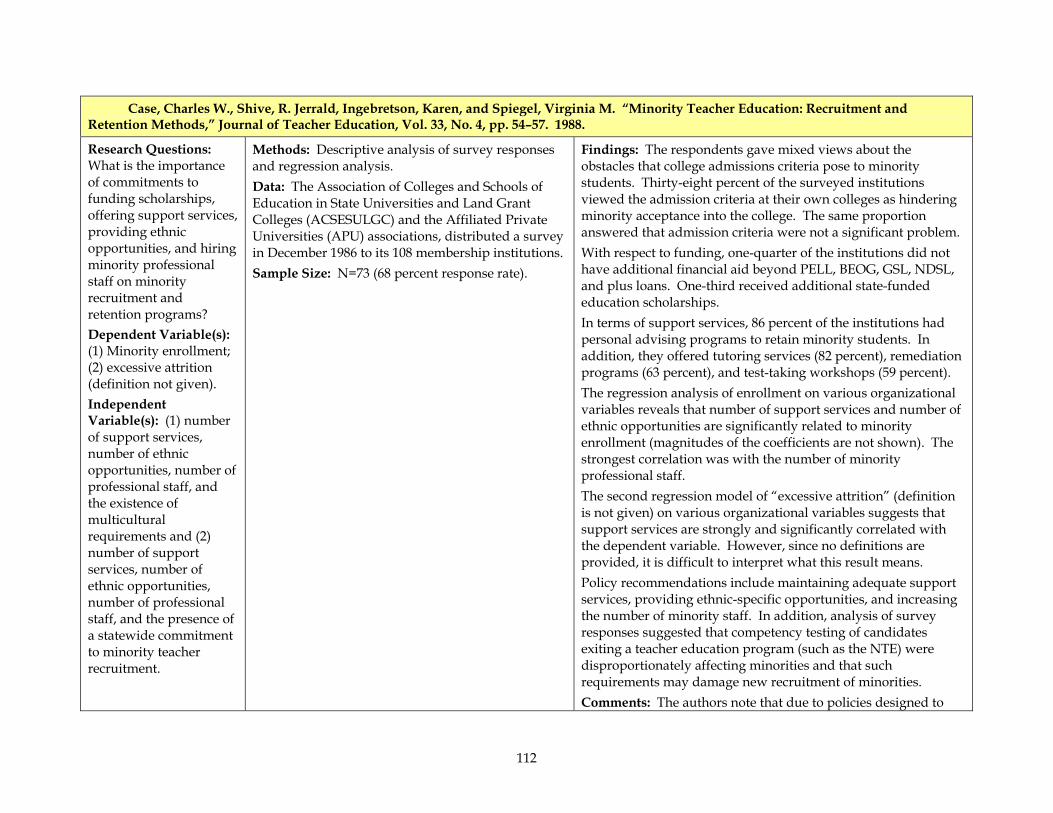
112
Case, Charles W., Shive, R. Jerrald, Ingebretson, Karen, and Spiegel, Virginia M. “Minority Teacher Education: Recruitment and Retention Methods,” Journal of Teacher Education, Vol. 33, No. 4, pp. 54–57. 1988.
Research Questions: What is the importance of commitments to funding scholarships, offering support services, providing ethnic opportunities, and hiring minority professional staff on minority recruitment and retention programs? Dependent Variable(s): (1) Minority enrollment; (2) excessive attrition (definition not given). Independent Variable(s): (1) number of support services, number of ethnic opportunities, number of professional staff, and the existence of multicultural requirements and (2) number of support services, number of ethnic opportunities, number of professional staff, and the presence of a statewide commitment to minority teacher recruitment.
Methods: Descriptive analysis of survey responses and regression analysis. Data: The Association of Colleges and Schools of Education in State Universities and Land Grant Colleges (ACSESULGC) and the Affiliated Private Universities (APU) associations, distributed a survey in December 1986 to its 108 membership institutions. Sample Size: N=73 (68 percent response rate).
Findings: The respondents gave mixed views about the obstacles that college admissions criteria pose to minority students. Thirty-eight percent of the surveyed institutions viewed the admission criteria at their own colleges as hindering minority acceptance into the college. The same proportion answered that admission criteria were not a significant problem. With respect to funding, one-quarter of the institutions did not have additional financial aid beyond PELL, BEOG, GSL, NDSL, and plus loans. One-third received additional state-funded education scholarships. In terms of support services, 86 percent of the institutions had personal advising programs to retain minority students. In addition, they offered tutoring services (82 percent), remediation programs (63 percent), and test-taking workshops (59 percent). The regression analysis of enrollment on various organizational variables reveals that number of support services and number of ethnic opportunities are significantly related to minority enrollment (magnitudes of the coefficients are not shown). The strongest correlation was with the number of minority professional staff. The second regression model of “excessive attrition” (definition is not given) on various organizational variables suggests that support services are strongly and significantly correlated with the dependent variable. However, since no definitions are provided, it is difficult to interpret what this result means. Policy recommendations include maintaining adequate support services, providing ethnic-specific opportunities, and increasing the number of minority staff. In addition, analysis of survey responses suggested that competency testing of candidates exiting a teacher education program (such as the NTE) were disproportionately affecting minorities and that such requirements may damage new recruitment of minorities. Comments: The authors note that due to policies designed to
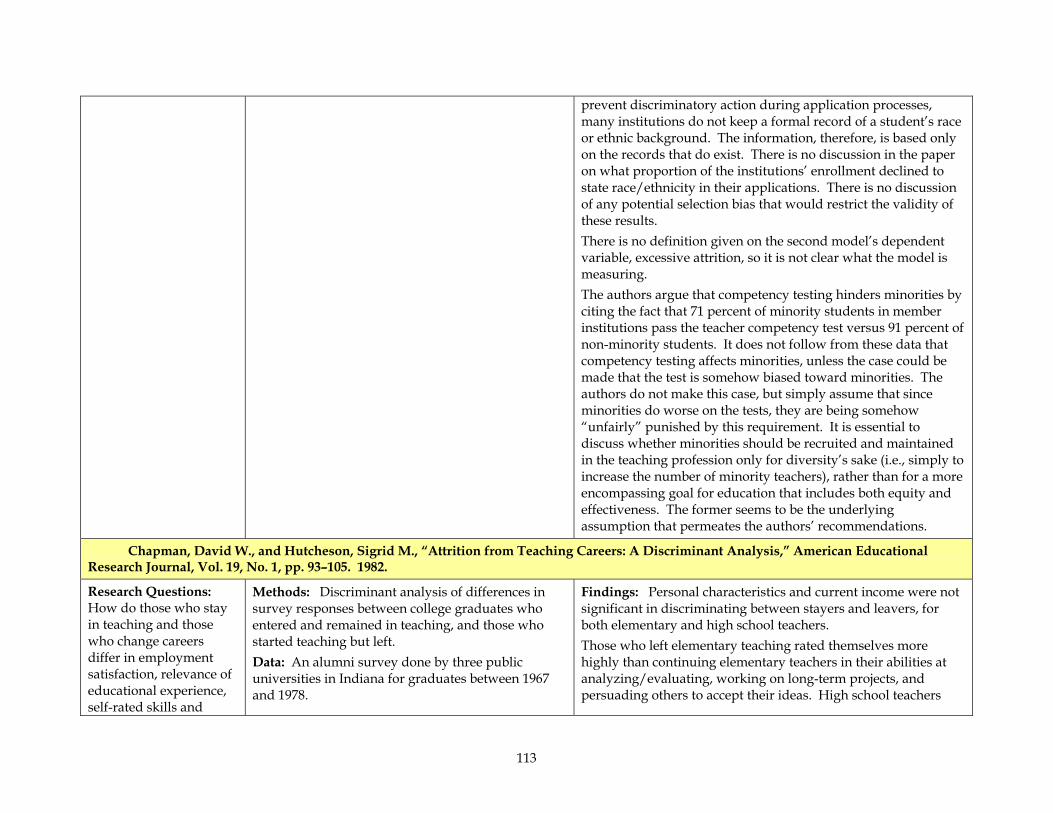
113
prevent discriminatory action during application processes, many institutions do not keep a formal record of a student’s race or ethnic background. The information, therefore, is based only on the records that do exist. There is no discussion in the paper on what proportion of the institutions’ enrollment declined to state race/ethnicity in their applications. There is no discussion of any potential selection bias that would restrict the validity of these results. There is no definition given on the second model’s dependent variable, excessive attrition, so it is not clear what the model is measuring. The authors argue that competency testing hinders minorities by citing the fact that 71 percent of minority students in member institutions pass the teacher competency test versus 91 percent of non-minority students. It does not follow from these data that competency testing affects minorities, unless the case could be made that the test is somehow biased toward minorities. The authors do not make this case, but simply assume that since minorities do worse on the tests, they are being somehow “unfairly” punished by this requirement. It is essential to discuss whether minorities should be recruited and maintained in the teaching profession only for diversity’s sake (i.e., simply to increase the number of minority teachers), rather than for a more encompassing goal for education that includes both equity and effectiveness. The former seems to be the underlying assumption that permeates the authors’ recommendations.
Chapman, David W., and Hutcheson, Sigrid M., “Attrition from Teaching Careers: A Discriminant Analysis,” American Educational Research Journal, Vol. 19, No. 1, pp. 93–105. 1982.
Research Questions: How do those who stay in teaching and those who change careers differ in employment satisfaction, relevance of educational experience, self-rated skills and
Methods: Discriminant analysis of differences in survey responses between college graduates who entered and remained in teaching, and those who started teaching but left. Data: An alumni survey done by three public universities in Indiana for graduates between 1967 and 1978.
Findings: Personal characteristics and current income were not significant in discriminating between stayers and leavers, for both elementary and high school teachers. Those who left elementary teaching rated themselves more highly than continuing elementary teachers in their abilities at analyzing/evaluating, working on long-term projects, and persuading others to accept their ideas. High school teachers
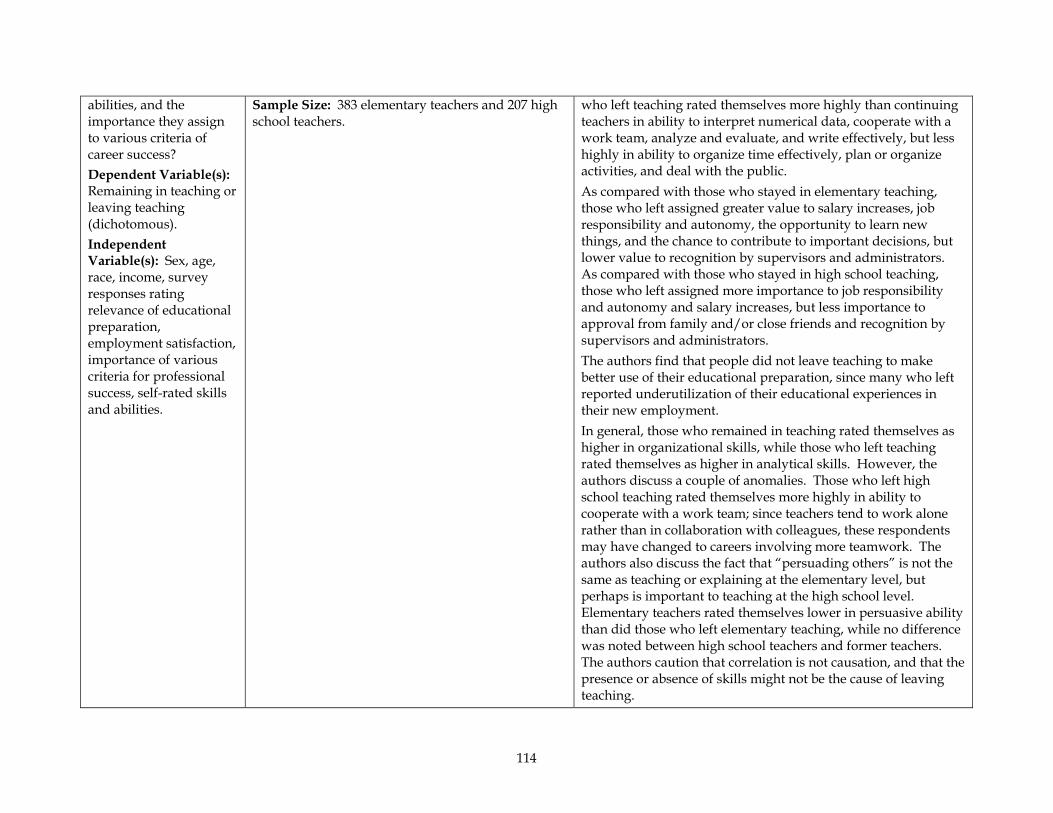
114
abilities, and the importance they assign to various criteria of career success? Dependent Variable(s): Remaining in teaching or leaving teaching (dichotomous). Independent Variable(s): Sex, age, race, income, survey responses rating relevance of educational preparation, employment satisfaction, importance of various criteria for professional success, self-rated skills and abilities.
Sample Size: 383 elementary teachers and 207 high school teachers.
who left teaching rated themselves more highly than continuing teachers in ability to interpret numerical data, cooperate with a work team, analyze and evaluate, and write effectively, but less highly in ability to organize time effectively, plan or organize activities, and deal with the public. As compared with those who stayed in elementary teaching, those who left assigned greater value to salary increases, job responsibility and autonomy, the opportunity to learn new things, and the chance to contribute to important decisions, but lower value to recognition by supervisors and administrators. As compared with those who stayed in high school teaching, those who left assigned more importance to job responsibility and autonomy and salary increases, but less importance to approval from family and/or close friends and recognition by supervisors and administrators. The authors find that people did not leave teaching to make better use of their educational preparation, since many who left reported underutilization of their educational experiences in their new employment. In general, those who remained in teaching rated themselves as higher in organizational skills, while those who left teaching rated themselves as higher in analytical skills. However, the authors discuss a couple of anomalies. Those who left high school teaching rated themselves more highly in ability to cooperate with a work team; since teachers tend to work alone rather than in collaboration with colleagues, these respondents may have changed to careers involving more teamwork. The authors also discuss the fact that “persuading others” is not the same as teaching or explaining at the elementary level, but perhaps is important to teaching at the high school level. Elementary teachers rated themselves lower in persuasive ability than did those who left elementary teaching, while no difference was noted between high school teachers and former teachers. The authors caution that correlation is not causation, and that the presence or absence of skills might not be the cause of leaving teaching.
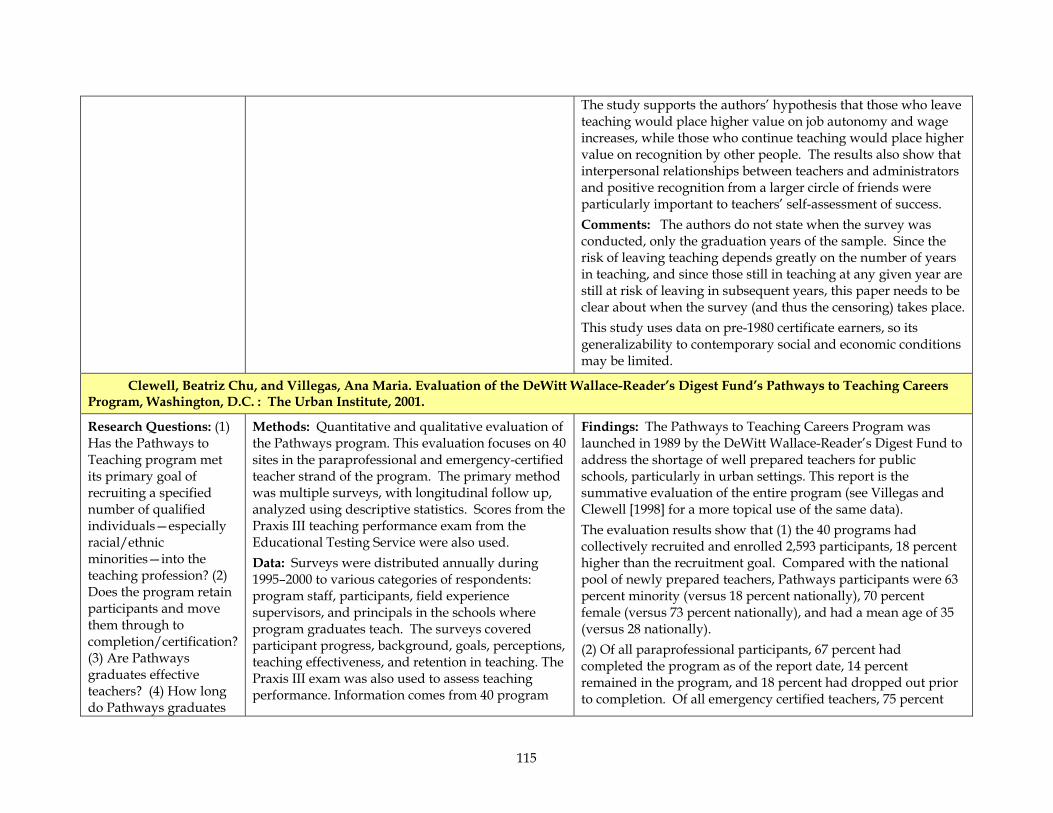
115
The study supports the authors’ hypothesis that those who leave teaching would place higher value on job autonomy and wage increases, while those who continue teaching would place higher value on recognition by other people. The results also show that interpersonal relationships between teachers and administrators and positive recognition from a larger circle of friends were particularly important to teachers’ self-assessment of success. Comments: The authors do not state when the survey was conducted, only the graduation years of the sample. Since the risk of leaving teaching depends greatly on the number of years in teaching, and since those still in teaching at any given year are still at risk of leaving in subsequent years, this paper needs to be clear about when the survey (and thus the censoring) takes place. This study uses data on pre-1980 certificate earners, so its generalizability to contemporary social and economic conditions may be limited.
Clewell, Beatriz Chu, and Villegas, Ana Maria. Evaluation of the DeWitt Wallace-Reader’s Digest Fund’s Pathways to Teaching Careers Program, Washington, D.C. : The Urban Institute, 2001.
Research Questions: (1) Has the Pathways to Teaching program met its primary goal of recruiting a specified number of qualified individuals—especially racial/ethnic minorities—into the teaching profession? (2) Does the program retain participants and move them through to completion/certification? (3) Are Pathways graduates effective teachers? (4) How long do Pathways graduates
Methods: Quantitative and qualitative evaluation of the Pathways program. This evaluation focuses on 40 sites in the paraprofessional and emergency-certified teacher strand of the program. The primary method was multiple surveys, with longitudinal follow up, analyzed using descriptive statistics. Scores from the Praxis III teaching performance exam from the Educational Testing Service were also used. Data: Surveys were distributed annually during 1995–2000 to various categories of respondents: program staff, participants, field experience supervisors, and principals in the schools where program graduates teach. The surveys covered participant progress, background, goals, perceptions, teaching effectiveness, and retention in teaching. The Praxis III exam was also used to assess teaching performance. Information comes from 40 program
Findings: The Pathways to Teaching Careers Program was launched in 1989 by the DeWitt Wallace-Reader’s Digest Fund to address the shortage of well prepared teachers for public schools, particularly in urban settings. This report is the summative evaluation of the entire program (see Villegas and Clewell [1998] for a more topical use of the same data). The evaluation results show that (1) the 40 programs had collectively recruited and enrolled 2,593 participants, 18 percent higher than the recruitment goal. Compared with the national pool of newly prepared teachers, Pathways participants were 63 percent minority (versus 18 percent nationally), 70 percent female (versus 73 percent nationally), and had a mean age of 35 (versus 28 nationally). (2) Of all paraprofessional participants, 67 percent had completed the program as of the report date, 14 percent remained in the program, and 18 percent had dropped out prior to completion. Of all emergency certified teachers, 75 percent
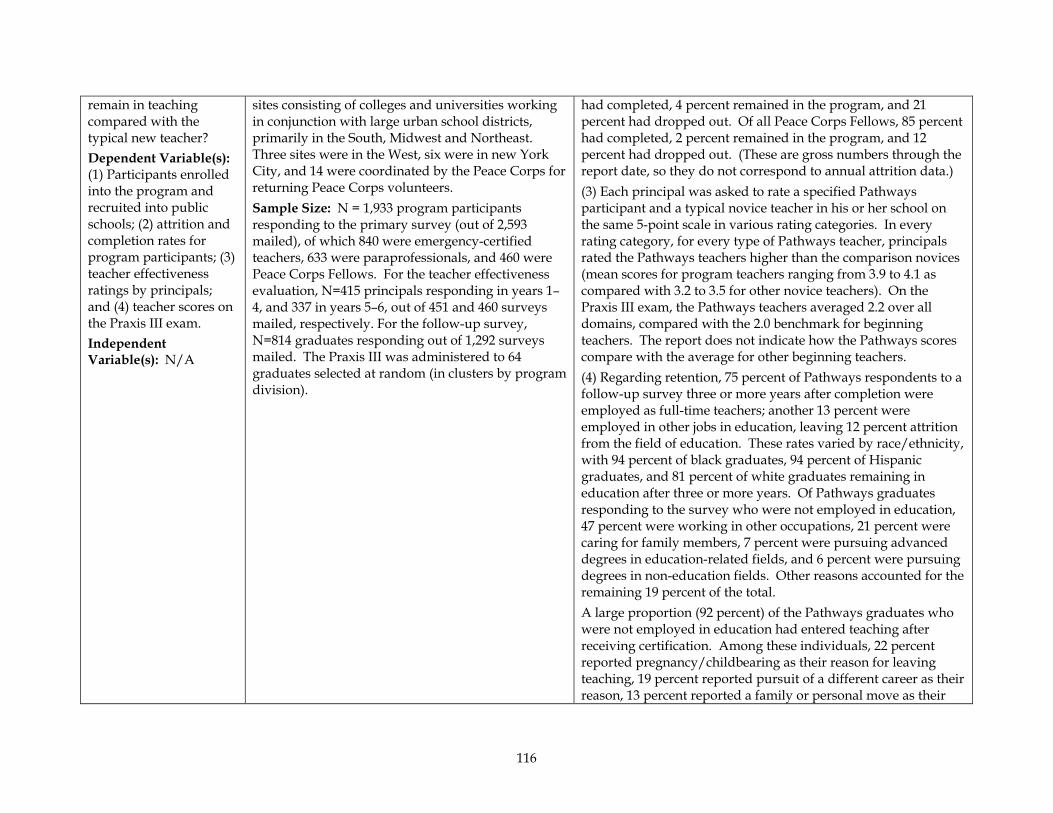
116
remain in teaching compared with the typical new teacher? Dependent Variable(s): (1) Participants enrolled into the program and recruited into public schools; (2) attrition and completion rates for program participants; (3) teacher effectiveness ratings by principals; and (4) teacher scores on the Praxis III exam. Independent Variable(s): N/A
sites consisting of colleges and universities working in conjunction with large urban school districts, primarily in the South, Midwest and Northeast. Three sites were in the West, six were in new York City, and 14 were coordinated by the Peace Corps for returning Peace Corps volunteers. Sample Size: N = 1,933 program participants responding to the primary survey (out of 2,593 mailed), of which 840 were emergency-certified teachers, 633 were paraprofessionals, and 460 were Peace Corps Fellows. For the teacher effectiveness evaluation, N=415 principals responding in years 1–4, and 337 in years 5–6, out of 451 and 460 surveys mailed, respectively. For the follow-up survey, N=814 graduates responding out of 1,292 surveys mailed. The Praxis III was administered to 64 graduates selected at random (in clusters by program division).
had completed, 4 percent remained in the program, and 21 percent had dropped out. Of all Peace Corps Fellows, 85 percent had completed, 2 percent remained in the program, and 12 percent had dropped out. (These are gross numbers through the report date, so they do not correspond to annual attrition data.) (3) Each principal was asked to rate a specified Pathways participant and a typical novice teacher in his or her school on the same 5-point scale in various rating categories. In every rating category, for every type of Pathways teacher, principals rated the Pathways teachers higher than the comparison novices (mean scores for program teachers ranging from 3.9 to 4.1 as compared with 3.2 to 3.5 for other novice teachers). On the Praxis III exam, the Pathways teachers averaged 2.2 over all domains, compared with the 2.0 benchmark for beginning teachers. The report does not indicate how the Pathways scores compare with the average for other beginning teachers. (4) Regarding retention, 75 percent of Pathways respondents to a follow-up survey three or more years after completion were employed as full-time teachers; another 13 percent were employed in other jobs in education, leaving 12 percent attrition from the field of education. These rates varied by race/ethnicity, with 94 percent of black graduates, 94 percent of Hispanic graduates, and 81 percent of white graduates remaining in education after three or more years. Of Pathways graduates responding to the survey who were not employed in education, 47 percent were working in other occupations, 21 percent were caring for family members, 7 percent were pursuing advanced degrees in education-related fields, and 6 percent were pursuing degrees in non-education fields. Other reasons accounted for the remaining 19 percent of the total. A large proportion (92 percent) of the Pathways graduates who were not employed in education had entered teaching after receiving certification. Among these individuals, 22 percent reported pregnancy/childbearing as their reason for leaving teaching, 19 percent reported pursuit of a different career as their reason, 13 percent reported a family or personal move as their
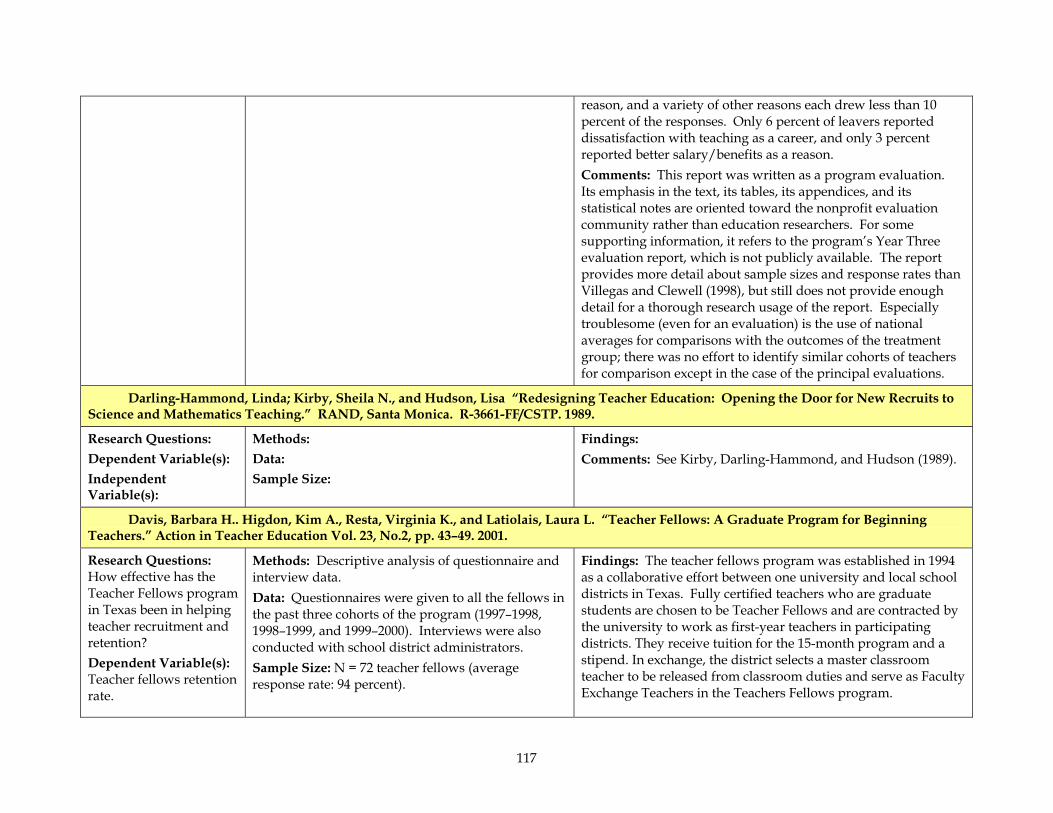
117
reason, and a variety of other reasons each drew less than 10 percent of the responses. Only 6 percent of leavers reported dissatisfaction with teaching as a career, and only 3 percent reported better salary/benefits as a reason. Comments: This report was written as a program evaluation. Its emphasis in the text, its tables, its appendices, and its statistical notes are oriented toward the nonprofit evaluation community rather than education researchers. For some supporting information, it refers to the program’s Year Three evaluation report, which is not publicly available. The report provides more detail about sample sizes and response rates than Villegas and Clewell (1998), but still does not provide enough detail for a thorough research usage of the report. Especially troublesome (even for an evaluation) is the use of national averages for comparisons with the outcomes of the treatment group; there was no effort to identify similar cohorts of teachers for comparison except in the case of the principal evaluations.
Darling-Hammond, Linda; Kirby, Sheila N., and Hudson, Lisa “Redesigning Teacher Education: Opening the Door for New Recruits to Science and Mathematics Teaching.” RAND, Santa Monica. R-3661-FF/CSTP. 1989.
Research Questions: Dependent Variable(s): Independent Variable(s):
Methods: Data: Sample Size:
Findings: Comments: See Kirby, Darling-Hammond, and Hudson (1989).
Davis, Barbara H.. Higdon, Kim A., Resta, Virginia K., and Latiolais, Laura L. “Teacher Fellows: A Graduate Program for Beginning Teachers.” Action in Teacher Education Vol. 23, No.2, pp. 43–49. 2001.
Research Questions: How effective has the Teacher Fellows program in Texas been in helping teacher recruitment and retention? Dependent Variable(s): Teacher fellows retention rate.
Methods: Descriptive analysis of questionnaire and interview data. Data: Questionnaires were given to all the fellows in the past three cohorts of the program (1997–1998, 1998–1999, and 1999–2000). Interviews were also conducted with school district administrators. Sample Size: N = 72 teacher fellows (average response rate: 94 percent).
Findings: The teacher fellows program was established in 1994 as a collaborative effort between one university and local school districts in Texas. Fully certified teachers who are graduate students are chosen to be Teacher Fellows and are contracted by the university to work as first-year teachers in participating districts. They receive tuition for the 15-month program and a stipend. In exchange, the district selects a master classroom teacher to be released from classroom duties and serve as Faculty Exchange Teachers in the Teachers Fellows program.
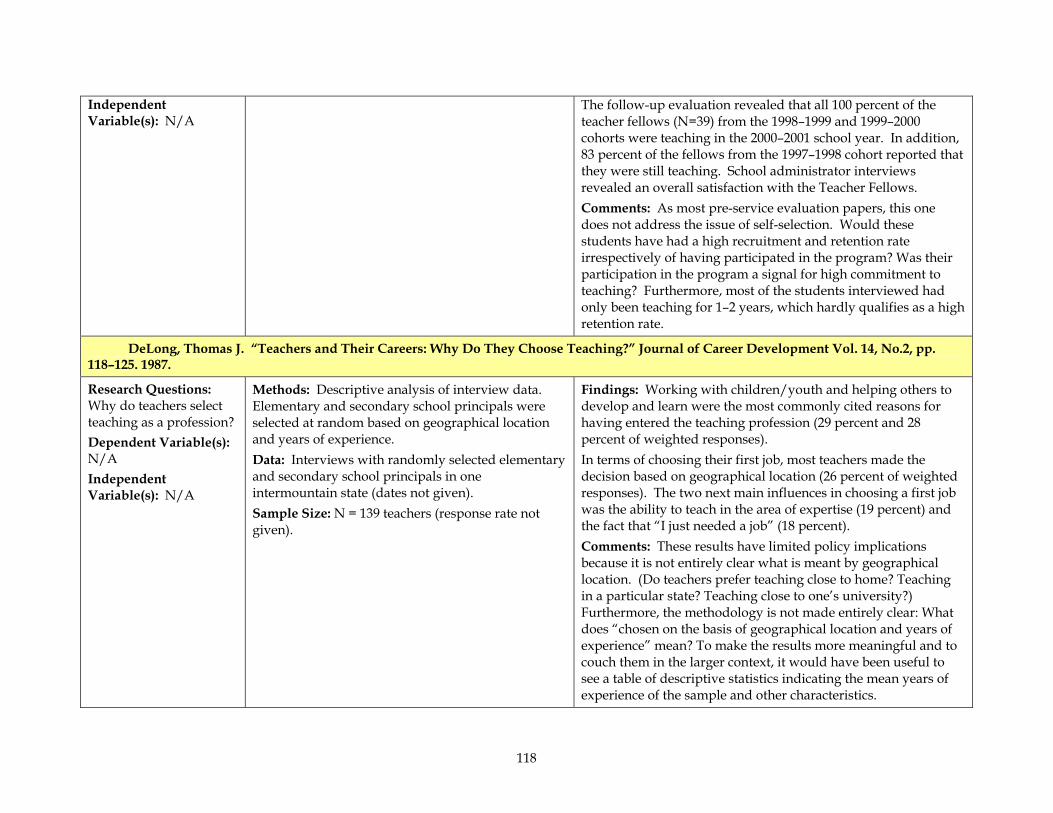
118
Independent Variable(s): N/A
The follow-up evaluation revealed that all 100 percent of the teacher fellows (N=39) from the 1998–1999 and 1999–2000 cohorts were teaching in the 2000–2001 school year. In addition, 83 percent of the fellows from the 1997–1998 cohort reported that they were still teaching. School administrator interviews revealed an overall satisfaction with the Teacher Fellows. Comments: As most pre-service evaluation papers, this one does not address the issue of self-selection. Would these students have had a high recruitment and retention rate irrespectively of having participated in the program? Was their participation in the program a signal for high commitment to teaching? Furthermore, most of the students interviewed had only been teaching for 1–2 years, which hardly qualifies as a high retention rate.
DeLong, Thomas J. “Teachers and Their Careers: Why Do They Choose Teaching?” Journal of Career Development Vol. 14, No.2, pp. 118–125. 1987.
Research Questions: Why do teachers select teaching as a profession? Dependent Variable(s): N/A Independent Variable(s): N/A
Methods: Descriptive analysis of interview data. Elementary and secondary school principals were selected at random based on geographical location and years of experience. Data: Interviews with randomly selected elementary and secondary school principals in one intermountain state (dates not given). Sample Size: N = 139 teachers (response rate not given).
Findings: Working with children/youth and helping others to develop and learn were the most commonly cited reasons for having entered the teaching profession (29 percent and 28 percent of weighted responses). In terms of choosing their first job, most teachers made the decision based on geographical location (26 percent of weighted responses). The two next main influences in choosing a first job was the ability to teach in the area of expertise (19 percent) and the fact that “I just needed a job” (18 percent). Comments: These results have limited policy implications because it is not entirely clear what is meant by geographical location. (Do teachers prefer teaching close to home? Teaching in a particular state? Teaching close to one’s university?) Furthermore, the methodology is not made entirely clear: What does “chosen on the basis of geographical location and years of experience” mean? To make the results more meaningful and to couch them in the larger context, it would have been useful to see a table of descriptive statistics indicating the mean years of experience of the sample and other characteristics.
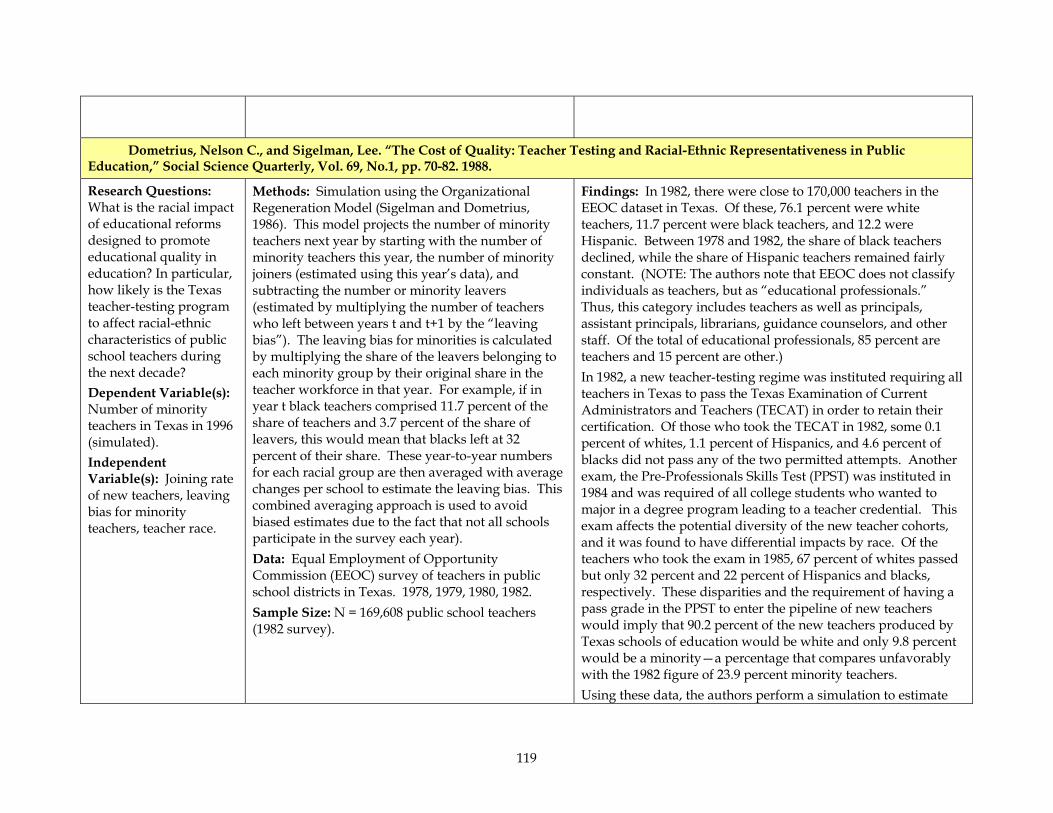
119
Dometrius, Nelson C., and Sigelman, Lee. “The Cost of Quality: Teacher Testing and Racial-Ethnic Representativeness in Public Education,” Social Science Quarterly, Vol. 69, No.1, pp. 70-82. 1988.
Research Questions: What is the racial impact of educational reforms designed to promote educational quality in education? In particular, how likely is the Texas teacher-testing program to affect racial-ethnic characteristics of public school teachers during the next decade? Dependent Variable(s): Number of minority teachers in Texas in 1996 (simulated). Independent Variable(s): Joining rate of new teachers, leaving bias for minority teachers, teacher race.
Methods: Simulation using the Organizational Regeneration Model (Sigelman and Dometrius, 1986). This model projects the number of minority teachers next year by starting with the number of minority teachers this year, the number of minority joiners (estimated using this year’s data), and subtracting the number or minority leavers (estimated by multiplying the number of teachers who left between years t and t+1 by the “leaving bias”). The leaving bias for minorities is calculated by multiplying the share of the leavers belonging to each minority group by their original share in the teacher workforce in that year. For example, if in year t black teachers comprised 11.7 percent of the share of teachers and 3.7 percent of the share of leavers, this would mean that blacks left at 32 percent of their share. These year-to-year numbers for each racial group are then averaged with average changes per school to estimate the leaving bias. This combined averaging approach is used to avoid biased estimates due to the fact that not all schools participate in the survey each year). Data: Equal Employment of Opportunity Commission (EEOC) survey of teachers in public school districts in Texas. 1978, 1979, 1980, 1982. Sample Size: N = 169,608 public school teachers (1982 survey).
Findings: In 1982, there were close to 170,000 teachers in the EEOC dataset in Texas. Of these, 76.1 percent were white teachers, 11.7 percent were black teachers, and 12.2 were Hispanic. Between 1978 and 1982, the share of black teachers declined, while the share of Hispanic teachers remained fairly constant. (NOTE: The authors note that EEOC does not classify individuals as teachers, but as “educational professionals.” Thus, this category includes teachers as well as principals, assistant principals, librarians, guidance counselors, and other staff. Of the total of educational professionals, 85 percent are teachers and 15 percent are other.) In 1982, a new teacher-testing regime was instituted requiring all teachers in Texas to pass the Texas Examination of Current Administrators and Teachers (TECAT) in order to retain their certification. Of those who took the TECAT in 1982, some 0.1 percent of whites, 1.1 percent of Hispanics, and 4.6 percent of blacks did not pass any of the two permitted attempts. Another exam, the Pre-Professionals Skills Test (PPST) was instituted in 1984 and was required of all college students who wanted to major in a degree program leading to a teacher credential. This exam affects the potential diversity of the new teacher cohorts, and it was found to have differential impacts by race. Of the teachers who took the exam in 1985, 67 percent of whites passed but only 32 percent and 22 percent of Hispanics and blacks, respectively. These disparities and the requirement of having a pass grade in the PPST to enter the pipeline of new teachers would imply that 90.2 percent of the new teachers produced by Texas schools of education would be white and only 9.8 percent would be a minority—a percentage that compares unfavorably with the 1982 figure of 23.9 percent minority teachers. Using these data, the authors perform a simulation to estimate
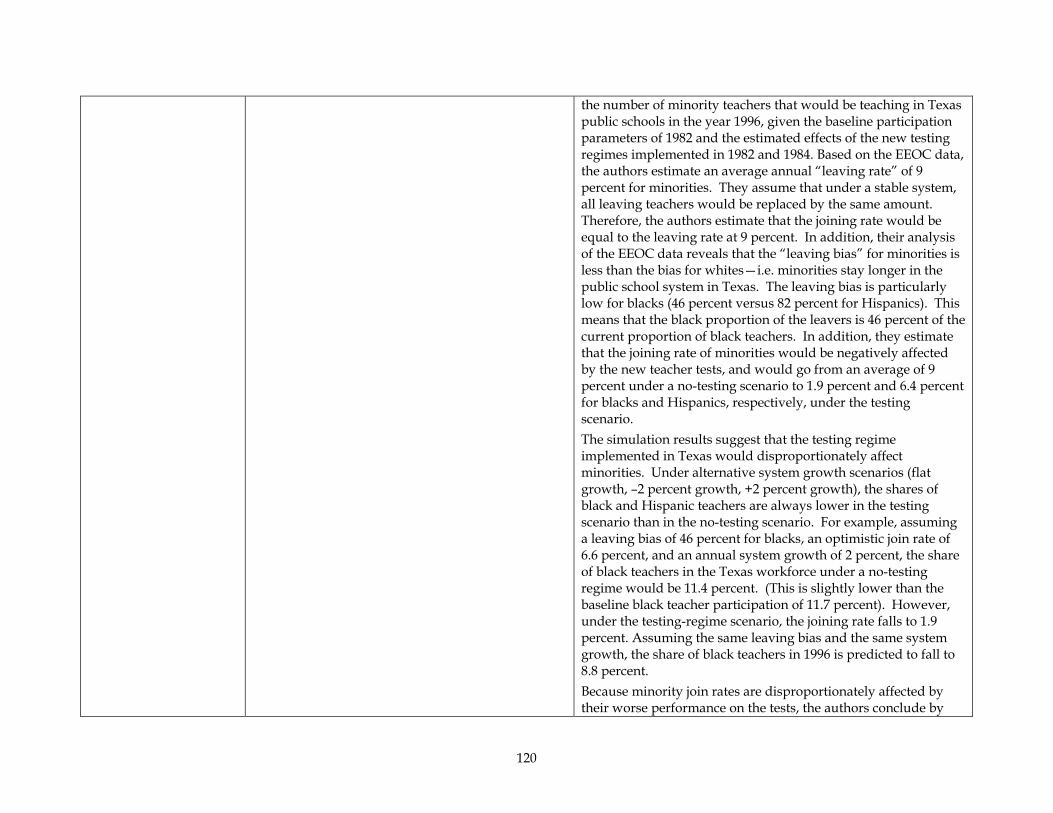
120
the number of minority teachers that would be teaching in Texas public schools in the year 1996, given the baseline participation parameters of 1982 and the estimated effects of the new testing regimes implemented in 1982 and 1984. Based on the EEOC data, the authors estimate an average annual “leaving rate” of 9 percent for minorities. They assume that under a stable system, all leaving teachers would be replaced by the same amount. Therefore, the authors estimate that the joining rate would be equal to the leaving rate at 9 percent. In addition, their analysis of the EEOC data reveals that the “leaving bias” for minorities is less than the bias for whites—i.e. minorities stay longer in the public school system in Texas. The leaving bias is particularly low for blacks (46 percent versus 82 percent for Hispanics). This means that the black proportion of the leavers is 46 percent of the current proportion of black teachers. In addition, they estimate that the joining rate of minorities would be negatively affected by the new teacher tests, and would go from an average of 9 percent under a no-testing scenario to 1.9 percent and 6.4 percent for blacks and Hispanics, respectively, under the testing scenario. The simulation results suggest that the testing regime implemented in Texas would disproportionately affect minorities. Under alternative system growth scenarios (flat growth, –2 percent growth, +2 percent growth), the shares of black and Hispanic teachers are always lower in the testing scenario than in the no-testing scenario. For example, assuming a leaving bias of 46 percent for blacks, an optimistic join rate of 6.6 percent, and an annual system growth of 2 percent, the share of black teachers in the Texas workforce under a no-testing regime would be 11.4 percent. (This is slightly lower than the baseline black teacher participation of 11.7 percent). However, under the testing-regime scenario, the joining rate falls to 1.9 percent. Assuming the same leaving bias and the same system growth, the share of black teachers in 1996 is predicted to fall to 8.8 percent. Because minority join rates are disproportionately affected by their worse performance on the tests, the authors conclude by
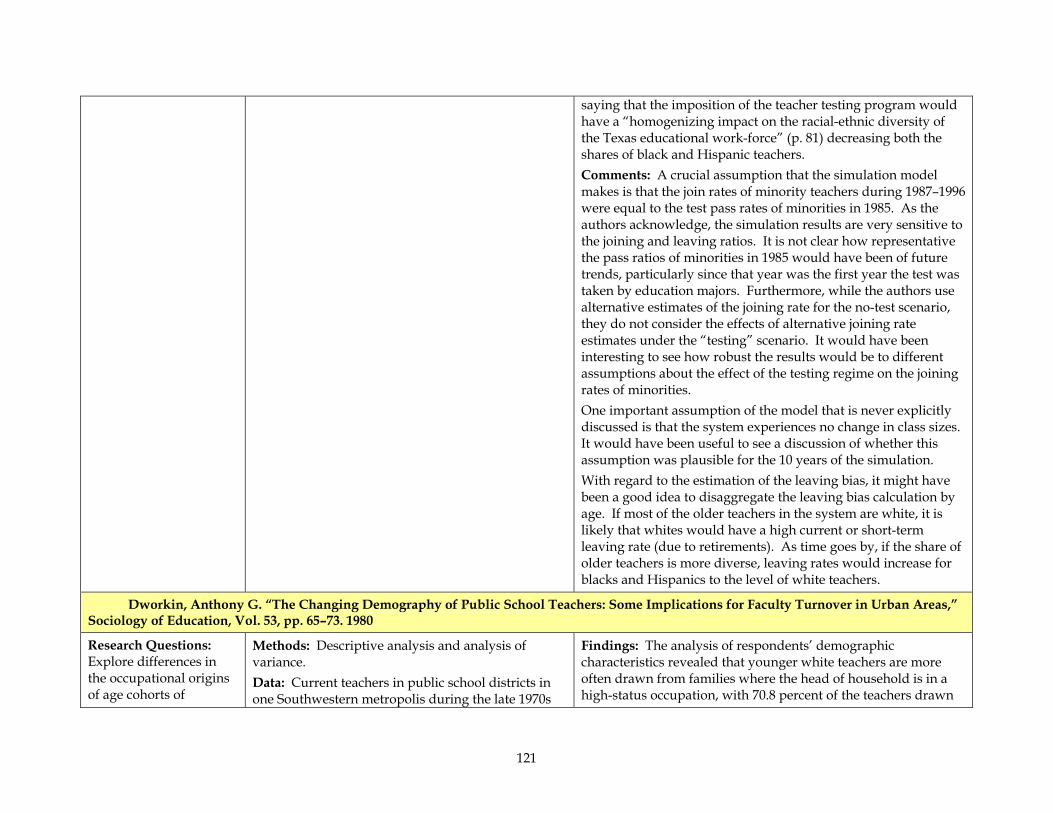
121
saying that the imposition of the teacher testing program would have a “homogenizing impact on the racial-ethnic diversity of the Texas educational work-force” (p. 81) decreasing both the shares of black and Hispanic teachers. Comments: A crucial assumption that the simulation model makes is that the join rates of minority teachers during 1987–1996 were equal to the test pass rates of minorities in 1985. As the authors acknowledge, the simulation results are very sensitive to the joining and leaving ratios. It is not clear how representative the pass ratios of minorities in 1985 would have been of future trends, particularly since that year was the first year the test was taken by education majors. Furthermore, while the authors use alternative estimates of the joining rate for the no-test scenario, they do not consider the effects of alternative joining rate estimates under the “testing” scenario. It would have been interesting to see how robust the results would be to different assumptions about the effect of the testing regime on the joining rates of minorities. One important assumption of the model that is never explicitly discussed is that the system experiences no change in class sizes. It would have been useful to see a discussion of whether this assumption was plausible for the 10 years of the simulation. With regard to the estimation of the leaving bias, it might have been a good idea to disaggregate the leaving bias calculation by age. If most of the older teachers in the system are white, it is likely that whites would have a high current or short-term leaving rate (due to retirements). As time goes by, if the share of older teachers is more diverse, leaving rates would increase for blacks and Hispanics to the level of white teachers.
Dworkin, Anthony G. “The Changing Demography of Public School Teachers: Some Implications for Faculty Turnover in Urban Areas,” Sociology of Education, Vol. 53, pp. 65–73. 1980
Research Questions: Explore differences in the occupational origins of age cohorts of
Methods: Descriptive analysis and analysis of variance. Data: Current teachers in public school districts in one Southwestern metropolis during the late 1970s
Findings: The analysis of respondents’ demographic characteristics revealed that younger white teachers are more often drawn from families where the head of household is in a high-status occupation, with 70.8 percent of the teachers drawn
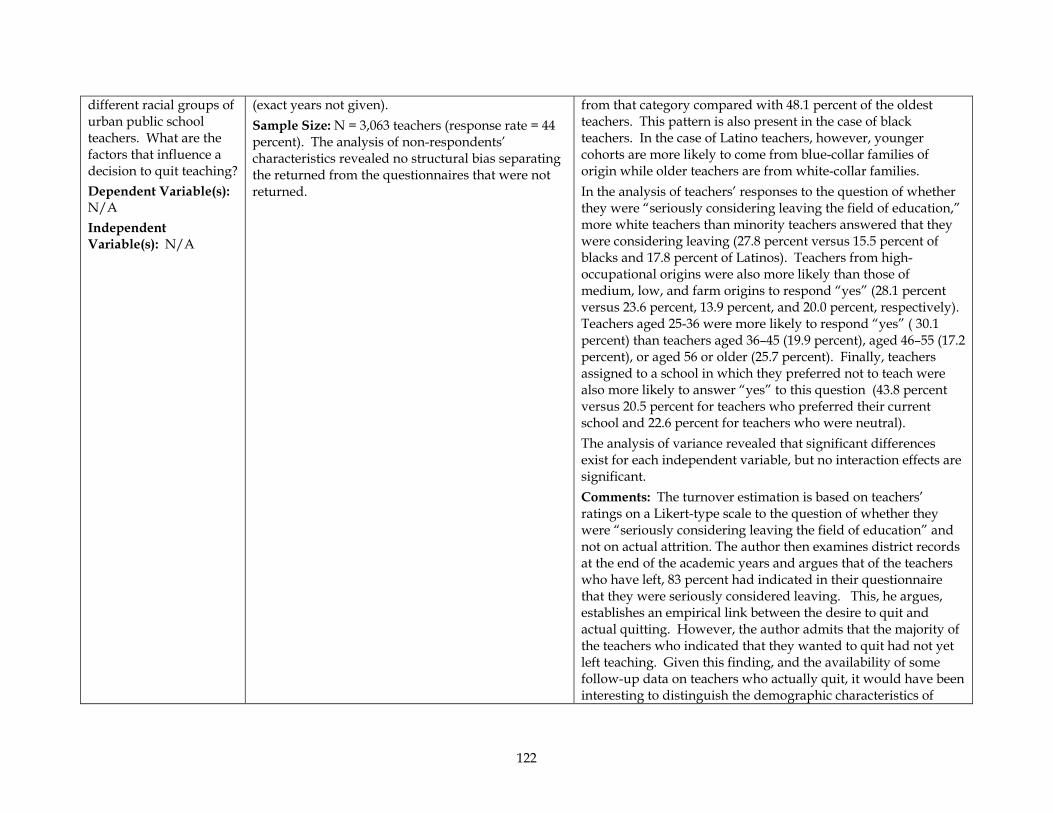
122
different racial groups of urban public school teachers. What are the factors that influence a decision to quit teaching? Dependent Variable(s): N/A Independent Variable(s): N/A
(exact years not given). Sample Size: N = 3,063 teachers (response rate = 44 percent). The analysis of non-respondents’ characteristics revealed no structural bias separating the returned from the questionnaires that were not returned.
from that category compared with 48.1 percent of the oldest teachers. This pattern is also present in the case of black teachers. In the case of Latino teachers, however, younger cohorts are more likely to come from blue-collar families of origin while older teachers are from white-collar families. In the analysis of teachers’ responses to the question of whether they were “seriously considering leaving the field of education,” more white teachers than minority teachers answered that they were considering leaving (27.8 percent versus 15.5 percent of blacks and 17.8 percent of Latinos). Teachers from high-occupational origins were also more likely than those of medium, low, and farm origins to respond “yes” (28.1 percent versus 23.6 percent, 13.9 percent, and 20.0 percent, respectively). Teachers aged 25-36 were more likely to respond “yes” ( 30.1 percent) than teachers aged 36–45 (19.9 percent), aged 46–55 (17.2 percent), or aged 56 or older (25.7 percent). Finally, teachers assigned to a school in which they preferred not to teach were also more likely to answer “yes” to this question (43.8 percent versus 20.5 percent for teachers who preferred their current school and 22.6 percent for teachers who were neutral). The analysis of variance revealed that significant differences exist for each independent variable, but no interaction effects are significant. Comments: The turnover estimation is based on teachers’ ratings on a Likert-type scale to the question of whether they were “seriously considering leaving the field of education” and not on actual attrition. The author then examines district records at the end of the academic years and argues that of the teachers who have left, 83 percent had indicated in their questionnaire that they were seriously considered leaving. This, he argues, establishes an empirical link between the desire to quit and actual quitting. However, the author admits that the majority of the teachers who indicated that they wanted to quit had not yet left teaching. Given this finding, and the availability of some follow-up data on teachers who actually quit, it would have been interesting to distinguish the demographic characteristics of
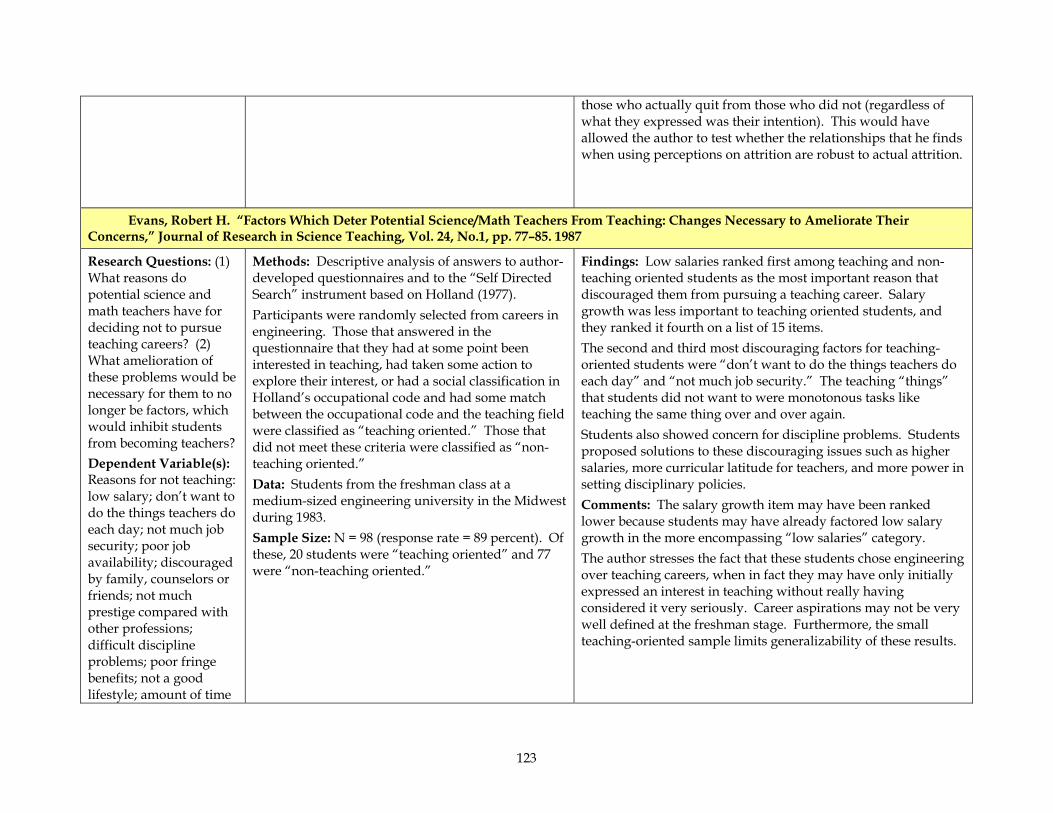
123
those who actually quit from those who did not (regardless of what they expressed was their intention). This would have allowed the author to test whether the relationships that he finds when using perceptions on attrition are robust to actual attrition.
Evans, Robert H. “Factors Which Deter Potential Science/Math Teachers From Teaching: Changes Necessary to Ameliorate Their Concerns,” Journal of Research in Science Teaching, Vol. 24, No.1, pp. 77–85. 1987
Research Questions: (1) What reasons do potential science and math teachers have for deciding not to pursue teaching careers? (2) What amelioration of these problems would be necessary for them to no longer be factors, which would inhibit students from becoming teachers? Dependent Variable(s): Reasons for not teaching: low salary; don’t want to do the things teachers do each day; not much job security; poor job availability; discouraged by family, counselors or friends; not much prestige compared with other professions; difficult discipline problems; poor fringe benefits; not a good lifestyle; amount of time
Methods: Descriptive analysis of answers to author-developed questionnaires and to the “Self Directed Search” instrument based on Holland (1977). Participants were randomly selected from careers in engineering. Those that answered in the questionnaire that they had at some point been interested in teaching, had taken some action to explore their interest, or had a social classification in Holland’s occupational code and had some match between the occupational code and the teaching field were classified as “teaching oriented.” Those that did not meet these criteria were classified as “non-teaching oriented.” Data: Students from the freshman class at a medium-sized engineering university in the Midwest during 1983. Sample Size: N = 98 (response rate = 89 percent). Of these, 20 students were “teaching oriented” and 77 were “non-teaching oriented.”
Findings: Low salaries ranked first among teaching and non-teaching oriented students as the most important reason that discouraged them from pursuing a teaching career. Salary growth was less important to teaching oriented students, and they ranked it fourth on a list of 15 items. The second and third most discouraging factors for teaching-oriented students were “don’t want to do the things teachers do each day” and “not much job security.” The teaching “things” that students did not want to were monotonous tasks like teaching the same thing over and over again. Students also showed concern for discipline problems. Students proposed solutions to these discouraging issues such as higher salaries, more curricular latitude for teachers, and more power in setting disciplinary policies. Comments: The salary growth item may have been ranked lower because students may have already factored low salary growth in the more encompassing “low salaries” category. The author stresses the fact that these students chose engineering over teaching careers, when in fact they may have only initially expressed an interest in teaching without really having considered it very seriously. Career aspirations may not be very well defined at the freshman stage. Furthermore, the small teaching-oriented sample limits generalizability of these results.
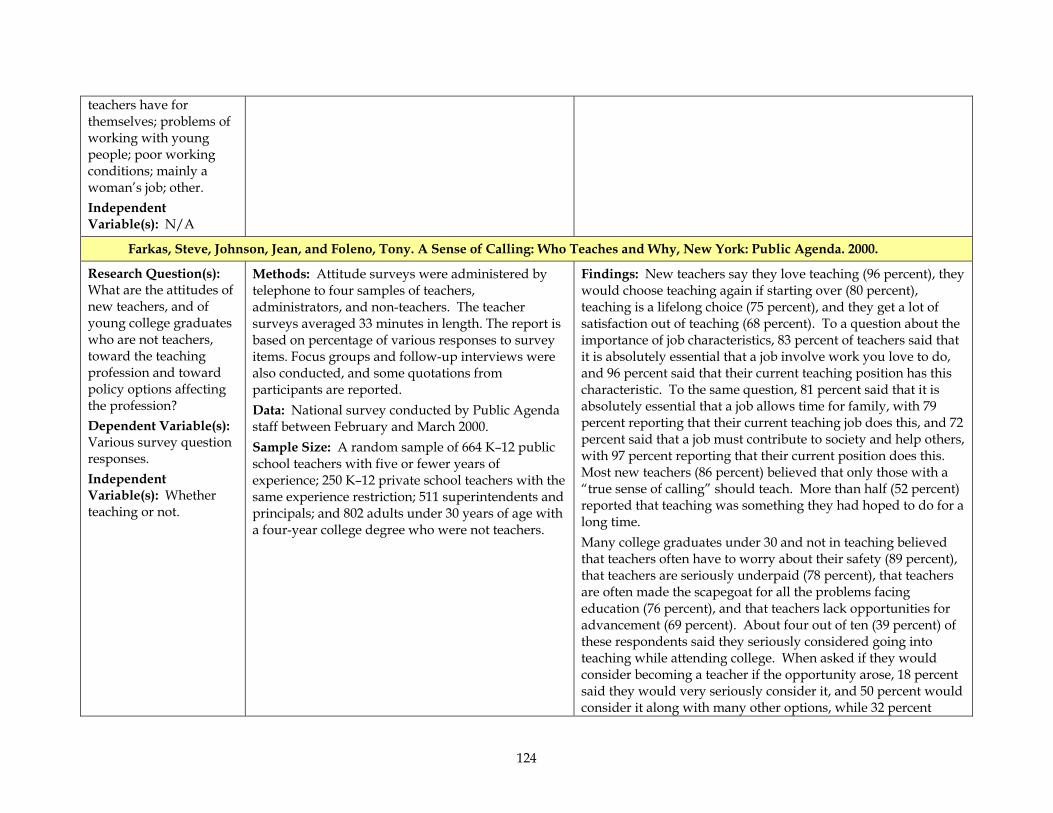
124
teachers have for themselves; problems of working with young people; poor working conditions; mainly a woman’s job; other. Independent Variable(s): N/A
Farkas, Steve, Johnson, Jean, and Foleno, Tony. A Sense of Calling: Who Teaches and Why, New York: Public Agenda. 2000.
Research Question(s): What are the attitudes of new teachers, and of young college graduates who are not teachers, toward the teaching profession and toward policy options affecting the profession? Dependent Variable(s): Various survey question responses. Independent Variable(s): Whether teaching or not.
Methods: Attitude surveys were administered by telephone to four samples of teachers, administrators, and non-teachers. The teacher surveys averaged 33 minutes in length. The report is based on percentage of various responses to survey items. Focus groups and follow-up interviews were also conducted, and some quotations from participants are reported. Data: National survey conducted by Public Agenda staff between February and March 2000. Sample Size: A random sample of 664 K–12 public school teachers with five or fewer years of experience; 250 K–12 private school teachers with the same experience restriction; 511 superintendents and principals; and 802 adults under 30 years of age with a four-year college degree who were not teachers.
Findings: New teachers say they love teaching (96 percent), they would choose teaching again if starting over (80 percent), teaching is a lifelong choice (75 percent), and they get a lot of satisfaction out of teaching (68 percent). To a question about the importance of job characteristics, 83 percent of teachers said that it is absolutely essential that a job involve work you love to do, and 96 percent said that their current teaching position has this characteristic. To the same question, 81 percent said that it is absolutely essential that a job allows time for family, with 79 percent reporting that their current teaching job does this, and 72 percent said that a job must contribute to society and help others, with 97 percent reporting that their current position does this. Most new teachers (86 percent) believed that only those with a “true sense of calling” should teach. More than half (52 percent) reported that teaching was something they had hoped to do for a long time. Many college graduates under 30 and not in teaching believed that teachers often have to worry about their safety (89 percent), that teachers are seriously underpaid (78 percent), that teachers are often made the scapegoat for all the problems facing education (76 percent), and that teachers lack opportunities for advancement (69 percent). About four out of ten (39 percent) of these respondents said they seriously considered going into teaching while attending college. When asked if they would consider becoming a teacher if the opportunity arose, 18 percent said they would very seriously consider it, and 50 percent would consider it along with many other options, while 32 percent
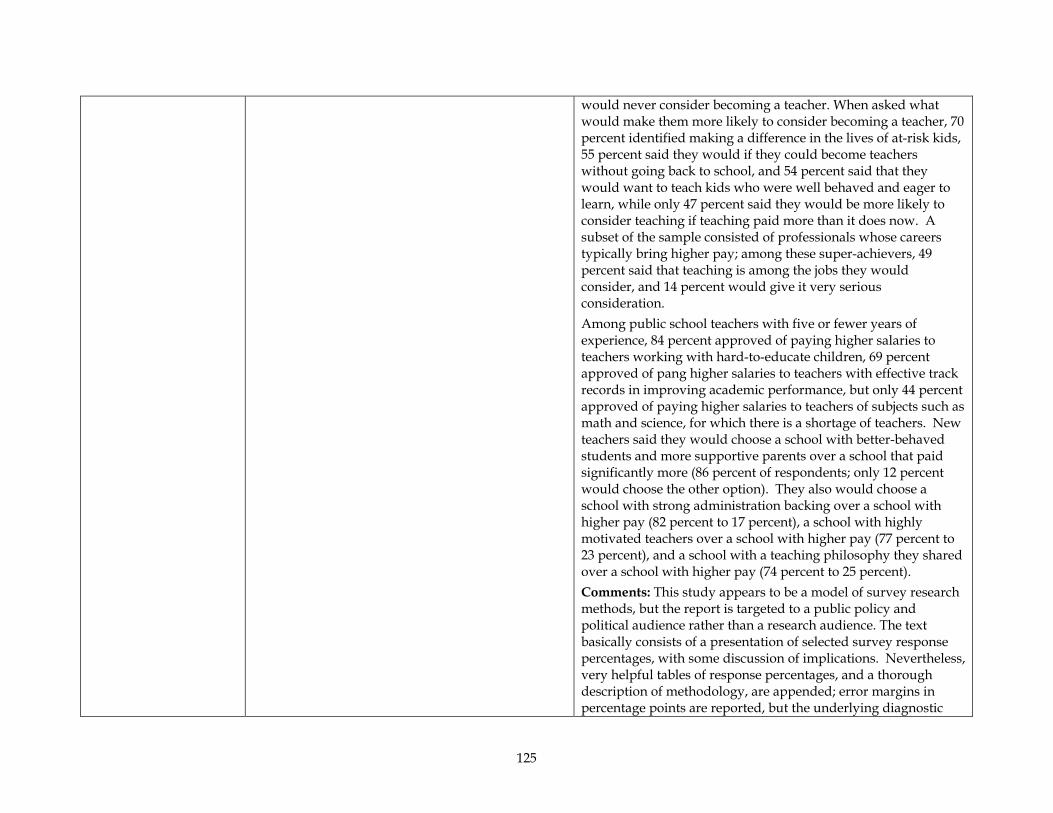
125
would never consider becoming a teacher. When asked what would make them more likely to consider becoming a teacher, 70 percent identified making a difference in the lives of at-risk kids, 55 percent said they would if they could become teachers without going back to school, and 54 percent said that they would want to teach kids who were well behaved and eager to learn, while only 47 percent said they would be more likely to consider teaching if teaching paid more than it does now. A subset of the sample consisted of professionals whose careers typically bring higher pay; among these super-achievers, 49 percent said that teaching is among the jobs they would consider, and 14 percent would give it very serious consideration. Among public school teachers with five or fewer years of experience, 84 percent approved of paying higher salaries to teachers working with hard-to-educate children, 69 percent approved of pang higher salaries to teachers with effective track records in improving academic performance, but only 44 percent approved of paying higher salaries to teachers of subjects such as math and science, for which there is a shortage of teachers. New teachers said they would choose a school with better-behaved students and more supportive parents over a school that paid significantly more (86 percent of respondents; only 12 percent would choose the other option). They also would choose a school with strong administration backing over a school with higher pay (82 percent to 17 percent), a school with highly motivated teachers over a school with higher pay (77 percent to 23 percent), and a school with a teaching philosophy they shared over a school with higher pay (74 percent to 25 percent). Comments: This study appears to be a model of survey research methods, but the report is targeted to a public policy and political audience rather than a research audience. The text basically consists of a presentation of selected survey response percentages, with some discussion of implications. Nevertheless, very helpful tables of response percentages, and a thorough description of methodology, are appended; error margins in percentage points are reported, but the underlying diagnostic
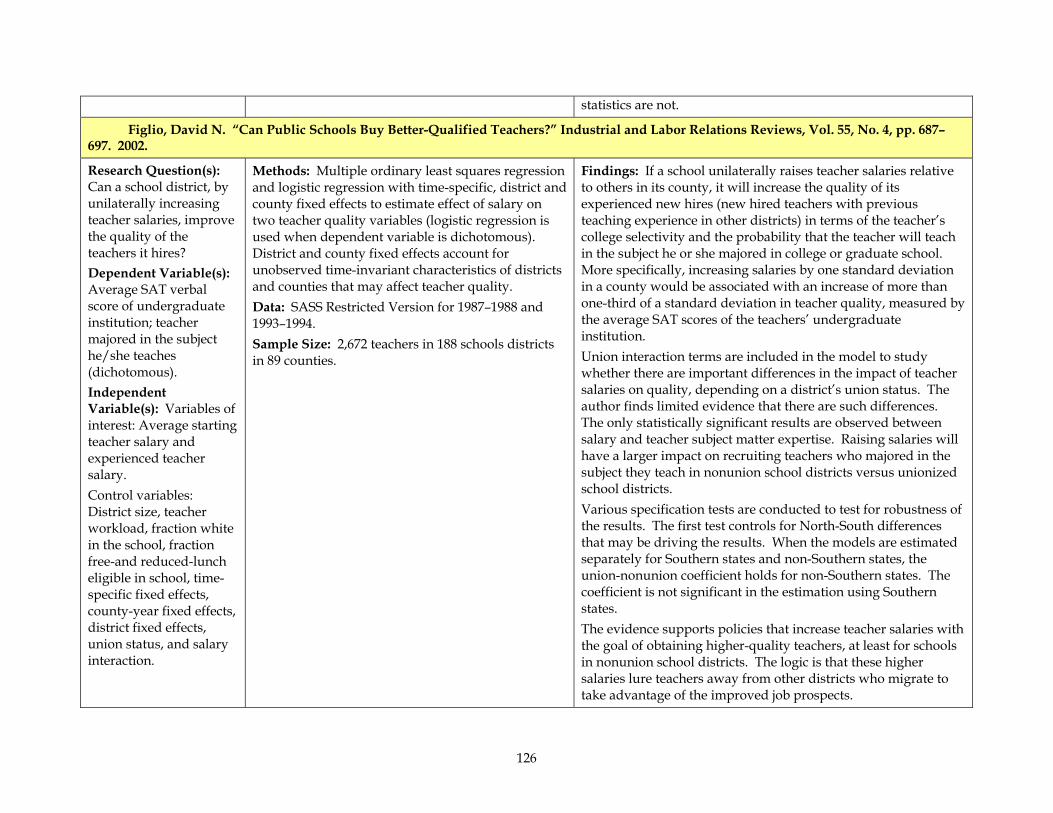
126
statistics are not.
Figlio, David N. “Can Public Schools Buy Better-Qualified Teachers?” Industrial and Labor Relations Reviews, Vol. 55, No. 4, pp. 687–697. 2002.
Research Question(s): Can a school district, by unilaterally increasing teacher salaries, improve the quality of the teachers it hires? Dependent Variable(s): Average SAT verbal score of undergraduate institution; teacher majored in the subject he/she teaches (dichotomous). Independent Variable(s): Variables of interest: Average starting teacher salary and experienced teacher salary. Control variables: District size, teacher workload, fraction white in the school, fraction free-and reduced-lunch eligible in school, time-specific fixed effects, county-year fixed effects, district fixed effects, union status, and salary interaction.
Methods: Multiple ordinary least squares regression and logistic regression with time-specific, district and county fixed effects to estimate effect of salary on two teacher quality variables (logistic regression is used when dependent variable is dichotomous). District and county fixed effects account for unobserved time-invariant characteristics of districts and counties that may affect teacher quality. Data: SASS Restricted Version for 1987–1988 and 1993–1994. Sample Size: 2,672 teachers in 188 schools districts in 89 counties.
Findings: If a school unilaterally raises teacher salaries relative to others in its county, it will increase the quality of its experienced new hires (new hired teachers with previous teaching experience in other districts) in terms of the teacher’s college selectivity and the probability that the teacher will teach in the subject he or she majored in college or graduate school. More specifically, increasing salaries by one standard deviation in a county would be associated with an increase of more than one-third of a standard deviation in teacher quality, measured by the average SAT scores of the teachers’ undergraduate institution. Union interaction terms are included in the model to study whether there are important differences in the impact of teacher salaries on quality, depending on a district’s union status. The author finds limited evidence that there are such differences. The only statistically significant results are observed between salary and teacher subject matter expertise. Raising salaries will have a larger impact on recruiting teachers who majored in the subject they teach in nonunion school districts versus unionized school districts. Various specification tests are conducted to test for robustness of the results. The first test controls for North-South differences that may be driving the results. When the models are estimated separately for Southern states and non-Southern states, the union-nonunion coefficient holds for non-Southern states. The coefficient is not significant in the estimation using Southern states. The evidence supports policies that increase teacher salaries with the goal of obtaining higher-quality teachers, at least for schools in nonunion school districts. The logic is that these higher salaries lure teachers away from other districts who migrate to take advantage of the improved job prospects.
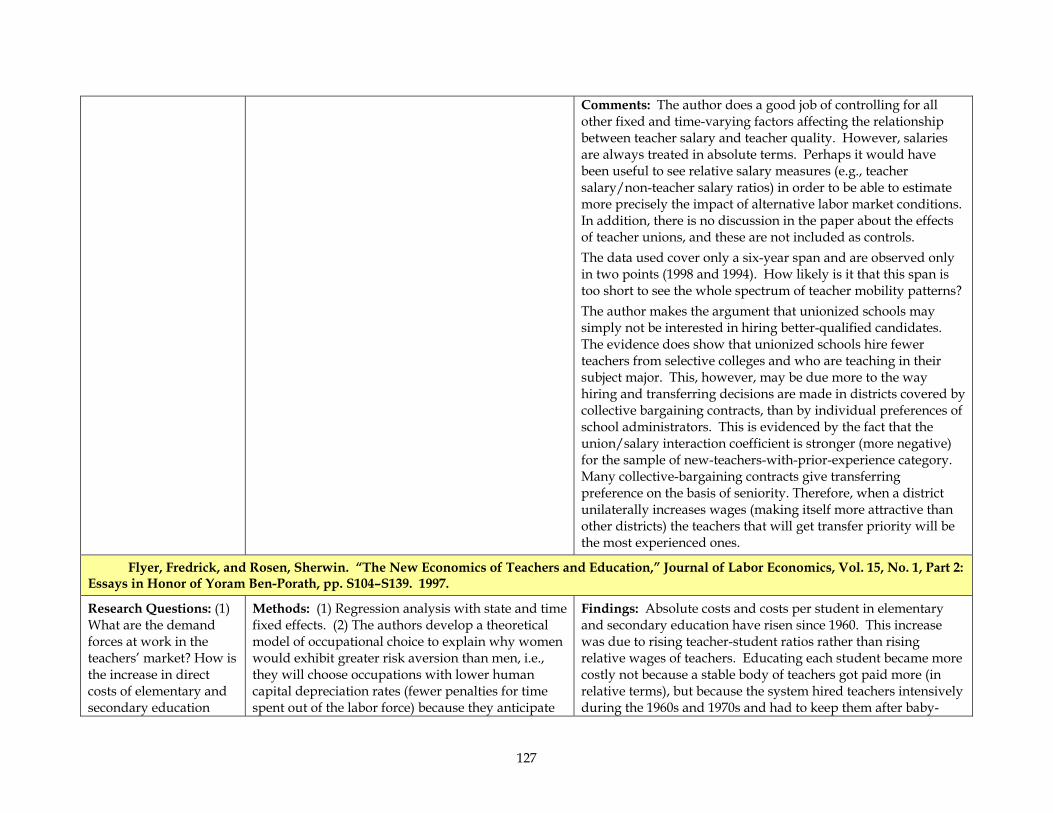
127
Comments: The author does a good job of controlling for all other fixed and time-varying factors affecting the relationship between teacher salary and teacher quality. However, salaries are always treated in absolute terms. Perhaps it would have been useful to see relative salary measures (e.g., teacher salary/non-teacher salary ratios) in order to be able to estimate more precisely the impact of alternative labor market conditions. In addition, there is no discussion in the paper about the effects of teacher unions, and these are not included as controls. The data used cover only a six-year span and are observed only in two points (1998 and 1994). How likely is it that this span is too short to see the whole spectrum of teacher mobility patterns? The author makes the argument that unionized schools may simply not be interested in hiring better-qualified candidates. The evidence does show that unionized schools hire fewer teachers from selective colleges and who are teaching in their subject major. This, however, may be due more to the way hiring and transferring decisions are made in districts covered by collective bargaining contracts, than by individual preferences of school administrators. This is evidenced by the fact that the union/salary interaction coefficient is stronger (more negative) for the sample of new-teachers-with-prior-experience category. Many collective-bargaining contracts give transferring preference on the basis of seniority. Therefore, when a district unilaterally increases wages (making itself more attractive than other districts) the teachers that will get transfer priority will be the most experienced ones.
Flyer, Fredrick, and Rosen, Sherwin. “The New Economics of Teachers and Education,” Journal of Labor Economics, Vol. 15, No. 1, Part 2: Essays in Honor of Yoram Ben-Porath, pp. S104–S139. 1997.
Research Questions: (1) What are the demand forces at work in the teachers’ market? How is the increase in direct costs of elementary and secondary education
Methods: (1) Regression analysis with state and time fixed effects. (2) The authors develop a theoretical model of occupational choice to explain why women would exhibit greater risk aversion than men, i.e., they will choose occupations with lower human capital depreciation rates (fewer penalties for time spent out of the labor force) because they anticipate
Findings: Absolute costs and costs per student in elementary and secondary education have risen since 1960. This increase was due to rising teacher-student ratios rather than rising relative wages of teachers. Educating each student became more costly not because a stable body of teachers got paid more (in relative terms), but because the system hired teachers intensively during the 1960s and 1970s and had to keep them after baby-
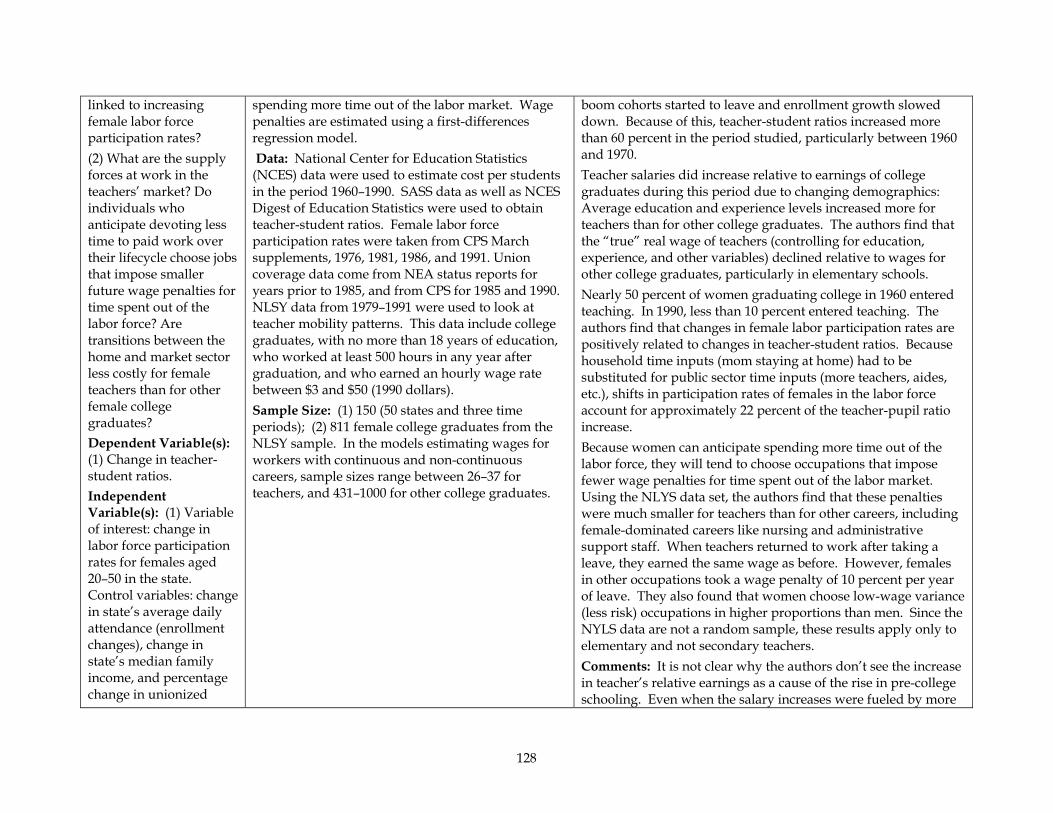
128
linked to increasing female labor force participation rates? (2) What are the supply forces at work in the teachers’ market? Do individuals who anticipate devoting less time to paid work over their lifecycle choose jobs that impose smaller future wage penalties for time spent out of the labor force? Are transitions between the home and market sector less costly for female teachers than for other female college graduates? Dependent Variable(s): (1) Change in teacher-student ratios. Independent Variable(s): (1) Variable of interest: change in labor force participation rates for females aged 20–50 in the state. Control variables: change in state’s average daily attendance (enrollment changes), change in state’s median family income, and percentage change in unionized
spending more time out of the labor market. Wage penalties are estimated using a first-differences regression model. Data: National Center for Education Statistics (NCES) data were used to estimate cost per students in the period 1960–1990. SASS data as well as NCES Digest of Education Statistics were used to obtain teacher-student ratios. Female labor force participation rates were taken from CPS March supplements, 1976, 1981, 1986, and 1991. Union coverage data come from NEA status reports for years prior to 1985, and from CPS for 1985 and 1990. NLSY data from 1979–1991 were used to look at teacher mobility patterns. This data include college graduates, with no more than 18 years of education, who worked at least 500 hours in any year after graduation, and who earned an hourly wage rate between $3 and $50 (1990 dollars). Sample Size: (1) 150 (50 states and three time periods); (2) 811 female college graduates from the NLSY sample. In the models estimating wages for workers with continuous and non-continuous careers, sample sizes range between 26–37 for teachers, and 431–1000 for other college graduates.
boom cohorts started to leave and enrollment growth slowed down. Because of this, teacher-student ratios increased more than 60 percent in the period studied, particularly between 1960 and 1970. Teacher salaries did increase relative to earnings of college graduates during this period due to changing demographics: Average education and experience levels increased more for teachers than for other college graduates. The authors find that the “true” real wage of teachers (controlling for education, experience, and other variables) declined relative to wages for other college graduates, particularly in elementary schools. Nearly 50 percent of women graduating college in 1960 entered teaching. In 1990, less than 10 percent entered teaching. The authors find that changes in female labor participation rates are positively related to changes in teacher-student ratios. Because household time inputs (mom staying at home) had to be substituted for public sector time inputs (more teachers, aides, etc.), shifts in participation rates of females in the labor force account for approximately 22 percent of the teacher-pupil ratio increase. Because women can anticipate spending more time out of the labor force, they will tend to choose occupations that impose fewer wage penalties for time spent out of the labor market. Using the NLYS data set, the authors find that these penalties were much smaller for teachers than for other careers, including female-dominated careers like nursing and administrative support staff. When teachers returned to work after taking a leave, they earned the same wage as before. However, females in other occupations took a wage penalty of 10 percent per year of leave. They also found that women choose low-wage variance (less risk) occupations in higher proportions than men. Since the NYLS data are not a random sample, these results apply only to elementary and not secondary teachers. Comments: It is not clear why the authors don’t see the increase in teacher’s relative earnings as a cause of the rise in pre-college schooling. Even when the salary increases were fueled by more

129
teachers in the state.
seniority and education levels—so that in relative terms they are not considered increases in the “true” wage—they are still increases that the education system has to bear. The substitution argument is difficult to understand. The authors see the link between more female participation in the labor force and the rise in student-teacher ratios as evidence of a substitution effect. The logic is that as more women participate in the labor force, they have less time for their children (household inputs) and therefore rely more on the schools to provide educational inputs (public-sector inputs). This causes increases in the teacher-student ratio. Therefore, do schools have to provide more teachers per students, because women are spending more time in the non-teaching labor markets? Perhaps this is true, but only if somehow schools and parents could agree that a given number of teachers per student was needed to provide the same educational outcomes as if these children spent more with their mothers. Finally, the authors acknowledge that the number of teachers in their NLSY sample spending a year or more out of the labor force is really small. It would have been helpful to see a discussion of how they think this may affect the results.
Galchus, Kenneth E. “An Analysis of the Factors Affecting the Supply and Demand for Teacher Quality,” Journal of Economics and Finance, Vol. 18, No. 2, pp. 165178. 1994.
Research Questions: What factors have influenced the supply and demand for teacher quality in Arkansas’s public schools? Dependent Variable(s): County-wide pass rate of teachers on the Arkansas basic skills test. Independent Variable(s): Demand
Methods: The supply-demand model was estimated using two-stage least squares. All variables (dependent as well as independent) enter the equations in log form. Data: Data come from 362 school districts spread among Arkansas’s 75 counties. School-level and school district figures were aggregated to the county level. The school data is from the 1984–1985 school year. Sample Size: N=75 counties
Findings: Average salaries have a statistically significant and negative effect on demand for teacher quality and a significant and positive effect on the supply of teacher quality. The magnitude of the effect is not very large: The coefficient of salary in the demand equation suggests that a 10-percent increase in average teacher salaries would lead to a 4.1-percent drop in the percentage of teachers passing the basic skills test. Therefore, demand for teacher quality appears to be price-inelastic. Supply for teacher quality is much more elastic. A 10-percent increase in average teacher salaries would lead to an increase in the percentage of teachers passing the basic skills test of 9.3 percent (almost proportional).
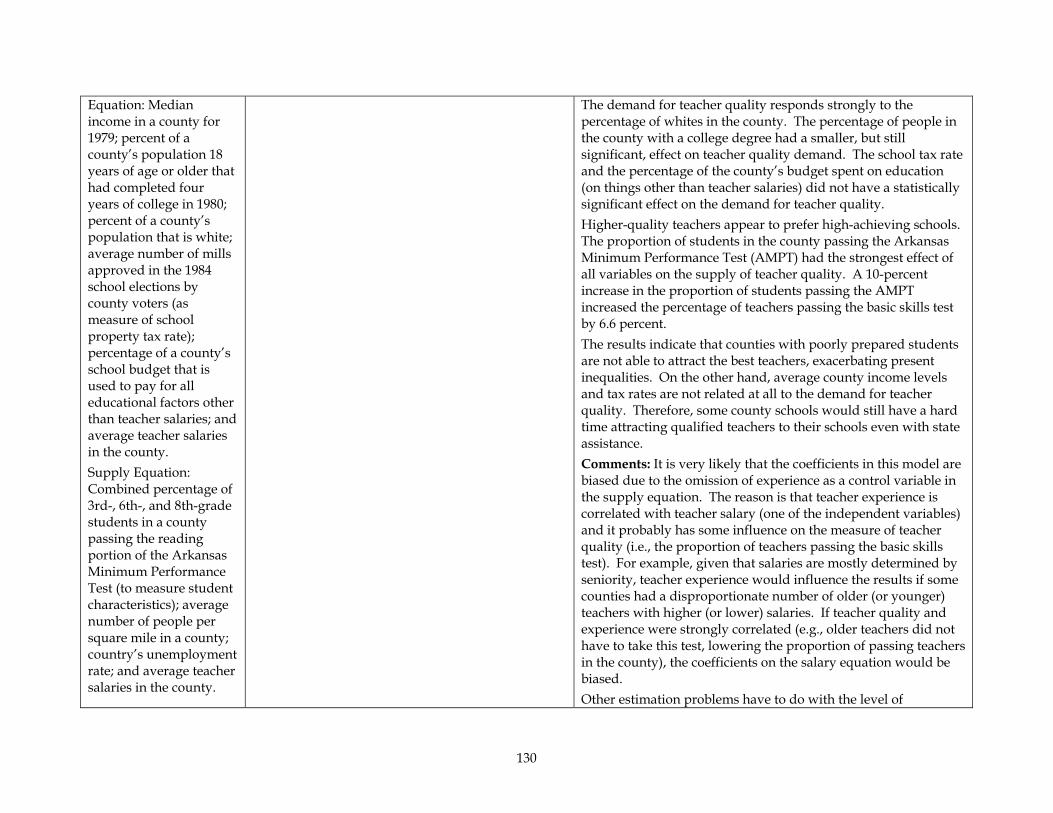
130
Equation: Median income in a county for 1979; percent of a county’s population 18 years of age or older that had completed four years of college in 1980; percent of a county’s population that is white; average number of mills approved in the 1984 school elections by county voters (as measure of school property tax rate); percentage of a county’s school budget that is used to pay for all educational factors other than teacher salaries; and average teacher salaries in the county. Supply Equation: Combined percentage of 3rd-, 6th-, and 8th-grade students in a county passing the reading portion of the Arkansas Minimum Performance Test (to measure student characteristics); average number of people per square mile in a county; country’s unemployment rate; and average teacher salaries in the county.
The demand for teacher quality responds strongly to the percentage of whites in the county. The percentage of people in the county with a college degree had a smaller, but still significant, effect on teacher quality demand. The school tax rate and the percentage of the county’s budget spent on education (on things other than teacher salaries) did not have a statistically significant effect on the demand for teacher quality. Higher-quality teachers appear to prefer high-achieving schools. The proportion of students in the county passing the Arkansas Minimum Performance Test (AMPT) had the strongest effect of all variables on the supply of teacher quality. A 10-percent increase in the proportion of students passing the AMPT increased the percentage of teachers passing the basic skills test by 6.6 percent. The results indicate that counties with poorly prepared students are not able to attract the best teachers, exacerbating present inequalities. On the other hand, average county income levels and tax rates are not related at all to the demand for teacher quality. Therefore, some county schools would still have a hard time attracting qualified teachers to their schools even with state assistance. Comments: It is very likely that the coefficients in this model are biased due to the omission of experience as a control variable in the supply equation. The reason is that teacher experience is correlated with teacher salary (one of the independent variables) and it probably has some influence on the measure of teacher quality (i.e., the proportion of teachers passing the basic skills test). For example, given that salaries are mostly determined by seniority, teacher experience would influence the results if some counties had a disproportionate number of older (or younger) teachers with higher (or lower) salaries. If teacher quality and experience were strongly correlated (e.g., older teachers did not have to take this test, lowering the proportion of passing teachers in the county), the coefficients on the salary equation would be biased. Other estimation problems have to do with the level of
131
aggregation and the measure of teacher quality used. The author does not provide enough information on the quality measure for it to be meaningful. Do all teachers in the county take this test? Was this test given 10 or 20 years ago so that older teachers would have taken the same test as new teachers? Is the level of aggregation appropriate or is there a lot of within-county variation in teacher quality? Finally, price (salaries) may not be the price of quality. Instead, it can reflect seniority, union provisions, etc. The demand for teacher quality seems to be mostly affected by teacher salaries and the proportion of whites in an area. The implication from the demand side is that if teacher quality were cheap, counties would demand more qualified teachers. The supply side, however, presents the converse story. If teacher quality were cheap, teachers would supply their services in fewer quantities. The effect of demand, however, is larger than the effect of supply, so a 10-percent increase in average salaries, holding all else equal, would have a net impact of decreasing teacher quality in the county (because the negative demand effect outweighs the positive supply effect). Therefore, this article is implying that increases in salaries would have a detrimental effect on the level of teacher quality in a county. This seems counterintuitive. Other considerations: Is the county the appropriate labor market level? Do county-level averages obscure high variation in salaries across districts? The same is true for the countywide measure of student achievement, which is aggregated from the school level and may obscure high variation. This variation may be correlated with teacher salaries and other characteristics that could change the results had the regressions been estimated at the school level.
Gitomer, Drew H., Latham, Andrew S., and Ziomek, Robert. The Academic Quality of Prospective Teachers: The Impact of Admissions and Licensure Testing, Princeton: Educational Testing Service. 1999.
Research Questions: (1) What are the academic and demographic
Methods: Calculation of the conditional means of SAT or ACT test scores for various groups, categorized by the independent variables. The
Findings: The authors dispute the oft-cited deficiency in SAT/ACT test scores among intended education majors relative to their college-bound peers. Specifically, individuals who took
132
characteristics of the prospective teacher pool? (This pool is divided into four subgroups: those who seek licensure, those who pass the licensure test, those who seek admission into teacher education, and those who pass the entrance test.) (2) How does teacher testing impact this pool? (3) What is the relationship between area of licensure and academic quality? (4) How would raising licensure testing standards affect the profiles of the prospective teaching population? (5) What is the relationship among teacher education training, teacher program accreditation, and the profiles of the prospective teaching population? Dependent Variable(s): SAT or ACT (college entrance exam) test scores; Praxis I (education program entrance exam) or Praxis II (teacher licensure exam) passing status.
Praxis test passing status for each individual was obtained by applying the 1997 passing standard for the state in which the candidate tested, regardless of the year tested between 1994 and 1997. Alternatively, two hypothetical uniform passing standards were applied to all individuals as a simulation; “high” was based on the highest passing score used by any state in 1997, and “low” was based on the lowest passing score used by any state in 1997. (Note that not all states required the Praxis tests in 1997.) Data: SAT and ACT college admissions test data from 1977–1995 matched with Praxis teacher licensure and college of education admissions test data from 1994–1997. Records were also matched with accredited undergraduate institutions to determine whether candidates had attended such an institution. Sample Size: More than 300,000 prospective teachers who took both a Praxis teacher test and either the SAT or ACT (33,866 individuals who took Praxis I and SAT; 159,857 who took Praxis II and SAT; 55,064 who took Praxis I and ACT; and 112,207 who took Praxis II and ACT).
the Praxis I test for admissions to a teacher education program had higher SAT/ACT scores than those whose self-reported intended major was education. Further, those who passed the Praxis I test had math scores comparable to, and verbal scores substantially higher than, the average scores of all college-bound seniors. When controlled for gender (given that women score lower on average on math tests, but represent a larger proportion of teacher candidates than men), those who were successful on the Praxis I had composite college entrance exam scores higher than average for college-bound high school seniors. Passing rates differed by race/ethnicity. White candidates passed the Praxis I test at the highest rate (87 percent), and black candidates at the lowest rate (53 percent). Thus, the Praxis I test appears to have a negative impact on the racial/ethnic diversity of the teacher candidate pool. Passing rates did not differ much by gender. Individuals who passed the Praxis II test for teacher licensure had SAT/ACT scores comparable to those of the college-bound population, but lower SAT scores than the average for college graduates (ACT scores were unavailable for college graduates). The authors suggest that a shift takes place during the career selection process in college; those who choose teaching as a career have lower SAT scores than their college-completing peers. However, the SAT/ACT scores for those who passed Praxis II were stronger than for the pool of teacher candidates taking Praxis II, so licensure testing appears to have a positive selection impact on the academic profile of those who teach. Praxis II passing rates showed a pattern of results by demographic characteristics similar to that for Praxis I. White candidates passed at the highest rate (92 percent), and black candidates at the lowest rate (65 percent). Thus, the pool of teacher candidates, already predominantly white before licensure, becomes even more homogeneous after licensure testing. Gender did not make much difference. Although undergraduate GPA is self-reported by Praxis II takers, it is consistently associated with higher SAT/ACT scores
133
Independent Variable(s): Praxis I or II passing status; race/ethnicity and gender; accreditation status of undergraduate institution; undergraduate GPA and major; enrollment in teacher education program; and licensing area.
and with higher licensure passing rates on the Praxis II. Two-thirds of licensure test takers reported GPAs of 3.0 or above, and 92 percent of those passed. Only 4 percent of takers reported GPAs of less than 2.5; however, of these, two-thirds passed licensure standards. Thus, the licensure test appears to have a small but positive effect on the average GPA of teachers. Using SAT data, the authors find a “great disparity” between teacher candidates who qualify for single-subject licenses and those whose licensure area is elementary, special, or physical education. Elementary education candidates had higher SAT scores than high school seniors reporting an intention to be education majors, but much lower SAT scores than college graduates in general. In contrast, verbal SAT scores of those qualifying for subject area licenses (with the exception of art/music) were higher than for all college graduates, and math SAT scores of those qualifying for licenses in science and mathematics areas were substantially higher than for all college graduates. Thus, while those qualifying for teacher licenses in specific content areas were academically stronger than their graduating peers, those qualifying for elementary, special, or physical education license were weaker academically than their graduating peers. The authors point out that, since elementary teachers represent a majority of the teaching population, the lower scores of elementary teacher candidates are likely to mask the relatively high scores of those qualifying for licenses in academic content areas. In their simulation of pass rates at hypothetical uniform standards, the authors find that raising standards in all states to the highest standard used by any state in 1997 would have a greater positive impact on the academic profile of teacher candidates than the negative impact of lowering all states to the lowest standard used by any state in 1997. The high standard would raise the average composite SAT score of teacher candidates (Praxis I passers) from 1039 to 1103, and the composite ACT score from 42.0 to 44.2. However, this would come at the cost of cutting the prospective teacher supply by 40 percent for SAT takers and 30 percent for ACT takers. It would
134
also sharply reduce the ethnic diversity of the (already relatively homogeneous) teaching pool, with black candidates passing at a 17-percent rate (SAT) or 28-percent rate (ACT) versus the current 46 percent and 63 percent rates, respectively. Raising or lowering standards would have little effect on the gender composition of the teaching force. Very similar results were simulated for changes in Praxis II standards. Instituting higher standards would reduce the licensure success rate to about two thirds, increase SAT/ACT scores of the teaching force, and reduce the success rate of minority candidates. Raising the Praxis II standards would not greatly impact the pass rates of high-GPA students, but it would impose a barrier to low-GPA students and raise the average GPA of the teacher pool. Comments: With the authors’ access to rich, linkable data sets (they work for the major testing organizations), this report provides an important insight into the relationships between general academic ability, as indicated by college admissions test scores and college GPA, and qualification for teaching, as indicated by the two Praxis tests. It makes a vital contribution by basing its assessment of the teacher candidate pool on observed behavior of college students and graduates—attempts to enter schools of education and to obtain licensure—rather than self-reported intentions of high school seniors. It reveals the importance of composition effects in any analysis of teacher academic quality; teachers are a heterogeneous population, and the distinction between elementary and subject-specialty teachers is especially critical. The paper compares many groupings of teacher candidates with college-bound students and college graduates. Although it is generally well written, sometimes the multiplicity of comparisons leads to confusion when the flow of the argument in the text follows a faulty parallelism or doesn’t match the organization of the tables. The authors do not perform statistical tests of differences in mean scores or proportions of people passing the tests.
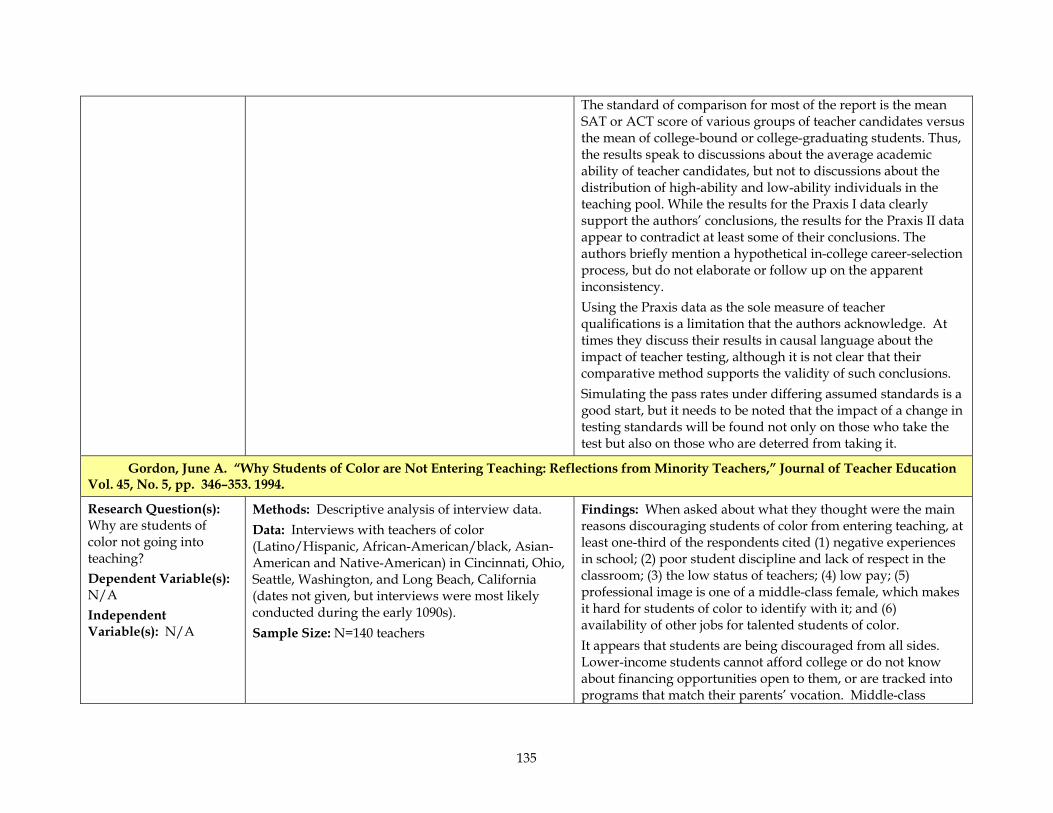
135
The standard of comparison for most of the report is the mean SAT or ACT score of various groups of teacher candidates versus the mean of college-bound or college-graduating students. Thus, the results speak to discussions about the average academic ability of teacher candidates, but not to discussions about the distribution of high-ability and low-ability individuals in the teaching pool. While the results for the Praxis I data clearly support the authors’ conclusions, the results for the Praxis II data appear to contradict at least some of their conclusions. The authors briefly mention a hypothetical in-college career-selection process, but do not elaborate or follow up on the apparent inconsistency. Using the Praxis data as the sole measure of teacher qualifications is a limitation that the authors acknowledge. At times they discuss their results in causal language about the impact of teacher testing, although it is not clear that their comparative method supports the validity of such conclusions. Simulating the pass rates under differing assumed standards is a good start, but it needs to be noted that the impact of a change in testing standards will be found not only on those who take the test but also on those who are deterred from taking it.
Gordon, June A. “Why Students of Color are Not Entering Teaching: Reflections from Minority Teachers,” Journal of Teacher Education Vol. 45, No. 5, pp. 346–353. 1994.
Research Question(s): Why are students of color not going into teaching? Dependent Variable(s): N/A Independent Variable(s): N/A
Methods: Descriptive analysis of interview data. Data: Interviews with teachers of color (Latino/Hispanic, African-American/black, Asian-American and Native-American) in Cincinnati, Ohio, Seattle, Washington, and Long Beach, California (dates not given, but interviews were most likely conducted during the early 1090s). Sample Size: N=140 teachers
Findings: When asked about what they thought were the main reasons discouraging students of color from entering teaching, at least one-third of the respondents cited (1) negative experiences in school; (2) poor student discipline and lack of respect in the classroom; (3) the low status of teachers; (4) low pay; (5) professional image is one of a middle-class female, which makes it hard for students of color to identify with it; and (6) availability of other jobs for talented students of color. It appears that students are being discouraged from all sides. Lower-income students cannot afford college or do not know about financing opportunities open to them, or are tracked into programs that match their parents’ vocation. Middle-class
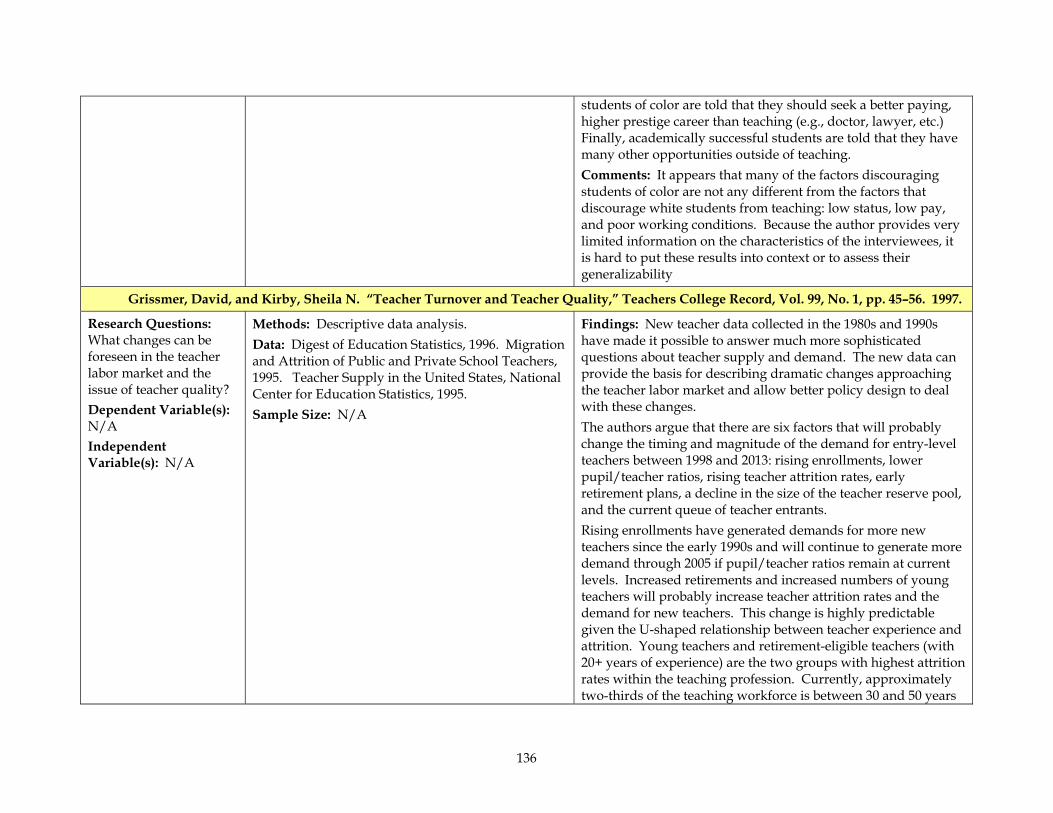
136
students of color are told that they should seek a better paying, higher prestige career than teaching (e.g., doctor, lawyer, etc.) Finally, academically successful students are told that they have many other opportunities outside of teaching. Comments: It appears that many of the factors discouraging students of color are not any different from the factors that discourage white students from teaching: low status, low pay, and poor working conditions. Because the author provides very limited information on the characteristics of the interviewees, it is hard to put these results into context or to assess their generalizability
Grissmer, David, and Kirby, Sheila N. “Teacher Turnover and Teacher Quality,” Teachers College Record, Vol. 99, No. 1, pp. 45–56. 1997.
Research Questions: What changes can be foreseen in the teacher labor market and the issue of teacher quality? Dependent Variable(s): N/A Independent Variable(s): N/A
Methods: Descriptive data analysis. Data: Digest of Education Statistics, 1996. Migration and Attrition of Public and Private School Teachers, 1995. Teacher Supply in the United States, National Center for Education Statistics, 1995. Sample Size: N/A
Findings: New teacher data collected in the 1980s and 1990s have made it possible to answer much more sophisticated questions about teacher supply and demand. The new data can provide the basis for describing dramatic changes approaching the teacher labor market and allow better policy design to deal with these changes. The authors argue that there are six factors that will probably change the timing and magnitude of the demand for entry-level teachers between 1998 and 2013: rising enrollments, lower pupil/teacher ratios, rising teacher attrition rates, early retirement plans, a decline in the size of the teacher reserve pool, and the current queue of teacher entrants. Rising enrollments have generated demands for more new teachers since the early 1990s and will continue to generate more demand through 2005 if pupil/teacher ratios remain at current levels. Increased retirements and increased numbers of young teachers will probably increase teacher attrition rates and the demand for new teachers. This change is highly predictable given the U-shaped relationship between teacher experience and attrition. Young teachers and retirement-eligible teachers (with 20+ years of experience) are the two groups with highest attrition rates within the teaching profession. Currently, approximately two-thirds of the teaching workforce is between 30 and 50 years
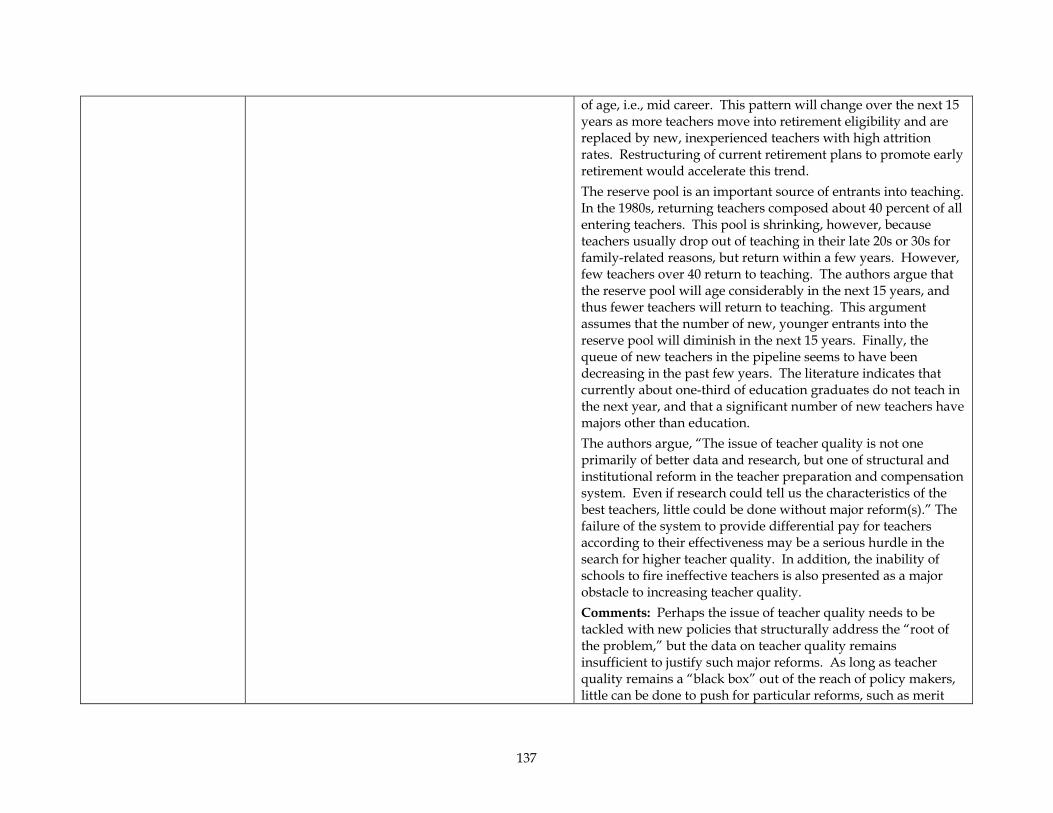
137
of age, i.e., mid career. This pattern will change over the next 15 years as more teachers move into retirement eligibility and are replaced by new, inexperienced teachers with high attrition rates. Restructuring of current retirement plans to promote early retirement would accelerate this trend. The reserve pool is an important source of entrants into teaching. In the 1980s, returning teachers composed about 40 percent of all entering teachers. This pool is shrinking, however, because teachers usually drop out of teaching in their late 20s or 30s for family-related reasons, but return within a few years. However, few teachers over 40 return to teaching. The authors argue that the reserve pool will age considerably in the next 15 years, and thus fewer teachers will return to teaching. This argument assumes that the number of new, younger entrants into the reserve pool will diminish in the next 15 years. Finally, the queue of new teachers in the pipeline seems to have been decreasing in the past few years. The literature indicates that currently about one-third of education graduates do not teach in the next year, and that a significant number of new teachers have majors other than education. The authors argue, “The issue of teacher quality is not one primarily of better data and research, but one of structural and institutional reform in the teacher preparation and compensation system. Even if research could tell us the characteristics of the best teachers, little could be done without major reform(s).” The failure of the system to provide differential pay for teachers according to their effectiveness may be a serious hurdle in the search for higher teacher quality. In addition, the inability of schools to fire ineffective teachers is also presented as a major obstacle to increasing teacher quality. Comments: Perhaps the issue of teacher quality needs to be tackled with new policies that structurally address the “root of the problem,” but the data on teacher quality remains insufficient to justify such major reforms. As long as teacher quality remains a “black box” out of the reach of policy makers, little can be done to push for particular reforms, such as merit

138
pay. In this respect, better and more accurate data can be very helpful.
Grissmer, David W. and Kirby, Sheila N. Patterns of Attrition Among Indiana Teachers: 1965–1987, Santa Monica: Calif.: RAND, R-4076-LE. 1992.
Research Questions: Were teachers leaving the profession at growing rates? What roles do compensation and working conditions play in retaining teachers? What types of teachers stay longest in the profession? Dependent Variable(s): Permanent and annual attrition. Independent Variable(s): Race, gender, age, experience, subject taught, salaries, school level. The labor force participation rates of men and women and the median incomes of college-educated men and women are included in some models to control for changes in overall female labor trends and in the opportunity cost of teaching.
Methods: Descriptive statistics, Kaplan-Meier estimators, and Cox proportional hazards models. Data: Indiana State Department of Education public school teacher personnel files from 1965–1988. Sample Size: The teaching force grew from approximately 43,500 in 1965 to 52,000 in 1988.
Findings: Attrition is defined as a loss to teaching—therefore teachers who become administrators or who take a non-teaching position in the school system are included in the definition. A fairly consistent proportion of teachers appear to return to teaching—approximately 25 to 30 percent of those who leave in any given year tend to return, generally within five years of separation. Permanent attrition dropped from 13 percent in the late 1960s to 5 percent in 1987. The drop in permanent attrition was greater for women than men due probably to the increase in female labor force participation over this period. A 10-percent increase in salary was associated with about a 10-percent reduction in attrition in men and a 4-percent reduction among women. Student-teacher ratios also help explain lower attrition. Older women teachers were a growing proportion of teachers, and late-entering teachers had lower attrition rates. Secondary school teachers have higher permanent attrition rates than elementary teachers, and science teachers have particularly high attrition rates. Physics and chemistry teachers have attrition rates that are 80 percent higher than those of elementary teachers. Biology teachers have rates that are 65 percent higher, and English teachers have rates that are 20–25 percent higher. Surprisingly, mathematics teachers do not have higher attrition rates than other types of secondary teachers. The U-shaped age-attrition pattern was evident: teachers 20–24 years old had higher-than-average attrition rates (23 versus 12.4 percent in 1965 and 13 versus 5.6 percent in 1985). Comments: This report provides information on historical trends in Indiana’s teaching force. It offers clear distinctions between permanent and annual attrition and is straightforward. Only school level was included among possible school characteristics to examine.

139
Gritz, R. Mark, and Theobald, Neil D. “The Effects of School District Spending on Length of Stay in Teaching,” The Journal of Human Resources, Vol. 31, No. 3, pp. 477–512. 1996.
Research Questions: How do differences in public school districts’ spending priorities affect the length of time that beginning teachers stay in the district? Dependent Variable(s): Number of consecutive years a person teaches in the district. Independent Variable(s): Variables of interest: natural log of annual salary; total expenditures per teacher for regular education, special education, and vocational education; expenditures for district-wide administration and supervision of instruction activities; total expenditures per teacher for support activities (e.g., learning resources, principal’s office, counseling, etc.); expenditures for classified staff involved in teaching activities (e.g., instructional aides); and total expenditures per teacher (in $) for
Methods: Generalized variant of a transition probability model (TPM) to study movements among the alternative career paths open to teachers. The model is developed analytically and then estimated empirically. The model estimates the effect of various district-spending variables on duration distributions for beginning teachers and for exit probabilities. The models are estimated separately for males and females in the State of Washington. Simulation: To estimate the long-term relationships between district spending priorities and teacher duration, the authors employ simulation techniques. The exercise simulates the experiences of hypothetical teachers who just began teaching and follows their career choices for ten years. To obtain these predicted values, the simulation uses parameter estimates from the empirical analysis. The exercise is repeated numerous times to characterize the distribution of career choices among beginning teachers, given particular individual traits (age, grade level, and teaching program), in various school settings (elementary and secondary schools), and facing alternative career paths. The initial simulation allocates $3,000 per teacher to total expenditures without changing salaries. Each of the other simulations increases or decreases one specific object of expenditure by $3,000 per teacher. Data: Dataset includes information on white teachers who began their careers in Washington public schools during the period 1981–1990. The career of each teacher in the sample is followed through the 1991–1992 school year. Data include information on teachers’ individual characteristics,
Findings: The main findings of this study are that beginning teachers work for shorter periods of time in districts that spend more on central administration or on classified staff involved in teaching activities (i.e., instructional aides). In addition, increasing school district spending without changing teacher salaries has little or no effect on the length of time that beginning teachers stay in their districts; both male and female teachers are more likely to leave if spending increases are targeted solely to classified staff involved in teaching activities. The tenure duration of female teachers is responsive to teaching salaries in other districts (if the teachers’ own salaries increase with respect to other districts, they stay longer). On the contrary, male teachers’ tenures are responsive to salaries in occupations outside teaching. Male teachers have longer teaching spells in districts where teachers are paid more relative to other occupations. The results from the simulation confirm findings in the literature about teacher turnover: A high percentage of individuals leave teaching within the first years of their career; personal characteristics influence retention behavior more in female than in male teachers; male teachers remain in their positions longer than do female teachers; special education teachers are less likely to remain in the district where they were first hired than are other types of teachers; and teachers are less likely to remain in districts where a high proportion of the students live in poverty or are minorities. The findings suggest that district-level policy-makers may not be able to influence teachers’ career durations by simply trying to keep their salaries above those in neighboring districts. This strategy may work to keep beginning teachers longer, but it may not be effective in retaining more experienced females or male teachers. The authors also suggest that school districts should consider the impact of efforts to include large numbers of classified staff in the classrooms, as this could have a negative
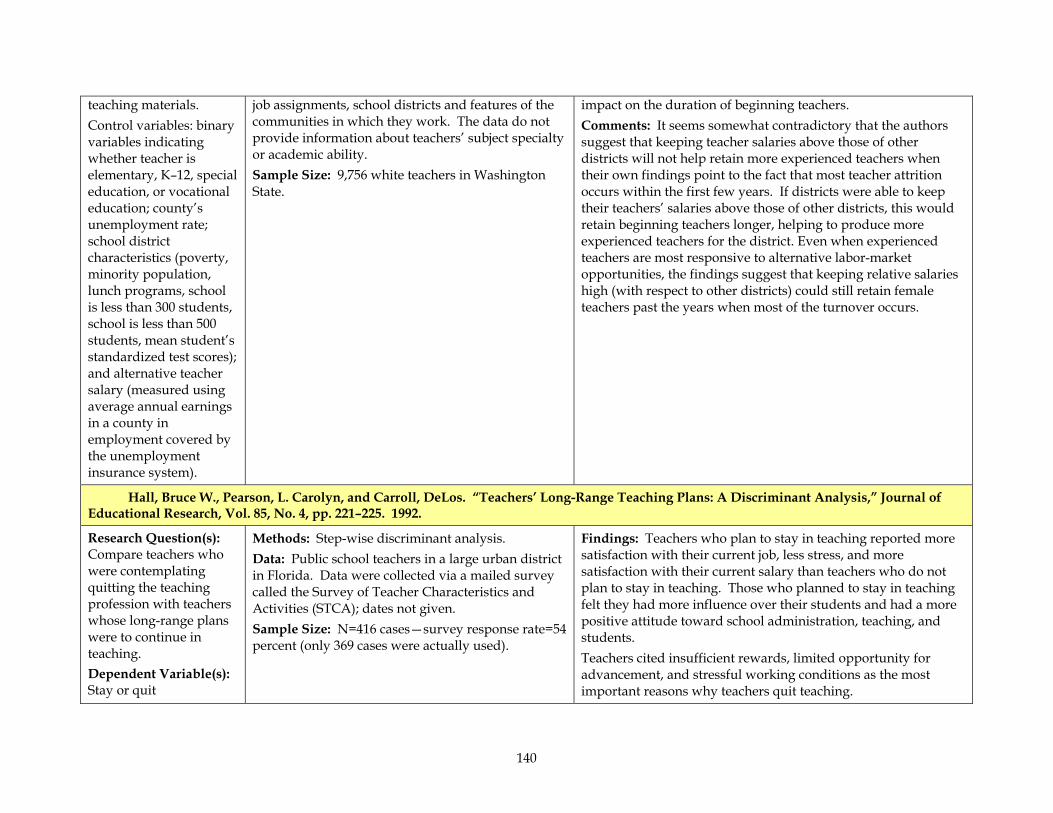
140
teaching materials. Control variables: binary variables indicating whether teacher is elementary, K–12, special education, or vocational education; county’s unemployment rate; school district characteristics (poverty, minority population, lunch programs, school is less than 300 students, school is less than 500 students, mean student’s standardized test scores); and alternative teacher salary (measured using average annual earnings in a county in employment covered by the unemployment insurance system).
job assignments, school districts and features of the communities in which they work. The data do not provide information about teachers’ subject specialty or academic ability. Sample Size: 9,756 white teachers in Washington State.
impact on the duration of beginning teachers. Comments: It seems somewhat contradictory that the authors suggest that keeping teacher salaries above those of other districts will not help retain more experienced teachers when their own findings point to the fact that most teacher attrition occurs within the first few years. If districts were able to keep their teachers’ salaries above those of other districts, this would retain beginning teachers longer, helping to produce more experienced teachers for the district. Even when experienced teachers are most responsive to alternative labor-market opportunities, the findings suggest that keeping relative salaries high (with respect to other districts) could still retain female teachers past the years when most of the turnover occurs.
Hall, Bruce W., Pearson, L. Carolyn, and Carroll, DeLos. “Teachers’ Long-Range Teaching Plans: A Discriminant Analysis,” Journal of Educational Research, Vol. 85, No. 4, pp. 221–225. 1992.
Research Question(s): Compare teachers who were contemplating quitting the teaching profession with teachers whose long-range plans were to continue in teaching. Dependent Variable(s): Stay or quit
Methods: Step-wise discriminant analysis. Data: Public school teachers in a large urban district in Florida. Data were collected via a mailed survey called the Survey of Teacher Characteristics and Activities (STCA); dates not given. Sample Size: N=416 cases—survey response rate=54 percent (only 369 cases were actually used).
Findings: Teachers who plan to stay in teaching reported more satisfaction with their current job, less stress, and more satisfaction with their current salary than teachers who do not plan to stay in teaching. Those who planned to stay in teaching felt they had more influence over their students and had a more positive attitude toward school administration, teaching, and students. Teachers cited insufficient rewards, limited opportunity for advancement, and stressful working conditions as the most important reasons why teachers quit teaching.
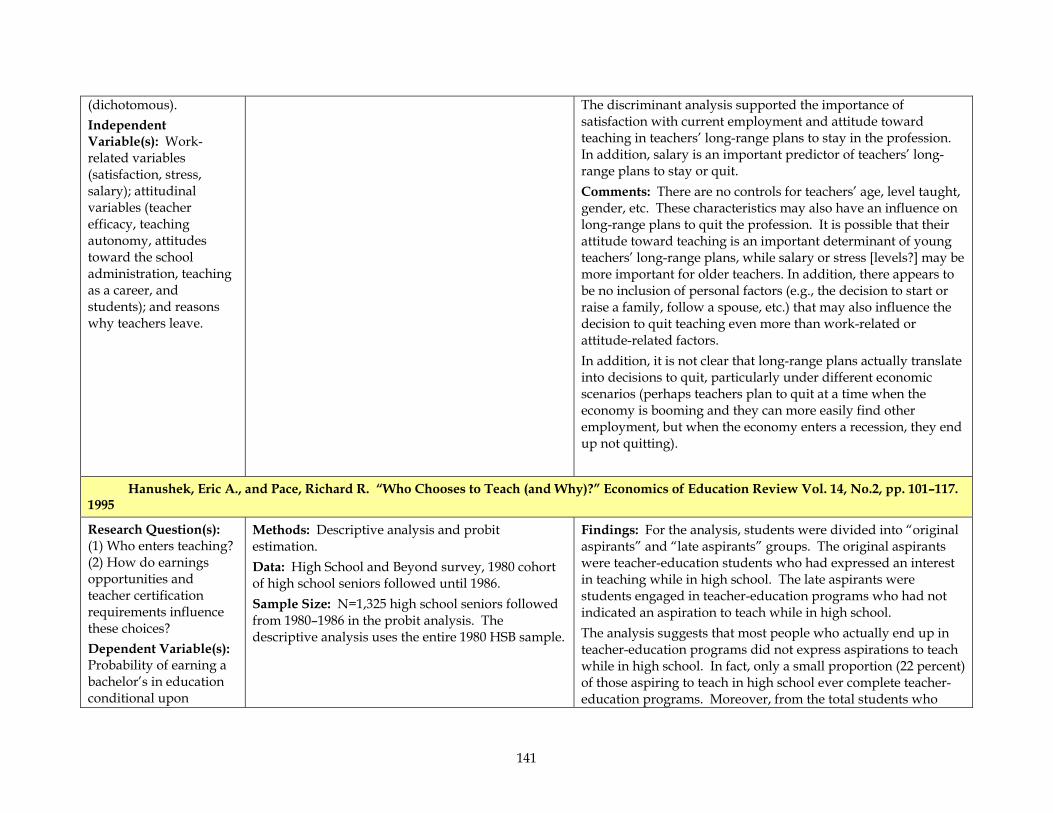
141
(dichotomous). Independent Variable(s): Work-related variables (satisfaction, stress, salary); attitudinal variables (teacher efficacy, teaching autonomy, attitudes toward the school administration, teaching as a career, and students); and reasons why teachers leave.
The discriminant analysis supported the importance of satisfaction with current employment and attitude toward teaching in teachers’ long-range plans to stay in the profession. In addition, salary is an important predictor of teachers’ long-range plans to stay or quit. Comments: There are no controls for teachers’ age, level taught, gender, etc. These characteristics may also have an influence on long-range plans to quit the profession. It is possible that their attitude toward teaching is an important determinant of young teachers’ long-range plans, while salary or stress [levels?] may be more important for older teachers. In addition, there appears to be no inclusion of personal factors (e.g., the decision to start or raise a family, follow a spouse, etc.) that may also influence the decision to quit teaching even more than work-related or attitude-related factors. In addition, it is not clear that long-range plans actually translate into decisions to quit, particularly under different economic scenarios (perhaps teachers plan to quit at a time when the economy is booming and they can more easily find other employment, but when the economy enters a recession, they end up not quitting).
Hanushek, Eric A., and Pace, Richard R. “Who Chooses to Teach (and Why)?” Economics of Education Review Vol. 14, No.2, pp. 101–117. 1995
Research Question(s): (1) Who enters teaching? (2) How do earnings opportunities and teacher certification requirements influence these choices? Dependent Variable(s): Probability of earning a bachelor’s in education conditional upon
Methods: Descriptive analysis and probit estimation. Data: High School and Beyond survey, 1980 cohort of high school seniors followed until 1986. Sample Size: N=1,325 high school seniors followed from 1980–1986 in the probit analysis. The descriptive analysis uses the entire 1980 HSB sample.
Findings: For the analysis, students were divided into “original aspirants” and “late aspirants” groups. The original aspirants were teacher-education students who had expressed an interest in teaching while in high school. The late aspirants were students engaged in teacher-education programs who had not indicated an aspiration to teach while in high school. The analysis suggests that most people who actually end up in teacher-education programs did not express aspirations to teach while in high school. In fact, only a small proportion (22 percent) of those aspiring to teach in high school ever complete teacher-education programs. Moreover, from the total students who
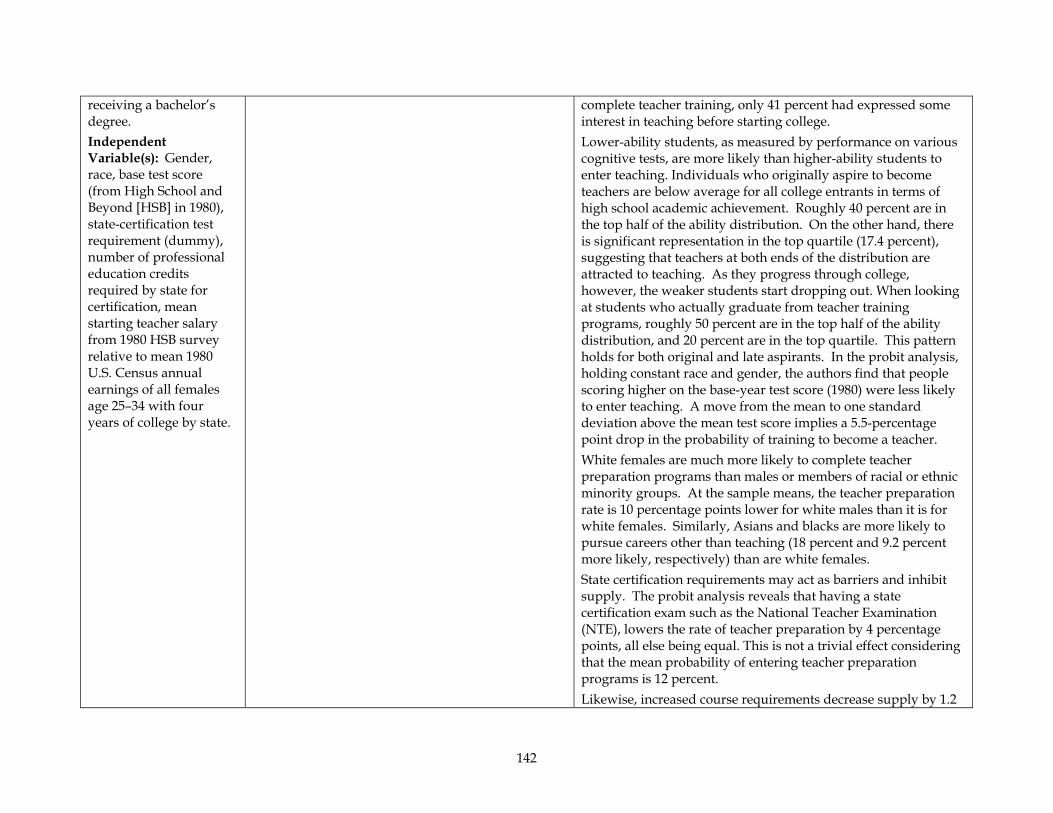
142
receiving a bachelor’s degree. Independent Variable(s): Gender, race, base test score (from High School and Beyond [HSB] in 1980), state-certification test requirement (dummy), number of professional education credits required by state for certification, mean starting teacher salary from 1980 HSB survey relative to mean 1980 U.S. Census annual earnings of all females age 25–34 with four years of college by state.
complete teacher training, only 41 percent had expressed some interest in teaching before starting college. Lower-ability students, as measured by performance on various cognitive tests, are more likely than higher-ability students to enter teaching. Individuals who originally aspire to become teachers are below average for all college entrants in terms of high school academic achievement. Roughly 40 percent are in the top half of the ability distribution. On the other hand, there is significant representation in the top quartile (17.4 percent), suggesting that teachers at both ends of the distribution are attracted to teaching. As they progress through college, however, the weaker students start dropping out. When looking at students who actually graduate from teacher training programs, roughly 50 percent are in the top half of the ability distribution, and 20 percent are in the top quartile. This pattern holds for both original and late aspirants. In the probit analysis, holding constant race and gender, the authors find that people scoring higher on the base-year test score (1980) were less likely to enter teaching. A move from the mean to one standard deviation above the mean test score implies a 5.5-percentage point drop in the probability of training to become a teacher. White females are much more likely to complete teacher preparation programs than males or members of racial or ethnic minority groups. At the sample means, the teacher preparation rate is 10 percentage points lower for white males than it is for white females. Similarly, Asians and blacks are more likely to pursue careers other than teaching (18 percent and 9.2 percent more likely, respectively) than are white females. State certification requirements may act as barriers and inhibit supply. The probit analysis reveals that having a state certification exam such as the National Teacher Examination (NTE), lowers the rate of teacher preparation by 4 percentage points, all else being equal. This is not a trivial effect considering that the mean probability of entering teacher preparation programs is 12 percent. Likewise, increased course requirements decrease supply by 1.2
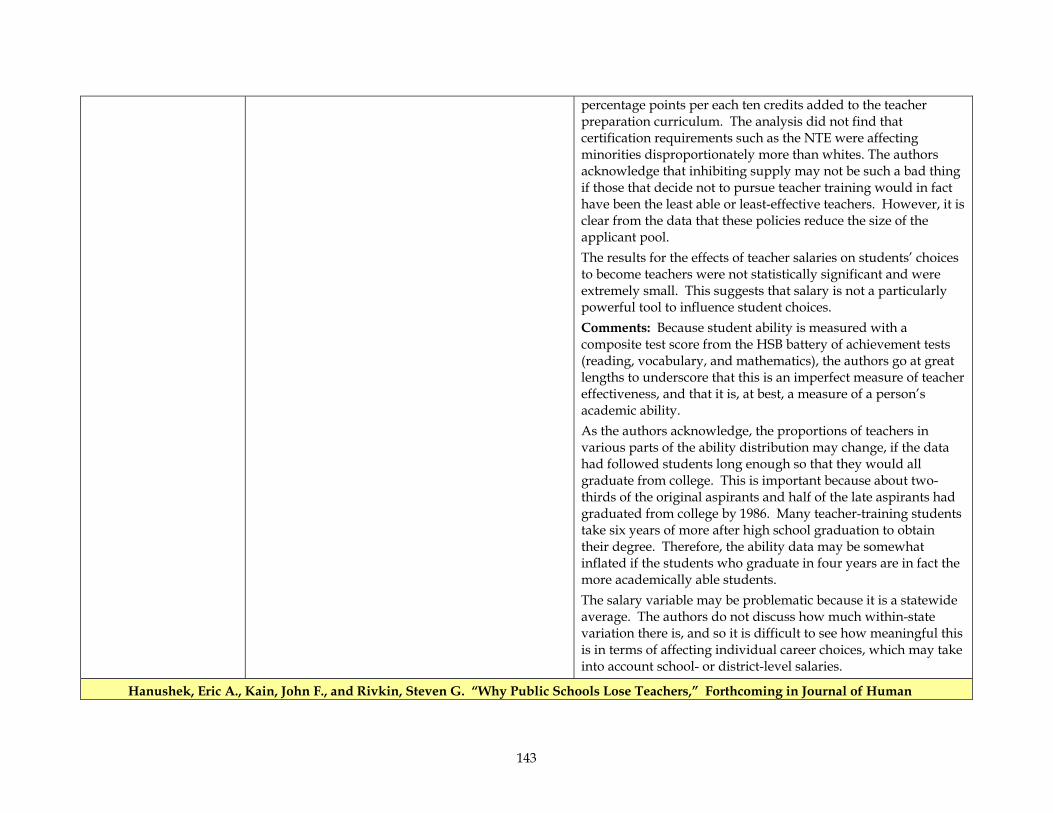
143
percentage points per each ten credits added to the teacher preparation curriculum. The analysis did not find that certification requirements such as the NTE were affecting minorities disproportionately more than whites. The authors acknowledge that inhibiting supply may not be such a bad thing if those that decide not to pursue teacher training would in fact have been the least able or least-effective teachers. However, it is clear from the data that these policies reduce the size of the applicant pool. The results for the effects of teacher salaries on students’ choices to become teachers were not statistically significant and were extremely small. This suggests that salary is not a particularly powerful tool to influence student choices. Comments: Because student ability is measured with a composite test score from the HSB battery of achievement tests (reading, vocabulary, and mathematics), the authors go at great lengths to underscore that this is an imperfect measure of teacher effectiveness, and that it is, at best, a measure of a person’s academic ability. As the authors acknowledge, the proportions of teachers in various parts of the ability distribution may change, if the data had followed students long enough so that they would all graduate from college. This is important because about two-thirds of the original aspirants and half of the late aspirants had graduated from college by 1986. Many teacher-training students take six years of more after high school graduation to obtain their degree. Therefore, the ability data may be somewhat inflated if the students who graduate in four years are in fact the more academically able students. The salary variable may be problematic because it is a statewide average. The authors do not discuss how much within-state variation there is, and so it is difficult to see how meaningful this is in terms of affecting individual career choices, which may take into account school- or district-level salaries.
Hanushek, Eric A., Kain, John F., and Rivkin, Steven G. “Why Public Schools Lose Teachers,” Forthcoming in Journal of Human
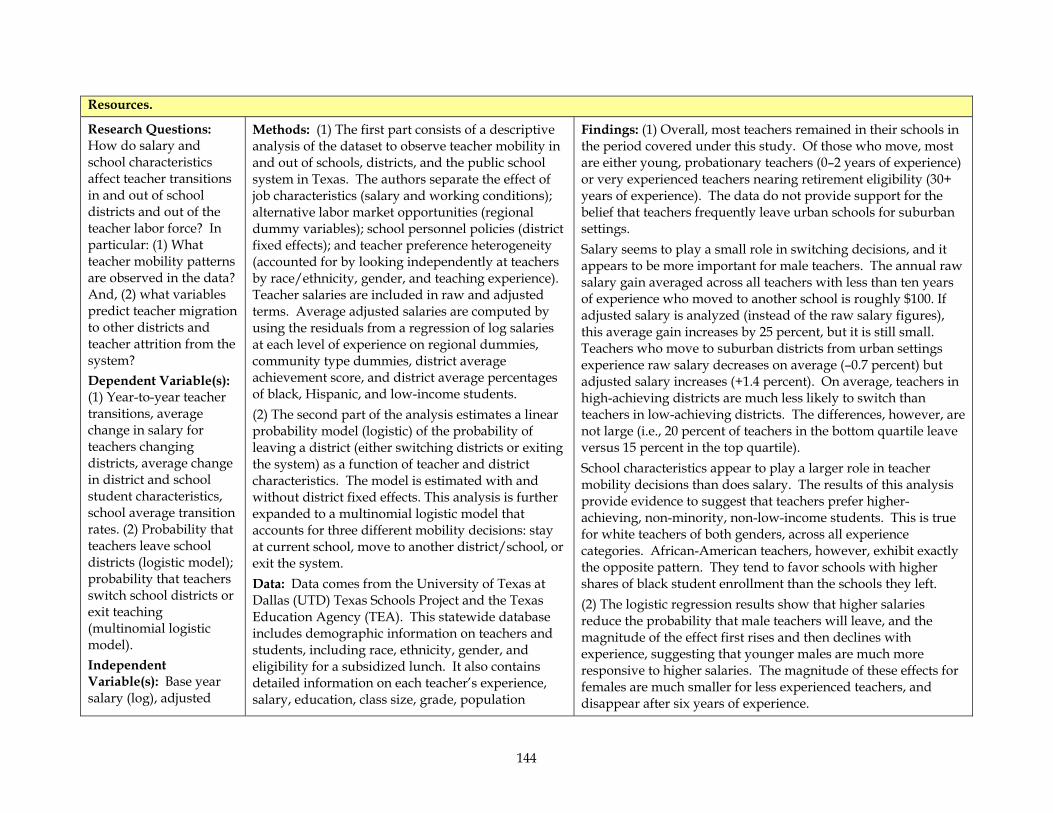
144
Resources.
Research Questions: How do salary and school characteristics affect teacher transitions in and out of school districts and out of the teacher labor force? In particular: (1) What teacher mobility patterns are observed in the data? And, (2) what variables predict teacher migration to other districts and teacher attrition from the system? Dependent Variable(s): (1) Year-to-year teacher transitions, average change in salary for teachers changing districts, average change in district and school student characteristics, school average transition rates. (2) Probability that teachers leave school districts (logistic model); probability that teachers switch school districts or exit teaching (multinomial logistic model). Independent Variable(s): Base year salary (log), adjusted
Methods: (1) The first part consists of a descriptive analysis of the dataset to observe teacher mobility in and out of schools, districts, and the public school system in Texas. The authors separate the effect of job characteristics (salary and working conditions); alternative labor market opportunities (regional dummy variables); school personnel policies (district fixed effects); and teacher preference heterogeneity (accounted for by looking independently at teachers by race/ethnicity, gender, and teaching experience). Teacher salaries are included in raw and adjusted terms. Average adjusted salaries are computed by using the residuals from a regression of log salaries at each level of experience on regional dummies, community type dummies, district average achievement score, and district average percentages of black, Hispanic, and low-income students. (2) The second part of the analysis estimates a linear probability model (logistic) of the probability of leaving a district (either switching districts or exiting the system) as a function of teacher and district characteristics. The model is estimated with and without district fixed effects. This analysis is further expanded to a multinomial logistic model that accounts for three different mobility decisions: stay at current school, move to another district/school, or exit the system. Data: Data comes from the University of Texas at Dallas (UTD) Texas Schools Project and the Texas Education Agency (TEA). This statewide database includes demographic information on teachers and students, including race, ethnicity, gender, and eligibility for a subsidized lunch. It also contains detailed information on each teacher’s experience, salary, education, class size, grade, population
Findings: (1) Overall, most teachers remained in their schools in the period covered under this study. Of those who move, most are either young, probationary teachers (0–2 years of experience) or very experienced teachers nearing retirement eligibility (30+ years of experience). The data do not provide support for the belief that teachers frequently leave urban schools for suburban settings. Salary seems to play a small role in switching decisions, and it appears to be more important for male teachers. The annual raw salary gain averaged across all teachers with less than ten years of experience who moved to another school is roughly $100. If adjusted salary is analyzed (instead of the raw salary figures), this average gain increases by 25 percent, but it is still small. Teachers who move to suburban districts from urban settings experience raw salary decreases on average (–0.7 percent) but adjusted salary increases (+1.4 percent). On average, teachers in high-achieving districts are much less likely to switch than teachers in low-achieving districts. The differences, however, are not large (i.e., 20 percent of teachers in the bottom quartile leave versus 15 percent in the top quartile). School characteristics appear to play a larger role in teacher mobility decisions than does salary. The results of this analysis provide evidence to suggest that teachers prefer higher-achieving, non-minority, non-low-income students. This is true for white teachers of both genders, across all experience categories. African-American teachers, however, exhibit exactly the opposite pattern. They tend to favor schools with higher shares of black student enrollment than the schools they left. (2) The logistic regression results show that higher salaries reduce the probability that male teachers will leave, and the magnitude of the effect first rises and then declines with experience, suggesting that younger males are much more responsive to higher salaries. The magnitude of these effects for females are much smaller for less experienced teachers, and disappear after six years of experience.
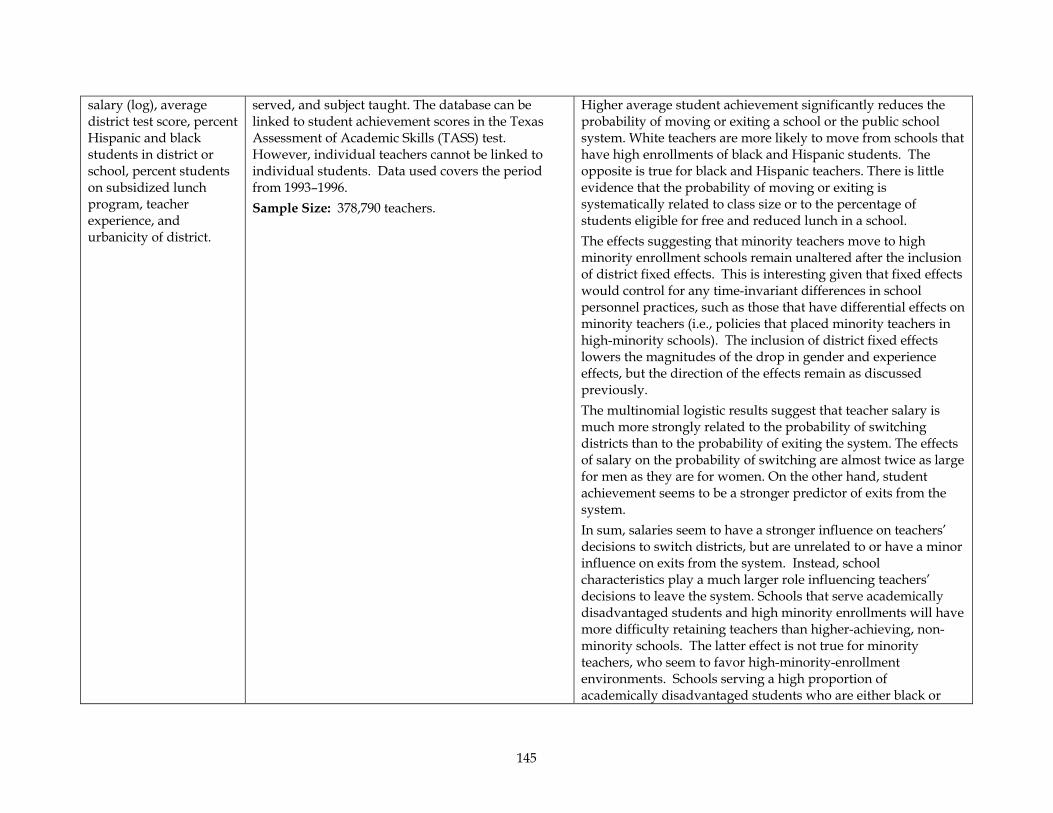
145
salary (log), average district test score, percent Hispanic and black students in district or school, percent students on subsidized lunch program, teacher experience, and urbanicity of district.
served, and subject taught. The database can be linked to student achievement scores in the Texas Assessment of Academic Skills (TASS) test. However, individual teachers cannot be linked to individual students. Data used covers the period from 1993–1996. Sample Size: 378,790 teachers.
Higher average student achievement significantly reduces the probability of moving or exiting a school or the public school system. White teachers are more likely to move from schools that have high enrollments of black and Hispanic students. The opposite is true for black and Hispanic teachers. There is little evidence that the probability of moving or exiting is systematically related to class size or to the percentage of students eligible for free and reduced lunch in a school. The effects suggesting that minority teachers move to high minority enrollment schools remain unaltered after the inclusion of district fixed effects. This is interesting given that fixed effects would control for any time-invariant differences in school personnel practices, such as those that have differential effects on minority teachers (i.e., policies that placed minority teachers in high-minority schools). The inclusion of district fixed effects lowers the magnitudes of the drop in gender and experience effects, but the direction of the effects remain as discussed previously. The multinomial logistic results suggest that teacher salary is much more strongly related to the probability of switching districts than to the probability of exiting the system. The effects of salary on the probability of switching are almost twice as large for men as they are for women. On the other hand, student achievement seems to be a stronger predictor of exits from the system. In sum, salaries seem to have a stronger influence on teachers’ decisions to switch districts, but are unrelated to or have a minor influence on exits from the system. Instead, school characteristics play a much larger role influencing teachers’ decisions to leave the system. Schools that serve academically disadvantaged students and high minority enrollments will have more difficulty retaining teachers than higher-achieving, non-minority schools. The latter effect is not true for minority teachers, who seem to favor high-minority-enrollment environments. Schools serving a high proportion of academically disadvantaged students who are either black or
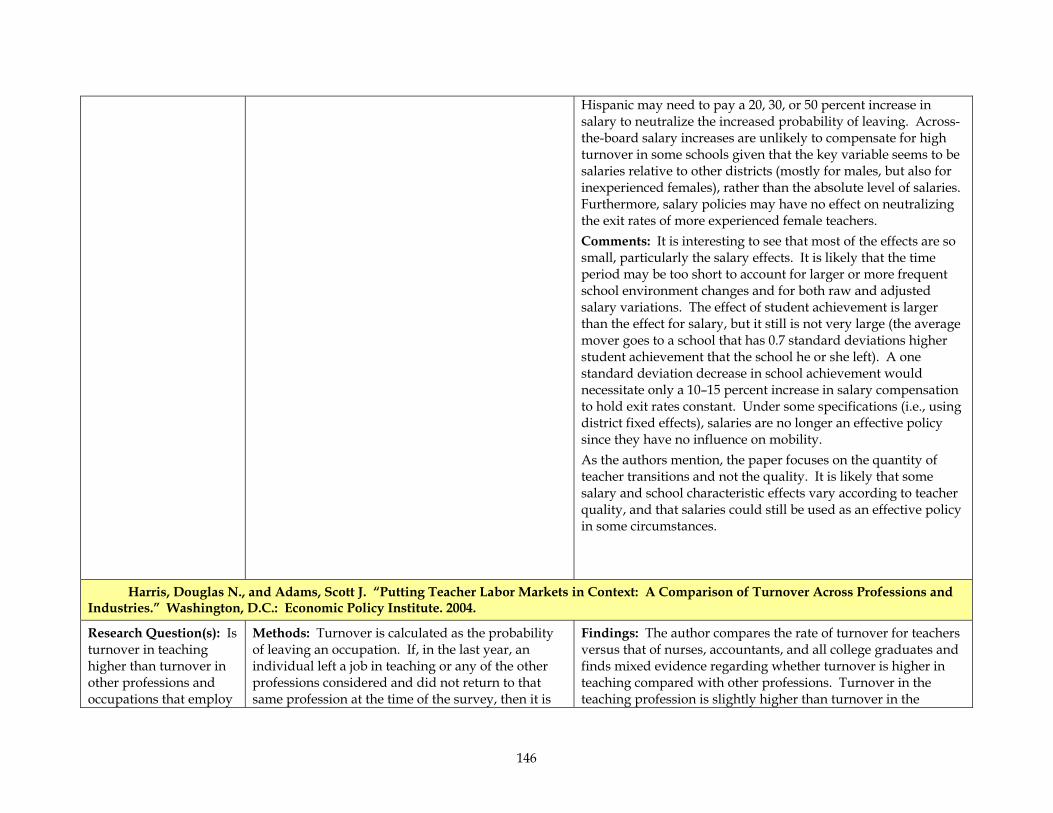
146
Hispanic may need to pay a 20, 30, or 50 percent increase in salary to neutralize the increased probability of leaving. Across-the-board salary increases are unlikely to compensate for high turnover in some schools given that the key variable seems to be salaries relative to other districts (mostly for males, but also for inexperienced females), rather than the absolute level of salaries. Furthermore, salary policies may have no effect on neutralizing the exit rates of more experienced female teachers. Comments: It is interesting to see that most of the effects are so small, particularly the salary effects. It is likely that the time period may be too short to account for larger or more frequent school environment changes and for both raw and adjusted salary variations. The effect of student achievement is larger than the effect for salary, but it still is not very large (the average mover goes to a school that has 0.7 standard deviations higher student achievement that the school he or she left). A one standard deviation decrease in school achievement would necessitate only a 10–15 percent increase in salary compensation to hold exit rates constant. Under some specifications (i.e., using district fixed effects), salaries are no longer an effective policy since they have no influence on mobility. As the authors mention, the paper focuses on the quantity of teacher transitions and not the quality. It is likely that some salary and school characteristic effects vary according to teacher quality, and that salaries could still be used as an effective policy in some circumstances.
Harris, Douglas N., and Adams, Scott J. “Putting Teacher Labor Markets in Context: A Comparison of Turnover Across Professions and Industries.” Washington, D.C.: Economic Policy Institute. 2004.
Research Question(s): Is turnover in teaching higher than turnover in other professions and occupations that employ
Methods: Turnover is calculated as the probability of leaving an occupation. If, in the last year, an individual left a job in teaching or any of the other professions considered and did not return to that same profession at the time of the survey, then it is
Findings: The author compares the rate of turnover for teachers versus that of nurses, accountants, and all college graduates and finds mixed evidence regarding whether turnover is higher in teaching compared with other professions. Turnover in the teaching profession is slightly higher than turnover in the
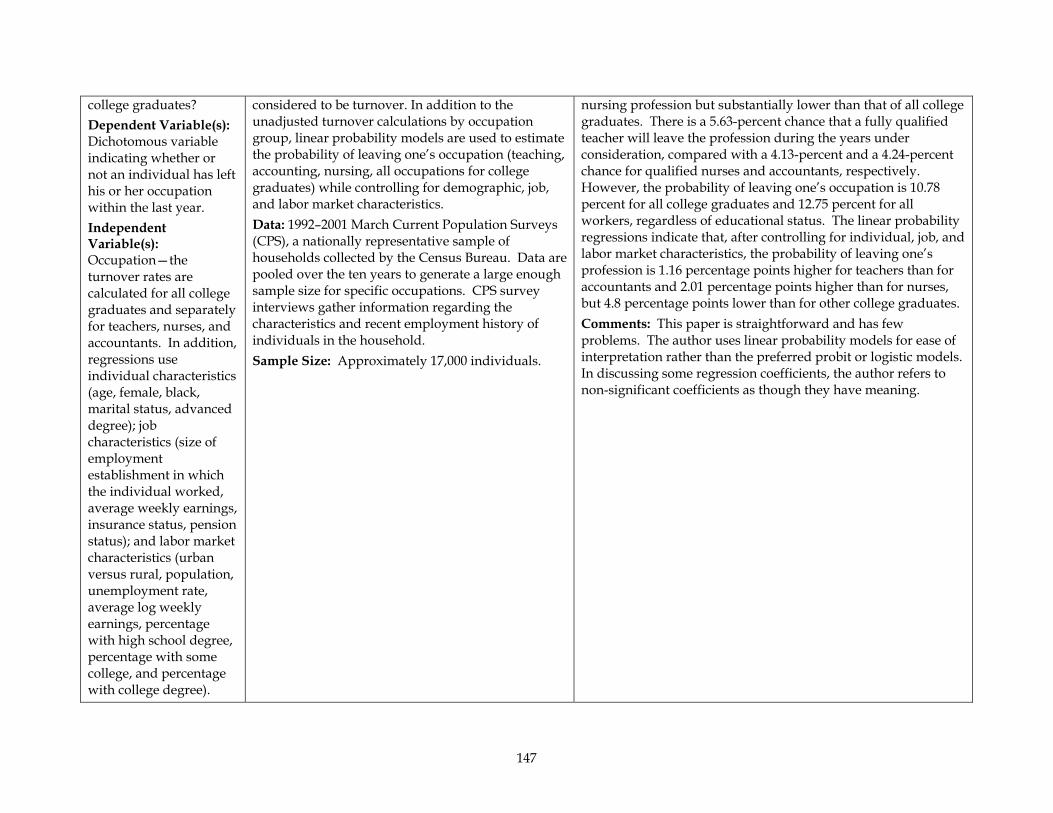
147
college graduates? Dependent Variable(s): Dichotomous variable indicating whether or not an individual has left his or her occupation within the last year. Independent Variable(s): Occupation—the turnover rates are calculated for all college graduates and separately for teachers, nurses, and accountants. In addition, regressions use individual characteristics (age, female, black, marital status, advanced degree); job characteristics (size of employment establishment in which the individual worked, average weekly earnings, insurance status, pension status); and labor market characteristics (urban versus rural, population, unemployment rate, average log weekly earnings, percentage with high school degree, percentage with some college, and percentage with college degree).
considered to be turnover. In addition to the unadjusted turnover calculations by occupation group, linear probability models are used to estimate the probability of leaving one’s occupation (teaching, accounting, nursing, all occupations for college graduates) while controlling for demographic, job, and labor market characteristics. Data: 1992–2001 March Current Population Surveys (CPS), a nationally representative sample of households collected by the Census Bureau. Data are pooled over the ten years to generate a large enough sample size for specific occupations. CPS survey interviews gather information regarding the characteristics and recent employment history of individuals in the household. Sample Size: Approximately 17,000 individuals.
nursing profession but substantially lower than that of all college graduates. There is a 5.63-percent chance that a fully qualified teacher will leave the profession during the years under consideration, compared with a 4.13-percent and a 4.24-percent chance for qualified nurses and accountants, respectively. However, the probability of leaving one’s occupation is 10.78 percent for all college graduates and 12.75 percent for all workers, regardless of educational status. The linear probability regressions indicate that, after controlling for individual, job, and labor market characteristics, the probability of leaving one’s profession is 1.16 percentage points higher for teachers than for accountants and 2.01 percentage points higher than for nurses, but 4.8 percentage points lower than for other college graduates. Comments: This paper is straightforward and has few problems. The author uses linear probability models for ease of interpretation rather than the preferred probit or logistic models. In discussing some regression coefficients, the author refers to non-significant coefficients as though they have meaning.
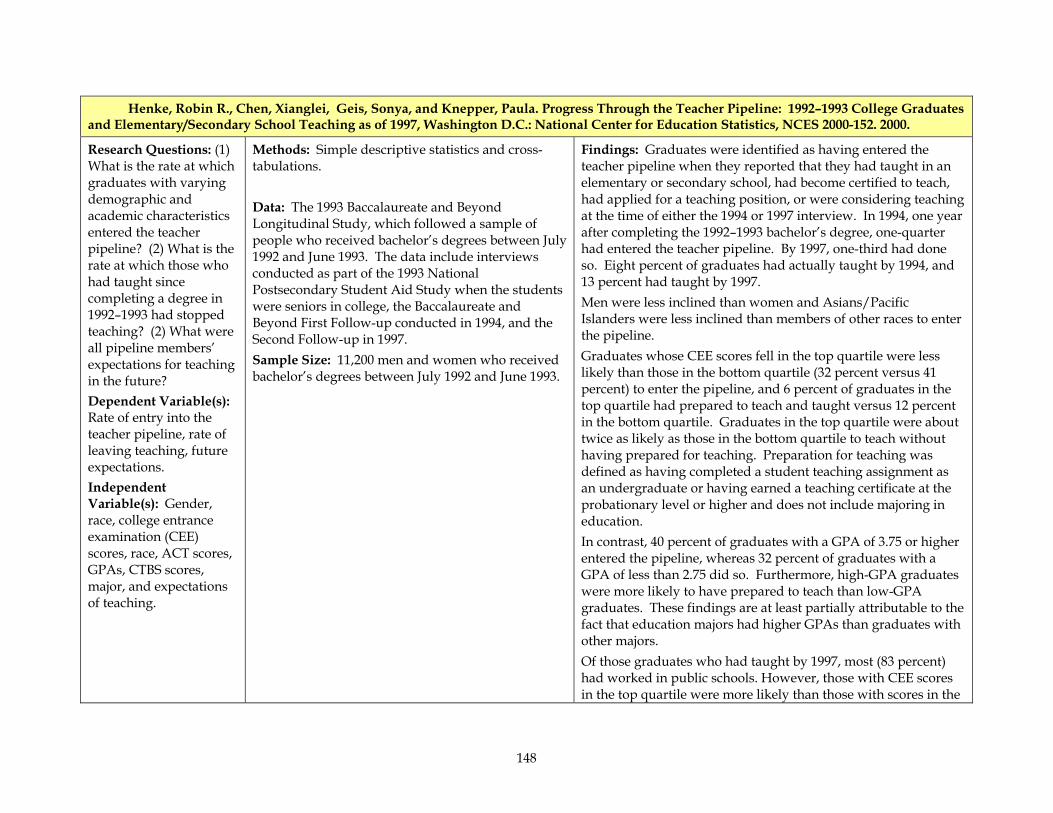
148
Henke, Robin R., Chen, Xianglei, Geis, Sonya, and Knepper, Paula. Progress Through the Teacher Pipeline: 1992–1993 College Graduates and Elementary/Secondary School Teaching as of 1997, Washington D.C.: National Center for Education Statistics, NCES 2000-152. 2000.
Research Questions: (1) What is the rate at which graduates with varying demographic and academic characteristics entered the teacher pipeline? (2) What is the rate at which those who had taught since completing a degree in 1992–1993 had stopped teaching? (2) What were all pipeline members’ expectations for teaching in the future? Dependent Variable(s): Rate of entry into the teacher pipeline, rate of leaving teaching, future expectations. Independent Variable(s): Gender, race, college entrance examination (CEE) scores, race, ACT scores, GPAs, CTBS scores, major, and expectations of teaching.
Methods: Simple descriptive statistics and cross-tabulations. Data: The 1993 Baccalaureate and Beyond Longitudinal Study, which followed a sample of people who received bachelor’s degrees between July 1992 and June 1993. The data include interviews conducted as part of the 1993 National Postsecondary Student Aid Study when the students were seniors in college, the Baccalaureate and Beyond First Follow-up conducted in 1994, and the Second Follow-up in 1997. Sample Size: 11,200 men and women who received bachelor’s degrees between July 1992 and June 1993.
Findings: Graduates were identified as having entered the teacher pipeline when they reported that they had taught in an elementary or secondary school, had become certified to teach, had applied for a teaching position, or were considering teaching at the time of either the 1994 or 1997 interview. In 1994, one year after completing the 1992–1993 bachelor’s degree, one-quarter had entered the teacher pipeline. By 1997, one-third had done so. Eight percent of graduates had actually taught by 1994, and 13 percent had taught by 1997. Men were less inclined than women and Asians/Pacific Islanders were less inclined than members of other races to enter the pipeline. Graduates whose CEE scores fell in the top quartile were less likely than those in the bottom quartile (32 percent versus 41 percent) to enter the pipeline, and 6 percent of graduates in the top quartile had prepared to teach and taught versus 12 percent in the bottom quartile. Graduates in the top quartile were about twice as likely as those in the bottom quartile to teach without having prepared for teaching. Preparation for teaching was defined as having completed a student teaching assignment as an undergraduate or having earned a teaching certificate at the probationary level or higher and does not include majoring in education. In contrast, 40 percent of graduates with a GPA of 3.75 or higher entered the pipeline, whereas 32 percent of graduates with a GPA of less than 2.75 did so. Furthermore, high-GPA graduates were more likely to have prepared to teach than low-GPA graduates. These findings are at least partially attributable to the fact that education majors had higher GPAs than graduates with other majors. Of those graduates who had taught by 1997, most (83 percent) had worked in public schools. However, those with CEE scores in the top quartile were more likely than those with scores in the
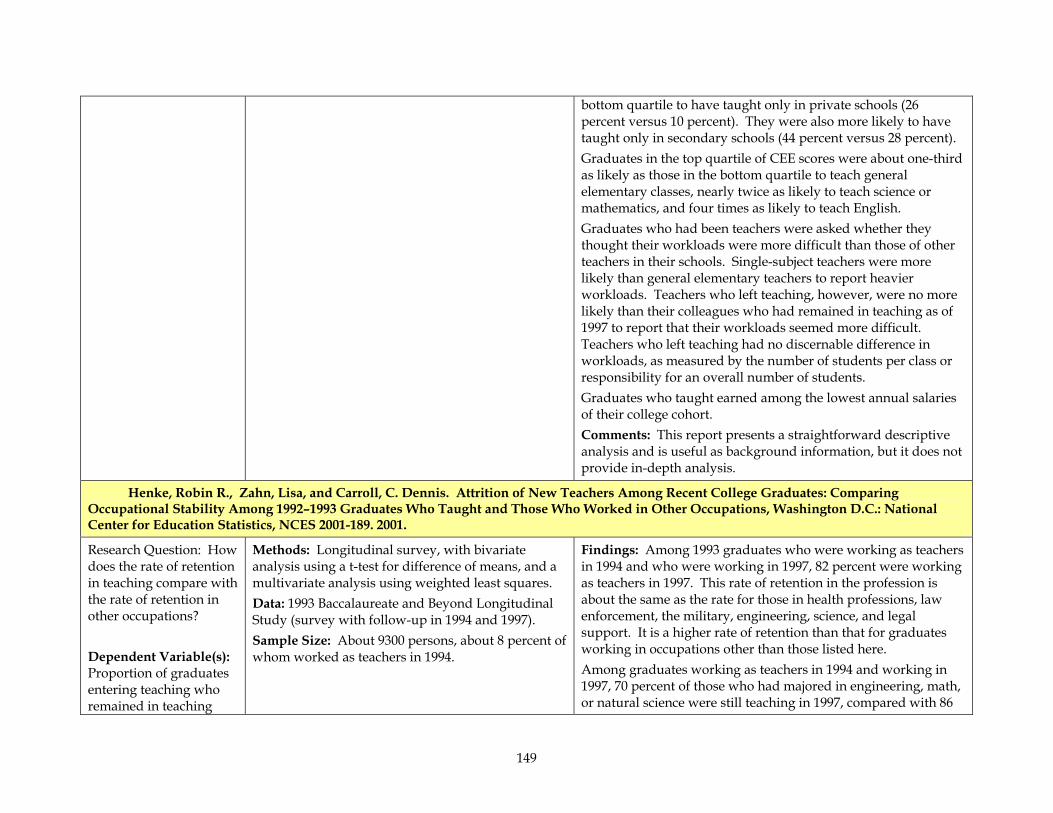
149
bottom quartile to have taught only in private schools (26 percent versus 10 percent). They were also more likely to have taught only in secondary schools (44 percent versus 28 percent). Graduates in the top quartile of CEE scores were about one-third as likely as those in the bottom quartile to teach general elementary classes, nearly twice as likely to teach science or mathematics, and four times as likely to teach English. Graduates who had been teachers were asked whether they thought their workloads were more difficult than those of other teachers in their schools. Single-subject teachers were more likely than general elementary teachers to report heavier workloads. Teachers who left teaching, however, were no more likely than their colleagues who had remained in teaching as of 1997 to report that their workloads seemed more difficult. Teachers who left teaching had no discernable difference in workloads, as measured by the number of students per class or responsibility for an overall number of students. Graduates who taught earned among the lowest annual salaries of their college cohort. Comments: This report presents a straightforward descriptive analysis and is useful as background information, but it does not provide in-depth analysis.
Henke, Robin R., Zahn, Lisa, and Carroll, C. Dennis. Attrition of New Teachers Among Recent College Graduates: Comparing Occupational Stability Among 1992–1993 Graduates Who Taught and Those Who Worked in Other Occupations, Washington D.C.: National Center for Education Statistics, NCES 2001-189. 2001.
Research Question: How does the rate of retention in teaching compare with the rate of retention in other occupations? Dependent Variable(s): Proportion of graduates entering teaching who remained in teaching
Methods: Longitudinal survey, with bivariate analysis using a t-test for difference of means, and a multivariate analysis using weighted least squares. Data: 1993 Baccalaureate and Beyond Longitudinal Study (survey with follow-up in 1994 and 1997). Sample Size: About 9300 persons, about 8 percent of whom worked as teachers in 1994.
Findings: Among 1993 graduates who were working as teachers in 1994 and who were working in 1997, 82 percent were working as teachers in 1997. This rate of retention in the profession is about the same as the rate for those in health professions, law enforcement, the military, engineering, science, and legal support. It is a higher rate of retention than that for graduates working in occupations other than those listed here. Among graduates working as teachers in 1994 and working in 1997, 70 percent of those who had majored in engineering, math, or natural science were still teaching in 1997, compared with 86
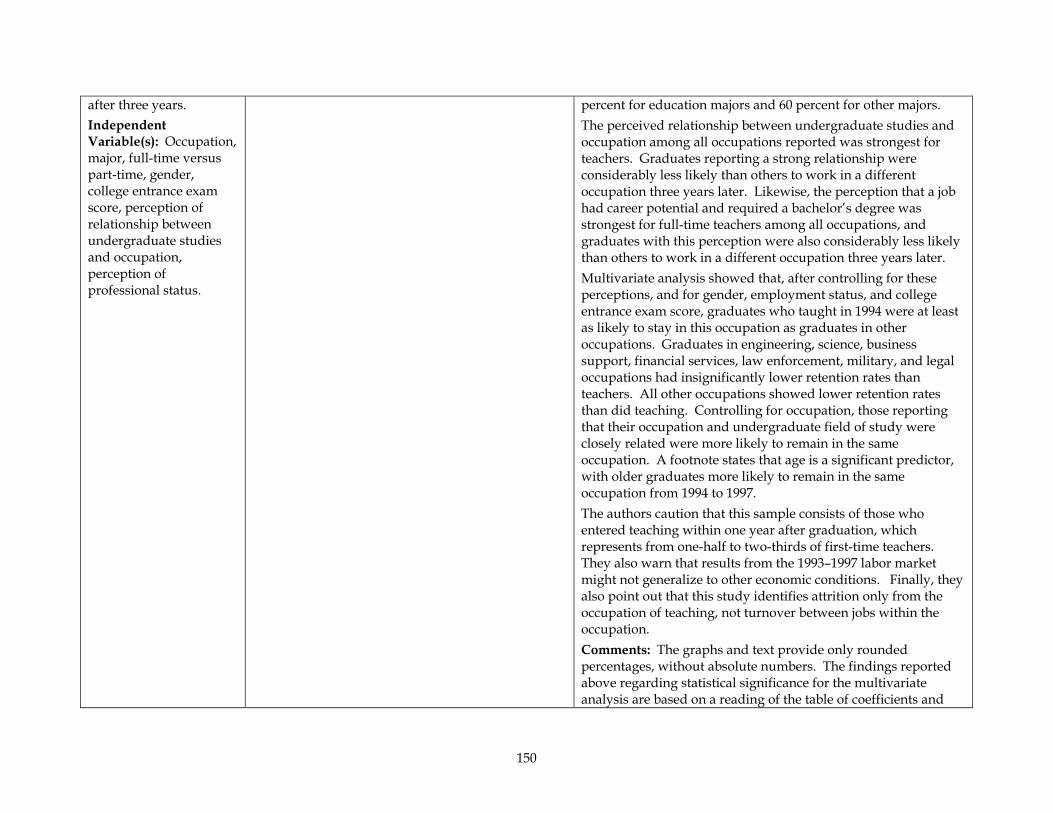
150
after three years. Independent Variable(s): Occupation, major, full-time versus part-time, gender, college entrance exam score, perception of relationship between undergraduate studies and occupation, perception of professional status.
percent for education majors and 60 percent for other majors. The perceived relationship between undergraduate studies and occupation among all occupations reported was strongest for teachers. Graduates reporting a strong relationship were considerably less likely than others to work in a different occupation three years later. Likewise, the perception that a job had career potential and required a bachelor’s degree was strongest for full-time teachers among all occupations, and graduates with this perception were also considerably less likely than others to work in a different occupation three years later. Multivariate analysis showed that, after controlling for these perceptions, and for gender, employment status, and college entrance exam score, graduates who taught in 1994 were at least as likely to stay in this occupation as graduates in other occupations. Graduates in engineering, science, business support, financial services, law enforcement, military, and legal occupations had insignificantly lower retention rates than teachers. All other occupations showed lower retention rates than did teaching. Controlling for occupation, those reporting that their occupation and undergraduate field of study were closely related were more likely to remain in the same occupation. A footnote states that age is a significant predictor, with older graduates more likely to remain in the same occupation from 1994 to 1997. The authors caution that this sample consists of those who entered teaching within one year after graduation, which represents from one-half to two-thirds of first-time teachers. They also warn that results from the 1993–1997 labor market might not generalize to other economic conditions. Finally, they also point out that this study identifies attrition only from the occupation of teaching, not turnover between jobs within the occupation. Comments: The graphs and text provide only rounded percentages, without absolute numbers. The findings reported above regarding statistical significance for the multivariate analysis are based on a reading of the table of coefficients and
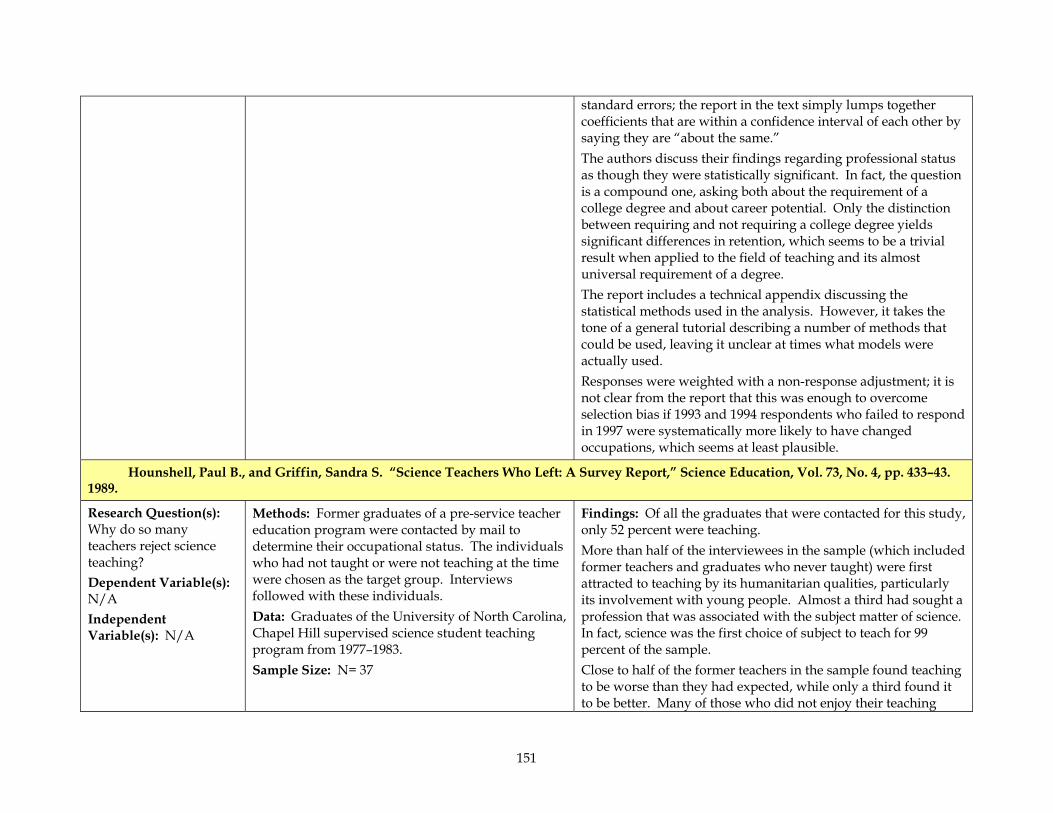
151
standard errors; the report in the text simply lumps together coefficients that are within a confidence interval of each other by saying they are “about the same.” The authors discuss their findings regarding professional status as though they were statistically significant. In fact, the question is a compound one, asking both about the requirement of a college degree and about career potential. Only the distinction between requiring and not requiring a college degree yields significant differences in retention, which seems to be a trivial result when applied to the field of teaching and its almost universal requirement of a degree. The report includes a technical appendix discussing the statistical methods used in the analysis. However, it takes the tone of a general tutorial describing a number of methods that could be used, leaving it unclear at times what models were actually used. Responses were weighted with a non-response adjustment; it is not clear from the report that this was enough to overcome selection bias if 1993 and 1994 respondents who failed to respond in 1997 were systematically more likely to have changed occupations, which seems at least plausible.
Hounshell, Paul B., and Griffin, Sandra S. “Science Teachers Who Left: A Survey Report,” Science Education, Vol. 73, No. 4, pp. 433–43. 1989.
Research Question(s): Why do so many teachers reject science teaching? Dependent Variable(s): N/A Independent Variable(s): N/A
Methods: Former graduates of a pre-service teacher education program were contacted by mail to determine their occupational status. The individuals who had not taught or were not teaching at the time were chosen as the target group. Interviews followed with these individuals. Data: Graduates of the University of North Carolina, Chapel Hill supervised science student teaching program from 1977–1983. Sample Size: N= 37
Findings: Of all the graduates that were contacted for this study, only 52 percent were teaching. More than half of the interviewees in the sample (which included former teachers and graduates who never taught) were first attracted to teaching by its humanitarian qualities, particularly its involvement with young people. Almost a third had sought a profession that was associated with the subject matter of science. In fact, science was the first choice of subject to teach for 99 percent of the sample. Close to half of the former teachers in the sample found teaching to be worse than they had expected, while only a third found it to be better. Many of those who did not enjoy their teaching
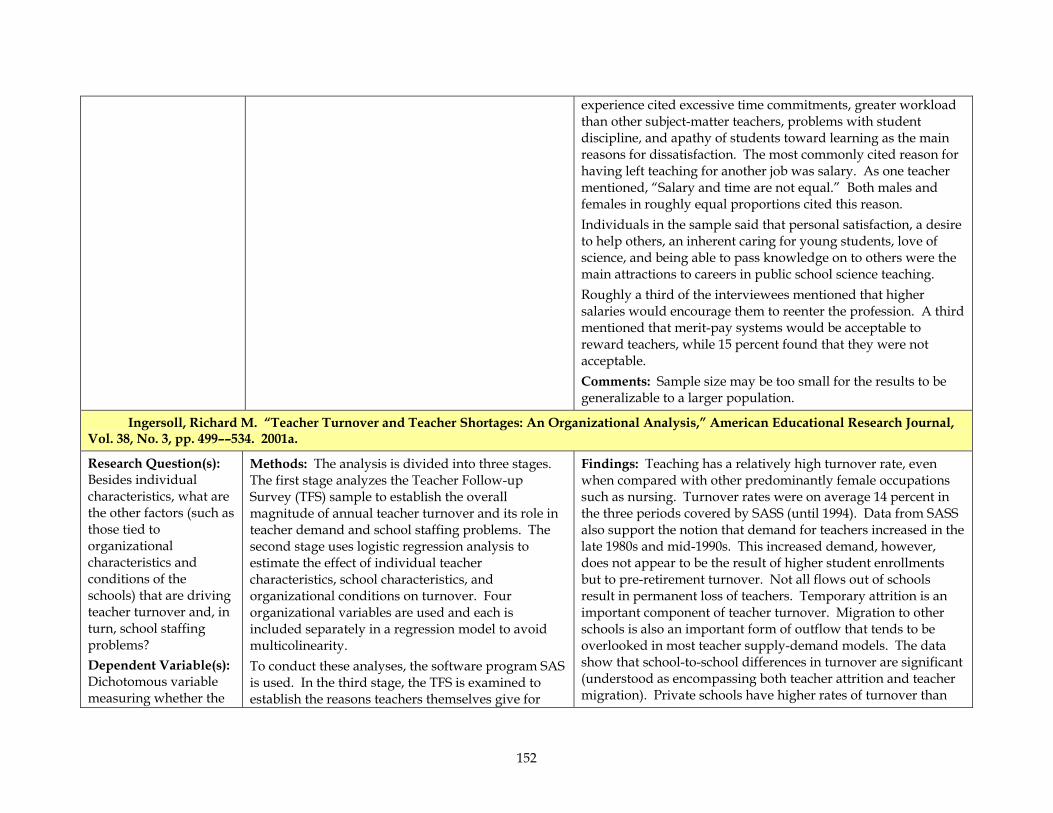
152
experience cited excessive time commitments, greater workload than other subject-matter teachers, problems with student discipline, and apathy of students toward learning as the main reasons for dissatisfaction. The most commonly cited reason for having left teaching for another job was salary. As one teacher mentioned, “Salary and time are not equal.” Both males and females in roughly equal proportions cited this reason. Individuals in the sample said that personal satisfaction, a desire to help others, an inherent caring for young students, love of science, and being able to pass knowledge on to others were the main attractions to careers in public school science teaching. Roughly a third of the interviewees mentioned that higher salaries would encourage them to reenter the profession. A third mentioned that merit-pay systems would be acceptable to reward teachers, while 15 percent found that they were not acceptable. Comments: Sample size may be too small for the results to be generalizable to a larger population.
Ingersoll, Richard M. “Teacher Turnover and Teacher Shortages: An Organizational Analysis,” American Educational Research Journal, Vol. 38, No. 3, pp. 499––534. 2001a.
Research Question(s): Besides individual characteristics, what are the other factors (such as those tied to organizational characteristics and conditions of the schools) that are driving teacher turnover and, in turn, school staffing problems? Dependent Variable(s): Dichotomous variable measuring whether the
Methods: The analysis is divided into three stages. The first stage analyzes the Teacher Follow-up Survey (TFS) sample to establish the overall magnitude of annual teacher turnover and its role in teacher demand and school staffing problems. The second stage uses logistic regression analysis to estimate the effect of individual teacher characteristics, school characteristics, and organizational conditions on turnover. Four organizational variables are used and each is included separately in a regression model to avoid multicolinearity. To conduct these analyses, the software program SAS is used. In the third stage, the TFS is examined to establish the reasons teachers themselves give for
Findings: Teaching has a relatively high turnover rate, even when compared with other predominantly female occupations such as nursing. Turnover rates were on average 14 percent in the three periods covered by SASS (until 1994). Data from SASS also support the notion that demand for teachers increased in the late 1980s and mid-1990s. This increased demand, however, does not appear to be the result of higher student enrollments but to pre-retirement turnover. Not all flows out of schools result in permanent loss of teachers. Temporary attrition is an important component of teacher turnover. Migration to other schools is also an important form of outflow that tends to be overlooked in most teacher supply-demand models. The data show that school-to-school differences in turnover are significant (understood as encompassing both teacher attrition and teacher migration). Private schools have higher rates of turnover than
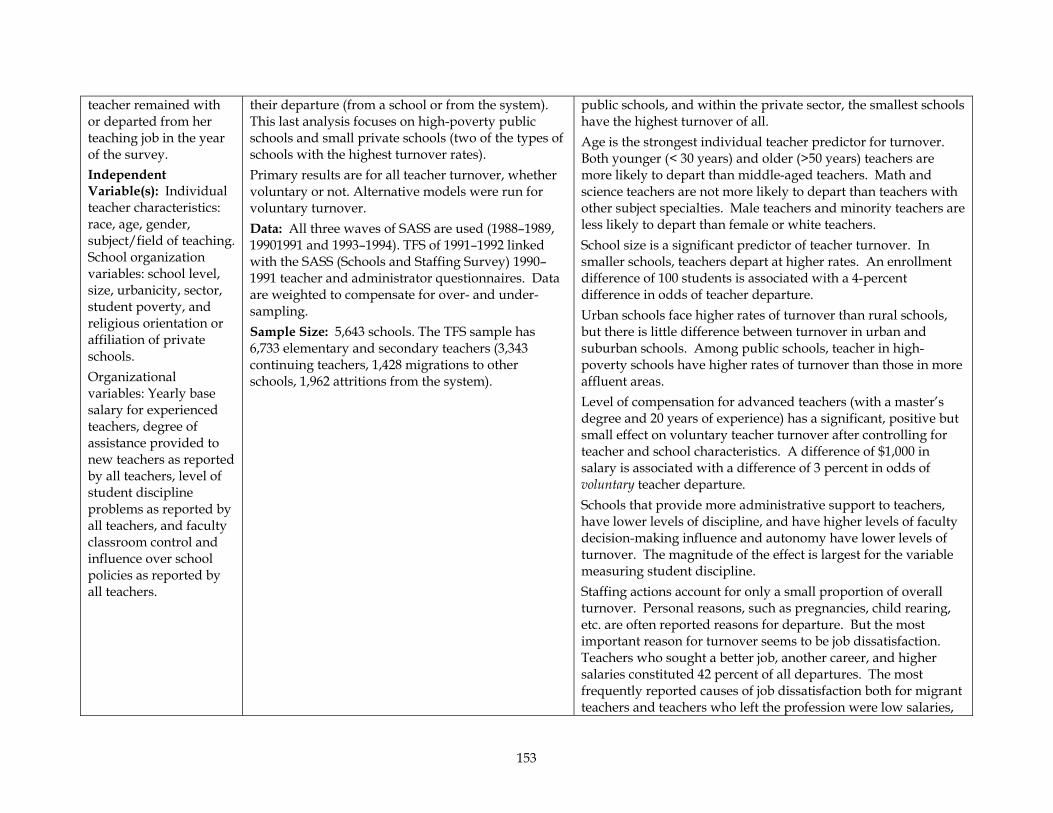
153
teacher remained with or departed from her teaching job in the year of the survey. Independent Variable(s): Individual teacher characteristics: race, age, gender, subject/field of teaching. School organization variables: school level, size, urbanicity, sector, student poverty, and religious orientation or affiliation of private schools. Organizational variables: Yearly base salary for experienced teachers, degree of assistance provided to new teachers as reported by all teachers, level of student discipline problems as reported by all teachers, and faculty classroom control and influence over school policies as reported by all teachers.
their departure (from a school or from the system). This last analysis focuses on high-poverty public schools and small private schools (two of the types of schools with the highest turnover rates). Primary results are for all teacher turnover, whether voluntary or not. Alternative models were run for voluntary turnover. Data: All three waves of SASS are used (1988–1989, 19901991 and 1993–1994). TFS of 1991–1992 linked with the SASS (Schools and Staffing Survey) 1990–1991 teacher and administrator questionnaires. Data are weighted to compensate for over- and under-sampling. Sample Size: 5,643 schools. The TFS sample has 6,733 elementary and secondary teachers (3,343 continuing teachers, 1,428 migrations to other schools, 1,962 attritions from the system).
public schools, and within the private sector, the smallest schools have the highest turnover of all. Age is the strongest individual teacher predictor for turnover. Both younger (< 30 years) and older (>50 years) teachers are more likely to depart than middle-aged teachers. Math and science teachers are not more likely to depart than teachers with other subject specialties. Male teachers and minority teachers are less likely to depart than female or white teachers. School size is a significant predictor of teacher turnover. In smaller schools, teachers depart at higher rates. An enrollment difference of 100 students is associated with a 4-percent difference in odds of teacher departure. Urban schools face higher rates of turnover than rural schools, but there is little difference between turnover in urban and suburban schools. Among public schools, teacher in high-poverty schools have higher rates of turnover than those in more affluent areas. Level of compensation for advanced teachers (with a master’s degree and 20 years of experience) has a significant, positive but small effect on voluntary teacher turnover after controlling for teacher and school characteristics. A difference of $1,000 in salary is associated with a difference of 3 percent in odds of voluntary teacher departure. Schools that provide more administrative support to teachers, have lower levels of discipline, and have higher levels of faculty decision-making influence and autonomy have lower levels of turnover. The magnitude of the effect is largest for the variable measuring student discipline. Staffing actions account for only a small proportion of overall turnover. Personal reasons, such as pregnancies, child rearing, etc. are often reported reasons for departure. But the most important reason for turnover seems to be job dissatisfaction. Teachers who sought a better job, another career, and higher salaries constituted 42 percent of all departures. The most frequently reported causes of job dissatisfaction both for migrant teachers and teachers who left the profession were low salaries,
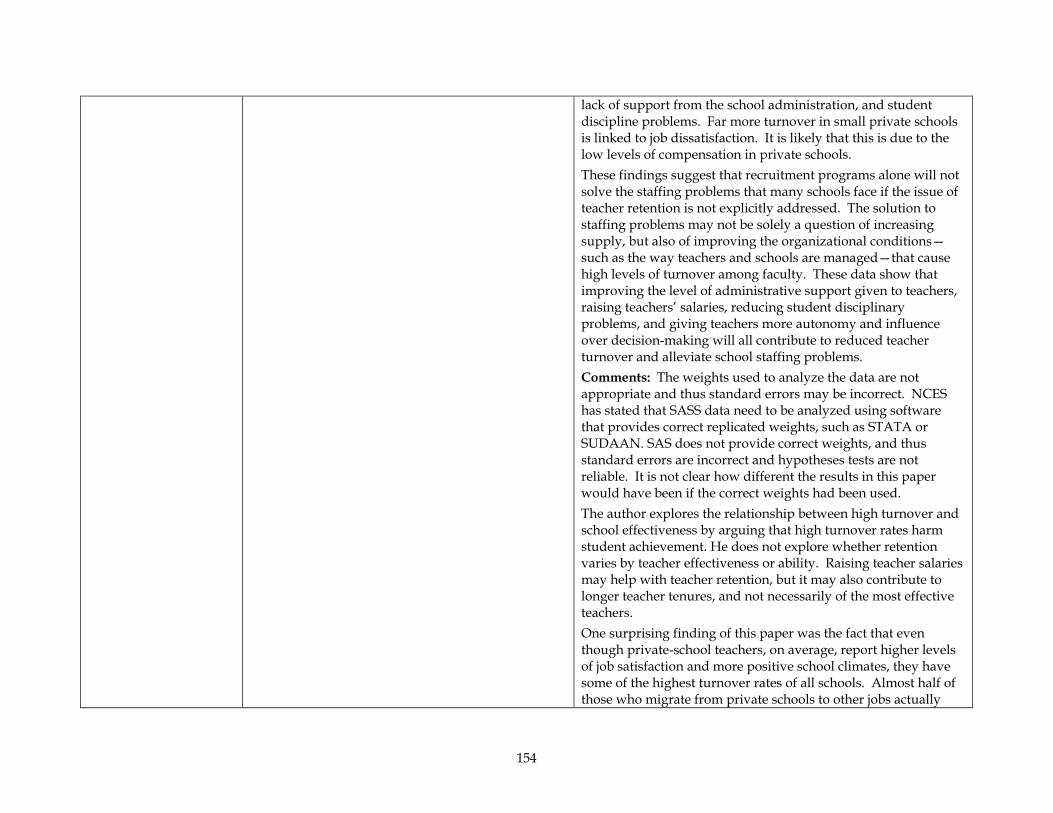
154
lack of support from the school administration, and student discipline problems. Far more turnover in small private schools is linked to job dissatisfaction. It is likely that this is due to the low levels of compensation in private schools. These findings suggest that recruitment programs alone will not solve the staffing problems that many schools face if the issue of teacher retention is not explicitly addressed. The solution to staffing problems may not be solely a question of increasing supply, but also of improving the organizational conditions—such as the way teachers and schools are managed—that cause high levels of turnover among faculty. These data show that improving the level of administrative support given to teachers, raising teachers’ salaries, reducing student disciplinary problems, and giving teachers more autonomy and influence over decision-making will all contribute to reduced teacher turnover and alleviate school staffing problems. Comments: The weights used to analyze the data are not appropriate and thus standard errors may be incorrect. NCES has stated that SASS data need to be analyzed using software that provides correct replicated weights, such as STATA or SUDAAN. SAS does not provide correct weights, and thus standard errors are incorrect and hypotheses tests are not reliable. It is not clear how different the results in this paper would have been if the correct weights had been used. The author explores the relationship between high turnover and school effectiveness by arguing that high turnover rates harm student achievement. He does not explore whether retention varies by teacher effectiveness or ability. Raising teacher salaries may help with teacher retention, but it may also contribute to longer teacher tenures, and not necessarily of the most effective teachers. One surprising finding of this paper was the fact that even though private-school teachers, on average, report higher levels of job satisfaction and more positive school climates, they have some of the highest turnover rates of all schools. Almost half of those who migrate from private schools to other jobs actually
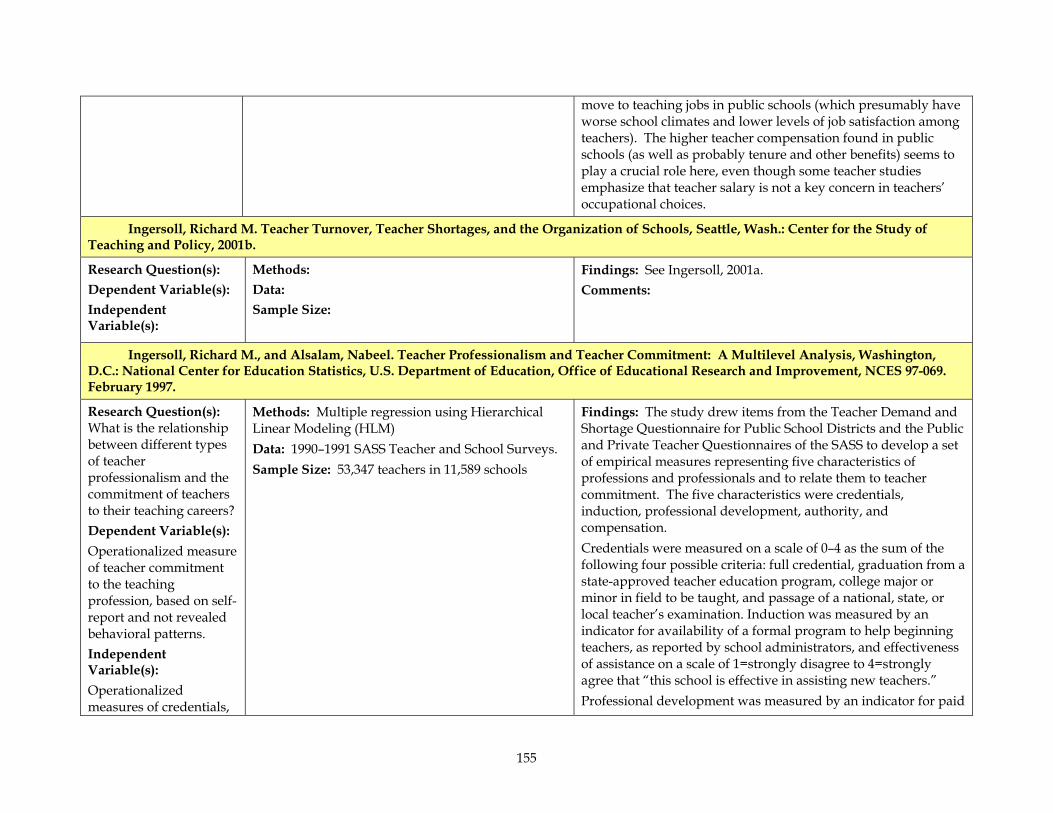
155
move to teaching jobs in public schools (which presumably have worse school climates and lower levels of job satisfaction among teachers). The higher teacher compensation found in public schools (as well as probably tenure and other benefits) seems to play a crucial role here, even though some teacher studies emphasize that teacher salary is not a key concern in teachers’ occupational choices.
Ingersoll, Richard M. Teacher Turnover, Teacher Shortages, and the Organization of Schools, Seattle, Wash.: Center for the Study of Teaching and Policy, 2001b.
Research Question(s): Dependent Variable(s): Independent Variable(s):
Methods: Data: Sample Size:
Findings: See Ingersoll, 2001a. Comments:
Ingersoll, Richard M., and Alsalam, Nabeel. Teacher Professionalism and Teacher Commitment: A Multilevel Analysis, Washington, D.C.: National Center for Education Statistics, U.S. Department of Education, Office of Educational Research and Improvement, NCES 97-069. February 1997.
Research Question(s): What is the relationship between different types of teacher professionalism and the commitment of teachers to their teaching careers? Dependent Variable(s): Operationalized measure of teacher commitment to the teaching profession, based on self-report and not revealed behavioral patterns. Independent Variable(s): Operationalized measures of credentials,
Methods: Multiple regression using Hierarchical Linear Modeling (HLM) Data: 1990–1991 SASS Teacher and School Surveys. Sample Size: 53,347 teachers in 11,589 schools
Findings: The study drew items from the Teacher Demand and Shortage Questionnaire for Public School Districts and the Public and Private Teacher Questionnaires of the SASS to develop a set of empirical measures representing five characteristics of professions and professionals and to relate them to teacher commitment. The five characteristics were credentials, induction, professional development, authority, and compensation. Credentials were measured on a scale of 0–4 as the sum of the following four possible criteria: full credential, graduation from a state-approved teacher education program, college major or minor in field to be taught, and passage of a national, state, or local teacher’s examination. Induction was measured by an indicator for availability of a formal program to help beginning teachers, as reported by school administrators, and effectiveness of assistance on a scale of 1=strongly disagree to 4=strongly agree that “this school is effective in assisting new teachers.” Professional development was measured by an indicator for paid
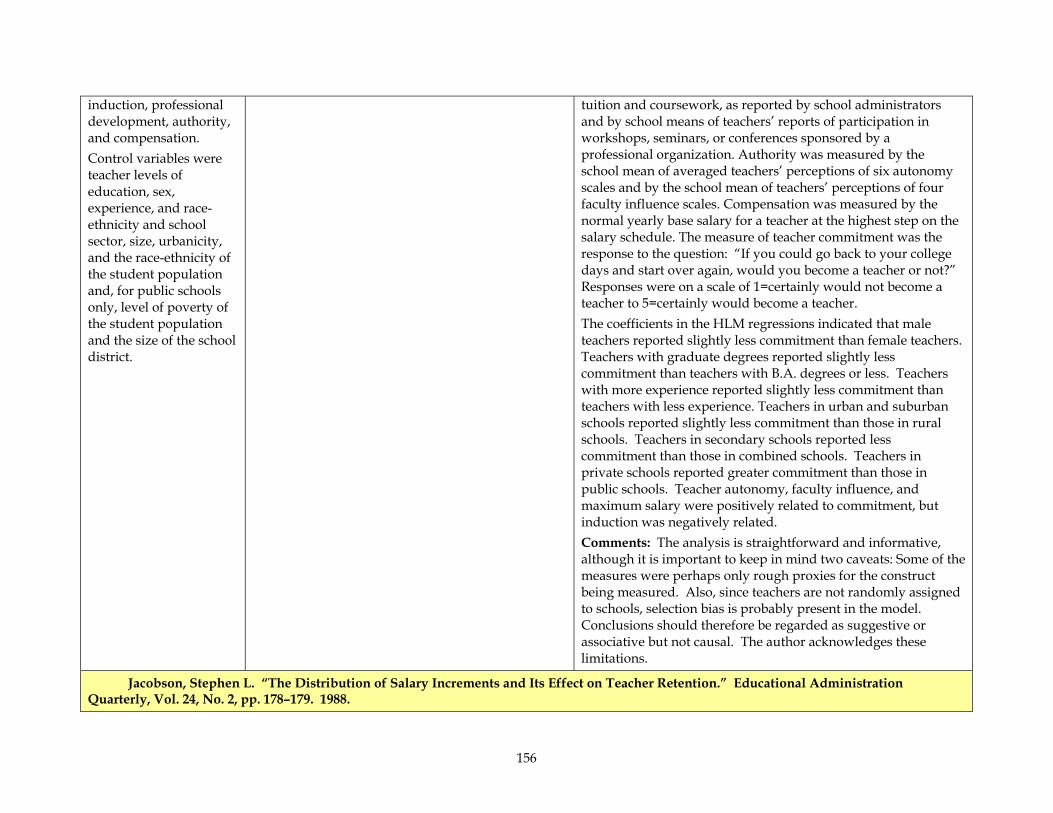
156
induction, professional development, authority, and compensation. Control variables were teacher levels of education, sex, experience, and race-ethnicity and school sector, size, urbanicity, and the race-ethnicity of the student population and, for public schools only, level of poverty of the student population and the size of the school district.
tuition and coursework, as reported by school administrators and by school means of teachers’ reports of participation in workshops, seminars, or conferences sponsored by a professional organization. Authority was measured by the school mean of averaged teachers’ perceptions of six autonomy scales and by the school mean of teachers’ perceptions of four faculty influence scales. Compensation was measured by the normal yearly base salary for a teacher at the highest step on the salary schedule. The measure of teacher commitment was the response to the question: “If you could go back to your college days and start over again, would you become a teacher or not?” Responses were on a scale of 1=certainly would not become a teacher to 5=certainly would become a teacher. The coefficients in the HLM regressions indicated that male teachers reported slightly less commitment than female teachers. Teachers with graduate degrees reported slightly less commitment than teachers with B.A. degrees or less. Teachers with more experience reported slightly less commitment than teachers with less experience. Teachers in urban and suburban schools reported slightly less commitment than those in rural schools. Teachers in secondary schools reported less commitment than those in combined schools. Teachers in private schools reported greater commitment than those in public schools. Teacher autonomy, faculty influence, and maximum salary were positively related to commitment, but induction was negatively related. Comments: The analysis is straightforward and informative, although it is important to keep in mind two caveats: Some of the measures were perhaps only rough proxies for the construct being measured. Also, since teachers are not randomly assigned to schools, selection bias is probably present in the model. Conclusions should therefore be regarded as suggestive or associative but not causal. The author acknowledges these limitations.
Jacobson, Stephen L. “The Distribution of Salary Increments and Its Effect on Teacher Retention.” Educational Administration Quarterly, Vol. 24, No. 2, pp. 178–179. 1988.
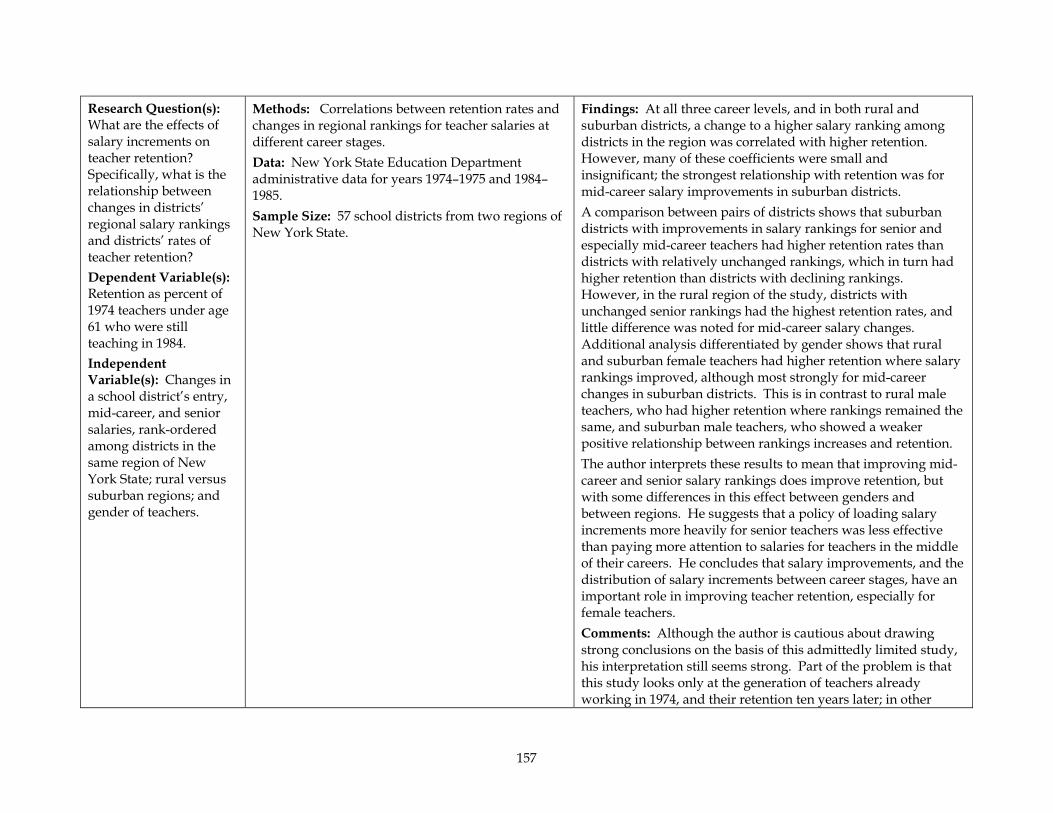
157
Research Question(s): What are the effects of salary increments on teacher retention? Specifically, what is the relationship between changes in districts’ regional salary rankings and districts’ rates of teacher retention? Dependent Variable(s): Retention as percent of 1974 teachers under age 61 who were still teaching in 1984. Independent Variable(s): Changes in a school district’s entry, mid-career, and senior salaries, rank-ordered among districts in the same region of New York State; rural versus suburban regions; and gender of teachers.
Methods: Correlations between retention rates and changes in regional rankings for teacher salaries at different career stages. Data: New York State Education Department administrative data for years 1974–1975 and 1984–1985. Sample Size: 57 school districts from two regions of New York State.
Findings: At all three career levels, and in both rural and suburban districts, a change to a higher salary ranking among districts in the region was correlated with higher retention. However, many of these coefficients were small and insignificant; the strongest relationship with retention was for mid-career salary improvements in suburban districts. A comparison between pairs of districts shows that suburban districts with improvements in salary rankings for senior and especially mid-career teachers had higher retention rates than districts with relatively unchanged rankings, which in turn had higher retention than districts with declining rankings. However, in the rural region of the study, districts with unchanged senior rankings had the highest retention rates, and little difference was noted for mid-career salary changes. Additional analysis differentiated by gender shows that rural and suburban female teachers had higher retention where salary rankings improved, although most strongly for mid-career changes in suburban districts. This is in contrast to rural male teachers, who had higher retention where rankings remained the same, and suburban male teachers, who showed a weaker positive relationship between rankings increases and retention. The author interprets these results to mean that improving mid-career and senior salary rankings does improve retention, but with some differences in this effect between genders and between regions. He suggests that a policy of loading salary increments more heavily for senior teachers was less effective than paying more attention to salaries for teachers in the middle of their careers. He concludes that salary improvements, and the distribution of salary increments between career stages, have an important role in improving teacher retention, especially for female teachers. Comments: Although the author is cautious about drawing strong conclusions on the basis of this admittedly limited study, his interpretation still seems strong. Part of the problem is that this study looks only at the generation of teachers already working in 1974, and their retention ten years later; in other

158
words, it ignores differences in prior career length for those composing that group, differences in duration of retention for those who were not still working in 1984, and effects on the retention of new teachers beginning their careers after 1974. The conclusion discusses the changing hazard rates over a typical teacher career, with the probability of turnover being highest in the first five to seven years, but the study design looks only at ten-year hazards and does not consider censoring issues. This analysis reports but largely ignores entry-level salary rankings, since those are presumed to have no effect on retention of teachers already working. However, in the rural districts, the coefficient between ranking changes and retention is larger for entry salaries than for mid-career and senior salaries. It would seem that an analysis of long-term retention using such correlations for mid-career and senior teachers should at least account for possible confounds revealed by that positive correlation for entry-level teachers.
Johnson, Susan M., and Birkeland, Sarah E. “Pursuing a ‘Sense of Success’: New Teachers Explain Their Career Decisions,” American Educational Research Journal, Vol. 40, No. 3, pp. 581–617. 2003.
Research Question(s): What are beginning teachers’ concerns with the teaching profession, and what causes them to leave the profession, move to another school or stay in their current position? Dependent Variable(s): N/A Independent Variable(s): N/A
Methods: Descriptive analysis of interview data Data: Interviews were collected with first- and second-year teachers in a wide range of Massachusetts public schools. The sample of teachers was not random, but was chosen to maximize diversity on a wide range of measures: urban and suburban schools of all grade levels, large and small schools, graduates of private college and university teacher education programs, public university teacher education programs, charter schools, first-career and mid-career entrants, and the 1999 list of recipients of the $20,000 signing bonus program. Selected teachers were interviewed twice. The first round of interviews was conducted in person in 1999. The second round of interviews was done either in person or by phone in the summer of 2000. A final follow-up round of interviews was
Findings: Three years into their study, 22 percent of the original sample (11 teachers) were classified as Leavers, leaving the profession altogether. More than half of those who left did so after the first year of teaching. Another 22 percent of the original sample were classified as Movers, i.e., had changed schools. Seventy-two percent of the Movers had moved voluntarily, and 18 percent had done so involuntarily. Fifty-six percent of the original sample was classified as Stayers (28 teachers), still working in the same school where they started. More than half of these were classified as “Unsettled Stayers,” i.e., they were not satisfied in their current position. In general, Leavers either saw their teaching career as a short-term occupation, hence had always intended to enter teaching for a brief period of time before moving on to another career, or had not experienced any success in the classroom and experienced great frustration or failure. Teacher pay and prestige did figure into their decision to move, but were not the
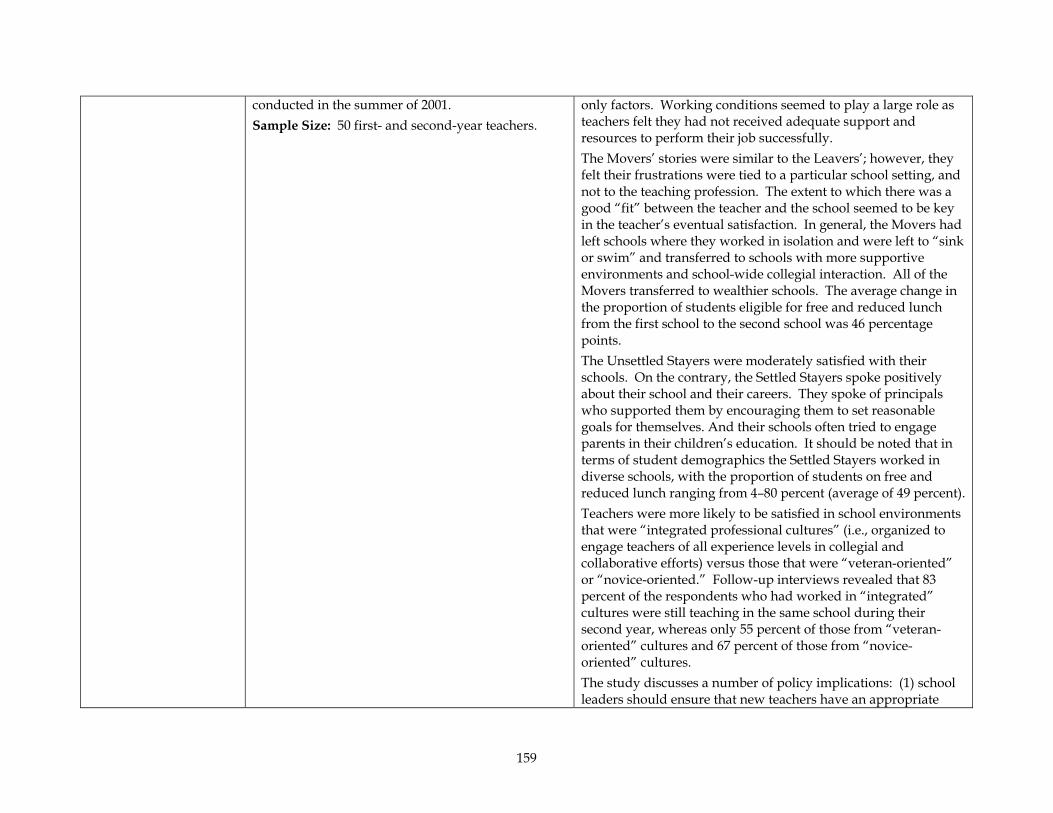
159
conducted in the summer of 2001. Sample Size: 50 first- and second-year teachers.
only factors. Working conditions seemed to play a large role as teachers felt they had not received adequate support and resources to perform their job successfully. The Movers’ stories were similar to the Leavers’; however, they felt their frustrations were tied to a particular school setting, and not to the teaching profession. The extent to which there was a good “fit” between the teacher and the school seemed to be key in the teacher’s eventual satisfaction. In general, the Movers had left schools where they worked in isolation and were left to “sink or swim” and transferred to schools with more supportive environments and school-wide collegial interaction. All of the Movers transferred to wealthier schools. The average change in the proportion of students eligible for free and reduced lunch from the first school to the second school was 46 percentage points. The Unsettled Stayers were moderately satisfied with their schools. On the contrary, the Settled Stayers spoke positively about their school and their careers. They spoke of principals who supported them by encouraging them to set reasonable goals for themselves. And their schools often tried to engage parents in their children’s education. It should be noted that in terms of student demographics the Settled Stayers worked in diverse schools, with the proportion of students on free and reduced lunch ranging from 4–80 percent (average of 49 percent). Teachers were more likely to be satisfied in school environments that were “integrated professional cultures” (i.e., organized to engage teachers of all experience levels in collegial and collaborative efforts) versus those that were “veteran-oriented” or “novice-oriented.” Follow-up interviews revealed that 83 percent of the respondents who had worked in “integrated” cultures were still teaching in the same school during their second year, whereas only 55 percent of those from “veteran-oriented” cultures and 67 percent of those from “novice-oriented” cultures. The study discusses a number of policy implications: (1) school leaders should ensure that new teachers have an appropriate
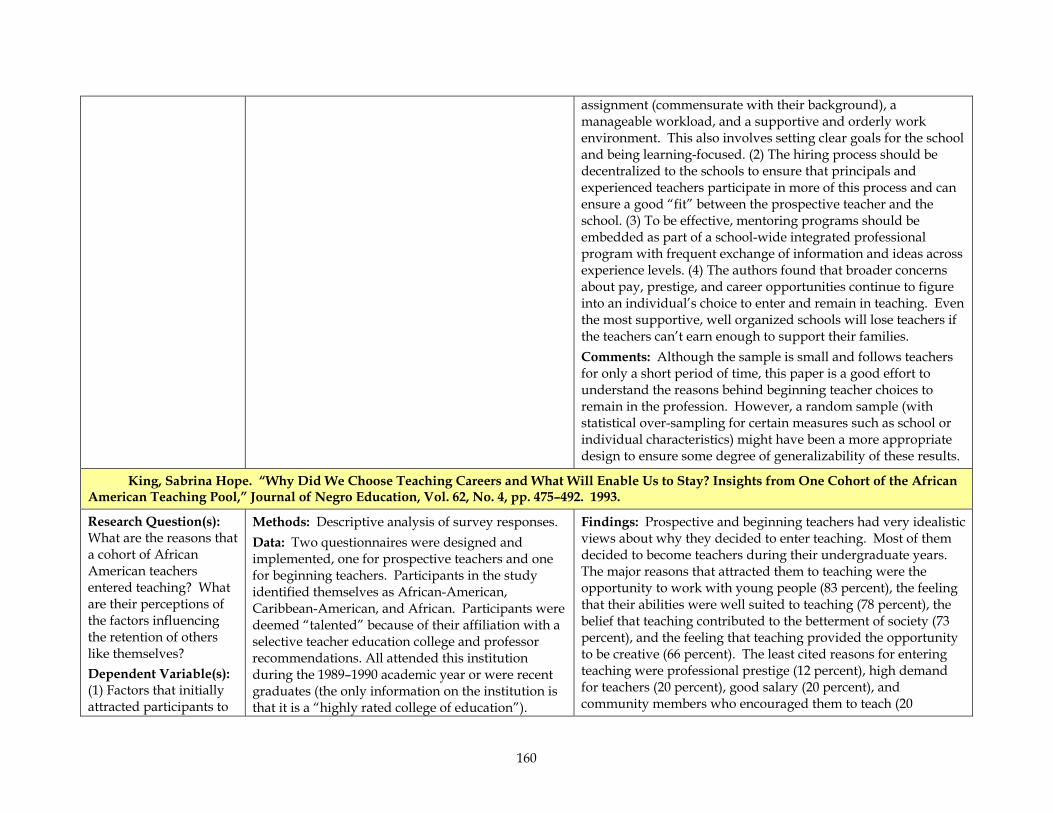
160
assignment (commensurate with their background), a manageable workload, and a supportive and orderly work environment. This also involves setting clear goals for the school and being learning-focused. (2) The hiring process should be decentralized to the schools to ensure that principals and experienced teachers participate in more of this process and can ensure a good “fit” between the prospective teacher and the school. (3) To be effective, mentoring programs should be embedded as part of a school-wide integrated professional program with frequent exchange of information and ideas across experience levels. (4) The authors found that broader concerns about pay, prestige, and career opportunities continue to figure into an individual’s choice to enter and remain in teaching. Even the most supportive, well organized schools will lose teachers if the teachers can’t earn enough to support their families. Comments: Although the sample is small and follows teachers for only a short period of time, this paper is a good effort to understand the reasons behind beginning teacher choices to remain in the profession. However, a random sample (with statistical over-sampling for certain measures such as school or individual characteristics) might have been a more appropriate design to ensure some degree of generalizability of these results.
King, Sabrina Hope. “Why Did We Choose Teaching Careers and What Will Enable Us to Stay? Insights from One Cohort of the African American Teaching Pool,” Journal of Negro Education, Vol. 62, No. 4, pp. 475–492. 1993.
Research Question(s): What are the reasons that a cohort of African American teachers entered teaching? What are their perceptions of the factors influencing the retention of others like themselves? Dependent Variable(s): (1) Factors that initially attracted participants to
Methods: Descriptive analysis of survey responses. Data: Two questionnaires were designed and implemented, one for prospective teachers and one for beginning teachers. Participants in the study identified themselves as African-American, Caribbean-American, and African. Participants were deemed “talented” because of their affiliation with a selective teacher education college and professor recommendations. All attended this institution during the 1989–1990 academic year or were recent graduates (the only information on the institution is that it is a “highly rated college of education”).
Findings: Prospective and beginning teachers had very idealistic views about why they decided to enter teaching. Most of them decided to become teachers during their undergraduate years. The major reasons that attracted them to teaching were the opportunity to work with young people (83 percent), the feeling that their abilities were well suited to teaching (78 percent), the belief that teaching contributed to the betterment of society (73 percent), and the feeling that teaching provided the opportunity to be creative (66 percent). The least cited reasons for entering teaching were professional prestige (12 percent), high demand for teachers (20 percent), good salary (20 percent), and community members who encouraged them to teach (20

161
teaching; (2) individuals/factors that encouraged/discouraged participants’ entry into teaching. Independent Variable(s): (1) Opportunity to work with young people; abilities are well suited to teaching; contributes to betterment of society; opportunity to be creative; opportunity to work with students of diverse backgrounds; intellectual challenge; good vacation time; interest in subject matter field; good working hours; opportunity to have control over one’s own work; another whom I respect encouraged me to teach; job security; good job to combine with being a parent; job not limited to specific locality; community members encouraged me to teach; good salary; high demand for teachers; professional prestige; and other. (2) Individuals: mother; other relatives; college
Participants’ ages range from 22–50. Sample Size: N=41, including 14 prospective teachers, 26 beginning teachers, and one former beginning teacher now in law school.
percent). There were some interesting differences when comparing the opinions of prospective and beginning teachers. Mainly, prospective teachers seem to be much more idealistic than teachers already working in the field. For example, no prospective teacher cited salary as a reason to enter teaching, while 30 percent of the beginning teachers responded that this was an important consideration. They also cited good vacation time (59 percent versus 43 percent), good working hours (52 percent versus 43 percent), and job security (37 percent versus 29 percent) much more frequently than prospective teachers did. Males were more attracted than females by salary considerations (43 percent versus 15 percent), by professional prestige (29 percent versus 9 percent), and by the prospect of having control over their own work (57 percent versus 32 percent). By contrast, women were much more attracted than males by the perception that teaching was a good occupation to combine with being a parent (35 percent to 0 percent), good vacation time (56 percent versus 43 percent), and because the job was not restricted to a specific locality (27 percent versus 14 percent). Among the individuals who most encouraged them to enter teaching, the most frequently cited were the participants’ mothers, other relatives, college teachers, siblings, college peers, and colleagues. The most encouraging factors were the lack of role models for youth, the need for minority teachers, and the poor conditions of minority communities. When asked about the reasons why they thought minorities were not choosing to teach, lack of prestige and lack of salary were the most frequently cited reasons. This is interesting given that the respondents did not give salary or prestige as reasons for having entered teaching. They also felt that their peers could be deterred by poor working conditions in urban schools, where most minorities expected to obtain teaching positions. When asked about factors that they thought would encourage minorities to enter the profession, the respondents suggested financial incentives, the development of teacher recruitment

162
teachers; siblings; college peers; colleagues; father; students; elementary teachers; secondary teachers; high school peers; spouse; and children. Factors: need for minority teachers; lack of role models for youth; poor conditions of minorities; interest in service occupations; previous jobs held; the media; and other.
programs for minorities, more prestige, and improved working conditions. Comments: Ninety-five percent and 100 percent of respondents cited salary increases and better working conditions, respectively, as important reform policies that could be successful in recruiting minority teachers. Lack of good salary comes up as frequently cited reasons for why minorities are not entering teaching. Yet salary is not deemed by the respondents to have been a factor in their own decision. Perhaps there is an idealism that respondents perceive to be “expected” of them when answering such surveys (or is only present when teachers are still students), which may underestimate the true effect that salary and other practical job matters (such as vacation time, working conditions, etc.) have on individuals’ decisions to become teachers. The author does not provide any statistical tests for the differences between men and women or between prospective and beginning teachers.
Kirby, Sheila Nataraj, Berends, Mark, and Naftel, Scott. “Supply and Demand of Minority Teachers in Texas: Problems and Prospects,” Educational Evaluation and Policy Analysis, Vol. 21, No. 1, pp. 47–66. 1999.
Research Question(s): What is the demand and supply of minority teachers in Texas? Dependent Variable(s): Time to attrition of teacher. Independent Variable(s): Teacher race/ethnicity, gender, age at entry into teaching, degree, primary teaching assignment, district risk category (based on percentage of
Methods: Kaplan-Meier nonparametric estimation, Cox proportional hazards model with multivariate regression (descriptive). Data: Longitudinal administrative data on public school teachers in Texas (1980–1996). Sample Size: 98,951 teachers.
Findings: The importance of continuing teachers as a source of the teaching workforce in Texas has increased over time, from 85 percent in 1980–1981 to 89 percent in 1995–1996. Teachers who return after a spell away from teaching have declined in importance as a source of new hires. The importance of new teachers as a source of supply has increased from a third of new hires in 1980–1981 to over half of new hires in 1995–1996. The average age of new teachers has increased from 27.7 to 31 years. In 1995–1996, minorities represented 26 percent of new teacher hires compared with 23 percent of all teachers, with Latino teachers accounting for 18 percent of new hires versus 12 percent in 1988–1989. The average high-risk district had 5.6 percent of teachers with non-certified permits versus 3.4 percent in the average low-risk district; among new teachers, 8.5 percent in high-risk districts had no degrees compared with 2.4 percent in low-risk districts. Regarding attrition, about 16 percent of teachers entering
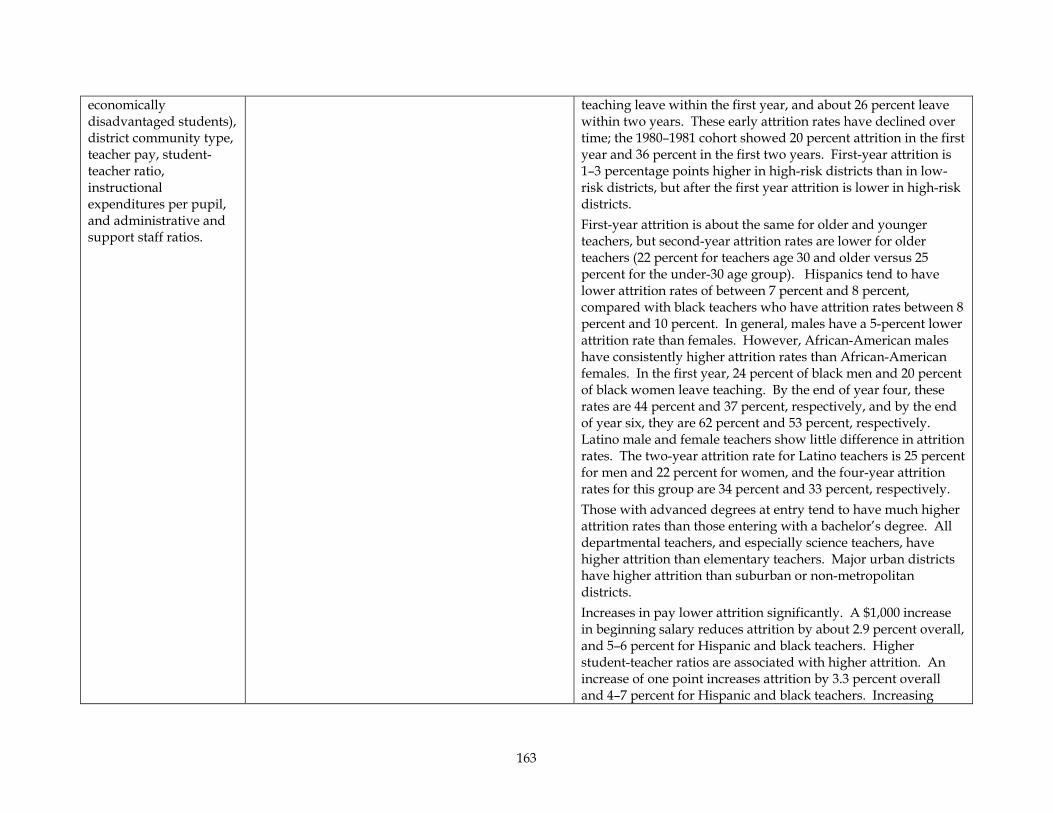
163
economically disadvantaged students), district community type, teacher pay, student-teacher ratio, instructional expenditures per pupil, and administrative and support staff ratios.
teaching leave within the first year, and about 26 percent leave within two years. These early attrition rates have declined over time; the 1980–1981 cohort showed 20 percent attrition in the first year and 36 percent in the first two years. First-year attrition is 1–3 percentage points higher in high-risk districts than in low-risk districts, but after the first year attrition is lower in high-risk districts. First-year attrition is about the same for older and younger teachers, but second-year attrition rates are lower for older teachers (22 percent for teachers age 30 and older versus 25 percent for the under-30 age group). Hispanics tend to have lower attrition rates of between 7 percent and 8 percent, compared with black teachers who have attrition rates between 8 percent and 10 percent. In general, males have a 5-percent lower attrition rate than females. However, African-American males have consistently higher attrition rates than African-American females. In the first year, 24 percent of black men and 20 percent of black women leave teaching. By the end of year four, these rates are 44 percent and 37 percent, respectively, and by the end of year six, they are 62 percent and 53 percent, respectively. Latino male and female teachers show little difference in attrition rates. The two-year attrition rate for Latino teachers is 25 percent for men and 22 percent for women, and the four-year attrition rates for this group are 34 percent and 33 percent, respectively. Those with advanced degrees at entry tend to have much higher attrition rates than those entering with a bachelor’s degree. All departmental teachers, and especially science teachers, have higher attrition than elementary teachers. Major urban districts have higher attrition than suburban or non-metropolitan districts. Increases in pay lower attrition significantly. A $1,000 increase in beginning salary reduces attrition by about 2.9 percent overall, and 5–6 percent for Hispanic and black teachers. Higher student-teacher ratios are associated with higher attrition. An increase of one point increases attrition by 3.3 percent overall and 4–7 percent for Hispanic and black teachers. Increasing
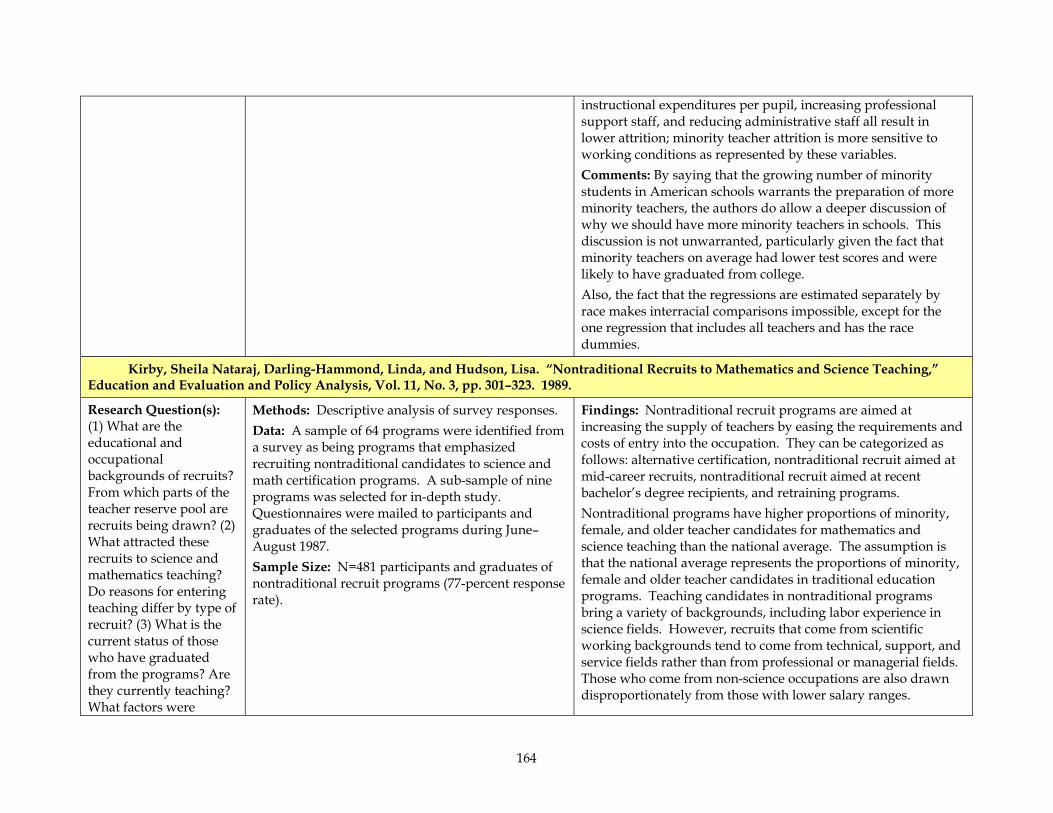
164
instructional expenditures per pupil, increasing professional support staff, and reducing administrative staff all result in lower attrition; minority teacher attrition is more sensitive to working conditions as represented by these variables. Comments: By saying that the growing number of minority students in American schools warrants the preparation of more minority teachers, the authors do allow a deeper discussion of why we should have more minority teachers in schools. This discussion is not unwarranted, particularly given the fact that minority teachers on average had lower test scores and were likely to have graduated from college. Also, the fact that the regressions are estimated separately by race makes interracial comparisons impossible, except for the one regression that includes all teachers and has the race dummies.
Kirby, Sheila Nataraj, Darling-Hammond, Linda, and Hudson, Lisa. “Nontraditional Recruits to Mathematics and Science Teaching,” Education and Evaluation and Policy Analysis, Vol. 11, No. 3, pp. 301–323. 1989.
Research Question(s): (1) What are the educational and occupational backgrounds of recruits? From which parts of the teacher reserve pool are recruits being drawn? (2) What attracted these recruits to science and mathematics teaching? Do reasons for entering teaching differ by type of recruit? (3) What is the current status of those who have graduated from the programs? Are they currently teaching? What factors were
Methods: Descriptive analysis of survey responses. Data: A sample of 64 programs were identified from a survey as being programs that emphasized recruiting nontraditional candidates to science and math certification programs. A sub-sample of nine programs was selected for in-depth study. Questionnaires were mailed to participants and graduates of the selected programs during June–August 1987. Sample Size: N=481 participants and graduates of nontraditional recruit programs (77-percent response rate).
Findings: Nontraditional recruit programs are aimed at increasing the supply of teachers by easing the requirements and costs of entry into the occupation. They can be categorized as follows: alternative certification, nontraditional recruit aimed at mid-career recruits, nontraditional recruit aimed at recent bachelor’s degree recipients, and retraining programs. Nontraditional programs have higher proportions of minority, female, and older teacher candidates for mathematics and science teaching than the national average. The assumption is that the national average represents the proportions of minority, female and older teacher candidates in traditional education programs. Teaching candidates in nontraditional programs bring a variety of backgrounds, including labor experience in science fields. However, recruits that come from scientific working backgrounds tend to come from technical, support, and service fields rather than from professional or managerial fields. Those who come from non-science occupations are also drawn disproportionately from those with lower salary ranges.
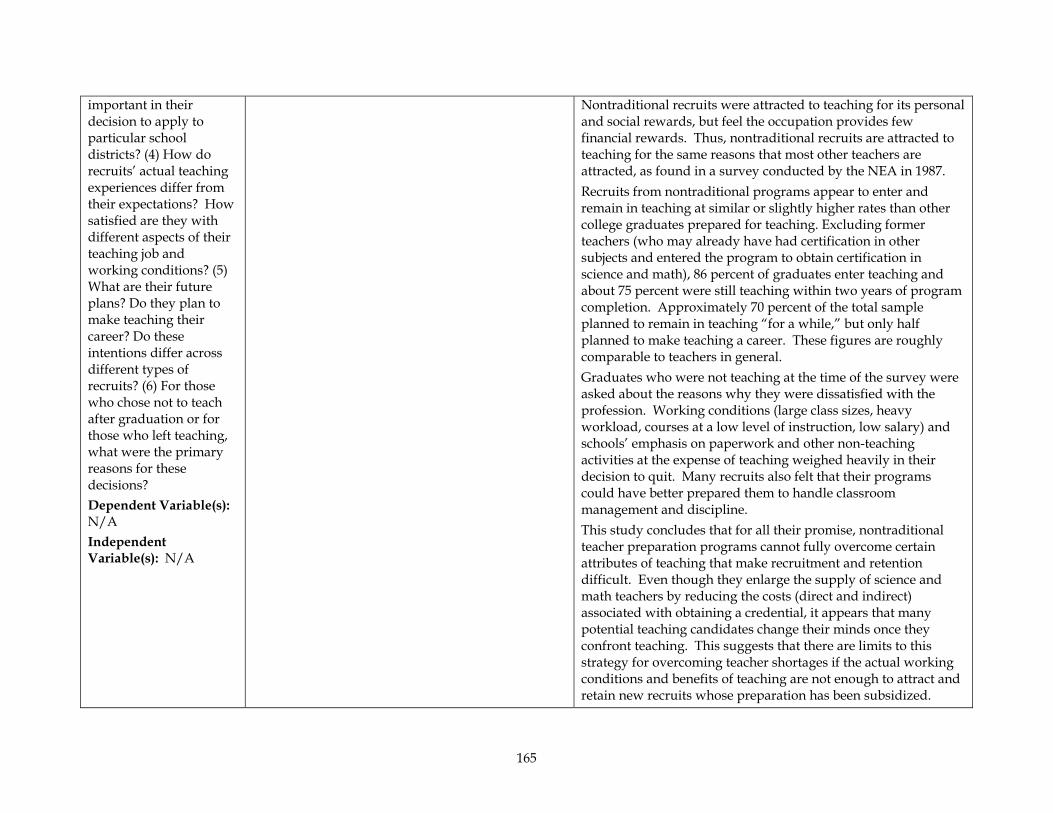
165
important in their decision to apply to particular school districts? (4) How do recruits’ actual teaching experiences differ from their expectations? How satisfied are they with different aspects of their teaching job and working conditions? (5) What are their future plans? Do they plan to make teaching their career? Do these intentions differ across different types of recruits? (6) For those who chose not to teach after graduation or for those who left teaching, what were the primary reasons for these decisions? Dependent Variable(s): N/A Independent Variable(s): N/A
Nontraditional recruits were attracted to teaching for its personal and social rewards, but feel the occupation provides few financial rewards. Thus, nontraditional recruits are attracted to teaching for the same reasons that most other teachers are attracted, as found in a survey conducted by the NEA in 1987. Recruits from nontraditional programs appear to enter and remain in teaching at similar or slightly higher rates than other college graduates prepared for teaching. Excluding former teachers (who may already have had certification in other subjects and entered the program to obtain certification in science and math), 86 percent of graduates enter teaching and about 75 percent were still teaching within two years of program completion. Approximately 70 percent of the total sample planned to remain in teaching “for a while,” but only half planned to make teaching a career. These figures are roughly comparable to teachers in general. Graduates who were not teaching at the time of the survey were asked about the reasons why they were dissatisfied with the profession. Working conditions (large class sizes, heavy workload, courses at a low level of instruction, low salary) and schools’ emphasis on paperwork and other non-teaching activities at the expense of teaching weighed heavily in their decision to quit. Many recruits also felt that their programs could have better prepared them to handle classroom management and discipline. This study concludes that for all their promise, nontraditional teacher preparation programs cannot fully overcome certain attributes of teaching that make recruitment and retention difficult. Even though they enlarge the supply of science and math teachers by reducing the costs (direct and indirect) associated with obtaining a credential, it appears that many potential teaching candidates change their minds once they confront teaching. This suggests that there are limits to this strategy for overcoming teacher shortages if the actual working conditions and benefits of teaching are not enough to attract and retain new recruits whose preparation has been subsidized.
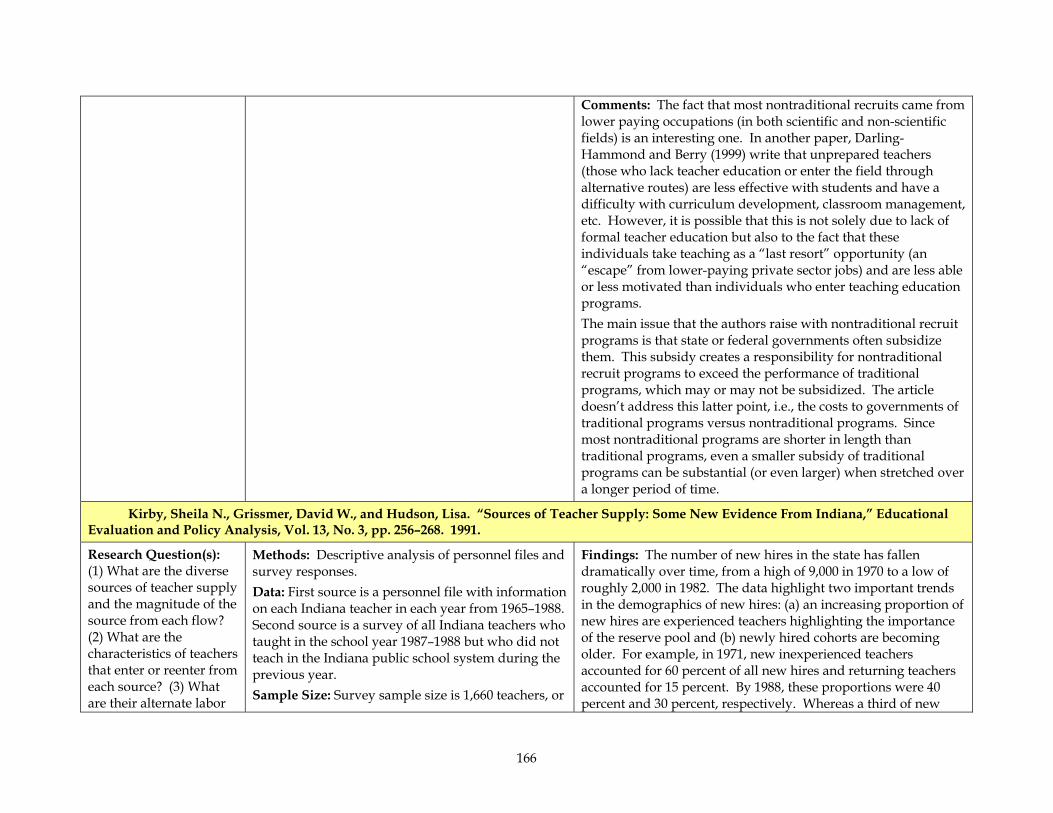
166
Comments: The fact that most nontraditional recruits came from lower paying occupations (in both scientific and non-scientific fields) is an interesting one. In another paper, Darling-Hammond and Berry (1999) write that unprepared teachers (those who lack teacher education or enter the field through alternative routes) are less effective with students and have a difficulty with curriculum development, classroom management, etc. However, it is possible that this is not solely due to lack of formal teacher education but also to the fact that these individuals take teaching as a “last resort” opportunity (an “escape” from lower-paying private sector jobs) and are less able or less motivated than individuals who enter teaching education programs. The main issue that the authors raise with nontraditional recruit programs is that state or federal governments often subsidize them. This subsidy creates a responsibility for nontraditional recruit programs to exceed the performance of traditional programs, which may or may not be subsidized. The article doesn’t address this latter point, i.e., the costs to governments of traditional programs versus nontraditional programs. Since most nontraditional programs are shorter in length than traditional programs, even a smaller subsidy of traditional programs can be substantial (or even larger) when stretched over a longer period of time.
Kirby, Sheila N., Grissmer, David W., and Hudson, Lisa. “Sources of Teacher Supply: Some New Evidence From Indiana,” Educational Evaluation and Policy Analysis, Vol. 13, No. 3, pp. 256–268. 1991.
Research Question(s): (1) What are the diverse sources of teacher supply and the magnitude of the source from each flow? (2) What are the characteristics of teachers that enter or reenter from each source? (3) What are their alternate labor
Methods: Descriptive analysis of personnel files and survey responses. Data: First source is a personnel file with information on each Indiana teacher in each year from 1965–1988. Second source is a survey of all Indiana teachers who taught in the school year 1987–1988 but who did not teach in the Indiana public school system during the previous year. Sample Size: Survey sample size is 1,660 teachers, or
Findings: The number of new hires in the state has fallen dramatically over time, from a high of 9,000 in 1970 to a low of roughly 2,000 in 1982. The data highlight two important trends in the demographics of new hires: (a) an increasing proportion of new hires are experienced teachers highlighting the importance of the reserve pool and (b) newly hired cohorts are becoming older. For example, in 1971, new inexperienced teachers accounted for 60 percent of all new hires and returning teachers accounted for 15 percent. By 1988, these proportions were 40 percent and 30 percent, respectively. Whereas a third of new
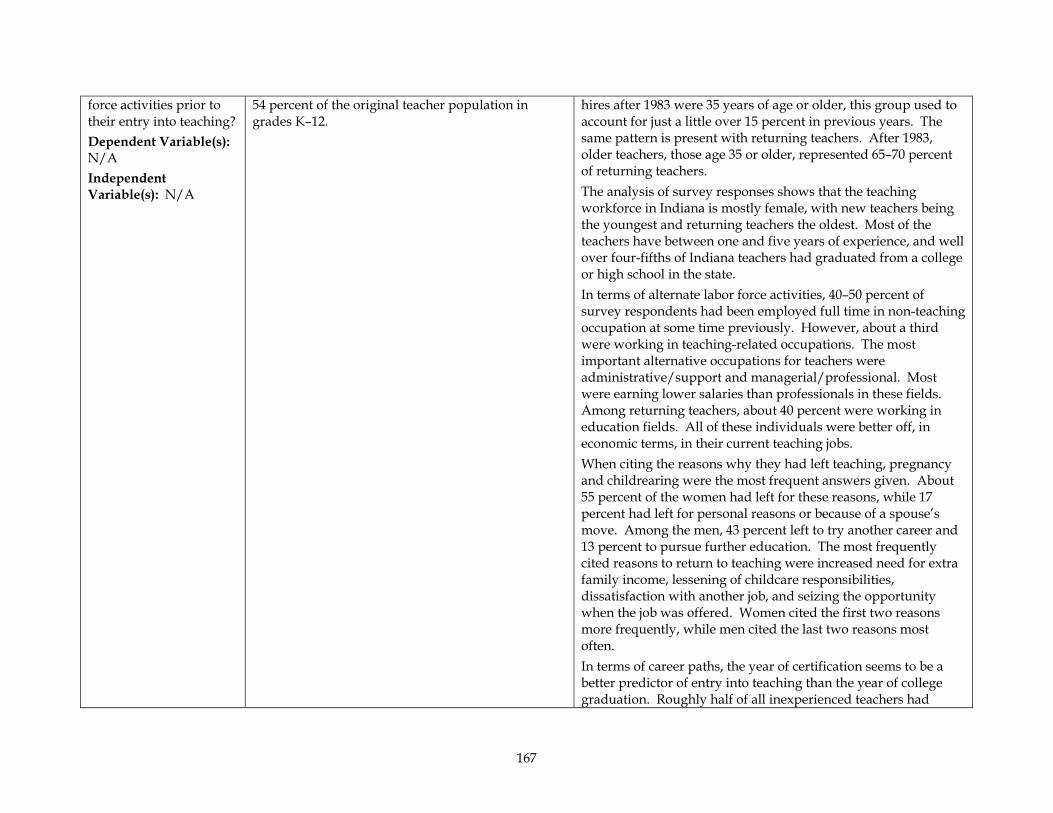
167
force activities prior to their entry into teaching? Dependent Variable(s): N/A Independent Variable(s): N/A
54 percent of the original teacher population in grades K–12.
hires after 1983 were 35 years of age or older, this group used to account for just a little over 15 percent in previous years. The same pattern is present with returning teachers. After 1983, older teachers, those age 35 or older, represented 65–70 percent of returning teachers. The analysis of survey responses shows that the teaching workforce in Indiana is mostly female, with new teachers being the youngest and returning teachers the oldest. Most of the teachers have between one and five years of experience, and well over four-fifths of Indiana teachers had graduated from a college or high school in the state. In terms of alternate labor force activities, 40–50 percent of survey respondents had been employed full time in non-teaching occupation at some time previously. However, about a third were working in teaching-related occupations. The most important alternative occupations for teachers were administrative/support and managerial/professional. Most were earning lower salaries than professionals in these fields. Among returning teachers, about 40 percent were working in education fields. All of these individuals were better off, in economic terms, in their current teaching jobs. When citing the reasons why they had left teaching, pregnancy and childrearing were the most frequent answers given. About 55 percent of the women had left for these reasons, while 17 percent had left for personal reasons or because of a spouse’s move. Among the men, 43 percent left to try another career and 13 percent to pursue further education. The most frequently cited reasons to return to teaching were increased need for extra family income, lessening of childcare responsibilities, dissatisfaction with another job, and seizing the opportunity when the job was offered. Women cited the first two reasons more frequently, while men cited the last two reasons most often. In terms of career paths, the year of certification seems to be a better predictor of entry into teaching than the year of college graduation. Roughly half of all inexperienced teachers had

168
received their degree the year prior to entering teaching. About 25 percent entered after a one-year’s delay. Therefore, supply models that only look at the proportion of newly graduated teachers who enter teaching may underestimate the number who eventually enter teaching. It is possible that individuals delay entry into teaching to obtain a master’s degree or other credentials necessary for certification (a supply argument) or that they choose another occupation due to a tight education labor market (a demand argument). Comments: None.
Lankford, Hamilton, Loeb Susanna, and Wyckoff, James. “Teacher Sorting and the Plight of Urban Schools: A Descriptive Analysis,” Educational Evaluation and Policy Analysis, Vol. 24, No. 1, pp. 3762. 2002.
Research Question(s): (1) How much variation is there in the average attributes of teachers in New York State schools? (2) Which schools have the least qualified teachers? (3) How has this distribution changed over time? (4) How is this distribution impacted by teacher transfer and attrition? (5) How are salary differentials contributing to or alleviating inequities in teacher resources? Dependent Variable(s): N/A Independent
Methods: Descriptive analysis. First, the authors construct school-level averages of teacher attributes. Second, they examine their distribution across schools in New York State. Schools are ranked by percentiles according to a composite quality measure. This measure is constructed using factor analysis on all the teacher attribute measures. The authors also perform correlation analysis among the various attributes to see whether schools with less qualified teachers in one dimension also have less qualified teachers in another dimension. Finally, the authors decompose the variance in teacher attributes between regions, between districts within regions, and between schools within districts. The attrition analysis follows a cohort of teachers who were first hired in 1993 over the next five years of their careers to look at their turnover patterns. Data: Personnel Master File of the Basic Education Data System of the New York State Education Department from 1984–1985 through 1999–2000. This dataset is linked to other databases containing a
Findings: The authors find that teachers in New York State are unevenly distributed across schools. Schools in the 10th percentile (the highest quality schools) have no teacher who is new, failed the certification exam in his or her first attempt, or graduated from the least-competitive colleges. On the other hand, schools in the 90th percentile (the lowest quality schools) have a substantial portion of new teachers (18 percent), teachers who are only teaching courses for which they are not certified (24 percent), or who failed a certification exam on their first attempt (33 percent). Correlations between school-level teacher attributes show that schools that have low-quality teachers in one dimension also have low-quality teachers in all other dimensions. For example, schools with a high proportion of teachers who failed certification exams are more likely to have teachers from less competitive colleges (correlation is approx. 0.45). An analysis of variance decomposition on the composite teacher-quality measure shows that close to 25 percent of the variation is between regions in the state; 40 percent is between districts in the same region; and 35 percent is among schools within districts. This indicates that most of the variance in teacher qualifications
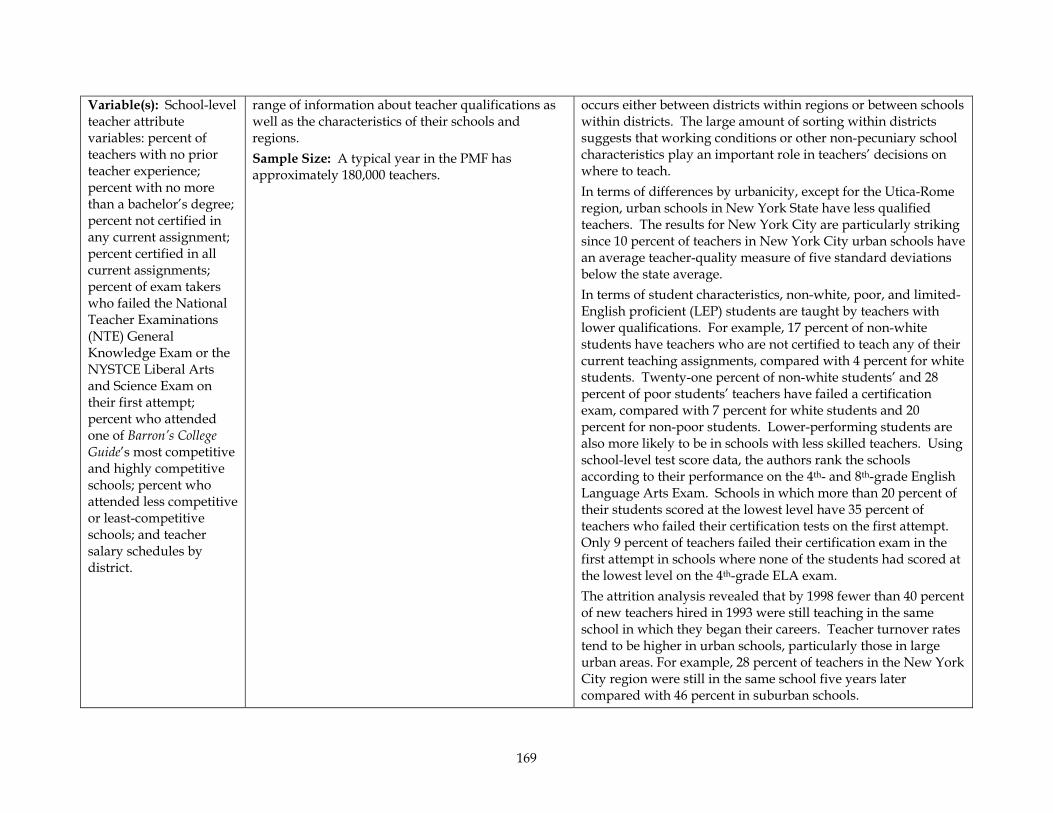
169
Variable(s): School-level teacher attribute variables: percent of teachers with no prior teacher experience; percent with no more than a bachelor’s degree; percent not certified in any current assignment; percent certified in all current assignments; percent of exam takers who failed the National Teacher Examinations (NTE) General Knowledge Exam or the NYSTCE Liberal Arts and Science Exam on their first attempt; percent who attended one of Barron’s College Guide’s most competitive and highly competitive schools; percent who attended less competitive or least-competitive schools; and teacher salary schedules by district.
range of information about teacher qualifications as well as the characteristics of their schools and regions. Sample Size: A typical year in the PMF has approximately 180,000 teachers.
occurs either between districts within regions or between schools within districts. The large amount of sorting within districts suggests that working conditions or other non-pecuniary school characteristics play an important role in teachers’ decisions on where to teach. In terms of differences by urbanicity, except for the Utica-Rome region, urban schools in New York State have less qualified teachers. The results for New York City are particularly striking since 10 percent of teachers in New York City urban schools have an average teacher-quality measure of five standard deviations below the state average. In terms of student characteristics, non-white, poor, and limited-English proficient (LEP) students are taught by teachers with lower qualifications. For example, 17 percent of non-white students have teachers who are not certified to teach any of their current teaching assignments, compared with 4 percent for white students. Twenty-one percent of non-white students’ and 28 percent of poor students’ teachers have failed a certification exam, compared with 7 percent for white students and 20 percent for non-poor students. Lower-performing students are also more likely to be in schools with less skilled teachers. Using school-level test score data, the authors rank the schools according to their performance on the 4th- and 8th-grade English Language Arts Exam. Schools in which more than 20 percent of their students scored at the lowest level have 35 percent of teachers who failed their certification tests on the first attempt. Only 9 percent of teachers failed their certification exam in the first attempt in schools where none of the students had scored at the lowest level on the 4th-grade ELA exam. The attrition analysis revealed that by 1998 fewer than 40 percent of new teachers hired in 1993 were still teaching in the same school in which they began their careers. Teacher turnover rates tend to be higher in urban schools, particularly those in large urban areas. For example, 28 percent of teachers in the New York City region were still in the same school five years later compared with 46 percent in suburban schools.
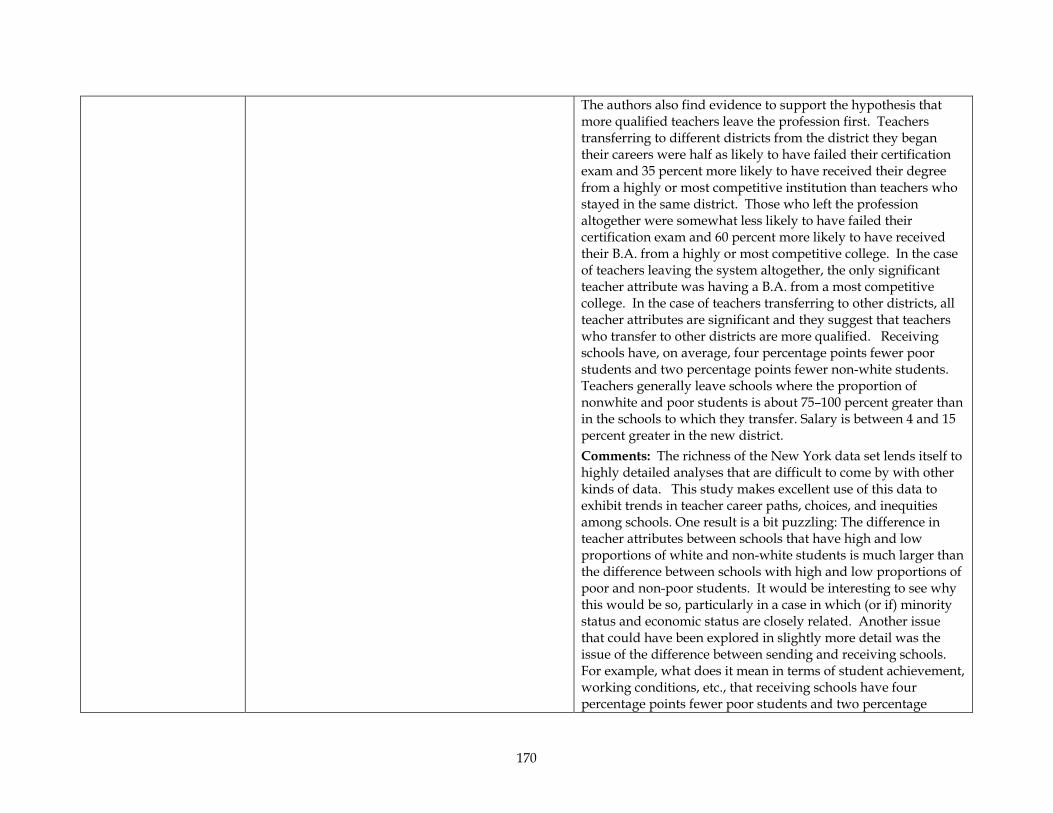
170
The authors also find evidence to support the hypothesis that more qualified teachers leave the profession first. Teachers transferring to different districts from the district they began their careers were half as likely to have failed their certification exam and 35 percent more likely to have received their degree from a highly or most competitive institution than teachers who stayed in the same district. Those who left the profession altogether were somewhat less likely to have failed their certification exam and 60 percent more likely to have received their B.A. from a highly or most competitive college. In the case of teachers leaving the system altogether, the only significant teacher attribute was having a B.A. from a most competitive college. In the case of teachers transferring to other districts, all teacher attributes are significant and they suggest that teachers who transfer to other districts are more qualified. Receiving schools have, on average, four percentage points fewer poor students and two percentage points fewer non-white students. Teachers generally leave schools where the proportion of nonwhite and poor students is about 75–100 percent greater than in the schools to which they transfer. Salary is between 4 and 15 percent greater in the new district. Comments: The richness of the New York data set lends itself to highly detailed analyses that are difficult to come by with other kinds of data. This study makes excellent use of this data to exhibit trends in teacher career paths, choices, and inequities among schools. One result is a bit puzzling: The difference in teacher attributes between schools that have high and low proportions of white and non-white students is much larger than the difference between schools with high and low proportions of poor and non-poor students. It would be interesting to see why this would be so, particularly in a case in which (or if) minority status and economic status are closely related. Another issue that could have been explored in slightly more detail was the issue of the difference between sending and receiving schools. For example, what does it mean in terms of student achievement, working conditions, etc., that receiving schools have four percentage points fewer poor students and two percentage
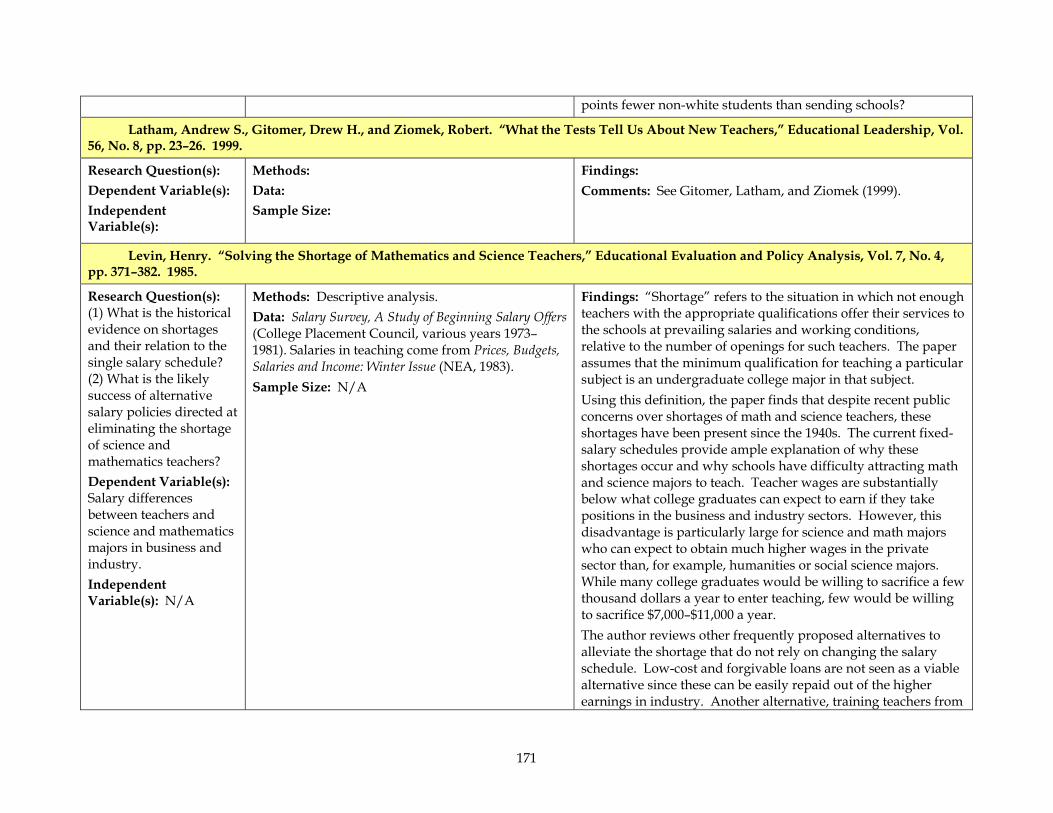
171
points fewer non-white students than sending schools?
Latham, Andrew S., Gitomer, Drew H., and Ziomek, Robert. “What the Tests Tell Us About New Teachers,” Educational Leadership, Vol. 56, No. 8, pp. 23–26. 1999.
Research Question(s): Dependent Variable(s): Independent Variable(s):
Methods: Data: Sample Size:
Findings: Comments: See Gitomer, Latham, and Ziomek (1999).
Levin, Henry. “Solving the Shortage of Mathematics and Science Teachers,” Educational Evaluation and Policy Analysis, Vol. 7, No. 4, pp. 371–382. 1985.
Research Question(s): (1) What is the historical evidence on shortages and their relation to the single salary schedule? (2) What is the likely success of alternative salary policies directed at eliminating the shortage of science and mathematics teachers? Dependent Variable(s): Salary differences between teachers and science and mathematics majors in business and industry. Independent Variable(s): N/A
Methods: Descriptive analysis. Data: Salary Survey, A Study of Beginning Salary Offers (College Placement Council, various years 1973–1981). Salaries in teaching come from Prices, Budgets, Salaries and Income: Winter Issue (NEA, 1983). Sample Size: N/A
Findings: “Shortage” refers to the situation in which not enough teachers with the appropriate qualifications offer their services to the schools at prevailing salaries and working conditions, relative to the number of openings for such teachers. The paper assumes that the minimum qualification for teaching a particular subject is an undergraduate college major in that subject. Using this definition, the paper finds that despite recent public concerns over shortages of math and science teachers, these shortages have been present since the 1940s. The current fixed-salary schedules provide ample explanation of why these shortages occur and why schools have difficulty attracting math and science majors to teach. Teacher wages are substantially below what college graduates can expect to earn if they take positions in the business and industry sectors. However, this disadvantage is particularly large for science and math majors who can expect to obtain much higher wages in the private sector than, for example, humanities or social science majors. While many college graduates would be willing to sacrifice a few thousand dollars a year to enter teaching, few would be willing to sacrifice $7,000–$11,000 a year. The author reviews other frequently proposed alternatives to alleviate the shortage that do not rely on changing the salary schedule. Low-cost and forgivable loans are not seen as a viable alternative since these can be easily repaid out of the higher earnings in industry. Another alternative, training teachers from
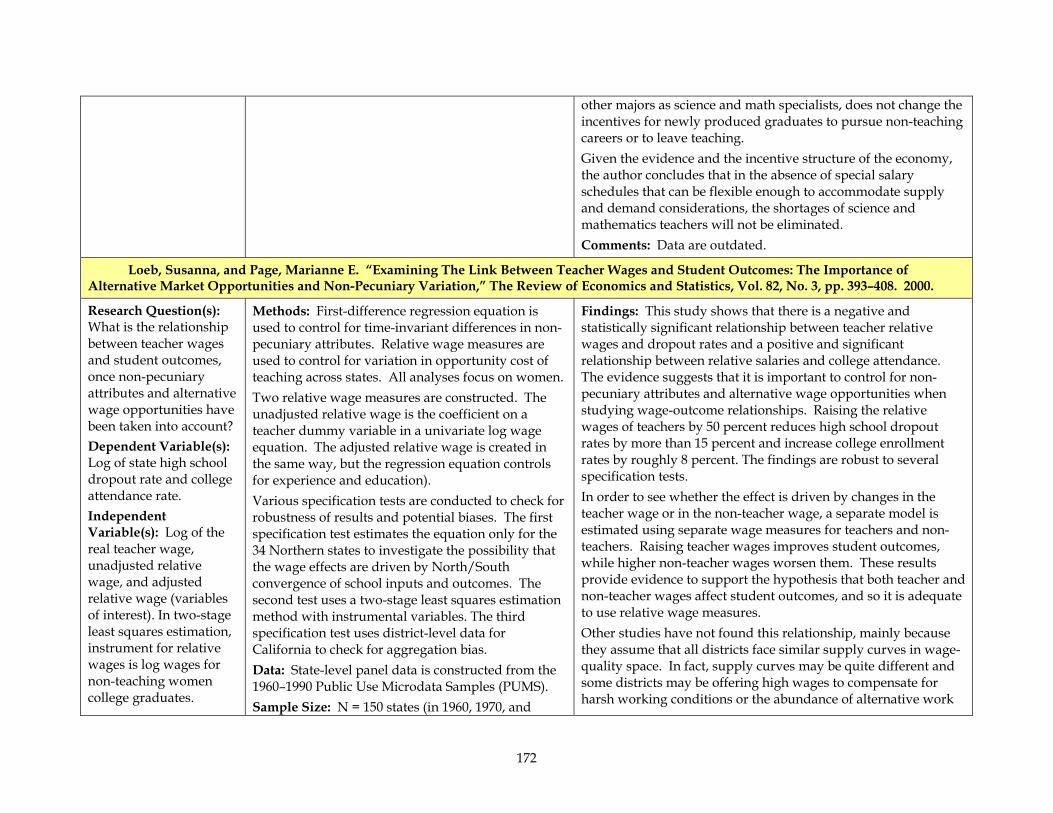
172
other majors as science and math specialists, does not change the incentives for newly produced graduates to pursue non-teaching careers or to leave teaching. Given the evidence and the incentive structure of the economy, the author concludes that in the absence of special salary schedules that can be flexible enough to accommodate supply and demand considerations, the shortages of science and mathematics teachers will not be eliminated. Comments: Data are outdated.
Loeb, Susanna, and Page, Marianne E. “Examining The Link Between Teacher Wages and Student Outcomes: The Importance of Alternative Market Opportunities and Non-Pecuniary Variation,” The Review of Economics and Statistics, Vol. 82, No. 3, pp. 393–408. 2000.
Research Question(s): What is the relationship between teacher wages and student outcomes, once non-pecuniary attributes and alternative wage opportunities have been taken into account? Dependent Variable(s): Log of state high school dropout rate and college attendance rate. Independent Variable(s): Log of the real teacher wage, unadjusted relative wage, and adjusted relative wage (variables of interest). In two-stage least squares estimation, instrument for relative wages is log wages for non-teaching women college graduates.
Methods: First-difference regression equation is used to control for time-invariant differences in non-pecuniary attributes. Relative wage measures are used to control for variation in opportunity cost of teaching across states. All analyses focus on women. Two relative wage measures are constructed. The unadjusted relative wage is the coefficient on a teacher dummy variable in a univariate log wage equation. The adjusted relative wage is created in the same way, but the regression equation controls for experience and education). Various specification tests are conducted to check for robustness of results and potential biases. The first specification test estimates the equation only for the 34 Northern states to investigate the possibility that the wage effects are driven by North/South convergence of school inputs and outcomes. The second test uses a two-stage least squares estimation method with instrumental variables. The third specification test uses district-level data for California to check for aggregation bias. Data: State-level panel data is constructed from the 1960–1990 Public Use Microdata Samples (PUMS). Sample Size: N = 150 states (in 1960, 1970, and
Findings: This study shows that there is a negative and statistically significant relationship between teacher relative wages and dropout rates and a positive and significant relationship between relative salaries and college attendance. The evidence suggests that it is important to control for non-pecuniary attributes and alternative wage opportunities when studying wage-outcome relationships. Raising the relative wages of teachers by 50 percent reduces high school dropout rates by more than 15 percent and increase college enrollment rates by roughly 8 percent. The findings are robust to several specification tests. In order to see whether the effect is driven by changes in the teacher wage or in the non-teacher wage, a separate model is estimated using separate wage measures for teachers and non-teachers. Raising teacher wages improves student outcomes, while higher non-teacher wages worsen them. These results provide evidence to support the hypothesis that both teacher and non-teacher wages affect student outcomes, and so it is adequate to use relative wage measures. Other studies have not found this relationship, mainly because they assume that all districts face similar supply curves in wage-quality space. In fact, supply curves may be quite different and some districts may be offering high wages to compensate for harsh working conditions or the abundance of alternative work
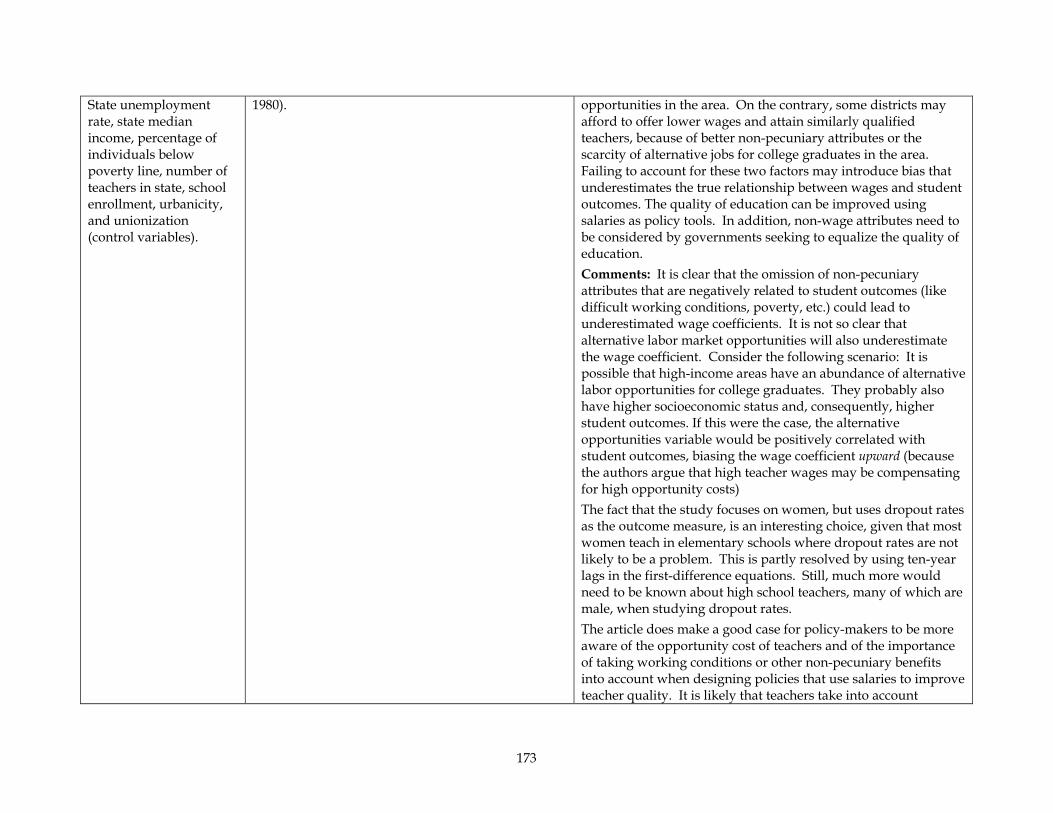
173
State unemployment rate, state median income, percentage of individuals below poverty line, number of teachers in state, school enrollment, urbanicity, and unionization (control variables).
1980).
opportunities in the area. On the contrary, some districts may afford to offer lower wages and attain similarly qualified teachers, because of better non-pecuniary attributes or the scarcity of alternative jobs for college graduates in the area. Failing to account for these two factors may introduce bias that underestimates the true relationship between wages and student outcomes. The quality of education can be improved using salaries as policy tools. In addition, non-wage attributes need to be considered by governments seeking to equalize the quality of education. Comments: It is clear that the omission of non-pecuniary attributes that are negatively related to student outcomes (like difficult working conditions, poverty, etc.) could lead to underestimated wage coefficients. It is not so clear that alternative labor market opportunities will also underestimate the wage coefficient. Consider the following scenario: It is possible that high-income areas have an abundance of alternative labor opportunities for college graduates. They probably also have higher socioeconomic status and, consequently, higher student outcomes. If this were the case, the alternative opportunities variable would be positively correlated with student outcomes, biasing the wage coefficient upward (because the authors argue that high teacher wages may be compensating for high opportunity costs) The fact that the study focuses on women, but uses dropout rates as the outcome measure, is an interesting choice, given that most women teach in elementary schools where dropout rates are not likely to be a problem. This is partly resolved by using ten-year lags in the first-difference equations. Still, much more would need to be known about high school teachers, many of which are male, when studying dropout rates. The article does make a good case for policy-makers to be more aware of the opportunity cost of teachers and of the importance of taking working conditions or other non-pecuniary benefits into account when designing policies that use salaries to improve teacher quality. It is likely that teachers take into account
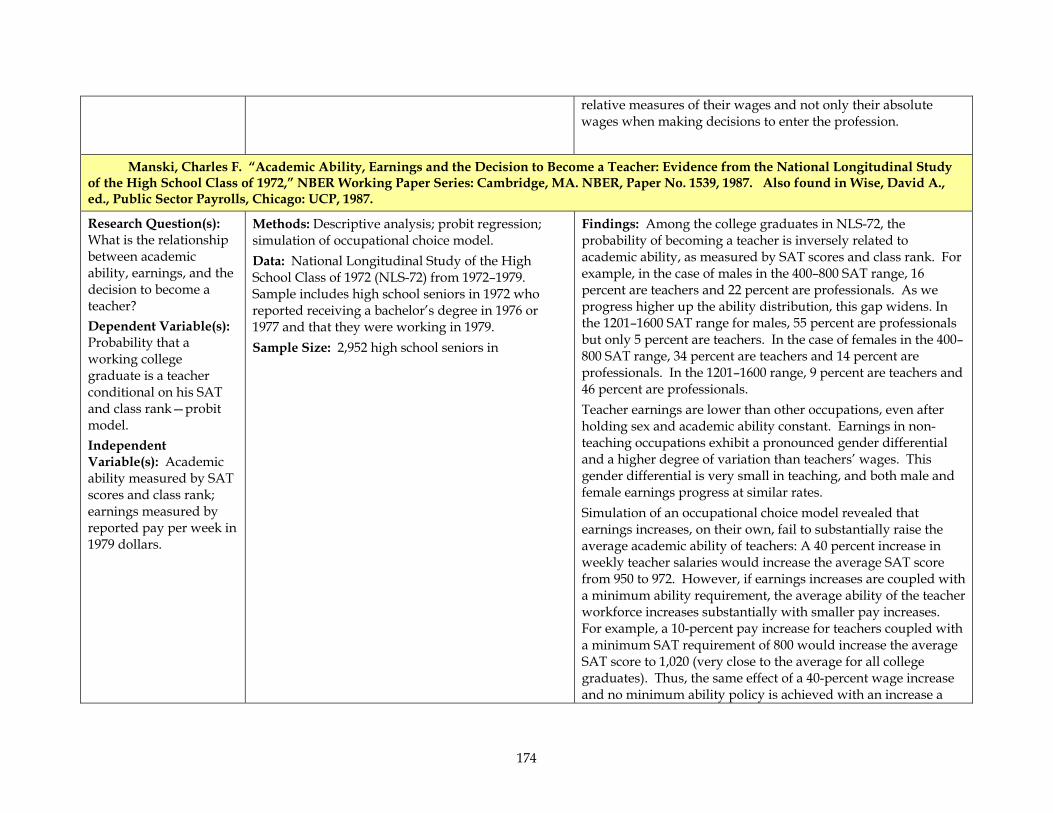
174
relative measures of their wages and not only their absolute wages when making decisions to enter the profession.
Manski, Charles F. “Academic Ability, Earnings and the Decision to Become a Teacher: Evidence from the National Longitudinal Study of the High School Class of 1972,” NBER Working Paper Series: Cambridge, MA. NBER, Paper No. 1539, 1987. Also found in Wise, David A., ed., Public Sector Payrolls, Chicago: UCP, 1987.
Research Question(s): What is the relationship between academic ability, earnings, and the decision to become a teacher? Dependent Variable(s): Probability that a working college graduate is a teacher conditional on his SAT and class rank—probit model. Independent Variable(s): Academic ability measured by SAT scores and class rank; earnings measured by reported pay per week in 1979 dollars.
Methods: Descriptive analysis; probit regression; simulation of occupational choice model. Data: National Longitudinal Study of the High School Class of 1972 (NLS-72) from 1972–1979. Sample includes high school seniors in 1972 who reported receiving a bachelor’s degree in 1976 or 1977 and that they were working in 1979. Sample Size: 2,952 high school seniors in
Findings: Among the college graduates in NLS-72, the probability of becoming a teacher is inversely related to academic ability, as measured by SAT scores and class rank. For example, in the case of males in the 400–800 SAT range, 16 percent are teachers and 22 percent are professionals. As we progress higher up the ability distribution, this gap widens. In the 1201–1600 SAT range for males, 55 percent are professionals but only 5 percent are teachers. In the case of females in the 400–800 SAT range, 34 percent are teachers and 14 percent are professionals. In the 1201–1600 range, 9 percent are teachers and 46 percent are professionals. Teacher earnings are lower than other occupations, even after holding sex and academic ability constant. Earnings in non-teaching occupations exhibit a pronounced gender differential and a higher degree of variation than teachers’ wages. This gender differential is very small in teaching, and both male and female earnings progress at similar rates. Simulation of an occupational choice model revealed that earnings increases, on their own, fail to substantially raise the average academic ability of teachers: A 40 percent increase in weekly teacher salaries would increase the average SAT score from 950 to 972. However, if earnings increases are coupled with a minimum ability requirement, the average ability of the teacher workforce increases substantially with smaller pay increases. For example, a 10-percent pay increase for teachers coupled with a minimum SAT requirement of 800 would increase the average SAT score to 1,020 (very close to the average for all college graduates). Thus, the same effect of a 40-percent wage increase and no minimum ability policy is achieved with an increase a
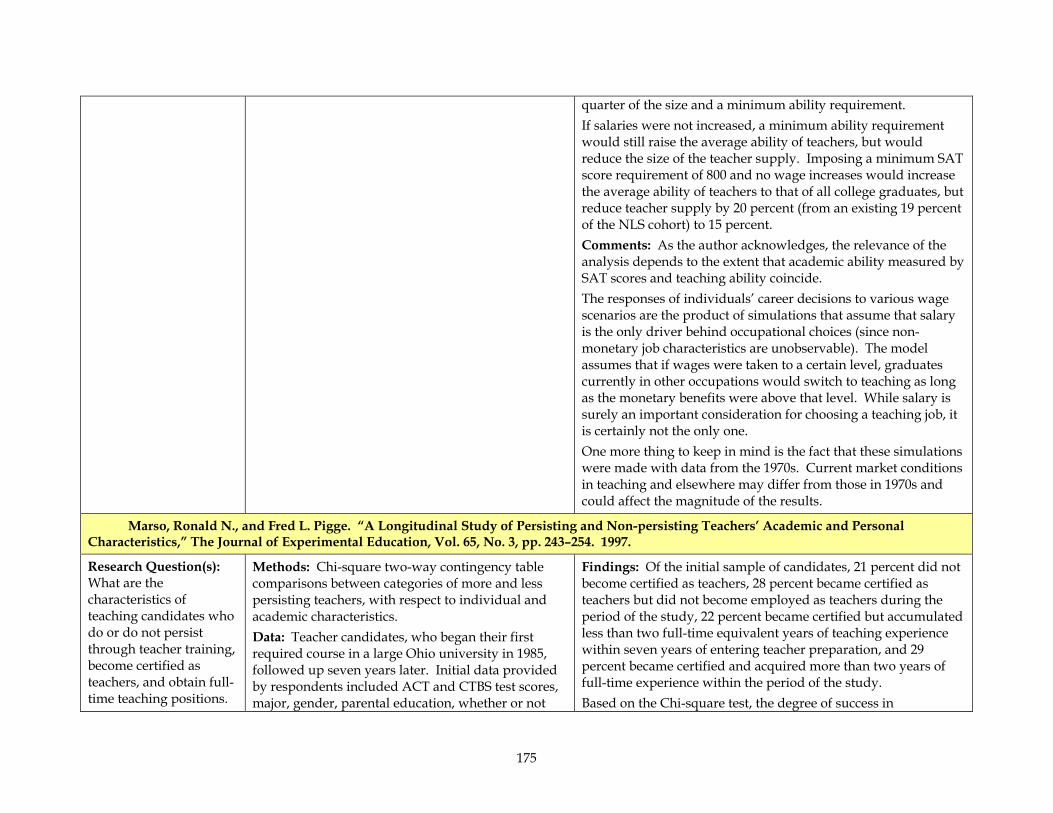
175
quarter of the size and a minimum ability requirement. If salaries were not increased, a minimum ability requirement would still raise the average ability of teachers, but would reduce the size of the teacher supply. Imposing a minimum SAT score requirement of 800 and no wage increases would increase the average ability of teachers to that of all college graduates, but reduce teacher supply by 20 percent (from an existing 19 percent of the NLS cohort) to 15 percent. Comments: As the author acknowledges, the relevance of the analysis depends to the extent that academic ability measured by SAT scores and teaching ability coincide. The responses of individuals’ career decisions to various wage scenarios are the product of simulations that assume that salary is the only driver behind occupational choices (since non-monetary job characteristics are unobservable). The model assumes that if wages were taken to a certain level, graduates currently in other occupations would switch to teaching as long as the monetary benefits were above that level. While salary is surely an important consideration for choosing a teaching job, it is certainly not the only one. One more thing to keep in mind is the fact that these simulations were made with data from the 1970s. Current market conditions in teaching and elsewhere may differ from those in 1970s and could affect the magnitude of the results.
Marso, Ronald N., and Fred L. Pigge. “A Longitudinal Study of Persisting and Non-persisting Teachers’ Academic and Personal Characteristics,” The Journal of Experimental Education, Vol. 65, No. 3, pp. 243–254. 1997.
Research Question(s): What are the characteristics of teaching candidates who do or do not persist through teacher training, become certified as teachers, and obtain full-time teaching positions.
Methods: Chi-square two-way contingency table comparisons between categories of more and less persisting teachers, with respect to individual and academic characteristics. Data: Teacher candidates, who began their first required course in a large Ohio university in 1985, followed up seven years later. Initial data provided by respondents included ACT and CTBS test scores, major, gender, parental education, whether or not
Findings: Of the initial sample of candidates, 21 percent did not become certified as teachers, 28 percent became certified as teachers but did not become employed as teachers during the period of the study, 22 percent became certified but accumulated less than two full-time equivalent years of teaching experience within seven years of entering teacher preparation, and 29 percent became certified and acquired more than two years of full-time experience within the period of the study. Based on the Chi-square test, the degree of success in
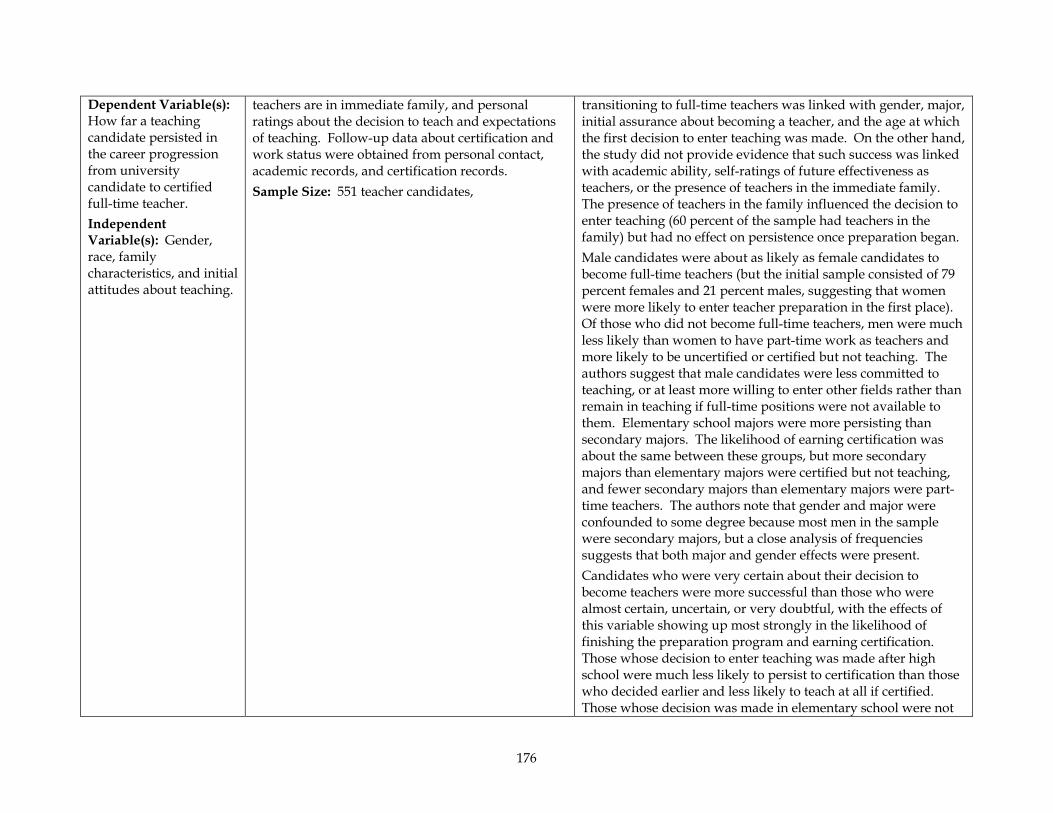
176
Dependent Variable(s): How far a teaching candidate persisted in the career progression from university candidate to certified full-time teacher. Independent Variable(s): Gender, race, family characteristics, and initial attitudes about teaching.
teachers are in immediate family, and personal ratings about the decision to teach and expectations of teaching. Follow-up data about certification and work status were obtained from personal contact, academic records, and certification records. Sample Size: 551 teacher candidates,
transitioning to full-time teachers was linked with gender, major, initial assurance about becoming a teacher, and the age at which the first decision to enter teaching was made. On the other hand, the study did not provide evidence that such success was linked with academic ability, self-ratings of future effectiveness as teachers, or the presence of teachers in the immediate family. The presence of teachers in the family influenced the decision to enter teaching (60 percent of the sample had teachers in the family) but had no effect on persistence once preparation began. Male candidates were about as likely as female candidates to become full-time teachers (but the initial sample consisted of 79 percent females and 21 percent males, suggesting that women were more likely to enter teacher preparation in the first place). Of those who did not become full-time teachers, men were much less likely than women to have part-time work as teachers and more likely to be uncertified or certified but not teaching. The authors suggest that male candidates were less committed to teaching, or at least more willing to enter other fields rather than remain in teaching if full-time positions were not available to them. Elementary school majors were more persisting than secondary majors. The likelihood of earning certification was about the same between these groups, but more secondary majors than elementary majors were certified but not teaching, and fewer secondary majors than elementary majors were part-time teachers. The authors note that gender and major were confounded to some degree because most men in the sample were secondary majors, but a close analysis of frequencies suggests that both major and gender effects were present. Candidates who were very certain about their decision to become teachers were more successful than those who were almost certain, uncertain, or very doubtful, with the effects of this variable showing up most strongly in the likelihood of finishing the preparation program and earning certification. Those whose decision to enter teaching was made after high school were much less likely to persist to certification than those who decided earlier and less likely to teach at all if certified. Those whose decision was made in elementary school were not
177
significantly different from those whose decision was made in high school. According to the authors, this evidence indicates that attrition during teacher preparation and in the early years of teaching does not reduce the quality of the teacher pool, as indicated by test scores. They argue that post-secondary recruitment of teacher candidates is unlikely to be productive, since two-thirds of such candidates are unlikely to become teachers in the end. They also point out that the approximate 50-percent attrition from entering preparation to become full- or part-time teachers means that the process of making teachers is a costly and high-risk undertaking. Comments: The authors do not discuss their follow-up methods in depth, leading to questions about possible bias due to non-response or due to lack of administrative information about teachers working elsewhere than in Ohio. The article also does not make it clear whether this study included all teacher candidates from the given year, a random sample, or a nonrandom sample. The Chi-square contingency table method is useful for single predictive variables taken one at a time, but doesn’t allow controlling for the simultaneous presence of the other variables. It would have been interesting to see a multivariate regression approach, with interaction terms between gender and the other variables.
Miech, Richard Allen, and Glen H. Elder, Jr. “The Service Ethic and Teaching,” Sociology of Education, Vol. 69, No. 3, pp. 237–253. 1996.
Research Question(s): Are idealists more likely to leave teaching? If so, is this because of the frustration and uncertainty intrinsic to the job? Are there differences in this effect between men and women, or between graduates of the early 1960s and graduates of
Methods: Discrete-time hazard regression model. Weighting to control for over-sampling in the initial samples. The authors mention that their approach allowed controlling for censoring but do not describe their method for doing this. Data: National longitudinal study of 1961 college seniors, followed for four years (through 1964). National longitudinal study of 1972 high school seniors, followed for 14 years (through 1986) with a supplemental survey in 1986 of respondents with teaching experience or identified as potential
Findings: The findings are summarized with respect to four sub-samples, three of which show similar effects. For male respondents in the 1961 and 1972 samples and female respondents in the 1972 sample, idealists were much more likely to leave the teaching profession than non-idealists. Idealistic men in the 1960s cohort were 55 percent more likely to leave within the two years studied than non-idealistic men. Idealistic men and women in the 1970s cohort were almost twice as likely to leave by 1986 than their non-idealistic colleagues. However, idealistic women in the 1960s cohort were no more likely to leave than non-idealistic women. The authors attribute this result to the lesser career opportunities available outside of teaching for
178
the early 1970s? Dependent Variable(s): Probability of leaving teaching. Independent Variable(s): Whether or not rated as idealists on the basis of survey questions about what values they considered important in their choice of careers (idealism was identified as placing a higher value on service to others and to society than on other career motivations such as income, status, security, working conditions, etc.). Gender, marital status, parental status, race, salary, self-rating of initial commitment to teaching, public versus private school, and 1960s versus 1970s cohort.
teachers. Sample Size: 3,783 respondents in the 1961 cohort who became teachers in 1962. 724 participants in the NLS-72 study who responded to the 1986 teacher supplement.
women during the 1960s as compared with the 1970s and 1980s. For all groups, the attrition rate was higher for those who expressed a lower initial commitment to teaching. The authors assert that the presence of this variable in the model controls for a confounding explanation of idealists’ high attrition: that idealists might start with less commitment to teaching than others. The model includes an interaction term for female respondents who were idealistic and who bore children during the study period. These women were more likely to stay in teaching than idealistic women who did not bear children or non-idealistic women who bore children. The authors connect this finding with other literature showing an exceptionally high commitment to the labor force among idealistic women, and suggest that it is their commitment to the labor force (perhaps combined with the difficulty of changing careers while childrearing) rather than their commitment to teaching as such that accounts for this result. Women in the 1972 cohort with older children showed no special propensity to leave teaching, but women in the 1961 cohort with older children were more likely to leave than those without children. This is attributed to a change in societal attitudes about working mothers. The authors provide a number of hypothetical alternative explanations for the observed effect of idealism on the probability of leaving teaching, and reject these hypotheses on the basis of various control variables in the model. Thus, they control for salary, family background, and socioeconomic status. They also check whether such teachers are more likely to leave teaching to become administrators (they are not), and whether such teachers are more likely to work in disadvantaged school districts where conditions are harder and wages lower (they are not). Based on these analyses, the authors take their findings as confirmation of a hypothesis that idealists leave teaching because it does not tangibly fulfill their expectations of contributing to society. They experience frustration and uncertainty in assessing
179
their own impact on students. Their working environment provides them with “little guidance on the goals, means, and evaluation of their work.” This interpretation implies that policies to recruit idealists into teaching will be unsuccessful in the long run, unless coupled with policies to help such idealists prepare for the uncertainty of teaching and/or policies to help them receive more positive feedback on the job regarding their success at contributing to the lives of their students. Comments: As the authors admit, the measurement of idealism is a problem in this sort of study, especially in using survey instruments designed by other researchers for other purposes. This paper does an unusually good job of exploring and accounting for alternative explanations of the observed results; nevertheless, it might not go far enough to exclude other causal explanations. The presence of some control variables does not guarantee that endogeneity is not a problem, if more adequate controls are missing. More information on inter-variable correlations, and perhaps more interaction terms in the model, would have been helpful. The authors argue that the presence of the variable “initial commitment to teaching” controls for the fact that idealists may start with less commitment to teaching than others. However, this may not adequately control for the alternative hypothesis. It would still be useful to check the correlation between the two variables. If they are highly positively correlated, including both of them in the model does not tell which way the causation goes; if they are not correlated or negatively correlated, which seems plausible, then the finding of separate strong effects for idealists and for low-commitment respondents would be very meaningful.
Mont, Daniel, and Daniel I. Rees. “Influence of Classroom Characteristics on High School Teacher Turnover,” Economic Inquiry, Vol. 34, pp. 152–167. 1996.
Research Question(s): What are the effects of class load and other factors on teacher
Methods: Discrete hazard model with right-censoring and logit estimation. Data: New York State Department of Education
Findings: Higher levels of student quality reduce a teacher’s probability of leaving; the other variables and sample restrictions support an interpretation of this as an effect on quitting rather
180
turnover? Dependent Variable(s): Rate of teacher exits from initial district, where an absence from employment records for two years is counted as an exit (thus excluding one-year leaves of absence and sabbaticals). Independent Variable(s): Teaching load as measured by the average class size taught by a teacher (and class size squared), the number of classes taught, and the proportion of classes taught in the teacher’s area of certification. Average quality of students taught by a teacher. Math and science teachers versus other teachers. District-level variables: size, dropout rate, percentage of students who go on to college, percentage of households in the district with children (as an instrument for the level of public support for the school system), median household income, and percentage of residents
Personnel Master File for 1979 through 1989. Sample Size: 525 full-time high school teachers newly hired in 1979 by districts in New York State outside of New York City, excluding special education and other highly specialized teachers.
than on layoffs. Larger class size was associated with higher turnover in classes that were above the average size of 20.76 for this sample, but with lower turnover for classes below this size. More careful analysis confirms a significant positive effect of class size on the probability of leaving for classes above the mean, but shows no practically significant effect for classes below the mean. According to the authors, theory would predict an increasing effect of larger classes on teacher quits but not layoffs, and an increasing effect of smaller classes on teacher layoffs but not quits. In this framework, the data indicate that larger class sizes indeed lead to higher teacher quits, but that smaller class sizes do not result in higher teacher layoffs. (The authors note that most New York school districts experienced falling enrollments during the period of the study, and tests of variation in effect due to the rate of enrollment change proved inconclusive.) They also suggest that class size could be endogenous, if certain teachers are more popular with students, happier in their work, and well liked by administrators, leading to both larger class assignments and higher retention. This hypothesis would actually reduce the chance of finding the observed positive relationship between class size and teacher turnover. No significant association was found between number of classes taught and teacher turnover. The authors suggest that any effect of this variable could be subordinate to the strong effect of larger class sizes and/or obscured by the assignment of administrative tasks to teachers with fewer classes. Reducing the proportion of classes taught in a teacher’s area of certification increased the likelihood of separation. This result holds up in a model using only tenured teachers, indicating that it is a quit effect and not a layoff effect. The probability of separation decreased with the number of years on the job. The turnover rate in the first year was 0.331, followed by 0.229 for the remaining two years before the tenure decision. The turnover rate in year nine was 0.091. Higher salaries resulted in fewer separations. This study indicates that,
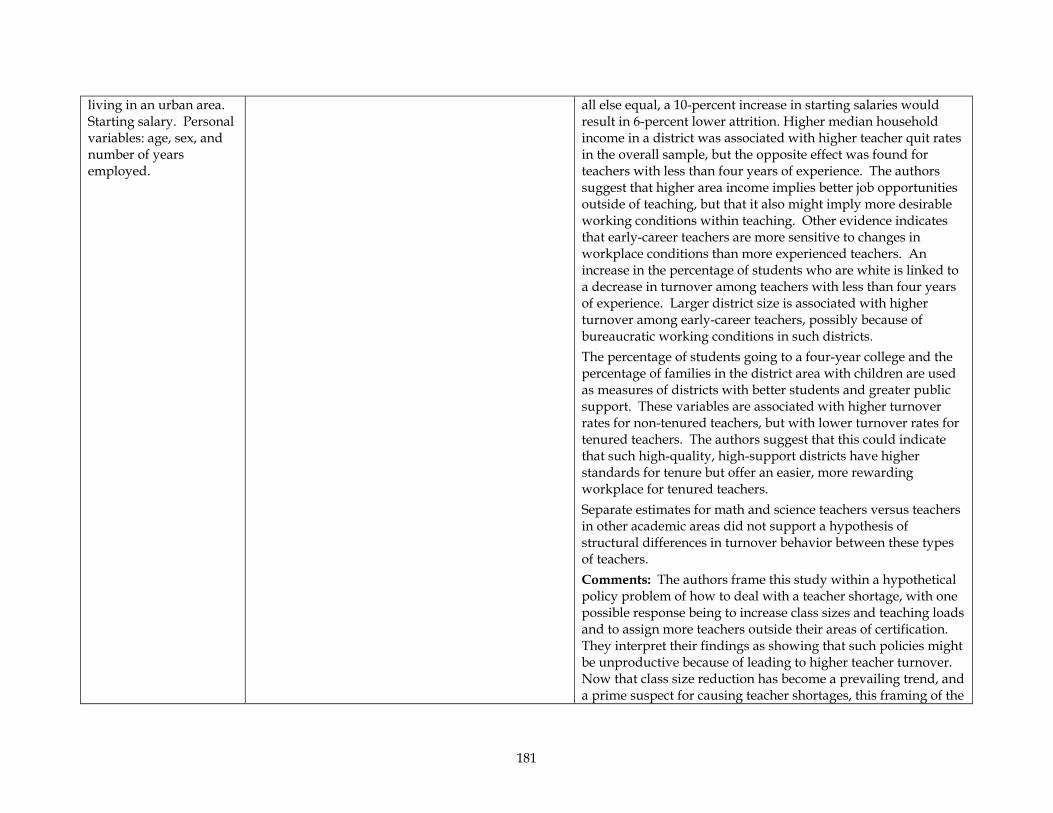
181
living in an urban area. Starting salary. Personal variables: age, sex, and number of years employed.
all else equal, a 10-percent increase in starting salaries would result in 6-percent lower attrition. Higher median household income in a district was associated with higher teacher quit rates in the overall sample, but the opposite effect was found for teachers with less than four years of experience. The authors suggest that higher area income implies better job opportunities outside of teaching, but that it also might imply more desirable working conditions within teaching. Other evidence indicates that early-career teachers are more sensitive to changes in workplace conditions than more experienced teachers. An increase in the percentage of students who are white is linked to a decrease in turnover among teachers with less than four years of experience. Larger district size is associated with higher turnover among early-career teachers, possibly because of bureaucratic working conditions in such districts. The percentage of students going to a four-year college and the percentage of families in the district area with children are used as measures of districts with better students and greater public support. These variables are associated with higher turnover rates for non-tenured teachers, but with lower turnover rates for tenured teachers. The authors suggest that this could indicate that such high-quality, high-support districts have higher standards for tenure but offer an easier, more rewarding workplace for tenured teachers. Separate estimates for math and science teachers versus teachers in other academic areas did not support a hypothesis of structural differences in turnover behavior between these types of teachers. Comments: The authors frame this study within a hypothetical policy problem of how to deal with a teacher shortage, with one possible response being to increase class sizes and teaching loads and to assign more teachers outside their areas of certification. They interpret their findings as showing that such policies might be unproductive because of leading to higher teacher turnover. Now that class size reduction has become a prevailing trend, and a prime suspect for causing teacher shortages, this framing of the
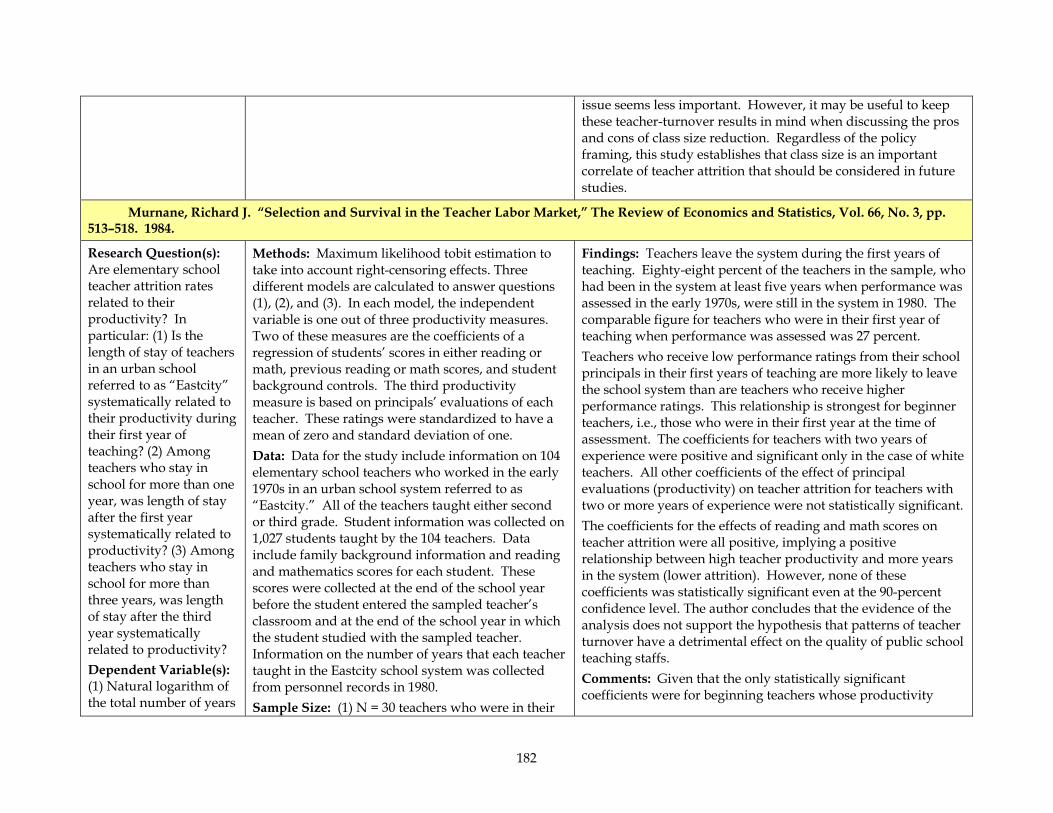
182
issue seems less important. However, it may be useful to keep these teacher-turnover results in mind when discussing the pros and cons of class size reduction. Regardless of the policy framing, this study establishes that class size is an important correlate of teacher attrition that should be considered in future studies.
Murnane, Richard J. “Selection and Survival in the Teacher Labor Market,” The Review of Economics and Statistics, Vol. 66, No. 3, pp. 513–518. 1984.
Research Question(s): Are elementary school teacher attrition rates related to their productivity? In particular: (1) Is the length of stay of teachers in an urban school referred to as “Eastcity” systematically related to their productivity during their first year of teaching? (2) Among teachers who stay in school for more than one year, was length of stay after the first year systematically related to productivity? (3) Among teachers who stay in school for more than three years, was length of stay after the third year systematically related to productivity? Dependent Variable(s): (1) Natural logarithm of the total number of years
Methods: Maximum likelihood tobit estimation to take into account right-censoring effects. Three different models are calculated to answer questions (1), (2), and (3). In each model, the independent variable is one out of three productivity measures. Two of these measures are the coefficients of a regression of students’ scores in either reading or math, previous reading or math scores, and student background controls. The third productivity measure is based on principals’ evaluations of each teacher. These ratings were standardized to have a mean of zero and standard deviation of one. Data: Data for the study include information on 104 elementary school teachers who worked in the early 1970s in an urban school system referred to as “Eastcity.” All of the teachers taught either second or third grade. Student information was collected on 1,027 students taught by the 104 teachers. Data include family background information and reading and mathematics scores for each student. These scores were collected at the end of the school year before the student entered the sampled teacher’s classroom and at the end of the school year in which the student studied with the sampled teacher. Information on the number of years that each teacher taught in the Eastcity school system was collected from personnel records in 1980. Sample Size: (1) N = 30 teachers who were in their
Findings: Teachers leave the system during the first years of teaching. Eighty-eight percent of the teachers in the sample, who had been in the system at least five years when performance was assessed in the early 1970s, were still in the system in 1980. The comparable figure for teachers who were in their first year of teaching when performance was assessed was 27 percent. Teachers who receive low performance ratings from their school principals in their first years of teaching are more likely to leave the school system than are teachers who receive higher performance ratings. This relationship is strongest for beginner teachers, i.e., those who were in their first year at the time of assessment. The coefficients for teachers with two years of experience were positive and significant only in the case of white teachers. All other coefficients of the effect of principal evaluations (productivity) on teacher attrition for teachers with two or more years of experience were not statistically significant. The coefficients for the effects of reading and math scores on teacher attrition were all positive, implying a positive relationship between high teacher productivity and more years in the system (lower attrition). However, none of these coefficients was statistically significant even at the 90-percent confidence level. The author concludes that the evidence of the analysis does not support the hypothesis that patterns of teacher turnover have a detrimental effect on the quality of public school teaching staffs. Comments: Given that the only statistically significant coefficients were for beginning teachers whose productivity
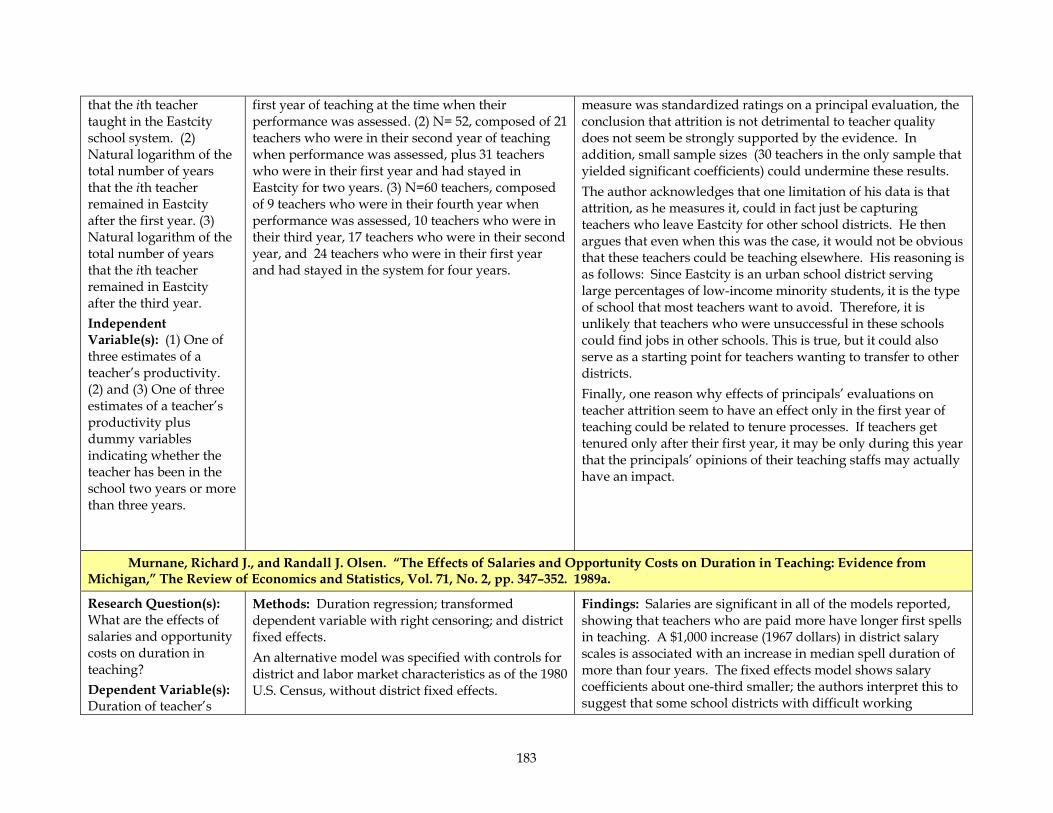
183
that the ith teacher taught in the Eastcity school system. (2) Natural logarithm of the total number of years that the ith teacher remained in Eastcity after the first year. (3) Natural logarithm of the total number of years that the ith teacher remained in Eastcity after the third year. Independent Variable(s): (1) One of three estimates of a teacher’s productivity. (2) and (3) One of three estimates of a teacher’s productivity plus dummy variables indicating whether the teacher has been in the school two years or more than three years.
first year of teaching at the time when their performance was assessed. (2) N= 52, composed of 21 teachers who were in their second year of teaching when performance was assessed, plus 31 teachers who were in their first year and had stayed in Eastcity for two years. (3) N=60 teachers, composed of 9 teachers who were in their fourth year when performance was assessed, 10 teachers who were in their third year, 17 teachers who were in their second year, and 24 teachers who were in their first year and had stayed in the system for four years.
measure was standardized ratings on a principal evaluation, the conclusion that attrition is not detrimental to teacher quality does not seem be strongly supported by the evidence. In addition, small sample sizes (30 teachers in the only sample that yielded significant coefficients) could undermine these results. The author acknowledges that one limitation of his data is that attrition, as he measures it, could in fact just be capturing teachers who leave Eastcity for other school districts. He then argues that even when this was the case, it would not be obvious that these teachers could be teaching elsewhere. His reasoning is as follows: Since Eastcity is an urban school district serving large percentages of low-income minority students, it is the type of school that most teachers want to avoid. Therefore, it is unlikely that teachers who were unsuccessful in these schools could find jobs in other schools. This is true, but it could also serve as a starting point for teachers wanting to transfer to other districts. Finally, one reason why effects of principals’ evaluations on teacher attrition seem to have an effect only in the first year of teaching could be related to tenure processes. If teachers get tenured only after their first year, it may be only during this year that the principals’ opinions of their teaching staffs may actually have an impact.
Murnane, Richard J., and Randall J. Olsen. “The Effects of Salaries and Opportunity Costs on Duration in Teaching: Evidence from Michigan,” The Review of Economics and Statistics, Vol. 71, No. 2, pp. 347–352. 1989a.
Research Question(s): What are the effects of salaries and opportunity costs on duration in teaching? Dependent Variable(s): Duration of teacher’s
Methods: Duration regression; transformed dependent variable with right censoring; and district fixed effects. An alternative model was specified with controls for district and labor market characteristics as of the 1980 U.S. Census, without district fixed effects.
Findings: Salaries are significant in all of the models reported, showing that teachers who are paid more have longer first spells in teaching. A $1,000 increase (1967 dollars) in district salary scales is associated with an increase in median spell duration of more than four years. The fixed effects model shows salary coefficients about one-third smaller; the authors interpret this to suggest that some school districts with difficult working
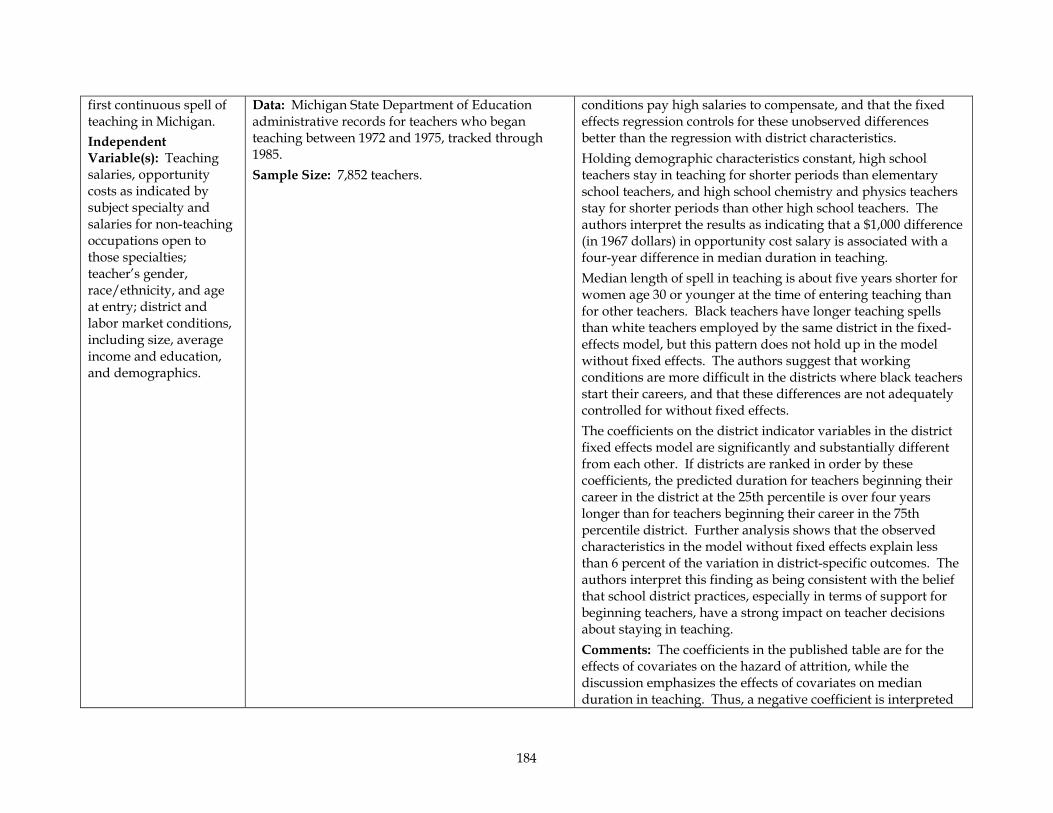
184
first continuous spell of teaching in Michigan. Independent Variable(s): Teaching salaries, opportunity costs as indicated by subject specialty and salaries for non-teaching occupations open to those specialties; teacher’s gender, race/ethnicity, and age at entry; district and labor market conditions, including size, average income and education, and demographics.
Data: Michigan State Department of Education administrative records for teachers who began teaching between 1972 and 1975, tracked through 1985. Sample Size: 7,852 teachers.
conditions pay high salaries to compensate, and that the fixed effects regression controls for these unobserved differences better than the regression with district characteristics. Holding demographic characteristics constant, high school teachers stay in teaching for shorter periods than elementary school teachers, and high school chemistry and physics teachers stay for shorter periods than other high school teachers. The authors interpret the results as indicating that a $1,000 difference (in 1967 dollars) in opportunity cost salary is associated with a four-year difference in median duration in teaching. Median length of spell in teaching is about five years shorter for women age 30 or younger at the time of entering teaching than for other teachers. Black teachers have longer teaching spells than white teachers employed by the same district in the fixed-effects model, but this pattern does not hold up in the model without fixed effects. The authors suggest that working conditions are more difficult in the districts where black teachers start their careers, and that these differences are not adequately controlled for without fixed effects. The coefficients on the district indicator variables in the district fixed effects model are significantly and substantially different from each other. If districts are ranked in order by these coefficients, the predicted duration for teachers beginning their career in the district at the 25th percentile is over four years longer than for teachers beginning their career in the 75th percentile district. Further analysis shows that the observed characteristics in the model without fixed effects explain less than 6 percent of the variation in district-specific outcomes. The authors interpret this finding as being consistent with the belief that school district practices, especially in terms of support for beginning teachers, have a strong impact on teacher decisions about staying in teaching. Comments: The coefficients in the published table are for the effects of covariates on the hazard of attrition, while the discussion emphasizes the effects of covariates on median duration in teaching. Thus, a negative coefficient is interpreted
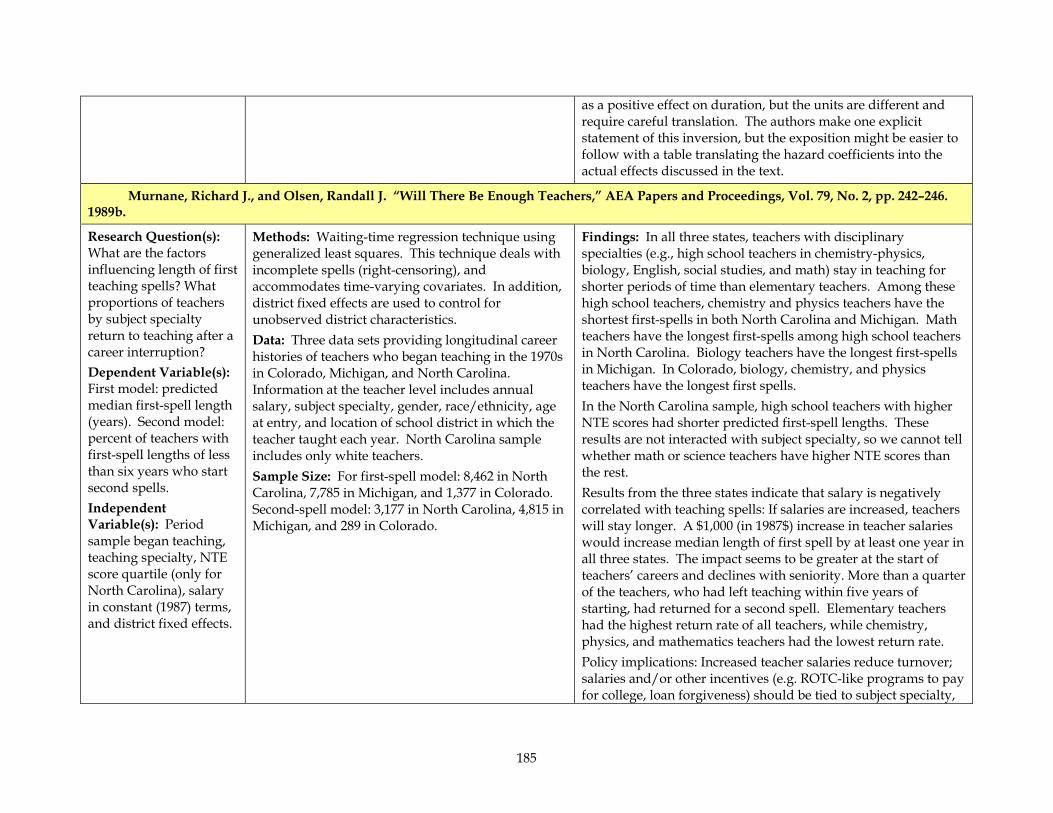
185
as a positive effect on duration, but the units are different and require careful translation. The authors make one explicit statement of this inversion, but the exposition might be easier to follow with a table translating the hazard coefficients into the actual effects discussed in the text.
Murnane, Richard J., and Olsen, Randall J. “Will There Be Enough Teachers,” AEA Papers and Proceedings, Vol. 79, No. 2, pp. 242–246. 1989b.
Research Question(s): What are the factors influencing length of first teaching spells? What proportions of teachers by subject specialty return to teaching after a career interruption? Dependent Variable(s): First model: predicted median first-spell length (years). Second model: percent of teachers with first-spell lengths of less than six years who start second spells. Independent Variable(s): Period sample began teaching, teaching specialty, NTE score quartile (only for North Carolina), salary in constant (1987) terms, and district fixed effects.
Methods: Waiting-time regression technique using generalized least squares. This technique deals with incomplete spells (right-censoring), and accommodates time-varying covariates. In addition, district fixed effects are used to control for unobserved district characteristics. Data: Three data sets providing longitudinal career histories of teachers who began teaching in the 1970s in Colorado, Michigan, and North Carolina. Information at the teacher level includes annual salary, subject specialty, gender, race/ethnicity, age at entry, and location of school district in which the teacher taught each year. North Carolina sample includes only white teachers. Sample Size: For first-spell model: 8,462 in North Carolina, 7,785 in Michigan, and 1,377 in Colorado. Second-spell model: 3,177 in North Carolina, 4,815 in Michigan, and 289 in Colorado.
Findings: In all three states, teachers with disciplinary specialties (e.g., high school teachers in chemistry-physics, biology, English, social studies, and math) stay in teaching for shorter periods of time than elementary teachers. Among these high school teachers, chemistry and physics teachers have the shortest first-spells in both North Carolina and Michigan. Math teachers have the longest first-spells among high school teachers in North Carolina. Biology teachers have the longest first-spells in Michigan. In Colorado, biology, chemistry, and physics teachers have the longest first spells. In the North Carolina sample, high school teachers with higher NTE scores had shorter predicted first-spell lengths. These results are not interacted with subject specialty, so we cannot tell whether math or science teachers have higher NTE scores than the rest. Results from the three states indicate that salary is negatively correlated with teaching spells: If salaries are increased, teachers will stay longer. A $1,000 (in 1987$) increase in teacher salaries would increase median length of first spell by at least one year in all three states. The impact seems to be greater at the start of teachers’ careers and declines with seniority. More than a quarter of the teachers, who had left teaching within five years of starting, had returned for a second spell. Elementary teachers had the highest return rate of all teachers, while chemistry, physics, and mathematics teachers had the lowest return rate. Policy implications: Increased teacher salaries reduce turnover; salaries and/or other incentives (e.g. ROTC-like programs to pay for college, loan forgiveness) should be tied to subject specialty,
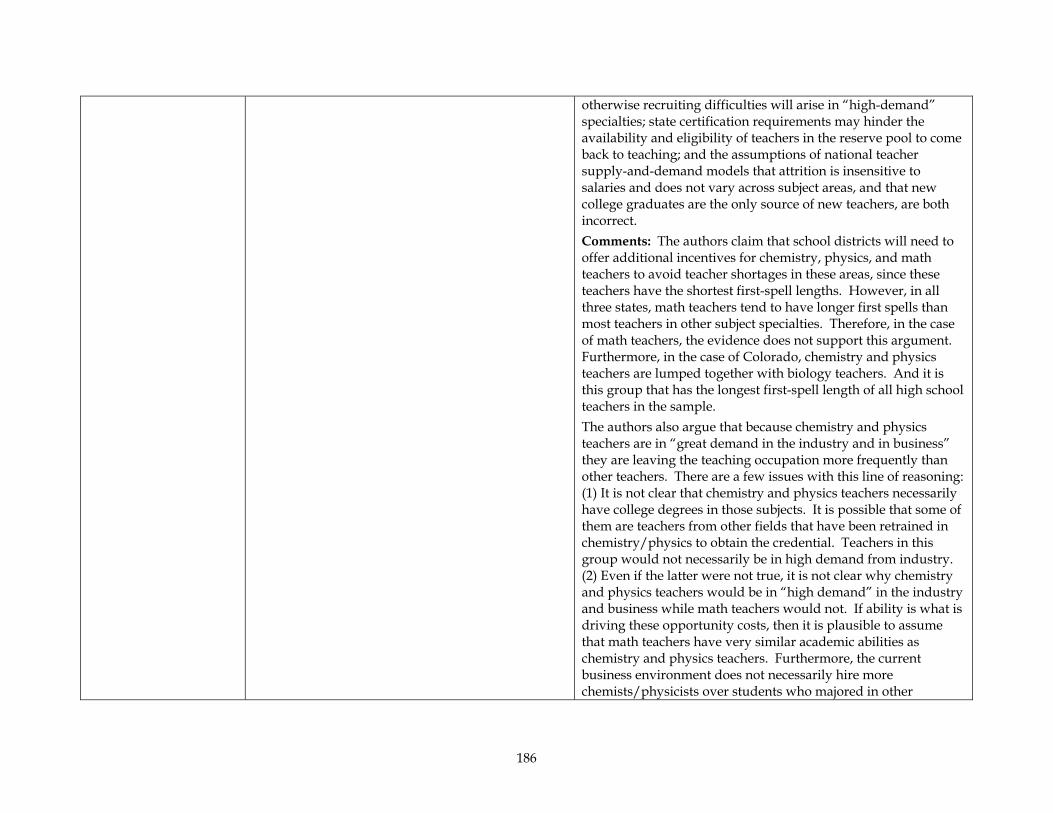
186
otherwise recruiting difficulties will arise in “high-demand” specialties; state certification requirements may hinder the availability and eligibility of teachers in the reserve pool to come back to teaching; and the assumptions of national teacher supply-and-demand models that attrition is insensitive to salaries and does not vary across subject areas, and that new college graduates are the only source of new teachers, are both incorrect. Comments: The authors claim that school districts will need to offer additional incentives for chemistry, physics, and math teachers to avoid teacher shortages in these areas, since these teachers have the shortest first-spell lengths. However, in all three states, math teachers tend to have longer first spells than most teachers in other subject specialties. Therefore, in the case of math teachers, the evidence does not support this argument. Furthermore, in the case of Colorado, chemistry and physics teachers are lumped together with biology teachers. And it is this group that has the longest first-spell length of all high school teachers in the sample. The authors also argue that because chemistry and physics teachers are in “great demand in the industry and in business” they are leaving the teaching occupation more frequently than other teachers. There are a few issues with this line of reasoning: (1) It is not clear that chemistry and physics teachers necessarily have college degrees in those subjects. It is possible that some of them are teachers from other fields that have been retrained in chemistry/physics to obtain the credential. Teachers in this group would not necessarily be in high demand from industry. (2) Even if the latter were not true, it is not clear why chemistry and physics teachers would be in “high demand” in the industry and business while math teachers would not. If ability is what is driving these opportunity costs, then it is plausible to assume that math teachers have very similar academic abilities as chemistry and physics teachers. Furthermore, the current business environment does not necessarily hire more chemists/physicists over students who majored in other
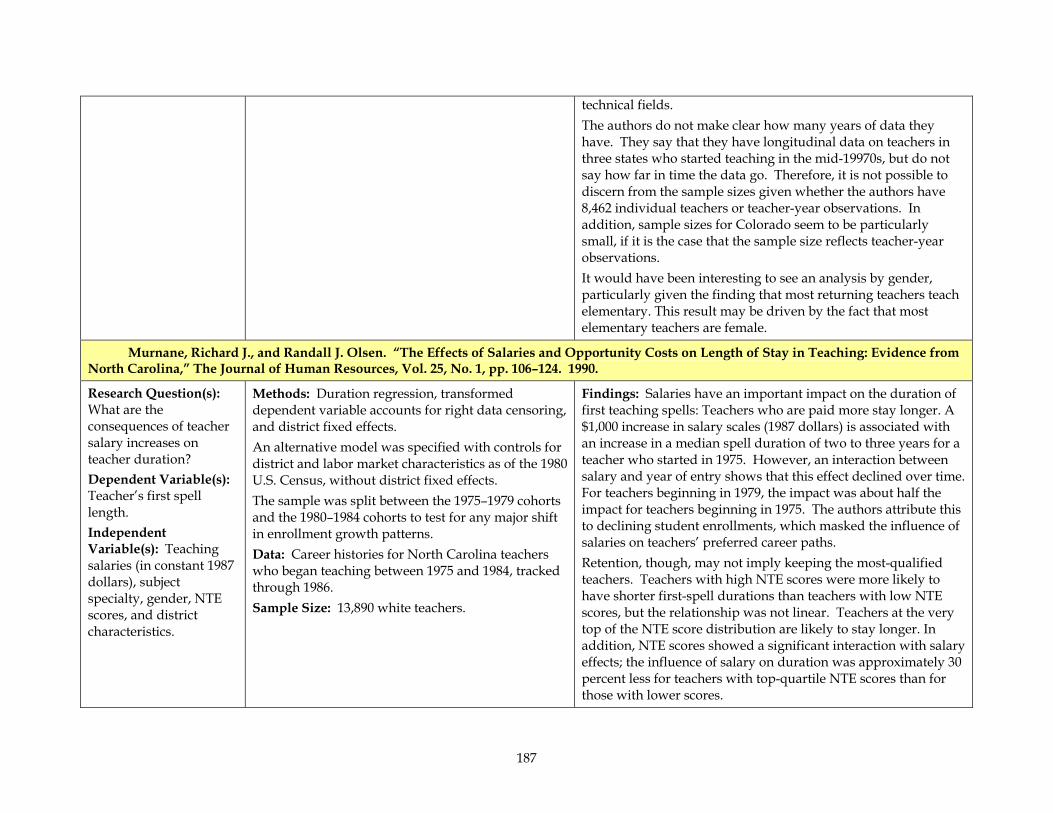
187
technical fields. The authors do not make clear how many years of data they have. They say that they have longitudinal data on teachers in three states who started teaching in the mid-19970s, but do not say how far in time the data go. Therefore, it is not possible to discern from the sample sizes given whether the authors have 8,462 individual teachers or teacher-year observations. In addition, sample sizes for Colorado seem to be particularly small, if it is the case that the sample size reflects teacher-year observations. It would have been interesting to see an analysis by gender, particularly given the finding that most returning teachers teach elementary. This result may be driven by the fact that most elementary teachers are female.
Murnane, Richard J., and Randall J. Olsen. “The Effects of Salaries and Opportunity Costs on Length of Stay in Teaching: Evidence from North Carolina,” The Journal of Human Resources, Vol. 25, No. 1, pp. 106–124. 1990.
Research Question(s): What are the consequences of teacher salary increases on teacher duration? Dependent Variable(s): Teacher’s first spell length. Independent Variable(s): Teaching salaries (in constant 1987 dollars), subject specialty, gender, NTE scores, and district characteristics.
Methods: Duration regression, transformed dependent variable accounts for right data censoring, and district fixed effects. An alternative model was specified with controls for district and labor market characteristics as of the 1980 U.S. Census, without district fixed effects. The sample was split between the 1975–1979 cohorts and the 1980–1984 cohorts to test for any major shift in enrollment growth patterns. Data: Career histories for North Carolina teachers who began teaching between 1975 and 1984, tracked through 1986. Sample Size: 13,890 white teachers.
Findings: Salaries have an important impact on the duration of first teaching spells: Teachers who are paid more stay longer. A $1,000 increase in salary scales (1987 dollars) is associated with an increase in a median spell duration of two to three years for a teacher who started in 1975. However, an interaction between salary and year of entry shows that this effect declined over time. For teachers beginning in 1979, the impact was about half the impact for teachers beginning in 1975. The authors attribute this to declining student enrollments, which masked the influence of salaries on teachers’ preferred career paths. Retention, though, may not imply keeping the most-qualified teachers. Teachers with high NTE scores were more likely to have shorter first-spell durations than teachers with low NTE scores, but the relationship was not linear. Teachers at the very top of the NTE score distribution are likely to stay longer. In addition, NTE scores showed a significant interaction with salary effects; the influence of salary on duration was approximately 30 percent less for teachers with top-quartile NTE scores than for those with lower scores.
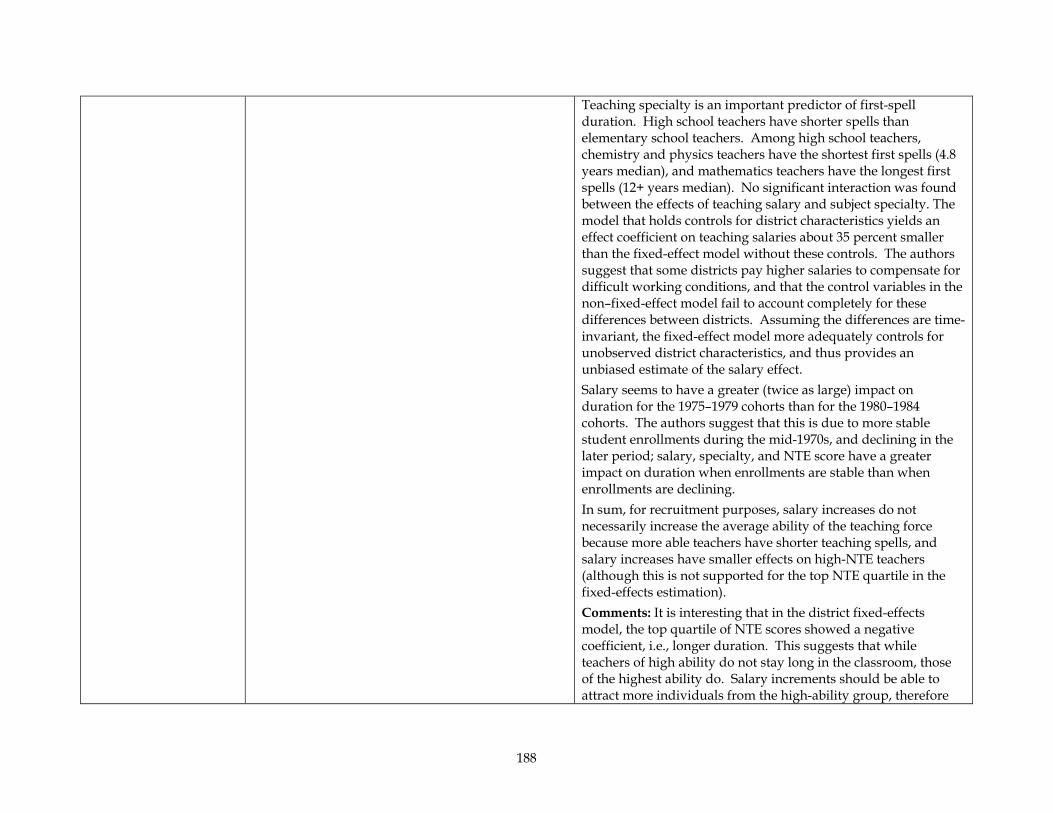
188
Teaching specialty is an important predictor of first-spell duration. High school teachers have shorter spells than elementary school teachers. Among high school teachers, chemistry and physics teachers have the shortest first spells (4.8 years median), and mathematics teachers have the longest first spells (12+ years median). No significant interaction was found between the effects of teaching salary and subject specialty. The model that holds controls for district characteristics yields an effect coefficient on teaching salaries about 35 percent smaller than the fixed-effect model without these controls. The authors suggest that some districts pay higher salaries to compensate for difficult working conditions, and that the control variables in the non–fixed-effect model fail to account completely for these differences between districts. Assuming the differences are time-invariant, the fixed-effect model more adequately controls for unobserved district characteristics, and thus provides an unbiased estimate of the salary effect. Salary seems to have a greater (twice as large) impact on duration for the 1975–1979 cohorts than for the 1980–1984 cohorts. The authors suggest that this is due to more stable student enrollments during the mid-1970s, and declining in the later period; salary, specialty, and NTE score have a greater impact on duration when enrollments are stable than when enrollments are declining. In sum, for recruitment purposes, salary increases do not necessarily increase the average ability of the teaching force because more able teachers have shorter teaching spells, and salary increases have smaller effects on high-NTE teachers (although this is not supported for the top NTE quartile in the fixed-effects estimation). Comments: It is interesting that in the district fixed-effects model, the top quartile of NTE scores showed a negative coefficient, i.e., longer duration. This suggests that while teachers of high ability do not stay long in the classroom, those of the highest ability do. Salary increments should be able to attract more individuals from the high-ability group, therefore
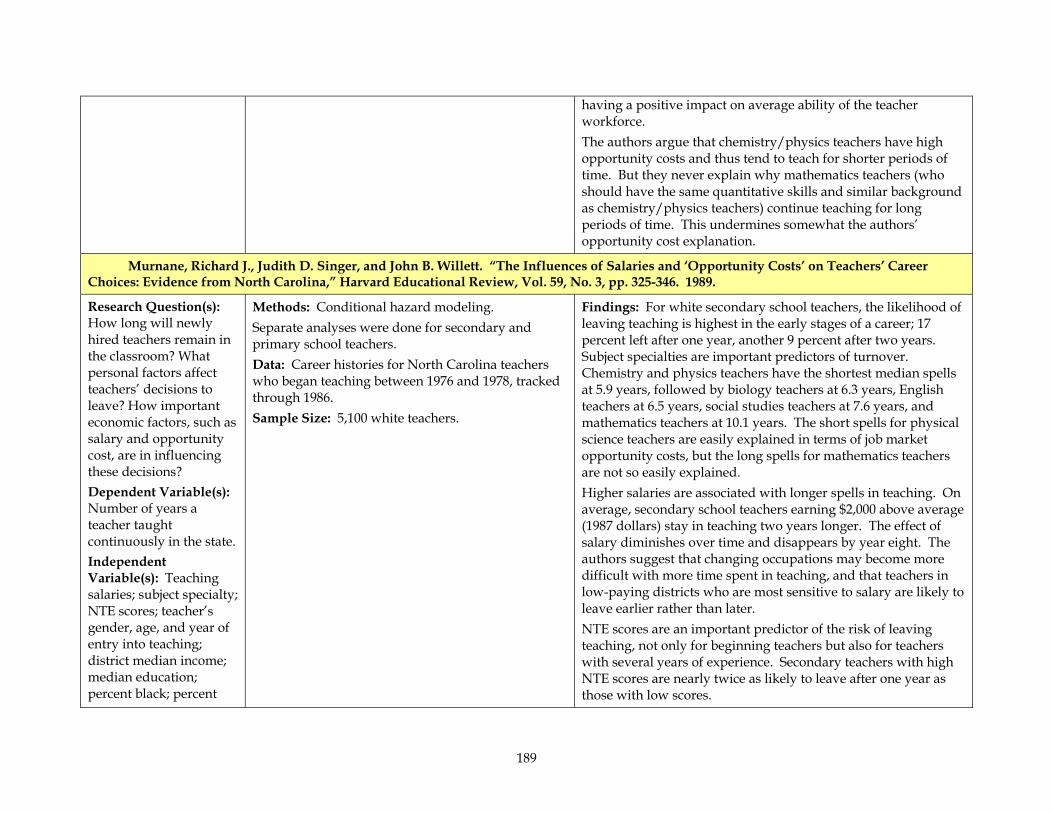
189
having a positive impact on average ability of the teacher workforce. The authors argue that chemistry/physics teachers have high opportunity costs and thus tend to teach for shorter periods of time. But they never explain why mathematics teachers (who should have the same quantitative skills and similar background as chemistry/physics teachers) continue teaching for long periods of time. This undermines somewhat the authors’ opportunity cost explanation.
Murnane, Richard J., Judith D. Singer, and John B. Willett. “The Influences of Salaries and ‘Opportunity Costs’ on Teachers’ Career Choices: Evidence from North Carolina,” Harvard Educational Review, Vol. 59, No. 3, pp. 325-346. 1989.
Research Question(s): How long will newly hired teachers remain in the classroom? What personal factors affect teachers’ decisions to leave? How important economic factors, such as salary and opportunity cost, are in influencing these decisions? Dependent Variable(s): Number of years a teacher taught continuously in the state. Independent Variable(s): Teaching salaries; subject specialty; NTE scores; teacher’s gender, age, and year of entry into teaching; district median income; median education; percent black; percent
Methods: Conditional hazard modeling. Separate analyses were done for secondary and primary school teachers. Data: Career histories for North Carolina teachers who began teaching between 1976 and 1978, tracked through 1986. Sample Size: 5,100 white teachers.
Findings: For white secondary school teachers, the likelihood of leaving teaching is highest in the early stages of a career; 17 percent left after one year, another 9 percent after two years. Subject specialties are important predictors of turnover. Chemistry and physics teachers have the shortest median spells at 5.9 years, followed by biology teachers at 6.3 years, English teachers at 6.5 years, social studies teachers at 7.6 years, and mathematics teachers at 10.1 years. The short spells for physical science teachers are easily explained in terms of job market opportunity costs, but the long spells for mathematics teachers are not so easily explained. Higher salaries are associated with longer spells in teaching. On average, secondary school teachers earning $2,000 above average (1987 dollars) stay in teaching two years longer. The effect of salary diminishes over time and disappears by year eight. The authors suggest that changing occupations may become more difficult with more time spent in teaching, and that teachers in low-paying districts who are most sensitive to salary are likely to leave earlier rather than later. NTE scores are an important predictor of the risk of leaving teaching, not only for beginning teachers but also for teachers with several years of experience. Secondary teachers with high NTE scores are nearly twice as likely to leave after one year as those with low scores.
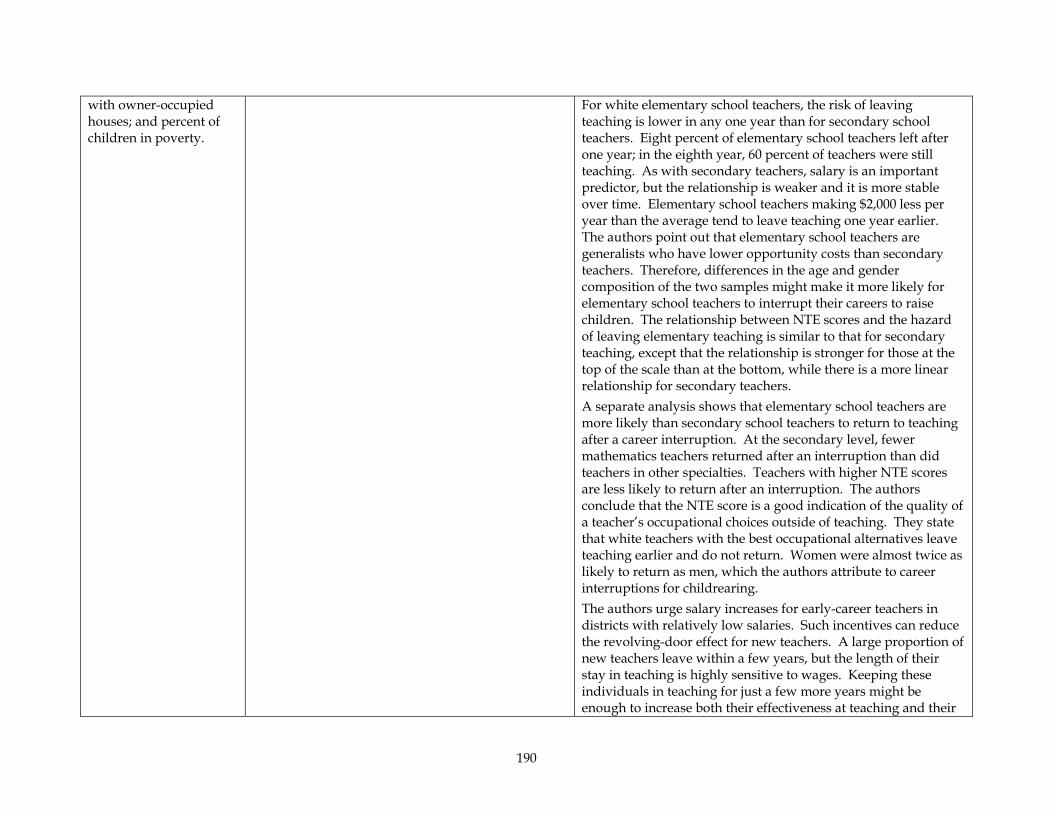
190
with owner-occupied houses; and percent of children in poverty.
For white elementary school teachers, the risk of leaving teaching is lower in any one year than for secondary school teachers. Eight percent of elementary school teachers left after one year; in the eighth year, 60 percent of teachers were still teaching. As with secondary teachers, salary is an important predictor, but the relationship is weaker and it is more stable over time. Elementary school teachers making $2,000 less per year than the average tend to leave teaching one year earlier. The authors point out that elementary school teachers are generalists who have lower opportunity costs than secondary teachers. Therefore, differences in the age and gender composition of the two samples might make it more likely for elementary school teachers to interrupt their careers to raise children. The relationship between NTE scores and the hazard of leaving elementary teaching is similar to that for secondary teaching, except that the relationship is stronger for those at the top of the scale than at the bottom, while there is a more linear relationship for secondary teachers. A separate analysis shows that elementary school teachers are more likely than secondary school teachers to return to teaching after a career interruption. At the secondary level, fewer mathematics teachers returned after an interruption than did teachers in other specialties. Teachers with higher NTE scores are less likely to return after an interruption. The authors conclude that the NTE score is a good indication of the quality of a teacher’s occupational choices outside of teaching. They state that white teachers with the best occupational alternatives leave teaching earlier and do not return. Women were almost twice as likely to return as men, which the authors attribute to career interruptions for childrearing. The authors urge salary increases for early-career teachers in districts with relatively low salaries. Such incentives can reduce the revolving-door effect for new teachers. A large proportion of new teachers leave within a few years, but the length of their stay in teaching is highly sensitive to wages. Keeping these individuals in teaching for just a few more years might be enough to increase both their effectiveness at teaching and their
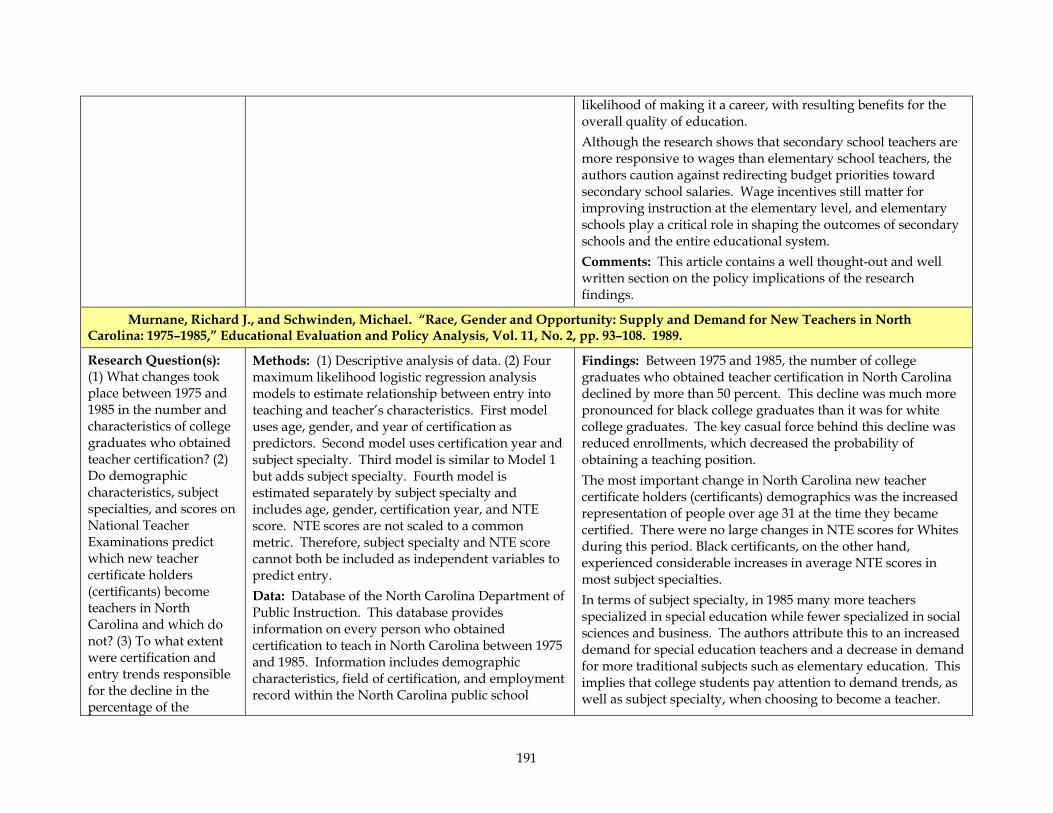
191
likelihood of making it a career, with resulting benefits for the overall quality of education. Although the research shows that secondary school teachers are more responsive to wages than elementary school teachers, the authors caution against redirecting budget priorities toward secondary school salaries. Wage incentives still matter for improving instruction at the elementary level, and elementary schools play a critical role in shaping the outcomes of secondary schools and the entire educational system. Comments: This article contains a well thought-out and well written section on the policy implications of the research findings.
Murnane, Richard J., and Schwinden, Michael. “Race, Gender and Opportunity: Supply and Demand for New Teachers in North Carolina: 1975–1985,” Educational Evaluation and Policy Analysis, Vol. 11, No. 2, pp. 93–108. 1989.
Research Question(s): (1) What changes took place between 1975 and 1985 in the number and characteristics of college graduates who obtained teacher certification? (2) Do demographic characteristics, subject specialties, and scores on National Teacher Examinations predict which new teacher certificate holders (certificants) become teachers in North Carolina and which do not? (3) To what extent were certification and entry trends responsible for the decline in the percentage of the
Methods: (1) Descriptive analysis of data. (2) Four maximum likelihood logistic regression analysis models to estimate relationship between entry into teaching and teacher’s characteristics. First model uses age, gender, and year of certification as predictors. Second model uses certification year and subject specialty. Third model is similar to Model 1 but adds subject specialty. Fourth model is estimated separately by subject specialty and includes age, gender, certification year, and NTE score. NTE scores are not scaled to a common metric. Therefore, subject specialty and NTE score cannot both be included as independent variables to predict entry. Data: Database of the North Carolina Department of Public Instruction. This database provides information on every person who obtained certification to teach in North Carolina between 1975 and 1985. Information includes demographic characteristics, field of certification, and employment record within the North Carolina public school
Findings: Between 1975 and 1985, the number of college graduates who obtained teacher certification in North Carolina declined by more than 50 percent. This decline was much more pronounced for black college graduates than it was for white college graduates. The key casual force behind this decline was reduced enrollments, which decreased the probability of obtaining a teaching position. The most important change in North Carolina new teacher certificate holders (certificants) demographics was the increased representation of people over age 31 at the time they became certified. There were no large changes in NTE scores for Whites during this period. Black certificants, on the other hand, experienced considerable increases in average NTE scores in most subject specialties. In terms of subject specialty, in 1985 many more teachers specialized in special education while fewer specialized in social sciences and business. The authors attribute this to an increased demand for special education teachers and a decrease in demand for more traditional subjects such as elementary education. This implies that college students pay attention to demand trends, as well as subject specialty, when choosing to become a teacher.

192
nation’s schoolteachers who are black? Dependent Variable(s): Entry into teaching (dichotomous). Independent Variable(s): Age, gender, year in which certification was obtained, subject specialty, and NTE score.
system. Analysis is focused on persons classified as either black or white and who had no teaching experience before obtaining certification. Teachers may no longer appear in the dataset when they cease teaching in North Carolina or when they have moved to another state. Sample Size: 47,403.
The authors find that the estimated probability of entry into teaching differs according to race, gender, subject specialty, and NTE scores. White certificants had a lower probability of entering teaching in 1985 than they had in 1975. Black certificants had a higher entry probability in 1985. In 1975, for both White and Black certificants, predicted entry probabilities were higher for women than for men. In 1985, however, the estimated probability of entry for white women was considerably lower, whereas the estimated entry probability for all other groups increased. In most subject specialties, entry probabilities were associated with the proportion of teachers holding certain subject specialties during that year. For example, an individual holding a special education degree was much more likely to enter teaching in 1975, but not in 1985 when there were many more certificants in this specialty. In the case of certificants with math and science specialties, however, the higher probabilities of entry in 1985 do not seem to be caused by a reduced supply of teachers in these fields. In fact, the percentage of certificants in math and science increased from 1975 to 1985. It appears that higher school demand for teachers in these subjects was driving the increase. In 1985, entry probabilities in all specialties, except for business, were greater for black certificants relative to white certificants. In the case of white female certificants, NTE scores were a significant predictor of entry into teaching in three fields: physics/chemistry, mathematics, and English. White certificants with higher NTE scores were less likely to enter teaching. In the case of black certificants, however, higher NTE scores were associated with a higher probability of entry. This may be due to some form of discrimination in the market (i.e., able white individuals find better opportunities outside of teaching, but blacks do not) or to the fact that more blacks majored in “high-demand” subjects such as special education and the sciences. The decline in the percentage of schoolteachers who are black was in part attributed to the NTE requirement for certification.
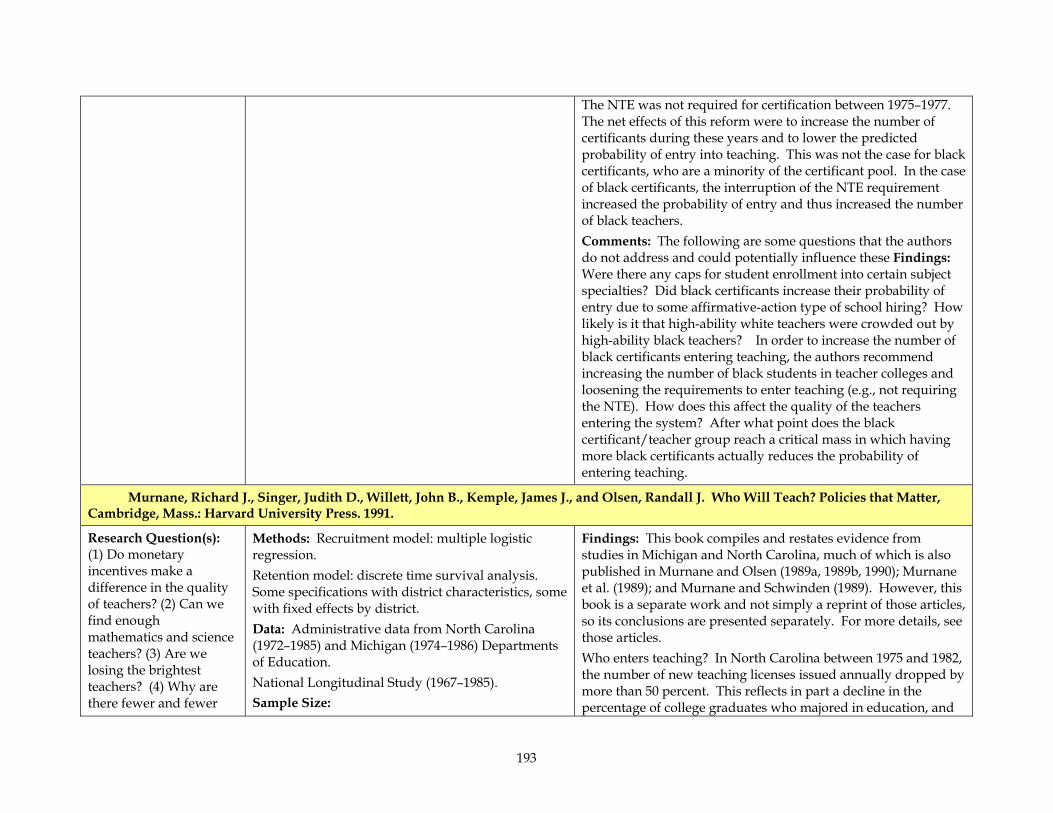
193
The NTE was not required for certification between 1975–1977. The net effects of this reform were to increase the number of certificants during these years and to lower the predicted probability of entry into teaching. This was not the case for black certificants, who are a minority of the certificant pool. In the case of black certificants, the interruption of the NTE requirement increased the probability of entry and thus increased the number of black teachers. Comments: The following are some questions that the authors do not address and could potentially influence these Findings: Were there any caps for student enrollment into certain subject specialties? Did black certificants increase their probability of entry due to some affirmative-action type of school hiring? How likely is it that high-ability white teachers were crowded out by high-ability black teachers? In order to increase the number of black certificants entering teaching, the authors recommend increasing the number of black students in teacher colleges and loosening the requirements to enter teaching (e.g., not requiring the NTE). How does this affect the quality of the teachers entering the system? After what point does the black certificant/teacher group reach a critical mass in which having more black certificants actually reduces the probability of entering teaching.
Murnane, Richard J., Singer, Judith D., Willett, John B., Kemple, James J., and Olsen, Randall J. Who Will Teach? Policies that Matter, Cambridge, Mass.: Harvard University Press. 1991.
Research Question(s): (1) Do monetary incentives make a difference in the quality of teachers? (2) Can we find enough mathematics and science teachers? (3) Are we losing the brightest teachers? (4) Why are there fewer and fewer
Methods: Recruitment model: multiple logistic regression. Retention model: discrete time survival analysis. Some specifications with district characteristics, some with fixed effects by district. Data: Administrative data from North Carolina (1972–1985) and Michigan (1974–1986) Departments of Education. National Longitudinal Study (1967–1985). Sample Size:
Findings: This book compiles and restates evidence from studies in Michigan and North Carolina, much of which is also published in Murnane and Olsen (1989a, 1989b, 1990); Murnane et al. (1989); and Murnane and Schwinden (1989). However, this book is a separate work and not simply a reprint of those articles, so its conclusions are presented separately. For more details, see those articles. Who enters teaching? In North Carolina between 1975 and 1982, the number of new teaching licenses issued annually dropped by more than 50 percent. This reflects in part a decline in the percentage of college graduates who majored in education, and
194
black teachers? Dependent Variable(s): Recruitment: Group-wise percentages of those receiving teaching preparation licenses and group-wise percentages of those who enter the teaching profession. Retention: Attrition (hazard) rates and median duration (survival) times of teachers in teaching positions. Independent Variable(s): Characteristics of individuals: gender, race, academic major, test scores, IQ, subject specialties, year of graduation. District characteristics: proportion minority, proportion of poor children, proportion of workers in professions, median income, and median adult level of education. Policies: wages and changes in licensing requirements.
30,614 teachers who entered Michigan public schools between 1972 and 1981, followed through 1985. 50,502 teachers licensed by North Carolina between 1974 and 1985, followed through 1986. NLS: 2,539 individuals who graduated from colleges nationwide between 1967 and 1985 For retention model: 6.935 teachers who started teaching in Michigan between 1972 and 1975. 9,644 teachers who began their careers in North Carolina between 1974 and 1978.
thus a declining interest in preparing for a teaching career. Nationally, the percentage of graduates with education majors peaked at 28 percent in 1976, but declined to less than 9 percent by 1984. The authors attribute this to demographic and economic changes. Specifically, public school enrollments dropped in the 1970s as the baby-boom generation passed school age, leading to layoffs of teachers and the inability of many education graduates to find teaching jobs. This sent a message to college students in the 1980s that education was profession with fewer jobs and increasingly uncertain job security. Furthermore, teachers’ salaries declined relative to salaries in other fields over the same period. In North Carolina, the average starting salary for teachers dropped from 96 percent of the average starting salary in the private sector for humanities majors in 1975 to 86 percent in 1982. In spite of large nominal increases in their salaries, real wages for teachers dropped by 20 percent during the 1970s due to inflation. During the same period, the representation of black college graduates among teaching licensees in North Carolina declined from about one in five to less than one in ten. Part of the reason for this was a suspension of the NTE requirement in the state from 1975 to 1977, resulting in a higher-than-usual number of black licensees during those years. Using national data, the authors show that minority representation in the teaching force dropped dramatically from the 1960s to the 1980s. They attribute this to two main factors. One is the increasing utilization of standardized tests in licensing requirements, on which black applicants score lower than white applicants in general. The lower pass rate for blacks not only reduces the success rate for applicants, but also discourages many black college students from even pursuing education as a career. The second factor is the increase in job opportunities for blacks in the private sector over the same period of time. In the national sample as well as state samples, female college graduates were more likely to become teachers than male college graduates. The authors point out that the work schedule associated with teaching may be more attractive to women with

195
family responsibilities. They also point out that opportunities for women in fields other than teaching were relatively less attractive during the 1960s and 1970s. Since teacher wages were determined by uniform salary scales based on experience and education, and women in the non-teaching workforce generally earned much less than men during the same period, salaries in teaching were more competitive for women than for men. Nationally, high-IQ college graduates were much less likely to enter teaching than were those with average IQs during the years from 1967 to 1980. And this differential between the two groups was greater at the end of that period than at the beginning. By 1980, a graduate with an IQ of 100 was more than four times as likely to become a teacher than a graduate with an IQ of 130. The distribution of teaching licensees across subject fields changed as well. Changes in national law resulted in an expansion of services to, and enrollment of, special needs students; this created opportunities for teachers trained in special education, and college students responded by obtaining special education licenses in growing proportions. At the same time that the percentage of special education teachers among all licensees more than doubled, the percentage of licensees specializing in business education dropped by more than half. The drop in business education licenses was due to both a decline in business education opportunities in schools and higher income opportunities in the private sector. These trends reflect a major theme of the authors—that the opportunities and incentives available to teachers, as compared with alternative careers, influence the choices of college students and graduates about whether to enter teaching. Who stays in teaching? Based on both North Carolina and Michigan data, the authors report that teachers are most likely to leave teaching during their earlier years, with the first year having the highest hazard. Teachers who survive their early years are likely to remain in teaching for many years. Attrition rates are higher in Michigan than in North Carolina; first-year
196
attrition for Michigan teachers is 21 percent, versus 11 percent for North Carolina teachers. The authors suggest that this is due in part to anticipated student declines and economic weakness in Michigan. Black teachers are more likely than white teachers to work in large urban districts with high degrees of poverty. However, regardless of race, teachers who work in such districts tend to have shorter teaching careers than those working in smaller suburban districts. After controlling for such district characteristics though the use of fixed effects, Black teachers have higher retention than white teachers. Seventy-five percent of black teachers in North Carolina stayed in teaching at least five years, versus 61 percent of white teachers who started in the same districts; among Michigan teachers, the pattern was less dramatic, with comparable rates of 32 percent for black teachers and 30 percent for white teachers. Nevertheless, according to the authors, the declining rate of overall black teacher recruitment, the higher rate of white teacher attrition from such urban districts, and the higher attrition rate among newly hired teachers may imply an accelerating turnover problem for large urban districts. The improvement in non-teaching job opportunities for blacks may also work to bring black teaching careers closer to the pattern for white teachers. In both states studied, entering teachers who were women over 30 years old were less likely to leave teaching than were men of any age, while men in turn were less likely to leave teaching than were women 30 years of age or younger. In Michigan, 41 percent of younger women remained in teaching longer than five years, compared with 64 percent of women who entered teaching at more than 30 years of age. In North Carolina, these percentages were 66 percent and 75 percent, respectively. Compared with men and women over 30, these younger women are most likely to return to teaching after an absence, and while away from teaching are less likely to be employed full time in another occupation. However, the national trend is that, compared with earlier periods, such younger women are increasingly likely to stay in teaching, and increasingly likely to enter other
197
employment when leaving teaching. The authors suggest that this is consistent with the national trend for fewer women to leave the work force for extended periods of child care than in earlier generations. Elementary school teachers have higher retention than secondary school teachers, with median career durations 2.0 years (51 percent) longer in Michigan and more than 3.2 years (41 percent) longer in North Carolina. Among secondary school teachers, those in chemistry and physics have the lowest retention, with median career durations 1.7 years (44 percent) shorter in Michigan and 1.2 years (15 percent) shorter in North Carolina. In North Carolina, but not in Michigan, secondary mathematics teachers have median teaching careers as long as elementary teachers. The authors point out that their data do not distinguish between mathematics teachers trained in calculus and computer programming from teachers prepared to teach introductory mathematics and algebra, but they cite evidence from another state that many secondary mathematics teachers lack the mathematics or science major that would make them competitive for high-paying jobs outside of teaching. The length of a teaching career tends to be much shorter for those with high standardized-test scores than for those with lower scores. North Carolina teachers with high NTE scores are more likely than those with low scores to leave teaching. This difference in attrition rates holds both for beginning teachers and for teachers with ten years of experience. A similar pattern appears in the national sample based on IQ scores, with the highest scoring individuals tending to have the earliest departures from teaching. The authors take this as evidence for the importance of incentives, because higher-scoring teachers have better-paying opportunities outside education than do those with lower scores. Salary incentives matter the most in the first five years on the job, and the effect of salary is positive. Teachers who earn more tend to stay in teaching longer than those who earn less. The cumulative effect of this early-career difference has a permanent
198
effect on the distribution of the teaching force; however, the effect of salary on current attrition rates, conditional on having survived the earlier years, completely dissipates by six to eight years into the career. The authors suggest that opportunities outside teaching decline over time while job efficacy and satisfaction within teaching tend to increase over time; they also suggest that the individuals most sensitive to salary differences are likely to leave teaching early, so that the long-term teaching force consists of individuals less sensitive to such incentives. A comparison between Michigan and North Carolina patterns over time, considering each state’s rate of enrollment growth or decline during the same period, yields the observation that salary incentives have a greater effect on teacher career decisions when demand for teachers is stable or growing than in periods when it is declining. Comments: This is an excellent compilation of several studies, some of which are better executed or have more comprehensive data than others, but all of which appear to be solid research and analysis.
Natriello, Gary, and Zumwalt, Karen. “New Teachers for Urban Schools? The Contribution of the Provisional Teacher Program in New Jersey.” Education and Urban Society Vol. 26, No. 1, pp. 49–62. 1993.
Research Question(s): How well do alternative preparation and certification programs meet the needs of urban schools? Dependent Variable(s): N/A Independent Variable(s): N/A
Methods: Descriptive analysis of longitudinal data. Data: Surveys distributed among alternative and traditional teacher education graduates in New Jersey at various points: last semester of the program (1987), end of first (1988), second (1990), third (1991), and fourth years (1992) of teaching, and at some points in between. Sample Size: N = 316 in the first year of the survey (187 graduates of the traditional program and 129 graduates of the alternative route—response rate for initial year was 87 percent). Sample sizes declined considerably during the next three years of the study.
Findings: This study compares graduates of traditional college-based teacher education programs with graduates of the Provisional Teacher Program in New Jersey (the “alternative route”). This program provides temporary certification for college graduates that have passed the NTE exam in their teaching field and have an employment offer from a public or private school in the state. The study found that alternate-route teachers in New Jersey were more likely to report having lived in an urban community than traditional-route graduates (23 percent versus 14 percent). In addition, they were more likely to be members of racial and ethnic minority groups and to have a facility with a language in addition to English (Spanish was the most common second language of alternative-route teachers).
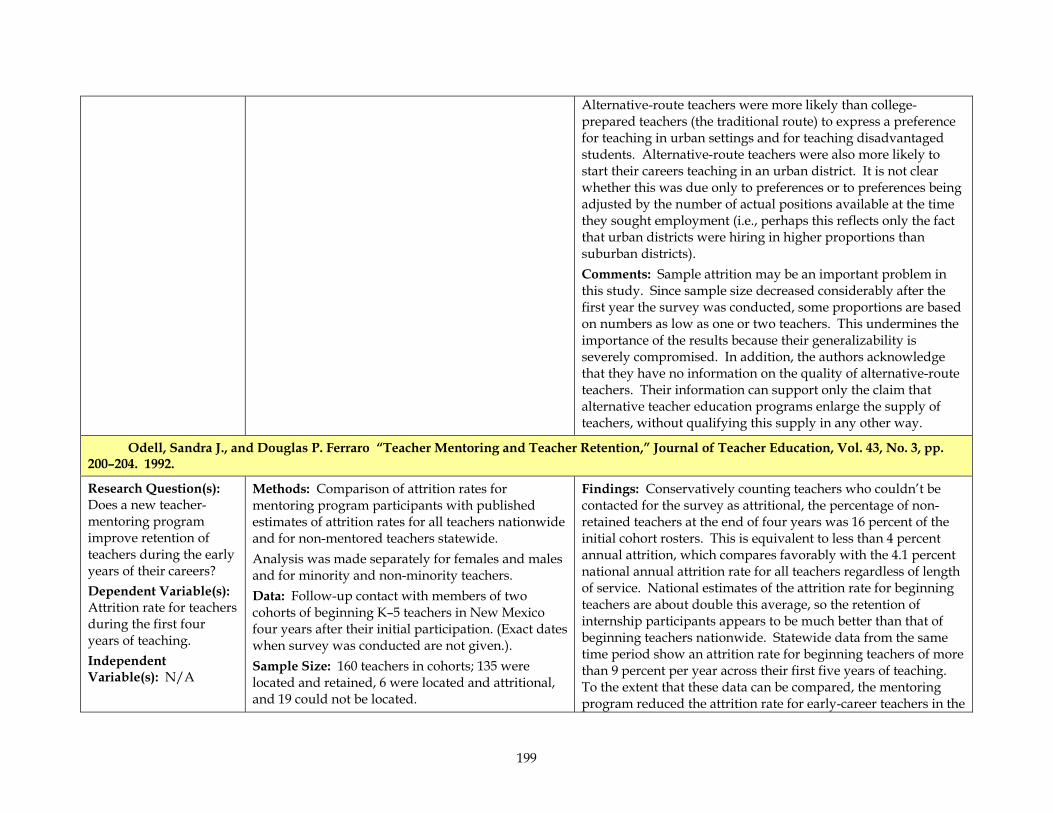
199
Alternative-route teachers were more likely than college-prepared teachers (the traditional route) to express a preference for teaching in urban settings and for teaching disadvantaged students. Alternative-route teachers were also more likely to start their careers teaching in an urban district. It is not clear whether this was due only to preferences or to preferences being adjusted by the number of actual positions available at the time they sought employment (i.e., perhaps this reflects only the fact that urban districts were hiring in higher proportions than suburban districts). Comments: Sample attrition may be an important problem in this study. Since sample size decreased considerably after the first year the survey was conducted, some proportions are based on numbers as low as one or two teachers. This undermines the importance of the results because their generalizability is severely compromised. In addition, the authors acknowledge that they have no information on the quality of alternative-route teachers. Their information can support only the claim that alternative teacher education programs enlarge the supply of teachers, without qualifying this supply in any other way.
Odell, Sandra J., and Douglas P. Ferraro “Teacher Mentoring and Teacher Retention,” Journal of Teacher Education, Vol. 43, No. 3, pp. 200–204. 1992.
Research Question(s): Does a new teacher-mentoring program improve retention of teachers during the early years of their careers? Dependent Variable(s): Attrition rate for teachers during the first four years of teaching. Independent Variable(s): N/A
Methods: Comparison of attrition rates for mentoring program participants with published estimates of attrition rates for all teachers nationwide and for non-mentored teachers statewide. Analysis was made separately for females and males and for minority and non-minority teachers. Data: Follow-up contact with members of two cohorts of beginning K–5 teachers in New Mexico four years after their initial participation. (Exact dates when survey was conducted are not given.). Sample Size: 160 teachers in cohorts; 135 were located and retained, 6 were located and attritional, and 19 could not be located.
Findings: Conservatively counting teachers who couldn’t be contacted for the survey as attritional, the percentage of non-retained teachers at the end of four years was 16 percent of the initial cohort rosters. This is equivalent to less than 4 percent annual attrition, which compares favorably with the 4.1 percent national annual attrition rate for all teachers regardless of length of service. National estimates of the attrition rate for beginning teachers are about double this average, so the retention of internship participants appears to be much better than that of beginning teachers nationwide. Statewide data from the same time period show an attrition rate for beginning teachers of more than 9 percent per year across their first five years of teaching. To the extent that these data can be compared, the mentoring program reduced the attrition rate for early-career teachers in the
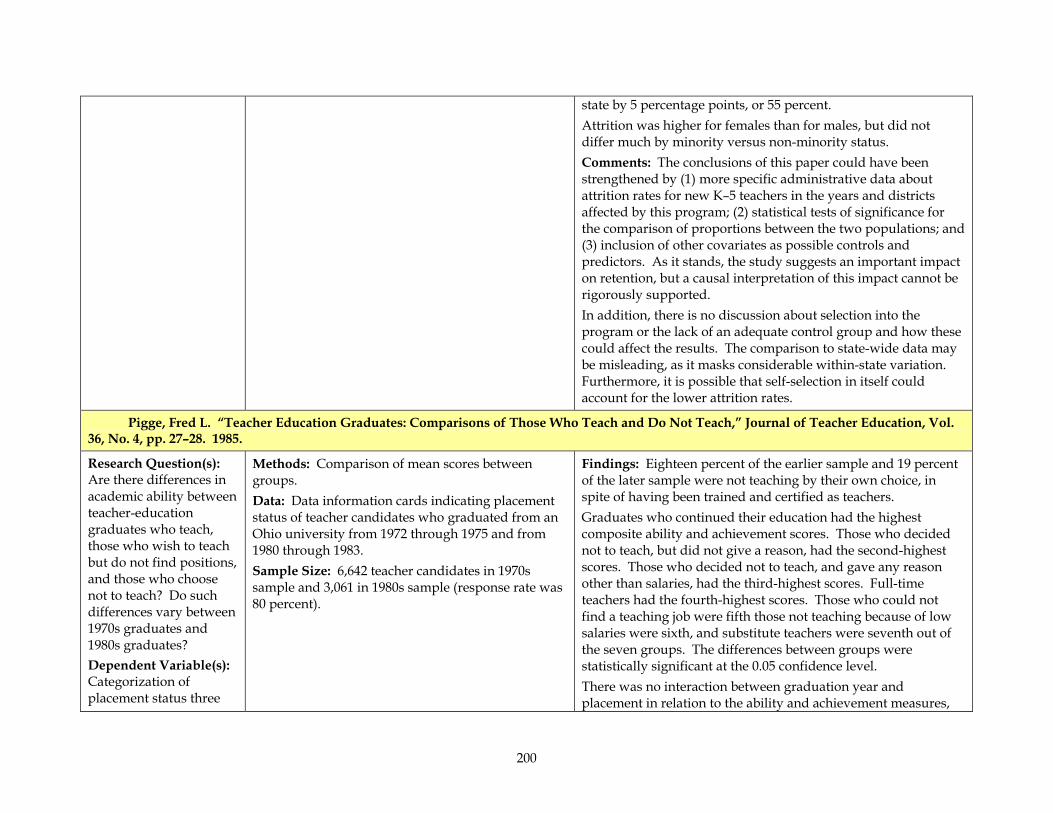
200
state by 5 percentage points, or 55 percent. Attrition was higher for females than for males, but did not differ much by minority versus non-minority status. Comments: The conclusions of this paper could have been strengthened by (1) more specific administrative data about attrition rates for new K–5 teachers in the years and districts affected by this program; (2) statistical tests of significance for the comparison of proportions between the two populations; and (3) inclusion of other covariates as possible controls and predictors. As it stands, the study suggests an important impact on retention, but a causal interpretation of this impact cannot be rigorously supported. In addition, there is no discussion about selection into the program or the lack of an adequate control group and how these could affect the results. The comparison to state-wide data may be misleading, as it masks considerable within-state variation. Furthermore, it is possible that self-selection in itself could account for the lower attrition rates.
Pigge, Fred L. “Teacher Education Graduates: Comparisons of Those Who Teach and Do Not Teach,” Journal of Teacher Education, Vol. 36, No. 4, pp. 27–28. 1985.
Research Question(s): Are there differences in academic ability between teacher-education graduates who teach, those who wish to teach but do not find positions, and those who choose not to teach? Do such differences vary between 1970s graduates and 1980s graduates? Dependent Variable(s): Categorization of placement status three
Methods: Comparison of mean scores between groups. Data: Data information cards indicating placement status of teacher candidates who graduated from an Ohio university from 1972 through 1975 and from 1980 through 1983. Sample Size: 6,642 teacher candidates in 1970s sample and 3,061 in 1980s sample (response rate was 80 percent).
Findings: Eighteen percent of the earlier sample and 19 percent of the later sample were not teaching by their own choice, in spite of having been trained and certified as teachers. Graduates who continued their education had the highest composite ability and achievement scores. Those who decided not to teach, but did not give a reason, had the second-highest scores. Those who decided not to teach, and gave any reason other than salaries, had the third-highest scores. Full-time teachers had the fourth-highest scores. Those who could not find a teaching job were fifth those not teaching because of low salaries were sixth, and substitute teachers were seventh out of the seven groups. The differences between groups were statistically significant at the 0.05 confidence level. There was no interaction between graduation year and placement in relation to the ability and achievement measures,
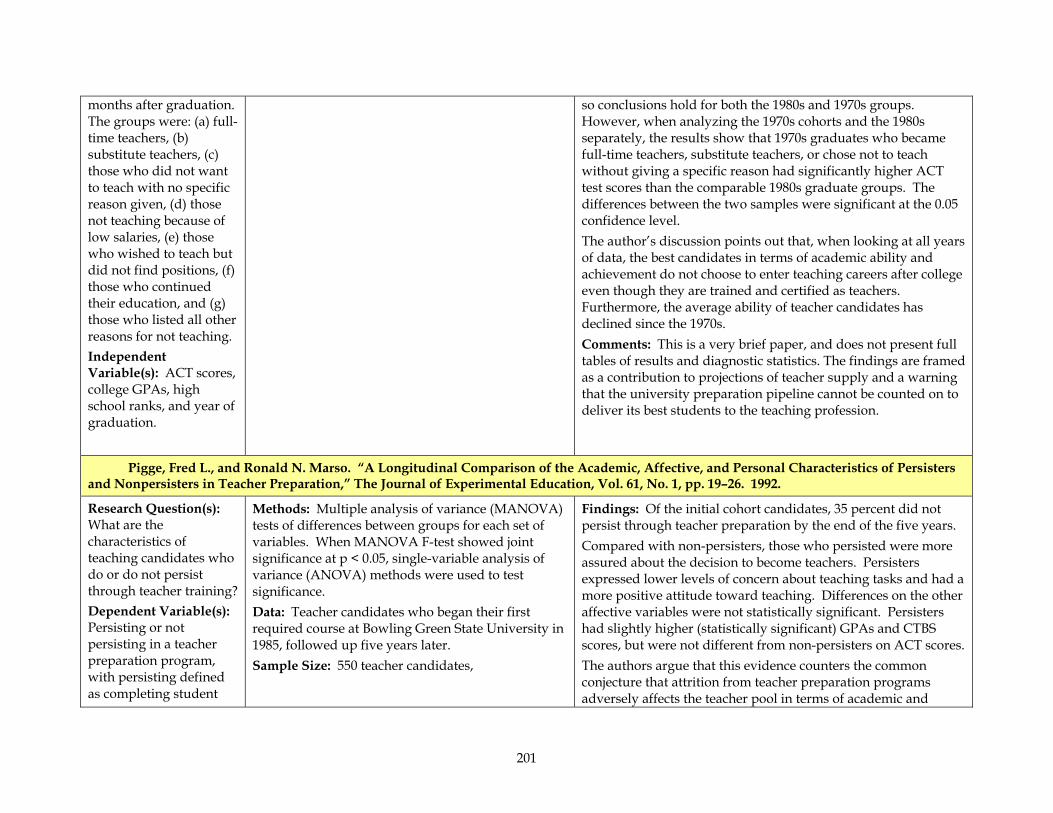
201
months after graduation. The groups were: (a) full-time teachers, (b) substitute teachers, (c) those who did not want to teach with no specific reason given, (d) those not teaching because of low salaries, (e) those who wished to teach but did not find positions, (f) those who continued their education, and (g) those who listed all other reasons for not teaching. Independent Variable(s): ACT scores, college GPAs, high school ranks, and year of graduation.
so conclusions hold for both the 1980s and 1970s groups. However, when analyzing the 1970s cohorts and the 1980s separately, the results show that 1970s graduates who became full-time teachers, substitute teachers, or chose not to teach without giving a specific reason had significantly higher ACT test scores than the comparable 1980s graduate groups. The differences between the two samples were significant at the 0.05 confidence level. The author’s discussion points out that, when looking at all years of data, the best candidates in terms of academic ability and achievement do not choose to enter teaching careers after college even though they are trained and certified as teachers. Furthermore, the average ability of teacher candidates has declined since the 1970s. Comments: This is a very brief paper, and does not present full tables of results and diagnostic statistics. The findings are framed as a contribution to projections of teacher supply and a warning that the university preparation pipeline cannot be counted on to deliver its best students to the teaching profession.
Pigge, Fred L., and Ronald N. Marso. “A Longitudinal Comparison of the Academic, Affective, and Personal Characteristics of Persisters and Nonpersisters in Teacher Preparation,” The Journal of Experimental Education, Vol. 61, No. 1, pp. 19–26. 1992.
Research Question(s): What are the characteristics of teaching candidates who do or do not persist through teacher training? Dependent Variable(s): Persisting or not persisting in a teacher preparation program, with persisting defined as completing student
Methods: Multiple analysis of variance (MANOVA) tests of differences between groups for each set of variables. When MANOVA F-test showed joint significance at p < 0.05, single-variable analysis of variance (ANOVA) methods were used to test significance. Data: Teacher candidates who began their first required course at Bowling Green State University in 1985, followed up five years later. Sample Size: 550 teacher candidates,
Findings: Of the initial cohort candidates, 35 percent did not persist through teacher preparation by the end of the five years. Compared with non-persisters, those who persisted were more assured about the decision to become teachers. Persisters expressed lower levels of concern about teaching tasks and had a more positive attitude toward teaching. Differences on the other affective variables were not statistically significant. Persisters had slightly higher (statistically significant) GPAs and CTBS scores, but were not different from non-persisters on ACT scores. The authors argue that this evidence counters the common conjecture that attrition from teacher preparation programs adversely affects the teacher pool in terms of academic and
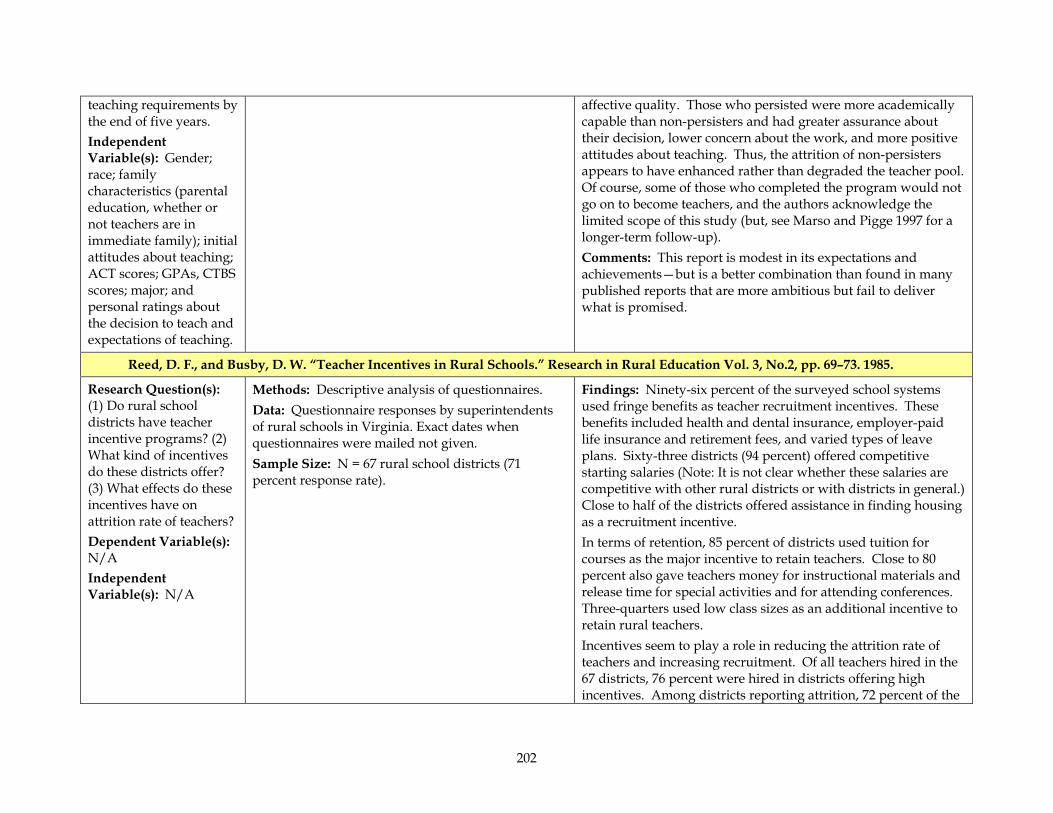
202
teaching requirements by the end of five years. Independent Variable(s): Gender; race; family characteristics (parental education, whether or not teachers are in immediate family); initial attitudes about teaching; ACT scores; GPAs, CTBS scores; major; and personal ratings about the decision to teach and expectations of teaching.
affective quality. Those who persisted were more academically capable than non-persisters and had greater assurance about their decision, lower concern about the work, and more positive attitudes about teaching. Thus, the attrition of non-persisters appears to have enhanced rather than degraded the teacher pool. Of course, some of those who completed the program would not go on to become teachers, and the authors acknowledge the limited scope of this study (but, see Marso and Pigge 1997 for a longer-term follow-up). Comments: This report is modest in its expectations and achievements—but is a better combination than found in many published reports that are more ambitious but fail to deliver what is promised.
Reed, D. F., and Busby, D. W. “Teacher Incentives in Rural Schools.” Research in Rural Education Vol. 3, No.2, pp. 69–73. 1985.
Research Question(s): (1) Do rural school districts have teacher incentive programs? (2) What kind of incentives do these districts offer? (3) What effects do these incentives have on attrition rate of teachers? Dependent Variable(s): N/A Independent Variable(s): N/A
Methods: Descriptive analysis of questionnaires. Data: Questionnaire responses by superintendents of rural schools in Virginia. Exact dates when questionnaires were mailed not given. Sample Size: N = 67 rural school districts (71 percent response rate).
Findings: Ninety-six percent of the surveyed school systems used fringe benefits as teacher recruitment incentives. These benefits included health and dental insurance, employer-paid life insurance and retirement fees, and varied types of leave plans. Sixty-three districts (94 percent) offered competitive starting salaries (Note: It is not clear whether these salaries are competitive with other rural districts or with districts in general.) Close to half of the districts offered assistance in finding housing as a recruitment incentive. In terms of retention, 85 percent of districts used tuition for courses as the major incentive to retain teachers. Close to 80 percent also gave teachers money for instructional materials and release time for special activities and for attending conferences. Three-quarters used low class sizes as an additional incentive to retain rural teachers. Incentives seem to play a role in reducing the attrition rate of teachers and increasing recruitment. Of all teachers hired in the 67 districts, 76 percent were hired in districts offering high incentives. Among districts reporting attrition, 72 percent of the
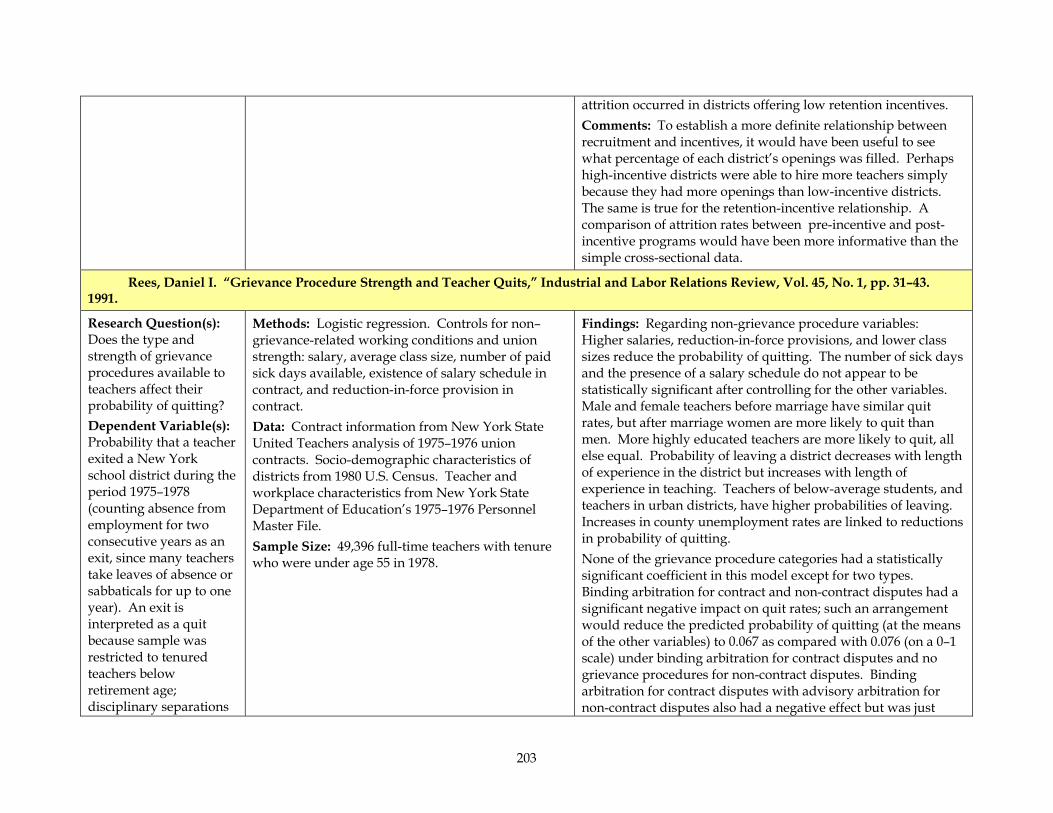
203
attrition occurred in districts offering low retention incentives. Comments: To establish a more definite relationship between recruitment and incentives, it would have been useful to see what percentage of each district’s openings was filled. Perhaps high-incentive districts were able to hire more teachers simply because they had more openings than low-incentive districts. The same is true for the retention-incentive relationship. A comparison of attrition rates between pre-incentive and post-incentive programs would have been more informative than the simple cross-sectional data.
Rees, Daniel I. “Grievance Procedure Strength and Teacher Quits,” Industrial and Labor Relations Review, Vol. 45, No. 1, pp. 31–43. 1991.
Research Question(s): Does the type and strength of grievance procedures available to teachers affect their probability of quitting? Dependent Variable(s): Probability that a teacher exited a New York school district during the period 1975–1978 (counting absence from employment for two consecutive years as an exit, since many teachers take leaves of absence or sabbaticals for up to one year). An exit is interpreted as a quit because sample was restricted to tenured teachers below retirement age; disciplinary separations
Methods: Logistic regression. Controls for non–grievance-related working conditions and union strength: salary, average class size, number of paid sick days available, existence of salary schedule in contract, and reduction-in-force provision in contract. Data: Contract information from New York State United Teachers analysis of 1975–1976 union contracts. Socio-demographic characteristics of districts from 1980 U.S. Census. Teacher and workplace characteristics from New York State Department of Education’s 1975–1976 Personnel Master File. Sample Size: 49,396 full-time teachers with tenure who were under age 55 in 1978.
Findings: Regarding non-grievance procedure variables: Higher salaries, reduction-in-force provisions, and lower class sizes reduce the probability of quitting. The number of sick days and the presence of a salary schedule do not appear to be statistically significant after controlling for the other variables. Male and female teachers before marriage have similar quit rates, but after marriage women are more likely to quit than men. More highly educated teachers are more likely to quit, all else equal. Probability of leaving a district decreases with length of experience in the district but increases with length of experience in teaching. Teachers of below-average students, and teachers in urban districts, have higher probabilities of leaving. Increases in county unemployment rates are linked to reductions in probability of quitting. None of the grievance procedure categories had a statistically significant coefficient in this model except for two types. Binding arbitration for contract and non-contract disputes had a significant negative impact on quit rates; such an arrangement would reduce the predicted probability of quitting (at the means of the other variables) to 0.067 as compared with 0.076 (on a 0–1 scale) under binding arbitration for contract disputes and no grievance procedures for non-contract disputes. Binding arbitration for contract disputes with advisory arbitration for non-contract disputes also had a negative effect but was just
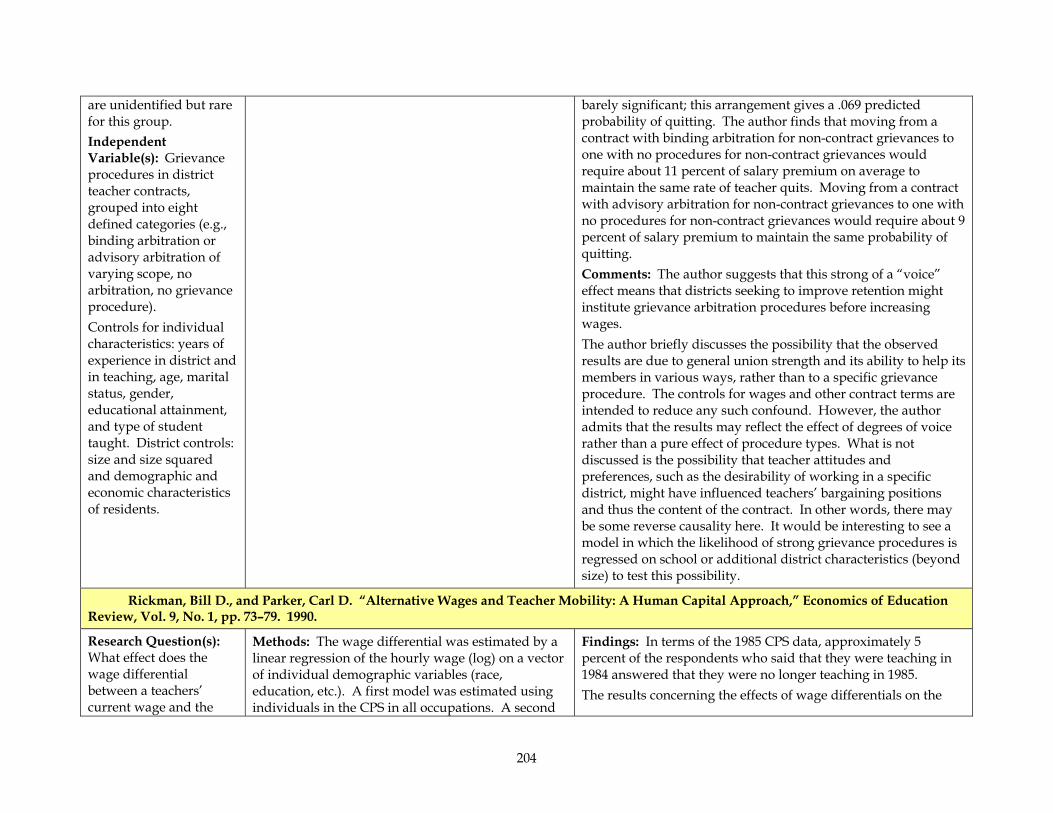
204
are unidentified but rare for this group. Independent Variable(s): Grievance procedures in district teacher contracts, grouped into eight defined categories (e.g., binding arbitration or advisory arbitration of varying scope, no arbitration, no grievance procedure). Controls for individual characteristics: years of experience in district and in teaching, age, marital status, gender, educational attainment, and type of student taught. District controls: size and size squared and demographic and economic characteristics of residents.
barely significant; this arrangement gives a .069 predicted probability of quitting. The author finds that moving from a contract with binding arbitration for non-contract grievances to one with no procedures for non-contract grievances would require about 11 percent of salary premium on average to maintain the same rate of teacher quits. Moving from a contract with advisory arbitration for non-contract grievances to one with no procedures for non-contract grievances would require about 9 percent of salary premium to maintain the same probability of quitting. Comments: The author suggests that this strong of a “voice” effect means that districts seeking to improve retention might institute grievance arbitration procedures before increasing wages. The author briefly discusses the possibility that the observed results are due to general union strength and its ability to help its members in various ways, rather than to a specific grievance procedure. The controls for wages and other contract terms are intended to reduce any such confound. However, the author admits that the results may reflect the effect of degrees of voice rather than a pure effect of procedure types. What is not discussed is the possibility that teacher attitudes and preferences, such as the desirability of working in a specific district, might have influenced teachers’ bargaining positions and thus the content of the contract. In other words, there may be some reverse causality here. It would be interesting to see a model in which the likelihood of strong grievance procedures is regressed on school or additional district characteristics (beyond size) to test this possibility.
Rickman, Bill D., and Parker, Carl D. “Alternative Wages and Teacher Mobility: A Human Capital Approach,” Economics of Education Review, Vol. 9, No. 1, pp. 73–79. 1990.
Research Question(s): What effect does the wage differential between a teachers’ current wage and the
Methods: The wage differential was estimated by a linear regression of the hourly wage (log) on a vector of individual demographic variables (race, education, etc.). A first model was estimated using individuals in the CPS in all occupations. A second
Findings: In terms of the 1985 CPS data, approximately 5 percent of the respondents who said that they were teaching in 1984 answered that they were no longer teaching in 1985. The results concerning the effects of wage differentials on the
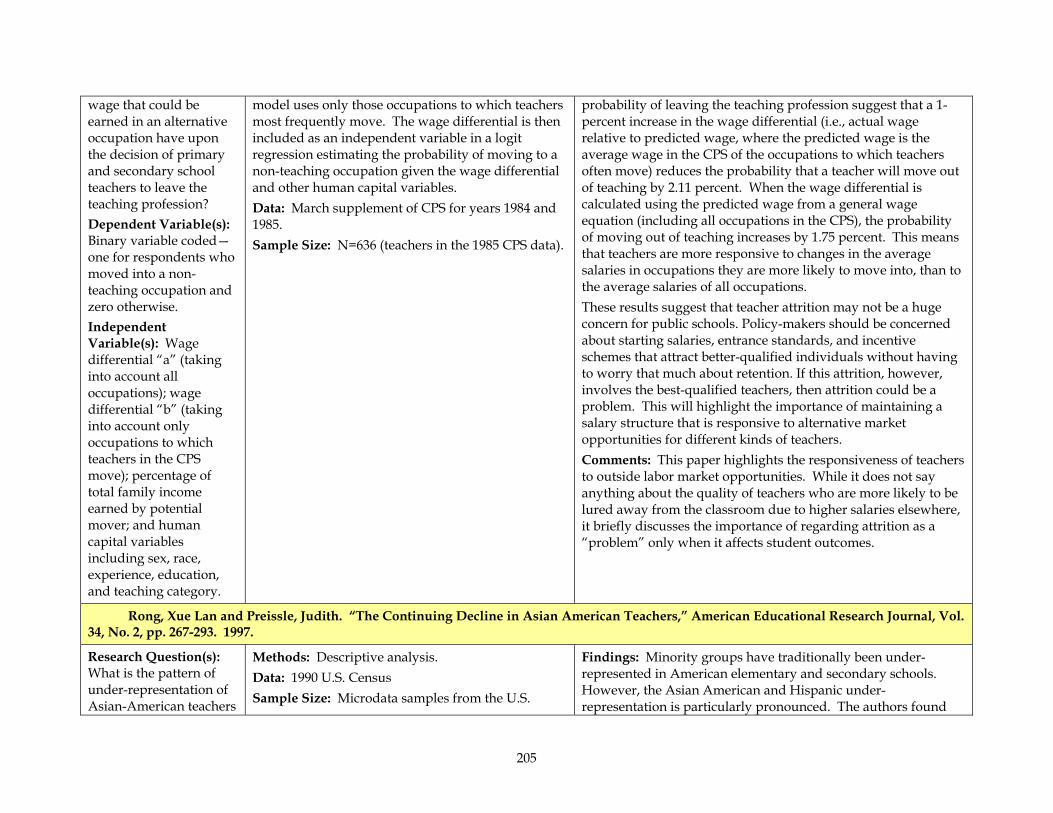
205
wage that could be earned in an alternative occupation have upon the decision of primary and secondary school teachers to leave the teaching profession? Dependent Variable(s): Binary variable coded—one for respondents who moved into a non-teaching occupation and zero otherwise. Independent Variable(s): Wage differential “a” (taking into account all occupations); wage differential “b” (taking into account only occupations to which teachers in the CPS move); percentage of total family income earned by potential mover; and human capital variables including sex, race, experience, education, and teaching category.
model uses only those occupations to which teachers most frequently move. The wage differential is then included as an independent variable in a logit regression estimating the probability of moving to a non-teaching occupation given the wage differential and other human capital variables. Data: March supplement of CPS for years 1984 and 1985. Sample Size: N=636 (teachers in the 1985 CPS data).
probability of leaving the teaching profession suggest that a 1-percent increase in the wage differential (i.e., actual wage relative to predicted wage, where the predicted wage is the average wage in the CPS of the occupations to which teachers often move) reduces the probability that a teacher will move out of teaching by 2.11 percent. When the wage differential is calculated using the predicted wage from a general wage equation (including all occupations in the CPS), the probability of moving out of teaching increases by 1.75 percent. This means that teachers are more responsive to changes in the average salaries in occupations they are more likely to move into, than to the average salaries of all occupations. These results suggest that teacher attrition may not be a huge concern for public schools. Policy-makers should be concerned about starting salaries, entrance standards, and incentive schemes that attract better-qualified individuals without having to worry that much about retention. If this attrition, however, involves the best-qualified teachers, then attrition could be a problem. This will highlight the importance of maintaining a salary structure that is responsive to alternative market opportunities for different kinds of teachers. Comments: This paper highlights the responsiveness of teachers to outside labor market opportunities. While it does not say anything about the quality of teachers who are more likely to be lured away from the classroom due to higher salaries elsewhere, it briefly discusses the importance of regarding attrition as a “problem” only when it affects student outcomes.
Rong, Xue Lan and Preissle, Judith. “The Continuing Decline in Asian American Teachers,” American Educational Research Journal, Vol. 34, No. 2, pp. 267-293. 1997.
Research Question(s): What is the pattern of under-representation of Asian-American teachers
Methods: Descriptive analysis. Data: 1990 U.S. Census Sample Size: Microdata samples from the U.S.
Findings: Minority groups have traditionally been under-represented in American elementary and secondary schools. However, the Asian American and Hispanic under-representation is particularly pronounced. The authors found
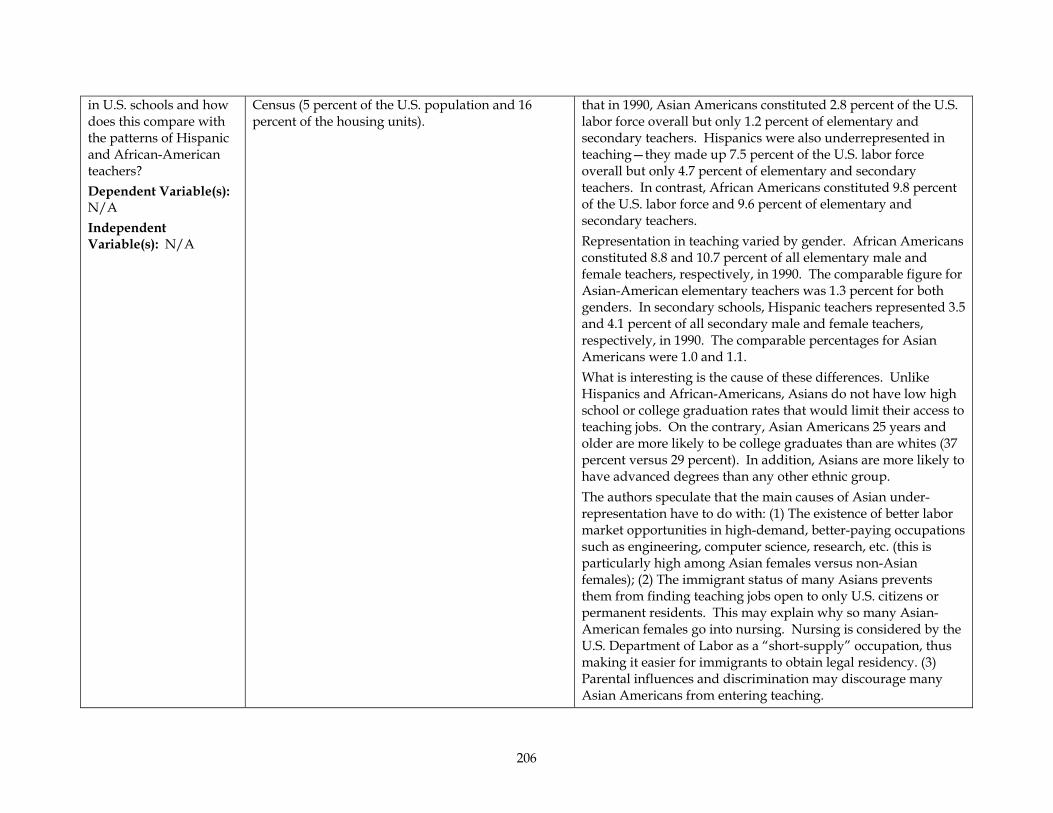
206
in U.S. schools and how does this compare with the patterns of Hispanic and African-American teachers? Dependent Variable(s): N/A Independent Variable(s): N/A
Census (5 percent of the U.S. population and 16 percent of the housing units).
that in 1990, Asian Americans constituted 2.8 percent of the U.S. labor force overall but only 1.2 percent of elementary and secondary teachers. Hispanics were also underrepresented in teaching—they made up 7.5 percent of the U.S. labor force overall but only 4.7 percent of elementary and secondary teachers. In contrast, African Americans constituted 9.8 percent of the U.S. labor force and 9.6 percent of elementary and secondary teachers. Representation in teaching varied by gender. African Americans constituted 8.8 and 10.7 percent of all elementary male and female teachers, respectively, in 1990. The comparable figure for Asian-American elementary teachers was 1.3 percent for both genders. In secondary schools, Hispanic teachers represented 3.5 and 4.1 percent of all secondary male and female teachers, respectively, in 1990. The comparable percentages for Asian Americans were 1.0 and 1.1. What is interesting is the cause of these differences. Unlike Hispanics and African-Americans, Asians do not have low high school or college graduation rates that would limit their access to teaching jobs. On the contrary, Asian Americans 25 years and older are more likely to be college graduates than are whites (37 percent versus 29 percent). In addition, Asians are more likely to have advanced degrees than any other ethnic group. The authors speculate that the main causes of Asian under-representation have to do with: (1) The existence of better labor market opportunities in high-demand, better-paying occupations such as engineering, computer science, research, etc. (this is particularly high among Asian females versus non-Asian females); (2) The immigrant status of many Asians prevents them from finding teaching jobs open to only U.S. citizens or permanent residents. This may explain why so many Asian-American females go into nursing. Nursing is considered by the U.S. Department of Labor as a “short-supply” occupation, thus making it easier for immigrants to obtain legal residency. (3) Parental influences and discrimination may discourage many Asian Americans from entering teaching.
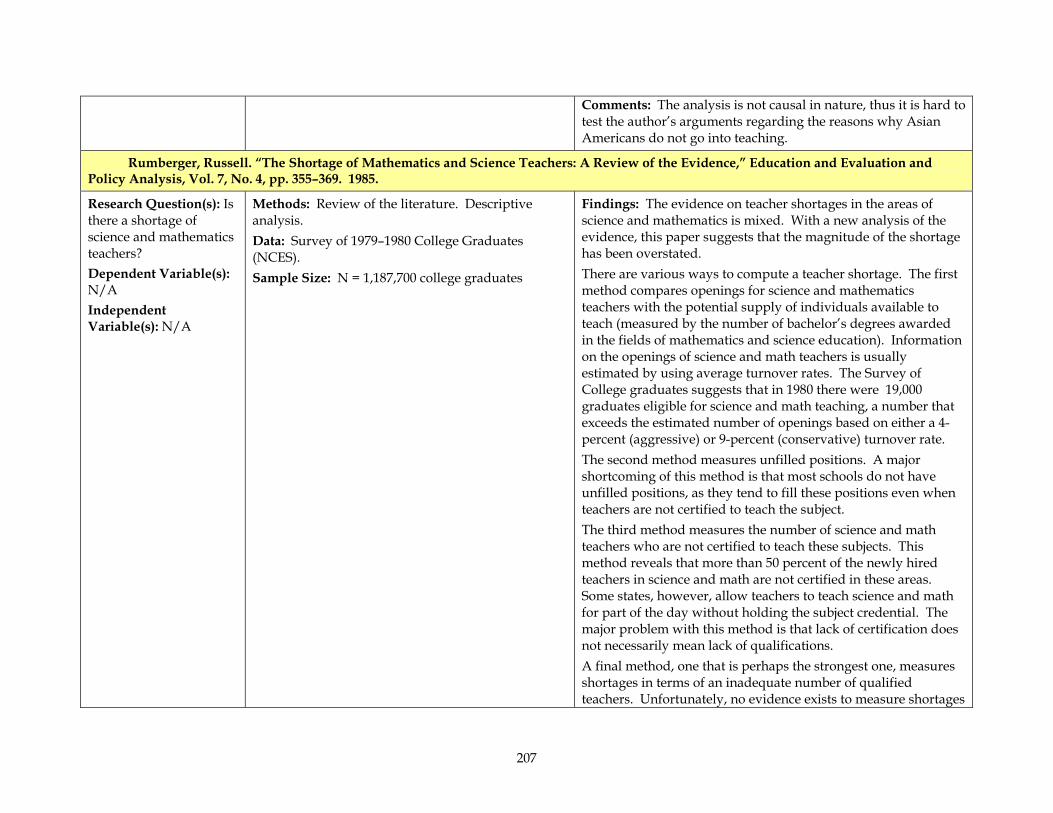
207
Comments: The analysis is not causal in nature, thus it is hard to test the author’s arguments regarding the reasons why Asian Americans do not go into teaching.
Rumberger, Russell. “The Shortage of Mathematics and Science Teachers: A Review of the Evidence,” Education and Evaluation and Policy Analysis, Vol. 7, No. 4, pp. 355–369. 1985.
Research Question(s): Is there a shortage of science and mathematics teachers? Dependent Variable(s): N/A Independent Variable(s): N/A
Methods: Review of the literature. Descriptive analysis. Data: Survey of 1979–1980 College Graduates (NCES). Sample Size: N = 1,187,700 college graduates
Findings: The evidence on teacher shortages in the areas of science and mathematics is mixed. With a new analysis of the evidence, this paper suggests that the magnitude of the shortage has been overstated. There are various ways to compute a teacher shortage. The first method compares openings for science and mathematics teachers with the potential supply of individuals available to teach (measured by the number of bachelor’s degrees awarded in the fields of mathematics and science education). Information on the openings of science and math teachers is usually estimated by using average turnover rates. The Survey of College graduates suggests that in 1980 there were 19,000 graduates eligible for science and math teaching, a number that exceeds the estimated number of openings based on either a 4-percent (aggressive) or 9-percent (conservative) turnover rate. The second method measures unfilled positions. A major shortcoming of this method is that most schools do not have unfilled positions, as they tend to fill these positions even when teachers are not certified to teach the subject. The third method measures the number of science and math teachers who are not certified to teach these subjects. This method reveals that more than 50 percent of the newly hired teachers in science and math are not certified in these areas. Some states, however, allow teachers to teach science and math for part of the day without holding the subject credential. The major problem with this method is that lack of certification does not necessarily mean lack of qualifications. A final method, one that is perhaps the strongest one, measures shortages in terms of an inadequate number of qualified teachers. Unfortunately, no evidence exists to measure shortages
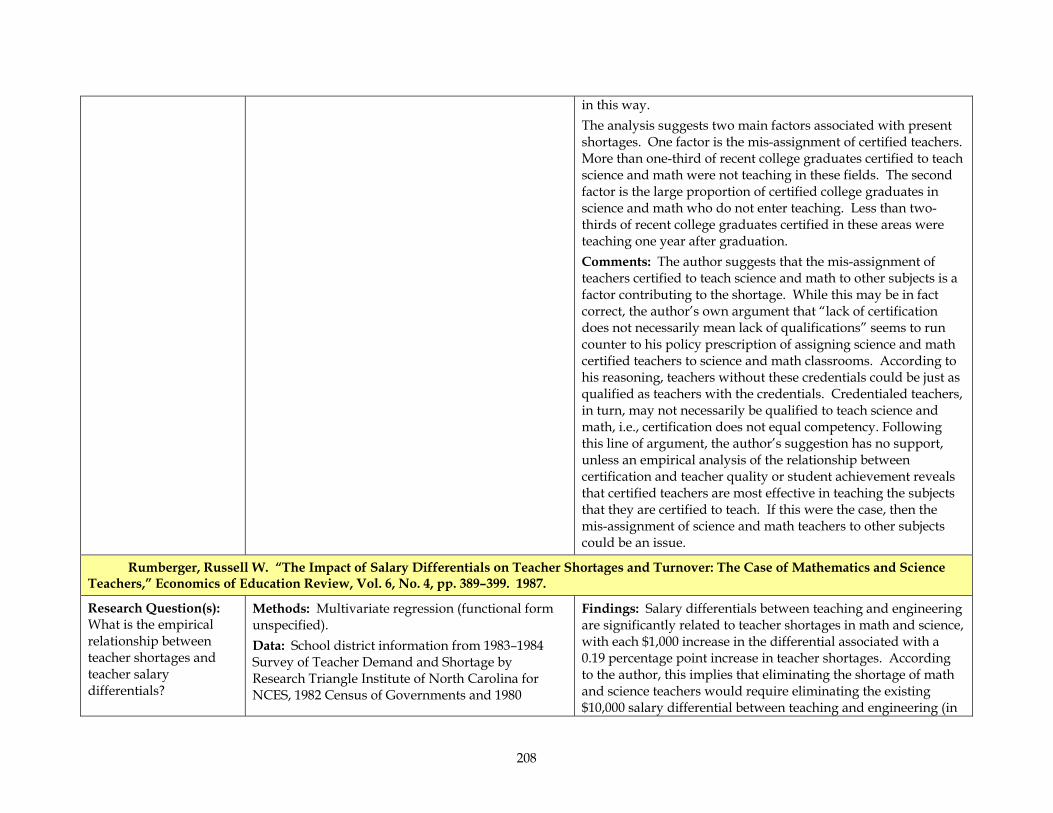
208
in this way. The analysis suggests two main factors associated with present shortages. One factor is the mis-assignment of certified teachers. More than one-third of recent college graduates certified to teach science and math were not teaching in these fields. The second factor is the large proportion of certified college graduates in science and math who do not enter teaching. Less than two-thirds of recent college graduates certified in these areas were teaching one year after graduation. Comments: The author suggests that the mis-assignment of teachers certified to teach science and math to other subjects is a factor contributing to the shortage. While this may be in fact correct, the author’s own argument that “lack of certification does not necessarily mean lack of qualifications” seems to run counter to his policy prescription of assigning science and math certified teachers to science and math classrooms. According to his reasoning, teachers without these credentials could be just as qualified as teachers with the credentials. Credentialed teachers, in turn, may not necessarily be qualified to teach science and math, i.e., certification does not equal competency. Following this line of argument, the author’s suggestion has no support, unless an empirical analysis of the relationship between certification and teacher quality or student achievement reveals that certified teachers are most effective in teaching the subjects that they are certified to teach. If this were the case, then the mis-assignment of science and math teachers to other subjects could be an issue.
Rumberger, Russell W. “The Impact of Salary Differentials on Teacher Shortages and Turnover: The Case of Mathematics and Science Teachers,” Economics of Education Review, Vol. 6, No. 4, pp. 389–399. 1987.
Research Question(s): What is the empirical relationship between teacher shortages and teacher salary differentials?
Methods: Multivariate regression (functional form unspecified). Data: School district information from 1983–1984 Survey of Teacher Demand and Shortage by Research Triangle Institute of North Carolina for NCES, 1982 Census of Governments and 1980
Findings: Salary differentials between teaching and engineering are significantly related to teacher shortages in math and science, with each $1,000 increase in the differential associated with a 0.19 percentage point increase in teacher shortages. According to the author, this implies that eliminating the shortage of math and science teachers would require eliminating the existing $10,000 salary differential between teaching and engineering (in
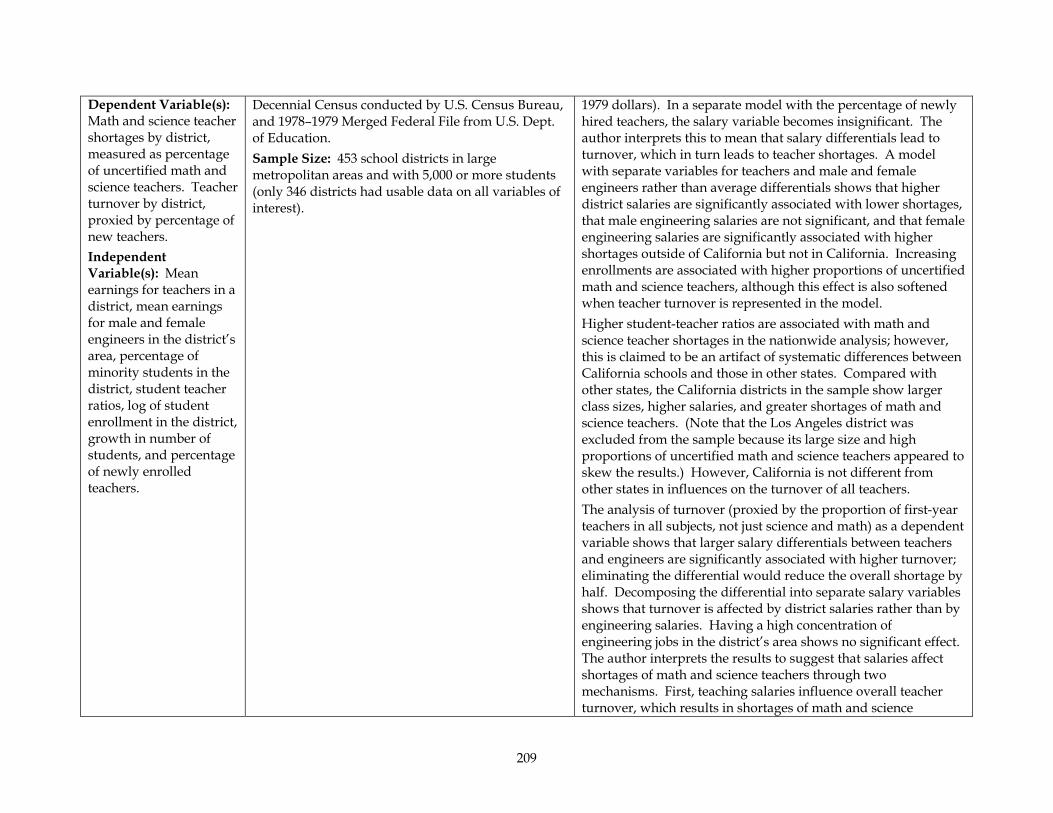
209
Dependent Variable(s): Math and science teacher shortages by district, measured as percentage of uncertified math and science teachers. Teacher turnover by district, proxied by percentage of new teachers. Independent Variable(s): Mean earnings for teachers in a district, mean earnings for male and female engineers in the district’s area, percentage of minority students in the district, student teacher ratios, log of student enrollment in the district, growth in number of students, and percentage of newly enrolled teachers.
Decennial Census conducted by U.S. Census Bureau, and 1978–1979 Merged Federal File from U.S. Dept. of Education. Sample Size: 453 school districts in large metropolitan areas and with 5,000 or more students (only 346 districts had usable data on all variables of interest).
1979 dollars). In a separate model with the percentage of newly hired teachers, the salary variable becomes insignificant. The author interprets this to mean that salary differentials lead to turnover, which in turn leads to teacher shortages. A model with separate variables for teachers and male and female engineers rather than average differentials shows that higher district salaries are significantly associated with lower shortages, that male engineering salaries are not significant, and that female engineering salaries are significantly associated with higher shortages outside of California but not in California. Increasing enrollments are associated with higher proportions of uncertified math and science teachers, although this effect is also softened when teacher turnover is represented in the model. Higher student-teacher ratios are associated with math and science teacher shortages in the nationwide analysis; however, this is claimed to be an artifact of systematic differences between California schools and those in other states. Compared with other states, the California districts in the sample show larger class sizes, higher salaries, and greater shortages of math and science teachers. (Note that the Los Angeles district was excluded from the sample because its large size and high proportions of uncertified math and science teachers appeared to skew the results.) However, California is not different from other states in influences on the turnover of all teachers. The analysis of turnover (proxied by the proportion of first-year teachers in all subjects, not just science and math) as a dependent variable shows that larger salary differentials between teachers and engineers are significantly associated with higher turnover; eliminating the differential would reduce the overall shortage by half. Decomposing the differential into separate salary variables shows that turnover is affected by district salaries rather than by engineering salaries. Having a high concentration of engineering jobs in the district’s area shows no significant effect. The author interprets the results to suggest that salaries affect shortages of math and science teachers through two mechanisms. First, teaching salaries influence overall teacher turnover, which results in shortages of math and science
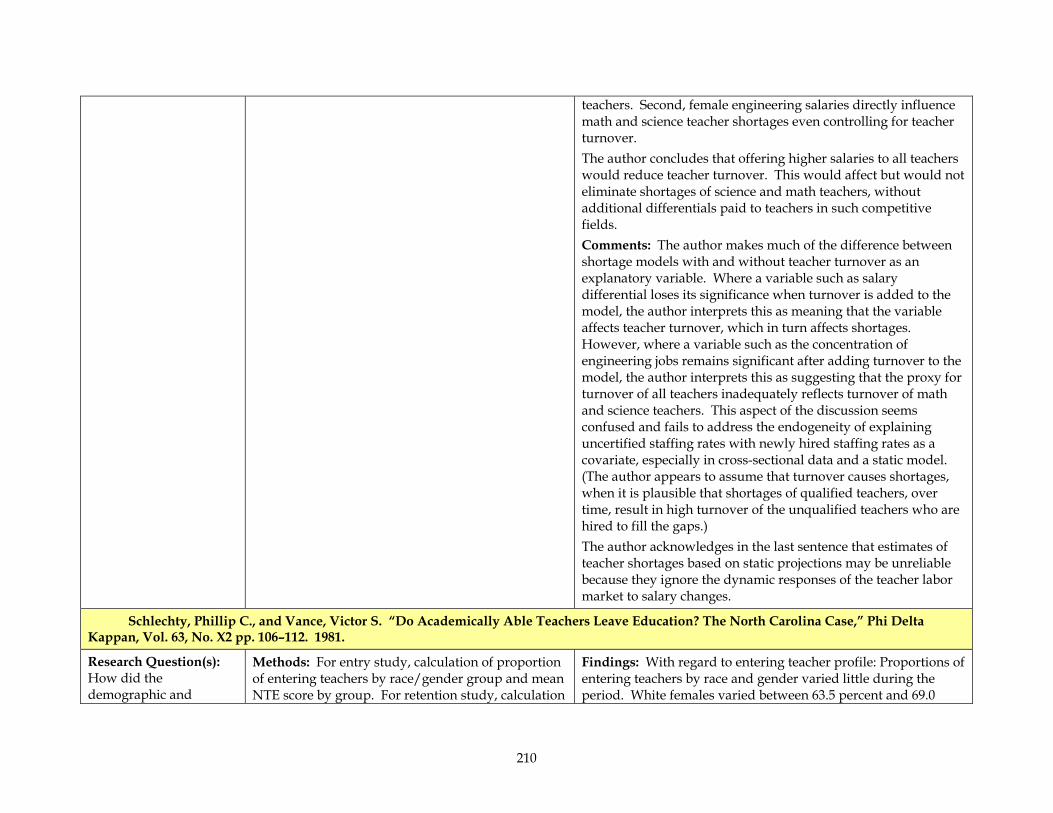
210
teachers. Second, female engineering salaries directly influence math and science teacher shortages even controlling for teacher turnover. The author concludes that offering higher salaries to all teachers would reduce teacher turnover. This would affect but would not eliminate shortages of science and math teachers, without additional differentials paid to teachers in such competitive fields. Comments: The author makes much of the difference between shortage models with and without teacher turnover as an explanatory variable. Where a variable such as salary differential loses its significance when turnover is added to the model, the author interprets this as meaning that the variable affects teacher turnover, which in turn affects shortages. However, where a variable such as the concentration of engineering jobs remains significant after adding turnover to the model, the author interprets this as suggesting that the proxy for turnover of all teachers inadequately reflects turnover of math and science teachers. This aspect of the discussion seems confused and fails to address the endogeneity of explaining uncertified staffing rates with newly hired staffing rates as a covariate, especially in cross-sectional data and a static model. (The author appears to assume that turnover causes shortages, when it is plausible that shortages of qualified teachers, over time, result in high turnover of the unqualified teachers who are hired to fill the gaps.) The author acknowledges in the last sentence that estimates of teacher shortages based on static projections may be unreliable because they ignore the dynamic responses of the teacher labor market to salary changes.
Schlechty, Phillip C., and Vance, Victor S. “Do Academically Able Teachers Leave Education? The North Carolina Case,” Phi Delta Kappan, Vol. 63, No. X2 pp. 106–112. 1981.
Research Question(s): How did the demographic and
Methods: For entry study, calculation of proportion of entering teachers by race/gender group and mean NTE score by group. For retention study, calculation
Findings: With regard to entering teacher profile: Proportions of entering teachers by race and gender varied little during the period. White females varied between 63.5 percent and 69.0
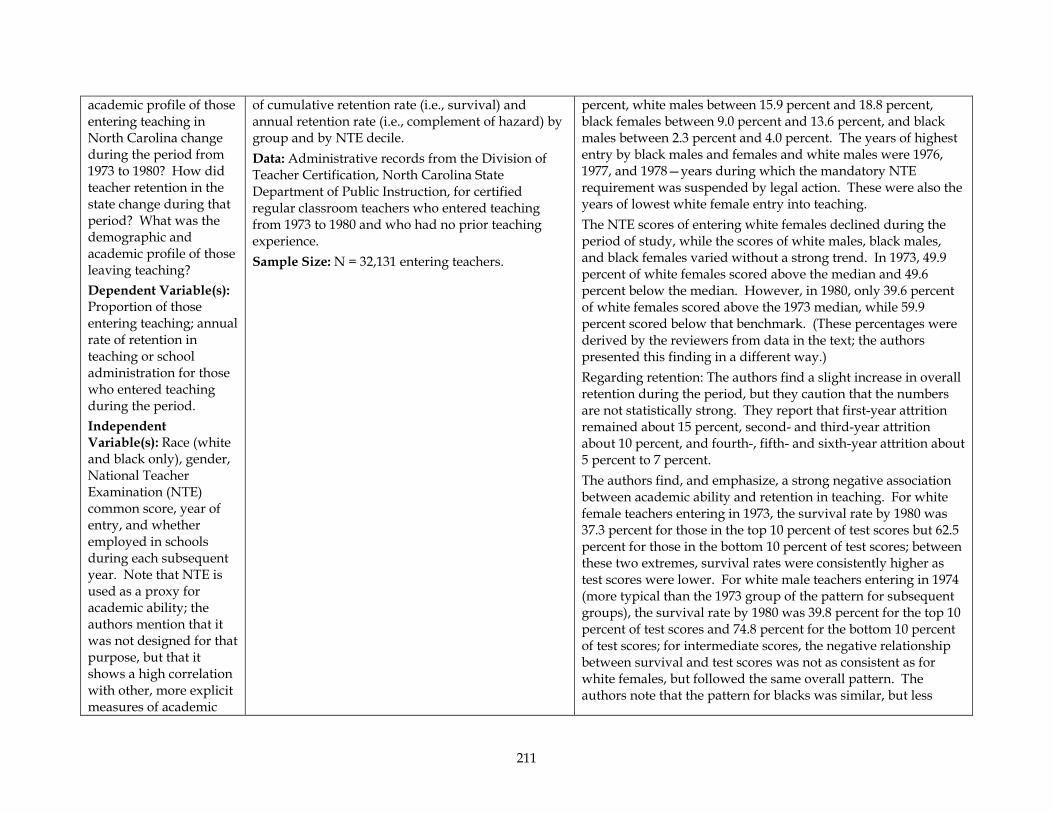
211
academic profile of those entering teaching in North Carolina change during the period from 1973 to 1980? How did teacher retention in the state change during that period? What was the demographic and academic profile of those leaving teaching? Dependent Variable(s): Proportion of those entering teaching; annual rate of retention in teaching or school administration for those who entered teaching during the period. Independent Variable(s): Race (white and black only), gender, National Teacher Examination (NTE) common score, year of entry, and whether employed in schools during each subsequent year. Note that NTE is used as a proxy for academic ability; the authors mention that it was not designed for that purpose, but that it shows a high correlation with other, more explicit measures of academic
of cumulative retention rate (i.e., survival) and annual retention rate (i.e., complement of hazard) by group and by NTE decile. Data: Administrative records from the Division of Teacher Certification, North Carolina State Department of Public Instruction, for certified regular classroom teachers who entered teaching from 1973 to 1980 and who had no prior teaching experience. Sample Size: N = 32,131 entering teachers.
percent, white males between 15.9 percent and 18.8 percent, black females between 9.0 percent and 13.6 percent, and black males between 2.3 percent and 4.0 percent. The years of highest entry by black males and females and white males were 1976, 1977, and 1978—years during which the mandatory NTE requirement was suspended by legal action. These were also the years of lowest white female entry into teaching. The NTE scores of entering white females declined during the period of study, while the scores of white males, black males, and black females varied without a strong trend. In 1973, 49.9 percent of white females scored above the median and 49.6 percent below the median. However, in 1980, only 39.6 percent of white females scored above the 1973 median, while 59.9 percent scored below that benchmark. (These percentages were derived by the reviewers from data in the text; the authors presented this finding in a different way.) Regarding retention: The authors find a slight increase in overall retention during the period, but they caution that the numbers are not statistically strong. They report that first-year attrition remained about 15 percent, second- and third-year attrition about 10 percent, and fourth-, fifth- and sixth-year attrition about 5 percent to 7 percent. The authors find, and emphasize, a strong negative association between academic ability and retention in teaching. For white female teachers entering in 1973, the survival rate by 1980 was 37.3 percent for those in the top 10 percent of test scores but 62.5 percent for those in the bottom 10 percent of test scores; between these two extremes, survival rates were consistently higher as test scores were lower. For white male teachers entering in 1974 (more typical than the 1973 group of the pattern for subsequent groups), the survival rate by 1980 was 39.8 percent for the top 10 percent of test scores and 74.8 percent for the bottom 10 percent of test scores; for intermediate scores, the negative relationship between survival and test scores was not as consistent as for white females, but followed the same overall pattern. The authors note that the pattern for blacks was similar, but less
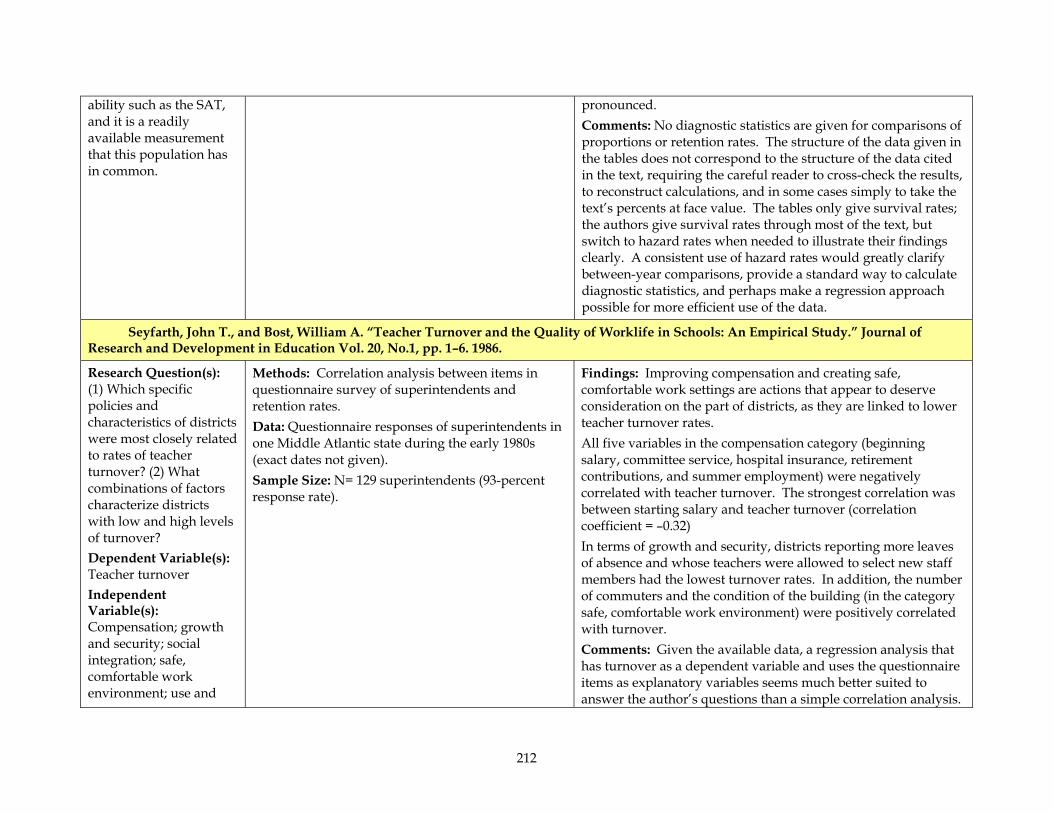
212
ability such as the SAT, and it is a readily available measurement that this population has in common.
pronounced. Comments: No diagnostic statistics are given for comparisons of proportions or retention rates. The structure of the data given in the tables does not correspond to the structure of the data cited in the text, requiring the careful reader to cross-check the results, to reconstruct calculations, and in some cases simply to take the text’s percents at face value. The tables only give survival rates; the authors give survival rates through most of the text, but switch to hazard rates when needed to illustrate their findings clearly. A consistent use of hazard rates would greatly clarify between-year comparisons, provide a standard way to calculate diagnostic statistics, and perhaps make a regression approach possible for more efficient use of the data.
Seyfarth, John T., and Bost, William A. “Teacher Turnover and the Quality of Worklife in Schools: An Empirical Study.” Journal of Research and Development in Education Vol. 20, No.1, pp. 1–6. 1986.
Research Question(s): (1) Which specific policies and characteristics of districts were most closely related to rates of teacher turnover? (2) What combinations of factors characterize districts with low and high levels of turnover? Dependent Variable(s): Teacher turnover Independent Variable(s): Compensation; growth and security; social integration; safe, comfortable work environment; use and
Methods: Correlation analysis between items in questionnaire survey of superintendents and retention rates. Data: Questionnaire responses of superintendents in one Middle Atlantic state during the early 1980s (exact dates not given). Sample Size: N= 129 superintendents (93-percent response rate).
Findings: Improving compensation and creating safe, comfortable work settings are actions that appear to deserve consideration on the part of districts, as they are linked to lower teacher turnover rates. All five variables in the compensation category (beginning salary, committee service, hospital insurance, retirement contributions, and summer employment) were negatively correlated with teacher turnover. The strongest correlation was between starting salary and teacher turnover (correlation coefficient = –0.32) In terms of growth and security, districts reporting more leaves of absence and whose teachers were allowed to select new staff members had the lowest turnover rates. In addition, the number of commuters and the condition of the building (in the category safe, comfortable work environment) were positively correlated with turnover. Comments: Given the available data, a regression analysis that has turnover as a dependent variable and uses the questionnaire items as explanatory variables seems much better suited to answer the author’s questions than a simple correlation analysis.
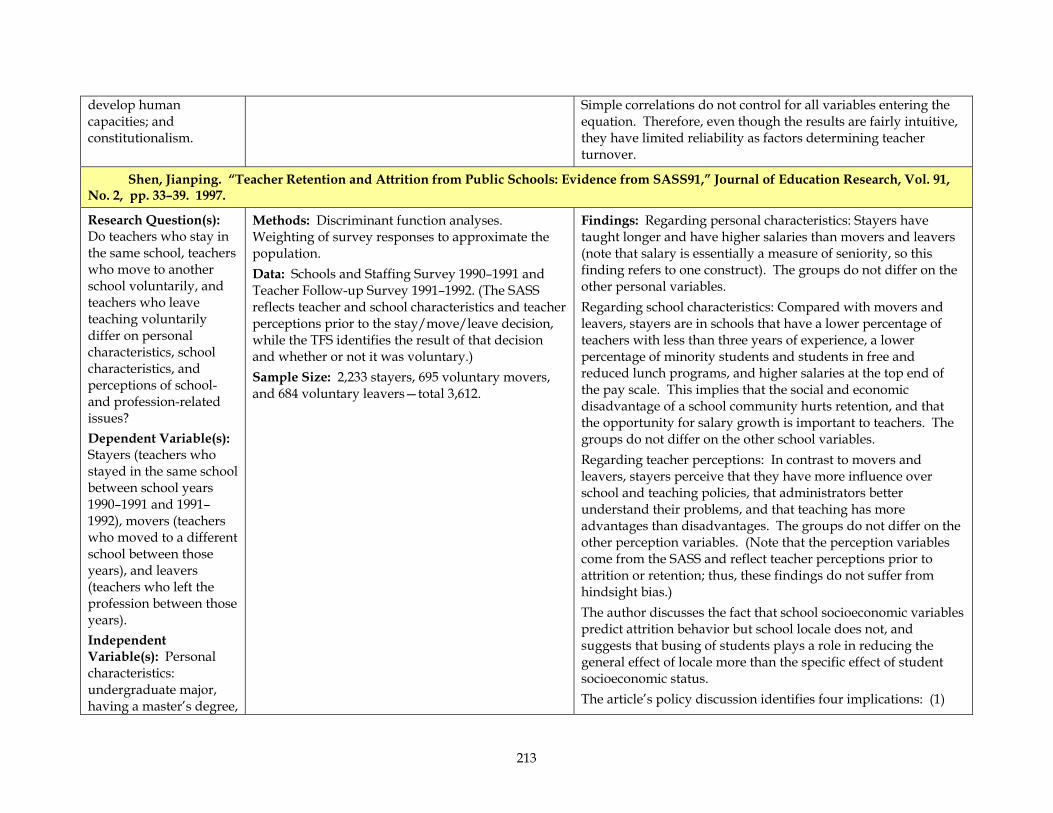
213
develop human capacities; and constitutionalism.
Simple correlations do not control for all variables entering the equation. Therefore, even though the results are fairly intuitive, they have limited reliability as factors determining teacher turnover.
Shen, Jianping. “Teacher Retention and Attrition from Public Schools: Evidence from SASS91,” Journal of Education Research, Vol. 91, No. 2, pp. 33–39. 1997.
Research Question(s): Do teachers who stay in the same school, teachers who move to another school voluntarily, and teachers who leave teaching voluntarily differ on personal characteristics, school characteristics, and perceptions of school- and profession-related issues? Dependent Variable(s): Stayers (teachers who stayed in the same school between school years 1990–1991 and 1991–1992), movers (teachers who moved to a different school between those years), and leavers (teachers who left the profession between those years). Independent Variable(s): Personal characteristics: undergraduate major, having a master’s degree,
Methods: Discriminant function analyses. Weighting of survey responses to approximate the population. Data: Schools and Staffing Survey 1990–1991 and Teacher Follow-up Survey 1991–1992. (The SASS reflects teacher and school characteristics and teacher perceptions prior to the stay/move/leave decision, while the TFS identifies the result of that decision and whether or not it was voluntary.) Sample Size: 2,233 stayers, 695 voluntary movers, and 684 voluntary leavers—total 3,612.
Findings: Regarding personal characteristics: Stayers have taught longer and have higher salaries than movers and leavers (note that salary is essentially a measure of seniority, so this finding refers to one construct). The groups do not differ on the other personal variables. Regarding school characteristics: Compared with movers and leavers, stayers are in schools that have a lower percentage of teachers with less than three years of experience, a lower percentage of minority students and students in free and reduced lunch programs, and higher salaries at the top end of the pay scale. This implies that the social and economic disadvantage of a school community hurts retention, and that the opportunity for salary growth is important to teachers. The groups do not differ on the other school variables. Regarding teacher perceptions: In contrast to movers and leavers, stayers perceive that they have more influence over school and teaching policies, that administrators better understand their problems, and that teaching has more advantages than disadvantages. The groups do not differ on the other perception variables. (Note that the perception variables come from the SASS and reflect teacher perceptions prior to attrition or retention; thus, these findings do not suffer from hindsight bias.) The author discusses the fact that school socioeconomic variables predict attrition behavior but school locale does not, and suggests that busing of students plays a role in reducing the general effect of locale more than the specific effect of student socioeconomic status. The article’s policy discussion identifies four implications: (1)

214
sex, race, school level taught, year in teaching, salary, background before entering teaching, whether bilingual, number of breaks of one or more years since entering teaching. School characteristics: percent minority, percent of teachers with less than three years in the school, free lunch students, base salary for teachers with master’s degrees and 20 years of experience, base salary for teachers with bachelor’s degree and no experience, whether there is a formal program to support beginning teachers, and organization of classes. Teachers’ perceptions: of influence over school and teaching policy, that teaching has more advantages than disadvantages, that administrators know staff’s problems, of match between expertise and assignment, of the degree of student deviant behavior, and of the degree of lack of family support.
Special incentives are needed to keep teachers in socioeconomically disadvantaged schools. (2) The teaching profession needs a career ladder with growth opportunities and higher rewards for late-career teachers as an incentive for early-career teachers to stay. (3) Teachers need to be empowered within their schools. (4) A multiple-perspective rather than single-dimensional approach is required, since retention is influenced by many factors. Comments: The author observes that attrition is higher in schools with higher percentages of teachers with less than three years of experience, and states that this supports the personal-variables finding that teacher attrition occurs more often in the early years of a career. The same effect could be attributed to other another reason: that some schools may have higher attrition due to school characteristics and thus (1) have more positions to fill, (2) must hire more new teachers, and (3) have a higher rate of attrition due to the teacher characteristic of career length, in addition to any attrition due to school characteristics. This implies a self-reinforcing dynamic that would be difficult for disadvantaged schools to overcome. The author also discusses the finding that attrition is not related to undergraduate major and level of school taught and suggests that salary incentives have helped keep more science majors in teaching. Other literature indicates that science majors have seen faster-rising incentives outside of teaching than in teaching, so the argument here seems weak. This discussion is brief and tentative, though. It is likely that the design of the study did not provide the right tools to detect the differences on this dimension that other researchers have found, especially since science majors are relevant only to secondary teaching and an interaction term would seem appropriate for this question. In general, discriminant analysis as a stepwise correlational method seems less useful than well controlled regression analysis for answering such specific question, and less valid for hypothesis testing about causality; the author acknowledges this limitation.
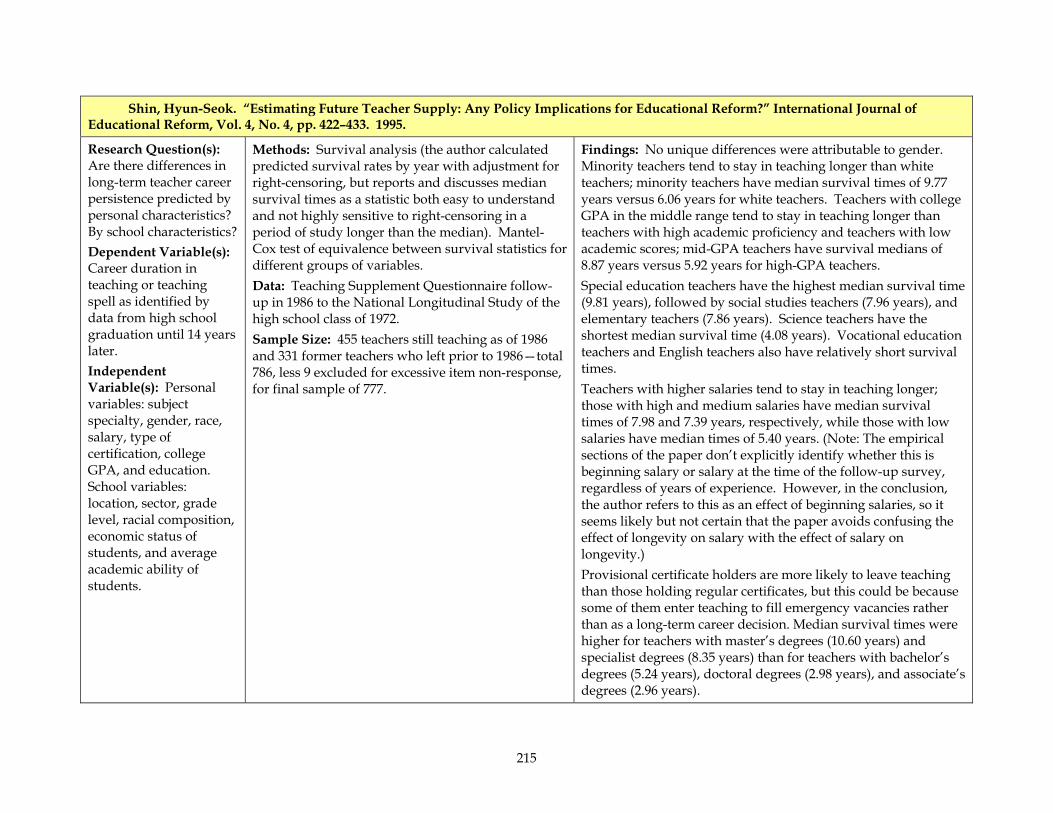
215
Shin, Hyun-Seok. “Estimating Future Teacher Supply: Any Policy Implications for Educational Reform?” International Journal of Educational Reform, Vol. 4, No. 4, pp. 422–433. 1995.
Research Question(s): Are there differences in long-term teacher career persistence predicted by personal characteristics? By school characteristics? Dependent Variable(s): Career duration in teaching or teaching spell as identified by data from high school graduation until 14 years later. Independent Variable(s): Personal variables: subject specialty, gender, race, salary, type of certification, college GPA, and education. School variables: location, sector, grade level, racial composition, economic status of students, and average academic ability of students.
Methods: Survival analysis (the author calculated predicted survival rates by year with adjustment for right-censoring, but reports and discusses median survival times as a statistic both easy to understand and not highly sensitive to right-censoring in a period of study longer than the median). Mantel-Cox test of equivalence between survival statistics for different groups of variables. Data: Teaching Supplement Questionnaire follow-up in 1986 to the National Longitudinal Study of the high school class of 1972. Sample Size: 455 teachers still teaching as of 1986 and 331 former teachers who left prior to 1986—total 786, less 9 excluded for excessive item non-response, for final sample of 777.
Findings: No unique differences were attributable to gender. Minority teachers tend to stay in teaching longer than white teachers; minority teachers have median survival times of 9.77 years versus 6.06 years for white teachers. Teachers with college GPA in the middle range tend to stay in teaching longer than teachers with high academic proficiency and teachers with low academic scores; mid-GPA teachers have survival medians of 8.87 years versus 5.92 years for high-GPA teachers. Special education teachers have the highest median survival time (9.81 years), followed by social studies teachers (7.96 years), and elementary teachers (7.86 years). Science teachers have the shortest median survival time (4.08 years). Vocational education teachers and English teachers also have relatively short survival times. Teachers with higher salaries tend to stay in teaching longer; those with high and medium salaries have median survival times of 7.98 and 7.39 years, respectively, while those with low salaries have median times of 5.40 years. (Note: The empirical sections of the paper don’t explicitly identify whether this is beginning salary or salary at the time of the follow-up survey, regardless of years of experience. However, in the conclusion, the author refers to this as an effect of beginning salaries, so it seems likely but not certain that the paper avoids confusing the effect of longevity on salary with the effect of salary on longevity.) Provisional certificate holders are more likely to leave teaching than those holding regular certificates, but this could be because some of them enter teaching to fill emergency vacancies rather than as a long-term career decision. Median survival times were higher for teachers with master’s degrees (10.60 years) and specialist degrees (8.35 years) than for teachers with bachelor’s degrees (5.24 years), doctoral degrees (2.98 years), and associate’s degrees (2.96 years).
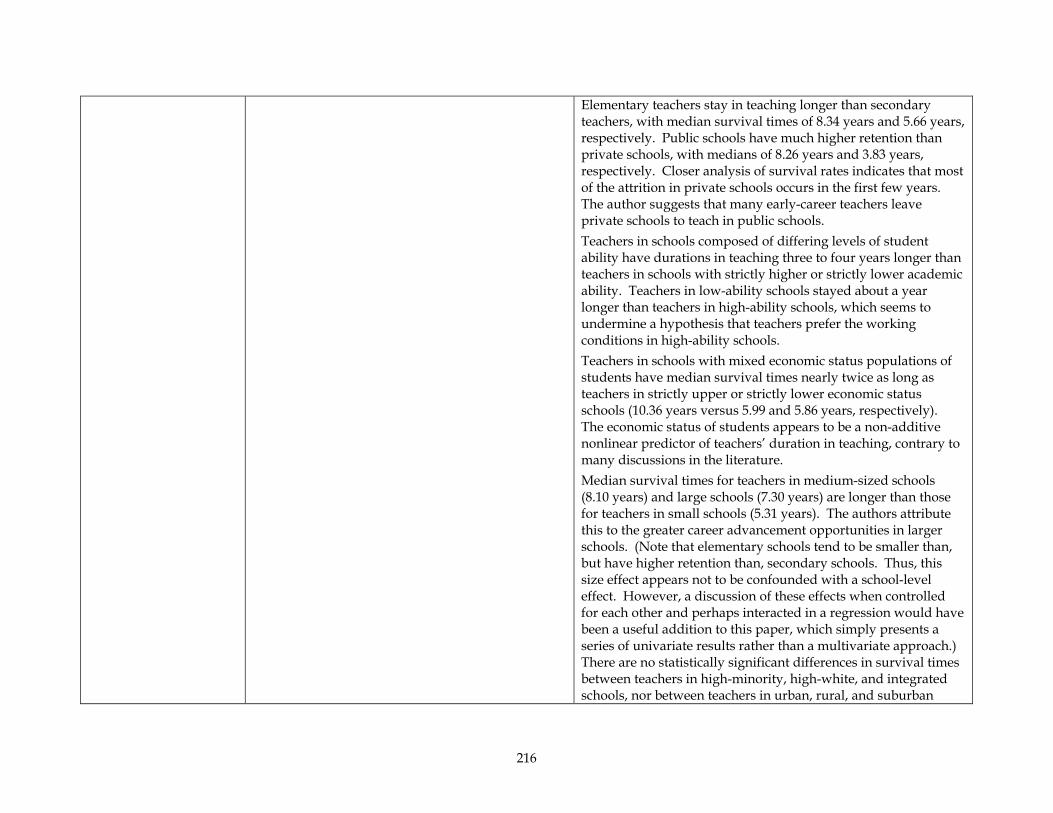
216
Elementary teachers stay in teaching longer than secondary teachers, with median survival times of 8.34 years and 5.66 years, respectively. Public schools have much higher retention than private schools, with medians of 8.26 years and 3.83 years, respectively. Closer analysis of survival rates indicates that most of the attrition in private schools occurs in the first few years. The author suggests that many early-career teachers leave private schools to teach in public schools. Teachers in schools composed of differing levels of student ability have durations in teaching three to four years longer than teachers in schools with strictly higher or strictly lower academic ability. Teachers in low-ability schools stayed about a year longer than teachers in high-ability schools, which seems to undermine a hypothesis that teachers prefer the working conditions in high-ability schools. Teachers in schools with mixed economic status populations of students have median survival times nearly twice as long as teachers in strictly upper or strictly lower economic status schools (10.36 years versus 5.99 and 5.86 years, respectively). The economic status of students appears to be a non-additive nonlinear predictor of teachers’ duration in teaching, contrary to many discussions in the literature. Median survival times for teachers in medium-sized schools (8.10 years) and large schools (7.30 years) are longer than those for teachers in small schools (5.31 years). The authors attribute this to the greater career advancement opportunities in larger schools. (Note that elementary schools tend to be smaller than, but have higher retention than, secondary schools. Thus, this size effect appears not to be confounded with a school-level effect. However, a discussion of these effects when controlled for each other and perhaps interacted in a regression would have been a useful addition to this paper, which simply presents a series of univariate results rather than a multivariate approach.) There are no statistically significant differences in survival times between teachers in high-minority, high-white, and integrated schools, nor between teachers in urban, rural, and suburban
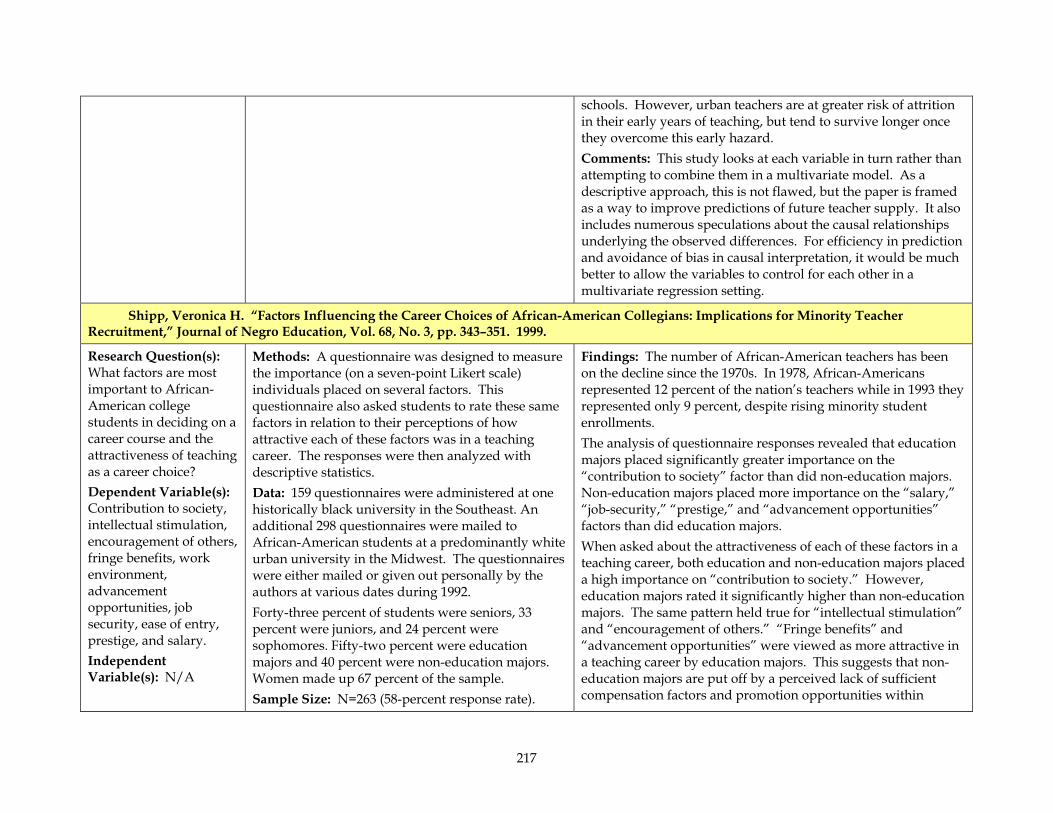
217
schools. However, urban teachers are at greater risk of attrition in their early years of teaching, but tend to survive longer once they overcome this early hazard. Comments: This study looks at each variable in turn rather than attempting to combine them in a multivariate model. As a descriptive approach, this is not flawed, but the paper is framed as a way to improve predictions of future teacher supply. It also includes numerous speculations about the causal relationships underlying the observed differences. For efficiency in prediction and avoidance of bias in causal interpretation, it would be much better to allow the variables to control for each other in a multivariate regression setting.
Shipp, Veronica H. “Factors Influencing the Career Choices of African-American Collegians: Implications for Minority Teacher Recruitment,” Journal of Negro Education, Vol. 68, No. 3, pp. 343–351. 1999.
Research Question(s): What factors are most important to African-American college students in deciding on a career course and the attractiveness of teaching as a career choice? Dependent Variable(s): Contribution to society, intellectual stimulation, encouragement of others, fringe benefits, work environment, advancement opportunities, job security, ease of entry, prestige, and salary. Independent Variable(s): N/A
Methods: A questionnaire was designed to measure the importance (on a seven-point Likert scale) individuals placed on several factors. This questionnaire also asked students to rate these same factors in relation to their perceptions of how attractive each of these factors was in a teaching career. The responses were then analyzed with descriptive statistics. Data: 159 questionnaires were administered at one historically black university in the Southeast. An additional 298 questionnaires were mailed to African-American students at a predominantly white urban university in the Midwest. The questionnaires were either mailed or given out personally by the authors at various dates during 1992. Forty-three percent of students were seniors, 33 percent were juniors, and 24 percent were sophomores. Fifty-two percent were education majors and 40 percent were non-education majors. Women made up 67 percent of the sample. Sample Size: N=263 (58-percent response rate).
Findings: The number of African-American teachers has been on the decline since the 1970s. In 1978, African-Americans represented 12 percent of the nation’s teachers while in 1993 they represented only 9 percent, despite rising minority student enrollments. The analysis of questionnaire responses revealed that education majors placed significantly greater importance on the “contribution to society” factor than did non-education majors. Non-education majors placed more importance on the “salary,” “job-security,” “prestige,” and “advancement opportunities” factors than did education majors. When asked about the attractiveness of each of these factors in a teaching career, both education and non-education majors placed a high importance on “contribution to society.” However, education majors rated it significantly higher than non-education majors. The same pattern held true for “intellectual stimulation” and “encouragement of others.” “Fringe benefits” and “advancement opportunities” were viewed as more attractive in a teaching career by education majors. This suggests that non-education majors are put off by a perceived lack of sufficient compensation factors and promotion opportunities within
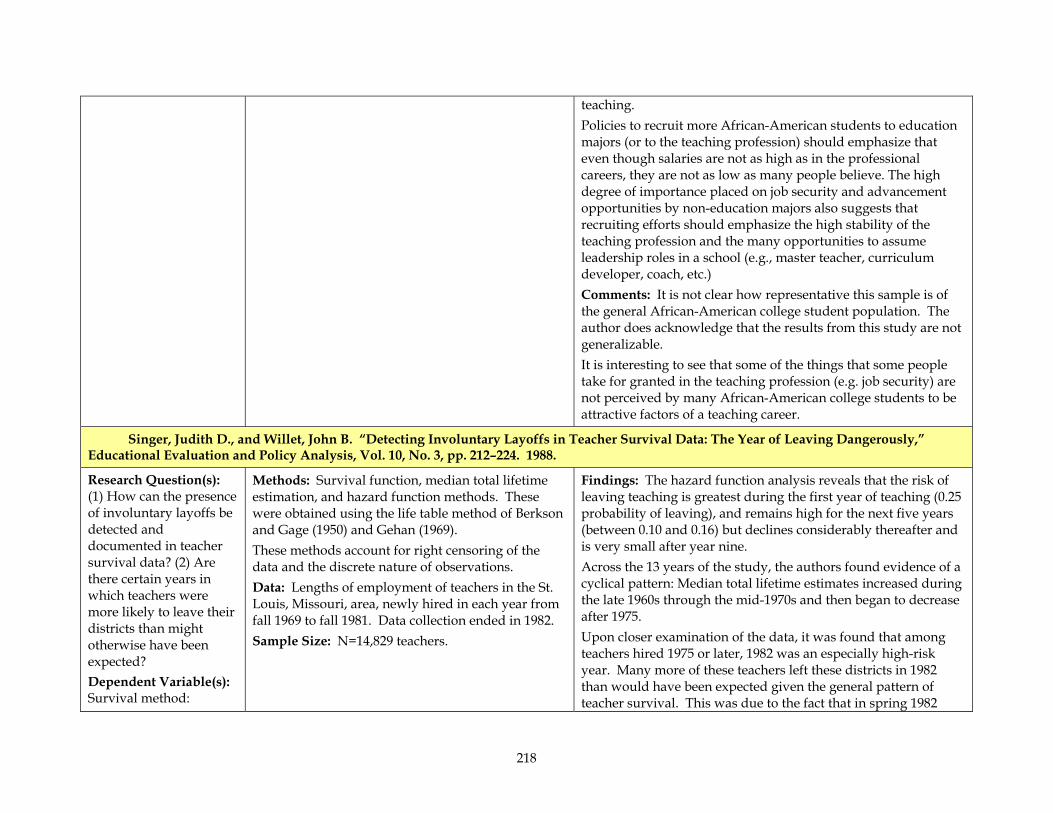
218
teaching. Policies to recruit more African-American students to education majors (or to the teaching profession) should emphasize that even though salaries are not as high as in the professional careers, they are not as low as many people believe. The high degree of importance placed on job security and advancement opportunities by non-education majors also suggests that recruiting efforts should emphasize the high stability of the teaching profession and the many opportunities to assume leadership roles in a school (e.g., master teacher, curriculum developer, coach, etc.) Comments: It is not clear how representative this sample is of the general African-American college student population. The author does acknowledge that the results from this study are not generalizable. It is interesting to see that some of the things that some people take for granted in the teaching profession (e.g. job security) are not perceived by many African-American college students to be attractive factors of a teaching career.
Singer, Judith D., and Willet, John B. “Detecting Involuntary Layoffs in Teacher Survival Data: The Year of Leaving Dangerously,” Educational Evaluation and Policy Analysis, Vol. 10, No. 3, pp. 212–224. 1988.
Research Question(s): (1) How can the presence of involuntary layoffs be detected and documented in teacher survival data? (2) Are there certain years in which teachers were more likely to leave their districts than might otherwise have been expected? Dependent Variable(s): Survival method:
Methods: Survival function, median total lifetime estimation, and hazard function methods. These were obtained using the life table method of Berkson and Gage (1950) and Gehan (1969). These methods account for right censoring of the data and the discrete nature of observations. Data: Lengths of employment of teachers in the St. Louis, Missouri, area, newly hired in each year from fall 1969 to fall 1981. Data collection ended in 1982. Sample Size: N=14,829 teachers.
Findings: The hazard function analysis reveals that the risk of leaving teaching is greatest during the first year of teaching (0.25 probability of leaving), and remains high for the next five years (between 0.10 and 0.16) but declines considerably thereafter and is very small after year nine. Across the 13 years of the study, the authors found evidence of a cyclical pattern: Median total lifetime estimates increased during the late 1960s through the mid-1970s and then began to decrease after 1975. Upon closer examination of the data, it was found that among teachers hired 1975 or later, 1982 was an especially high-risk year. Many more of these teachers left these districts in 1982 than would have been expected given the general pattern of teacher survival. This was due to the fact that in spring 1982
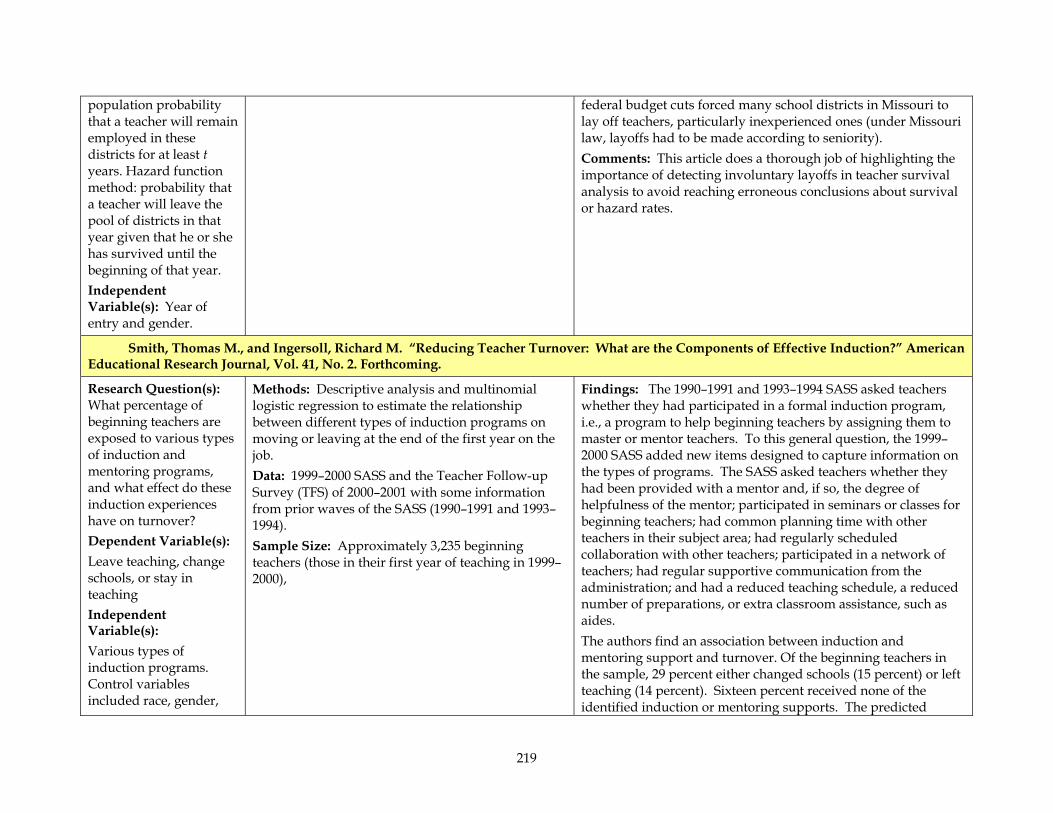
219
population probability that a teacher will remain employed in these districts for at least t years. Hazard function method: probability that a teacher will leave the pool of districts in that year given that he or she has survived until the beginning of that year. Independent Variable(s): Year of entry and gender.
federal budget cuts forced many school districts in Missouri to lay off teachers, particularly inexperienced ones (under Missouri law, layoffs had to be made according to seniority). Comments: This article does a thorough job of highlighting the importance of detecting involuntary layoffs in teacher survival analysis to avoid reaching erroneous conclusions about survival or hazard rates.
Smith, Thomas M., and Ingersoll, Richard M. “Reducing Teacher Turnover: What are the Components of Effective Induction?” American Educational Research Journal, Vol. 41, No. 2. Forthcoming.
Research Question(s): What percentage of beginning teachers are exposed to various types of induction and mentoring programs, and what effect do these induction experiences have on turnover? Dependent Variable(s): Leave teaching, change schools, or stay in teaching Independent Variable(s): Various types of induction programs. Control variables included race, gender,
Methods: Descriptive analysis and multinomial logistic regression to estimate the relationship between different types of induction programs on moving or leaving at the end of the first year on the job. Data: 1999–2000 SASS and the Teacher Follow-up Survey (TFS) of 2000–2001 with some information from prior waves of the SASS (1990–1991 and 1993–1994). Sample Size: Approximately 3,235 beginning teachers (those in their first year of teaching in 1999–2000),
Findings: The 1990–1991 and 1993–1994 SASS asked teachers whether they had participated in a formal induction program, i.e., a program to help beginning teachers by assigning them to master or mentor teachers. To this general question, the 1999–2000 SASS added new items designed to capture information on the types of programs. The SASS asked teachers whether they had been provided with a mentor and, if so, the degree of helpfulness of the mentor; participated in seminars or classes for beginning teachers; had common planning time with other teachers in their subject area; had regularly scheduled collaboration with other teachers; participated in a network of teachers; had regular supportive communication from the administration; and had a reduced teaching schedule, a reduced number of preparations, or extra classroom assistance, such as aides. The authors find an association between induction and mentoring support and turnover. Of the beginning teachers in the sample, 29 percent either changed schools (15 percent) or left teaching (14 percent). Sixteen percent received none of the identified induction or mentoring supports. The predicted
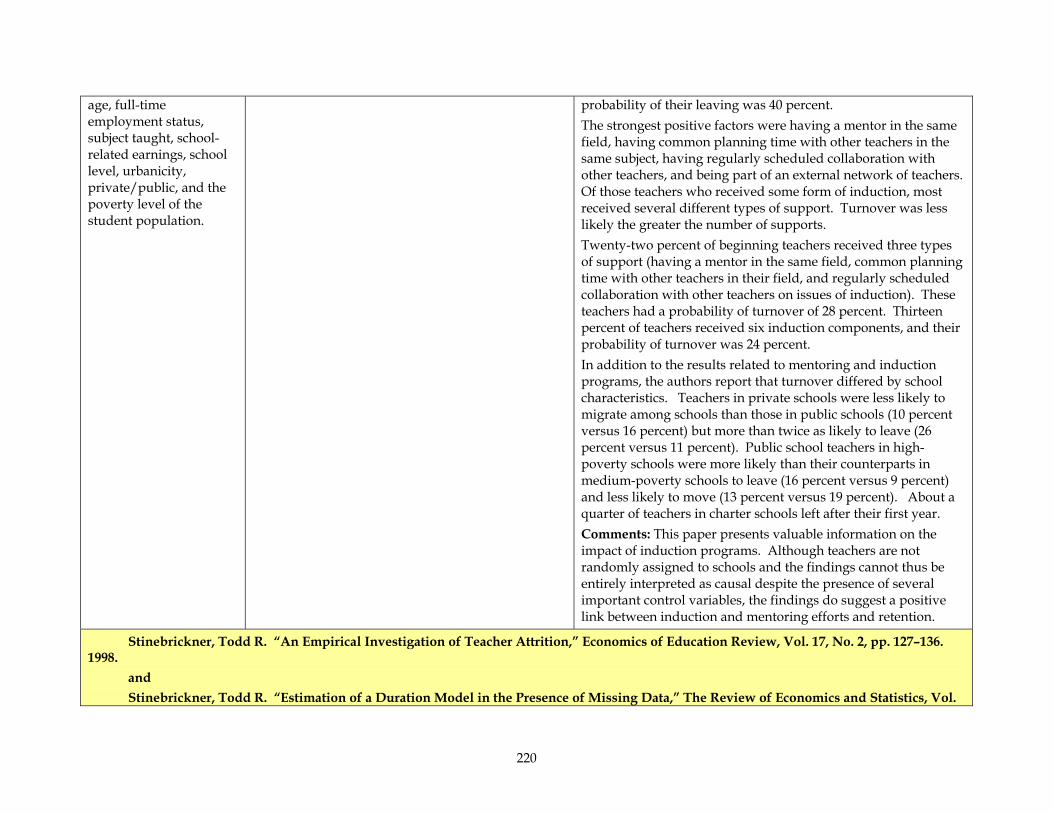
220
age, full-time employment status, subject taught, school-related earnings, school level, urbanicity, private/public, and the poverty level of the student population.
probability of their leaving was 40 percent. The strongest positive factors were having a mentor in the same field, having common planning time with other teachers in the same subject, having regularly scheduled collaboration with other teachers, and being part of an external network of teachers. Of those teachers who received some form of induction, most received several different types of support. Turnover was less likely the greater the number of supports. Twenty-two percent of beginning teachers received three types of support (having a mentor in the same field, common planning time with other teachers in their field, and regularly scheduled collaboration with other teachers on issues of induction). These teachers had a probability of turnover of 28 percent. Thirteen percent of teachers received six induction components, and their probability of turnover was 24 percent. In addition to the results related to mentoring and induction programs, the authors report that turnover differed by school characteristics. Teachers in private schools were less likely to migrate among schools than those in public schools (10 percent versus 16 percent) but more than twice as likely to leave (26 percent versus 11 percent). Public school teachers in high-poverty schools were more likely than their counterparts in medium-poverty schools to leave (16 percent versus 9 percent) and less likely to move (13 percent versus 19 percent). About a quarter of teachers in charter schools left after their first year. Comments: This paper presents valuable information on the impact of induction programs. Although teachers are not randomly assigned to schools and the findings cannot thus be entirely interpreted as causal despite the presence of several important control variables, the findings do suggest a positive link between induction and mentoring efforts and retention.
Stinebrickner, Todd R. “An Empirical Investigation of Teacher Attrition,” Economics of Education Review, Vol. 17, No. 2, pp. 127–136. 1998.
and Stinebrickner, Todd R. “Estimation of a Duration Model in the Presence of Missing Data,” The Review of Economics and Statistics, Vol.
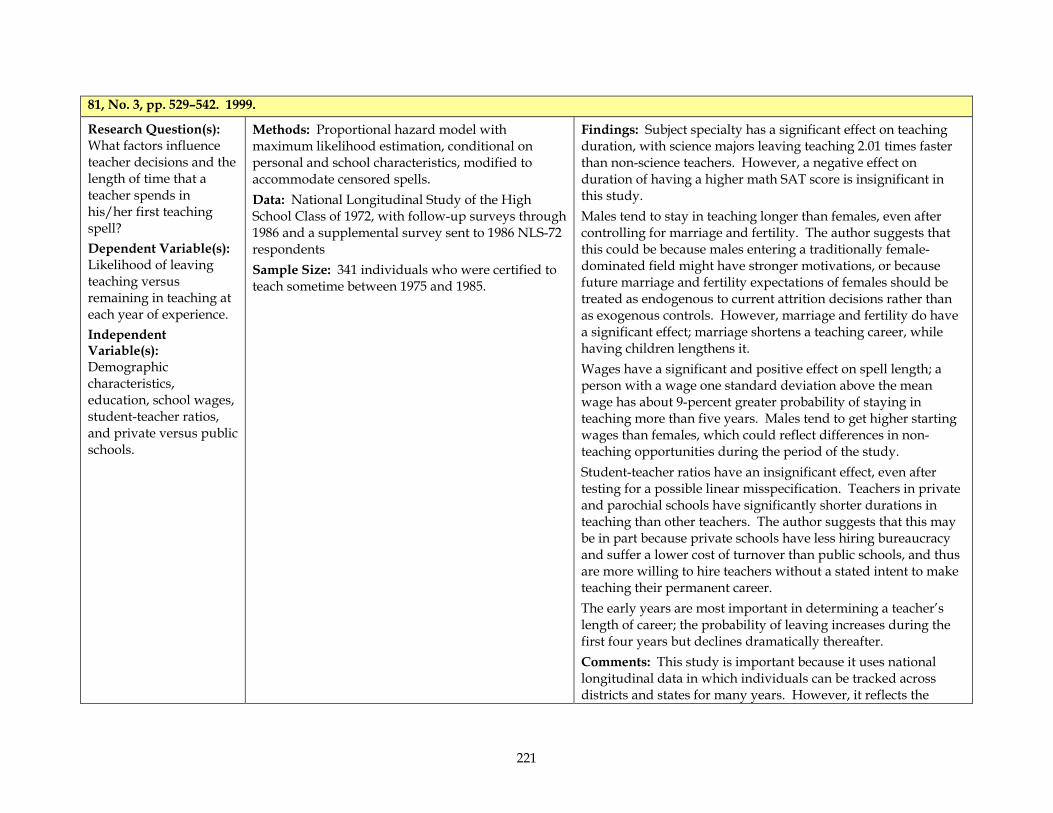
221
81, No. 3, pp. 529–542. 1999.
Research Question(s): What factors influence teacher decisions and the length of time that a teacher spends in his/her first teaching spell? Dependent Variable(s): Likelihood of leaving teaching versus remaining in teaching at each year of experience. Independent Variable(s): Demographic characteristics, education, school wages, student-teacher ratios, and private versus public schools.
Methods: Proportional hazard model with maximum likelihood estimation, conditional on personal and school characteristics, modified to accommodate censored spells. Data: National Longitudinal Study of the High School Class of 1972, with follow-up surveys through 1986 and a supplemental survey sent to 1986 NLS-72 respondents Sample Size: 341 individuals who were certified to teach sometime between 1975 and 1985.
Findings: Subject specialty has a significant effect on teaching duration, with science majors leaving teaching 2.01 times faster than non-science teachers. However, a negative effect on duration of having a higher math SAT score is insignificant in this study. Males tend to stay in teaching longer than females, even after controlling for marriage and fertility. The author suggests that this could be because males entering a traditionally female-dominated field might have stronger motivations, or because future marriage and fertility expectations of females should be treated as endogenous to current attrition decisions rather than as exogenous controls. However, marriage and fertility do have a significant effect; marriage shortens a teaching career, while having children lengthens it. Wages have a significant and positive effect on spell length; a person with a wage one standard deviation above the mean wage has about 9-percent greater probability of staying in teaching more than five years. Males tend to get higher starting wages than females, which could reflect differences in non-teaching opportunities during the period of the study. Student-teacher ratios have an insignificant effect, even after testing for a possible linear misspecification. Teachers in private and parochial schools have significantly shorter durations in teaching than other teachers. The author suggests that this may be in part because private schools have less hiring bureaucracy and suffer a lower cost of turnover than public schools, and thus are more willing to hire teachers without a stated intent to make teaching their permanent career. The early years are most important in determining a teacher’s length of career; the probability of leaving increases during the first four years but declines dramatically thereafter. Comments: This study is important because it uses national longitudinal data in which individuals can be tracked across districts and states for many years. However, it reflects the
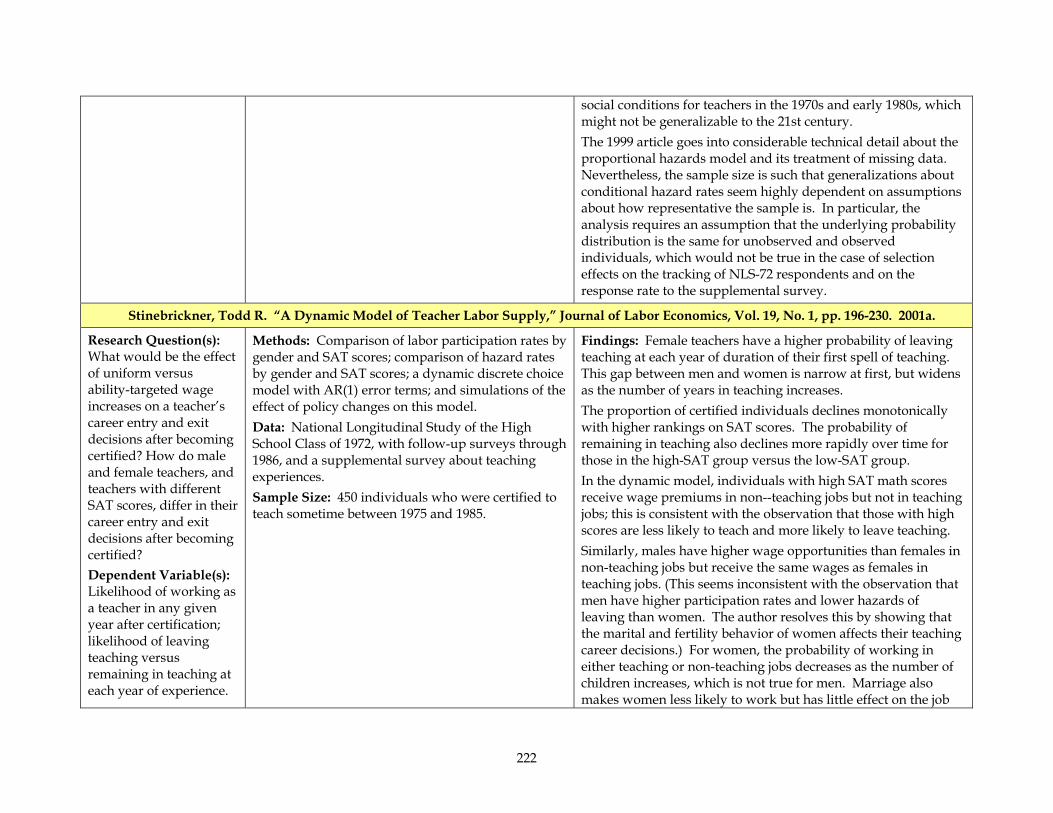
222
social conditions for teachers in the 1970s and early 1980s, which might not be generalizable to the 21st century. The 1999 article goes into considerable technical detail about the proportional hazards model and its treatment of missing data. Nevertheless, the sample size is such that generalizations about conditional hazard rates seem highly dependent on assumptions about how representative the sample is. In particular, the analysis requires an assumption that the underlying probability distribution is the same for unobserved and observed individuals, which would not be true in the case of selection effects on the tracking of NLS-72 respondents and on the response rate to the supplemental survey.
Stinebrickner, Todd R. “A Dynamic Model of Teacher Labor Supply,” Journal of Labor Economics, Vol. 19, No. 1, pp. 196-230. 2001a.
Research Question(s): What would be the effect of uniform versus ability-targeted wage increases on a teacher’s career entry and exit decisions after becoming certified? How do male and female teachers, and teachers with different SAT scores, differ in their career entry and exit decisions after becoming certified? Dependent Variable(s): Likelihood of working as a teacher in any given year after certification; likelihood of leaving teaching versus remaining in teaching at each year of experience.
Methods: Comparison of labor participation rates by gender and SAT scores; comparison of hazard rates by gender and SAT scores; a dynamic discrete choice model with AR(1) error terms; and simulations of the effect of policy changes on this model. Data: National Longitudinal Study of the High School Class of 1972, with follow-up surveys through 1986, and a supplemental survey about teaching experiences. Sample Size: 450 individuals who were certified to teach sometime between 1975 and 1985.
Findings: Female teachers have a higher probability of leaving teaching at each year of duration of their first spell of teaching. This gap between men and women is narrow at first, but widens as the number of years in teaching increases. The proportion of certified individuals declines monotonically with higher rankings on SAT scores. The probability of remaining in teaching also declines more rapidly over time for those in the high-SAT group versus the low-SAT group. In the dynamic model, individuals with high SAT math scores receive wage premiums in non--teaching jobs but not in teaching jobs; this is consistent with the observation that those with high scores are less likely to teach and more likely to leave teaching. Similarly, males have higher wage opportunities than females in non-teaching jobs but receive the same wages as females in teaching jobs. (This seems inconsistent with the observation that men have higher participation rates and lower hazards of leaving than women. The author resolves this by showing that the marital and fertility behavior of women affects their teaching career decisions.) For women, the probability of working in either teaching or non-teaching jobs decreases as the number of children increases, which is not true for men. Marriage also makes women less likely to work but has little effect on the job
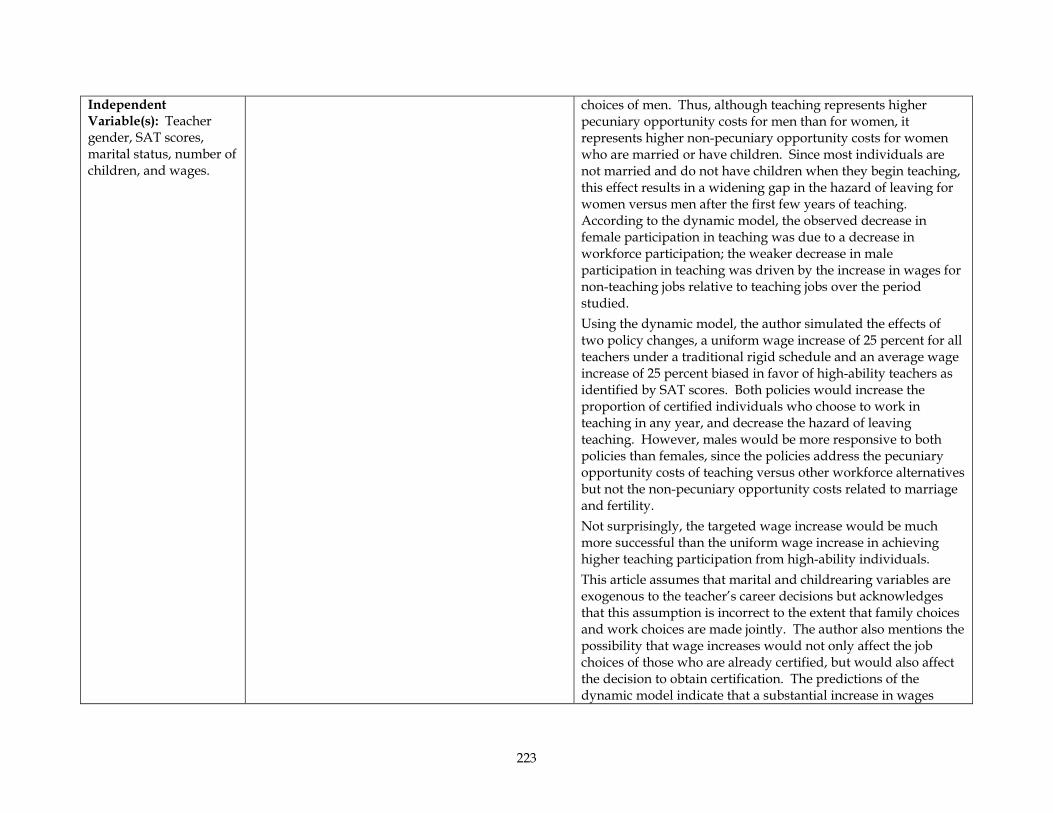
223
Independent Variable(s): Teacher gender, SAT scores, marital status, number of children, and wages.
choices of men. Thus, although teaching represents higher pecuniary opportunity costs for men than for women, it represents higher non-pecuniary opportunity costs for women who are married or have children. Since most individuals are not married and do not have children when they begin teaching, this effect results in a widening gap in the hazard of leaving for women versus men after the first few years of teaching. According to the dynamic model, the observed decrease in female participation in teaching was due to a decrease in workforce participation; the weaker decrease in male participation in teaching was driven by the increase in wages for non-teaching jobs relative to teaching jobs over the period studied. Using the dynamic model, the author simulated the effects of two policy changes, a uniform wage increase of 25 percent for all teachers under a traditional rigid schedule and an average wage increase of 25 percent biased in favor of high-ability teachers as identified by SAT scores. Both policies would increase the proportion of certified individuals who choose to work in teaching in any year, and decrease the hazard of leaving teaching. However, males would be more responsive to both policies than females, since the policies address the pecuniary opportunity costs of teaching versus other workforce alternatives but not the non-pecuniary opportunity costs related to marriage and fertility. Not surprisingly, the targeted wage increase would be much more successful than the uniform wage increase in achieving higher teaching participation from high-ability individuals. This article assumes that marital and childrearing variables are exogenous to the teacher’s career decisions but acknowledges that this assumption is incorrect to the extent that family choices and work choices are made jointly. The author also mentions the possibility that wage increases would not only affect the job choices of those who are already certified, but would also affect the decision to obtain certification. The predictions of the dynamic model indicate that a substantial increase in wages
224
could help achieve a goal of retaining more of the existing workforce of teachers; however, it could slow down the process of bringing more academically gifted individuals into teaching careers because the slower turnover of existing teachers would reduce the positions available for new entrants. Comments: It is essential to keep the method of this paper in mind when interpreting its results. The comparative descriptive statistics are straightforward, but offer little explanation as to why they occur. What the author has done is to posit a behavioral model of labor supply, and then to show that the model accurately predicts the observed data. He then uses that model to predict behavior in the face of counter-factual policy assumptions. Such a method can provide fruitful insights and warnings against policy decisions based on standard assumptions about teacher behavior; this is how the author uses the results. However, such an approach should not be interpreted as strong empirical evidence for those insights.
Stinebrickner, Todd R. “Compensation Policies and Teacher Decisions,” International Economic Review, Vol. 42, No. 3, pp. 751–779. 2001b.
Research Question(s): What would be the effect of uniform versus ability-targeted wages on the decisions of certified individuals to teach or not teach? How do males and females, and individuals with different SAT scores, differ in their preferences for teaching versus non-teaching work or not working? Dependent Variable(s): Likelihood of working as a teacher in any given
Methods: Specification of a discrete-choice, utility-maximizing model for the decision to teach, work outside of teaching, or not work. Estimation of a structural model for pecuniary and non-pecuniary utilities obtained from these choices, as functions of observable personal characteristics, unobservable but constant heterogeneity, and unforeseen stochastic factors. Maximum likelihood estimation of the choice to teach or otherwise. Chi-square tests of utility-maximizing model predictions versus observed likelihood of teaching.. Data: National Longitudinal Study of the High School Class of 1972, with follow-up surveys through 1986, and a supplemental survey about teaching experiences. Sample Size: 551 individuals who were certified to
Findings: The proportion of years spent in teaching declines monotonically with SAT rankings, accompanied by a rising proportion of years spent in non-teaching jobs. High-ability individuals, as indicated by SAT scores in the top third, are able to obtain a substantial wage premium in non-teaching jobs that they cannot obtain in teaching jobs. The estimation of non-pecuniary utilities in this model shows no evidence that high-ability individuals find non-teaching jobs more desirable than teaching jobs for any reason other than this wage premium. The author interprets this as evidence that high-ability individuals are deterred from teaching by the rigid pay structure of teaching jobs, i.e., a structure that rewards teachers for longevity and formal educational credits but not for individual ability. Compared with men, women spend a higher proportion of years out of the workforce and a lower proportion of years in non-teaching jobs. While women and men receive similar wages in teaching jobs, men receive approximately 7-percent higher
225
year after certification. Independent Variable(s): Teacher gender, SAT scores, marital status, number of children, age of youngest child, and wages.
teach sometime between 1975 and 1985.
wages in non-teaching jobs, which accounts for men’s higher proportion of years in non-teaching jobs. However, the proportion of women’s years spent not working appears to be related to marriage and family variables. Being married makes a woman much less likely to work; this is not so for men. Having a child under 6 years of age also makes a woman much less likely to work; again, this is not true for men. The factors predicting proportion of years spent teaching also predict duration of first teaching spells, since there is a substantial net flow of individuals from teaching jobs to non-teaching jobs (in the case of men) and to nonworking status (in the case of women). However, the discrete choice model understates this attrition from teaching; unlike the author’s dynamic model (see Stinebrickner, 2001a), the model described here does not account for the path-dependency of the career decisions being modeled. The unobserved heterogeneity factor in this model cannot be associated with specific individual characteristics, but four types of individuals are characterized by their choices and wages. Some of these types appear to reflect differences in ability that are not captured by SAT scores and have similar effects on career choices and wages as observed for SAT scores; however, the author cautions that this finding could also reflect residence in a region with a high cost of living and thus higher wages. One type identifies persons who prefer not to work; in the terms of the model, their disutilities from both non-teaching and teaching work tend to be high, and they have the highest propensity to have children. The model specified and tested in this paper was also used to simulate the effects of two policy changes regarding teacher compensation: a uniform wage increase for all teachers regardless of ability and a targeted wage increase of the same aggregate amount but with individual wages depending on academic ability. The two policies are similar in their positive effect on the proportion of certified individuals who work in teaching versus other alternatives. However, among the high-
226
ability (high-SAT) group, the targeted wage policy would have a much greater positive impact on the likelihood of teaching than would the uniform wage increase. On the other hand, providing increased benefits for child care for women with children would not be enough to overcome the disutility of working for such individuals. The model estimates that a pay raise of about 60 percent would be necessary to offer equivalent utility between working and not working for a woman with one child under 6 years old. Since this pay raise is much greater than the cost of child care, there are clearly non-pecuniary utility differences that would make subsidized child care relatively ineffective as a way to increase teacher retention. Comments: This paper uses the same data set as the author’s Journal of Labor Economics article (2001a). The comments regarding the interpretation of a simulation model apply to this paper as well.
Stinebrickner, Todd R. “An Analysis of Occupational Change and Departure from the Labor Force: Evidence for the Reasons that Teachers Leave,” Journal of Human Resources, Vol. 37, No. 1, pp. 193–216. 2002.
Research Question(s): (1) What is the relative importance of different exit reasons in teacher attrition rates? (2) Do reasons for leaving teaching vary between types of teachers (e.g., science teachers, high-scoring teachers, elementary versus secondary teachers)? (3) How are marriage and fertility related to duration in teaching and reasons for leaving? (4) Do teaching wages have different effects on
Methods: Descriptive Kaplan-Meier survival analysis; independent competing risks hazard model, assuming proportional hazards, specified to allow for censoring and for unobserved heterogeneity in taste or distaste for teaching and for working. Data: National Longitudinal Study of the High School Class of 1972, with follow-up surveys through 1986, and a supplemental survey about teaching experiences. Sample Size: 422 female respondents who were certified to teach and chose to teach sometime during the sample period (313 used in estimating model due to missing data); 1,028 female non-teachers who entered a non-teaching job during the sample period (772 used in estimating model due to missing data).
Findings: Teachers with higher wages are both less likely to change occupations and less likely to leave the workforce. Women who are married are 1.94 times as likely to leave the workforce as women who are not married. The effect of having children older than one year of age is close to zero, but a woman with a child born since the beginning of the previous school year is 7.83 times as likely to leave the workforce as a woman without a newborn child. (The author points out that the decision to have a child may be endogenous with decisions about a career, so this model may overestimate the true effect of a new child on duration in teaching. The author also points out that individuals with older children who continue to teach have previously made decisions to teach with younger children and/or newborns, and thus might have unobserved propensities not characteristic of all entering teachers. Thus, research that includes data on the presence of a newborn child provides more useful information about the effect of fertility on job attrition than does simply
227
different types of exits from teaching? (5) How do the rates of return to teaching after leaving vary with reasons for leaving? (6) How do teacher attrition rates compare with attrition rates for non-teachers with comparable levels of education? Dependent Variable(s): Likelihood of working as a teacher in any given year after certification; separate likelihood of leaving teaching for a non-teaching job, leaving teaching to exit the workforce, and remaining in teaching at each year of experience. Independent Variable(s): SAT scores, marital status, number of children and whether a new child was born in the last year, wages, science teachers versus other teachers, elementary teachers versus other teachers, and region of the country.
looking at the number of children.) The Kaplan-Meier analysis shows that non-teachers have shorter first spells of work than teachers, and that these spells are more likely to end by changing jobs or occupations than they are for teachers. The effects of wages are similar between teachers and non-teachers, and the effects of having children other than newborns are similarly close to zero. However, the probability of exiting the workforce when a new birth occurs is 0.60 for a female teacher and 0.31 for a female non-teacher. Of teachers who leave the workforce and are observed for at least five years thereafter, 33 percent return to teaching within this period. This rate of return is approximately the same for teachers who leave after the birth of a child; a longer study would be required to identify the effect after six years, when the child is old enough to go to school. The rate of return for teachers who change occupations is 35 percent over the same period. Non-teachers tend to change jobs and occupations more quickly than teachers. Non-teachers tend to exit the workforce at about the same rate as teachers, and they tend to return to work more quickly than teachers who leave the workforce. Of those observed for five years after leaving the workforce, 47 percent of teachers and 77 percent of non-teachers return to some type of work during this period. The author suggests that more non-teachers may leave work to enter school full time, and that the rigid pay structure in schools may reduce the risk of wage loss to a returning teacher as compared with a returning non-teacher. The central finding emphasized in the article is that teachers do not leave teaching simply for better jobs, as the conventional wisdom has it. A large amount of teacher attrition is directly related to marriage and fertility events. The author cautions against overgeneralizing from these results; teaching jobs were scarce during much of the sample period, and changes have occurred since the end of that period in the views of women toward work and raising children. Comments: The text of the article discusses the results only

228
broadly, without addressing all of the research questions identified in the introduction, and without a comprehensive discussion of the estimates on each independent variable for teachers versus non-teachers. The findings described above are those mentioned by the author in the text, without attempting additional interpretations of the coefficients in the table of model estimates.
Theobald, Neil D. “An Examination of the Influence of Personal, Professional, and School District Characteristics on Public School Teacher Retention,” Economics of Education Review, Vol. 9, No. 3, pp. 241–250. 1990.
Research Question(s): What are the determinants of a teachers’ decision to continue teaching in the same school district in which he or she is currently employed or to pursue alternative opportunities, which may include transferring to a different district or leaving the public school sector? Dependent Variable(s): Stay/leave decision (dichotomous). Independent Variable(s): Age, age-squared teaching experience, salary per day, race, gender, elementary school dummy, education (master’s or doctorate), percent Asian, percent black students, percent
Methods: Probit model estimated using maximum likelihood. Analysis is conducted separately for male and female teachers. Data: Records from the Certified Personnel Report maintained by Washington State’s Office of the Superintendent of Public Instruction. The data for this study come from the 1984–1985, 1985–1986, and 1986–1987 school years. Sample Size: N=37,321, 37,696 and 38,378 (in 1985, 1986, and 1987 respectively)
Findings: Years of teaching experience and an elementary teaching assignment are both correlated with a “stay” decision. The effects of age mostly follow the quadratic pattern shown in Grissmer and Kirby (1987), but do not confirm Grissmer and Kirby’s findings that older females are just as likely as older men to leave their current district. In fact, these results suggest that older females are much more likely to remain in their positions than older males. A teacher’s next-year salary is positively correlated with a “stay” decision. If teachers predict that they will earn 10 percent more next year in their current district, they are 6.9 percent more likely to stay, holding all else equal. Male teachers with graduate degrees are nearly 50 percent more likely to leave their positions than similar males without these degrees. This effect is not statistically significant for females. This suggests that policies such as the one implemented in Washington that requires a master’s degree of all teachers may have adverse effects in teacher retention. If it is true that male teachers pursue graduate degrees in order to advance into administration, and if administration positions do not grow considerably in the next few years, many male teachers may find themselves qualified enough (in terms of education degrees) to pursue occupations outside of teaching. The strongest effect of a district characteristic on stay/leave decisions was that of the assessed valuation. Contrary to previous research, this study does not find that teachers tend to
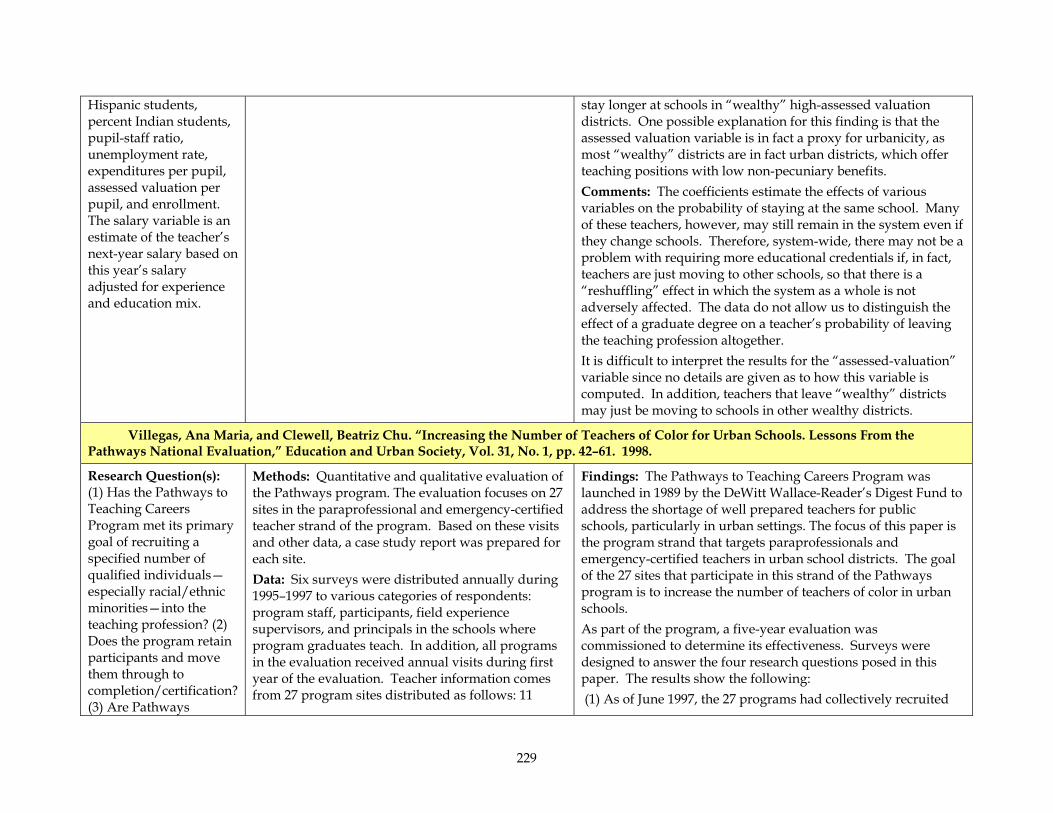
229
Hispanic students, percent Indian students, pupil-staff ratio, unemployment rate, expenditures per pupil, assessed valuation per pupil, and enrollment. The salary variable is an estimate of the teacher’s next-year salary based on this year’s salary adjusted for experience and education mix.
stay longer at schools in “wealthy” high-assessed valuation districts. One possible explanation for this finding is that the assessed valuation variable is in fact a proxy for urbanicity, as most “wealthy” districts are in fact urban districts, which offer teaching positions with low non-pecuniary benefits. Comments: The coefficients estimate the effects of various variables on the probability of staying at the same school. Many of these teachers, however, may still remain in the system even if they change schools. Therefore, system-wide, there may not be a problem with requiring more educational credentials if, in fact, teachers are just moving to other schools, so that there is a “reshuffling” effect in which the system as a whole is not adversely affected. The data do not allow us to distinguish the effect of a graduate degree on a teacher’s probability of leaving the teaching profession altogether. It is difficult to interpret the results for the “assessed-valuation” variable since no details are given as to how this variable is computed. In addition, teachers that leave “wealthy” districts may just be moving to schools in other wealthy districts.
Villegas, Ana Maria, and Clewell, Beatriz Chu. “Increasing the Number of Teachers of Color for Urban Schools. Lessons From the Pathways National Evaluation,” Education and Urban Society, Vol. 31, No. 1, pp. 42–61. 1998.
Research Question(s): (1) Has the Pathways to Teaching Careers Program met its primary goal of recruiting a specified number of qualified individuals—especially racial/ethnic minorities—into the teaching profession? (2) Does the program retain participants and move them through to completion/certification? (3) Are Pathways
Methods: Quantitative and qualitative evaluation of the Pathways program. The evaluation focuses on 27 sites in the paraprofessional and emergency-certified teacher strand of the program. Based on these visits and other data, a case study report was prepared for each site. Data: Six surveys were distributed annually during 1995–1997 to various categories of respondents: program staff, participants, field experience supervisors, and principals in the schools where program graduates teach. In addition, all programs in the evaluation received annual visits during first year of the evaluation. Teacher information comes from 27 program sites distributed as follows: 11
Findings: The Pathways to Teaching Careers Program was launched in 1989 by the DeWitt Wallace-Reader’s Digest Fund to address the shortage of well prepared teachers for public schools, particularly in urban settings. The focus of this paper is the program strand that targets paraprofessionals and emergency-certified teachers in urban school districts. The goal of the 27 sites that participate in this strand of the Pathways program is to increase the number of teachers of color in urban schools. As part of the program, a five-year evaluation was commissioned to determine its effectiveness. Surveys were designed to answer the four research questions posed in this paper. The results show the following: (1) As of June 1997, the 27 programs had collectively recruited
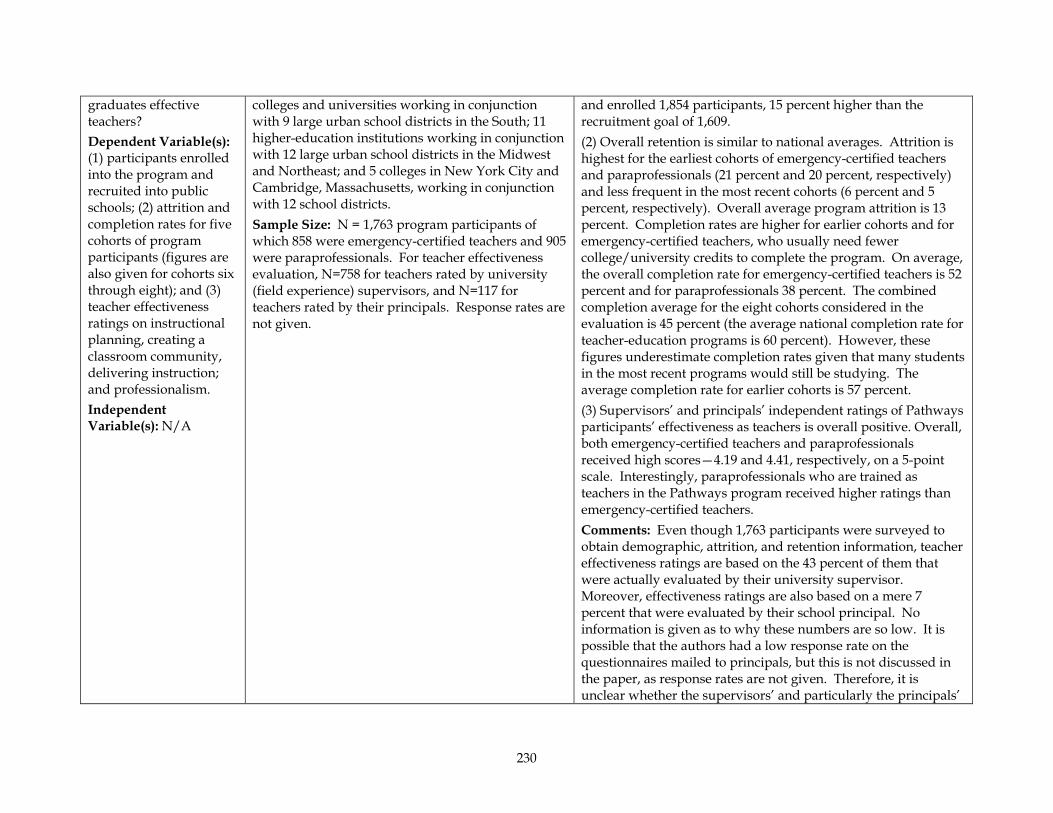
230
graduates effective teachers? Dependent Variable(s): (1) participants enrolled into the program and recruited into public schools; (2) attrition and completion rates for five cohorts of program participants (figures are also given for cohorts six through eight); and (3) teacher effectiveness ratings on instructional planning, creating a classroom community, delivering instruction; and professionalism. Independent Variable(s): N/A
colleges and universities working in conjunction with 9 large urban school districts in the South; 11 higher-education institutions working in conjunction with 12 large urban school districts in the Midwest and Northeast; and 5 colleges in New York City and Cambridge, Massachusetts, working in conjunction with 12 school districts. Sample Size: N = 1,763 program participants of which 858 were emergency-certified teachers and 905 were paraprofessionals. For teacher effectiveness evaluation, N=758 for teachers rated by university (field experience) supervisors, and N=117 for teachers rated by their principals. Response rates are not given.
and enrolled 1,854 participants, 15 percent higher than the recruitment goal of 1,609. (2) Overall retention is similar to national averages. Attrition is highest for the earliest cohorts of emergency-certified teachers and paraprofessionals (21 percent and 20 percent, respectively) and less frequent in the most recent cohorts (6 percent and 5 percent, respectively). Overall average program attrition is 13 percent. Completion rates are higher for earlier cohorts and for emergency-certified teachers, who usually need fewer college/university credits to complete the program. On average, the overall completion rate for emergency-certified teachers is 52 percent and for paraprofessionals 38 percent. The combined completion average for the eight cohorts considered in the evaluation is 45 percent (the average national completion rate for teacher-education programs is 60 percent). However, these figures underestimate completion rates given that many students in the most recent programs would still be studying. The average completion rate for earlier cohorts is 57 percent. (3) Supervisors’ and principals’ independent ratings of Pathways participants’ effectiveness as teachers is overall positive. Overall, both emergency-certified teachers and paraprofessionals received high scores—4.19 and 4.41, respectively, on a 5-point scale. Interestingly, paraprofessionals who are trained as teachers in the Pathways program received higher ratings than emergency-certified teachers. Comments: Even though 1,763 participants were surveyed to obtain demographic, attrition, and retention information, teacher effectiveness ratings are based on the 43 percent of them that were actually evaluated by their university supervisor. Moreover, effectiveness ratings are also based on a mere 7 percent that were evaluated by their school principal. No information is given as to why these numbers are so low. It is possible that the authors had a low response rate on the questionnaires mailed to principals, but this is not discussed in the paper, as response rates are not given. Therefore, it is unclear whether the supervisors’ and particularly the principals’
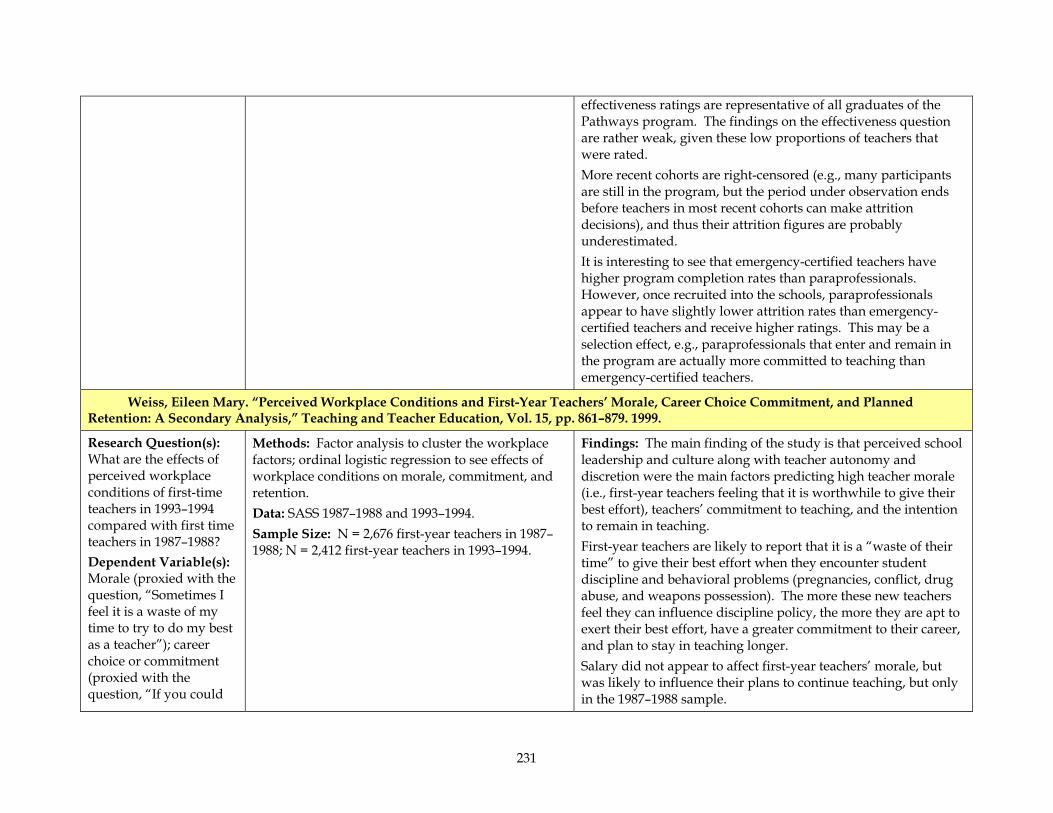
231
effectiveness ratings are representative of all graduates of the Pathways program. The findings on the effectiveness question are rather weak, given these low proportions of teachers that were rated. More recent cohorts are right-censored (e.g., many participants are still in the program, but the period under observation ends before teachers in most recent cohorts can make attrition decisions), and thus their attrition figures are probably underestimated. It is interesting to see that emergency-certified teachers have higher program completion rates than paraprofessionals. However, once recruited into the schools, paraprofessionals appear to have slightly lower attrition rates than emergency-certified teachers and receive higher ratings. This may be a selection effect, e.g., paraprofessionals that enter and remain in the program are actually more committed to teaching than emergency-certified teachers.
Weiss, Eileen Mary. “Perceived Workplace Conditions and First-Year Teachers’ Morale, Career Choice Commitment, and Planned Retention: A Secondary Analysis,” Teaching and Teacher Education, Vol. 15, pp. 861–879. 1999.
Research Question(s): What are the effects of perceived workplace conditions of first-time teachers in 1993–1994 compared with first time teachers in 1987–1988? Dependent Variable(s): Morale (proxied with the question, “Sometimes I feel it is a waste of my time to try to do my best as a teacher”); career choice or commitment (proxied with the question, “If you could
Methods: Factor analysis to cluster the workplace factors; ordinal logistic regression to see effects of workplace conditions on morale, commitment, and retention. Data: SASS 1987–1988 and 1993–1994. Sample Size: N = 2,676 first-year teachers in 1987–1988; N = 2,412 first-year teachers in 1993–1994.
Findings: The main finding of the study is that perceived school leadership and culture along with teacher autonomy and discretion were the main factors predicting high teacher morale (i.e., first-year teachers feeling that it is worthwhile to give their best effort), teachers’ commitment to teaching, and the intention to remain in teaching. First-year teachers are likely to report that it is a “waste of their time” to give their best effort when they encounter student discipline and behavioral problems (pregnancies, conflict, drug abuse, and weapons possession). The more these new teachers feel they can influence discipline policy, the more they are apt to exert their best effort, have a greater commitment to their career, and plan to stay in teaching longer. Salary did not appear to affect first-year teachers’ morale, but was likely to influence their plans to continue teaching, but only in the 1987–1988 sample.
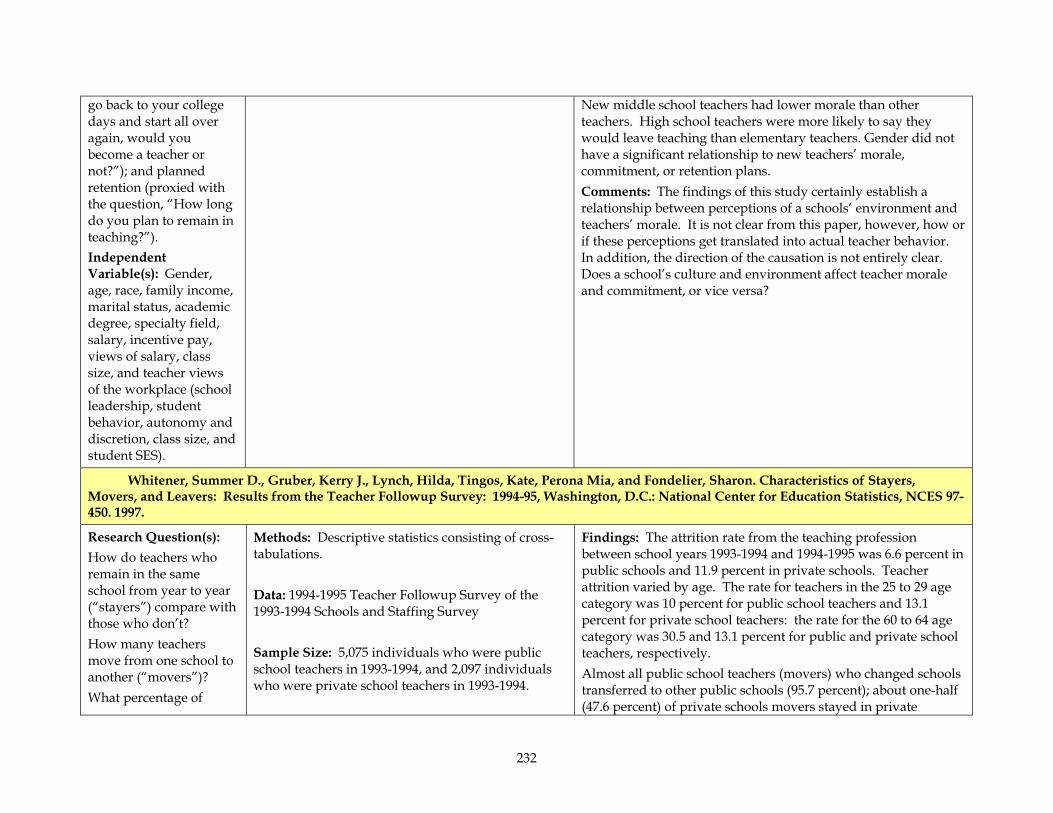
232
go back to your college days and start all over again, would you become a teacher or not?”); and planned retention (proxied with the question, “How long do you plan to remain in teaching?”). Independent Variable(s): Gender, age, race, family income, marital status, academic degree, specialty field, salary, incentive pay, views of salary, class size, and teacher views of the workplace (school leadership, student behavior, autonomy and discretion, class size, and student SES).
New middle school teachers had lower morale than other teachers. High school teachers were more likely to say they would leave teaching than elementary teachers. Gender did not have a significant relationship to new teachers’ morale, commitment, or retention plans. Comments: The findings of this study certainly establish a relationship between perceptions of a schools’ environment and teachers’ morale. It is not clear from this paper, however, how or if these perceptions get translated into actual teacher behavior. In addition, the direction of the causation is not entirely clear. Does a school’s culture and environment affect teacher morale and commitment, or vice versa?
Whitener, Summer D., Gruber, Kerry J., Lynch, Hilda, Tingos, Kate, Perona Mia, and Fondelier, Sharon. Characteristics of Stayers, Movers, and Leavers: Results from the Teacher Followup Survey: 1994-95, Washington, D.C.: National Center for Education Statistics, NCES 97-450. 1997.
Research Question(s): How do teachers who remain in the same school from year to year (“stayers”) compare with those who don’t? How many teachers move from one school to another (“movers”)? What percentage of
Methods: Descriptive statistics consisting of cross-tabulations. Data: 1994-1995 Teacher Followup Survey of the 1993-1994 Schools and Staffing Survey Sample Size: 5,075 individuals who were public school teachers in 1993-1994, and 2,097 individuals who were private school teachers in 1993-1994.
Findings: The attrition rate from the teaching profession between school years 1993-1994 and 1994-1995 was 6.6 percent in public schools and 11.9 percent in private schools. Teacher attrition varied by age. The rate for teachers in the 25 to 29 age category was 10 percent for public school teachers and 13.1 percent for private school teachers: the rate for the 60 to 64 age category was 30.5 and 13.1 percent for public and private school teachers, respectively. Almost all public school teachers (movers) who changed schools transferred to other public schools (95.7 percent); about one-half (47.6 percent) of private schools movers stayed in private
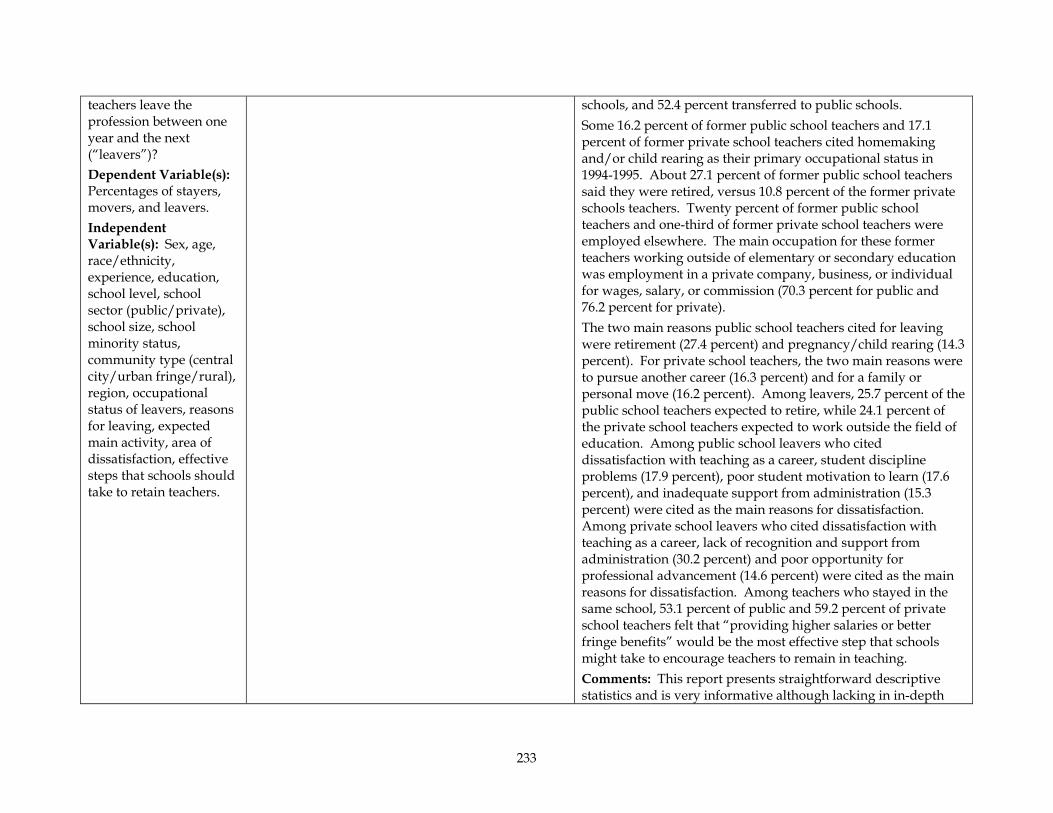
233
teachers leave the profession between one year and the next (“leavers”)? Dependent Variable(s): Percentages of stayers, movers, and leavers. Independent Variable(s): Sex, age, race/ethnicity, experience, education, school level, school sector (public/private), school size, school minority status, community type (central city/urban fringe/rural), region, occupational status of leavers, reasons for leaving, expected main activity, area of dissatisfaction, effective steps that schools should take to retain teachers.
schools, and 52.4 percent transferred to public schools. Some 16.2 percent of former public school teachers and 17.1 percent of former private school teachers cited homemaking and/or child rearing as their primary occupational status in 1994-1995. About 27.1 percent of former public school teachers said they were retired, versus 10.8 percent of the former private schools teachers. Twenty percent of former public school teachers and one-third of former private school teachers were employed elsewhere. The main occupation for these former teachers working outside of elementary or secondary education was employment in a private company, business, or individual for wages, salary, or commission (70.3 percent for public and 76.2 percent for private). The two main reasons public school teachers cited for leaving were retirement (27.4 percent) and pregnancy/child rearing (14.3 percent). For private school teachers, the two main reasons were to pursue another career (16.3 percent) and for a family or personal move (16.2 percent). Among leavers, 25.7 percent of the public school teachers expected to retire, while 24.1 percent of the private school teachers expected to work outside the field of education. Among public school leavers who cited dissatisfaction with teaching as a career, student discipline problems (17.9 percent), poor student motivation to learn (17.6 percent), and inadequate support from administration (15.3 percent) were cited as the main reasons for dissatisfaction. Among private school leavers who cited dissatisfaction with teaching as a career, lack of recognition and support from administration (30.2 percent) and poor opportunity for professional advancement (14.6 percent) were cited as the main reasons for dissatisfaction. Among teachers who stayed in the same school, 53.1 percent of public and 59.2 percent of private school teachers felt that “providing higher salaries or better fringe benefits” would be the most effective step that schools might take to encourage teachers to remain in teaching. Comments: This report presents straightforward descriptive statistics and is very informative although lacking in in-depth
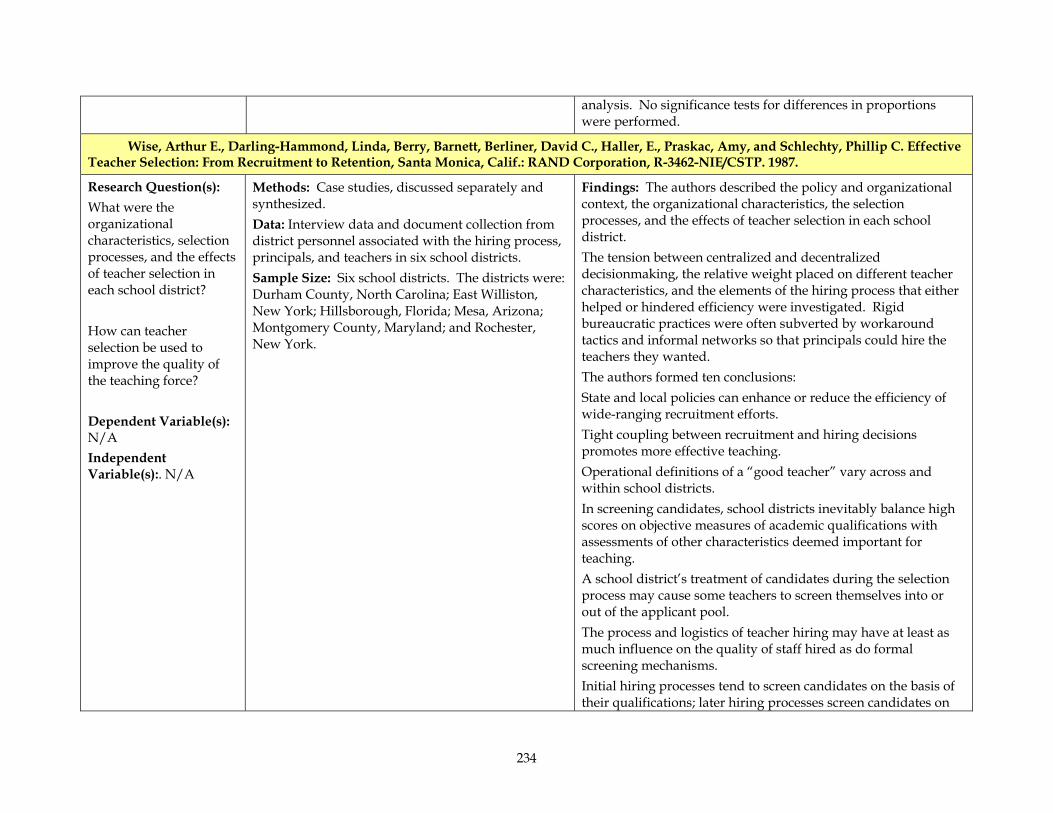
234
analysis. No significance tests for differences in proportions were performed.
Wise, Arthur E., Darling-Hammond, Linda, Berry, Barnett, Berliner, David C., Haller, E., Praskac, Amy, and Schlechty, Phillip C. Effective Teacher Selection: From Recruitment to Retention, Santa Monica, Calif.: RAND Corporation, R-3462-NIE/CSTP. 1987.
Research Question(s): What were the organizational characteristics, selection processes, and the effects of teacher selection in each school district? How can teacher selection be used to improve the quality of the teaching force? Dependent Variable(s): N/A Independent Variable(s):. N/A
Methods: Case studies, discussed separately and synthesized. Data: Interview data and document collection from district personnel associated with the hiring process, principals, and teachers in six school districts. Sample Size: Six school districts. The districts were: Durham County, North Carolina; East Williston, New York; Hillsborough, Florida; Mesa, Arizona; Montgomery County, Maryland; and Rochester, New York.
Findings: The authors described the policy and organizational context, the organizational characteristics, the selection processes, and the effects of teacher selection in each school district. The tension between centralized and decentralized decisionmaking, the relative weight placed on different teacher characteristics, and the elements of the hiring process that either helped or hindered efficiency were investigated. Rigid bureaucratic practices were often subverted by workaround tactics and informal networks so that principals could hire the teachers they wanted. The authors formed ten conclusions: State and local policies can enhance or reduce the efficiency of wide-ranging recruitment efforts. Tight coupling between recruitment and hiring decisions promotes more effective teaching. Operational definitions of a “good teacher” vary across and within school districts. In screening candidates, school districts inevitably balance high scores on objective measures of academic qualifications with assessments of other characteristics deemed important for teaching. A school district’s treatment of candidates during the selection process may cause some teachers to screen themselves into or out of the applicant pool. The process and logistics of teacher hiring may have at least as much influence on the quality of staff hired as do formal screening mechanisms. Initial hiring processes tend to screen candidates on the basis of their qualifications; later hiring processes screen candidates on
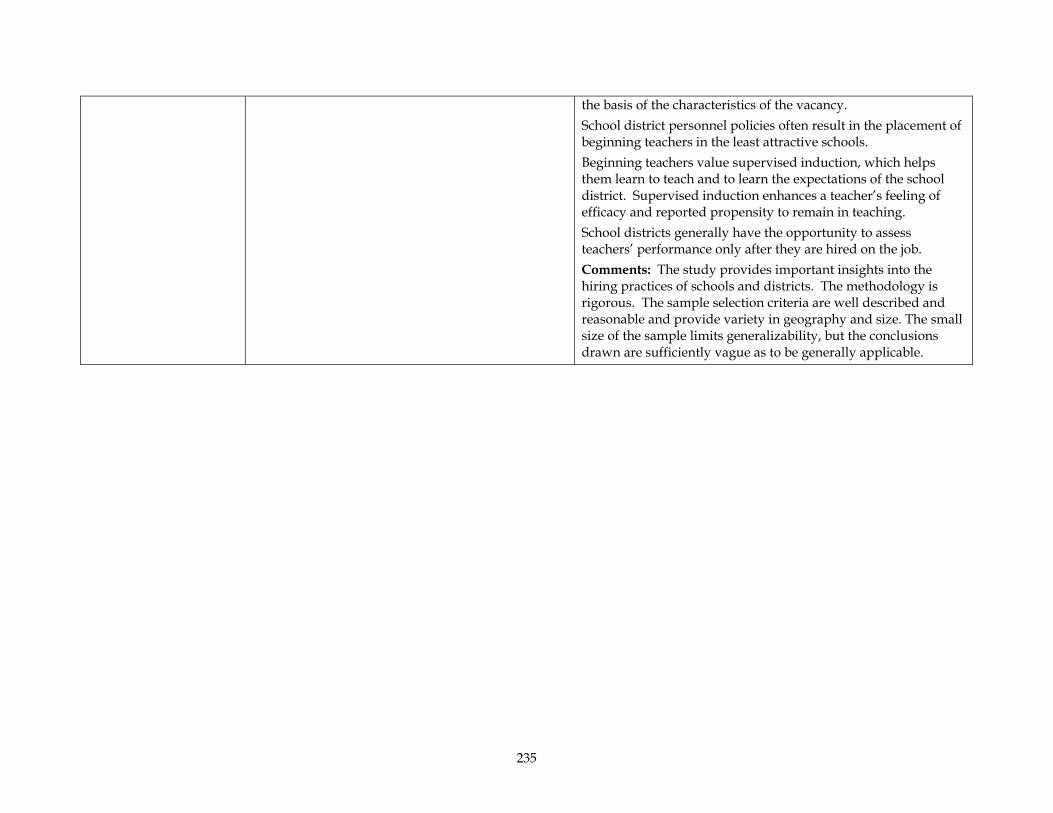
235
the basis of the characteristics of the vacancy. School district personnel policies often result in the placement of beginning teachers in the least attractive schools. Beginning teachers value supervised induction, which helps them learn to teach and to learn the expectations of the school district. Supervised induction enhances a teacher’s feeling of efficacy and reported propensity to remain in teaching. School districts generally have the opportunity to assess teachers’ performance only after they are hired on the job. Comments: The study provides important insights into the hiring practices of schools and districts. The methodology is rigorous. The sample selection criteria are well described and reasonable and provide variety in geography and size. The small size of the sample limits generalizability, but the conclusions drawn are sufficiently vague as to be generally applicable.
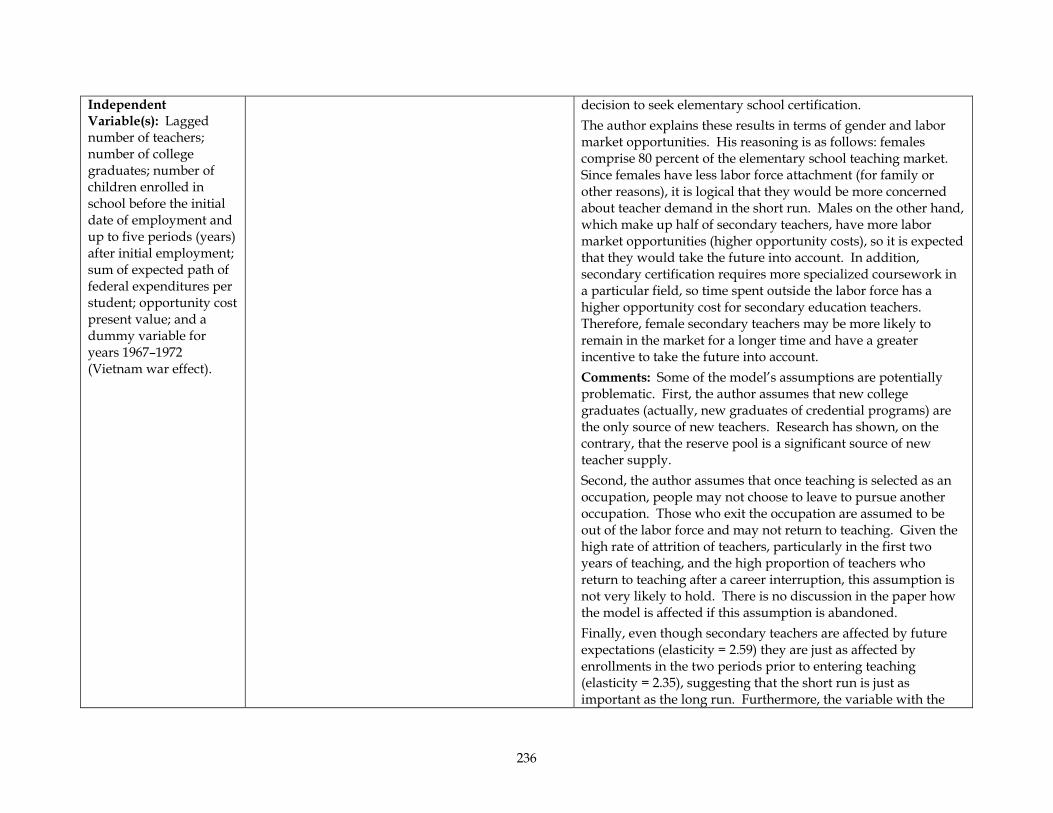
236
Independent Variable(s): Lagged number of teachers; number of college graduates; number of children enrolled in school before the initial date of employment and up to five periods (years) after initial employment; sum of expected path of federal expenditures per student; opportunity cost present value; and a dummy variable for years 1967–1972 (Vietnam war effect).
decision to seek elementary school certification. The author explains these results in terms of gender and labor market opportunities. His reasoning is as follows: females comprise 80 percent of the elementary school teaching market. Since females have less labor force attachment (for family or other reasons), it is logical that they would be more concerned about teacher demand in the short run. Males on the other hand, which make up half of secondary teachers, have more labor market opportunities (higher opportunity costs), so it is expected that they would take the future into account. In addition, secondary certification requires more specialized coursework in a particular field, so time spent outside the labor force has a higher opportunity cost for secondary education teachers. Therefore, female secondary teachers may be more likely to remain in the market for a longer time and have a greater incentive to take the future into account. Comments: Some of the model’s assumptions are potentially problematic. First, the author assumes that new college graduates (actually, new graduates of credential programs) are the only source of new teachers. Research has shown, on the contrary, that the reserve pool is a significant source of new teacher supply. Second, the author assumes that once teaching is selected as an occupation, people may not choose to leave to pursue another occupation. Those who exit the occupation are assumed to be out of the labor force and may not return to teaching. Given the high rate of attrition of teachers, particularly in the first two years of teaching, and the high proportion of teachers who return to teaching after a career interruption, this assumption is not very likely to hold. There is no discussion in the paper how the model is affected if this assumption is abandoned. Finally, even though secondary teachers are affected by future expectations (elasticity = 2.59) they are just as affected by enrollments in the two periods prior to entering teaching (elasticity = 2.35), suggesting that the short run is just as important as the long run. Furthermore, the variable with the
237
most impact on the number of both secondary and elementary teacher education graduates is the lagged number of teachers. This again, suggests that the short run has a greater impact on entry decisions.