Embed Size (px)
Citation preview
Supporting InformationIkeda et al. 10.1073/pnas.0711894105Supporting MethodsSalt Chemotaxis Learning Assays for Supporting Information (SI) Fig.S1 (Conditioning on Plates). In Fig. S1, we used the ‘‘plate condi-tioning method’’ in which animals were placed on 6-cm condi-tioning plates [5 mM potassium phosphate (pH 6.0), 1 mMCaCl2, 1 mM MgSO4, 3% agar] with or without 50 mM NaCl andincubated at 20°C for 4 h. Conditioned animals were then testedfor chemotaxis to NaCl at 20°C as described (1).
Odortaxis and Olfactory Adaptation Assays. Assays of chemotaxis toodorants were based on Bargmann et al. (2). Young animals werewashed three times with assay buffer [5 mM potassium phos-phate (pH 6.0), 1 mM CaCl2, 1 mM MgSO4, 0.05% gelatin] andplaced near the center of the 9-cm assay plates [5 mM potassiumphosphate (pH 6.0), 1 mM CaCl2, 1 mM MgSO4, 2% agar]. Onemicroliter each of diluted odorant or ethanol (for control) wasplaced at a spot 5 mm from the edge of the plate along with 1�l of 0.5 M NaN3 at each spot. Assay time was 1 h. Chemotaxisindex was calculated as [(number of animals within a 2-cm radiusof odorant spot) � (number of animals within a 2-cm radius ofcontrol spot)]/(total number of animals). Olfactory adaptationassays were performed as described (3), except that 20 nl/mlbenzaldehyde was used for preexposure treatments.
Temperature Learning Assays. The temperature learning assayswere performed as described (4, 5) with slight modifications.Nine-centimeter plates with 10 ml of assay medium [25 mMpotassium phosphate (pH 6.0), 0.3% NaCl, 2% agar] were usedfor the assays. L4 larvae from nonstarving nematode growthmedium (NGM) plates were placed on seeded NGM plates andgrown for 18 h at 20°C. A stable 16–25°C radial thermal gradientwas created by placing a frozen acetic acid vial (6 cm tall � 2.5cm diameter, �25 ml acetic acid) in the middle of the assay platein a 25°C incubator. Young adults were individually placed on anonseeded preincubated 20°C NGM plate and crawled for �5min to remove bacteria. Worms were then moved to anothernonseeded preincubated 20°C NGM plate to start starvation(time 0). At different time points, e.g., 0, 1, 2, 3, or 4 h, individualworms were transferred to assay plates and tested for theirtemperature preference. They were allowed to move freely for1 h before being removed from the plates. Their tracks werescored as either prefer 20°C or not, e.g., a track would be scoredas ‘‘�’’ if the worm made at least one circle or most of its tracklay in the 20°C region.
Sensory Integration Assays. Assays for the interaction betweenchemotaxis to diacetyl and avoidance of Cu2� ion were per-formed as described (6) with some modifications. Twenty-fivemicroliters of 100 mM copper sulfate solution, instead of copperacetate used in Ishihara et al. (6), was spread on the midline ofthe 9-cm assay plates [10 mM Hepes (pH 7.0), 1 mM CaCl2, 1mM MgSO4, 50 mM NaCl, 2% agar]. These plates were placedat room temperature overnight to allow the diffusion of coppersulfate before each assay. Young adult animals were washedthree times with wash buffer [25 mM potassium phosphate (pH6.0), 50 mM NaCl, 0.02% gelatin], and were placed on one sideof the Cu2� barrier on the assay plate. After excess buffer wasabsorbed, 2 �l of diluted diacetyl was spotted on the other side.After 90 min, the number of animals on each side was scored.The index was calculated as (number of animals on the odorantside)/(total number of animals).
Chemotaxis Assays to Cu2�. Chemotaxis assays to Cu2� wereperformed as described (7) with some modifications. Four-quadrant plates (X-plates) were used for the assays. Pairs ofopposite quadrants were filled with �12 ml of CTX agar [10mM MOPS (pH 7.2), 1 mM CaCl2, 1 mM MgSO4, 2% agar]either with or without 100 �M CuSO4. After the agar hadsolidified, �10 ml of CTX agar was poured on the top of thewhole plate so that the plastic barriers were covered. Theplates were kept at room temperature for 6–9 h. A populationof animals was washed three times with wash buffer [10 mMMOPS (pH 7.2), 1 mM CaCl2, 1 mM MgSO4, 0.05% gelatin]and were placed on the center of the assay plates. After 60 min,the number of animals on each quadrant was scored. The indexwas calculated as [(number of animals on Cu2� quadrants) �(number of animals on control quadrants)]/(total number ofanimals).
Heat Shock Experiments. casy-1(tm718) animals carryinghsp16.2p::casy-1 were cultivated at 20°C to young adulthood,and shifted to 33°C for 1 h or 2 h. These animals wererecovered by incubation at 20°C for 1 h (for 1-h heat shock) or2 h (for 2-h heat shock). Salt chemotaxis learning assays wereperformed at 23°C.
Plasmid Constructions. Most of the casy-1 expression vectors wereconstructed by using the GATEWAY system (Invitrogen). De-tails of the use of the Gateway system can be viewed at ourweb-site http://park.itc.u-tokyo.ac.jp/mgrl/IINO�lab/Gateway/Gateway�overview1.html.
The casy-1 cDNA yk221c2 (a gift from Yuji Kohara, NationalInstitute of Genetics, Shizuoka, Japan) was inserted into thepPD-DEST vector to generate a casy-1 destination vector (pP-DDEST-casy1). For RYV, mRFP (a gift from Roger Tsien,University of California at San Diego, La Jolla, CA) was insertedat the end of putative signal sequence and Venus was insertedjust before the end of the coding region of CASY-1 in pPD-DEST-casy1. For a series of RYV deletion plasmids, eachsequence was amplified by PCR from RYV destination vector,and joined by self-ligation. They contain EcoRV and/or XbaIrecognition sequences (6 bp) at the joining sites. To generateentry vectors carrying gcy-22 promoter sequence (8), the pro-moter region was amplified by PCR from C. elegans genomicDNA (2.4 kb) and inserted into pENTR1A vector. To generateentry vectors carrying the hsp16.2 promoter, the promoterregions were amplified by PCR from pPD49.78 (0.4 kb forhsp16.2) and inserted into the pDONR201 vector by site-specificrecombination. Other entry vectors used in this study weregenerated in a similar way (for H20 promoter) or as describedpreviously. casy-1p::gfp was constructed by inserting a 3-kb casy-1promoter sequence, which was amplified by PCR from genomicDNA, into pPD95.75 (from A. Fire, Stanford University, Stan-ford, CA). NtGFP::CASY-1 and CASY-1::CtGFP were N-terminal and C-terminal GFP fusion proteins, respectively. Bothconstructs were generated by inserting a 17.6-kb fragments ofcosmids (B0034) cut by KpnI into pBluescript SK. GFP werethen inserted into the end of the putative signal sequence or justbefore the end of the coding sequence of CASY-1. They sharethe same transcriptional regulatory sequences including thepromoter (5.1 kb) and 3� UTR.
Germ-Line Transformation. Germ-line transformations were per-formed by standard microinjection methods (9). Most of expres-
Ikeda et al. www.pnas.org/cgi/content/short/0711894105 1 of 8
sion constructs were injected along with myo-3p::venus as atransformation marker and pPD49.26 as a carrier DNA. dpy-20(�) marker was used as a transformation marker for theobservation of expression or localization of RYV and its deriv-ative in Fig. 4.
Statistic Analyses. Statistic analyses of behavioral data wereperformed with R version 2.6.1 for Windows. Depending on theassays, unpaired t tests, Dunnett’s tests, or two-way ANOVA,followed by Tukey post hoc tests were used. An � level of 0.02was used in all tests. Error bars indicate the SEM.
1. Tomioka M, et al. (2006) The insulin/PI 3-kinase pathway regulates salt chemotaxislearning in Caenorhabditis elegans. Neuron 51:613–625.
2. Bargmann CI, Hartwieg E, Horvitz HR (1993) Odorant-selective genes and neuronsmediate olfaction in C. elegans. Cell 74:515–527.
3. Matsuki M, Kunitomo H, Iino Y (2006) Go� regulates olfactory adaptation by antag-onizing Gq�-DAG signaling in Caenorhabditis elegans. Proc Natl Acad Sci USA103:1112–1117.
4. Hedgecock EM, Russell RL (1975) Normal and mutant thermotaxis in the nematodeCaenorhabditis elegans. Proc Natl Acad Sci USA 72:4061–4065.
5. Mori I, Ohshima Y (1995) Neural regulation of thermotaxis in Caenorhabditis elegans.Nature 376:344–348.
6. Ishihara T, et al. (2002) HEN-1, a secretory protein with an LDL receptor motif, regulatessensory integration and learning in Caenorhabditis elegans. Cell 109:639–649.
7. Wicks SR, de Vries CJ, van Luenen HG, Plasterk RH (2000) CHE-3, a cytosolic dynein heavychain, is required for sensory cilia structure and function in Caenorhabditis elegans.Dev Biol 221:295–307.
8. Johnston RJ, Jr, Chang S, Etchberger JF, Ortiz CO, Hobert O (2005) MicroRNAs acting ina double-negative feedback loop to control a neuronal cell fate decision. Proc NatlAcad Sci USA 102:12449–12454.
9. Mello CC, Kramer JM, Stinchcomb D, Ambros V (1991) Efficient gene transfer inC.elegans: Extrachromosomal maintenance and integration of transforming se-quences. EMBO J 10:3959–3970.
10. Hill E, Broadbent ID, Chothia C, Pettitt J (2001) Cadherin superfamily proteins inCaenorhabditis elegans and Drosophila melanogaster. J Mol Biol 305:1011–1024.
11. Tepass U, Truong K, Godt D, Ikura M, Peifer M (2000) Cadherins in embryonic andneural morphogenesis. Nature Rev Mol Cell Biol 1:91–100.
12. Araki Y, et al. (2003) Novel cadherin-related membrane proteins, Alcadeins, enhancethe X11-like protein-mediated stabilization of amyloid beta-protein precursor metab-olism. J Biol Chem 278:49448–49458.
13. Vogt L, et al. (2001) Calsyntenin-1, a proteolytically processed postsynaptic mem-brane protein with a cytoplasmic calcium-binding domain. Mol Cell Neurosci 17,151–166.
Ikeda et al. www.pnas.org/cgi/content/short/0711894105 2 of 8

**
-0.4
-0.2
0.0
0.2
0.4
0.6
0.8
WT casy-1(pe401)
Chemotaxisindex
mock-conditioned
NaCl-conditioned
Fig. S1. casy-1(pe401) mutants are defective in salt chemotaxis learning (plate conditioning). Wild-type (WT) animals or casy-1(pe401) mutants were kept onNaCl-free plates (mock-conditioned) or plates containing 50 mM NaCl (NaCl-conditioned) for 4 h and tested for chemotaxis to NaCl. See SI Methods in SI Textfor the learning assay procedure. Asterisks represent significant difference between strains (unpaired t test; **, P � 0.001).
Ikeda et al. www.pnas.org/cgi/content/short/0711894105 3 of 8
ceCASY-1dmCALShsCLSTN1hsCLSTN2hsCLSTN3
ceCASY-1dmCALShsCLSTN1hsCLSTN2hsCLSTN3
ceCASY-1dmCALShsCLSTN1hsCLSTN2hsCLSTN3
ceCASY-1dmCALShsCLSTN1hsCLSTN2hsCLSTN3
ceCASY-1dmCALShsCLSTN1hsCLSTN2hsCLSTN3
ceCASY-1dmCALShsCLSTN1hsCLSTN2hsCLSTN3
ceCASY-1dmCALShsCLSTN1hsCLSTN2hsCLSTN3
ceCASY-1dmCALShsCLSTN1hsCLSTN2hsCLSTN3
ceCASY-1dmCALShsCLSTN1hsCLSTN2hsCLSTN3
ceCASY-1dmCALShsCLSTN1hsCLSTN2hsCLSTN3
ceCASY-1dmCALShsCLSTN1hsCLSTN2hsCLSTN3
ceCASY-1dmCALShsCLSTN1hsCLSTN2hsCLSTN3
11111
7077918772
165166187183168
263263284280265
354349377370360
447446466462455
524527556536544
618626650630638
694722742719730
792817821800809
884913893866887
984
acidic region
T.M.
hd33 in-frame deletion
LG/LNS pe401 E K
hd41 frame-shift
signal peptide cadherins
tm718 frame-shift
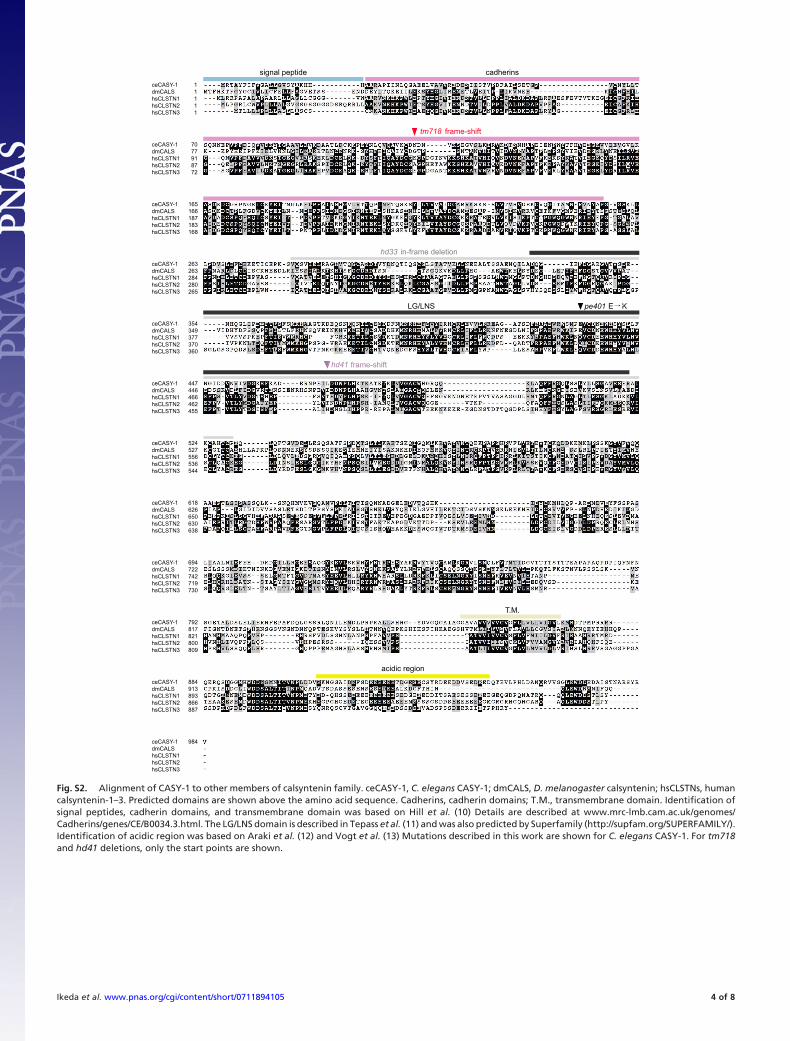
Fig. S2. Alignment of CASY-1 to other members of calsyntenin family. ceCASY-1, C. elegans CASY-1; dmCALS, D. melanogaster calsyntenin; hsCLSTNs, humancalsyntenin-1–3. Predicted domains are shown above the amino acid sequence. Cadherins, cadherin domains; T.M., transmembrane domain. Identification ofsignal peptides, cadherin domains, and transmembrane domain was based on Hill et al. (10) Details are described at www.mrc-lmb.cam.ac.uk/genomes/Cadherins/genes/CE/B0034.3.html. The LG/LNS domain is described in Tepass et al. (11) and was also predicted by Superfamily (http://supfam.org/SUPERFAMILY/).Identification of acidic region was based on Araki et al. (12) and Vogt et al. (13) Mutations described in this work are shown for C. elegans CASY-1. For tm718and hd41 deletions, only the start points are shown.
Ikeda et al. www.pnas.org/cgi/content/short/0711894105 4 of 8

WT
casy-1(pe401)
Benzaldehyde (nl/µl)
Chemotaxisindex
-0.2
0.0
0.2
0.4
0.6
0.8
1.0
0.01 0.1 1 10 100
WT
casy-1(pe401)Chemotaxisindex
Diacetyl (nl/µl)
0.0
0.2
0.4
0.6
0.8
1.0
0.01 0.1 1 10 100
A B
-0.8
-0.6
-0.4
-0.2
0.0
C
AvoidanceIndex
WTcasy-1(tm718)
Fig. S3. casy-1 mutants show almost normal sensitivity to a set of chemicals. Naı̈ve animals were tested for odorants (A, benzaldehyde; B, diacetyl), or 100 �MCu2� (C). There is no significant effect of strains (two-way ANOVA in A and B, P � 0.022 and P � 0.041, respectively, and unpaired t test in C, P � 0.43).
Ikeda et al. www.pnas.org/cgi/content/short/0711894105 5 of 8

A B C
Fig. S4. Intracellular localization of CASY-1. Intracellular localization of NtGFP::CASY-1 in head sensory neurons was observed. DIC image (A), GFP image (B),and a merged image of GFP and DIC (C).
Ikeda et al. www.pnas.org/cgi/content/short/0711894105 6 of 8

WT casy-1(tm718)
daf-18(rf)
daf-18(null)
casy-1;daf-18(rf)
casy-1;daf-18(null)
A B
WT casy-1(tm718)
ins-1(null)
casy-1;ins-1(null)
mock-conditioned
NaCl-conditioned0.0
0.2
0.4
0.6
0.8
Chemotaxisindex
-0.2
** **
*
*
-1.0
-0.8
-0.6
-0.4
-0.2
0.0
0.2
0.4
0.6
0.8
1.0
ChemotaxisIndex
**
Fig. S5. casy-1 may act in parallel to the insulin/PI3K pathway for salt chemotaxis learning. (A) Chemotaxis to NaCl was tested on naı̈ve animals of wild type,casy-1, daf-18, and casy-1; daf-18 double mutants. daf-18(rf ) denotes daf-18(e1375) and daf-18(null) denotes daf-18(mg198). (B) Salt chemotaxis learning assaywas performed on casy-1, ins-1 and casy-1;ins-1 animals. Asterisks represent significant differences between double mutants and single mutants (unpaired t test;
**, P � 0.001; *, P � 0.01).
Ikeda et al. www.pnas.org/cgi/content/short/0711894105 7 of 8

casy-1(tm718)WTChemotaxisindex
transgene
host strain
- RYV RYV(∆Ct)
RYV(∆Nt) CtV
RYV800
RYV700
RYV600
RYV530
-1.0----
0.80.60.40.20.00.20.40.60.81.0
** * * *
B
A
-
Chemotaxisindex
transgene
host strain casy-1(tm718)
RYV(∆Cads)
RYV(∆LNS)
RYV331-700
RYV700(∆SP)
WT
------
1.00.80.60.40.20.00.20.40.60.81.0
-
*
Fig. S6. Functional domain mapping of casy-1. Results of salt chemotaxis learning assays of casy-1 mutants transformed with the deletion constructs. Asterisksrepresent significant differences from control animals carrying only the transformation marker (Dunnett’s test; **, P � 0.001; *, P � 0.01).
Ikeda et al. www.pnas.org/cgi/content/short/0711894105 8 of 8


![Elegant The Effects of Thermal Smulaon on the Mind Club ...t1].pdf · Figure 2. Track of one worm with .5 degrees/cm temperature gradient (Karen Jiang 2014). Figure 3. Track of several](https://img.pdfslide.net/doc/110x75/5fe6b5ab3f603804325df6f3/elegant-the-eiects-of-thermal-smulaon-on-the-mind-club-t1pdf-figure-2.jpg)