Embed Size (px)
Citation preview

Supporting Basis
for
Determination of Best System of Emissions Reduction for Carbon Dioxide (CO2) Emissions from
Existing Electric Utility Generating Units
October 2015
(Updated 10-30-2015)
Prepared by:
North Carolina Department of Environmental Quality
Division of Air Quality
Attachment B B-1

(This page intentionally left blank)
Attachment B B-2Attachment B B-2

Table of Contents
Introduction i
Best System of Emission Reduction for Affected Units
Coal-fired EGUs
Duke Energy - Belews Creek Belewsille-1 Belews-1
Duke Energy – Cliffside Cliffside-1
Duke Energy - G G Allen GG Allen-1
Duke Energy – Marshall Marshall-1
Duke Energy – Mayo Mayo-1
Duke Energy – Roxboro Roxboro-1
Roanoke Valley Energy Facility I and II Roanoke-1
Edgecombe Genco - Battleboro Edgecombe-1
Duke Energy – GG Allen 1, 2&3 and Asheville Units 1&2 Allen & Asheville -1
Natural Gas Combined Cycle Units
Dominion Resources-Rosemary Rosemary-1
Duke Energy – Buck Buck-1
Duke Energy – Dan River DanRiver-1
Duke Energy – H F Lee Lee-1
Duke Energy – L V Sutton Sutton-1
Duke Energy – Sherwood H Smith Jr Smith-1
Public Works Commission - Butler-Warner Warner-1
Southern Company- Rowan Rowan-1
Justification for Exclusion of Units
Elizabethtown Energy and Lumberton Energy Elizabethtown Lumberton-1
Attachment B B-3Attachment B B-3

(This page intentionally left blank)
Attachment B B-4Attachment B B-4

Introduction
The Environmental Protection Agency (EPA) signed a new rule on August 3, 2015 for Carbon Dioxide Emission Guidelines for Existing EGUs. NCDEQ is proposing to adopt rules in 15A NCAC 02D .2700, Standards of Performance for Existing Electric Utility Generating Units under Clean Air Act (CAA) Section 111(d), to satisfy a similar federal requirement. Section 111(d) requires EPA to identify the Best System of Emissions Reduction (BSER) that is adequately demonstrated and available to limit pollution and to set guidelines for states to reflect BSER. Based on its evaluation of BSER for existing EGUs, the EPA regulation provides state specific goals for reducing carbon dioxide emissions for the power sector. States are then required to develop a plan including necessary rules to meet those goals.
This document contains a compilation of the supporting basis for North Carolina's Clean Air Act Section 111(d) determination of the Best System of Emission Reductions for carbon dioxide emissions for existing electric utility generating units.
i
Attachment B B-5Attachment B B-5

(This page intentionally left blank)
ii
Attachment B B-6Attachment B B-6

1
North Carolina Department of Environmental Quality Division of Air Quality
Supporting Basis
Determination of Best System of Emissions Reduction for CO2 Emissions from Existing Electric Utility Generating Units
October 30, 2015
Facility Duke Energy Carolinas LLC, Belews Creek Steam Station, Walnut Cove, NC Facility ID: 8500004 Current Air Quality Permit No. 01983T29 Affected Electric Utility Generating Units (EGUs) One No. 2 fuel oil/coal-fired electric utility boiler (12,253 million Btu per hour heat input capacity) equipped with alkaline-based fuel additive (ID No. ES-1 (U1 Boiler)). Generator rated at 1080.1 MW (nameplate capacity). One No. 2 fuel oil/coal-fired electric utility boiler (12,632 million Btu per hour heat input capacity) equipped with alkaline-based fuel additive (ID No. ES-2 (U2 Boiler)). Generator rated at 1080.1 MW (nameplate capacity).
1. Introduction The United States Environmental Protection Agency (EPA) has adopted Emission Guidelines for Greenhouse Gas Emissions and Compliance Times for Electric Utility Generating Units on August 3, 2015 and codified it in 40 CFR Subpart UUUU. The affected electric utility steam generating units (EGUs) under these emission guidelines (EG) are steam generating units, integrated gasification combined cycle units (IGCC), and stationary combined cycle or combined heat and power (CHP) combustion turbines that commenced construction on or before January 8, 2014. The EG includes uniform, nationwide emission standards, which are performance-based rates for emissions of greenhouse gases (GHG) expressed as CO2 (lb CO2/net MWh), as follows: Fossil fuel-fired steam generating units or IGCC: 1,534 lb CO2/net MWh (interim, average of 2022-
2029), 1,305 lb CO2/net MWh (final, starting 2030)
Natural gas-fired stationary combined cycle combustion turbines (including CHP combustion turbines): 832 lb/net MWh (interim, average of 2022-2029), 771 lb/MWh (final, starting 2030)
In lieu of the above uniform rates, each EGU can comply with state-specific goal (lb CO2/net MWh). The other option is that all affected units in the state, in aggregate, comply with the mass-based state goal (short tons/yr).
Belews-Page 1 of 19
Attachment B B-7Attachment B B-7

2
For North Carolina (NC), the rate-based interim and final goals are 1,311 lb CO2/net MWh and 1,136 lb CO2/net MWh, respectively. Similarly, NC’s mass-based interim and final goals are 56,986,025 short tons/yr and 51,266,234 short tons/yr, respectively. The above standards (whether uniform nationwide rates or state-specific goals) are based upon the determination of Best System of Emissions Reduction (BSER) consisting of following three building blocks: Building Block 1 (BB1) - reducing the carbon intensity of electricity generation by improving the
heat rate of existing coal-fired power plants.
Building Block 2 (BB2) - substituting increased electricity generation from lower-emitting existing natural gas plants for reduced generation from higher-emitting coal-fired power plants.
Building Block 3 (BB3) - substituting increased electricity generation from new zero-emitting renewable energy sources (like wind and solar) for reduced generation from existing coal-fired and natural gas-fired power plants.
The EG requires that each state submit its plan complying with all applicable requirements by the deadline included therein. One of the requirements consists of development of an emission standard (“standard of performance”) and establishment of compliance time for each EGU. The Clean Air Act (CAA) §111(a)(1) defines “standard of performance” as “a standard for emissions of air pollutants which reflects the degree of emission limitation achievable through the application of the best system of emission reduction which (taking into account the cost of achieving such reduction and any nonair quality health and environmental impact and energy requirements) the Administrator determines has been adequately demonstrated”.
2. History of Development of Emission Guidelines under CAA Over the last 40 years, under §111(d), the EPA has regulated four pollutants from five source categories, by promulgating associated EG. These source categories are phosphate fertilizer plants (fluorides), sulfuric acid plants (acid mist), Kraft pulp plants (total reduced sulfur (TRS)), primary aluminum plants (fluorides), and municipal solid waste landfills (landfill gas emissions as non-methane organic compounds (NMOCs))1. The following general principles and/or rationales were used by EPA in establishing BSER for these EGs: The degree of emission reduction achievable through the application of various demonstrated control
technologies.
The technical feasibility of applying various demonstrated technologies to existing sources considering variability in sizes and designs.
1 See Footnote 18 at 79 FR 41776, July 17, 2014, including ‘‘Phosphate Fertilizer Plants; Final Guideline Document Availability,’’ 42 FR 12022 (March 1, 1977); ‘‘Standards of Performance for New Stationary Sources; Emission Guideline for Sulfuric Acid Mist,’’ 42 FR 55796 (October 18, 1977); ‘‘Kraft Pulp Mills, Notice of Availability of Final Guideline Document,’’ 44 FR 29828 (May 22, 1979); ‘‘Primary Aluminum Plants; Availability of Final Guideline Document,’’ 45 FR 26294 (April 17, 1980); ‘‘Standards of Performance for New Stationary Sources and Guidelines for Control of Existing Sources: Municipal Solid Waste Landfills, Final Rule,’’ 61 FR 9905 (March 12, 1996).
Belews-Page 2 of 19
Attachment B B-8Attachment B B-8

3
The impact of various demonstrated technologies on national energy consumption, water pollution, waste disposal, and ambient air concentrations of a designated pollutant.
The cost of adopting the emission guidelines, after considering control costs for various demonstrated technologies and taking into account the level of any existing controls.
Each of these EGs indicates that the cost of applying various control technologies can have a considerable impact in selection of a BSER for any designated pollutant for existing facilities. They also indicate that the age, size, type, class, and process design of the facility, influence not only the BSER selection process, but can also support a decision-making for whether different EGs are to be established for differing sizes, types, or classes of equipment. The EGs for the above referenced source categories have been established for principal points of emissions (point and fugitive emissions sources) located within the facility and, not for any emissions sources located outside of the facility. Finally, in these EGs, with respect to determining the EG, EPA has consistently recognized that not only the control technology needs to be demonstrated on existing sources, but the degree of emission reduction (performance level) needs to be readily achievable by the control technology.
3. The Division of Air Quality (DAQ)’s Approach for Determination of BSER The DAQ will consider the above general principles in determining BSER for CO2 emissions reduction from each EGU. But, importantly, DAQ will determine BSER for each EGU based upon BB1-type measures only (i.e., measures which can be accomplished within the fence-line of the facility), conforming to the §111(d) of the CAA and the requirements of 40 CFR 60 “Adoption and Submittal of State Plans for Designated Facilities”. Thus, DAQ’s approach will comprise of improving the operational efficiency of the EGUs in order to reduce CO2 emissions from the 2012 baseline levels. The DAQ’s BSER evaluation will specifically be based upon the following: type of EGU remaining useful life of the EGU unit’s baseline data (net heat rate, net generation, annual capacity factor, and CO2 emissions) unit’s projected future capacity factor feasibility of applying specific heat rate improvement (HRI) measure on a given unit whether the measure is adequately demonstrated degree of heat rate reduction potential for feasible HRI measures site-specific limitations associated costs (capital, fixed and variable operational and maintenance (O&M), and fuel
savings) cost per ton of CO2 reduction
The evaluation is also based on literature review2 of technical feasibility for various HRI measures, degree of heat rate reduction potential, and costs data (capital, and fixed and variable O&M).
2 “Coal-fired Power Plant Heat Rate Reductions”, Final Report, Sargent & Lundy, Chicago, IL, January 22, 2009. “Analysis of Heat Rate Improvement Potential at Coal-Fired Power Plants”, US Energy Information Administration, Washington, DC, May 2015. S. Corellis, “Range and Applicability of Heat Rate Improvements”, Technical Update, Electric Power Research Institute, Palo Alto, CA, April 2014.
Belews-Page 3 of 19
Attachment B B-9Attachment B B-9

4
It needs to be emphasized here that DAQ’s determination for each EGU will not be based upon some pre-determined HRI target, such as EPA’s selection of a 4.3% HRI potential for EGUs in the Eastern interconnection3, as discussed in the EG. The DAQ’s approach will include those adequately demonstrated, cost-effective measures that assure that the electricity is generated with lower CO2 emissions, thus improving public health and welfare. The selected HRI measures would be expected to produce non-air environmental co-benefits in the form of reduced water usage and solid waste production, in addition to, reductions in emissions of non-GHG pollutants such as SO2, NOx, and mercury. However, it should be noted that as the EGU becomes more cost-competitive due to HRIs, it may be dispatched more frequently and/or at higher loads. If the EGU is utilized more often, some increases in emissions of GHG (as CO2) and similarly, for non-GHG pollutants (such as SO2, NOx, or mercury) are possible, and those could partially offset the emissions reductions achieved through the HRI of the EGU. EPA has determined a cost estimate of $23 per ton4 reasonable for CO2 emissions reduction from EGUs under BB1 implementing HRI measures. EPA has further determined that this cost is reasonable because it achieves “an appropriate balance between cost and amount of reductions.”5 In addition, EPA has used another benchmark in the form of social cost of carbon (SC-CO2) at $40 per ton (2020) to $48 per ton (2030)6 to conclude that the above $23 per ton cost is reasonable. In determining a BSER for a particular EGU, DAQ will use the above cost effectiveness threshold of $23 per ton to determine reasonableness of cost and whether one or more technically feasible measure(s) can be implemented, as long as, collectively, the total cost does not exceed this threshold.
4. BSER Evaluation Duke Energy Carolinas, LLC, Belews Creek Steam Station (DEC) has provided information through submittals of July 31 and September 11, 2015, to aid in DAQ’s efforts in determining BSER for CO2 emissions from Units 1 and 2. Additional information was provided through face-to-face meetings and email communication. The submitted information consists of baseline data (net heat rate, net generation, generation-based annual capacity factor, and CO2 emissions) for 2012, projected heat input for future years such as 2019; and cost data (capital cost and annual O&M)7, project life, degradation factor and HRI potential for each of the following measures, for possible implementation on all EGUs of NC-based coal fleet:
3 Applies to coal-fired EGUs only. 4 See page 446 of 1560 (pre-publication version), Carbon Pollution Emission Guidelines for Existing Stationary Sources: Electric Utility Generating Units Clean Power Plan, August 3, 2015. Based on nation-wide coal fleet capacity of 213 GW, heat rate improvement capital cost of $100/KW, capital charge rate of 14.3%, fleet-wide baseline net heat rate of 10,250 Btu/KWh, heat rate improvement of 4% for coal-fired EGUs, annual capacity factor of 78%, and future (2030) average coal delivered cost of $2.70 per million Btu. See page 2-65, Greenhouse Gas Mitigation Measures, Technical Support Document (TSD) for Carbon Pollution Guidelines for Existing Power Plants”, August 3, 2015. 5 See page 457 of 1560 (pre-publication version), Ibid. 6 See pages 458 and 459 of 1560 (pre-publication version), Ibid. 7 High level estimate in the range of -20% to +75% in 2015 $s.
Belews-Page 4 of 19
Attachment B B-10Attachment B B-10

5
Controllable Loss Reduction (Maintain Unit Efficiency) [CLR] Sliding Pressure Operation [SPO] Lower FGD Efficiency (as SO2 permit limits allow) [LFGD] Intelligent Sootblowers [ISB] Air Heater Leakage Reduction [ALR] Combustion Optimization - CCM / Excess Air / Neural Network [CO] Online Condenser Cleaning [OCC] Induced and/or Booster Draft Fan Variable Frequency Drive [IBD] Air Heater Exit Gas Temperature Reduction [AHE] Flue Gas Desulfurization (FGD) Auxiliary Load Reduction through Variable Frequency Drives
[FGDA] Boiler Feed Pump Motor Driven Variable Frequency Drive [BFP] Induced Draft Fan Replacement [IDFR] Forced Draft Fan Variable Frequency Drive [FDF] Condenser Rebundle, Retubes, and Rebuilds [CRR] Electrostatic Precipitator (ESP) (Power management, T/R set upgrades) [ESP] Turbine Upgrades (HI, IP, LP) [TUR] Helper Cooling Tower [HCT]
DEC has claimed the submitted information on cost, project life, and degradation factors, as “confidential”. The DAQ will treat this specific information (cost data and information on project life and the associated degradation factors) “confidential” until the Director decides that it is not confidential in accordance with NCAC 2Q .0107 “Confidential Information”. Thus, DAQ will not include such information in this document. In general, through these submittals, DEC characterizes the HRI decreasing over time because the equipment associated with each measure degrades over time due to normal wear and tear, requiring recurrent implementation of HRI projects or measures. DEC further mentions that some of the efficiency projects cannot be performed or the full HRI benefits may not be realized due to unique configuration or physical limitation of a given EGU. In addition, DEC states that operation of any EGU at less than the full load or if cycled between full and partial load will adversely impact EGU’s heat rate. DEC also discusses reduced utilization of its coal-fired fleet in the recent history in response to lower natural gas prices, resulting in some of its coal-fired units, once operated as base-load units, now operating as intermediate duty cycling units. Finally, DEC adds that any post combustion environmental controls (activated carbon for mercury control, dry bottom and fly ash conversion for coal ash disposal, selective catalytic reduction for NOx control, and Zero Liquid Discharge (ZLD) for wastewater treatment) also adversely impact the heat rate of the EGU, in addition to any other environmental control which might be installed in future (any project implemented since its BSER submittal deadline date of July 31, 2015). With respect to the BSER evaluation, the DAQ has utilized the following data upon verifying or through calculations, for estimating heat rate reduction (Btu/kWh), CO2 emission reduction (short tons/yr), and cost per unit reduction of CO2 ($ per ton) for each measure:
Belews-Page 5 of 19
Attachment B B-11Attachment B B-11

6
Table 1
Unit No. 1 2
Baseline (2012) Net Generation (MWh)
7,685,065 6,305,060
Baseline (2012) Net Heat Rate (Btu/kWh)
9,102 9,279
Baseline (2012) CO2 Emissions (Tons/yr)
7,170,093 6,105,967
Baseline (2012) Annual Heat Input (million Btu)
69,949,462 58,504,652
Baseline (2012) Annual Capacity Factor (heat input basis)
0.652 0.529
Future (2019) Projected Annual Capacity Factor (heat input basis)
0.660 0.430
Future (2019) Projected Coal Delivered Cost ($ per million Btu)
3.92 3.92
Commencement of Operation Year
1974 1975
Planned Retirement Year 2045 2045 It needs to be clarified here that, for all NC-based EGUs, owned by Duke Energy (both under DEC and Duke Energy Progress (DEP)), DAQ used the actual coal delivered prices for 2014 and scaled them for 20198 to estimate the above coal delivered price of $3.92 per million Btu. DAQ will adjust the capital
8 Duke Energy Carolinas The actual, average cost of fuel burned for 12 months ending December 2014 (Jan 2014-Dec 2014) was $3.84 per million Btu (See NCUC Docket No. E-7, Sub 1047, Duke Energy Carolinas, LLC Monthly Fuel Report, February 11, 2015). Duke Energy Progress The actual, average cost of coal burned for 12 months ending January 2015 (Feb 2014-Jan 2015) was $3.57 per million Btu (See NCUC Docket No. E-2, Sub 1064, Duke Energy Progress, INC. Monthly Fuel Report, March 12, 2015). Using the EIA (Annual Energy Outlook 2015) [www.eia.gov/beta/aeo/], Nationwide coal delivered prices were / projected to be: 2013 $2.50 per million Btu 2015 $2.41 per million Btu 2020 $2.54 per million Btu By interpolation, nationwide coal delivered prices for 2014 and 2019 would be approximately $2.46 per million Btu and $2.51 per million, respectively; thus an increase of 2 percent of coal price was projected from 2014 to 2019.
Belews-Page 6 of 19
Attachment B B-12Attachment B B-12
7
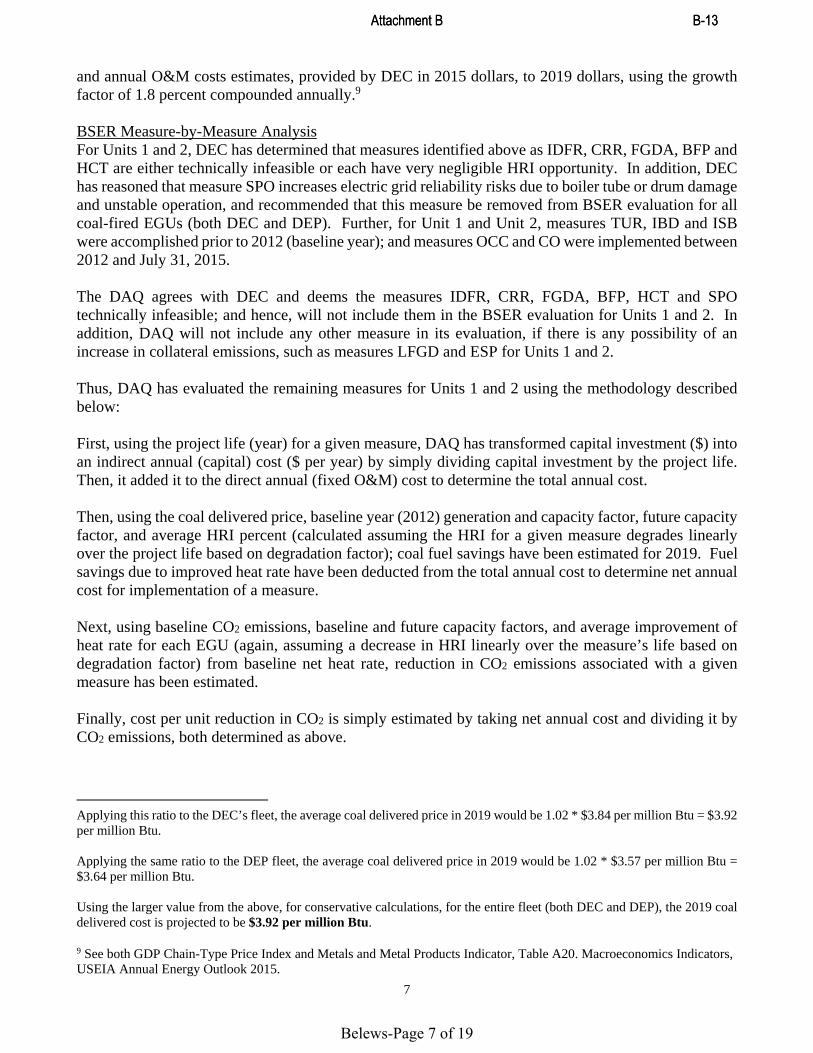
and annual O&M costs estimates, provided by DEC in 2015 dollars, to 2019 dollars, using the growth factor of 1.8 percent compounded annually.9 BSER Measure-by-Measure Analysis For Units 1 and 2, DEC has determined that measures identified above as IDFR, CRR, FGDA, BFP and HCT are either technically infeasible or each have very negligible HRI opportunity. In addition, DEC has reasoned that measure SPO increases electric grid reliability risks due to boiler tube or drum damage and unstable operation, and recommended that this measure be removed from BSER evaluation for all coal-fired EGUs (both DEC and DEP). Further, for Unit 1 and Unit 2, measures TUR, IBD and ISB were accomplished prior to 2012 (baseline year); and measures OCC and CO were implemented between 2012 and July 31, 2015. The DAQ agrees with DEC and deems the measures IDFR, CRR, FGDA, BFP, HCT and SPO technically infeasible; and hence, will not include them in the BSER evaluation for Units 1 and 2. In addition, DAQ will not include any other measure in its evaluation, if there is any possibility of an increase in collateral emissions, such as measures LFGD and ESP for Units 1 and 2. Thus, DAQ has evaluated the remaining measures for Units 1 and 2 using the methodology described below: First, using the project life (year) for a given measure, DAQ has transformed capital investment ($) into an indirect annual (capital) cost ($ per year) by simply dividing capital investment by the project life. Then, it added it to the direct annual (fixed O&M) cost to determine the total annual cost. Then, using the coal delivered price, baseline year (2012) generation and capacity factor, future capacity factor, and average HRI percent (calculated assuming the HRI for a given measure degrades linearly over the project life based on degradation factor); coal fuel savings have been estimated for 2019. Fuel savings due to improved heat rate have been deducted from the total annual cost to determine net annual cost for implementation of a measure. Next, using baseline CO2 emissions, baseline and future capacity factors, and average improvement of heat rate for each EGU (again, assuming a decrease in HRI linearly over the measure’s life based on degradation factor) from baseline net heat rate, reduction in CO2 emissions associated with a given measure has been estimated. Finally, cost per unit reduction in CO2 is simply estimated by taking net annual cost and dividing it by CO2 emissions, both determined as above.
Applying this ratio to the DEC’s fleet, the average coal delivered price in 2019 would be 1.02 * $3.84 per million Btu = $3.92 per million Btu. Applying the same ratio to the DEP fleet, the average coal delivered price in 2019 would be 1.02 * $3.57 per million Btu = $3.64 per million Btu. Using the larger value from the above, for conservative calculations, for the entire fleet (both DEC and DEP), the 2019 coal delivered cost is projected to be $3.92 per million Btu. 9 See both GDP Chain-Type Price Index and Metals and Metal Products Indicator, Table A20. Macroeconomics Indicators, USEIA Annual Energy Outlook 2015.
Belews-Page 7 of 19
Attachment B B-13Attachment B B-13
8
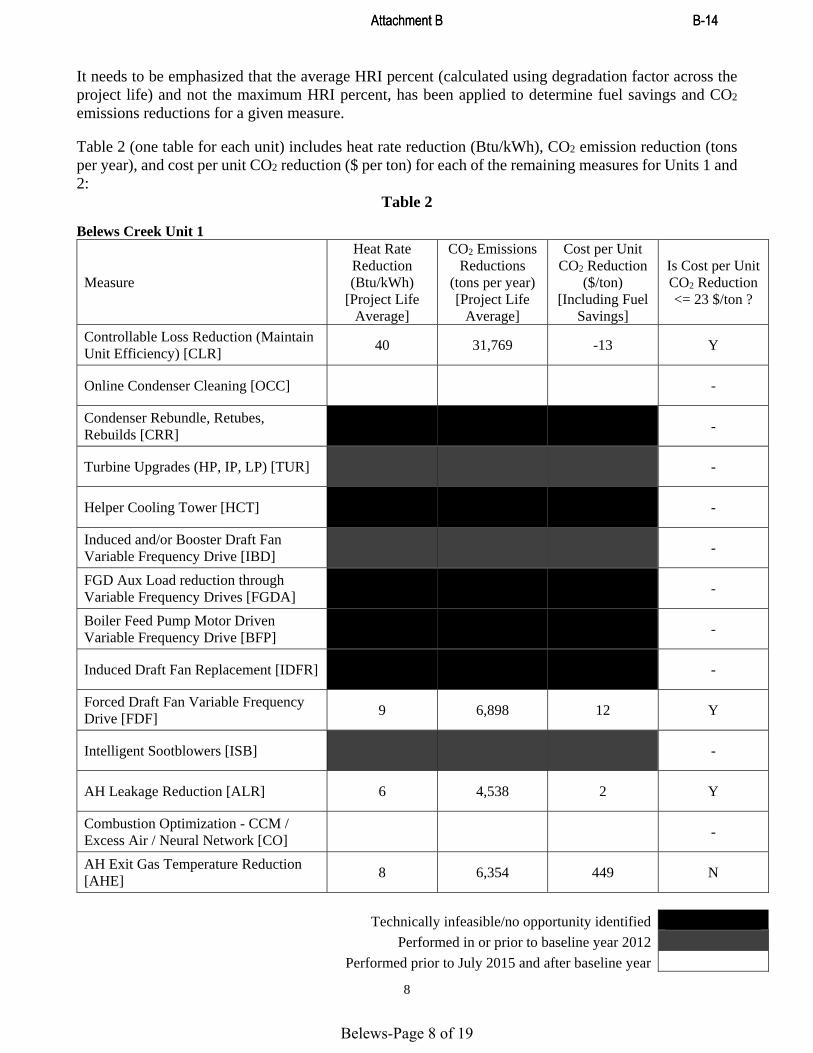
It needs to be emphasized that the average HRI percent (calculated using degradation factor across the project life) and not the maximum HRI percent, has been applied to determine fuel savings and CO2 emissions reductions for a given measure. Table 2 (one table for each unit) includes heat rate reduction (Btu/kWh), CO2 emission reduction (tons per year), and cost per unit CO2 reduction ($ per ton) for each of the remaining measures for Units 1 and 2:
Table 2
Belews Creek Unit 1
Measure
Heat Rate Reduction (Btu/kWh)
[Project Life Average]
CO2 Emissions Reductions
(tons per year) [Project Life
Average]
Cost per Unit CO2 Reduction
($/ton) [Including Fuel
Savings]
Is Cost per Unit CO2 Reduction <= 23 $/ton ?
Controllable Loss Reduction (Maintain Unit Efficiency) [CLR]
40 31,769 -13 Y
Online Condenser Cleaning [OCC] -
Condenser Rebundle, Retubes, Rebuilds [CRR]
0 0 0 -
Turbine Upgrades (HP, IP, LP) [TUR] -
Helper Cooling Tower [HCT] 0 0 0 -
Induced and/or Booster Draft Fan Variable Frequency Drive [IBD]
-
FGD Aux Load reduction through Variable Frequency Drives [FGDA]
0 0 0 -
Boiler Feed Pump Motor Driven Variable Frequency Drive [BFP]
0 0 0 -
Induced Draft Fan Replacement [IDFR] 0 0 0 -
Forced Draft Fan Variable Frequency Drive [FDF]
9 6,898 12 Y
Intelligent Sootblowers [ISB] -
AH Leakage Reduction [ALR] 6 4,538 2 Y
Combustion Optimization - CCM / Excess Air / Neural Network [CO]
-
AH Exit Gas Temperature Reduction [AHE]
8 6,354 449 N
Technically infeasible/no opportunity identified
Performed in or prior to baseline year 2012
Performed prior to July 2015 and after baseline year
Belews-Page 8 of 19
Attachment B B-14Attachment B B-14

9
Belews Creek Unit 2
Measure
Heat Rate Reduction (Btu/kWh)
[Project Life Average]
CO2 Emissions Reductions
(tons per year) [Project Life
Average]
Cost per Unit CO2 Reduction
($/ton) [Including Fuel
Savings]
Is Cost per Unit CO2 Reduction <= 23 $/ton ?
Controllable Loss Reduction (Maintain Unit Efficiency) [CLR]
41 21,727 0 Y
Online Condenser Cleaning [OCC] -
Condenser Rebundle, Retubes, Rebuilds [CRR]
0 0 0 -
Turbine Upgrades (HP, IP, LP) [TUR] -
Helper Cooling Tower [HCT] 0 0 0 -
Induced and/or Booster Draft Fan Variable Frequency Drive [IBD]
-
FGD Aux Load reduction through Variable Frequency Drives [FGDA]
0 0 0 -
Boiler Feed Pump Motor Driven Variable Frequency Drive [BFP]
0 0 0 -
Induced Draft Fan Replacement [IDFR] 0 0 0 -
Forced Draft Fan Variable Frequency Drive [FDF]
21 11,500 -7 Y
Intelligent Sootblowers [ISB] -
AH Leakage Reduction [ALR] 6 3,104 31 N
Combustion Optimization - CCM / Excess Air / Neural Network [CO]
-
AH Exit Gas Temperature Reduction [AHE]
8 4,345 689 N
Technically infeasible/no opportunity identified
Performed in or prior to baseline year 2012
Performed prior to July 2015 and after baseline year
Refer to the attached spreadsheet on calculations for annualized cost and cost per unit reduction of CO2 for each of the HRI measures included in the Table 2 above. The retirement age for each EGU has been estimated by DEC and made available to DAQ. There is no need to adjust the above estimated costs for the remaining useful life (RUL) of the EGUs. Each BSER measure considered has a project life that is less than the RUL of the EGU.
Belews-Page 9 of 19
Attachment B B-15Attachment B B-15

10
Belews Creek Unit 1 Results Discussion Comparing the cost estimates in Table 2, Unit 1 above, with the reasonable cost threshold of less than or equal to $23 per ton, as discussed in Section 3, the cost for measures CLR, FDF and ALR is each less than or equal to $23 per ton at a collective cost of $1 per ton. The cost for the only remaining measure considered, AHE, at $449 per ton, if added to measures CLR, FDF and ALR, would make the collective cost of the four measures to be considered “excessive”, “exorbitant” or “unreasonable”, as stated by EPA in the preamble to the final EG10. Therefore, there are no additional remaining measures available to bring the collective cost to less than or equal to $23 per ton for Unit 1. The DAQ will select the best mixture of measures in order to maximize CO2 emissions reductions while keeping the collective cost of the selected measures less than or equal to $23 per ton. For the three available measures: CLR, FDF and ALR, consider the following combinations, one at a time: First, consider using all three available measures: CLR, FDF and ALR. Based on confidential information DEC has supplied as justification, if a large number of other measures are available for a given unit, then the projected HRI benefit from CLR should be further reduced. Therefore, DAQ has reduced the HRI benefit for CLR anytime there are two or more other measures to be implemented, in this case to from 40 Btu/kWh to 20 Btu/kWh. This results in the cost for CLR being increased from -$13 per ton to $14 per ton, and the collective cost for measures CLR, FDF and ALR now increases from $1 per ton to $28 per ton. Therefore, this combination of measures cannot be selected since the collective cost is greater than the $23 per ton threshold. Next, consider using measures CLR and FDF. In this case, the HRI benefit for CLR does not need to be reduced since only two measures are considered. The collective cost of CLR and FDF is $0 per ton with a CO2 emissions reduction of 38,667 tons per year. Next, consider using measures CLR and ALR. In this case, the HRI benefit for CLR does not need to be reduced since only two measures are considered. The collective cost of CLR and ALR is -$11 per ton with a CO2 emissions reduction of 36,307 tons per year. Next, consider using measures FDF and ALR. The collective cost of FDF and ALR is $14 per ton with a CO2 emissions reduction of 11,436 tons per year. Each of the above three available combinations of measures results in a collective cost of less than or equal to $23 per ton which DAQ has determined is reasonable. Therefore, the decision on which of these options to select is based on maximizing the CO2 emissions reductions. Measures CLR and FDF result in the greatest CO2 emissions reductions. The associated heat rate reduction and CO2 emissions reduction are 48 Btu/kWh and 38,667 tons per year, respectively. These measures are expected to produce non-air environmental co-benefits in the form of reduced water usage and solid waste production, in addition to reduced emissions of non-GHG pollutants such as SO2, NOx, and mercury. Also, no adverse energy impact is expected from employing the measures at Unit 1. Thus, considering cost, non-air environmental, and energy impacts, DAQ determines that measures CLR and FDF are the BSER for Unit 1.
10 Page 298 of 1560 (pre-publication version), Ibid.
Belews-Page 10 of 19
Attachment B B-16Attachment B B-16

11
Belews Creek Unit 2 Results Discussion Comparing the cost estimates in Table 2, Unit 2 above, with the reasonable cost threshold of less than or equal to $23 per ton, as discussed in Section 3, the cost for measures CLR and FDF is each less than or equal to $23 per ton at a collective cost of -$7 per ton. One remaining measure, ALR, at a cost of $31 per ton, if added with CLR and FDF would result in a collective cost for the three measures is $24 per ton. Therefore, this combination of measures cannot be selected since the collective cost is greater than $23 per ton. The cost for the only remaining measure considered, AHE, at $689 per ton, if added to measures CLR and FDF, would make the collective cost of the three measures to be considered “excessive”, “exorbitant” or “unreasonable”, as stated by EPA in the preamble to the final EG10. For the three available measures: CLR, FDF and ALR, consider the following combinations, one at a time: First, consider using measures CLR and FDF. The collective cost of CLR and FDF is -$7 per ton with a CO2 emissions reduction of 33,227 tons per year. Next, consider using measures CLR and ALR. The collective cost of CLR and ALR is $31. Therefore, this combination of measures cannot be selected since the collective cost is greater than $23 per ton. Next, consider using measures FDF and ALR. The collective cost of FDF and ALR is $24 per ton. Therefore, this combination of measures cannot be selected since the collective cost is greater than $23 per ton. Only one of the above three available combinations of measures, CLR and FDF, results in a collective cost of less than or equal to $23 per ton, which DAQ has determined is reasonable. Therefore, these measures CLR and FDF are selected as BSER. The associated heat rate reduction and CO2 emissions reduction are 62 Btu/kWh and 33,227 tons per year, respectively. These measures are expected to produce non-air environmental co-benefits in the form of reduced water usage and solid waste production, in addition to reduced emissions of non-GHG pollutants such as SO2, NOx, and mercury. Also, no adverse energy impact is expected from employing the measures at Unit 2. Thus, considering cost, non-air environmental, and energy impacts, DAQ determines that measures CLR and FDF are the BSER for Unit 2.
5. BSER for Belews Creek Units 1 and 2 For Unit 1, DEC shall implement HRI measures CLR and FDF, starting September 1, 2019. For Unit 2, DEC shall implement HRI measures CLR and FDF, starting September 1, 2019.
Belews-Page 11 of 19
Attachment B B-17Attachment B B-17

NOTES REFERENCES
$107,397 A 1
$107,397 DC 2(a)
None
$0 IC 2(a)
$107,397 TCI = DC + IC 2(a)
$805,476 1
-$1,214,137 3
-$408,661 2(b)
8 PL 1$13,425 TCRC = TCI/PL 2(b)
$13,425 IDAC = TCRC 2(b)
-$395,237 TAC = DAC + IDAC 2(b)
6,504,666 4
9,102 4
Baseline (2012) Net Generation, MW-h 7,685,065 4
Baseline (2012) Annual Capacity Factor (heat input basis), % 65.17 4
Future (2019) Annual Capacity Factor (projected heat input basis), % 66.00 4
Future (2019) Net Generation, MW-h 7,782,941 5
46
34
Project Life, Years 8 1
Degradation Factor Across Project Life, % 25 1
0.50 1
0.38 1
CO2 Emissions Reduction (1st year) (corresponding to heat rate improvement), % 0.50
CO2 Emissions Reduction (nth year) (corresponding to heat rate improvement), % 0.38
32,938 6
36,307 6
24,703 6
27,231 6
-11 7
23 8
-15 7
30 8
-13
26
40
31769
1. Duke Energy Submittal, September 11, 2015.
5. Based on baseline net generation and ratio of baseline and future capacity factors.
6. Based on baseline CO2 emissions and capacity factor, future capacity factor, and CO2 emissions reductions percentage.
7. Based on total annual cost including fuel savings and CO2 emissions reductions from baseline.
8. Based on total annual cost excluding fuel savings and CO2 emissions reductions from baseline.
4. DAQ Spreadsheet on Fleetwide Calculations for Baseline and Future Years.
Heat Rate Reduction (Improvement) (average over project life), Btu/kw-hr
CO2 Emissions Reduction from Baseline (average over project life), Short ton/yr
Average Cost per Short Ton of CO2 Removed Across the Project Life (include fuel savings)
Average Cost per Short Ton of CO2 Removed Across the Project Life (exclude fuel savings)
2. EPA Air Pollution Control Cost Manual, Sixth Edition, January 2002; EPA/452/B-02-001
a. Section 1, Chapter 2, Paragraph 2.3.1 Elements of Total Capital Investment.
b. Section 1, Chapter 2, Paragraph 2.3.2: Elements of Total Annual Cost.3. Based on baseline net generation and net heat rate, ratio of baseline and future capacity factors, heat rate improvement, and future year (2019) average coal price included in "Annual Energy Outlook 2015", US EIA.
Cost per Short Ton of CO2 Removed (nth year of project life) (exclude fuel savings)
Heat Rate Reduction (Improvement) (1st year of project life), Btu/kw-hr
Heat Rate Reduction (Improvement) (nth year of project life), Btu/kw-hr
Heat Rate Improvement (1st year) from Baseline Net Heat Rate, %
Heat Rate Improvement (nth year) from Baseline Net Heat Rate, %
CO2 Emissions Reduction (1st year) from Baseline, Metric ton/yr
CO2 Emissions Reduction (1st year) from Baseline, Short ton/yr
CO2 Emissions Reduction (nth year) from Baseline, Metric ton/yr
CO2 Emissions Reduction (nth year) from Baseline, Short ton/yr
Cost per Short Ton of CO2 Removed (1st year of project life) (include fuel savings)
Cost per Short Ton of CO2 Removed (1st year of project life) (exclude fuel savings)
Cost per Short Ton of CO2 Removed (nth year of project life) (include fuel savings)
Baseline (2012) Net Heat Rate, Btu/kw-hr
Annual Cost
Direct Annual Costs
Fixed & Variable Operation & Maintenance Cost
Fuel Savings
Total Direct Annual Costs (DAC)
Indirect Annual Costs
Project Life
Total Capital Recovery Costs (TCRC)
Total Indirect Annual Costs (IDAC)
Total Annual CostBaseline (2012) CO2 Emissions, metric ton/yr
Total Capital Investment (TCI)
Duke Energy Carolinas, LLCBelews Creek U1Annualized Cost and Cost Per Unit CO2 Reduction forControllable Loss Reduction (Maintain Unit Efficiency)
CAPITAL COST
`
Equipment Cost
Total Direct Costs
Indirect Costs
Total Indirect Costs
Belews-Page 12 of 19
Attachment B B-18Attachment B B-18

NOTES REFERENCES
$5,369,837 A 1
$5,369,837 DC 2(a)
None
$0 IC 2(a)
$5,369,837 TCI = DC + IC 2(a)
$80,548 1
-$263,641 3
-$183,094 2(b)
20 PL 1$268,492 TCRC = TCI/PL 2(b)
$268,492 IDAC = TCRC 2(b)
$85,398 TAC = DAC + IDAC 2(b)
6,504,666 4
9,102 4
Baseline (2012) Net Generation, MW-h 7,685,065 4
Baseline (2012) Annual Capacity Factor (heat input basis), % 65.17 4
Future (2019) Annual Capacity Factor (projected heat input basis), % 66.00 4
Future (2019) Net Generation, MW-h 7,782,941 5
9
8
Project Life, Years 20 1
Degradation Factor Across Project Life, % 10 1
0.10 1
0.09 1
CO2 Emissions Reduction (1st year) (corresponding to heat rate improvement), % 0.10
CO2 Emissions Reduction (nth year) (corresponding to heat rate improvement), % 0.09
6,588 6
7,261 6
5,929 6
6,535 6
12 7
48 8
13 7
53 8
12
51
9
6898
1. Duke Energy Submittal, September 11, 2015.
5. Based on baseline net generation and ratio of baseline and future capacity factors.
6. Based on baseline CO2 emissions and capacity factor, future capacity factor, and CO2 emissions reductions percentage.
7. Based on total annual cost including fuel savings and CO2 emissions reductions from baseline.
8. Based on total annual cost excluding fuel savings and CO2 emissions reductions from baseline.
4. DAQ Spreadsheet on Fleetwide Calculations for Baseline and Future Years.
Heat Rate Reduction (Improvement) (average over project life), Btu/kw-hr
CO2 Emissions Reduction from Baseline (average over project life), Short ton/yr
Average Cost per Short Ton of CO2 Removed Across the Project Life (include fuel savings)
Average Cost per Short Ton of CO2 Removed Across the Project Life (exclude fuel savings)
2. EPA Air Pollution Control Cost Manual, Sixth Edition, January 2002; EPA/452/B-02-001
a. Section 1, Chapter 2, Paragraph 2.3.1 Elements of Total Capital Investment.
b. Section 1, Chapter 2, Paragraph 2.3.2: Elements of Total Annual Cost.3. Based on baseline net generation and net heat rate, ratio of baseline and future capacity factors, heat rate improvement, and future year (2019) average coal price included in "Annual Energy Outlook 2015", US EIA.
Cost per Short Ton of CO2 Removed (nth year of project life) (exclude fuel savings)
Heat Rate Reduction (Improvement) (1st year of project life), Btu/kw-hr
Heat Rate Reduction (Improvement) (nth year of project life), Btu/kw-hr
Heat Rate Improvement (1st year) from Baseline Net Heat Rate, %
Heat Rate Improvement (nth year) from Baseline Net Heat Rate, %
CO2 Emissions Reduction (1st year) from Baseline, Metric ton/yr
CO2 Emissions Reduction (1st year) from Baseline, Short ton/yr
CO2 Emissions Reduction (nth year) from Baseline, Metric ton/yr
CO2 Emissions Reduction (nth year) from Baseline, Short ton/yr
Cost per Short Ton of CO2 Removed (1st year of project life) (include fuel savings)
Cost per Short Ton of CO2 Removed (1st year of project life) (exclude fuel savings)
Cost per Short Ton of CO2 Removed (nth year of project life) (include fuel savings)
Baseline (2012) Net Heat Rate, Btu/kw-hr
Annual Cost
Direct Annual Costs
Fixed & Variable Operation & Maintenance Cost
Fuel Savings
Total Direct Annual Costs (DAC)
Indirect Annual Costs
Project Life
Total Capital Recovery Costs (TCRC)
Total Indirect Annual Costs (IDAC)
Total Annual CostBaseline (2012) CO2 Emissions, metric ton/yr
Total Capital Investment (TCI)
Duke Energy Carolinas, LLCBelews Creek U1Annualized Cost and Cost Per Unit CO2 Reduction forForced Draft Fan Variable Frequency Drive
CAPITAL COST
`
Equipment Cost
Total Direct Costs
Indirect Costs
Total Indirect Costs
Belews-Page 13 of 19
Attachment B B-19Attachment B B-19

NOTES REFERENCES
$375,889 A 1
$375,889 DC 2(a)
None
$0 IC 2(a)
$375,889 TCI = DC + IC 2(a)
$53,698 1
-$173,448 3
-$119,750 2(b)
3 PL 1$125,296 TCRC = TCI/PL 2(b)
$125,296 IDAC = TCRC 2(b)
$5,546 TAC = DAC + IDAC 2(b)
6,504,666 4
9,102 4
Baseline (2012) Net Generation, MW-h 7,685,065 4
Baseline (2012) Annual Capacity Factor (heat input basis), % 65.17 4
Future (2019) Annual Capacity Factor (projected heat input basis), % 66.00 4
Future (2019) Net Generation, MW-h 7,782,941 5
9
2
Project Life, Years 3 1
Degradation Factor Across Project Life, % 75 1
0.10 1
0.03 1
CO2 Emissions Reduction (1st year) (corresponding to heat rate improvement), % 0.10
CO2 Emissions Reduction (nth year) (corresponding to heat rate improvement), % 0.03
6,588 6
7,261 6
1,647 6
1,815 6
1 7
25 8
3 7
99 8
2
62
6
4538
1. Duke Energy Submittal, September 11, 2015.
5. Based on baseline net generation and ratio of baseline and future capacity factors.
6. Based on baseline CO2 emissions and capacity factor, future capacity factor, and CO2 emissions reductions percentage.
7. Based on total annual cost including fuel savings and CO2 emissions reductions from baseline.
8. Based on total annual cost excluding fuel savings and CO2 emissions reductions from baseline.
4. DAQ Spreadsheet on Fleetwide Calculations for Baseline and Future Years.
Heat Rate Reduction (Improvement) (average over project life), Btu/kw-hr
CO2 Emissions Reduction from Baseline (average over project life), Short ton/yr
Average Cost per Short Ton of CO2 Removed Across the Project Life (include fuel savings)
Average Cost per Short Ton of CO2 Removed Across the Project Life (exclude fuel savings)
2. EPA Air Pollution Control Cost Manual, Sixth Edition, January 2002; EPA/452/B-02-001
a. Section 1, Chapter 2, Paragraph 2.3.1 Elements of Total Capital Investment.
b. Section 1, Chapter 2, Paragraph 2.3.2: Elements of Total Annual Cost.3. Based on baseline net generation and net heat rate, ratio of baseline and future capacity factors, heat rate improvement, and future year (2019) average coal price included in "Annual Energy Outlook 2015", US EIA.
Cost per Short Ton of CO2 Removed (nth year of project life) (exclude fuel savings)
Heat Rate Reduction (Improvement) (1st year of project life), Btu/kw-hr
Heat Rate Reduction (Improvement) (nth year of project life), Btu/kw-hr
Heat Rate Improvement (1st year) from Baseline Net Heat Rate, %
Heat Rate Improvement (nth year) from Baseline Net Heat Rate, %
CO2 Emissions Reduction (1st year) from Baseline, Metric ton/yr
CO2 Emissions Reduction (1st year) from Baseline, Short ton/yr
CO2 Emissions Reduction (nth year) from Baseline, Metric ton/yr
CO2 Emissions Reduction (nth year) from Baseline, Short ton/yr
Cost per Short Ton of CO2 Removed (1st year of project life) (include fuel savings)
Cost per Short Ton of CO2 Removed (1st year of project life) (exclude fuel savings)
Cost per Short Ton of CO2 Removed (nth year of project life) (include fuel savings)
Baseline (2012) Net Heat Rate, Btu/kw-hr
Annual Cost
Direct Annual Costs
Fixed & Variable Operation & Maintenance Cost
Fuel Savings
Total Direct Annual Costs (DAC)
Indirect Annual Costs
Project Life
Total Capital Recovery Costs (TCRC)
Total Indirect Annual Costs (IDAC)
Total Annual CostBaseline (2012) CO2 Emissions, metric ton/yr
Total Capital Investment (TCI)
Duke Energy Carolinas, LLCBelews Creek U1Annualized Cost and Cost Per Unit CO2 Reduction forAH Leakage Reduction
CAPITAL COST
`
Equipment Cost
Total Direct Costs
Indirect Costs
Total Indirect Costs
Belews-Page 14 of 19
Attachment B B-20Attachment B B-20

NOTES REFERENCES
$3,758,886 A 1
$3,758,886 DC 2(a)
None
$0 IC 2(a)
$3,758,886 TCI = DC + IC 2(a)
$2,500,000 1
-$242,827 3
$2,257,173 2(b)
7 PL 1$536,984 TCRC = TCI/PL 2(b)
$536,984 IDAC = TCRC 2(b)
$2,794,156 TAC = DAC + IDAC 2(b)
6,504,666 4
9,102 4
Baseline (2012) Net Generation, MW-h 7,685,065 4
Baseline (2012) Annual Capacity Factor (heat input basis), % 65.17 4
Future (2019) Annual Capacity Factor (projected heat input basis), % 66.00 4
Future (2019) Net Generation, MW-h 7,782,941 5
9
7
Project Life, Years 7 1
Degradation Factor Across Project Life, % 25 1
0.10 1
0.08 1
CO2 Emissions Reduction (1st year) (corresponding to heat rate improvement), % 0.10
CO2 Emissions Reduction (nth year) (corresponding to heat rate improvement), % 0.08
6,588 6
7,261 6
4,941 6
5,446 6
385 7
418 8
513 7
558 8
449
488
8
6354
1. Duke Energy Submittal, September 11, 2015.
5. Based on baseline net generation and ratio of baseline and future capacity factors.
6. Based on baseline CO2 emissions and capacity factor, future capacity factor, and CO2 emissions reductions percentage.
7. Based on total annual cost including fuel savings and CO2 emissions reductions from baseline.
8. Based on total annual cost excluding fuel savings and CO2 emissions reductions from baseline.
4. DAQ Spreadsheet on Fleetwide Calculations for Baseline and Future Years.
Heat Rate Reduction (Improvement) (average over project life), Btu/kw-hr
CO2 Emissions Reduction from Baseline (average over project life), Short ton/yr
Average Cost per Short Ton of CO2 Removed Across the Project Life (include fuel savings)
Average Cost per Short Ton of CO2 Removed Across the Project Life (exclude fuel savings)
2. EPA Air Pollution Control Cost Manual, Sixth Edition, January 2002; EPA/452/B-02-001
a. Section 1, Chapter 2, Paragraph 2.3.1 Elements of Total Capital Investment.
b. Section 1, Chapter 2, Paragraph 2.3.2: Elements of Total Annual Cost.3. Based on baseline net generation and net heat rate, ratio of baseline and future capacity factors, heat rate improvement, and future year (2019) average coal price included in "Annual Energy Outlook 2015", US EIA.
Cost per Short Ton of CO2 Removed (nth year of project life) (exclude fuel savings)
Heat Rate Reduction (Improvement) (1st year of project life), Btu/kw-hr
Heat Rate Reduction (Improvement) (nth year of project life), Btu/kw-hr
Heat Rate Improvement (1st year) from Baseline Net Heat Rate, %
Heat Rate Improvement (nth year) from Baseline Net Heat Rate, %
CO2 Emissions Reduction (1st year) from Baseline, Metric ton/yr
CO2 Emissions Reduction (1st year) from Baseline, Short ton/yr
CO2 Emissions Reduction (nth year) from Baseline, Metric ton/yr
CO2 Emissions Reduction (nth year) from Baseline, Short ton/yr
Cost per Short Ton of CO2 Removed (1st year of project life) (include fuel savings)
Cost per Short Ton of CO2 Removed (1st year of project life) (exclude fuel savings)
Cost per Short Ton of CO2 Removed (nth year of project life) (include fuel savings)
Baseline (2012) Net Heat Rate, Btu/kw-hr
Annual Cost
Direct Annual Costs
Fixed & Variable Operation & Maintenance Cost
Fuel Savings
Total Direct Annual Costs (DAC)
Indirect Annual Costs
Project Life
Total Capital Recovery Costs (TCRC)
Total Indirect Annual Costs (IDAC)
Total Annual CostBaseline (2012) CO2 Emissions, metric ton/yr
Total Capital Investment (TCI)
Duke Energy Carolinas, LLCBelews Creek U1Annualized Cost and Cost Per Unit CO2 Reduction forAH Exit Gas Temperature Reduction
CAPITAL COST
`
Equipment Cost
Total Direct Costs
Indirect Costs
Total Indirect Costs
Belews-Page 15 of 19
Attachment B B-21Attachment B B-21

NOTES REFERENCES
$107,397 A 1
$107,397 DC 2(a)
None
$0 IC 2(a)
$107,397 TCI = DC + IC 2(a)
$805,476 1
-$815,524 3
-$10,048 2(b)
8 PL 1$13,425 TCRC = TCI/PL 2(b)
$13,425 IDAC = TCRC 2(b)
$3,376 TAC = DAC + IDAC 2(b)
5,539,297 4
9,279 4
Baseline (2012) Net Generation, MW-h 6,305,060 4
Baseline (2012) Annual Capacity Factor (heat input basis), % 52.87 4
Future (2019) Annual Capacity Factor (projected heat input basis), % 43.00 4
Future (2019) Net Generation, MW-h 5,128,004 5
46
35
Project Life, Years 8 1
Degradation Factor Across Project Life, % 25 1
0.50 1
0.38 1
CO2 Emissions Reduction (1st year) (corresponding to heat rate improvement), % 0.50
CO2 Emissions Reduction (nth year) (corresponding to heat rate improvement), % 0.38
22,526 6
24,831 6
16,894 6
18,623 6
0 7
33 8
0 7
44 8
0
38
41
21727
1. Duke Energy Submittal, September 11, 2015.
5. Based on baseline net generation and ratio of baseline and future capacity factors.
6. Based on baseline CO2 emissions and capacity factor, future capacity factor, and CO2 emissions reductions percentage.
7. Based on total annual cost including fuel savings and CO2 emissions reductions from baseline.
8. Based on total annual cost excluding fuel savings and CO2 emissions reductions from baseline.
4. DAQ Spreadsheet on Fleetwide Calculations for Baseline and Future Years.
Heat Rate Reduction (Improvement) (average over project life), Btu/kw-hr
CO2 Emissions Reduction from Baseline (average over project life), Short ton/yr
Average Cost per Short Ton of CO2 Removed Across the Project Life (include fuel savings)
Average Cost per Short Ton of CO2 Removed Across the Project Life (exclude fuel savings)
2. EPA Air Pollution Control Cost Manual, Sixth Edition, January 2002; EPA/452/B-02-001
a. Section 1, Chapter 2, Paragraph 2.3.1 Elements of Total Capital Investment.
b. Section 1, Chapter 2, Paragraph 2.3.2: Elements of Total Annual Cost.3. Based on baseline net generation and net heat rate, ratio of baseline and future capacity factors, heat rate improvement, and future year (2019) average coal price included in "Annual Energy Outlook 2015", US EIA.
Cost per Short Ton of CO2 Removed (nth year of project life) (exclude fuel savings)
Heat Rate Reduction (Improvement) (1st year of project life), Btu/kw-hr
Heat Rate Reduction (Improvement) (nth year of project life), Btu/kw-hr
Heat Rate Improvement (1st year) from Baseline Net Heat Rate, %
Heat Rate Improvement (nth year) from Baseline Net Heat Rate, %
CO2 Emissions Reduction (1st year) from Baseline, Metric ton/yr
CO2 Emissions Reduction (nth year) from Baseline, Short ton/yr
CO2 Emissions Reduction (1st year) from Baseline, Metric ton/yr
CO2 Emissions Reduction (nth year) from Baseline, Metric ton/yr
Cost per Short Ton of CO2 Removed (1st year of project life) (include fuel savings)
Cost per Short Ton of CO2 Removed (1st year of project life) (exclude fuel savings)
Cost per Short Ton of CO2 Removed (nth year of project life) (include fuel savings)
Baseline (2012) Net Heat Rate, Btu/kw-hr
Annual Cost
Direct Annual Costs
Fixed & Variable Operation & Maintenance Cost
Fuel Savings
Total Direct Annual Costs (DAC)
Indirect Annual Costs
Project Life
Total Capital Recovery Costs (TCRC)
Total Indirect Annual Costs (IDAC)
Total Annual CostBaseline (2012) CO2 Emissions, metric ton/yr
Total Capital Investment (TCI)
Duke Energy Carolinas, LLCBelews Creek U2Annualized Cost and Cost Per Unit CO2 Reduction forControllable Loss Reduction (Maintain Unit Efficiency)
CAPITAL COST
`
Equipment Cost
Total Direct Costs
Indirect Costs
Total Indirect Costs
Belews-Page 16 of 19
Attachment B B-22Attachment B B-22

NOTES REFERENCES
$5,369,837 A 1
$5,369,837 DC 2(a)
None
$0 IC 2(a)
$5,369,837 TCI = DC + IC 2(a)
$80,548 1
-$431,645 3
-$351,098 2(b)
20 PL 1$268,492 TCRC = TCI/PL 2(b)
$268,492 IDAC = TCRC 2(b)
-$82,606 TAC = DAC + IDAC 2(b)
5,539,297 4
9,279 4
Baseline (2012) Net Generation, MW-h 6,305,060 4
Baseline (2012) Annual Capacity Factor (heat input basis), % 52.87 4
Future (2019) Annual Capacity Factor (projected heat input basis), % 43.00 4
Future (2019) Net Generation, MW-h 5,128,004 5
23
20
Project Life, Years 20 1
Degradation Factor Across Project Life, % 10 1
0.24 1
0.22 1
CO2 Emissions Reduction (1st year) (corresponding to heat rate improvement), % 0.24
CO2 Emissions Reduction (nth year) (corresponding to heat rate improvement), % 0.22
10,981 6
12,105 6
9,883 6
10,894 6
-7 7
29 8
-8 7
32 8
-7
30
21
11500
1. Duke Energy Submittal, September 11, 2015.
5. Based on baseline net generation and ratio of baseline and future capacity factors.
6. Based on baseline CO2 emissions and capacity factor, future capacity factor, and CO2 emissions reductions percentage.
7. Based on total annual cost including fuel savings and CO2 emissions reductions from baseline.
8. Based on total annual cost excluding fuel savings and CO2 emissions reductions from baseline.
4. DAQ Spreadsheet on Fleetwide Calculations for Baseline and Future Years.
Heat Rate Reduction (Improvement) (average over project life), Btu/kw-hr
CO2 Emissions Reduction from Baseline (average over project life), Short ton/yr
Average Cost per Short Ton of CO2 Removed Across the Project Life (include fuel savings)
Average Cost per Short Ton of CO2 Removed Across the Project Life (exclude fuel savings)
2. EPA Air Pollution Control Cost Manual, Sixth Edition, January 2002; EPA/452/B-02-001
a. Section 1, Chapter 2, Paragraph 2.3.1 Elements of Total Capital Investment.
b. Section 1, Chapter 2, Paragraph 2.3.2: Elements of Total Annual Cost.3. Based on baseline net generation and net heat rate, ratio of baseline and future capacity factors, heat rate improvement, and future year (2019) average coal price included in "Annual Energy Outlook 2015", US EIA.
Cost per Short Ton of CO2 Removed (nth year of project life) (exclude fuel savings)
Heat Rate Reduction (Improvement) (1st year of project life), Btu/kw-hr
Heat Rate Reduction (Improvement) (nth year of project life), Btu/kw-hr
Heat Rate Improvement (1st year) from Baseline Net Heat Rate, %
Heat Rate Improvement (nth year) from Baseline Net Heat Rate, %
CO2 Emissions Reduction (1st year) from Baseline, Metric ton/yr
CO2 Emissions Reduction (nth year) from Baseline, Short ton/yr
CO2 Emissions Reduction (1st year) from Baseline, Metric ton/yr
CO2 Emissions Reduction (nth year) from Baseline, Metric ton/yr
Cost per Short Ton of CO2 Removed (1st year of project life) (include fuel savings)
Cost per Short Ton of CO2 Removed (1st year of project life) (exclude fuel savings)
Cost per Short Ton of CO2 Removed (nth year of project life) (include fuel savings)
Baseline (2012) Net Heat Rate, Btu/kw-hr
Annual Cost
Direct Annual Costs
Fixed & Variable Operation & Maintenance Cost
Fuel Savings
Total Direct Annual Costs (DAC)
Indirect Annual Costs
Project Life
Total Capital Recovery Costs (TCRC)
Total Indirect Annual Costs (IDAC)
Total Annual CostBaseline (2012) CO2 Emissions, metric ton/yr
Total Capital Investment (TCI)
Duke Energy Carolinas, LLCBelews Creek U2Annualized Cost and Cost Per Unit CO2 Reduction forForced Draft Fan Variable Frequency Drive
CAPITAL COST
`
Equipment Cost
Total Direct Costs
Indirect Costs
Total Indirect Costs
Belews-Page 17 of 19
Attachment B B-23Attachment B B-23

NOTES REFERENCES
$375,889 A 1
$375,889 DC 2(a)
None
$0 IC 2(a)
$375,889 TCI = DC + IC 2(a)
$53,698 1
-$116,503 3
-$62,805 2(b)
3 PL 1$125,296 TCRC = TCI/PL 2(b)
$125,296 IDAC = TCRC 2(b)
$62,491 TAC = DAC + IDAC 2(b)
5,539,297 4
9,279 4
Baseline (2012) Net Generation, MW-h 6,305,060 4
Baseline (2012) Annual Capacity Factor (heat input basis), % 52.87 4
Future (2019) Annual Capacity Factor (projected heat input basis), % 43.00 4
Future (2019) Net Generation, MW-h 5,128,004 5
9
2
Project Life, Years 3 1
Degradation Factor Across Project Life, % 75 1
0.10 1
0.03 1
CO2 Emissions Reduction (1st year) (corresponding to heat rate improvement), % 0.10
CO2 Emissions Reduction (nth year) (corresponding to heat rate improvement), % 0.03
4,505 6
4,966 6
1,126 6
1,242 6
13 7
36 8
50 7
144 8
31
90
6
3104
1. Duke Energy Submittal, September 11, 2015.
5. Based on baseline net generation and ratio of baseline and future capacity factors.
6. Based on baseline CO2 emissions and capacity factor, future capacity factor, and CO2 emissions reductions percentage.
7. Based on total annual cost including fuel savings and CO2 emissions reductions from baseline.
8. Based on total annual cost excluding fuel savings and CO2 emissions reductions from baseline.
4. DAQ Spreadsheet on Fleetwide Calculations for Baseline and Future Years.
Heat Rate Reduction (Improvement) (average over project life), Btu/kw-hr
CO2 Emissions Reduction from Baseline (average over project life), Short ton/yr
Average Cost per Short Ton of CO2 Removed Across the Project Life (include fuel savings)
Average Cost per Short Ton of CO2 Removed Across the Project Life (exclude fuel savings)
2. EPA Air Pollution Control Cost Manual, Sixth Edition, January 2002; EPA/452/B-02-001
a. Section 1, Chapter 2, Paragraph 2.3.1 Elements of Total Capital Investment.
b. Section 1, Chapter 2, Paragraph 2.3.2: Elements of Total Annual Cost.3. Based on baseline net generation and net heat rate, ratio of baseline and future capacity factors, heat rate improvement, and future year (2019) average coal price included in "Annual Energy Outlook 2015", US EIA.
Cost per Short Ton of CO2 Removed (nth year of project life) (exclude fuel savings)
Heat Rate Reduction (Improvement) (1st year of project life), Btu/kw-hr
Heat Rate Reduction (Improvement) (nth year of project life), Btu/kw-hr
Heat Rate Improvement (1st year) from Baseline Net Heat Rate, %
Heat Rate Improvement (nth year) from Baseline Net Heat Rate, %
CO2 Emissions Reduction (1st year) from Baseline, Metric ton/yr
CO2 Emissions Reduction (nth year) from Baseline, Short ton/yr
CO2 Emissions Reduction (1st year) from Baseline, Metric ton/yr
CO2 Emissions Reduction (nth year) from Baseline, Metric ton/yr
Cost per Short Ton of CO2 Removed (1st year of project life) (include fuel savings)
Cost per Short Ton of CO2 Removed (1st year of project life) (exclude fuel savings)
Cost per Short Ton of CO2 Removed (nth year of project life) (include fuel savings)
Baseline (2012) Net Heat Rate, Btu/kw-hr
Annual Cost
Direct Annual Costs
Fixed & Variable Operation & Maintenance Cost
Fuel Savings
Total Direct Annual Costs (DAC)
Indirect Annual Costs
Project Life
Total Capital Recovery Costs (TCRC)
Total Indirect Annual Costs (IDAC)
Total Annual CostBaseline (2012) CO2 Emissions, metric ton/yr
Total Capital Investment (TCI)
Duke Energy Carolinas, LLCBelews Creek U2Annualized Cost and Cost Per Unit CO2 Reduction forAH Leakage Reduction
CAPITAL COST
`
Equipment Cost
Total Direct Costs
Indirect Costs
Total Indirect Costs
Belews-Page 18 of 19
Attachment B B-24Attachment B B-24

NOTES REFERENCES
$3,758,886 A 1
$3,758,886 DC 2(a)
None
$0 IC 2(a)
$3,758,886 TCI = DC + IC 2(a)
$2,500,000 1
-$104,087 3
$2,395,913 2(b)
7 PL 1$536,984 TCRC = TCI/PL 2(b)
$536,984 IDAC = TCRC 2(b)
$2,932,896 TAC = DAC + IDAC 2(b)
5,539,297 4
9,279 4
Baseline (2012) Net Generation, MW-h 6,305,060 4
Baseline (2012) Annual Capacity Factor (heat input basis), % 52.87 4
Future (2019) Annual Capacity Factor (projected heat input basis), % 43.00 4
Future (2019) Net Generation, MW-h 5,128,004 5
9
7
Project Life, Years 7 1
Degradation Factor Across Project Life, % 25 1
0.10 1
0.08 1
CO2 Emissions Reduction (1st year) (corresponding to heat rate improvement), % 0.10
CO2 Emissions Reduction (nth year) (corresponding to heat rate improvement), % 0.08
4,505 6
4,966 6
3,379 6
3,725 6
591 7
612 8
787 7
815 8
689
713
8
4345
1. Duke Energy Submittal, September 11, 2015.
5. Based on baseline net generation and ratio of baseline and future capacity factors.
6. Based on baseline CO2 emissions and capacity factor, future capacity factor, and CO2 emissions reductions percentage.
7. Based on total annual cost including fuel savings and CO2 emissions reductions from baseline.
8. Based on total annual cost excluding fuel savings and CO2 emissions reductions from baseline.
4. DAQ Spreadsheet on Fleetwide Calculations for Baseline and Future Years.
Heat Rate Reduction (Improvement) (average over project life), Btu/kw-hr
CO2 Emissions Reduction from Baseline (average over project life), Short ton/yr
Average Cost per Short Ton of CO2 Removed Across the Project Life (include fuel savings)
Average Cost per Short Ton of CO2 Removed Across the Project Life (exclude fuel savings)
2. EPA Air Pollution Control Cost Manual, Sixth Edition, January 2002; EPA/452/B-02-001
a. Section 1, Chapter 2, Paragraph 2.3.1 Elements of Total Capital Investment.
b. Section 1, Chapter 2, Paragraph 2.3.2: Elements of Total Annual Cost.3. Based on baseline net generation and net heat rate, ratio of baseline and future capacity factors, heat rate improvement, and future year (2019) average coal price included in "Annual Energy Outlook 2015", US EIA.
Cost per Short Ton of CO2 Removed (nth year of project life) (exclude fuel savings)
Heat Rate Reduction (Improvement) (1st year of project life), Btu/kw-hr
Heat Rate Reduction (Improvement) (nth year of project life), Btu/kw-hr
Heat Rate Improvement (1st year) from Baseline Net Heat Rate, %
Heat Rate Improvement (nth year) from Baseline Net Heat Rate, %
CO2 Emissions Reduction (1st year) from Baseline, Metric ton/yr
CO2 Emissions Reduction (nth year) from Baseline, Short ton/yr
CO2 Emissions Reduction (1st year) from Baseline, Metric ton/yr
CO2 Emissions Reduction (nth year) from Baseline, Metric ton/yr
Cost per Short Ton of CO2 Removed (1st year of project life) (include fuel savings)
Cost per Short Ton of CO2 Removed (1st year of project life) (exclude fuel savings)
Cost per Short Ton of CO2 Removed (nth year of project life) (include fuel savings)
Baseline (2012) Net Heat Rate, Btu/kw-hr
Annual Cost
Direct Annual Costs
Fixed & Variable Operation & Maintenance Cost
Fuel Savings
Total Direct Annual Costs (DAC)
Indirect Annual Costs
Project Life
Total Capital Recovery Costs (TCRC)
Total Indirect Annual Costs (IDAC)
Total Annual CostBaseline (2012) CO2 Emissions, metric ton/yr
Total Capital Investment (TCI)
Duke Energy Carolinas, LLCBelews Creek U2Annualized Cost and Cost Per Unit CO2 Reduction forAH Exit Gas Temperature Reduction
CAPITAL COST
`
Equipment Cost
Total Direct Costs
Indirect Costs
Total Indirect Costs
Belews-Page 19 of 19
Attachment B B-25Attachment B B-25

1
North Carolina Department of Environmental Quality Division of Air Quality
Supporting Basis
Determination of Best System of Emissions Reduction for CO2 Emissions from Existing Electric Utility Generating Units
October 30, 2015
Facility Duke Energy Carolinas LLC, Cliffside Steam Station, Cliffside, NC Facility ID: 8100028 Current Air Quality Permit No. 04044T39 Affected Electric Utility Generating Units (EGUs) Cliffside Unit 5 One coal/No. 2 fuel oil-fired electric utility boiler (6,080 million Btu per hour heat input capacity, Unit No. 5) equipped with low-NOX concentric firing system and separated over-fire air/lowered firing low-NOx control equipment Generator rated at 552 MW (summertime nameplate capacity). Cliffside Unit 6 One coal/No. 2 fuel oil-fired supercritical electric utility boiler (7,850 million Btu per hour heat input capacity, Unit No. 6) equipped with low-NOx burners and over-fire air low-NOx control Generator rated at 844 MW (summertime nameplate capacity).
1. Introduction The United States Environmental Protection Agency (EPA) has adopted Emission Guidelines for Greenhouse Gas Emissions and Compliance Times for Electric Utility Generating Units on August 3, 2015 and codified it in 40 CFR Subpart UUUU. The affected electric utility steam generating units (EGUs) under these emission guidelines (EG) are steam generating units, integrated gasification combined cycle units (IGCC), and stationary combined cycle or combined heat and power (CHP) combustion turbines that commenced construction on or before January 8, 2014. The EG includes uniform, nationwide emission standards, which are performance-based rates for emissions of greenhouse gases (GHG) expressed as CO2 (lb CO2/net MWh), as follows: Fossil fuel-fired steam generating units or IGCC: 1,534 lb CO2/net MWh (interim, average of
2022-2029), 1,305 lb CO2/net MWh (final, starting 2030)
Natural gas-fired stationary combined cycle combustion turbines (including CHP combustion turbines): 832 lb/net MWh (interim, average of 2022-2029), 771 lb/MWh (final, starting 2030)
Cliffside-Page 1 of 23
Attachment B B-26Attachment B B-26

2
In lieu of the above uniform rates, each EGU can comply with state-specific goal (lb CO2/net MWh). The other option is that all affected units in the state, in aggregate, comply with the mass-based state goal (short tons/yr). For North Carolina (NC), the rate-based interim and final goals are 1,311 lb CO2/net MWh and 1,136 lb CO2/net MWh, respectively. Similarly, NC’s mass-based interim and final goals are 56,986,025 short tons/yr and 51,266,234 short tons/yr, respectively. The above standards (whether uniform nationwide rates or state-specific goals) are based upon the determination of Best System of Emissions Reduction (BSER) consisting of following three building blocks: Building Block 1 (BB1) - reducing the carbon intensity of electricity generation by improving the
heat rate of existing coal-fired power plants.
Building Block 2 (BB2) - substituting increased electricity generation from lower-emitting existing natural gas plants for reduced generation from higher-emitting coal-fired power plants.
Building Block 3 (BB3) - substituting increased electricity generation from new zero-emitting renewable energy sources (like wind and solar) for reduced generation from existing coal-fired and natural gas-fired power plants.
The EG requires that each state submit its plan complying with all applicable requirements by the deadline included therein. One of the requirements consists of development of an emission standard (“standard of performance”) and establishment of compliance time for each EGU. The Clean Air Act (CAA) §111(a)(1) defines “standard of performance” as “a standard for emissions of air pollutants which reflects the degree of emission limitation achievable through the application of the best system of emission reduction which (taking into account the cost of achieving such reduction and any non-air quality health and environmental impact and energy requirements) the Administrator determines has been adequately demonstrated”.
2. History of Development of Emission Guidelines under CAA Over the last 40 years, under §111(d), the EPA has regulated four pollutants from five source categories, by promulgating associated EG. These source categories are phosphate fertilizer plants (fluorides), sulfuric acid plants (acid mist), Kraft pulp plants (total reduced sulfur (TRS)), primary aluminum plants (fluorides), and municipal solid waste landfills (landfill gas emissions as non-methane organic compounds (NMOCs))1. The following general principles and/or rationales were used by EPA in establishing BSER for these EGs: The degree of emission reduction achievable through the application of various demonstrated
control technologies.
1 See Footnote 18 at 79 FR 41776, July 17, 2014, including ‘‘Phosphate Fertilizer Plants; Final Guideline Document Availability,’’ 42 FR 12022 (March 1, 1977); ‘‘Standards of Performance for New Stationary Sources; Emission Guideline for Sulfuric Acid Mist,’’ 42 FR 55796 (October 18, 1977); ‘‘Kraft Pulp Mills, Notice of Availability of Final Guideline Document,’’ 44 FR 29828 (May 22, 1979); ‘‘Primary Aluminum Plants; Availability of Final Guideline Document,’’ 45 FR 26294 (April 17, 1980); ‘‘Standards of Performance for New Stationary Sources and Guidelines for Control of Existing Sources: Municipal Solid Waste Landfills, Final Rule,’’ 61 FR 9905 (March 12, 1996).
Cliffside-Page 2 of 23
Attachment B B-27Attachment B B-27

3
The technical feasibility of applying various demonstrated technologies to existing sources
considering variability in sizes and designs.
The impact of various demonstrated technologies on national energy consumption, water pollution, waste disposal, and ambient air concentrations of a designated pollutant.
The cost of adopting the emission guidelines, after considering control costs for various demonstrated technologies and taking into account the level of any existing controls.
Each of these EGs indicates that the cost of applying various control technologies can have a considerable impact in selection of a BSER for any designated pollutant for existing facilities. They also indicate that the age, size, type, class, and process design of the facility, influence not only the BSER selection process, but can also support a decision-making for whether different EGs are to be established for differing sizes, types, or classes of equipment. The EGs for the above referenced source categories have been established for principal points of emissions (point and fugitive emissions sources) located within the facility and, not for any emissions sources located outside of the facility. Finally, in these EGs, with respect to determining the EG, EPA has consistently recognized that not only the control technology needs to be demonstrated on existing sources, but the degree of emission reduction (performance level) needs to be readily achievable by the control technology.
3. The Division of Air Quality (DAQ)’s Approach for Determination of BSER The DAQ will consider the above general principles in determining BSER for CO2 emissions reduction from each EGU. But, importantly, DAQ will determine BSER for each EGU based upon BB1-type measures only (i.e., measures which can be accomplished within the fence-line of the facility), conforming to the §111(d) of the CAA and the requirements of 40 CFR 60 “Adoption and Submittal of State Plans for Designated Facilities”. Thus, DAQ’s approach will comprise of improving the operational efficiency of the EGUs in order to reduce CO2 emissions from the 2012 baseline levels. The DAQ’s BSER evaluation will specifically be based upon the following: type of EGU remaining useful life of the EGU unit’s baseline data (net heat rate, net generation, annual capacity factor, and CO2 emissions) unit’s projected future capacity factor feasibility of applying specific heat rate improvement (HRI) measure on a given unit whether the measure is adequately demonstrated degree of heat rate reduction potential for feasible HRI measures site-specific limitations associated costs (capital, fixed and variable operational and maintenance (O&M), and fuel savings) cost per ton of CO2 reduction The evaluation is also based on literature review2 of technical feasibility for various HRI measures, degree of heat rate reduction potential, and costs data (capital, and fixed and variable O&M).
2 “Coal-fired Power Plant Heat Rate Reductions”, Final Report, Sargent & Lundy, Chicago, IL, January 22, 2009.
Cliffside-Page 3 of 23
Attachment B B-28Attachment B B-28

4
It needs to be emphasized here that DAQ’s determination for each EGU will not be based upon some pre-determined HRI target, such as EPA’s selection of a 4.3% HRI potential for EGUs in the Eastern interconnection3, as discussed in the EG. The DAQ’s approach will include those adequately demonstrated, cost-effective measures that assure that the electricity is generated with lower CO2 emissions, thus improving public health and welfare. The selected HRI measures would be expected to produce non-air environmental co-benefits in the form of reduced water usage and solid waste production, in addition to, reductions in emissions of non-GHG pollutants such as SO2, NOx, and mercury. However, it should be noted that as the EGU becomes more cost-competitive due to HRIs, it may be dispatched more frequently and/or at higher loads. If the EGU is utilized more often, some increases in emissions of GHG (as CO2) and similarly, for non-GHG pollutants (such as SO2, NOx, or mercury) are possible, and those could partially offset the emissions reductions achieved through the HRI of the EGU. EPA has determined a cost estimate of $23 per ton4 reasonable for CO2 emissions reduction from EGUs under BB1 implementing HRI measures. EPA has further determined that this cost is reasonable because it achieves “an appropriate balance between cost and amount of reductions.”5 In addition, EPA has used another benchmark in the form of social cost of carbon (SC-CO2) at $40 per ton (2020) to $48 per ton (2030)6 to conclude that the above $23 per ton cost is reasonable. In determining a BSER for a particular EGU, DAQ will use the above cost effectiveness threshold of $23 per ton to determine reasonableness of cost and whether one or more technically feasible measure(s) can be implemented, as long as, collectively, the total cost does not exceed this threshold.
4. BSER Evaluation Duke Energy Carolinas, LLC, Cliffside Steam Station (DEC) has provided information through submittals of July 31 and September 11, 2015, to aid in DAQ’s efforts in determining BSER for CO2 emissions from Units 5 and 6. Additional information was provided through face-to-face meetings and email communication. The submitted information consists of baseline data (net heat rate, net generation, generation-based annual capacity factor, and CO2 emissions) for 2012, projected heat input for future years such as
“Analysis of Heat Rate Improvement Potential at Coal-Fired Power Plants”, US Energy Information Administration, Washington, DC, May 2015. S. Corellis, “Range and Applicability of Heat Rate Improvements”, Technical Update, Electric Power Research Institute, Palo Alto, CA, April 2014. 3 Applies to coal-fired EGUs only. 4 See page 446 of 1560 (pre-publication version), Carbon Pollution Emission Guidelines for Existing Stationary Sources: Electric Utility Generating Units Clean Power Plan, August 3, 2015. Based on nation-wide coal fleet capacity of 213 GW, heat rate improvement capital cost of $100/KW, capital charge rate of 14.3%, fleet-wide baseline net heat rate of 10,250 Btu/KWh, heat rate improvement of 4% for coal-fired EGUs, annual capacity factor of 78%, and future (2030) average coal delivered cost of $2.70 per million Btu. See page 2-65, Greenhouse Gas Mitigation Measures, Technical Support Document (TSD) for Carbon Pollution Guidelines for Existing Power Plants”, August 3, 2015. 5 See page 457 of 1560 (pre-publication version), Ibid. 6 See pages 458 and 459 of 1560 (pre-publication version), Ibid.
Cliffside-Page 4 of 23
Attachment B B-29Attachment B B-29

5
2019; and cost data (capital cost and annual O&M)7, project life, degradation factor and HRI potential for each of the following measures, for possible implementation on all EGUs of NC-based coal fleet: Controllable Loss Reduction (Maintain Unit Efficiency) [CLR] Sliding Pressure Operation [SPO] Lower FGD Efficiency (as SO2 permit limits allow) [LFGD] Intelligent Sootblowers [ISB] Air Heater Leakage Reduction [ALR] Combustion Optimization - CCM / Excess Air / Neural Network [CO] Online Condenser Cleaning [OCC] Induced and/or Booster Draft Fan Variable Frequency Drive [IBD] Air Heater Exit Gas Temperature Reduction [AHE] Flue Gas Desulfurization (FGD) Auxiliary Load Reduction through Variable Frequency Drives
[FGDA] Boiler Feed Pump Motor Driven Variable Frequency Drive [BFP] Induced Draft Fan Replacement [IDFR] Forced Draft Fan Variable Frequency Drive [FDF] Condenser Rebundle, Retubes, and Rebuilds [CRR] Electrostatic Precipitator (ESP) (Power management, T/R set upgrades) [ESP] Turbine Upgrades (HI, IP, LP) [TUR] Helper Cooling Tower [HCT] DEC has claimed the submitted information on cost, project life, and degradation factors, as “confidential”. The DAQ will treat this specific information (cost data and information on project life and the associated degradation factors) “confidential” until the Director decides that it is not confidential in accordance with NCAC 2Q .0107 “Confidential Information”. Thus, DAQ will not include such information in this document. In general, through these submittals, DEC characterizes the HRIs decreasing over time because the equipment associated with each measure degrades over time due to normal wear and tear, requiring recurrent implementation of HRI projects or measures. DEC further mentions that some of the efficiency projects cannot be performed or the full HRI benefits may not be realized due to unique configuration or physical limitation of a given EGU. In addition, DEC states that operation of any EGU at less than the full load or if cycled between full and partial load will adversely impact EGU’s heat rate. DEC also discusses reduced utilization of its coal-fired fleet in the recent history in response to lower natural gas prices, resulting in some of its coal-fired units, once operated as base-load units, now operating as intermediate duty cycling units. Finally, DEC adds that any post combustion environmental controls (activated carbon for mercury control, dry bottom and fly ash conversion for coal ash disposal, selective catalytic reduction for NOx control, and Zero Liquid Discharge (ZLD) for wastewater treatment) also adversely impact the heat rate of the EGU, in addition to any other environmental control which might be installed in future (any project implemented since its BSER submittal deadline date of July 31, 2015).
7 High level estimate in the range of -20% to +75% in 2015 $s.
Cliffside-Page 5 of 23
Attachment B B-30Attachment B B-30

6
With respect to the BSER evaluation, the DAQ has utilized the following data upon verifying or through calculations, for estimating heat rate reduction (Btu/kWh), CO2 emission reduction (short tons/yr), and cost per unit reduction of CO2 ($ per ton) for each measure:
Table 1: Cliffside Units 5 and 6
Unit No. 5 6
Baseline (2012) Net Generation (MWh) 1,144,368 4,813,190
Baseline (2012) Net Heat Rate (Btu/kWh) 10,164 8,944
Baseline (2012) CO2 Emissions (Tons/yr) 1,192,056 4,416,678
Baseline (2012) Annual Heat Input (million Btu)
11,631,356 43,049,171
Baseline (2012) Annual Capacity Factor (heat input basis)
0.218 0.626
Future (2019) Projected Annual Capacity Factor (Heat Input Basis)
0.100 0.540
Future (2019) Projected Coal Delivered Cost ($ per million Btu)
3.92 3.92
Commencement of Operation Year 1972 2012
Planned Retirement Year 2042 2048
It needs to be clarified here that, for all NC-based EGUs, owned by Duke Energy (both under DEC and Duke Energy Progress (DEP)), DAQ used the actual coal delivered prices for 2014 and scaled them for 20198 to estimate the above coal delivered price of $3.92 per million Btu. DAQ will adjust the capital
8 Duke Energy Carolinas The actual, average cost of fuel burned for 12 months ending December 2014 (Jan 2014-Dec 2014) was $3.84 per million Btu (See NCUC Docket No. E-7, Sub 1047, Duke Energy Carolinas, LLC Monthly Fuel Report, February 11, 2015). Duke Energy Progress The actual, average cost of coal burned for 12 months ending January 2015 (Feb 2014-Jan 2015) was $3.57 per million Btu (See NCUC Docket No. E-2, Sub 1064, Duke Energy Progress, INC. Monthly Fuel Report, March 12, 2015). Using the EIA (Annual Energy Outlook 2015) [www.eia.gov/beta/aeo/], nationwide coal delivered prices were projected to be: 2013 $2.50 per million Btu 2015 $2.41 per million Btu 2020 $2.54 per million Btu By interpolation, nationwide coal delivered prices for 2014 and 2019 would be approximately $2.46 per million Btu and $2.51 per million, respectively; thus an increase of 2 percent of coal price was projected from 2014 to 2019. Applying this ratio to the DEC’s fleet, the average coal delivered price in 2019 would be 1.02 * $3.84 per million Btu = $3.92 per million Btu. Applying the same ratio to the DEP fleet, the average coal delivered price in 2019 would be 1.02 * $3.57 per million Btu = $3.64 per million Btu. Using the larger value from the above, for conservative calculations, for the entire fleet (both DEC and DEP), the 2019 coal delivered cost is projected to be $3.92 per million Btu.
Cliffside-Page 6 of 23
Attachment B B-31Attachment B B-31

7
and annual O&M costs estimates, provided by DEC in 2015 dollars, to 2019 dollars, using the growth factor of 1.8 percent compounded annually.9 Cliffside Unit 5 BSER Candidates For Unit 5, DEC has determined that measures identified above as SPO, CRR, HCT, FGDA, BFP, IDFR, AHE are either technically infeasible or each have very negligible HRI opportunity. The DAQ agrees with DEC, and will not include them further in the BSER evaluation. Further, measures TUR and IBD were accomplished prior to 2012 (baseline year). The DAQ will not include any other measure in its evaluation if there is any possibility of an increase in collateral emissions, such as measures LFGD and ESP. Thus, the following remaining six measures were considered further in the BSER analysis: CLR, OCC, FDF, ISB, ALR and CO. Cliffside Unit 6 BSER Candidates For Unit 6, DEC has determined that measures identified above as OCC, CRR, TUR, HCT, FGDA, BFP, IDFR, and AHE, are either technically infeasible or each have very negligible HRI opportunity. In addition, DEC has reasoned that measure SPO increases electric grid reliability risks due to boiler tube or drum damage and unstable operation, and recommended that this measure be removed from BSER evaluation for all coal-fired EGUs (both DEC and DEP). The DAQ agrees with DEC, and will not include these measures further in the BSER evaluation. Measure IBD was accomplished prior to 2012 (baseline year). The DAQ will not include any other measure in its evaluation if there is any possibility of an increase in collateral emissions, such as measures LFGD and ESP. Thus, the following remaining five measures were considered further in the BSER analysis: CLR, FDF, ISB, ALR and CO. BSER Measure by Measure Analysis The DAQ has evaluated the remaining measures for Units 5 and 6 using the methodology described below: First, using the project life (yr) for a given measure, DAQ has transformed capital investment ($) into an indirect annual (capital) cost ($ per yr) by simply dividing capital investment by the project life. Then, it added it to the direct annual (fixed O&M) cost to determine the total annual cost. Next, using the coal delivered price, baseline year (2012) generation and capacity factor, future capacity factor, and average HRI percent (calculated assuming the HRI for a given measure degrades linearly over the project life based on degradation factor); coal fuel savings have been estimated for 2019. Fuel savings due to improved heat rate have been deducted from the total annual cost to determine net annual cost for implementation of a measure.
9 See both GDP Chain-Type Price Index and Metals and Metal Products Indicator, Table A20. Macroeconomics Indicators, USEIA Annual Energy Outlook 2015.
Cliffside-Page 7 of 23
Attachment B B-32Attachment B B-32

8
Then, using baseline CO2 emissions, baseline and future capacity factors, and average improvement of heat rate for the EGU (again assuming a decrease in HRI linearly over the measure’s life based on degradation factor) from baseline net heat rate, reduction in CO2 emissions associated with a given measure has been estimated. Finally, cost per unit reduction in CO2 is simply estimated by taking net annual cost and dividing it by CO2 emissions, both determined as above. It needs to be emphasized that average HRI percent (calculated using degradation factor across the project life) and not the maximum HRI percent, has been applied to determine fuel savings and CO2 emissions reductions for a given measure. Table 2 (one table for each unit) includes heat rate reduction (Btu/kWh), CO2 emission reduction (tons/yr), and cost per unit CO2 reduction ($ per ton) for each of the remaining measures considered for Units 5 and 6. Refer to the attached spreadsheet on calculations for annualized cost and cost per unit reduction of CO2 for each associated measure included in Table 2. It needs to be stated here although the retirement age for each of the units has been estimated by DEC and available to DAQ, there is no need to adjust the estimated costs, considering the remaining useful life (RUL) of each of the EGUs. Each BSER measure considered has a project life that is less than the RUL of the EGU. Cliffside Unit 5 Results If implemented, all of the measures included in Table 2 would be expected to produce non-air environmental co-benefits in the form of reduced water usage and solid waste production, in addition to reduced emissions of non-GHG pollutants such as SO2, NOx, and mercury. Adverse energy impacts would not be expected as well. However, as shown in Table 2: Cliffside Unit 5, the estimated cost for each measure considered exceeds the reasonable cost threshold of $23 per ton and can be considered “excessive”, “exorbitant” or “unreasonable”, as stated by EPA in the preamble to the final EG.10 As shown in Table 1, Unit 5 is projected to operate at a very low annual capacity factor. If the EGU was to operate at a higher annual capacity factor, the cost per unit reduction of CO2 would be reduced. In summary, DAQ has determined the estimated costs in $ per ton for each of the measures for Unit 5 unreasonable. Thus, considering cost, non-air environmental, and energy impacts, DAQ determines that none of the measures listed in Table 2 is BSER for Unit 5.
10 Page 298 of 1560 (pre-publication version), Ibid.
Cliffside-Page 8 of 23
Attachment B B-33Attachment B B-33

9
Table 2: Cliffside Unit 5
Measure
Heat Rate Reduction
Btu/kWh
[Project Life Average]
CO2 Emissions Reductions
tons per year [Project Life
Average]
Cost per Unit CO2 Reduction
$ per ton
[Including Fuel Savings]
Is Cost per Unit CO2 Reduction <= $23 per
ton?
Controllable Loss Reduction (Maintain Unit Efficiency) [CLR]
44 2,388 311 N
Online Condenser Cleaning [OCC] 8 409 724 N
Condenser Rebundle, Retubes, Rebuilds [CRR]
0 0 0 -
Turbine Upgrades (HP, IP, LP) [TUR] -
Helper Cooling Tower [HCT] 0 0 0 -
Induced and/or Booster Draft Fan Variable Frequency Drive [IBD]
-
FGD Aux Load Reduction Through Variable Frequency Drives [FGDA]
0 0 0 -
Boiler Feed Pump Motor Driven Variable Frequency Drive [BFP]
0 0 0 -
Induced Draft Fan Replacement [IDFR] 0 0 0 -
Forced Draft Fan Variable Frequency Drive [FDF]
43 2,333 112 N
Intelligent Sootblowers [ISB] 27 1,433 37 N
AH Leakage Reduction [ALR] 13 682 350 N
Combustion Optimization - CCM / Excess Air / Neural Network [CO]
27 1,433 95 N
AH Exit Gas Temperature Reduction [AHE]
0 0 0 -
Technically infeasible/no opportunity identified
Performed in or prior to baseline year 2012
Performed prior to July 2015 and after baseline year
Cliffside-Page 9 of 23
Attachment B B-34Attachment B B-34

10
Table 2: Cliffside Unit 6
Measure
Heat Rate Reduction
Btu/kWh
[Project Life Average]
CO2 Emissions Reductions
tons per year [Project Life
Average]
Cost per Unit CO2 Reduction
$ per ton
[Including Fuel Savings]
Is Cost per Unit CO2
Reduction <= $23 per ton?
Controllable Loss Reduction (Maintain Unit Efficiency) [CLR]
39 16,669 11 Y
Online Condenser Cleaning [OCC] 0 0 0 -
Condenser Rebundle, Retubes, Rebuilds [CRR]
0 0 0 -
Turbine Upgrades (HP, IP, LP) [TUR] 0 0 0 -
Helper Cooling Tower [HCT] 0 0 0 -
Induced and/or Booster Draft Fan Variable Frequency Drive [IBD]
-
FGD Aux Load Reduction Through Variable Frequency Drives [FGDA]
0 0 0 -
Boiler Feed Pump Motor Driven Variable Frequency Drive [BFP]
0 0 0 -
Induced Draft Fan Replacement [IDFR] 0 0 0 -
Forced Draft Fan Variable Frequency Drive [FDF]
15 6,334 17 Y
Intelligent Sootblowers [ISB] 12 5,001 -17 Y
AH Leakage Reduction [ALR] 11 4,762 -1 Y
Combustion Optimization - CCM / Excess Air / Neural Network [CO]
23 10,001 -20 Y
AH Exit Gas Temperature Reduction [AHE]
0 0 0 -
Technically infeasible/no opportunity identified
Performed in or prior to baseline year 2012
Performed prior to July 2015 and after baseline year
Cliffside-Page 10 of 23
Attachment B B-35Attachment B B-35

11
Cliffside Unit 6 Results Upon, initial analysis all remaining five measures (CLR, FDF, ISB, ALR and CO) individually cost less than $23/ton and collectively cost -$21/ton. Of the five remaining projects, ISB, ALR and CO can be considered measures that improve boiler efficiency. When considering measures that improve an EGU’s thermal efficiency, the benefits are not necessarily additive, unlike the case for measures that reduce parasitic loads on the EGU, where it is a reasonable assumption to do so. The HRI likely values initially submitted by DEC and used thus far do not take into account synergistic effects. Therefore, it is reasonable to adjust the HRI values used in this analysis in those cases where multiple boiler efficiency projects are considered together as BSER. Based on confidential information DEC has supplied as justification, the HRI likely for ISB will be further reduced in this analysis. A decrease in the HRI will also result in the increase in the cost per ton of CO2 removed. One other adjustment to consider in this case is the use of CLR. DEC has supplied justification that the assumption of a HRI value resulting from the implementation of CLR alone should not be considered additive (similar to boiler efficiency projects) when implemented with many other projects. DAQ found this explanation reasonable and as a result reduced the HRI likely from the implementation of CLR when used in conjunction with two or more other measures. The table below (Table 3) presents the reductions in heat rate, cost per ton of CO2 reduction and the total CO2 reduction associated with the implementation of each measure. The table also presents the combinations of measures that will be considered as BSER candidates. Note that other combinations are possible, but by inspection can readily be seen to exceed the reasonable cost threshold or have much lower benefit than those presented here. Note that after adjustment to the HRI for CLR and ISB, the collective cost of implementing all five measures (option 0) increases from -$21/ton to $40/ton, exceeding the reasonable cost threshold. Upon review, options 2, 4, and 7 have the greatest environmental benefit of all combinations that are below the reasonable cost threshold. Options 2 and 4 have the same environmental benefit (e.g., 62 Btu/kWh or 26,670 tons of CO2 reduced) but option 2 is of a lower cost (-$17/ton vs. -$9/ton). Option 7 has a slightly lower environmental benefit (26,098 vs. 26,670 tons/yr.) than option 2, but has a lower cost (-$21/ton vs. -$17/ton). It needs to be stated here that there is some uncertainty about whether the HRI benefits associated with CLR would actually be realized as per the information provided by DEC. Given the small margin of difference between option 2 and option 7, the DAQ recommends option 7 or the following measures for BSER for Unit 6: FDF, ISB, ALR and CO. In summary, DAQ has determined the following four measures as BSER: FDF, ISB, ALR and CO. The cumulative associated heat rate reductions and CO2 emissions reductions are 61 Btu/kWh and 26,098 tons/yr. respectively. The measures are expected to produce non-air environmental co-benefits in the form of reduced water usage and solid waste production, in addition to, reduced emissions of non-GHG pollutants such as SO2, NOx, and mercury. No adverse energy impact is expected from employing the four measures as BSER at Unit 6.
Cliffside-Page 11 of 23
Attachment B B-36Attachment B B-36

12
Table 3: Cliffside Unit 6
Cost and Benefits as a Function of Measure Combinations
Option Measures Heat Rate Reduction,Btu/ kWh
Cost per ton of CO2
reduced, $/ton
Total CO2 reduction,
tpy
- CLR ( with 2 or more other
measures) 20 61 8,334
- CLR (alone or with 1 other measure) 39 11 16,669
- FDF 15 17 6,334
- ISB ( with CO in mix) 12 -17 5,001
- ISB (without CO in mix) 23 -28 10,001
- ALR 11 -1 4,762
- CO 23 -20 10,001
0 All five measures if possible 81 40 34,432
1 CLR + FDF 54 28 23,003
2 CLR +ISB 62 -17 26,670
3 CLR +ALR 50 10 21,431
4 CLR+CO 62 -9 26,670
5 CLR+ISB+CO 55 24 23,336
6 CLR+ISB+ALR 54 32 23,097
7 FDF+ISB+ALR+CO 61 -21 26,098
8 FDF+ISB+ALR 49 -12 21,097
9 FDF+ALR+CO 49 -4 21,097
5. BSER for Cliffside Units 5 and 6 Cliffside Unit 5 No BSER. Cliffside Unit 6 DEC shall implement the following HRI measures, consisting of FDF, ISB, ALR and CO, starting September 1, 2019.
Cliffside-Page 12 of 23
Attachment B B-37Attachment B B-37

NOTES REFERENCES
$107,397 A 1
$107,397 DC 2(a)
None
$0 IC 2(a)
$107,397 TCI = DC + IC 2(a)
$805,476 1
-$91,278 3
$714,198 2(b)
8 PL 1$13,425 TCRC = TCI/PL 2(b)
$13,425 IDAC = TCRC 2(b)
$727,622 TAC = DAC + IDAC 2(b)
1,081,426 4
10,164 4
Baseline (2012) Net Generation, MW-h 1,144,368 4
Baseline (2012) Annual Capacity Factor (heat input basis), % 21.84 4
Future (2019) Annual Capacity Factor (projected heat input basis), % 10.00 4
Future (2019) Net Generation, MW-h 523,978 5
51
38
Project Life, Years 8 1
Degradation Factor Across Project Life, % 25 1
0.50 1
0.38 1
CO2 Emissions Reduction (1st year) (corresponding to heat rate improvement), % 0.50
CO2 Emissions Reduction (nth year) (corresponding to heat rate improvement), % 0.38
2,476 6
2,729 6
1,857 6
2,047 6
267 7
300 8
355 7
400 8
311
350
44
2388
1. Duke Energy Submittal, September 11, 2015.
5. Based on baseline net generation and ratio of baseline and future capacity factors.
6. Based on baseline CO2 emissions and capacity factor, future capacity factor, and CO2 emissions reductions percentage.
7. Based on total annual cost including fuel savings and CO2 emissions reductions from baseline.
8. Based on total annual cost excluding fuel savings and CO2 emissions reductions from baseline.
4. DAQ Spreadsheet on Fleetwide Calculations for Baseline and Future Years.
Heat Rate Reduction (Improvement) (average over project life), Btu/kw-hr
CO2 Emissions Reduction from Baseline (average over project life), Short ton/yr
Average Cost per Short Ton of CO2 Removed Across the Project Life (include fuel savings)
Average Cost per Short Ton of CO2 Removed Across the Project Life (exclude fuel savings)
2. EPA Air Pollution Control Cost Manual, Sixth Edition, January 2002; EPA/452/B-02-001
a. Section 1, Chapter 2, Paragraph 2.3.1 Elements of Total Capital Investment.
b. Section 1, Chapter 2, Paragraph 2.3.2: Elements of Total Annual Cost.3. Based on baseline net generation and net heat rate, ratio of baseline and future capacity factors, heat rate improvement, and future year (2019) average coal price included in "Annual Energy Outlook 2015", US EIA.
Cost per Short Ton of CO2 Removed (nth year of project life) (exclude fuel savings)
Heat Rate Reduction (Improvement) (1st year of project life), Btu/kw-hr
Heat Rate Reduction (Improvement) (nth year of project life), Btu/kw-hr
Heat Rate Improvement (1st year) from Baseline Net Heat Rate, %
Heat Rate Improvement (nth year) from Baseline Net Heat Rate, %
CO2 Emissions Reduction (1st year) from Baseline, Metric ton/yr
CO2 Emissions Reduction (nth year) from Baseline, Short ton/yr
CO2 Emissions Reduction (1st year) from Baseline, Metric ton/yr
CO2 Emissions Reduction (nth year) from Baseline, Metric ton/yr
Cost per Short Ton of CO2 Removed (1st year of project life) (include fuel savings)
Cost per Short Ton of CO2 Removed (1st year of project life) (exclude fuel savings)
Cost per Short Ton of CO2 Removed (nth year of project life) (include fuel savings)
Baseline (2012) Net Heat Rate, Btu/kw-hr
Annual Cost
Direct Annual Costs
Fixed & Variable Operation & Maintenance Cost
Fuel Savings
Total Direct Annual Costs (DAC)
Indirect Annual Costs
Project Life
Total Capital Recovery Costs (TCRC)
Total Indirect Annual Costs (IDAC)
Total Annual CostBaseline (2012) CO2 Emissions, metric ton/yr
Total Capital Investment (TCI)
Duke Energy Carolinas, LLCCliffside U5Annualized Cost and Cost Per Unit CO2 Reduction forControllable Loss Reduction (Maintain Unit Efficiency)
CAPITAL COST
`
Equipment Cost
Total Direct Costs
Indirect Costs
Total Indirect Costs
Cliffside-Page 13 of 23
Attachment B B-38Attachment B B-38

NOTES REFERENCES
$2,147,935 A 1
$2,147,935 DC 2(a)
None
$0 IC 2(a)
$2,147,935 TCI = DC + IC 2(a)
$64,438 1
-$15,648 3
$48,790 2(b)
10 PL 1$214,793 TCRC = TCI/PL 2(b)
$214,793 IDAC = TCRC 2(b)
$263,584 TAC = DAC + IDAC 2(b)
1,081,426 4
10,164 4
Baseline (2012) Net Generation, MW-h 1,144,368 4
Baseline (2012) Annual Capacity Factor (heat input basis), % 21.84 4
Future (2019) Annual Capacity Factor (projected heat input basis), % 10.00 4
Future (2019) Net Generation, MW-h 523,978 5
10
5
Project Life, Years 10 1
Degradation Factor Across Project Life, % 50 1
0.10 1
0.05 1
CO2 Emissions Reduction (1st year) (corresponding to heat rate improvement), % 0.10
CO2 Emissions Reduction (nth year) (corresponding to heat rate improvement), % 0.05
495 6
546 6
248 6
273 6
483 7
512 8
966 7
1023 8
724
767
8
409
1. Duke Energy Submittal, September 11, 2015.
5. Based on baseline net generation and ratio of baseline and future capacity factors.
6. Based on baseline CO2 emissions and capacity factor, future capacity factor, and CO2 emissions reductions percentage.
7. Based on total annual cost including fuel savings and CO2 emissions reductions from baseline.
8. Based on total annual cost excluding fuel savings and CO2 emissions reductions from baseline.
4. DAQ Spreadsheet on Fleetwide Calculations for Baseline and Future Years.
Heat Rate Reduction (Improvement) (average over project life), Btu/kw-hr
CO2 Emissions Reduction from Baseline (average over project life), Short ton/yr
Average Cost per Short Ton of CO2 Removed Across the Project Life (include fuel savings)
Average Cost per Short Ton of CO2 Removed Across the Project Life (exclude fuel savings)
2. EPA Air Pollution Control Cost Manual, Sixth Edition, January 2002; EPA/452/B-02-001
a. Section 1, Chapter 2, Paragraph 2.3.1 Elements of Total Capital Investment.
b. Section 1, Chapter 2, Paragraph 2.3.2: Elements of Total Annual Cost.3. Based on baseline net generation and net heat rate, ratio of baseline and future capacity factors, heat rate improvement, and future year (2019) average coal price included in "Annual Energy Outlook 2015", US EIA.
Cost per Short Ton of CO2 Removed (nth year of project life) (exclude fuel savings)
Heat Rate Reduction (Improvement) (1st year of project life), Btu/kw-hr
Heat Rate Reduction (Improvement) (nth year of project life), Btu/kw-hr
Heat Rate Improvement (1st year) from Baseline Net Heat Rate, %
Heat Rate Improvement (nth year) from Baseline Net Heat Rate, %
CO2 Emissions Reduction (1st year) from Baseline, Metric ton/yr
CO2 Emissions Reduction (nth year) from Baseline, Short ton/yr
CO2 Emissions Reduction (1st year) from Baseline, Metric ton/yr
CO2 Emissions Reduction (nth year) from Baseline, Metric ton/yr
Cost per Short Ton of CO2 Removed (1st year of project life) (include fuel savings)
Cost per Short Ton of CO2 Removed (1st year of project life) (exclude fuel savings)
Cost per Short Ton of CO2 Removed (nth year of project life) (include fuel savings)
Baseline (2012) Net Heat Rate, Btu/kw-hr
Annual Cost
Direct Annual Costs
Fixed & Variable Operation & Maintenance Cost
Fuel Savings
Total Direct Annual Costs (DAC)
Indirect Annual Costs
Project Life
Total Capital Recovery Costs (TCRC)
Total Indirect Annual Costs (IDAC)
Total Annual CostBaseline (2012) CO2 Emissions, metric ton/yr
Total Capital Investment (TCI)
Duke Energy Carolinas, LLCCliffside U5Annualized Cost and Cost Per Unit CO2 Reduction forOnline Condenser Cleaning
CAPITAL COST
`
Equipment Cost
Total Direct Costs
Indirect Costs
Total Indirect Costs
Cliffside-Page 14 of 23
Attachment B B-39Attachment B B-39

NOTES REFERENCES
$5,369,837 A 1
$5,369,837 DC 2(a)
None
$0 IC 2(a)
$5,369,837 TCI = DC + IC 2(a)
$80,548 1
-$89,191 3
-$8,644 2(b)
20 PL 1$268,492 TCRC = TCI/PL 2(b)
$268,492 IDAC = TCRC 2(b)
$259,848 TAC = DAC + IDAC 2(b)
1,081,426 4
10,164 4
Baseline (2012) Net Generation, MW-h 1,144,368 4
Baseline (2012) Annual Capacity Factor (heat input basis), % 21.84 4
Future (2019) Annual Capacity Factor (projected heat input basis), % 10.00 4
Future (2019) Net Generation, MW-h 523,978 5
46
41
Project Life, Years 20 1
Degradation Factor Across Project Life, % 10 1
0.45 1
0.41 1
CO2 Emissions Reduction (1st year) (corresponding to heat rate improvement), % 0.45
CO2 Emissions Reduction (nth year) (corresponding to heat rate improvement), % 0.41
2,228 6
2,456 6
2,005 6
2,211 6
106 7
142 8
118 7
158 8
112
150
43
2333
1. Duke Energy Submittal, September 11, 2015.
5. Based on baseline net generation and ratio of baseline and future capacity factors.
6. Based on baseline CO2 emissions and capacity factor, future capacity factor, and CO2 emissions reductions percentage.
7. Based on total annual cost including fuel savings and CO2 emissions reductions from baseline.
8. Based on total annual cost excluding fuel savings and CO2 emissions reductions from baseline.
4. DAQ Spreadsheet on Fleetwide Calculations for Baseline and Future Years.
Heat Rate Reduction (Improvement) (average over project life), Btu/kw-hr
CO2 Emissions Reduction from Baseline (average over project life), Short ton/yr
Average Cost per Short Ton of CO2 Removed Across the Project Life (include fuel savings)
Average Cost per Short Ton of CO2 Removed Across the Project Life (exclude fuel savings)
2. EPA Air Pollution Control Cost Manual, Sixth Edition, January 2002; EPA/452/B-02-001
a. Section 1, Chapter 2, Paragraph 2.3.1 Elements of Total Capital Investment.
b. Section 1, Chapter 2, Paragraph 2.3.2: Elements of Total Annual Cost.3. Based on baseline net generation and net heat rate, ratio of baseline and future capacity factors, heat rate improvement, and future year (2019) average coal price included in "Annual Energy Outlook 2015", US EIA.
Cost per Short Ton of CO2 Removed (nth year of project life) (exclude fuel savings)
Heat Rate Reduction (Improvement) (1st year of project life), Btu/kw-hr
Heat Rate Reduction (Improvement) (nth year of project life), Btu/kw-hr
Heat Rate Improvement (1st year) from Baseline Net Heat Rate, %
Heat Rate Improvement (nth year) from Baseline Net Heat Rate, %
CO2 Emissions Reduction (1st year) from Baseline, Metric ton/yr
CO2 Emissions Reduction (nth year) from Baseline, Short ton/yr
CO2 Emissions Reduction (1st year) from Baseline, Metric ton/yr
CO2 Emissions Reduction (nth year) from Baseline, Metric ton/yr
Cost per Short Ton of CO2 Removed (1st year of project life) (include fuel savings)
Cost per Short Ton of CO2 Removed (1st year of project life) (exclude fuel savings)
Cost per Short Ton of CO2 Removed (nth year of project life) (include fuel savings)
Baseline (2012) Net Heat Rate, Btu/kw-hr
Annual Cost
Direct Annual Costs
Fixed & Variable Operation & Maintenance Cost
Fuel Savings
Total Direct Annual Costs (DAC)
Indirect Annual Costs
Project Life
Total Capital Recovery Costs (TCRC)
Total Indirect Annual Costs (IDAC)
Total Annual CostBaseline (2012) CO2 Emissions, metric ton/yr
Total Capital Investment (TCI)
Duke Energy Carolinas, LLCCliffside U5Annualized Cost and Cost Per Unit CO2 Reduction forForced Draft Fan Variable Frequency Drive
CAPITAL COST
`
Equipment Cost
Total Direct Costs
Indirect Costs
Total Indirect Costs
Cliffside-Page 15 of 23
Attachment B B-40Attachment B B-40

NOTES REFERENCES
$536,984 A 1
$536,984 DC 2(a)
None
$0 IC 2(a)
$536,984 TCI = DC + IC 2(a)
$53,698 1
-$54,767 3
-$1,068 2(b)
10 PL 1$53,698 TCRC = TCI/PL 2(b)
$53,698 IDAC = TCRC 2(b)
$52,630 TAC = DAC + IDAC 2(b)
1,081,426 4
10,164 4
Baseline (2012) Net Generation, MW-h 1,144,368 4
Baseline (2012) Annual Capacity Factor (heat input basis), % 21.84 4
Future (2019) Annual Capacity Factor (projected heat input basis), % 10.00 4
Future (2019) Net Generation, MW-h 523,978 5
30
23
Project Life, Years 10 1
Degradation Factor Across Project Life, % 25 1
0.30 1
0.23 1
CO2 Emissions Reduction (1st year) (corresponding to heat rate improvement), % 0.30
CO2 Emissions Reduction (nth year) (corresponding to heat rate improvement), % 0.23
1,485 6
1,637 6
1,114 6
1,228 6
32 7
66 8
43 7
87 8
37
77
27
1433
1. Duke Energy Submittal, September 11, 2015.
5. Based on baseline net generation and ratio of baseline and future capacity factors.
6. Based on baseline CO2 emissions and capacity factor, future capacity factor, and CO2 emissions reductions percentage.
7. Based on total annual cost including fuel savings and CO2 emissions reductions from baseline.
8. Based on total annual cost excluding fuel savings and CO2 emissions reductions from baseline.
4. DAQ Spreadsheet on Fleetwide Calculations for Baseline and Future Years.
Heat Rate Reduction (Improvement) (average over project life), Btu/kw-hr
CO2 Emissions Reduction from Baseline (average over project life), Short ton/yr
Average Cost per Short Ton of CO2 Removed Across the Project Life (include fuel savings)
Average Cost per Short Ton of CO2 Removed Across the Project Life (exclude fuel savings)
2. EPA Air Pollution Control Cost Manual, Sixth Edition, January 2002; EPA/452/B-02-001
a. Section 1, Chapter 2, Paragraph 2.3.1 Elements of Total Capital Investment.
b. Section 1, Chapter 2, Paragraph 2.3.2: Elements of Total Annual Cost.3. Based on baseline net generation and net heat rate, ratio of baseline and future capacity factors, heat rate improvement, and future year (2019) average coal price included in "Annual Energy Outlook 2015", US EIA.
Cost per Short Ton of CO2 Removed (nth year of project life) (exclude fuel savings)
Heat Rate Reduction (Improvement) (1st year of project life), Btu/kw-hr
Heat Rate Reduction (Improvement) (nth year of project life), Btu/kw-hr
Heat Rate Improvement (1st year) from Baseline Net Heat Rate, %
Heat Rate Improvement (nth year) from Baseline Net Heat Rate, %
CO2 Emissions Reduction (1st year) from Baseline, Metric ton/yr
CO2 Emissions Reduction (nth year) from Baseline, Short ton/yr
CO2 Emissions Reduction (1st year) from Baseline, Metric ton/yr
CO2 Emissions Reduction (nth year) from Baseline, Metric ton/yr
Cost per Short Ton of CO2 Removed (1st year of project life) (include fuel savings)
Cost per Short Ton of CO2 Removed (1st year of project life) (exclude fuel savings)
Cost per Short Ton of CO2 Removed (nth year of project life) (include fuel savings)
Baseline (2012) Net Heat Rate, Btu/kw-hr
Annual Cost
Direct Annual Costs
Fixed & Variable Operation & Maintenance Cost
Fuel Savings
Total Direct Annual Costs (DAC)
Indirect Annual Costs
Project Life
Total Capital Recovery Costs (TCRC)
Total Indirect Annual Costs (IDAC)
Total Annual CostBaseline (2012) CO2 Emissions, metric ton/yr
Total Capital Investment (TCI)
Duke Energy Carolinas, LLCCliffside U5Annualized Cost and Cost Per Unit CO2 Reduction forIntelligent Sootblowers
CAPITAL COST
`
Equipment Cost
Total Direct Costs
Indirect Costs
Total Indirect Costs
Cliffside-Page 16 of 23
Attachment B B-41Attachment B B-41

NOTES REFERENCES
$375,889 A 1
$375,889 DC 2(a)
None
$0 IC 2(a)
$375,889 TCI = DC + IC 2(a)
$53,698 1
-$26,079 3
$27,619 2(b)
3 PL 1$125,296 TCRC = TCI/PL 2(b)
$125,296 IDAC = TCRC 2(b)
$152,915 TAC = DAC + IDAC 2(b)
1,081,426 4
10,164 4
Baseline (2012) Net Generation, MW-h 1,144,368 4
Baseline (2012) Annual Capacity Factor (heat input basis), % 21.84 4
Future (2019) Annual Capacity Factor (projected heat input basis), % 10.00 4
Future (2019) Net Generation, MW-h 523,978 5
20
5
Project Life, Years 3 1
Degradation Factor Across Project Life, % 75 1
0.20 1
0.05 1
CO2 Emissions Reduction (1st year) (corresponding to heat rate improvement), % 0.20
CO2 Emissions Reduction (nth year) (corresponding to heat rate improvement), % 0.05
990 6
1,092 6
248 6
273 6
140 7
164 8
560 7
656 8
350
410
13
682
1. Duke Energy Submittal, September 11, 2015.
5. Based on baseline net generation and ratio of baseline and future capacity factors.
6. Based on baseline CO2 emissions and capacity factor, future capacity factor, and CO2 emissions reductions percentage.
7. Based on total annual cost including fuel savings and CO2 emissions reductions from baseline.
8. Based on total annual cost excluding fuel savings and CO2 emissions reductions from baseline.
4. DAQ Spreadsheet on Fleetwide Calculations for Baseline and Future Years.
Heat Rate Reduction (Improvement) (average over project life), Btu/kw-hr
CO2 Emissions Reduction from Baseline (average over project life), Short ton/yr
Average Cost per Short Ton of CO2 Removed Across the Project Life (include fuel savings)
Average Cost per Short Ton of CO2 Removed Across the Project Life (exclude fuel savings)
2. EPA Air Pollution Control Cost Manual, Sixth Edition, January 2002; EPA/452/B-02-001
a. Section 1, Chapter 2, Paragraph 2.3.1 Elements of Total Capital Investment.
b. Section 1, Chapter 2, Paragraph 2.3.2: Elements of Total Annual Cost.3. Based on baseline net generation and net heat rate, ratio of baseline and future capacity factors, heat rate improvement, and future year (2019) average coal price included in "Annual Energy Outlook 2015", US EIA.
Cost per Short Ton of CO2 Removed (nth year of project life) (exclude fuel savings)
Heat Rate Reduction (Improvement) (1st year of project life), Btu/kw-hr
Heat Rate Reduction (Improvement) (nth year of project life), Btu/kw-hr
Heat Rate Improvement (1st year) from Baseline Net Heat Rate, %
Heat Rate Improvement (nth year) from Baseline Net Heat Rate, %
CO2 Emissions Reduction (1st year) from Baseline, Metric ton/yr
CO2 Emissions Reduction (nth year) from Baseline, Short ton/yr
CO2 Emissions Reduction (1st year) from Baseline, Metric ton/yr
CO2 Emissions Reduction (nth year) from Baseline, Metric ton/yr
Cost per Short Ton of CO2 Removed (1st year of project life) (include fuel savings)
Cost per Short Ton of CO2 Removed (1st year of project life) (exclude fuel savings)
Cost per Short Ton of CO2 Removed (nth year of project life) (include fuel savings)
Baseline (2012) Net Heat Rate, Btu/kw-hr
Annual Cost
Direct Annual Costs
Fixed & Variable Operation & Maintenance Cost
Fuel Savings
Total Direct Annual Costs (DAC)
Indirect Annual Costs
Project Life
Total Capital Recovery Costs (TCRC)
Total Indirect Annual Costs (IDAC)
Total Annual CostBaseline (2012) CO2 Emissions, metric ton/yr
Total Capital Investment (TCI)
Duke Energy Carolinas, LLCCliffside U5Annualized Cost and Cost Per Unit CO2 Reduction forAH Leakage Reduction
CAPITAL COST
`
Equipment Cost
Total Direct Costs
Indirect Costs
Total Indirect Costs
Cliffside-Page 17 of 23
Attachment B B-42Attachment B B-42

NOTES REFERENCES
$1,073,967 A 1
$1,073,967 DC 2(a)
None
$0 IC 2(a)
$1,073,967 TCI = DC + IC 2(a)
$80,548 1
-$54,767 3
$25,781 2(b)
10 PL 1$107,397 TCRC = TCI/PL 2(b)
$107,397 IDAC = TCRC 2(b)
$133,178 TAC = DAC + IDAC 2(b)
1,081,426 4
10,164 4
Baseline (2012) Net Generation, MW-h 1,144,368 4
Baseline (2012) Annual Capacity Factor (heat input basis), % 21.84 4
Future (2019) Annual Capacity Factor (projected heat input basis), % 10.00 4
Future (2019) Net Generation, MW-h 523,978 5
30
23
Project Life, Years 10 1
Degradation Factor Across Project Life, % 25 1
0.30 1
0.23 1
CO2 Emissions Reduction (1st year) (corresponding to heat rate improvement), % 0.30
CO2 Emissions Reduction (nth year) (corresponding to heat rate improvement), % 0.23
1,485 6
1,637 6
1,114 6
1,228 6
81 7
115 8
108 7
153 8
95
134
27
1433
1. Duke Energy Submittal, September 11, 2015.
5. Based on baseline net generation and ratio of baseline and future capacity factors.
6. Based on baseline CO2 emissions and capacity factor, future capacity factor, and CO2 emissions reductions percentage.
7. Based on total annual cost including fuel savings and CO2 emissions reductions from baseline.
8. Based on total annual cost excluding fuel savings and CO2 emissions reductions from baseline.
4. DAQ Spreadsheet on Fleetwide Calculations for Baseline and Future Years.
Heat Rate Reduction (Improvement) (average over project life), Btu/kw-hr
CO2 Emissions Reduction from Baseline (average over project life), Short ton/yr
Average Cost per Short Ton of CO2 Removed Across the Project Life (include fuel savings)
Average Cost per Short Ton of CO2 Removed Across the Project Life (exclude fuel savings)
2. EPA Air Pollution Control Cost Manual, Sixth Edition, January 2002; EPA/452/B-02-001
a. Section 1, Chapter 2, Paragraph 2.3.1 Elements of Total Capital Investment.
b. Section 1, Chapter 2, Paragraph 2.3.2: Elements of Total Annual Cost.3. Based on baseline net generation and net heat rate, ratio of baseline and future capacity factors, heat rate improvement, and future year (2019) average coal price included in "Annual Energy Outlook 2015", US EIA.
Cost per Short Ton of CO2 Removed (nth year of project life) (exclude fuel savings)
Heat Rate Reduction (Improvement) (1st year of project life), Btu/kw-hr
Heat Rate Reduction (Improvement) (nth year of project life), Btu/kw-hr
Heat Rate Improvement (1st year) from Baseline Net Heat Rate, %
Heat Rate Improvement (nth year) from Baseline Net Heat Rate, %
CO2 Emissions Reduction (1st year) from Baseline, Metric ton/yr
CO2 Emissions Reduction (nth year) from Baseline, Short ton/yr
CO2 Emissions Reduction (1st year) from Baseline, Metric ton/yr
CO2 Emissions Reduction (nth year) from Baseline, Metric ton/yr
Cost per Short Ton of CO2 Removed (1st year of project life) (include fuel savings)
Cost per Short Ton of CO2 Removed (1st year of project life) (exclude fuel savings)
Cost per Short Ton of CO2 Removed (nth year of project life) (include fuel savings)
Baseline (2012) Net Heat Rate, Btu/kw-hr
Annual Cost
Direct Annual Costs
Fixed & Variable Operation & Maintenance Cost
Fuel Savings
Total Direct Annual Costs (DAC)
Indirect Annual Costs
Project Life
Total Capital Recovery Costs (TCRC)
Total Indirect Annual Costs (IDAC)
Total Annual CostBaseline (2012) CO2 Emissions, metric ton/yr
Total Capital Investment (TCI)
Duke Energy Carolinas, LLCCliffside U5Annualized Cost and Cost Per Unit CO2 Reduction forCombustion Optimization - CCM / Excess Air / Neural Network
CAPITAL COST
`
Equipment Cost
Total Direct Costs
Indirect Costs
Total Indirect Costs
Cliffside-Page 18 of 23
Attachment B B-43Attachment B B-43

NOTES REFERENCES
$107,397 A 1
$107,397 DC 2(a)
None
$0 IC 2(a)
$107,397 TCI = DC + IC 2(a)
$805,476 1
-$636,460 3
$169,015 2(b)
8 PL 1$13,425 TCRC = TCI/PL 2(b)
$13,425 IDAC = TCRC 2(b)
$182,440 TAC = DAC + IDAC 2(b)
4,006,784 4
8,944 4
Baseline (2012) Net Generation, MW-h 4,813,190 4
Baseline (2012) Annual Capacity Factor (heat input basis), % 62.60 4
Future (2019) Annual Capacity Factor (projected heat input basis), % 54.00 4
Future (2019) Net Generation, MW-h 4,151,953 5
45
34
Project Life, Years 8 1
Degradation Factor Across Project Life, % 25 1
0.50 1
0.38 1
CO2 Emissions Reduction (1st year) (corresponding to heat rate improvement), % 0.50
CO2 Emissions Reduction (nth year) (corresponding to heat rate improvement), % 0.38
17,282 6
19,050 6
12,961 6
14,287 6
10 7
43 8
13 7
57 8
11
50
39
16669
1. Duke Energy Submittal, September 11, 2015.
5. Based on baseline net generation and ratio of baseline and future capacity factors.
6. Based on baseline CO2 emissions and capacity factor, future capacity factor, and CO2 emissions reductions percentage.
7. Based on total annual cost including fuel savings and CO2 emissions reductions from baseline.
8. Based on total annual cost excluding fuel savings and CO2 emissions reductions from baseline.
4. DAQ Spreadsheet on Fleetwide Calculations for Baseline and Future Years.
Heat Rate Reduction (Improvement) (average over project life), Btu/kw-hr
CO2 Emissions Reduction from Baseline (average over project life), Short ton/yr
Average Cost per Short Ton of CO2 Removed Across the Project Life (include fuel savings)
Average Cost per Short Ton of CO2 Removed Across the Project Life (exclude fuel savings)
2. EPA Air Pollution Control Cost Manual, Sixth Edition, January 2002; EPA/452/B-02-001
a. Section 1, Chapter 2, Paragraph 2.3.1 Elements of Total Capital Investment.
b. Section 1, Chapter 2, Paragraph 2.3.2: Elements of Total Annual Cost.3. Based on baseline net generation and net heat rate, ratio of baseline and future capacity factors, heat rate improvement, and future year (2019) average coal price included in "Annual Energy Outlook 2015", US EIA.
Cost per Short Ton of CO2 Removed (nth year of project life) (exclude fuel savings)
Heat Rate Reduction (Improvement) (1st year of project life), Btu/kw-hr
Heat Rate Reduction (Improvement) (nth year of project life), Btu/kw-hr
Heat Rate Improvement (1st year) from Baseline Net Heat Rate, %
Heat Rate Improvement (nth year) from Baseline Net Heat Rate, %
CO2 Emissions Reduction (1st year) from Baseline, Metric ton/yr
CO2 Emissions Reduction (nth year) from Baseline, Short ton/yr
CO2 Emissions Reduction (1st year) from Baseline, Metric ton/yr
CO2 Emissions Reduction (nth year) from Baseline, Metric ton/yr
Cost per Short Ton of CO2 Removed (1st year of project life) (include fuel savings)
Cost per Short Ton of CO2 Removed (1st year of project life) (exclude fuel savings)
Cost per Short Ton of CO2 Removed (nth year of project life) (include fuel savings)
Baseline (2012) Net Heat Rate, Btu/kw-hr
Annual Cost
Direct Annual Costs
Fixed & Variable Operation & Maintenance Cost
Fuel Savings
Total Direct Annual Costs (DAC)
Indirect Annual Costs
Project Life
Total Capital Recovery Costs (TCRC)
Total Indirect Annual Costs (IDAC)
Total Annual CostBaseline (2012) CO2 Emissions, metric ton/yr
Total Capital Investment (TCI)
Duke Energy Carolinas, LLCCliffside U6*Annualized Cost and Cost Per Unit CO2 Reduction forControllable Loss Reduction (Maintain Unit Efficiency)
CAPITAL COST
`
Equipment Cost
Total Direct Costs
Indirect Costs
Total Indirect Costs
Cliffside-Page 19 of 23
Attachment B B-44Attachment B B-44

NOTES REFERENCES
$5,369,837 A 1
$5,369,837 DC 2(a)
None
$0 IC 2(a)
$5,369,837 TCI = DC + IC 2(a)
$80,548 1
-$241,855 3
-$161,307 2(b)
20 PL 1$268,492 TCRC = TCI/PL 2(b)
$268,492 IDAC = TCRC 2(b)
$107,185 TAC = DAC + IDAC 2(b)
4,006,784 4
8,944 4
Baseline (2012) Net Generation, MW-h 4,813,190 4
Baseline (2012) Annual Capacity Factor (heat input basis), % 62.60 4
Future (2019) Annual Capacity Factor (projected heat input basis), % 54.00 4
Future (2019) Net Generation, MW-h 4,151,953 5
16
14
Project Life, Years 20 1
Degradation Factor Across Project Life, % 10 1
0.18 1
0.16 1
CO2 Emissions Reduction (1st year) (corresponding to heat rate improvement), % 0.18
CO2 Emissions Reduction (nth year) (corresponding to heat rate improvement), % 0.16
6,049 6
6,667 6
5,444 6
6,001 6
16 7
52 8
18 7
58 8
17
55
15
6334
1. Duke Energy Submittal, September 11, 2015.
5. Based on baseline net generation and ratio of baseline and future capacity factors.
6. Based on baseline CO2 emissions and capacity factor, future capacity factor, and CO2 emissions reductions percentage.
7. Based on total annual cost including fuel savings and CO2 emissions reductions from baseline.
8. Based on total annual cost excluding fuel savings and CO2 emissions reductions from baseline.
4. DAQ Spreadsheet on Fleetwide Calculations for Baseline and Future Years.
Heat Rate Reduction (Improvement) (average over project life), Btu/kw-hr
CO2 Emissions Reduction from Baseline (average over project life), Short ton/yr
Average Cost per Short Ton of CO2 Removed Across the Project Life (include fuel savings)
Average Cost per Short Ton of CO2 Removed Across the Project Life (exclude fuel savings)
2. EPA Air Pollution Control Cost Manual, Sixth Edition, January 2002; EPA/452/B-02-001
a. Section 1, Chapter 2, Paragraph 2.3.1 Elements of Total Capital Investment.
b. Section 1, Chapter 2, Paragraph 2.3.2: Elements of Total Annual Cost.3. Based on baseline net generation and net heat rate, ratio of baseline and future capacity factors, heat rate improvement, and future year (2019) average coal price included in "Annual Energy Outlook 2015", US EIA.
Cost per Short Ton of CO2 Removed (nth year of project life) (exclude fuel savings)
Heat Rate Reduction (Improvement) (1st year of project life), Btu/kw-hr
Heat Rate Reduction (Improvement) (nth year of project life), Btu/kw-hr
Heat Rate Improvement (1st year) from Baseline Net Heat Rate, %
Heat Rate Improvement (nth year) from Baseline Net Heat Rate, %
CO2 Emissions Reduction (1st year) from Baseline, Metric ton/yr
CO2 Emissions Reduction (nth year) from Baseline, Short ton/yr
CO2 Emissions Reduction (1st year) from Baseline, Metric ton/yr
CO2 Emissions Reduction (nth year) from Baseline, Metric ton/yr
Cost per Short Ton of CO2 Removed (1st year of project life) (include fuel savings)
Cost per Short Ton of CO2 Removed (1st year of project life) (exclude fuel savings)
Cost per Short Ton of CO2 Removed (nth year of project life) (include fuel savings)
Baseline (2012) Net Heat Rate, Btu/kw-hr
Annual Cost
Direct Annual Costs
Fixed & Variable Operation & Maintenance Cost
Fuel Savings
Total Direct Annual Costs (DAC)
Indirect Annual Costs
Project Life
Total Capital Recovery Costs (TCRC)
Total Indirect Annual Costs (IDAC)
Total Annual CostBaseline (2012) CO2 Emissions, metric ton/yr
Total Capital Investment (TCI)
Duke Energy Carolinas, LLCCliffside U6*Annualized Cost and Cost Per Unit CO2 Reduction forForced Draft Fan Variable Frequency Drive
CAPITAL COST
`
Equipment Cost
Total Direct Costs
Indirect Costs
Total Indirect Costs
Cliffside-Page 20 of 23
Attachment B B-45Attachment B B-45

NOTES REFERENCES
$536,984 A 1
$536,984 DC 2(a)
None
$0 IC 2(a)
$536,984 TCI = DC + IC 2(a)
$53,698 1
-$190,938 3
-$137,240 2(b)
10 PL 1$53,698 TCRC = TCI/PL 2(b)
$53,698 IDAC = TCRC 2(b)
-$83,541 TAC = DAC + IDAC 2(b)
4,006,784 4
8,944 4
Baseline (2012) Net Generation, MW-h 4,813,190 4
Baseline (2012) Annual Capacity Factor (heat input basis), % 62.60 4
Future (2019) Annual Capacity Factor (projected heat input basis), % 54.00 4
Future (2019) Net Generation, MW-h 4,151,953 5
13
10
Project Life, Years 10 1
Degradation Factor Across Project Life, % 25 1
0.15 1
0.11 1
CO2 Emissions Reduction (1st year) (corresponding to heat rate improvement), % 0.15
CO2 Emissions Reduction (nth year) (corresponding to heat rate improvement), % 0.11
5,184 6
5,715 6
3,888 6
4,286 6
-15 7
19 8
-19 7
25 8
-17
22
12
5001
1. Duke Energy Submittal, September 11, 2015.
5. Based on baseline net generation and ratio of baseline and future capacity factors.
6. Based on baseline CO2 emissions and capacity factor, future capacity factor, and CO2 emissions reductions percentage.
7. Based on total annual cost including fuel savings and CO2 emissions reductions from baseline.
8. Based on total annual cost excluding fuel savings and CO2 emissions reductions from baseline.
4. DAQ Spreadsheet on Fleetwide Calculations for Baseline and Future Years.
Heat Rate Reduction (Improvement) (average over project life), Btu/kw-hr
CO2 Emissions Reduction from Baseline (average over project life), Short ton/yr
Average Cost per Short Ton of CO2 Removed Across the Project Life (include fuel savings)
Average Cost per Short Ton of CO2 Removed Across the Project Life (exclude fuel savings)
2. EPA Air Pollution Control Cost Manual, Sixth Edition, January 2002; EPA/452/B-02-001
a. Section 1, Chapter 2, Paragraph 2.3.1 Elements of Total Capital Investment.
b. Section 1, Chapter 2, Paragraph 2.3.2: Elements of Total Annual Cost.3. Based on baseline net generation and net heat rate, ratio of baseline and future capacity factors, heat rate improvement, and future year (2019) average coal price included in "Annual Energy Outlook 2015", US EIA.
Cost per Short Ton of CO2 Removed (nth year of project life) (exclude fuel savings)
Heat Rate Reduction (Improvement) (1st year of project life), Btu/kw-hr
Heat Rate Reduction (Improvement) (nth year of project life), Btu/kw-hr
Heat Rate Improvement (1st year) from Baseline Net Heat Rate, %
Heat Rate Improvement (nth year) from Baseline Net Heat Rate, %
CO2 Emissions Reduction (1st year) from Baseline, Metric ton/yr
CO2 Emissions Reduction (nth year) from Baseline, Short ton/yr
CO2 Emissions Reduction (1st year) from Baseline, Metric ton/yr
CO2 Emissions Reduction (nth year) from Baseline, Metric ton/yr
Cost per Short Ton of CO2 Removed (1st year of project life) (include fuel savings)
Cost per Short Ton of CO2 Removed (1st year of project life) (exclude fuel savings)
Cost per Short Ton of CO2 Removed (nth year of project life) (include fuel savings)
Baseline (2012) Net Heat Rate, Btu/kw-hr
Annual Cost
Direct Annual Costs
Fixed & Variable Operation & Maintenance Cost
Fuel Savings
Total Direct Annual Costs (DAC)
Indirect Annual Costs
Project Life
Total Capital Recovery Costs (TCRC)
Total Indirect Annual Costs (IDAC)
Total Annual CostBaseline (2012) CO2 Emissions, metric ton/yr
Total Capital Investment (TCI)
Duke Energy Carolinas, LLCCliffside U6*Annualized Cost and Cost Per Unit CO2 Reduction forIntelligent Sootblowers
CAPITAL COST
`
Equipment Cost
Total Direct Costs
Indirect Costs
Total Indirect Costs
Cliffside-Page 21 of 23
Attachment B B-46Attachment B B-46

NOTES REFERENCES
$375,889 A 1
$375,889 DC 2(a)
None
$0 IC 2(a)
$375,889 TCI = DC + IC 2(a)
$53,698 1
-$181,846 3
-$128,147 2(b)
3 PL 1$125,296 TCRC = TCI/PL 2(b)
$125,296 IDAC = TCRC 2(b)
-$2,851 TAC = DAC + IDAC 2(b)
4,006,784 4
8,944 4
Baseline (2012) Net Generation, MW-h 4,813,190 4
Baseline (2012) Annual Capacity Factor (heat input basis), % 62.60 4
Future (2019) Annual Capacity Factor (projected heat input basis), % 54.00 4
Future (2019) Net Generation, MW-h 4,151,953 5
18
4
Project Life, Years 3 1
Degradation Factor Across Project Life, % 75 1
0.20 1
0.05 1
CO2 Emissions Reduction (1st year) (corresponding to heat rate improvement), % 0.20
CO2 Emissions Reduction (nth year) (corresponding to heat rate improvement), % 0.05
6,913 6
7,620 6
1,728 6
1,905 6
0 7
23 8
-1 7
94 8
-1
59
11
4762
1. Duke Energy Submittal, September 11, 2015.
5. Based on baseline net generation and ratio of baseline and future capacity factors.
6. Based on baseline CO2 emissions and capacity factor, future capacity factor, and CO2 emissions reductions percentage.
7. Based on total annual cost including fuel savings and CO2 emissions reductions from baseline.
8. Based on total annual cost excluding fuel savings and CO2 emissions reductions from baseline.
4. DAQ Spreadsheet on Fleetwide Calculations for Baseline and Future Years.
Heat Rate Reduction (Improvement) (average over project life), Btu/kw-hr
CO2 Emissions Reduction from Baseline (average over project life), Short ton/yr
Average Cost per Short Ton of CO2 Removed Across the Project Life (include fuel savings)
Average Cost per Short Ton of CO2 Removed Across the Project Life (exclude fuel savings)
2. EPA Air Pollution Control Cost Manual, Sixth Edition, January 2002; EPA/452/B-02-001
a. Section 1, Chapter 2, Paragraph 2.3.1 Elements of Total Capital Investment.
b. Section 1, Chapter 2, Paragraph 2.3.2: Elements of Total Annual Cost.3. Based on baseline net generation and net heat rate, ratio of baseline and future capacity factors, heat rate improvement, and future year (2019) average coal price included in "Annual Energy Outlook 2015", US EIA.
Cost per Short Ton of CO2 Removed (nth year of project life) (exclude fuel savings)
Heat Rate Reduction (Improvement) (1st year of project life), Btu/kw-hr
Heat Rate Reduction (Improvement) (nth year of project life), Btu/kw-hr
Heat Rate Improvement (1st year) from Baseline Net Heat Rate, %
Heat Rate Improvement (nth year) from Baseline Net Heat Rate, %
CO2 Emissions Reduction (1st year) from Baseline, Metric ton/yr
CO2 Emissions Reduction (nth year) from Baseline, Short ton/yr
CO2 Emissions Reduction (1st year) from Baseline, Metric ton/yr
CO2 Emissions Reduction (nth year) from Baseline, Metric ton/yr
Cost per Short Ton of CO2 Removed (1st year of project life) (include fuel savings)
Cost per Short Ton of CO2 Removed (1st year of project life) (exclude fuel savings)
Cost per Short Ton of CO2 Removed (nth year of project life) (include fuel savings)
Baseline (2012) Net Heat Rate, Btu/kw-hr
Annual Cost
Direct Annual Costs
Fixed & Variable Operation & Maintenance Cost
Fuel Savings
Total Direct Annual Costs (DAC)
Indirect Annual Costs
Project Life
Total Capital Recovery Costs (TCRC)
Total Indirect Annual Costs (IDAC)
Total Annual CostBaseline (2012) CO2 Emissions, metric ton/yr
Total Capital Investment (TCI)
Duke Energy Carolinas, LLCCliffside U6*Annualized Cost and Cost Per Unit CO2 Reduction forAH Leakage Reduction
CAPITAL COST
`
Equipment Cost
Total Direct Costs
Indirect Costs
Total Indirect Costs
Cliffside-Page 22 of 23
Attachment B B-47Attachment B B-47

NOTES REFERENCES
$1,073,967 A 1
$1,073,967 DC 2(a)
None
$0 IC 2(a)
$1,073,967 TCI = DC + IC 2(a)
$80,548 1
-$381,876 3
-$301,329 2(b)
10 PL 1$107,397 TCRC = TCI/PL 2(b)
$107,397 IDAC = TCRC 2(b)
-$193,932 TAC = DAC + IDAC 2(b)
4,006,784 4
8,944 4
Baseline (2012) Net Generation, MW-h 4,813,190 4
Baseline (2012) Annual Capacity Factor (heat input basis), % 62.60 4
Future (2019) Annual Capacity Factor (projected heat input basis), % 54.00 4
Future (2019) Net Generation, MW-h 4,151,953 5
27
20
Project Life, Years 10 1
Degradation Factor Across Project Life, % 25 1
0.30 1
0.23 1
CO2 Emissions Reduction (1st year) (corresponding to heat rate improvement), % 0.30
CO2 Emissions Reduction (nth year) (corresponding to heat rate improvement), % 0.23
10,369 6
11,430 6
7,777 6
8,572 6
-17 7
16 8
-23 7
22 8
-20
19
23
10001
1. Duke Energy Submittal, September 11, 2015.
5. Based on baseline net generation and ratio of baseline and future capacity factors.
6. Based on baseline CO2 emissions and capacity factor, future capacity factor, and CO2 emissions reductions percentage.
7. Based on total annual cost including fuel savings and CO2 emissions reductions from baseline.
8. Based on total annual cost excluding fuel savings and CO2 emissions reductions from baseline.
4. DAQ Spreadsheet on Fleetwide Calculations for Baseline and Future Years.
Heat Rate Reduction (Improvement) (average over project life), Btu/kw-hr
CO2 Emissions Reduction from Baseline (average over project life), Short ton/yr
Average Cost per Short Ton of CO2 Removed Across the Project Life (include fuel savings)
Average Cost per Short Ton of CO2 Removed Across the Project Life (exclude fuel savings)
2. EPA Air Pollution Control Cost Manual, Sixth Edition, January 2002; EPA/452/B-02-001
a. Section 1, Chapter 2, Paragraph 2.3.1 Elements of Total Capital Investment.
b. Section 1, Chapter 2, Paragraph 2.3.2: Elements of Total Annual Cost.3. Based on baseline net generation and net heat rate, ratio of baseline and future capacity factors, heat rate improvement, and future year (2019) average coal price included in "Annual Energy Outlook 2015", US EIA.
Cost per Short Ton of CO2 Removed (nth year of project life) (exclude fuel savings)
Heat Rate Reduction (Improvement) (1st year of project life), Btu/kw-hr
Heat Rate Reduction (Improvement) (nth year of project life), Btu/kw-hr
Heat Rate Improvement (1st year) from Baseline Net Heat Rate, %
Heat Rate Improvement (nth year) from Baseline Net Heat Rate, %
CO2 Emissions Reduction (1st year) from Baseline, Metric ton/yr
CO2 Emissions Reduction (nth year) from Baseline, Short ton/yr
CO2 Emissions Reduction (1st year) from Baseline, Metric ton/yr
CO2 Emissions Reduction (nth year) from Baseline, Metric ton/yr
Cost per Short Ton of CO2 Removed (1st year of project life) (include fuel savings)
Cost per Short Ton of CO2 Removed (1st year of project life) (exclude fuel savings)
Cost per Short Ton of CO2 Removed (nth year of project life) (include fuel savings)
Baseline (2012) Net Heat Rate, Btu/kw-hr
Annual Cost
Direct Annual Costs
Fixed & Variable Operation & Maintenance Cost
Fuel Savings
Total Direct Annual Costs (DAC)
Indirect Annual Costs
Project Life
Total Capital Recovery Costs (TCRC)
Total Indirect Annual Costs (IDAC)
Total Annual CostBaseline (2012) CO2 Emissions, metric ton/yr
Total Capital Investment (TCI)
Duke Energy Carolinas, LLCCliffside U6*Annualized Cost and Cost Per Unit CO2 Reduction forCombustion Optimization - CCM / Excess Air / Neural Network
CAPITAL COST
`
Equipment Cost
Total Direct Costs
Indirect Costs
Total Indirect Costs
Cliffside-Page 23 of 23
Attachment B B-48Attachment B B-48

1
North Carolina Department of Environmental Quality Division of Air Quality
Supporting Basis
Determination of Best System of Emissions Reduction for CO2 Emissions from Existing Electric Utility Generating Units
October 30, 2015
Facility Duke Energy Carolinas LLC, Allen Steam Station, Belmont, NC Facility ID: 3600039 Current Air Quality Permit No. 03757T40 Affected Electric Utility Generating Units (EGUs) One coal/No. 2 fuel oil-fired electric utility boiler equipped with a modified fuel burner system (low NOx concentric firing system) and separated over-fire air low NOx equipment (4,151 million Btu per hour heat input capacity, ID No. ES-4 (U4Boiler) [Unit 4]). Generator rated at 275 MW (nameplate capacity). One coal/No. 2 fuel oil-fired electric utility boiler equipped with a modified fuel burner system (low NOx concentric firing system), separated over-fire air, and lowered fired low NOx equipment (3,997 million Btu per hour heat input capacity, ID No. ES-5 (U5Boiler) [Unit 5]). Generator rated at 275 MW (nameplate capacity). Note: There are three other coal-fired EGUs (ID Nos. ES-1 (U1Boiler) [Unit 1], ES-2 (U2Boiler) [Unit 2], and ES-3 (U3Boiler) [Unit 3]) at this facility, but, they are scheduled to be shut down in 2023, and the DAQ determined that there are no measures that represent Best System of Emission Reduction for these EGUs.
1. Introduction The United States Environmental Protection Agency (EPA) has adopted Emission Guidelines for Greenhouse Gas Emissions and Compliance Times for Electric Utility Generating Units on August 3, 2015 and codified it in 40 CFR Subpart UUUU. The affected electric utility steam generating units (EGUs) under these emission guidelines (EG) are steam generating units, integrated gasification combined cycle units (IGCC), and stationary combined cycle or combined heat and power (CHP) combustion turbines that commenced construction on or before January 8, 2014. The EG includes uniform, nationwide emission standards, which are performance-based rates for emissions of greenhouse gases (GHG) expressed as CO2 (lb CO2/net MWh), as follows: Fossil fuel-fired steam generating units or IGCC: 1,534 lb CO2/net MWh (interim, average of
2022-2029), 1,305 lb CO2/net MWh (final, starting 2030)
GGAllen-Page 1 of 28
Attachment B B-49Attachment B B-49

2
Natural gas-fired stationary combined cycle combustion turbines (including CHP combustion turbines): 832 lb/net MWh (interim, average of 2022-2029), 771 lb/MWh (final, starting 2030)
In lieu of the above uniform rates, each EGU can comply with state-specific goal (lb CO2/net MWh). The other option is that all affected units in the state, in aggregate, comply with the mass-based state goal (short tons/yr). For North Carolina (NC), the rate-based interim and final goals are 1,311 lb CO2/net MWh and 1,136 lb CO2/net MWh, respectively. Similarly, NC’s mass-based interim and final goals are 56,986,025 short tons/yr and 51,266,234 short tons/yr, respectively. The above standards (whether uniform nationwide rates or state-specific goals) are based upon the determination of Best System of Emissions Reduction (BSER) consisting of following three building blocks: Building Block 1 (BB1) - reducing the carbon intensity of electricity generation by improving the
heat rate of existing coal-fired power plants.
Building Block 2 (BB2) - substituting increased electricity generation from lower-emitting existing natural gas plants for reduced generation from higher-emitting coal-fired power plants.
Building Block 3 (BB3) - substituting increased electricity generation from new zero-emitting
renewable energy sources (like wind and solar) for reduced generation from existing coal-fired and natural gas-fired power plants.
The EG requires that each state submit its plan complying with all applicable requirements by the deadline included therein. One of the requirements consists of development of an emission standard (“standard of performance”) and establishment of compliance time for each EGU. The Clean Air Act (CAA) §111(a)(1) defines “standard of performance” as “a standard for emissions of air pollutants which reflects the degree of emission limitation achievable through the application of the best system of emission reduction which (taking into account the cost of achieving such reduction and any nonair quality health and environmental impact and energy requirements) the Administrator determines has been adequately demonstrated”.
2. History of Development of Emission Guidelines under CAA Over the last 40 years, under §111(d), the EPA has regulated four pollutants from five source categories, by promulgating associated EG. These source categories are phosphate fertilizer plants (fluorides), sulfuric acid plants (acid mist), Kraft pulp plants (total reduced sulfur (TRS)), primary aluminum plants (fluorides), and municipal solid waste landfills (landfill gas emissions as non-methane organic compounds (NMOCs))1. The following general principles and/or rationales were used by EPA in establishing BSER for these EGs:
1 See Footnote 18 at 79 FR 41776, July 17, 2014, including ‘‘Phosphate Fertilizer Plants; Final Guideline Document Availability,’’ 42 FR 12022 (March 1, 1977); ‘‘Standards of Performance for New Stationary Sources; Emission Guideline for Sulfuric Acid Mist,’’ 42 FR 55796 (October 18, 1977); ‘‘Kraft Pulp Mills, Notice of Availability of Final Guideline Document,’’ 44 FR 29828 (May 22, 1979); ‘‘Primary Aluminum Plants; Availability of Final Guideline Document,’’ 45 FR 26294 (April 17, 1980); ‘‘Standards of Performance for New Stationary Sources and Guidelines for Control of Existing Sources: Municipal Solid Waste Landfills, Final Rule,’’ 61 FR 9905 (March 12, 1996).
GGAllen-Page 2 of 28
Attachment B B-50Attachment B B-50

3
The degree of emission reduction achievable through the application of various demonstrated
control technologies.
The technical feasibility of applying various demonstrated technologies to existing sources considering variability in sizes and designs.
The impact of various demonstrated technologies on national energy consumption, water pollution,
waste disposal, and ambient air concentrations of a designated pollutant.
The cost of adopting the emission guidelines, after considering control costs for various demonstrated technologies and taking into account the level of any existing controls.
Each of these EGs indicates that the cost of applying various control technologies can have a considerable impact in selection of a BSER for any designated pollutant for existing facilities. They also indicate that the age, size, type, class, and process design of the facility, influence not only the BSER selection process, but can also support a decision-making for whether different EGs are to be established for differing sizes, types, or classes of equipment. The EGs for the above referenced source categories have been established for principal points of emissions (point and fugitive emissions sources) located within the facility and, not for any emissions sources located outside of the facility. Finally, in these EGs, with respect to determining the EG, EPA has consistently recognized that not only the control technology needs to be demonstrated on existing sources, but the degree of emission reduction (performance level) needs to be readily achievable by the control technology.
3. The Division of Air Quality (DAQ)’s Approach for Determination of BSER The DAQ will consider the above general principles in determining BSER for CO2 emissions reduction from each EGU. But, importantly, DAQ will determine BSER for each EGU based upon BB1-type measures only (i.e., measures which can be accomplished within the fence-line of the facility), conforming to the §111(d) of the CAA and the requirements of 40 CFR 60 “Adoption and Submittal of State Plans for Designated Facilities”. Thus, DAQ’s approach will comprise of improving the operational efficiency of the EGUs in order to reduce CO2 emissions from the 2012 baseline levels. The DAQ’s BSER evaluation will specifically be based upon the following: type of EGU remaining useful life of the EGU unit’s baseline data (net heat rate, net generation, annual capacity factor, and CO2 emissions) unit’s projected future capacity factor feasibility of applying specific heat rate improvement (HRI) measure on a given unit whether the measure is adequately demonstrated degree of heat rate reduction potential for feasible HRI measures site-specific limitations associated costs (capital, fixed and variable operational and maintenance (O&M), and fuel savings) cost per ton of CO2 reduction
GGAllen-Page 3 of 28
Attachment B B-51Attachment B B-51

4
The evaluation is also based on literature review2 of technical feasibility for various HRI measures, degree of heat rate reduction potential, and costs data (capital, and fixed and variable O&M). It needs to be emphasized here that DAQ’s determination for each EGU will not be based upon some pre-determined HRI target, such as EPA’s selection of a 4.3% HRI potential for EGUs in the Eastern interconnection3, as discussed in the EG. The DAQ’s approach will include those adequately demonstrated, cost-effective measures that assure that the electricity is generated with lower CO2 emissions, thus improving public health and welfare. The selected HRI measures would be expected to produce non-air environmental co-benefits in the form of reduced water usage and solid waste production, in addition to, reductions in emissions of non-GHG pollutants such as SO2, NOx, and mercury. However, it should be noted that as the EGU becomes more cost-competitive due to HRIs, it may be dispatched more frequently and/or at higher loads. If the EGU is utilized more often, some increases in emissions of GHG (as CO2) and similarly, for non-GHG pollutants (such as SO2, NOx, or mercury) are possible, and those could partially offset the emissions reductions achieved through the HRI of the EGU. EPA has determined a cost estimate of $23 per ton4 reasonable for CO2 emissions reduction from EGUs under BB1 implementing HRI measures. EPA has further determined that this cost is reasonable because it achieves “an appropriate balance between cost and amount of reductions.”5 In addition, EPA has used another benchmark in the form of social cost of carbon (SC-CO2) at $40 per ton (2020) to $48 per ton (2030)6 to conclude that the above $23 per ton cost is reasonable. In determining a BSER for a particular EGU, DAQ will use the above cost effectiveness threshold of $23 per ton to determine reasonableness of cost and whether one or more technically feasible measure(s) can be implemented, as long as, collectively, the total cost does not exceed this threshold.
4. BSER Evaluation Duke Energy Carolinas, LLC, Allen Steam Station (DEC) has provided information through submittals of July 31 and September 11, 2015, to aid in DAQ’s efforts in determining BSER for CO2 emissions from Units 4 and 5. Additional information was provided through face-to-face meetings and email communication.
2 “Coal-fired Power Plant Heat Rate Reductions”, Final Report, Sargent & Lundy, Chicago, IL, January 22, 2009. “Analysis of Heat Rate Improvement Potential at Coal-Fired Power Plants”, US Energy Information Administration, Washington, DC, May 2015. S. Corellis, “Range and Applicability of Heat Rate Improvements”, Technical Update, Electric Power Research Institute, Palo Alto, CA, April 2014. 3 Applies to coal-fired EGUs only. 4 See page 446 of 1560 (pre-publication version), Carbon Pollution Emission Guidelines for Existing Stationary Sources: Electric Utility Generating Units Clean Power Plan, August 3, 2015. Based on nation-wide coal fleet capacity of 213 GW, heat rate improvement capital cost of $100/KW, capital charge rate of 14.3%, fleet-wide baseline net heat rate of 10,250 Btu/KWh, heat rate improvement of 4% for coal-fired EGUs, annual capacity factor of 78%, and future (2030) average coal delivered cost of $2.70 per million Btu. See page 2-65, Greenhouse Gas Mitigation Measures, Technical Support Document (TSD) for Carbon Pollution Guidelines for Existing Power Plants”, August 3, 2015. 5 See page 457 of 1560 (pre-publication version), Ibid. 6 See pages 458 and 459 of 1560 (pre-publication version), Ibid.
GGAllen-Page 4 of 28
Attachment B B-52Attachment B B-52

5
The submitted information consists of baseline data (net heat rate, net generation, generation-based annual capacity factor, and CO2 emissions) for 2012, projected heat input for future years such as 2019; and cost data (capital cost and annual O&M)7, project life, degradation factor and HRI potential for each of the following measures, for possible implementation on all EGUs of NC-based coal fleet: Controllable Loss Reduction (Maintain Unit Efficiency) [CLR] Sliding Pressure Operation [SPO] Lower FGD Efficiency (as SO2 permit limits allow) [LFGD] Intelligent Sootblowers [ISB] Air Heater Leakage Reduction [ALR] Combustion Optimization - CCM / Excess Air / Neural Network [CO] Online Condenser Cleaning [OCC] Induced and/or Booster Draft Fan Variable Frequency Drive [IBD] Air Heater Exit Gas Temperature Reduction [AHE] Flue Gas Desulfurization (FGD) Auxiliary Load Reduction through Variable Frequency Drives
[FGDA] Boiler Feed Pump Motor Driven Variable Frequency Drive [BFP] Induced Draft Fan Replacement [IDFR] Forced Draft Fan Variable Frequency Drive [FDF] Condenser Rebundle, Retubes, and Rebuilds [CRR] Electrostatic Precipitator (ESP) (Power management, T/R set upgrades) [ESP] Turbine Upgrades (HI, IP, LP) [TUR] Helper Cooling Tower [HCT] DEC has claimed the submitted information on cost, project life, and degradation factors, as “confidential”. The DAQ will treat this specific information (cost data and information on project life and the associated degradation factors) “confidential” until the Director decides that it is not confidential in accordance with NCAC 2Q .0107 “Confidential Information”. Thus, DAQ will not include such information in this document. In general, through these submittals, DEC characterizes the HRIs decreasing over time because the equipment associated with each measure degrades over time due to normal wear and tear, requiring recurrent implementation of HRI projects or measures. DEC further mentions that some of the efficiency projects cannot be performed or the full HRI benefits may not be realized due to unique configuration or physical limitation of a given EGU. In addition, DEC states that operation of any EGU at less than the full load or if cycled between full and partial load will adversely impact EGU’s heat rate. DEC also discusses reduced utilization of its coal-fired fleet in the recent history in response to lower natural gas prices, resulting in some of its coal-fired units, once operated as base-load units, now operating as intermediate duty cycling units. Finally, DEC adds that any post combustion environmental controls (activated carbon for mercury control, dry bottom and fly ash conversion for coal ash disposal, selective catalytic reduction for NOx control, and Zero Liquid Discharge (ZLD) for wastewater treatment) also adversely impact the heat rate of the EGU, in addition to any other environmental control which might be installed in future (any project implemented since its BSER submittal deadline date of July 31, 2015).
7 High level estimate in the range of -20% to +75% in 2015 $s.
GGAllen-Page 5 of 28
Attachment B B-53Attachment B B-53

6
With respect to the BSER evaluation, the DAQ has utilized the following data upon verifying or through calculations, for estimating heat rate reduction (Btu/kWh), CO2 emission reduction (short tons/yr), and cost per unit reduction of CO2 ($ per ton) for each measure:
Table 1: Allen Units 4 and 5 Unit No. 4 5
Baseline (2012) Net Generation (MWh)
777,282 386,992
Baseline (2012) Net Heat Rate (Btu/kWh)
10,578 11,053
Baseline (2012) CO2 Emissions (Tons/yr)
786,297 442,840
Baseline (2012) Annual Heat Inputs (million Btu)
8,222,089 4,277,423
Baseline (2012) Annual Capacity Factor (Heat Input Basis)
0.226 0.122
Future (2019) Projected Annual Capacity Factor (Heat Input Basis)
0.040 0.020
Future (2019) Projected Coal Delivered Cost ($ per million Btu)
3.92 3.92
Commencement of Operation Year
1960 1961
Planned Retirement Year 2028 2028
It needs to be clarified here that, for all NC-based EGUs, owned by Duke Energy (both under DEC and Duke Energy Progress (DEP)), DAQ used the actual coal delivered prices for 2014 and scaled them for 20198 to estimate the above coal delivered price of $3.92 per million Btu. The DAQ will adjust the 8 Duke Energy Carolinas The actual, average cost of fuel burned for 12 months ending December 2014 (Jan 2014-Dec 2014) was $3.84 per million Btu (See NCUC Docket No. E-7, Sub 1047, Duke Energy Carolinas, LLC Monthly Fuel Report, February 11, 2015). Duke Energy Progress The actual, average cost of coal burned for 12 months ending January 2015 (Feb 2014-Jan 2015) was $3.57 per million Btu (See NCUC Docket No. E-2, Sub 1064, Duke Energy Progress, INC. Monthly Fuel Report, March 12, 2015). Using the EIA (Annual Energy Outlook 2015) [www.eia.gov/beta/aeo/], Nationwide coal delivered prices were / projected to be: 2013 $2.50 per million Btu 2015 $2.41 per million Btu 2020 $2.54 per million Btu
GGAllen-Page 6 of 28
Attachment B B-54Attachment B B-54

7
capital and annual O&M costs estimates, provided by DEC in 2015 dollars, to 2019 dollars, using the growth factor of 1.8 percent compounded annually.9 For Units 4 and 5, DEC has determined that measures identified above as SPO, OCC, IDFR, CRR, and HCT, are either technically infeasible or each have very negligible HRI opportunity. In addition, DEC has reasoned that measure SPO increases electric grid reliability risks due to boiler tube or drum damage and unstable operation, and recommended that this measure be removed from BSER evaluation for all coal-fired EGUs (both DEC and DEP). Further, for Unit 4 and Unit 5, TUR and AHE measures, respectively, were accomplished prior to 2012 (baseline year). The DAQ agrees with DEC and deems the measures SPO, OCC, IDFR, CRR, and HCT, technically infeasible; and hence, will not include them in the BSER evaluation for Units 4 and 5. In addition, DAQ will not include any other measure in its evaluation, if there is any possibility of an increase in collateral emissions, such as measures FGD and ESP for Units 4 and 5. Thus, DAQ has evaluated the remaining measures (all except technically infeasible measures, measures implemented prior to 2012, measures implemented between 2012 and July 31, 2015, and measures which increase collateral emissions) for Units 4 and 5 using the methodology described below: First, using the project life (yr) for a given measure, DAQ has transformed capital investment ($) into an indirect annual (capital) cost ($ per yr) by simply dividing capital investment by the project life. Then, it added it to the direct annual (fixed O&M) cost to determine the total annual cost. Next, using the coal delivered price, baseline year (2012) generation and capacity factor, future capacity factor, and average HRI percent (calculated assuming the HRI for a given measure degrades linearly over the project life based on degradation factor); coal fuel savings have been estimated for 2019. Fuel savings due to improved heat rate have been deducted from the total annual cost to determine net annual cost for implementation of a measure. Then, using baseline CO2 emissions, baseline and future capacity factors, and average improvement of heat rate for the EGU (again assuming a decrease in HRI linearly over the measure’s life based on degradation factor) from baseline net heat rate, reduction in CO2 emissions associated with a given measure has been estimated.
By interpolation, nationwide coal delivered prices for 2014 and 2019 would be approximately $2.46 per million Btu and $2.51 per million, respectively; thus an increase of 2 percent of coal price was projected from 2014 to 2019. Applying this ratio to the DEC’s fleet, the average coal delivered price in 2019 would be 1.02 * $3.84 per million Btu = $3.92 per million Btu. Applying the same ratio to the DEP fleet, the average coal delivered price in 2019 would be 1.02 * $3.57 per million Btu = $3.64 per million Btu. Using the larger value from the above, for conservative calculations, for the entire fleet (both DEC and DEP), the 2019 coal delivered cost is projected to be $3.92 per million Btu. 9 See both GDP Chain-Type Price Index and Metals and Metal Products Indicator, Table A20. Macroeconomics Indicators, USEIA Annual Energy Outlook 2015.
GGAllen-Page 7 of 28
Attachment B B-55Attachment B B-55

8
Finally, cost per unit reduction in CO2 is simply estimated by taking net annual cost and dividing it by CO2 emissions, both determined as above. It needs to be emphasized that average HRI percent (calculated using degradation factor across the project life) and not the maximum HRI percent, has been applied to determine fuel savings and CO2 emissions reductions for a given measure. Table 2 below (one table for each unit) includes heat rate reduction (Btu/kWh), CO2 emission reduction (tons/yr), and cost per unit CO2 reduction ($ per ton) for each of the remaining measures for Units 4 and 5. Refer to the attached spreadsheet on calculations for annualized cost and cost per unit reduction of CO2 for each of the HRI measures included in Table 2. It needs to be stated here although the retirement age for each of the units has been estimated by DEC and available to DAQ, there is no need to adjust the above estimated costs, considering the remaining useful life (RUL) of each of the EGUs. Each BSER measure considered has a project life that is less than the RUL of the EGU. If implemented, all of the measures included in Table 2 would be expected to produce non-air environmental co-benefits in the form of reduced water usage and solid waste production, in addition to, reduced emissions of non-GHG pollutants such as SO2, NOx, and mercury. Moreover, adverse energy impacts would not be expected as well. However, comparing the above estimates with the reasonable cost threshold of $23 per ton, as discussed in Section 3 above, each of the estimated costs included in the table above for Units 4 and 5 can be considered “excessive”, “exorbitant” or “unreasonable”, as stated by EPA in the preamble to the final EG10. As shown in Table 1, Units 4 and 5 are projected to operate at a very low annual capacity factors. If any of the EGUs were to operate at a higher annual capacity factor, then, the cost per unit reduction of CO2 would be reduced. In summary, DAQ is determining the estimated costs in $ per ton for each of the measures for Units 4 and 5 unreasonable (using the cost threshold of $23 per ton CO2). Thus, considering cost, non-air environmental, and energy impacts, DAQ determines that none of the measures listed in Table 2is BSER for Units 4 or 5.
5. BSER for Allen Units 4 and 5 None.
10 Page 298 of 1560 (pre-publication version), Ibid.
GGAllen-Page 8 of 28
Attachment B B-56Attachment B B-56

9
Table 2: Allen Unit 4
Measure Heat Rate Reduction
Btu/kWh [Project Life
Average]
CO2 Emissions Reductions
tons per year [Project Life
Average]
Cost per Unit CO2 Reduction
$ per ton [Including Fuel
Savings]
Is Cost per Unit CO2 Reduction <= $23 per ton?
Controllable Loss Reduction (Maintain Unit Efficiency) [CLR]
46 609 1,332 N
Online Condenser Cleaning [OCC] -
Condenser Rebundle, Retubes, Rebuilds [CRR]
-
Turbine Upgrades (HP, IP, LP) [TUR] -
Helper Cooling Tower [HCT] -
Induced and/or Booster Draft Fan Variable Frequency Drive [IBD]
98 1,293 355 N
FGD Aux Load Reduction Through Variable Frequency Drives [FGDA]
3 40 2,404 N
Boiler Feed Pump Motor Driven Variable Frequency Drive [BFP]
25 330 1,263 N
Induced Draft Fan Replacement [IDFR] -
Forced Draft Fan Variable Frequency Drive [FDF]
49 644 502 N
Intelligent Sootblowers [ISB] 28 365 258 N
AH Leakage Reduction [ALR] 13 174 1,544 N
Combustion Optimization - CCM / Excess Air / Neural Network [CO]
28 365 484 N
AH Exit Gas Temperature Reduction [AHE]
28 365 1,609 N
Technically infeasible/no opportunity identified
Performed in or prior to baseline year 2012
Performed prior to July 2015 and after baseline year 2012
GGAllen-Page 9 of 28
Attachment B B-57Attachment B B-57

10
Table 2: Allen Unit 5
Measure Heat Rate Reduction
Btu/kWh [Project Life
Average]
CO2 Emissions Reductions
tons per year [Project Life
Average]
Cost per Unit CO2 Reduction
$ per ton [Including Fuel
Savings]
Is Cost per Unit CO2 Reduction
<= 23 $/ton?
Controllable Loss Reduction (Maintain Unit Efficiency) [CLR]
48 317 2,598 N
Online Condenser Cleaning [OCC] 0 0 0 -
Condenser Rebundle, Retubes, Rebuilds [CRR]
0 0 0 -
Turbine Upgrades (HP, IP, LP) [TUR] 104 679 4,386 N
Helper Cooling Tower [HCT] 0 0 0 -
Induced and/or Booster Draft Fan Variable Frequency Drive [IBD]
105 689 705 N
FGD Aux Load Reduction through Variable Frequency Drives [FGDA]
3 21 4,654 N
Boiler Feed Pump Motor Driven Variable Frequency Drive [BFP]
26 172 2,465 N
Induced Draft Fan Replacement [IDFR] 0 0 0 -
Forced Draft Fan Variable Frequency Drive [FDF]
53 344 979 N
Intelligent Sootblowers [ISB] 29 190 538 N
AH Leakage Reduction [ALR] 14 91 3,028 N
Combustion Optimization - CCM / Excess Air / Neural Network [CO]
29 190 970 N
AH Exit Gas Temperature Reduction [AHE]
-
Technically infeasible/no opportunity identified
Performed in or prior to baseline year 2012
Performed prior to July 2015 and after baseline year
GGAllen-Page 10 of 28
Attachment B B-58Attachment B B-58

NOTES REFERENCES
$107,397 A 1
$107,397 DC 2(a)
None
$0 IC 2(a)
$107,397 TCI = DC + IC 2(a)
$805,476 1
-$24,930 3
$780,545 2(b)
8 PL 1$13,425 TCRC = TCI/PL 2(b)
$13,425 IDAC = TCRC 2(b)
$793,970 TAC = DAC + IDAC 2(b)
713,324 4
10,578 4
Baseline (2012) Net Generation, MW-h 777,282 4
Baseline (2012) Annual Capacity Factor (heat input basis), % 22.61 4
Future (2019) Annual Capacity Factor (projected heat input basis), % 4.00 4
Future (2019) Net Generation, MW-h 137,511 5
53
40
Project Life, Years 8 1
Degradation Factor Across Project Life, % 25 1
0.50 1
0.38 1
CO2 Emissions Reduction (1st year) (corresponding to heat rate improvement), % 0.50
CO2 Emissions Reduction (nth year) (corresponding to heat rate improvement), % 0.38
631 6
696 6
473 6
522 6
1142 7
1177 8
1522 7
1570 8
1332
1374
46
609
1. Duke Energy Submittal, September 11, 2015.
5. Based on baseline net generation and ratio of baseline and future capacity factors.
6. Based on baseline CO2 emissions and capacity factor, future capacity factor, and CO2 emissions reductions percentage.
7. Based on total annual cost including fuel savings and CO2 emissions reductions from baseline.
8. Based on total annual cost excluding fuel savings and CO2 emissions reductions from baseline.
CO2 Emissions Reduction (nth year) from Baseline, Short ton/yr
Total Capital Investment (TCI)
Duke Energy Carolinas, LLCAllen U4Annualized Cost and Cost Per Unit CO2 Reduction forControllable Loss Reduction (Maintain Unit Efficiency)
CAPITAL COST
`
Equipment Cost
Total Direct Costs
Indirect Costs
Total Indirect Costs
Indirect Annual Costs
Project Life
Total Capital Recovery Costs (TCRC)
Annual Cost
Direct Annual Costs
Fixed & Variable Operation & Maintenance Cost
Fuel Savings
Total Direct Annual Costs (DAC)
Baseline (2012) Net Heat Rate, Btu/kw-hr
Baseline (2012) CO2 Emissions, metric ton/yr
CO2 Emissions Reduction (1st year) from Baseline, Short ton/yr
CO2 Emissions Reduction (nth year) from Baseline, Metric ton/yr
Total Indirect Annual Costs (IDAC)
Total Annual Cost
Heat Rate Reduction (Improvement) (1st year of project life), Btu/kw-hr
Heat Rate Reduction (Improvement) (nth year of project life), Btu/kw-hr
Heat Rate Improvement (1st year) from Baseline Net Heat Rate, %
Heat Rate Improvement (nth year) from Baseline Net Heat Rate, %
CO2 Emissions Reduction (1st year) from Baseline, Metric ton/yr
Cost per Short Ton of CO2 Removed (1st year of project life) (include fuel savings)
Cost per Short Ton of CO2 Removed (1st year of project life) (exclude fuel savings)
4. DAQ Spreadsheet on Fleetwide Calculations for Baseline and Future Years.
Heat Rate Reduction (Improvement) (average over project life), Btu/kw-hr
Cost per Short Ton of CO2 Removed (nth year of project life) (exclude fuel savings)
Cost per Short Ton of CO2 Removed (nth year of project life) (include fuel savings)
CO2 Emissions Reduction from Baseline (average over project life), Short ton/yr
Average Cost per Short Ton of CO2 Removed Across the Project Life (include fuel savings)
Average Cost per Short Ton of CO2 Removed Across the Project Life (exclude fuel savings)
2. EPA Air Pollution Control Cost Manual, Sixth Edition, January 2002; EPA/452/B-02-001
a. Section 1, Chapter 2, Paragraph 2.3.1 Elements of Total Capital Investment.
b. Section 1, Chapter 2, Paragraph 2.3.2: Elements of Total Annual Cost.3. Based on baseline net generation and net heat rate, ratio of baseline and future capacity factors, heat rate improvement, and future year (2019) average coal price included in "Annual Energy Outlook 2015", US EIA.
GGAllen-Page 11 of 28
Attachment B B-59Attachment B B-59

NOTES REFERENCES
$8,591,739 A 1
$8,591,739 DC 2(a)
None
$0 IC 2(a)
$8,591,739 TCI = DC + IC 2(a)
$80,548 1
-$52,950 3
$27,597 2(b)
20 PL 1$429,587 TCRC = TCI/PL 2(b)
$429,587 IDAC = TCRC 2(b)
$457,184 TAC = DAC + IDAC 2(b)
713,324 4
10,578 4
Baseline (2012) Net Generation, MW-h 777,282 4
Baseline (2012) Annual Capacity Factor (heat input basis), % 22.61 4
Future (2019) Annual Capacity Factor (projected heat input basis), % 4.00 4
Future (2019) Net Generation, MW-h 137,511 5
103
93
Project Life, Years 20 1
Degradation Factor Across Project Life, % 10 1
0.98 1
0.88 1
CO2 Emissions Reduction (1st year) (corresponding to heat rate improvement), % 0.98
CO2 Emissions Reduction (nth year) (corresponding to heat rate improvement), % 0.88
1,234 6
1,361 6
1,111 6
1,225 6
336 7
375 8
373 7
417 8
355
396
98
1293
1. Duke Energy Submittal, September 11, 2015.
5. Based on baseline net generation and ratio of baseline and future capacity factors.
6. Based on baseline CO2 emissions and capacity factor, future capacity factor, and CO2 emissions reductions percentage.
7. Based on total annual cost including fuel savings and CO2 emissions reductions from baseline.
8. Based on total annual cost excluding fuel savings and CO2 emissions reductions from baseline.
Total Capital Investment (TCI)
Duke Energy Carolinas, LLCAllen U4Annualized Cost and Cost Per Unit CO2 Reduction forInduced and/or booster Draft Fan Variable Frequency Drive
CAPITAL COST
`
Equipment Cost
Total Direct Costs
Indirect Costs
Total Indirect Costs
Baseline (2012) Net Heat Rate, Btu/kw-hr
Annual Cost
Direct Annual Costs
Fixed & Variable Operation & Maintenance Cost
Fuel Savings
Total Direct Annual Costs (DAC)
Indirect Annual Costs
Project Life
Total Capital Recovery Costs (TCRC)
Total Indirect Annual Costs (IDAC)
Total Annual CostBaseline (2012) CO2 Emissions, metric ton/yr
Cost per Short Ton of CO2 Removed (nth year of project life) (exclude fuel savings)
Heat Rate Reduction (Improvement) (1st year of project life), Btu/kw-hr
Heat Rate Reduction (Improvement) (nth year of project life), Btu/kw-hr
Heat Rate Improvement (1st year) from Baseline Net Heat Rate, %
Heat Rate Improvement (nth year) from Baseline Net Heat Rate, %
CO2 Emissions Reduction (1st year) from Baseline, Metric ton/yr
CO2 Emissions Reduction (1st year) from Baseline, Short ton/yr
CO2 Emissions Reduction (nth year) from Baseline, Metric ton/yr
CO2 Emissions Reduction (nth year) from Baseline, Short ton/yr
Cost per Short Ton of CO2 Removed (1st year of project life) (include fuel savings)
Cost per Short Ton of CO2 Removed (1st year of project life) (exclude fuel savings)
Cost per Short Ton of CO2 Removed (nth year of project life) (include fuel savings)
4. DAQ Spreadsheet on Fleetwide Calculations for Baseline and Future Years.
Heat Rate Reduction (Improvement) (average over project life), Btu/kw-hr
CO2 Emissions Reduction from Baseline (average over project life), Short ton/yr
Average Cost per Short Ton of CO2 Removed Across the Project Life (include fuel savings)
Average Cost per Short Ton of CO2 Removed Across the Project Life (exclude fuel savings)
2. EPA Air Pollution Control Cost Manual, Sixth Edition, January 2002; EPA/452/B-02-001
a. Section 1, Chapter 2, Paragraph 2.3.1 Elements of Total Capital Investment.
b. Section 1, Chapter 2, Paragraph 2.3.2: Elements of Total Annual Cost.3. Based on baseline net generation and net heat rate, ratio of baseline and future capacity factors, heat rate improvement, and future year (2019) average coal price included in "Annual Energy Outlook 2015", US EIA.
GGAllen-Page 12 of 28
Attachment B B-60Attachment B B-60

NOTES REFERENCES
$429,587 A 1
$429,587 DC 2(a)
None
$0 IC 2(a)
$429,587 TCI = DC + IC 2(a)
$53,698 1
-$1,624 3
$52,074 2(b)
10 PL 1$42,959 TCRC = TCI/PL 2(b)
$42,959 IDAC = TCRC 2(b)
$95,033 TAC = DAC + IDAC 2(b)
713,324 4
10,578 4
Baseline (2012) Net Generation, MW-h 777,282 4
Baseline (2012) Annual Capacity Factor (heat input basis), % 22.61 4
Future (2019) Annual Capacity Factor (projected heat input basis), % 4.00 4
Future (2019) Net Generation, MW-h 137,511 5
3
3
Project Life, Years 10 1
Degradation Factor Across Project Life, % 10 1
0.03 1
0.03 1
CO2 Emissions Reduction (1st year) (corresponding to heat rate improvement), % 0.03
CO2 Emissions Reduction (nth year) (corresponding to heat rate improvement), % 0.03
38 6
42 6
34 6
38 6
2277 7
2316 8
2530 7
2573 8
2404
2445
3
40
1. Duke Energy Submittal, September 11, 2015.
5. Based on baseline net generation and ratio of baseline and future capacity factors.
6. Based on baseline CO2 emissions and capacity factor, future capacity factor, and CO2 emissions reductions percentage.
7. Based on total annual cost including fuel savings and CO2 emissions reductions from baseline.
8. Based on total annual cost excluding fuel savings and CO2 emissions reductions from baseline.
Total Capital Investment (TCI)
Duke Energy Carolinas, LLCAllen U4Annualized Cost and Cost Per Unit CO2 Reduction forFGD Aux Load reduction through Variable Frequency Drives
CAPITAL COST
`
Equipment Cost
Total Direct Costs
Indirect Costs
Total Indirect Costs
Baseline (2012) Net Heat Rate, Btu/kw-hr
Annual Cost
Direct Annual Costs
Fixed & Variable Operation & Maintenance Cost
Fuel Savings
Total Direct Annual Costs (DAC)
Indirect Annual Costs
Project Life
Total Capital Recovery Costs (TCRC)
Total Indirect Annual Costs (IDAC)
Total Annual CostBaseline (2012) CO2 Emissions, metric ton/yr
Cost per Short Ton of CO2 Removed (nth year of project life) (exclude fuel savings)
Heat Rate Reduction (Improvement) (1st year of project life), Btu/kw-hr
Heat Rate Reduction (Improvement) (nth year of project life), Btu/kw-hr
Heat Rate Improvement (1st year) from Baseline Net Heat Rate, %
Heat Rate Improvement (nth year) from Baseline Net Heat Rate, %
CO2 Emissions Reduction (1st year) from Baseline, Metric ton/yr
CO2 Emissions Reduction (1st year) from Baseline, Short ton/yr
CO2 Emissions Reduction (nth year) from Baseline, Metric ton/yr
CO2 Emissions Reduction (nth year) from Baseline, Short ton/yr
Cost per Short Ton of CO2 Removed (1st year of project life) (include fuel savings)
Cost per Short Ton of CO2 Removed (1st year of project life) (exclude fuel savings)
Cost per Short Ton of CO2 Removed (nth year of project life) (include fuel savings)
4. DAQ Spreadsheet on Fleetwide Calculations for Baseline and Future Years.
Heat Rate Reduction (Improvement) (average over project life), Btu/kw-hr
CO2 Emissions Reduction from Baseline (average over project life), Short ton/yr
Average Cost per Short Ton of CO2 Removed Across the Project Life (include fuel savings)
Average Cost per Short Ton of CO2 Removed Across the Project Life (exclude fuel savings)
2. EPA Air Pollution Control Cost Manual, Sixth Edition, January 2002; EPA/452/B-02-001
a. Section 1, Chapter 2, Paragraph 2.3.1 Elements of Total Capital Investment.
b. Section 1, Chapter 2, Paragraph 2.3.2: Elements of Total Annual Cost.3. Based on baseline net generation and net heat rate, ratio of baseline and future capacity factors, heat rate improvement, and future year (2019) average coal price included in "Annual Energy Outlook 2015", US EIA.
GGAllen-Page 13 of 28
Attachment B B-61Attachment B B-61

NOTES REFERENCES
$3,758,886 A 1
$3,758,886 DC 2(a)
None
$0 IC 2(a)
$3,758,886 TCI = DC + IC 2(a)
$53,698 1
-$13,534 3
$40,165 2(b)
10 PL 1$375,889 TCRC = TCI/PL 2(b)
$375,889 IDAC = TCRC 2(b)
$416,053 TAC = DAC + IDAC 2(b)
713,324 4
10,578 4
Baseline (2012) Net Generation, MW-h 777,282 4
Baseline (2012) Annual Capacity Factor (heat input basis), % 22.61 4
Future (2019) Annual Capacity Factor (projected heat input basis), % 4.00 4
Future (2019) Net Generation, MW-h 137,511 5
26
24
Project Life, Years 10 1
Degradation Factor Across Project Life, % 10 1
0.25 1
0.23 1
CO2 Emissions Reduction (1st year) (corresponding to heat rate improvement), % 0.25
CO2 Emissions Reduction (nth year) (corresponding to heat rate improvement), % 0.23
315 6
348 6
284 6
313 6
1196 7
1235 8
1329 7
1373 8
1263
1304
25
330
1. Duke Energy Submittal, September 11, 2015.
5. Based on baseline net generation and ratio of baseline and future capacity factors.
6. Based on baseline CO2 emissions and capacity factor, future capacity factor, and CO2 emissions reductions percentage.
7. Based on total annual cost including fuel savings and CO2 emissions reductions from baseline.
8. Based on total annual cost excluding fuel savings and CO2 emissions reductions from baseline.
Total Capital Investment (TCI)
Duke Energy Carolinas, LLCAllen U4Annualized Cost and Cost Per Unit CO2 Reduction forBoiler Feed Pump Motor Driven Variable Frequency Drive
CAPITAL COST
`
Equipment Cost
Total Direct Costs
Indirect Costs
Total Indirect Costs
Baseline (2012) Net Heat Rate, Btu/kw-hr
Annual Cost
Direct Annual Costs
Fixed & Variable Operation & Maintenance Cost
Fuel Savings
Total Direct Annual Costs (DAC)
Indirect Annual Costs
Project Life
Total Capital Recovery Costs (TCRC)
Total Indirect Annual Costs (IDAC)
Total Annual CostBaseline (2012) CO2 Emissions, metric ton/yr
Cost per Short Ton of CO2 Removed (nth year of project life) (exclude fuel savings)
Heat Rate Reduction (Improvement) (1st year of project life), Btu/kw-hr
Heat Rate Reduction (Improvement) (nth year of project life), Btu/kw-hr
Heat Rate Improvement (1st year) from Baseline Net Heat Rate, %
Heat Rate Improvement (nth year) from Baseline Net Heat Rate, %
CO2 Emissions Reduction (1st year) from Baseline, Metric ton/yr
CO2 Emissions Reduction (1st year) from Baseline, Short ton/yr
CO2 Emissions Reduction (nth year) from Baseline, Metric ton/yr
CO2 Emissions Reduction (nth year) from Baseline, Short ton/yr
Cost per Short Ton of CO2 Removed (1st year of project life) (include fuel savings)
Cost per Short Ton of CO2 Removed (1st year of project life) (exclude fuel savings)
Cost per Short Ton of CO2 Removed (nth year of project life) (include fuel savings)
4. DAQ Spreadsheet on Fleetwide Calculations for Baseline and Future Years.
Heat Rate Reduction (Improvement) (average over project life), Btu/kw-hr
CO2 Emissions Reduction from Baseline (average over project life), Short ton/yr
Average Cost per Short Ton of CO2 Removed Across the Project Life (include fuel savings)
Average Cost per Short Ton of CO2 Removed Across the Project Life (exclude fuel savings)
2. EPA Air Pollution Control Cost Manual, Sixth Edition, January 2002; EPA/452/B-02-001
a. Section 1, Chapter 2, Paragraph 2.3.1 Elements of Total Capital Investment.
b. Section 1, Chapter 2, Paragraph 2.3.2: Elements of Total Annual Cost.3. Based on baseline net generation and net heat rate, ratio of baseline and future capacity factors, heat rate improvement, and future year (2019) average coal price included in "Annual Energy Outlook 2015", US EIA.
GGAllen-Page 14 of 28
Attachment B B-62Attachment B B-62

NOTES REFERENCES
$5,369,837 A 1
$5,369,837 DC 2(a)
None
$0 IC 2(a)
$5,369,837 TCI = DC + IC 2(a)
$80,548 1
-$26,391 3
$54,157 2(b)
20 PL 1$268,492 TCRC = TCI/PL 2(b)
$268,492 IDAC = TCRC 2(b)
$322,649 TAC = DAC + IDAC 2(b)
713,324 4
10,578 4
Baseline (2012) Net Generation, MW-h 777,282 4
Baseline (2012) Annual Capacity Factor (heat input basis), % 22.61 4
Future (2019) Annual Capacity Factor (projected heat input basis), % 4.00 4
Future (2019) Net Generation, MW-h 137,511 5
52
46
Project Life, Years 20 1
Degradation Factor Across Project Life, % 10 1
0.49 1
0.44 1
CO2 Emissions Reduction (1st year) (corresponding to heat rate improvement), % 0.49
CO2 Emissions Reduction (nth year) (corresponding to heat rate improvement), % 0.44
615 6
678 6
554 6
610 6
476 7
515 8
529 7
572 8
502
543
49
644
1. Duke Energy Submittal, September 11, 2015.
5. Based on baseline net generation and ratio of baseline and future capacity factors.
6. Based on baseline CO2 emissions and capacity factor, future capacity factor, and CO2 emissions reductions percentage.
7. Based on total annual cost including fuel savings and CO2 emissions reductions from baseline.
8. Based on total annual cost excluding fuel savings and CO2 emissions reductions from baseline.
Total Capital Investment (TCI)
Duke Energy Carolinas, LLCAllen U4Annualized Cost and Cost Per Unit CO2 Reduction forForced Draft Fan Variable Frequency Drive
CAPITAL COST
`
Equipment Cost
Total Direct Costs
Indirect Costs
Total Indirect Costs
Baseline (2012) Net Heat Rate, Btu/kw-hr
Annual Cost
Direct Annual Costs
Fixed & Variable Operation & Maintenance Cost
Fuel Savings
Total Direct Annual Costs (DAC)
Indirect Annual Costs
Project Life
Total Capital Recovery Costs (TCRC)
Total Indirect Annual Costs (IDAC)
Total Annual CostBaseline (2012) CO2 Emissions, metric ton/yr
Cost per Short Ton of CO2 Removed (nth year of project life) (exclude fuel savings)
Heat Rate Reduction (Improvement) (1st year of project life), Btu/kw-hr
Heat Rate Reduction (Improvement) (nth year of project life), Btu/kw-hr
Heat Rate Improvement (1st year) from Baseline Net Heat Rate, %
Heat Rate Improvement (nth year) from Baseline Net Heat Rate, %
CO2 Emissions Reduction (1st year) from Baseline, Metric ton/yr
CO2 Emissions Reduction (1st year) from Baseline, Short ton/yr
CO2 Emissions Reduction (nth year) from Baseline, Metric ton/yr
CO2 Emissions Reduction (nth year) from Baseline, Short ton/yr
Cost per Short Ton of CO2 Removed (1st year of project life) (include fuel savings)
Cost per Short Ton of CO2 Removed (1st year of project life) (exclude fuel savings)
Cost per Short Ton of CO2 Removed (nth year of project life) (include fuel savings)
4. DAQ Spreadsheet on Fleetwide Calculations for Baseline and Future Years.
Heat Rate Reduction (Improvement) (average over project life), Btu/kw-hr
CO2 Emissions Reduction from Baseline (average over project life), Short ton/yr
Average Cost per Short Ton of CO2 Removed Across the Project Life (include fuel savings)
Average Cost per Short Ton of CO2 Removed Across the Project Life (exclude fuel savings)
2. EPA Air Pollution Control Cost Manual, Sixth Edition, January 2002; EPA/452/B-02-001
a. Section 1, Chapter 2, Paragraph 2.3.1 Elements of Total Capital Investment.
b. Section 1, Chapter 2, Paragraph 2.3.2: Elements of Total Annual Cost.3. Based on baseline net generation and net heat rate, ratio of baseline and future capacity factors, heat rate improvement, and future year (2019) average coal price included in "Annual Energy Outlook 2015", US EIA.
GGAllen-Page 15 of 28
Attachment B B-63Attachment B B-63

NOTES REFERENCES
$536,984 A 1
$536,984 DC 2(a)
None
$0 IC 2(a)
$536,984 TCI = DC + IC 2(a)
$53,698 1
-$14,958 3
$38,740 2(b)
10 PL 1$53,698 TCRC = TCI/PL 2(b)
$53,698 IDAC = TCRC 2(b)
$92,439 TAC = DAC + IDAC 2(b)
713,324 4
10,578 4
Baseline (2012) Net Generation, MW-h 777,282 4
Baseline (2012) Annual Capacity Factor (heat input basis), % 22.61 4
Future (2019) Annual Capacity Factor (projected heat input basis), % 4.00 4
Future (2019) Net Generation, MW-h 137,511 5
32
24
Project Life, Years 10 1
Degradation Factor Across Project Life, % 25 1
0.30 1
0.23 1
CO2 Emissions Reduction (1st year) (corresponding to heat rate improvement), % 0.30
CO2 Emissions Reduction (nth year) (corresponding to heat rate improvement), % 0.23
379 6
417 6
284 6
313 6
222 7
257 8
295 7
343 8
258
300
28
365
1. Duke Energy Submittal, September 11, 2015.
5. Based on baseline net generation and ratio of baseline and future capacity factors.
6. Based on baseline CO2 emissions and capacity factor, future capacity factor, and CO2 emissions reductions percentage.
7. Based on total annual cost including fuel savings and CO2 emissions reductions from baseline.
8. Based on total annual cost excluding fuel savings and CO2 emissions reductions from baseline.
Total Capital Investment (TCI)
Duke Energy Carolinas, LLCAllen U4Annualized Cost and Cost Per Unit CO2 Reduction forIntelligent Sootblowers
CAPITAL COST
`
Equipment Cost
Total Direct Costs
Indirect Costs
Total Indirect Costs
Baseline (2012) Net Heat Rate, Btu/kw-hr
Annual Cost
Direct Annual Costs
Fixed & Variable Operation & Maintenance Cost
Fuel Savings
Total Direct Annual Costs (DAC)
Indirect Annual Costs
Project Life
Total Capital Recovery Costs (TCRC)
Total Indirect Annual Costs (IDAC)
Total Annual CostBaseline (2012) CO2 Emissions, metric ton/yr
Cost per Short Ton of CO2 Removed (nth year of project life) (exclude fuel savings)
Heat Rate Reduction (Improvement) (1st year of project life), Btu/kw-hr
Heat Rate Reduction (Improvement) (nth year of project life), Btu/kw-hr
Heat Rate Improvement (1st year) from Baseline Net Heat Rate, %
Heat Rate Improvement (nth year) from Baseline Net Heat Rate, %
CO2 Emissions Reduction (1st year) from Baseline, Metric ton/yr
CO2 Emissions Reduction (1st year) from Baseline, Short ton/yr
CO2 Emissions Reduction (nth year) from Baseline, Metric ton/yr
CO2 Emissions Reduction (nth year) from Baseline, Short ton/yr
Cost per Short Ton of CO2 Removed (1st year of project life) (include fuel savings)
Cost per Short Ton of CO2 Removed (1st year of project life) (exclude fuel savings)
Cost per Short Ton of CO2 Removed (nth year of project life) (include fuel savings)
4. DAQ Spreadsheet on Fleetwide Calculations for Baseline and Future Years.
Heat Rate Reduction (Improvement) (average over project life), Btu/kw-hr
CO2 Emissions Reduction from Baseline (average over project life), Short ton/yr
Average Cost per Short Ton of CO2 Removed Across the Project Life (include fuel savings)
Average Cost per Short Ton of CO2 Removed Across the Project Life (exclude fuel savings)
2. EPA Air Pollution Control Cost Manual, Sixth Edition, January 2002; EPA/452/B-02-001
a. Section 1, Chapter 2, Paragraph 2.3.1 Elements of Total Capital Investment.
b. Section 1, Chapter 2, Paragraph 2.3.2: Elements of Total Annual Cost.3. Based on baseline net generation and net heat rate, ratio of baseline and future capacity factors, heat rate improvement, and future year (2019) average coal price included in "Annual Energy Outlook 2015", US EIA.
GGAllen-Page 16 of 28
Attachment B B-64Attachment B B-64

NOTES REFERENCES
$375,889 A 1
$375,889 DC 2(a)
None
$0 IC 2(a)
$375,889 TCI = DC + IC 2(a)
$53,698 1
-$7,123 3
$46,575 2(b)
3 PL 1$125,296 TCRC = TCI/PL 2(b)
$125,296 IDAC = TCRC 2(b)
$171,872 TAC = DAC + IDAC 2(b)
713,324 4
10,578 4
Baseline (2012) Net Generation, MW-h 777,282 4
Baseline (2012) Annual Capacity Factor (heat input basis), % 22.61 4
Future (2019) Annual Capacity Factor (projected heat input basis), % 4.00 4
Future (2019) Net Generation, MW-h 137,511 5
21
5
Project Life, Years 3 1
Degradation Factor Across Project Life, % 75 1
0.20 1
0.05 1
CO2 Emissions Reduction (1st year) (corresponding to heat rate improvement), % 0.20
CO2 Emissions Reduction (nth year) (corresponding to heat rate improvement), % 0.05
252 6
278 6
63 6
70 6
618 7
643 8
2471 7
2573 8
1544
1608
13
174
1. Duke Energy Submittal, September 11, 2015.
5. Based on baseline net generation and ratio of baseline and future capacity factors.
6. Based on baseline CO2 emissions and capacity factor, future capacity factor, and CO2 emissions reductions percentage.
7. Based on total annual cost including fuel savings and CO2 emissions reductions from baseline.
8. Based on total annual cost excluding fuel savings and CO2 emissions reductions from baseline.
Total Capital Investment (TCI)
Duke Energy Carolinas, LLCAllen U4Annualized Cost and Cost Per Unit CO2 Reduction forAH Leakage Reduction
CAPITAL COST
`
Equipment Cost
Total Direct Costs
Indirect Costs
Total Indirect Costs
Baseline (2012) Net Heat Rate, Btu/kw-hr
Annual Cost
Direct Annual Costs
Fixed & Variable Operation & Maintenance Cost
Fuel Savings
Total Direct Annual Costs (DAC)
Indirect Annual Costs
Project Life
Total Capital Recovery Costs (TCRC)
Total Indirect Annual Costs (IDAC)
Total Annual CostBaseline (2012) CO2 Emissions, metric ton/yr
Cost per Short Ton of CO2 Removed (nth year of project life) (exclude fuel savings)
Heat Rate Reduction (Improvement) (1st year of project life), Btu/kw-hr
Heat Rate Reduction (Improvement) (nth year of project life), Btu/kw-hr
Heat Rate Improvement (1st year) from Baseline Net Heat Rate, %
Heat Rate Improvement (nth year) from Baseline Net Heat Rate, %
CO2 Emissions Reduction (1st year) from Baseline, Metric ton/yr
CO2 Emissions Reduction (1st year) from Baseline, Short ton/yr
CO2 Emissions Reduction (nth year) from Baseline, Metric ton/yr
CO2 Emissions Reduction (nth year) from Baseline, Short ton/yr
Cost per Short Ton of CO2 Removed (1st year of project life) (include fuel savings)
Cost per Short Ton of CO2 Removed (1st year of project life) (exclude fuel savings)
Cost per Short Ton of CO2 Removed (nth year of project life) (include fuel savings)
4. DAQ Spreadsheet on Fleetwide Calculations for Baseline and Future Years.
Heat Rate Reduction (Improvement) (average over project life), Btu/kw-hr
CO2 Emissions Reduction from Baseline (average over project life), Short ton/yr
Average Cost per Short Ton of CO2 Removed Across the Project Life (include fuel savings)
Average Cost per Short Ton of CO2 Removed Across the Project Life (exclude fuel savings)
2. EPA Air Pollution Control Cost Manual, Sixth Edition, January 2002; EPA/452/B-02-001
a. Section 1, Chapter 2, Paragraph 2.3.1 Elements of Total Capital Investment.
b. Section 1, Chapter 2, Paragraph 2.3.2: Elements of Total Annual Cost.3. Based on baseline net generation and net heat rate, ratio of baseline and future capacity factors, heat rate improvement, and future year (2019) average coal price included in "Annual Energy Outlook 2015", US EIA.
GGAllen-Page 17 of 28
Attachment B B-65Attachment B B-65

NOTES REFERENCES
$1,073,967 A 1
$1,073,967 DC 2(a)
None
$0 IC 2(a)
$1,073,967 TCI = DC + IC 2(a)
$80,548 1
-$14,958 3
$65,589 2(b)
10 PL 1$107,397 TCRC = TCI/PL 2(b)
$107,397 IDAC = TCRC 2(b)
$172,986 TAC = DAC + IDAC 2(b)
713,324 4
10,578 4
Baseline (2012) Net Generation, MW-h 777,282 4
Baseline (2012) Annual Capacity Factor (heat input basis), % 22.61 4
Future (2019) Annual Capacity Factor (projected heat input basis), % 4.00 4
Future (2019) Net Generation, MW-h 137,511 5
32
24
Project Life, Years 10 1
Degradation Factor Across Project Life, % 25 1
0.30 1
0.23 1
CO2 Emissions Reduction (1st year) (corresponding to heat rate improvement), % 0.30
CO2 Emissions Reduction (nth year) (corresponding to heat rate improvement), % 0.23
379 6
417 6
284 6
313 6
415 7
450 8
553 7
600 8
484
525
28
365
1. Duke Energy Submittal, September 11, 2015.
5. Based on baseline net generation and ratio of baseline and future capacity factors.
6. Based on baseline CO2 emissions and capacity factor, future capacity factor, and CO2 emissions reductions percentage.
7. Based on total annual cost including fuel savings and CO2 emissions reductions from baseline.
8. Based on total annual cost excluding fuel savings and CO2 emissions reductions from baseline.
Total Capital Investment (TCI)
Duke Energy Carolinas, LLCAllen U4Annualized Cost and Cost Per Unit CO2 Reduction forCombustion Optimization - CCM / Excess Air / Neural Network
CAPITAL COST
`
Equipment Cost
Total Direct Costs
Indirect Costs
Total Indirect Costs
Baseline (2012) Net Heat Rate, Btu/kw-hr
Annual Cost
Direct Annual Costs
Fixed & Variable Operation & Maintenance Cost
Fuel Savings
Total Direct Annual Costs (DAC)
Indirect Annual Costs
Project Life
Total Capital Recovery Costs (TCRC)
Total Indirect Annual Costs (IDAC)
Total Annual CostBaseline (2012) CO2 Emissions, metric ton/yr
Cost per Short Ton of CO2 Removed (nth year of project life) (exclude fuel savings)
Heat Rate Reduction (Improvement) (1st year of project life), Btu/kw-hr
Heat Rate Reduction (Improvement) (nth year of project life), Btu/kw-hr
Heat Rate Improvement (1st year) from Baseline Net Heat Rate, %
Heat Rate Improvement (nth year) from Baseline Net Heat Rate, %
CO2 Emissions Reduction (1st year) from Baseline, Metric ton/yr
CO2 Emissions Reduction (1st year) from Baseline, Short ton/yr
CO2 Emissions Reduction (nth year) from Baseline, Metric ton/yr
CO2 Emissions Reduction (nth year) from Baseline, Short ton/yr
Cost per Short Ton of CO2 Removed (1st year of project life) (include fuel savings)
Cost per Short Ton of CO2 Removed (1st year of project life) (exclude fuel savings)
Cost per Short Ton of CO2 Removed (nth year of project life) (include fuel savings)
4. DAQ Spreadsheet on Fleetwide Calculations for Baseline and Future Years.
Heat Rate Reduction (Improvement) (average over project life), Btu/kw-hr
CO2 Emissions Reduction from Baseline (average over project life), Short ton/yr
Average Cost per Short Ton of CO2 Removed Across the Project Life (include fuel savings)
Average Cost per Short Ton of CO2 Removed Across the Project Life (exclude fuel savings)
2. EPA Air Pollution Control Cost Manual, Sixth Edition, January 2002; EPA/452/B-02-001
a. Section 1, Chapter 2, Paragraph 2.3.1 Elements of Total Capital Investment.
b. Section 1, Chapter 2, Paragraph 2.3.2: Elements of Total Annual Cost.3. Based on baseline net generation and net heat rate, ratio of baseline and future capacity factors, heat rate improvement, and future year (2019) average coal price included in "Annual Energy Outlook 2015", US EIA.
GGAllen-Page 18 of 28
Attachment B B-66Attachment B B-66

NOTES REFERENCES
$3,758,886 A 1
$3,758,886 DC 2(a)
None
$0 IC 2(a)
$3,758,886 TCI = DC + IC 2(a)
$53,698 1
-$14,958 3
$38,740 2(b)
7 PL 1$536,984 TCRC = TCI/PL 2(b)
$536,984 IDAC = TCRC 2(b)
$575,724 TAC = DAC + IDAC 2(b)
713,324 4
10,578 4
Baseline (2012) Net Generation, MW-h 777,282 4
Baseline (2012) Annual Capacity Factor (heat input basis), % 22.61 4
Future (2019) Annual Capacity Factor (projected heat input basis), % 4.00 4
Future (2019) Net Generation, MW-h 137,511 5
32
24
Project Life, Years 7 1
Degradation Factor Across Project Life, % 25 1
0.30 1
0.23 1
CO2 Emissions Reduction (1st year) (corresponding to heat rate improvement), % 0.30
CO2 Emissions Reduction (nth year) (corresponding to heat rate improvement), % 0.23
379 6
417 6
284 6
313 6
1380 7
1415 8
1839 7
1887 8
1609
1651
28
365
1. Duke Energy Submittal, September 11, 2015.
5. Based on baseline net generation and ratio of baseline and future capacity factors.
6. Based on baseline CO2 emissions and capacity factor, future capacity factor, and CO2 emissions reductions percentage.
7. Based on total annual cost including fuel savings and CO2 emissions reductions from baseline.
8. Based on total annual cost excluding fuel savings and CO2 emissions reductions from baseline.
Total Capital Investment (TCI)
Duke Energy Carolinas, LLCAllen U4Annualized Cost and Cost Per Unit CO2 Reduction forAH Exit Gas Temperature Reduction
CAPITAL COST
`
Equipment Cost
Total Direct Costs
Indirect Costs
Total Indirect Costs
Baseline (2012) Net Heat Rate, Btu/kw-hr
Annual Cost
Direct Annual Costs
Fixed & Variable Operation & Maintenance Cost
Fuel Savings
Total Direct Annual Costs (DAC)
Indirect Annual Costs
Project Life
Total Capital Recovery Costs (TCRC)
Total Indirect Annual Costs (IDAC)
Total Annual CostBaseline (2012) CO2 Emissions, metric ton/yr
Cost per Short Ton of CO2 Removed (nth year of project life) (exclude fuel savings)
Heat Rate Reduction (Improvement) (1st year of project life), Btu/kw-hr
Heat Rate Reduction (Improvement) (nth year of project life), Btu/kw-hr
Heat Rate Improvement (1st year) from Baseline Net Heat Rate, %
Heat Rate Improvement (nth year) from Baseline Net Heat Rate, %
CO2 Emissions Reduction (1st year) from Baseline, Metric ton/yr
CO2 Emissions Reduction (1st year) from Baseline, Short ton/yr
CO2 Emissions Reduction (nth year) from Baseline, Metric ton/yr
CO2 Emissions Reduction (nth year) from Baseline, Short ton/yr
Cost per Short Ton of CO2 Removed (1st year of project life) (include fuel savings)
Cost per Short Ton of CO2 Removed (1st year of project life) (exclude fuel savings)
Cost per Short Ton of CO2 Removed (nth year of project life) (include fuel savings)
4. DAQ Spreadsheet on Fleetwide Calculations for Baseline and Future Years.
Heat Rate Reduction (Improvement) (average over project life), Btu/kw-hr
CO2 Emissions Reduction from Baseline (average over project life), Short ton/yr
Average Cost per Short Ton of CO2 Removed Across the Project Life (include fuel savings)
Average Cost per Short Ton of CO2 Removed Across the Project Life (exclude fuel savings)
2. EPA Air Pollution Control Cost Manual, Sixth Edition, January 2002; EPA/452/B-02-001
a. Section 1, Chapter 2, Paragraph 2.3.1 Elements of Total Capital Investment.
b. Section 1, Chapter 2, Paragraph 2.3.2: Elements of Total Annual Cost.3. Based on baseline net generation and net heat rate, ratio of baseline and future capacity factors, heat rate improvement, and future year (2019) average coal price included in "Annual Energy Outlook 2015", US EIA.
GGAllen-Page 19 of 28
Attachment B B-67Attachment B B-67

NOTES REFERENCES
$107,397 A 1
$107,397 DC 2(a)
None
$0 IC 2(a)
$107,397 TCI = DC + IC 2(a)
$805,476 1
-$11,999 3
$793,477 2(b)
8 PL 1$13,425 TCRC = TCI/PL 2(b)
$13,425 IDAC = TCRC 2(b)
$806,902 TAC = DAC + IDAC 2(b)
401,742 4
11,053 4
Baseline (2012) Net Generation, MW-h 386,992 4
Baseline (2012) Annual Capacity Factor (heat input basis), % 12.22 4
Future (2019) Annual Capacity Factor (projected heat input basis), % 2.00 4
Future (2019) Net Generation, MW-h 63,337 5
55
41
Project Life, Years 8 1
Degradation Factor Across Project Life, % 25 1
0.50 1
0.38 1
CO2 Emissions Reduction (1st year) (corresponding to heat rate improvement), % 0.50
CO2 Emissions Reduction (nth year) (corresponding to heat rate improvement), % 0.38
329 6
362 6
247 6
272 6
2227 7
2260 8
2969 7
3013 8
2598
2636
48
317
1. Duke Energy Submittal, September 11, 2015.
5. Based on baseline net generation and ratio of baseline and future capacity factors.
6. Based on baseline CO2 emissions and capacity factor, future capacity factor, and CO2 emissions reductions percentage.
7. Based on total annual cost including fuel savings and CO2 emissions reductions from baseline.
8. Based on total annual cost excluding fuel savings and CO2 emissions reductions from baseline.
Total Capital Investment (TCI)
Duke Energy Carolinas, LLCAllen U5Annualized Cost and Cost Per Unit CO2 Reduction forControllable Loss Reduction (Maintain Unit Efficiency)
CAPITAL COST
`
Equipment Cost
Total Direct Costs
Indirect Costs
Total Indirect Costs
Baseline (2012) Net Heat Rate, Btu/kw-hr
Annual Cost
Direct Annual Costs
Fixed & Variable Operation & Maintenance Cost
Fuel Savings
Total Direct Annual Costs (DAC)
Indirect Annual Costs
Project Life
Total Capital Recovery Costs (TCRC)
Total Indirect Annual Costs (IDAC)
Total Annual CostBaseline (2012) CO2 Emissions, metric ton/yr
Cost per Short Ton of CO2 Removed (nth year of project life) (exclude fuel savings)
Heat Rate Reduction (Improvement) (1st year of project life), Btu/kw-hr
Heat Rate Reduction (Improvement) (nth year of project life), Btu/kw-hr
Heat Rate Improvement (1st year) from Baseline Net Heat Rate, %
Heat Rate Improvement (nth year) from Baseline Net Heat Rate, %
CO2 Emissions Reduction (1st year) from Baseline, Metric ton/yr
CO2 Emissions Reduction (1st year) from Baseline, Short ton/yr
CO2 Emissions Reduction (nth year) from Baseline, Metric ton/yr
CO2 Emissions Reduction (nth year) from Baseline, Short ton/yr
Cost per Short Ton of CO2 Removed (1st year of project life) (include fuel savings)
Cost per Short Ton of CO2 Removed (1st year of project life) (exclude fuel savings)
Cost per Short Ton of CO2 Removed (nth year of project life) (include fuel savings)
4. DAQ Spreadsheet on Fleetwide Calculations for Baseline and Future Years.
Heat Rate Reduction (Improvement) (average over project life), Btu/kw-hr
CO2 Emissions Reduction from Baseline (average over project life), Short ton/yr
Average Cost per Short Ton of CO2 Removed Across the Project Life (include fuel savings)
Average Cost per Short Ton of CO2 Removed Across the Project Life (exclude fuel savings)
2. EPA Air Pollution Control Cost Manual, Sixth Edition, January 2002; EPA/452/B-02-001
a. Section 1, Chapter 2, Paragraph 2.3.1 Elements of Total Capital Investment.
b. Section 1, Chapter 2, Paragraph 2.3.2: Elements of Total Annual Cost.3. Based on baseline net generation and net heat rate, ratio of baseline and future capacity factors, heat rate improvement, and future year (2019) average coal price included in "Annual Energy Outlook 2015", US EIA.
GGAllen-Page 20 of 28
Attachment B B-68Attachment B B-68

NOTES REFERENCES
$37,588,860 A 1
$37,588,860 DC 2(a)
None
$0 IC 2(a)
$37,588,860 TCI = DC + IC 2(a)
$53,698 1
-$25,711 3
$27,987 2(b)
20 PL 1$1,879,443 TCRC = TCI/PL 2(b)
$1,879,443 IDAC = TCRC 2(b)
$1,907,430 TAC = DAC + IDAC 2(b)
401,742 4
11,053 4
Baseline (2012) Net Generation, MW-h 386,992 4
Baseline (2012) Annual Capacity Factor (heat input basis), % 12.22 4
Future (2019) Annual Capacity Factor (projected heat input basis), % 2.00 4
Future (2019) Net Generation, MW-h 63,337 5
166
41
Project Life, Years 20 1
Degradation Factor Across Project Life, % 75 1
1.50 1
0.38 1
CO2 Emissions Reduction (1st year) (corresponding to heat rate improvement), % 1.50
CO2 Emissions Reduction (nth year) (corresponding to heat rate improvement), % 0.38
986 6
1,087 6
247 6
272 6
1754 7
1778 8
7018 7
7112 8
4386
4445
104
679
1. Duke Energy Submittal, September 11, 2015.
5. Based on baseline net generation and ratio of baseline and future capacity factors.
6. Based on baseline CO2 emissions and capacity factor, future capacity factor, and CO2 emissions reductions percentage.
7. Based on total annual cost including fuel savings and CO2 emissions reductions from baseline.
8. Based on total annual cost excluding fuel savings and CO2 emissions reductions from baseline.
Total Capital Investment (TCI)
Duke Energy Carolinas, LLCAllen U5Annualized Cost and Cost Per Unit CO2 Reduction forTurbine Upgrades (HP, IP, LP)
CAPITAL COST
`
Equipment Cost
Total Direct Costs
Indirect Costs
Total Indirect Costs
Baseline (2012) Net Heat Rate, Btu/kw-hr
Annual Cost
Direct Annual Costs
Fixed & Variable Operation & Maintenance Cost
Fuel Savings
Total Direct Annual Costs (DAC)
Indirect Annual Costs
Project Life
Total Capital Recovery Costs (TCRC)
Total Indirect Annual Costs (IDAC)
Total Annual CostBaseline (2012) CO2 Emissions, metric ton/yr
Cost per Short Ton of CO2 Removed (nth year of project life) (exclude fuel savings)
Heat Rate Reduction (Improvement) (1st year of project life), Btu/kw-hr
Heat Rate Reduction (Improvement) (nth year of project life), Btu/kw-hr
Heat Rate Improvement (1st year) from Baseline Net Heat Rate, %
Heat Rate Improvement (nth year) from Baseline Net Heat Rate, %
CO2 Emissions Reduction (1st year) from Baseline, Metric ton/yr
CO2 Emissions Reduction (1st year) from Baseline, Short ton/yr
CO2 Emissions Reduction (nth year) from Baseline, Metric ton/yr
CO2 Emissions Reduction (nth year) from Baseline, Short ton/yr
Cost per Short Ton of CO2 Removed (1st year of project life) (include fuel savings)
Cost per Short Ton of CO2 Removed (1st year of project life) (exclude fuel savings)
Cost per Short Ton of CO2 Removed (nth year of project life) (include fuel savings)
4. DAQ Spreadsheet on Fleetwide Calculations for Baseline and Future Years.
Heat Rate Reduction (Improvement) (average over project life), Btu/kw-hr
CO2 Emissions Reduction from Baseline (average over project life), Short ton/yr
Average Cost per Short Ton of CO2 Removed Across the Project Life (include fuel savings)
Average Cost per Short Ton of CO2 Removed Across the Project Life (exclude fuel savings)
2. EPA Air Pollution Control Cost Manual, Sixth Edition, January 2002; EPA/452/B-02-001
a. Section 1, Chapter 2, Paragraph 2.3.1 Elements of Total Capital Investment.
b. Section 1, Chapter 2, Paragraph 2.3.2: Elements of Total Annual Cost.3. Based on baseline net generation and net heat rate, ratio of baseline and future capacity factors, heat rate improvement, and future year (2019) average coal price included in "Annual Energy Outlook 2015", US EIA.
GGAllen-Page 21 of 28
Attachment B B-69Attachment B B-69
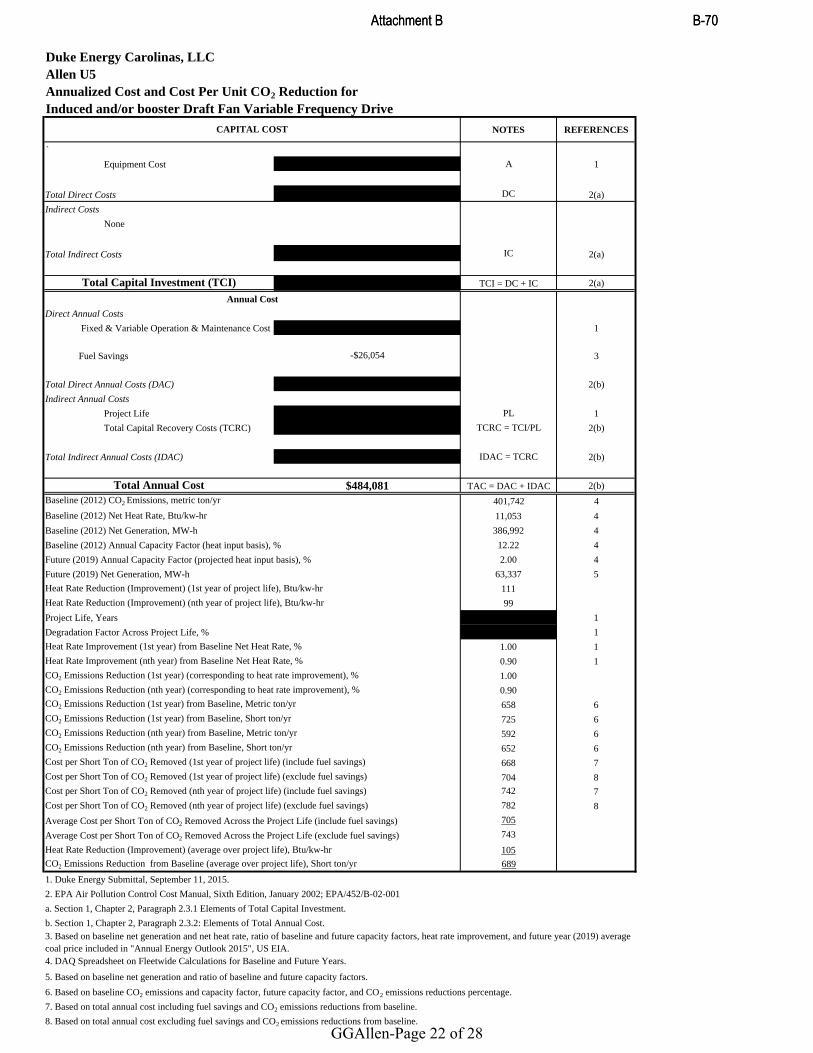
NOTES REFERENCES
$8,591,739 A 1
$8,591,739 DC 2(a)
None
$0 IC 2(a)
$8,591,739 TCI = DC + IC 2(a)
$80,548 1
-$26,054 3
$54,494 2(b)
20 PL 1$429,587 TCRC = TCI/PL 2(b)
$429,587 IDAC = TCRC 2(b)
$484,081 TAC = DAC + IDAC 2(b)
401,742 4
11,053 4
Baseline (2012) Net Generation, MW-h 386,992 4
Baseline (2012) Annual Capacity Factor (heat input basis), % 12.22 4
Future (2019) Annual Capacity Factor (projected heat input basis), % 2.00 4
Future (2019) Net Generation, MW-h 63,337 5
111
99
Project Life, Years 20 1
Degradation Factor Across Project Life, % 10 1
1.00 1
0.90 1
CO2 Emissions Reduction (1st year) (corresponding to heat rate improvement), % 1.00
CO2 Emissions Reduction (nth year) (corresponding to heat rate improvement), % 0.90
658 6
725 6
592 6
652 6
668 7
704 8
742 7
782 8
705
743
105
689
1. Duke Energy Submittal, September 11, 2015.
5. Based on baseline net generation and ratio of baseline and future capacity factors.
6. Based on baseline CO2 emissions and capacity factor, future capacity factor, and CO2 emissions reductions percentage.
7. Based on total annual cost including fuel savings and CO2 emissions reductions from baseline.
8. Based on total annual cost excluding fuel savings and CO2 emissions reductions from baseline.
Total Capital Investment (TCI)
Duke Energy Carolinas, LLCAllen U5Annualized Cost and Cost Per Unit CO2 Reduction forInduced and/or booster Draft Fan Variable Frequency Drive
CAPITAL COST
`
Equipment Cost
Total Direct Costs
Indirect Costs
Total Indirect Costs
Baseline (2012) Net Heat Rate, Btu/kw-hr
Annual Cost
Direct Annual Costs
Fixed & Variable Operation & Maintenance Cost
Fuel Savings
Total Direct Annual Costs (DAC)
Indirect Annual Costs
Project Life
Total Capital Recovery Costs (TCRC)
Total Indirect Annual Costs (IDAC)
Total Annual CostBaseline (2012) CO2 Emissions, metric ton/yr
Cost per Short Ton of CO2 Removed (nth year of project life) (exclude fuel savings)
Heat Rate Reduction (Improvement) (1st year of project life), Btu/kw-hr
Heat Rate Reduction (Improvement) (nth year of project life), Btu/kw-hr
Heat Rate Improvement (1st year) from Baseline Net Heat Rate, %
Heat Rate Improvement (nth year) from Baseline Net Heat Rate, %
CO2 Emissions Reduction (1st year) from Baseline, Metric ton/yr
CO2 Emissions Reduction (1st year) from Baseline, Short ton/yr
CO2 Emissions Reduction (nth year) from Baseline, Metric ton/yr
CO2 Emissions Reduction (nth year) from Baseline, Short ton/yr
Cost per Short Ton of CO2 Removed (1st year of project life) (include fuel savings)
Cost per Short Ton of CO2 Removed (1st year of project life) (exclude fuel savings)
Cost per Short Ton of CO2 Removed (nth year of project life) (include fuel savings)
4. DAQ Spreadsheet on Fleetwide Calculations for Baseline and Future Years.
Heat Rate Reduction (Improvement) (average over project life), Btu/kw-hr
CO2 Emissions Reduction from Baseline (average over project life), Short ton/yr
Average Cost per Short Ton of CO2 Removed Across the Project Life (include fuel savings)
Average Cost per Short Ton of CO2 Removed Across the Project Life (exclude fuel savings)
2. EPA Air Pollution Control Cost Manual, Sixth Edition, January 2002; EPA/452/B-02-001
a. Section 1, Chapter 2, Paragraph 2.3.1 Elements of Total Capital Investment.
b. Section 1, Chapter 2, Paragraph 2.3.2: Elements of Total Annual Cost.3. Based on baseline net generation and net heat rate, ratio of baseline and future capacity factors, heat rate improvement, and future year (2019) average coal price included in "Annual Energy Outlook 2015", US EIA.
GGAllen-Page 22 of 28
Attachment B B-70Attachment B B-70

NOTES REFERENCES
$429,587 A 1
$429,587 DC 2(a)
None
$0 IC 2(a)
$429,587 TCI = DC + IC 2(a)
$53,698 1
-$782 3
$52,917 2(b)
10 PL 1$42,959 TCRC = TCI/PL 2(b)
$42,959 IDAC = TCRC 2(b)
$95,875 TAC = DAC + IDAC 2(b)
401,742 4
11,053 4
Baseline (2012) Net Generation, MW-h 386,992 4
Baseline (2012) Annual Capacity Factor (heat input basis), % 12.22 4
Future (2019) Annual Capacity Factor (projected heat input basis), % 2.00 4
Future (2019) Net Generation, MW-h 63,337 5
3
3
Project Life, Years 10 1
Degradation Factor Across Project Life, % 10 1
0.03 1
0.03 1
CO2 Emissions Reduction (1st year) (corresponding to heat rate improvement), % 0.03
CO2 Emissions Reduction (nth year) (corresponding to heat rate improvement), % 0.03
20 6
22 6
18 6
20 6
4409 7
4445 8
4899 7
4939 8
4654
4692
3
21
1. Duke Energy Submittal, September 11, 2015.
5. Based on baseline net generation and ratio of baseline and future capacity factors.
6. Based on baseline CO2 emissions and capacity factor, future capacity factor, and CO2 emissions reductions percentage.
7. Based on total annual cost including fuel savings and CO2 emissions reductions from baseline.
8. Based on total annual cost excluding fuel savings and CO2 emissions reductions from baseline.
Total Capital Investment (TCI)
Duke Energy Carolinas, LLCAllen U5Annualized Cost and Cost Per Unit CO2 Reduction forFGD Aux Load reduction through Variable Frequency Drives
CAPITAL COST
`
Equipment Cost
Total Direct Costs
Indirect Costs
Total Indirect Costs
Baseline (2012) Net Heat Rate, Btu/kw-hr
Annual Cost
Direct Annual Costs
Fixed & Variable Operation & Maintenance Cost
Fuel Savings
Total Direct Annual Costs (DAC)
Indirect Annual Costs
Project Life
Total Capital Recovery Costs (TCRC)
Total Indirect Annual Costs (IDAC)
Total Annual CostBaseline (2012) CO2 Emissions, metric ton/yr
Cost per Short Ton of CO2 Removed (nth year of project life) (exclude fuel savings)
Heat Rate Reduction (Improvement) (1st year of project life), Btu/kw-hr
Heat Rate Reduction (Improvement) (nth year of project life), Btu/kw-hr
Heat Rate Improvement (1st year) from Baseline Net Heat Rate, %
Heat Rate Improvement (nth year) from Baseline Net Heat Rate, %
CO2 Emissions Reduction (1st year) from Baseline, Metric ton/yr
CO2 Emissions Reduction (1st year) from Baseline, Short ton/yr
CO2 Emissions Reduction (nth year) from Baseline, Metric ton/yr
CO2 Emissions Reduction (nth year) from Baseline, Short ton/yr
Cost per Short Ton of CO2 Removed (1st year of project life) (include fuel savings)
Cost per Short Ton of CO2 Removed (1st year of project life) (exclude fuel savings)
Cost per Short Ton of CO2 Removed (nth year of project life) (include fuel savings)
4. DAQ Spreadsheet on Fleetwide Calculations for Baseline and Future Years.
Heat Rate Reduction (Improvement) (average over project life), Btu/kw-hr
CO2 Emissions Reduction from Baseline (average over project life), Short ton/yr
Average Cost per Short Ton of CO2 Removed Across the Project Life (include fuel savings)
Average Cost per Short Ton of CO2 Removed Across the Project Life (exclude fuel savings)
2. EPA Air Pollution Control Cost Manual, Sixth Edition, January 2002; EPA/452/B-02-001
a. Section 1, Chapter 2, Paragraph 2.3.1 Elements of Total Capital Investment.
b. Section 1, Chapter 2, Paragraph 2.3.2: Elements of Total Annual Cost.3. Based on baseline net generation and net heat rate, ratio of baseline and future capacity factors, heat rate improvement, and future year (2019) average coal price included in "Annual Energy Outlook 2015", US EIA.
GGAllen-Page 23 of 28
Attachment B B-71Attachment B B-71

NOTES REFERENCES
$3,758,886 A 1
$3,758,886 DC 2(a)
None
$0 IC 2(a)
$3,758,886 TCI = DC + IC 2(a)
$53,698 1
-$6,513 3
$47,185 2(b)
10 PL 1$375,889 TCRC = TCI/PL 2(b)
$375,889 IDAC = TCRC 2(b)
$423,073 TAC = DAC + IDAC 2(b)
401,742 4
11,053 4
Baseline (2012) Net Generation, MW-h 386,992 4
Baseline (2012) Annual Capacity Factor (heat input basis), % 12.22 4
Future (2019) Annual Capacity Factor (projected heat input basis), % 2.00 4
Future (2019) Net Generation, MW-h 63,337 5
28
25
Project Life, Years 10 1
Degradation Factor Across Project Life, % 10 1
0.25 1
0.23 1
CO2 Emissions Reduction (1st year) (corresponding to heat rate improvement), % 0.25
CO2 Emissions Reduction (nth year) (corresponding to heat rate improvement), % 0.23
164 6
181 6
148 6
163 6
2335 7
2371 8
2594 7
2634 8
2465
2503
26
172
1. Duke Energy Submittal, September 11, 2015.
5. Based on baseline net generation and ratio of baseline and future capacity factors.
6. Based on baseline CO2 emissions and capacity factor, future capacity factor, and CO2 emissions reductions percentage.
7. Based on total annual cost including fuel savings and CO2 emissions reductions from baseline.
8. Based on total annual cost excluding fuel savings and CO2 emissions reductions from baseline.
Total Capital Investment (TCI)
Duke Energy Carolinas, LLCAllen U5Annualized Cost and Cost Per Unit CO2 Reduction forBoiler Feed Pump Motor Driven Variable Frequency Drive
CAPITAL COST
`
Equipment Cost
Total Direct Costs
Indirect Costs
Total Indirect Costs
Baseline (2012) Net Heat Rate, Btu/kw-hr
Annual Cost
Direct Annual Costs
Fixed & Variable Operation & Maintenance Cost
Fuel Savings
Total Direct Annual Costs (DAC)
Indirect Annual Costs
Project Life
Total Capital Recovery Costs (TCRC)
Total Indirect Annual Costs (IDAC)
Total Annual CostBaseline (2012) CO2 Emissions, metric ton/yr
Cost per Short Ton of CO2 Removed (nth year of project life) (exclude fuel savings)
Heat Rate Reduction (Improvement) (1st year of project life), Btu/kw-hr
Heat Rate Reduction (Improvement) (nth year of project life), Btu/kw-hr
Heat Rate Improvement (1st year) from Baseline Net Heat Rate, %
Heat Rate Improvement (nth year) from Baseline Net Heat Rate, %
CO2 Emissions Reduction (1st year) from Baseline, Metric ton/yr
CO2 Emissions Reduction (1st year) from Baseline, Short ton/yr
CO2 Emissions Reduction (nth year) from Baseline, Metric ton/yr
CO2 Emissions Reduction (nth year) from Baseline, Short ton/yr
Cost per Short Ton of CO2 Removed (1st year of project life) (include fuel savings)
Cost per Short Ton of CO2 Removed (1st year of project life) (exclude fuel savings)
Cost per Short Ton of CO2 Removed (nth year of project life) (include fuel savings)
4. DAQ Spreadsheet on Fleetwide Calculations for Baseline and Future Years.
Heat Rate Reduction (Improvement) (average over project life), Btu/kw-hr
CO2 Emissions Reduction from Baseline (average over project life), Short ton/yr
Average Cost per Short Ton of CO2 Removed Across the Project Life (include fuel savings)
Average Cost per Short Ton of CO2 Removed Across the Project Life (exclude fuel savings)
2. EPA Air Pollution Control Cost Manual, Sixth Edition, January 2002; EPA/452/B-02-001
a. Section 1, Chapter 2, Paragraph 2.3.1 Elements of Total Capital Investment.
b. Section 1, Chapter 2, Paragraph 2.3.2: Elements of Total Annual Cost.3. Based on baseline net generation and net heat rate, ratio of baseline and future capacity factors, heat rate improvement, and future year (2019) average coal price included in "Annual Energy Outlook 2015", US EIA.
GGAllen-Page 24 of 28
Attachment B B-72Attachment B B-72

NOTES REFERENCES
$5,369,837 A 1
$5,369,837 DC 2(a)
None
$0 IC 2(a)
$5,369,837 TCI = DC + IC 2(a)
$80,548 1
-$13,027 3
$67,521 2(b)
20 PL 1$268,492 TCRC = TCI/PL 2(b)
$268,492 IDAC = TCRC 2(b)
$336,012 TAC = DAC + IDAC 2(b)
401,742 4
11,053 4
Baseline (2012) Net Generation, MW-h 386,992 4
Baseline (2012) Annual Capacity Factor (heat input basis), % 12.22 4
Future (2019) Annual Capacity Factor (projected heat input basis), % 2.00 4
Future (2019) Net Generation, MW-h 63,337 5
55
50
Project Life, Years 20 1
Degradation Factor Across Project Life, % 10 1
0.50 1
0.45 1
CO2 Emissions Reduction (1st year) (corresponding to heat rate improvement), % 0.50
CO2 Emissions Reduction (nth year) (corresponding to heat rate improvement), % 0.45
329 6
362 6
296 6
326 6
927 7
963 8
1030 7
1070 8
979
1017
53
344
1. Duke Energy Submittal, September 11, 2015.
5. Based on baseline net generation and ratio of baseline and future capacity factors.
6. Based on baseline CO2 emissions and capacity factor, future capacity factor, and CO2 emissions reductions percentage.
7. Based on total annual cost including fuel savings and CO2 emissions reductions from baseline.
8. Based on total annual cost excluding fuel savings and CO2 emissions reductions from baseline.
Total Capital Investment (TCI)
Duke Energy Carolinas, LLCAllen U5Annualized Cost and Cost Per Unit CO2 Reduction forForced Draft Fan Variable Frequency Drive
CAPITAL COST
`
Equipment Cost
Total Direct Costs
Indirect Costs
Total Indirect Costs
Baseline (2012) Net Heat Rate, Btu/kw-hr
Annual Cost
Direct Annual Costs
Fixed & Variable Operation & Maintenance Cost
Fuel Savings
Total Direct Annual Costs (DAC)
Indirect Annual Costs
Project Life
Total Capital Recovery Costs (TCRC)
Total Indirect Annual Costs (IDAC)
Total Annual CostBaseline (2012) CO2 Emissions, metric ton/yr
Cost per Short Ton of CO2 Removed (nth year of project life) (exclude fuel savings)
Heat Rate Reduction (Improvement) (1st year of project life), Btu/kw-hr
Heat Rate Reduction (Improvement) (nth year of project life), Btu/kw-hr
Heat Rate Improvement (1st year) from Baseline Net Heat Rate, %
Heat Rate Improvement (nth year) from Baseline Net Heat Rate, %
CO2 Emissions Reduction (1st year) from Baseline, Metric ton/yr
CO2 Emissions Reduction (1st year) from Baseline, Short ton/yr
CO2 Emissions Reduction (nth year) from Baseline, Metric ton/yr
CO2 Emissions Reduction (nth year) from Baseline, Short ton/yr
Cost per Short Ton of CO2 Removed (1st year of project life) (include fuel savings)
Cost per Short Ton of CO2 Removed (1st year of project life) (exclude fuel savings)
Cost per Short Ton of CO2 Removed (nth year of project life) (include fuel savings)
4. DAQ Spreadsheet on Fleetwide Calculations for Baseline and Future Years.
Heat Rate Reduction (Improvement) (average over project life), Btu/kw-hr
CO2 Emissions Reduction from Baseline (average over project life), Short ton/yr
Average Cost per Short Ton of CO2 Removed Across the Project Life (include fuel savings)
Average Cost per Short Ton of CO2 Removed Across the Project Life (exclude fuel savings)
2. EPA Air Pollution Control Cost Manual, Sixth Edition, January 2002; EPA/452/B-02-001
a. Section 1, Chapter 2, Paragraph 2.3.1 Elements of Total Capital Investment.
b. Section 1, Chapter 2, Paragraph 2.3.2: Elements of Total Annual Cost.3. Based on baseline net generation and net heat rate, ratio of baseline and future capacity factors, heat rate improvement, and future year (2019) average coal price included in "Annual Energy Outlook 2015", US EIA.
GGAllen-Page 25 of 28
Attachment B B-73Attachment B B-73

NOTES REFERENCES
$536,984 A 1
$536,984 DC 2(a)
None
$0 IC 2(a)
$536,984 TCI = DC + IC 2(a)
$53,698 1
-$7,199 3
$46,499 2(b)
10 PL 1$53,698 TCRC = TCI/PL 2(b)
$53,698 IDAC = TCRC 2(b)
$100,198 TAC = DAC + IDAC 2(b)
401,742 4
11,053 4
Baseline (2012) Net Generation, MW-h 386,992 4
Baseline (2012) Annual Capacity Factor (heat input basis), % 12.22 4
Future (2019) Annual Capacity Factor (projected heat input basis), % 2.00 4
Future (2019) Net Generation, MW-h 63,337 5
33
25
Project Life, Years 10 1
Degradation Factor Across Project Life, % 25 1
0.30 1
0.23 1
CO2 Emissions Reduction (1st year) (corresponding to heat rate improvement), % 0.30
CO2 Emissions Reduction (nth year) (corresponding to heat rate improvement), % 0.23
197 6
217 6
148 6
163 6
461 7
494 8
614 7
659 8
538
576
29
190
1. Duke Energy Submittal, September 11, 2015.
5. Based on baseline net generation and ratio of baseline and future capacity factors.
6. Based on baseline CO2 emissions and capacity factor, future capacity factor, and CO2 emissions reductions percentage.
7. Based on total annual cost including fuel savings and CO2 emissions reductions from baseline.
8. Based on total annual cost excluding fuel savings and CO2 emissions reductions from baseline.
Total Capital Investment (TCI)
Duke Energy Carolinas, LLCAllen U5Annualized Cost and Cost Per Unit CO2 Reduction forIntelligent Sootblowers
CAPITAL COST
`
Equipment Cost
Total Direct Costs
Indirect Costs
Total Indirect Costs
Baseline (2012) Net Heat Rate, Btu/kw-hr
Annual Cost
Direct Annual Costs
Fixed & Variable Operation & Maintenance Cost
Fuel Savings
Total Direct Annual Costs (DAC)
Indirect Annual Costs
Project Life
Total Capital Recovery Costs (TCRC)
Total Indirect Annual Costs (IDAC)
Total Annual CostBaseline (2012) CO2 Emissions, metric ton/yr
Cost per Short Ton of CO2 Removed (nth year of project life) (exclude fuel savings)
Heat Rate Reduction (Improvement) (1st year of project life), Btu/kw-hr
Heat Rate Reduction (Improvement) (nth year of project life), Btu/kw-hr
Heat Rate Improvement (1st year) from Baseline Net Heat Rate, %
Heat Rate Improvement (nth year) from Baseline Net Heat Rate, %
CO2 Emissions Reduction (1st year) from Baseline, Metric ton/yr
CO2 Emissions Reduction (1st year) from Baseline, Short ton/yr
CO2 Emissions Reduction (nth year) from Baseline, Metric ton/yr
CO2 Emissions Reduction (nth year) from Baseline, Short ton/yr
Cost per Short Ton of CO2 Removed (1st year of project life) (include fuel savings)
Cost per Short Ton of CO2 Removed (1st year of project life) (exclude fuel savings)
Cost per Short Ton of CO2 Removed (nth year of project life) (include fuel savings)
4. DAQ Spreadsheet on Fleetwide Calculations for Baseline and Future Years.
Heat Rate Reduction (Improvement) (average over project life), Btu/kw-hr
CO2 Emissions Reduction from Baseline (average over project life), Short ton/yr
Average Cost per Short Ton of CO2 Removed Across the Project Life (include fuel savings)
Average Cost per Short Ton of CO2 Removed Across the Project Life (exclude fuel savings)
2. EPA Air Pollution Control Cost Manual, Sixth Edition, January 2002; EPA/452/B-02-001
a. Section 1, Chapter 2, Paragraph 2.3.1 Elements of Total Capital Investment.
b. Section 1, Chapter 2, Paragraph 2.3.2: Elements of Total Annual Cost.3. Based on baseline net generation and net heat rate, ratio of baseline and future capacity factors, heat rate improvement, and future year (2019) average coal price included in "Annual Energy Outlook 2015", US EIA.
GGAllen-Page 26 of 28
Attachment B B-74Attachment B B-74

NOTES REFERENCES
$375,889 A 1
$375,889 DC 2(a)
None
$0 IC 2(a)
$375,889 TCI = DC + IC 2(a)
$53,698 1
-$3,428 3
$50,270 2(b)
3 PL 1$125,296 TCRC = TCI/PL 2(b)
$125,296 IDAC = TCRC 2(b)
$175,566 TAC = DAC + IDAC 2(b)
401,742 4
11,053 4
Baseline (2012) Net Generation, MW-h 386,992 4
Baseline (2012) Annual Capacity Factor (heat input basis), % 12.22 4
Future (2019) Annual Capacity Factor (projected heat input basis), % 2.00 4
Future (2019) Net Generation, MW-h 63,337 5
22
6
Project Life, Years 3 1
Degradation Factor Across Project Life, % 75 1
0.20 1
0.05 1
CO2 Emissions Reduction (1st year) (corresponding to heat rate improvement), % 0.20
CO2 Emissions Reduction (nth year) (corresponding to heat rate improvement), % 0.05
132 6
145 6
33 6
36 6
1211 7
1235 8
4845 7
4939 8
3028
3087
14
91
1. Duke Energy Submittal, September 11, 2015.
5. Based on baseline net generation and ratio of baseline and future capacity factors.
6. Based on baseline CO2 emissions and capacity factor, future capacity factor, and CO2 emissions reductions percentage.
7. Based on total annual cost including fuel savings and CO2 emissions reductions from baseline.
8. Based on total annual cost excluding fuel savings and CO2 emissions reductions from baseline.
Total Capital Investment (TCI)
Duke Energy Carolinas, LLCAllen U5Annualized Cost and Cost Per Unit CO2 Reduction forAH Leakage Reduction
CAPITAL COST
`
Equipment Cost
Total Direct Costs
Indirect Costs
Total Indirect Costs
Baseline (2012) Net Heat Rate, Btu/kw-hr
Annual Cost
Direct Annual Costs
Fixed & Variable Operation & Maintenance Cost
Fuel Savings
Total Direct Annual Costs (DAC)
Indirect Annual Costs
Project Life
Total Capital Recovery Costs (TCRC)
Total Indirect Annual Costs (IDAC)
Total Annual CostBaseline (2012) CO2 Emissions, metric ton/yr
Cost per Short Ton of CO2 Removed (nth year of project life) (exclude fuel savings)
Heat Rate Reduction (Improvement) (1st year of project life), Btu/kw-hr
Heat Rate Reduction (Improvement) (nth year of project life), Btu/kw-hr
Heat Rate Improvement (1st year) from Baseline Net Heat Rate, %
Heat Rate Improvement (nth year) from Baseline Net Heat Rate, %
CO2 Emissions Reduction (1st year) from Baseline, Metric ton/yr
CO2 Emissions Reduction (1st year) from Baseline, Short ton/yr
CO2 Emissions Reduction (nth year) from Baseline, Metric ton/yr
CO2 Emissions Reduction (nth year) from Baseline, Short ton/yr
Cost per Short Ton of CO2 Removed (1st year of project life) (include fuel savings)
Cost per Short Ton of CO2 Removed (1st year of project life) (exclude fuel savings)
Cost per Short Ton of CO2 Removed (nth year of project life) (include fuel savings)
4. DAQ Spreadsheet on Fleetwide Calculations for Baseline and Future Years.
Heat Rate Reduction (Improvement) (average over project life), Btu/kw-hr
CO2 Emissions Reduction from Baseline (average over project life), Short ton/yr
Average Cost per Short Ton of CO2 Removed Across the Project Life (include fuel savings)
Average Cost per Short Ton of CO2 Removed Across the Project Life (exclude fuel savings)
2. EPA Air Pollution Control Cost Manual, Sixth Edition, January 2002; EPA/452/B-02-001
a. Section 1, Chapter 2, Paragraph 2.3.1 Elements of Total Capital Investment.
b. Section 1, Chapter 2, Paragraph 2.3.2: Elements of Total Annual Cost.3. Based on baseline net generation and net heat rate, ratio of baseline and future capacity factors, heat rate improvement, and future year (2019) average coal price included in "Annual Energy Outlook 2015", US EIA.
GGAllen-Page 27 of 28
Attachment B B-75Attachment B B-75

NOTES REFERENCES
$1,073,967 A 1
$1,073,967 DC 2(a)
None
$0 IC 2(a)
$1,073,967 TCI = DC + IC 2(a)
$80,548 1
-$7,199 3
$73,348 2(b)
10 PL 1$107,397 TCRC = TCI/PL 2(b)
$107,397 IDAC = TCRC 2(b)
$180,745 TAC = DAC + IDAC 2(b)
401,742 4
11,053 4
Baseline (2012) Net Generation, MW-h 386,992 4
Baseline (2012) Annual Capacity Factor (heat input basis), % 12.22 4
Future (2019) Annual Capacity Factor (projected heat input basis), % 2.00 4
Future (2019) Net Generation, MW-h 63,337 5
33
25
Project Life, Years 10 1
Degradation Factor Across Project Life, % 25 1
0.30 1
0.23 1
CO2 Emissions Reduction (1st year) (corresponding to heat rate improvement), % 0.30
CO2 Emissions Reduction (nth year) (corresponding to heat rate improvement), % 0.23
197 6
217 6
148 6
163 6
831 7
864 8
1108 7
1152 8
970
1008
29
190
1. Duke Energy Submittal, September 11, 2015.
5. Based on baseline net generation and ratio of baseline and future capacity factors.
6. Based on baseline CO2 emissions and capacity factor, future capacity factor, and CO2 emissions reductions percentage.
7. Based on total annual cost including fuel savings and CO2 emissions reductions from baseline.
8. Based on total annual cost excluding fuel savings and CO2 emissions reductions from baseline.
Total Capital Investment (TCI)
Duke Energy Carolinas, LLCAllen U5Annualized Cost and Cost Per Unit CO2 Reduction forCombustion Optimization - CCM / Excess Air / Neural Network
CAPITAL COST
`
Equipment Cost
Total Direct Costs
Indirect Costs
Total Indirect Costs
Baseline (2012) Net Heat Rate, Btu/kw-hr
Annual Cost
Direct Annual Costs
Fixed & Variable Operation & Maintenance Cost
Fuel Savings
Total Direct Annual Costs (DAC)
Indirect Annual Costs
Project Life
Total Capital Recovery Costs (TCRC)
Total Indirect Annual Costs (IDAC)
Total Annual CostBaseline (2012) CO2 Emissions, metric ton/yr
Cost per Short Ton of CO2 Removed (nth year of project life) (exclude fuel savings)
Heat Rate Reduction (Improvement) (1st year of project life), Btu/kw-hr
Heat Rate Reduction (Improvement) (nth year of project life), Btu/kw-hr
Heat Rate Improvement (1st year) from Baseline Net Heat Rate, %
Heat Rate Improvement (nth year) from Baseline Net Heat Rate, %
CO2 Emissions Reduction (1st year) from Baseline, Metric ton/yr
CO2 Emissions Reduction (1st year) from Baseline, Short ton/yr
CO2 Emissions Reduction (nth year) from Baseline, Metric ton/yr
CO2 Emissions Reduction (nth year) from Baseline, Short ton/yr
Cost per Short Ton of CO2 Removed (1st year of project life) (include fuel savings)
Cost per Short Ton of CO2 Removed (1st year of project life) (exclude fuel savings)
Cost per Short Ton of CO2 Removed (nth year of project life) (include fuel savings)
4. DAQ Spreadsheet on Fleetwide Calculations for Baseline and Future Years.
Heat Rate Reduction (Improvement) (average over project life), Btu/kw-hr
CO2 Emissions Reduction from Baseline (average over project life), Short ton/yr
Average Cost per Short Ton of CO2 Removed Across the Project Life (include fuel savings)
Average Cost per Short Ton of CO2 Removed Across the Project Life (exclude fuel savings)
2. EPA Air Pollution Control Cost Manual, Sixth Edition, January 2002; EPA/452/B-02-001
a. Section 1, Chapter 2, Paragraph 2.3.1 Elements of Total Capital Investment.
b. Section 1, Chapter 2, Paragraph 2.3.2: Elements of Total Annual Cost.3. Based on baseline net generation and net heat rate, ratio of baseline and future capacity factors, heat rate improvement, and future year (2019) average coal price included in "Annual Energy Outlook 2015", US EIA.
GGAllen-Page 28 of 28
Attachment B B-76Attachment B B-76

1
North Carolina Department of Environmental Quality Division of Air Quality
Supporting Basis
Determination of Best System of Emissions Reduction for CO2 Emissions from Existing Electric Utility Generating Units
October 30, 2015
Facility Duke Energy Carolinas LLC, Marshall Steam Station, Belmont, NC Facility ID: 1800073 Current Air Quality Permit No. 03676T52 Affected Electric Utility Generating Units (EGUs) One coal/No. 2 fuel oil-fired electric utility boiler equipped with a low NOx concentric firing system, separated over-fire air/lowered fired low-NOx technologies, and alkaline-based fuel additive (4,756 million Btu per hour heat input capacity, ID No. ES-1 [Unit 1]). Generator rated at 350 MW (nameplate capacity). One coal/No. 2 fuel oil-fired electric utility boiler equipped with a low NOx concentric firing system, separated over-fire air/lowered fired low-NOx technologies, and alkaline-based fuel additive (4,542 million Btu per hour heat input capacity, ID No. ES-2 [Unit 2]). Generator rated at 350 MW (nameplate capacity). One coal/No. 2 fuel oil-fired electric utility boiler equipped with a low NOx concentric firing system, separated over-fire air/lowered fired low-NOx technologies, and alkaline-based fuel additive (7,506 million Btu per hour heat input capacity, ID No. ES-3 [Unit 3]). Generator rated at 648 MW (nameplate capacity). One coal/No. 2 fuel oil-fired electric utility boiler equipped with a low NOx concentric firing system, separated over-fire air/lowered fired low-NOx technologies, and alkaline-based fuel additive (7,486 million Btu per hour heat input capacity, ID No. ES-4 [Unit 4]). Generator rated at 648 MW (nameplate capacity).
1. Introduction The United States Environmental Protection Agency (EPA) has adopted Emission Guidelines for Greenhouse Gas Emissions and Compliance Times for Electric Utility Generating Units on August 3, 2015 and codified it in 40 CFR Subpart UUUU. The affected electric utility steam generating units (EGUs) under these emission guidelines (EG) are steam generating units, integrated gasification combined cycle units (IGCC), and stationary combined cycle or combined heat and power (CHP) combustion turbines that commenced construction on or before January 8, 2014.
Marshall-Page 1 of 44
Attachment B B-77Attachment B B-77

2
The EG includes uniform, nationwide emission standards, which are performance-based rates for emissions of greenhouse gases (GHG) expressed as CO2 (lb CO2/net MWh), as follows: Fossil fuel-fired steam generating units or IGCC: 1,534 lb CO2/net MWh (interim, average of
2022-2029), 1,305 lb CO2/net MWh (final, starting 2030)
Natural gas-fired stationary combined cycle combustion turbines (including CHP combustion turbines): 832 lb/net MWh (interim, average of 2022-2029), 771 lb/MWh (final, starting 2030)
In lieu of the above uniform rates, each EGU can comply with state-specific goal (lb CO2/net MWh). The other option is that all affected units in the state, in aggregate, comply with the mass-based state goal (short tons/yr). For North Carolina (NC), the rate-based interim and final goals are 1,311 lb CO2/net MWh and 1,136 lb CO2/net MWh, respectively. Similarly, NC’s mass-based interim and final goals are 56,986,025 short tons/yr and 51,266,234 short tons/yr, respectively. The above standards (whether uniform nationwide rates or state-specific goals) are based upon the determination of Best System of Emissions Reduction (BSER) consisting of following three building blocks: Building Block 1 (BB1) - reducing the carbon intensity of electricity generation by improving the
heat rate of existing coal-fired power plants.
Building Block 2 (BB2) - substituting increased electricity generation from lower-emitting existing natural gas plants for reduced generation from higher-emitting coal-fired power plants.
Building Block 3 (BB3) - substituting increased electricity generation from new zero-emitting
renewable energy sources (like wind and solar) for reduced generation from existing coal-fired and natural gas-fired power plants.
The EG requires that each state submit its plan complying with all applicable requirements by the deadline included therein. One of the requirements consists of development of an emission standard (“standard of performance”) and establishment of compliance time for each EGU. The Clean Air Act (CAA) §111(a)(1) defines “standard of performance” as “a standard for emissions of air pollutants which reflects the degree of emission limitation achievable through the application of the best system of emission reduction which (taking into account the cost of achieving such reduction and any nonair quality health and environmental impact and energy requirements) the Administrator determines has been adequately demonstrated”.
2. History of Development of Emission Guidelines under CAA Over the last 40 years, under §111(d), the EPA has regulated four pollutants from five source categories, by promulgating associated EG. These source categories are phosphate fertilizer plants (fluorides), sulfuric acid plants (acid mist), Kraft pulp plants (total reduced sulfur (TRS)), primary aluminum plants (fluorides), and municipal solid waste landfills (landfill gas emissions as non-
Marshall-Page 2 of 44
Attachment B B-78Attachment B B-78

3
methane organic compounds (NMOCs))1. The following general principles and/or rationales were used by EPA in establishing BSER for these EGs: The degree of emission reduction achievable through the application of various demonstrated
control technologies.
The technical feasibility of applying various demonstrated technologies to existing sources considering variability in sizes and designs.
The impact of various demonstrated technologies on national energy consumption, water pollution,
waste disposal, and ambient air concentrations of a designated pollutant.
The cost of adopting the emission guidelines, after considering control costs for various demonstrated technologies and taking into account the level of any existing controls.
Each of these EGs indicates that the cost of applying various control technologies can have a considerable impact in selection of a BSER for any designated pollutant for existing facilities. They also indicate that the age, size, type, class, and process design of the facility, influence not only the BSER selection process, but can also support a decision-making for whether different EGs are to be established for differing sizes, types, or classes of equipment. The EGs for the above referenced source categories have been established for principal points of emissions (point and fugitive emissions sources) located within the facility and, not for any emissions sources located outside of the facility. Finally, in these EGs, with respect to determining the EG, EPA has consistently recognized that not only the control technology needs to be demonstrated on existing sources, but the degree of emission reduction (performance level) needs to be readily achievable by the control technology.
3. The Division of Air Quality (DAQ)’s Approach for Determination of BSER The DAQ will consider the above general principles in determining BSER for CO2 emissions reduction from each EGU. But, importantly, DAQ will determine BSER for each EGU based upon BB1-type measures only (i.e., measures which can be accomplished within the fence-line of the facility), conforming to the §111(d) of the CAA and the requirements of 40 CFR 60 “Adoption and Submittal of State Plans for Designated Facilities”. Thus, DAQ’s approach will comprise of improving the operational efficiency of the EGUs in order to reduce CO2 emissions from the 2012 baseline levels. The DAQ’s BSER evaluation will specifically be based upon the following: type of EGU remaining useful life of the EGU unit’s baseline data (net heat rate, net generation, annual capacity factor, and CO2 emissions) unit’s projected future capacity factor 1 See Footnote 18 at 79 FR 41776, July 17, 2014, including ‘‘Phosphate Fertilizer Plants; Final Guideline Document Availability,’’ 42 FR 12022 (March 1, 1977); ‘‘Standards of Performance for New Stationary Sources; Emission Guideline for Sulfuric Acid Mist,’’ 42 FR 55796 (October 18, 1977); ‘‘Kraft Pulp Mills, Notice of Availability of Final Guideline Document,’’ 44 FR 29828 (May 22, 1979); ‘‘Primary Aluminum Plants; Availability of Final Guideline Document,’’ 45 FR 26294 (April 17, 1980); ‘‘Standards of Performance for New Stationary Sources and Guidelines for Control of Existing Sources: Municipal Solid Waste Landfills, Final Rule,’’ 61 FR 9905 (March 12, 1996).
Marshall-Page 3 of 44
Attachment B B-79Attachment B B-79
4
feasibility of applying specific heat rate improvement (HRI) measure on a given unit whether the measure is adequately demonstrated degree of heat rate reduction potential for feasible HRI measures site-specific limitations associated costs (capital, fixed and variable operational and maintenance (O&M), and fuel savings) cost per ton of CO2 reduction The evaluation is also based on literature review2 of technical feasibility for various HRI measures, degree of heat rate reduction potential, and costs data (capital, and fixed and variable O&M). It needs to be emphasized here that DAQ’s determination for each EGU will not be based upon some pre-determined HRI target, such as EPA’s selection of a 4.3% HRI potential for EGUs in the Eastern interconnection3, as discussed in the EG. The DAQ’s approach will include those adequately demonstrated, cost-effective measures that assure that the electricity is generated with lower CO2 emissions, thus improving public health and welfare. The selected HRI measures would be expected to produce non-air environmental co-benefits in the form of reduced water usage and solid waste production, in addition to, reductions in emissions of non-GHG pollutants such as SO2, NOx, and mercury. However, it should be noted that as the EGU becomes more cost-competitive due to HRIs, it may be dispatched more frequently and/or at higher loads. If the EGU is utilized more often, some increases in emissions of GHG (as CO2) and similarly, for non-GHG pollutants (such as SO2, NOx, or mercury) are possible, and those could partially offset the emissions reductions achieved through the HRI of the EGU. EPA has determined a cost estimate of $23 per ton4 reasonable for CO2 emissions reduction from EGUs under BB1 implementing HRI measures. EPA has further determined that this cost is reasonable because it achieves “an appropriate balance between cost and amount of reductions.”5 In addition, EPA has used another benchmark in the form of social cost of carbon (SC-CO2) at $40 per ton (2020) to $48 per ton (2030)6 to conclude that the above $23 per ton cost is reasonable. In determining a BSER for a particular EGU, DAQ will use the above cost effectiveness threshold of $23 per ton to determine reasonableness of cost and whether one or more technically feasible measure(s) can be implemented, as long as, collectively, the total cost does not exceed this threshold.
2 “Coal-fired Power Plant Heat Rate Reductions”, Final Report, Sargent & Lundy, Chicago, IL, January 22, 2009. “Analysis of Heat Rate Improvement Potential at Coal-Fired Power Plants”, US Energy Information Administration, Washington, DC, May 2015. S. Corellis, “Range and Applicability of Heat Rate Improvements”, Technical Update, Electric Power Research Institute, Palo Alto, CA, April 2014. 3 Applies to coal-fired EGUs only. 4 See page 446 of 1560 (pre-publication version), Carbon Pollution Emission Guidelines for Existing Stationary Sources: Electric Utility Generating Units Clean Power Plan, August 3, 2015. Based on nation-wide coal fleet capacity of 213 GW, heat rate improvement capital cost of $100/KW, capital charge rate of 14.3%, fleet-wide baseline net heat rate of 10,250 Btu/KWh, heat rate improvement of 4% for coal-fired EGUs, annual capacity factor of 78%, and future (2030) average coal delivered cost of $2.70 per million Btu. See page 2-65, Greenhouse Gas Mitigation Measures, Technical Support Document (TSD) for Carbon Pollution Guidelines for Existing Power Plants”, August 3, 2015. 5 See page 457 of 1560 (pre-publication version), Ibid. 6 See pages 458 and 459 of 1560 (pre-publication version), Ibid.
Marshall-Page 4 of 44
Attachment B B-80Attachment B B-80

5
4. BSER Evaluation
Duke Energy Carolinas, LLC, Marshall Steam Station (DEC) has provided information through submittals of July 31 and September 11, 2015, to aid in DAQ’s efforts in determining BSER for CO2 emissions from Units 4 and 5. Additional information was provided through face-to-face meetings and email communication. The submitted information consists of baseline data (net heat rate, net generation, generation-based annual capacity factor, and CO2 emissions) for 2012, projected heat input for future years such as 2019; and cost data (capital cost and annual O&M)7, project life, degradation factor and HRI potential for each of the following measures, for possible implementation on all EGUs of NC-based coal fleet: Controllable Loss Reduction (Maintain Unit Efficiency) [CLR] Sliding Pressure Operation [SPO] Lower FGD Efficiency (as SO2 permit limits allow) [LFGD] Intelligent Sootblowers [ISB] Air Heater Leakage Reduction [ALR] Combustion Optimization - CCM / Excess Air / Neural Network [CO] Online Condenser Cleaning [OCC] Induced and/or Booster Draft Fan Variable Frequency Drive [IBD] Air Heater Exit Gas Temperature Reduction [AHE] Flue Gas Desulfurization (FGD) Auxiliary Load Reduction through Variable Frequency Drives
[FGDA] Boiler Feed Pump Motor Driven Variable Frequency Drive [BFP] Induced Draft Fan Replacement [IDFR] Forced Draft Fan Variable Frequency Drive [FDF] Condenser Rebundle, Retubes, and Rebuilds [CRR] Electrostatic Precipitator (ESP) (Power management, T/R set upgrades) [ESP] Turbine Upgrades (HI, IP, LP) [TUR] Helper Cooling Tower [HCT] DEC has claimed the submitted information on cost, project life, and degradation factors, as “confidential”. The DAQ will treat this specific information (cost data and information on project life and the associated degradation factors) “confidential” until the Director decides that it is not confidential in accordance with NCAC 2Q .0107 “Confidential Information”. Thus, DAQ will not include such information in this document. In general, through these submittals, DEC characterizes the HRIs decreasing over time because the equipment associated with each measure degrades over time due to normal wear and tear, requiring recurrent implementation of HRI projects or measures. DEC further mentions that some of the efficiency projects cannot be performed or the full HRI benefits may not be realized due to unique configuration or physical limitation of a given EGU. In addition, DEC states that operation of any EGU at less than the full load or if cycled between full and partial load will adversely impact EGU’s heat rate. DEC also discusses reduced utilization of its
7 High level estimate in the range of -20% to +75% in 2015 $s.
Marshall-Page 5 of 44
Attachment B B-81Attachment B B-81

6
coal-fired fleet in the recent history in response to lower natural gas prices, resulting in some of its coal-fired units, once operated as base-load units, now operating as intermediate duty cycling units. Finally, DEC adds that any post combustion environmental controls (activated carbon for mercury control, dry bottom and fly ash conversion for coal ash disposal, selective catalytic reduction for NOx control, and Zero Liquid Discharge (ZLD) for wastewater treatment) also adversely impact the heat rate of the EGU, in addition to any other environmental control which might be installed in future (any project implemented since its BSER submittal deadline date of July 31, 2015). With respect to the BSER evaluation, the DAQ has utilized the following data upon verifying or through calculations, for estimating heat rate reduction (Btu/kWh), CO2 emission reduction (short tons/yr), and cost per unit reduction of CO2 ($ per ton) for each measure:
Table 1: Marshall Unit 1 through Unit 4
Unit No. 1 2 3 4
Baseline (2012) Net Generation (MWh)
1,078,626 1,370,510 3,263,260 3,902,223
Baseline (2012) Net Heat Rate (Btu/kWh)
9,898 9,847 9,584 9,433
Baseline (2012) CO2 Emissions (Tons/yr)
1,136,758 1,440,942 3,376,317 3,906,809
Baseline (2012) Annual Heat Inputs (million Btu)
10,676,240 13,495,412 31,275,084 36,809,670
Baseline (2012) Annual Capacity Factor (Heat Input Basis)
0.256 0.339 0.476 0.561
Future (2019) Projected Annual Capacity Factor (Heat Input Basis)
0.180 0.270 0.510 0.580
Future (2019) Projected Coal Delivered Cost ($ per million Btu)
3.92 3.92 3.92 3.92
Commencement of Operation Year
1965 1966 1969 1970
Planned Retirement Year 2038 2038 2038 2038
It needs to be clarified here that, for all NC-based EGUs, owned by Duke Energy (both under DEC and Duke Energy Progress (DEP)), DAQ used the actual coal delivered prices for 2014 and scaled them for 20198 to estimate the above coal delivered price of $3.92 per million Btu. The DAQ will adjust the
8 Duke Energy Carolinas The actual, average cost of fuel burned for 12 months ending December 2014 (Jan 2014-Dec 2014) was $3.84 per million Btu (See NCUC Docket No. E-7, Sub 1047, Duke Energy Carolinas, LLC Monthly Fuel Report, February 11, 2015). Duke Energy Progress
Marshall-Page 6 of 44
Attachment B B-82Attachment B B-82

7
capital and annual O&M costs estimates, provided by DEC in 2015 dollars, to 2019 dollars, using the growth factor of 1.8 percent compounded annually.9 BSER Candidate Measures for Marshall Units 1 through 4 For Units 1 and 2, DEC has determined that measures identified above as SPO, IDFR, AHE, BFP, and HCT, are either technically infeasible or each have very negligible HRI opportunity. Further, for Unit 1, measures OCC and CRR were accomplished prior to 2012 (baseline year). In addition, for Unit 2, CRR measure was implemented in 2013. For Units 3 and 4, DEC has determined that measures identified above as AHE, FGDA, BFP, IDFR, and HCT, are either technically infeasible or each have very negligible HRI opportunity. For Unit 4, one additional measure CRR has been found to be technically infeasible or it has very negligible HRI opportunity. For both Units 3 and 4, measure OCC was implemented in 2013, while CRR measure was also implemented in 2013 for Unit 3 only. In addition, DEC has reasoned that SPO measure increases electric grid reliability risks due to boiler tube or drum damage and unstable operation, and recommended that this measure be removed from BSER evaluation for all coal-fired EGUs (both DEC and DEP). The DAQ agrees with DEC and deems the measures SPO, IDFR, AHE, BFP, and HCT, technically infeasible; and hence, will not include them in the BSER evaluation for Units 1 and 2. Next, the DAQ agrees with DEC and deems the measures SPO, AHE, FGDA, BFP, IDFR, and HCT, technically infeasible; and hence, will not include them in the BSER evaluation for Units 3 and 4.
The actual, average cost of coal burned for 12 months ending January 2015 (Feb 2014-Jan 2015) was $3.57 per million Btu (See NCUC Docket No. E-2, Sub 1064, Duke Energy Progress, INC. Monthly Fuel Report, March 12, 2015). Using the EIA (Annual Energy Outlook 2015) [www.eia.gov/beta/aeo/], Nationwide coal delivered prices were / projected to be: 2013 $2.50 per million Btu 2015 $2.41 per million Btu 2020 $2.54 per million Btu By interpolation, nationwide coal delivered prices for 2014 and 2019 would be approximately $2.46 per million Btu and $2.51 per million, respectively; thus an increase of 2 percent of coal price was projected from 2014 to 2019. Applying this ratio to the DEC’s fleet, the average coal delivered price in 2019 would be 1.02 * $3.84 per million Btu = $3.92 per million Btu. Applying the same ratio to the DEP fleet, the average coal delivered price in 2019 would be 1.02 * $3.57 per million Btu = $3.64 per million Btu. Using the larger value from the above, for conservative calculations, for the entire fleet (both DEC and DEP), the 2019 coal delivered cost is projected to be $3.92 per million Btu. 9 See both GDP Chain-Type Price Index and Metals and Metal Products Indicator, Table A20. Macroeconomics Indicators, USEIA Annual Energy Outlook 2015.
Marshall-Page 7 of 44
Attachment B B-83Attachment B B-83

8
In addition, the DAQ agrees with DEC and deems the measure CRR technically infeasible; and hence, will not include it in in the BSER evaluation for Unit 4. Finally, DAQ will not include any other measure in its evaluation, if there is any possibility of an increase in collateral emissions, such as measures LFGD and ESP for Units 1 through 4. Thus, DAQ will evaluate the remaining measures for Units 1 through 4, as follows: Unit 1: CLR, TUR, FGDA, IDFR, FDF, ISB, ALR, and CO Unit 2: CLR, CRR, TUR, FGDA, IDFR, FDF, ISB, ALR, and CO Unit 3: CLR, FDF, ISB, ALR, and CO Unit 4: CLR, FDF, ISB, ALR, and CO BSER Measure by Measure Analysis The DAQ has evaluated the remaining measures as included above using the methodology described below: First, using the project life (yr) for a given measure, DAQ has transformed capital investment ($) into an indirect annual (capital) cost ($ per yr) by simply dividing capital investment by the project life. Then, it added it to the direct annual (fixed O&M) cost to determine the total annual cost. Next, using the coal delivered price, baseline year (2012) generation and capacity factor, future capacity factor, and average HRI percent (calculated assuming the HRI for a given measure degrades linearly over the project life based on degradation factor); coal fuel savings have been estimated for 2019. Fuel savings due to improved heat rate have been deducted from the total annual cost to determine net annual cost for implementation of a measure. Then, using baseline CO2 emissions, baseline and future capacity factors, and average improvement of heat rate for the EGU (again assuming a decrease in HRI linearly over the measure’s life based on degradation factor) from baseline net heat rate, reduction in CO2 emissions associated with a given measure has been estimated. Finally, cost per unit reduction in CO2 is simply estimated by taking net annual cost and dividing it by CO2 emissions, both determined as above. It needs to be emphasized that average HRI percent (calculated using degradation factor across the project life) and not the maximum HRI percent, has been applied to determine fuel savings and CO2 emissions reductions for a given measure. Table 2 (one table for each unit) includes heat rate reduction (Btu/kWh), CO2 emission reduction (tons/yr), and cost per unit CO2 reduction ($ per ton) for each of the remaining measures for Units 1 through 4:
Marshall-Page 8 of 44
Attachment B B-84Attachment B B-84

9
Table 2: Marshall Unit 1 Measure Heat Rate
Reduction
Btu/kWh [Project Life
Average]
CO2 Emissions Reductions
tons per year [Project Life
Average]
Cost per Unit CO2 Reduction
$ per ton [Including Fuel
Savings]
Is Cost per Unit CO2 Reduction <= $23 per
ton?
Controllable Loss Reduction (Maintain Unit Efficiency) [CLR]
43 3,493 202
N
Online Condenser Cleaning [OCC] -
Condenser Rebundle, Retubes, Rebuilds [CRR]
-
Turbine Upgrades (HP, IP, LP) [TUR] 93 7,485 346 N
Helper Cooling Tower [HCT] 0 0 0 -
Induced and/or Booster Draft Fan Variable Frequency Drive [IBD]
0 0 0 -
FGD Aux Load Reduction Through Variable Frequency Drives [FGDA]
3 228 389 N
Boiler Feed Pump Motor Driven Variable Frequency Drive [BFP]
0 0 0 -
Induced Draft Fan Replacement [IDFR] 47 3,792 91 N
Forced Draft Fan Variable Frequency Drive [FDF]
38 3,034 78 N
Intelligent Sootblowers [ISB] 26 2,096 15 Y
AH Leakage Reduction [ALR] 12 998 223 N
Combustion Optimization - CCM / Excess Air / Neural Network [CO]
26 2,096 54 N
AH Exit Gas Temperature Reduction [AHE]
0 0 0 -
Technically infeasible/no opportunity identified
Performed in or prior to baseline year 2012
Performed prior to July 2015 and after baseline year
Marshall-Page 9 of 44
Attachment B B-85Attachment B B-85

10
Table 2: Marshall Unit 2 Measure Heat Rate
Reduction
Btu/kWh [Project Life
Average]
CO2 Emissions Reductions
tons per year [Project Life
Average]
Cost per Unit CO2 Reduction
$ per ton [Including Fuel
Savings]
Is Cost per Unit CO2 Reduction <= $23 per
ton?
Controllable Loss Reduction (Maintain Unit Efficiency) [CLR]
43 5,018 129 N
Online Condenser Cleaning [OCC] -
Condenser Rebundle, Retubes, Rebuilds [CRR]
37 4,301 94 N
Turbine Upgrades (HP, IP, LP) [TUR] 92 10,753 224 N
Helper Cooling Tower [HCT] 0 0 0 -
Induced and/or Booster Draft Fan Variable Frequency Drive [IBD]
0 0 0 -
FGD Aux Load Reduction Through Variable Frequency Drives [FGDA]
3 327 260 N
Boiler Feed Pump Motor Driven Variable Frequency Drive [BFP]
0 0 0 -
Induced Draft Fan Replacement [IDFR] 47 5,448 52 N
Forced Draft Fan Variable Frequency Drive [FDF]
32 3,746 57 N
Intelligent Sootblowers [ISB] 26 3,011 -1 Y
AH Leakage Reduction [ALR] 12 1,434 138 N
Combustion Optimization - CCM / Excess Air / Neural Network [CO]
26 3,011 26 N
AH Exit Gas Temperature Reduction [AHE]
0 0 0 -
Technically infeasible/no opportunity identified
Performed in or prior to baseline year 2012
Performed prior to July 2015 and after baseline year
Marshall-Page 10 of 44
Attachment B B-86Attachment B B-86

11
Table 2: Marshall Unit 3 Measure Heat Rate
Reduction
Btu/kWh [Project Life
Average]
CO2 Emissions Reductions
tons per year [Project Life
Average]
Cost per Unit CO2 Reduction
$ per ton [Including Fuel
Savings]
Is Cost per Unit CO2 Reduction <= $23 per
ton?
Controllable Loss Reduction (Maintain Unit Efficiency) [CLR]
42 15,840 16 Y
Online Condenser Cleaning [OCC] -
Condenser Rebundle, Retubes, Rebuilds [CRR]
-
Turbine Upgrades (HP, IP, LP) [TUR] -
Helper Cooling Tower [HCT] 0 0 0 -
Induced and/or Booster Draft Fan Variable Frequency Drive [IBD]
-
FGD Aux Load Reduction Through Variable Frequency Drives [FGDA]
0 0 0 -
Boiler Feed Pump Motor Driven Variable Frequency Drive [BFP]
0 0 0 -
Induced Draft Fan Replacement [IDFR] 0 0 0 -
Forced Draft Fan Variable Frequency Drive [FDF]
18 6,664 16 Y
Intelligent Sootblowers [ISB] 13 4,752 -14 Y
AH Leakage Reduction [ALR] 12 4,526 5 Y
Combustion Optimization - CCM / Excess Air / Neural Network [CO]
25 9,504 -17 Y
AH Exit Gas Temperature Reduction [AHE]
0 0 0 -
Technically infeasible/no opportunity identified
Performed in or prior to baseline year 2012
Performed prior to July 2015 and after baseline year
Marshall-Page 11 of 44
Attachment B B-87Attachment B B-87

12
Table 2: Marshall Unit 4 Measure Heat Rate
Reduction
Btu/kWh [Project Life
Average]
CO2 Emissions Reductions
tons per year [Project Life
Average]
Cost per Unit CO2 Reduction
$ per ton [Including Fuel
Savings]
Is Cost per Unit CO2 Reduction <= $23 per
ton?
Controllable Loss Reduction (Maintain Unit Efficiency) [CLR]
41 17,662 10 Y
Online Condenser Cleaning [OCC] -
Condenser Rebundle, Retubes, Rebuilds [CRR]
0 0 0 -
Turbine Upgrades (HP, IP, LP) [TUR] -
Helper Cooling Tower [HCT] 0 0 0 -
Induced and/or Booster Draft Fan Variable Frequency Drive [IBD]
-
FGD Aux Load Reduction Through Variable Frequency Drives [FGDA]
0 0 0 -
Boiler Feed Pump Motor Driven Variable Frequency Drive [BFP]
0 0 0 -
Induced Draft Fan Replacement [IDFR] 0 0 0 -
Forced Draft Fan Variable Frequency Drive [FDF]
13 5,753 24 N
Intelligent Sootblowers [ISB] 25 10,597 -27 Y
AH Leakage Reduction [ALR] 12 5,046 -2 Y
Combustion Optimization - CCM / Excess Air / Neural Network [CO]
25 10,597 -20 Y
AH Exit Gas Temperature Reduction [AHE]
0 0 0 -
Technically infeasible/no opportunity identified
Performed in or prior to baseline year 2012
Performed prior to July 2015 and after baseline year
Refer to the attached spreadsheet on calculations for annualized cost and cost per unit reduction of CO2 for each associated measure for each of the EGUs included in Table 2 above. It needs to be stated here although the retirement age for each of the units has been estimated by DEC and available to DAQ, there is no need to adjust the above estimated costs, considering the remaining
Marshall-Page 12 of 44
Attachment B B-88Attachment B B-88

13
useful life (RUL) of each of the EGUs. Each BSER measure considered has a project life that is less than the RUL of the EGU. Marshall Unit 1 Results Discussion Comparing with the reasonable cost threshold of $23 per ton, as discussed in Section 3 above, the estimated costs for measures included in Table 2: Unit 1 above, except for ISB measure, can be considered “excessive”, “exorbitant” or “unreasonable”, as stated by EPA in the preamble to the final EG10. For ISB measure, DAQ is determining CO2 emission reduction cost of $15 per ton reasonable for ISB measure (using the cost threshold of $23 per ton CO2). The associated heat rate reduction and CO2 emissions reduction are 26 Btu/kWh and 2,096 tons/yr, respectively. In general, the measure is expected to produce non-air environmental co-benefits in the form of reduced water usage and solid waste production, in addition to, reduced emissions of non-GHG pollutants such as SO2, NOx, and mercury. Moreover, no adverse energy impact is expected from employing the measure at Unit 1. Thus, considering cost, non-air environmental, and energy impacts, DAQ determines that the ISB measure is BSER for Unit 1. Marshall Unit 2 Results Discussion As shown in Table 2 above, only one measure, ISB (-$1 per ton), is less than or equal to the reasonable cost threshold of $23 per ton. No other measures are available to be considered with ISB that will keep the collective cost of the measures below the reasonable cost threshold. In summary, DAQ is determining CO2 emission reduction cost of -$1 per ton reasonable for ISB measure (i.e., fuel savings itself will pay for the cost for implementing the measure). The associated heat rate reduction and CO2 emissions reduction are 26 Btu/kWh and 3,011 tons/yr, respectively. In general, the measure is expected to produce non-air environmental co-benefits in the form of reduced water usage and solid waste production, in addition to, reduced emissions of non-GHG pollutants such as SO2, NOx, and mercury. Moreover, no adverse energy impact is expected from employing the measure at Unit 2. Thus, considering cost, non-air environmental, and energy impacts, DAQ determines that the ISB measure is BSER for Unit 2. Marshall Unit 3 Results Discussion Comparing the above estimates with the reasonable cost threshold of $23 per ton, as discussed in Section 3 above, each of the remaining five measures (CLR, FDF, ISB, ALR, and CO) individually costs less than or equal to $23 per ton and collectively -$6 per ton. Of the five remaining projects, ISB, ALR and CO can be considered measures that improve boiler efficiency. When considering measures that improve an EGU’s thermal efficiency, the benefits are not necessarily cumulative, unlike the case for measures that reduce parasitic loads on the EGU, where it is a reasonable assumption to do so. The HRI likely values initially submitted by DEC and used thus far
10 Page 298 of 1560 (pre-publication version), Ibid.
Marshall-Page 13 of 44
Attachment B B-89Attachment B B-89

14
do not take into account synergistic effects. Therefore, it is reasonable to adjust the HRI values used in this analysis in those cases where multiple boiler efficiency projects are considered together as BSER. Based on confidential information DEC has supplied as justification, the HRI likely for ISB will be further reduced in this analysis. A decrease in the HRI will also result in the increase in the cost per ton of CO2 removed. Upon adjustment, the cost per ton of CO2 removed associated with ISB increased from -$26 per ton to -$14 per ton, and the collective cost for all of these five measures increased from --$6 per ton to $6 per ton. One other adjustment to consider in this case is the use of CLR. DEC has supplied justification that the HRI likely value resulting from the implementation of CLR alone should not be considered additive (similar to boiler efficiency projects) when implemented with many other projects. The DAQ found this explanation reasonable and as a result reduced the HRI likely from the implementation of CLR when used in conjunction with two or more other measures. In this case, CLR is proposed with four more other projects and hence, the HRI associated with CLR was reduced. A decrease in the HRI will also result in the increase in the cost per ton of CO2 removed. Upon adjustment, the cost per ton of CO2 removed associated with CLR will increase from $16 per ton to $69 per ton. Collectively, the five measures now cost $49 per ton. Thus, the BSER analysis needs to be reconsidered. Without CLR Measure If CLR measure is excluded from the analysis, the other four measures (FDF, ISB, ALR and CO) would result in HRI benefits of 68 Btu/kWh and CO2 reductions of 25,446 tons per year, at a collective cost of -$10 per ton. Since there are no additional measures available for consideration, there are no other measures that could be combined with these four measures, still keeping the collective cost for all measures less than or equal to $23 per ton. CLR with Other Measures There are a number of possible combinations of measures that could be evaluated. However, only those measures which are expected to provide similar or higher benefits than the benefits associated with the above scenario, “without CLR measure” (Option 4 in Table 3), will be discussed here. The results are summarized in Table 3. Note the table also includes the contribution to costs and benefits associated with the CLR and ISB measures adjusted and non-adjusted as necessary. Considering all the scenarios and combinations in Table 3, DAQ recommends the following measures for BSER for Unit 3: FDF, ISB, ALR and CO. This combination of measures has the greatest benefits (i.e., greatest reductions in heat rate and CO2 emissions) at the lowest cost per ton of CO2 reduced. In summary, DAQ is determining CO2 emission reduction cost of -$10 per ton reasonable for four measures combined (FDF, ISB, ALR, and CO) (i.e., fuel savings itself will pay for the cost for implementing these measures). The associated heat rate reduction and CO2 emissions reduction are 68 Btu/kWh and 25,446 tons/yr, respectively. In general, these measures are expected to produce non-air environmental co-benefits in the form of reduced water usage and solid waste production, in addition to, reduced emissions of non-GHG pollutants such as SO2, NOx, and mercury. Moreover, no adverse energy impact is expected from employing the measures at Unit 3. Thus, considering cost, non-air
Marshall-Page 14 of 44
Attachment B B-90Attachment B B-90

15
environmental, and energy impacts, DAQ determines that the combined measures of FDF, ISB, ALR, and CO measures are BSER for Unit 3.
Table 3: Marshall Unit 3 Cost and Benefits as a Function of Measure Combinations
Option Measures Heat Rate Reduction
Btu/kWh
Cost per Unit CO2 Reduction $ per ton
CO2 Emissions Reductions
tons per year
- CLR with one other measure 42 16 15,840
- CLR with two or more measures 21 69 7,920
- FDF 18 16 6,664
- ISB without CO 25 -26 9,504
- ISB with CO 13 -14 4,752
- ALR 12 5 4,526
- CO 25 -17 9,504
1 CLR+ISB 67 -10 25,344
2 CLR+CO 67 -1 25,344
3 CLR+ISB+CO 59 38 22,176
4 FDF+ISB+CO+ALR 68 -10 25,446
5 FDF+ISB+ALR 55 -4 20,694
6 FDF+CO+ALR 55 4 20,694 Marshall Unit 4 Results Discussion Comparing the above estimates with the reasonable cost threshold of $23 per ton, as discussed in Section 3, each of the remaining four measures (CLR, ISB, ALR, and CO) individually costs less than or equal to $23 per ton and collectively -$15 per ton. One other measure, FDF (at $24 per ton), is available that will keep the collective cost below $23/ton. With respect to these five remaining projects, ISB, ALR and CO can be considered measures that improve boiler efficiency. When considering measures that improve an EGU’s thermal efficiency, the benefits are not necessarily cumulative, unlike the case for measures that reduce parasitic loads on the EGU, where it is a reasonable assumption to do so. The HRI likely values initially submitted by DEC and used thus far do not take into account synergistic effects. Therefore, it is reasonable to adjust the HRI values used in this analysis in those cases where multiple boiler efficiency projects are considered together as BSER. Based on confidential information DEC has supplied as justification, the HRI likely for ISB will be further reduced in this analysis. A decrease in the HRI will also result in the increase in the cost per ton of CO2 removed. One other adjustment to consider in this case is the use of CLR. DEC has supplied justification that the HRI likely value resulting from the implementation of CLR alone should not be considered additive (similar to boiler efficiency projects) when implemented with many other projects. The DAQ
Marshall-Page 15 of 44
Attachment B B-91Attachment B B-91

16
found this explanation reasonable and as a result reduced the HRI likely from the implementation of CLR when used in conjunction with two or more other measures. Making these adjustments to this combination of measures, the collective cost increases from -$15 per ton to $42 per ton, exceeding the established reasonable cost threshold. Thus, the BSER analysis needs to be reconsidered. Without CLR Measure If CLR measure is excluded from the analysis, the other four measures (FDF, ISB, ALR and CO) would result in HRI benefits of 62 Btu/kWh and CO2 reductions of 26,695 tons per year, at a collective cost of -$15 per ton. Since there are no additional measures available for consideration, there are no other measures that could be combined with these four measures, still keeping the collective cost for all measures less than or equal to $23 per ton. CLR with Other Measures There are a number of possible combinations of measures that could be evaluated. However, only those measures which are expected to provide similar or higher benefits than the benefits associated with the above scenario, “without CLR measure” (Option 4 in Table 4), will be discussed here. The results are summarized in the table below. Note the table also includes the contribution to costs and benefits associated with the CLR and ISB measures adjusted and non-adjusted as necessary.
Table 4: Marshall Unit 4 Cost and Benefits as a Function of Measure Combinations
Option Measures Heat Rate Reduction
Btu/kWh
Cost per Unit CO2 Reduction $ per ton
CO2 Emissions Reductions
tons per year
- CLR with one other measure 41 10 17,662
- CLR with two or more measures 21 57 8,831
- FDF 13 24 5,753
- ISB without CO 25 -27 10,597
- ISB with CO 12 -17 5,299
- ALR 12 -2 5,046
- CO 25 -20 10,597
1 CLR+ISB 66 -18 28,259
2 CLR+CO 66 -10 28,259
3 CLR+ISB+CO 58 20 24,727
4 FDF+ISB+CO+ALR 62 -15 26,695
5 FDF+ISB+ALR 50 -6 21,396
6 FDF+CO+ALR 50 2 21,396 It needs to be stated here that there is some uncertainty about whether the HRI benefits associated with CLR would actually be realized as per the information provided by DEC. In addition, considering only a negligible incremental improvement in heat rate associated with either a combination of measures
Marshall-Page 16 of 44
Attachment B B-92Attachment B B-92

17
CLR and ISB (66 Btu/kWh reduction) or measures CLR and CO (66 Btu/kWh reduction) over the combination of measures FDF, ISB, ALR, and CO (62 Btu/kWh reduction), DAQ recommends the following measures for BSER for Unit 4: FDF, ISB, ALR and CO. In summary, DAQ is determining CO2 emission reduction cost of -$15 per ton reasonable for four measures combined (FDF, ISB, ALR, and CO) (i.e., fuel savings itself will pay for the cost for implementing these measures). The associated heat rate reduction and CO2 emissions reduction are 62 Btu/kWh and 26,695 tons/yr, respectively. In general, these measures are expected to produce non-air environmental co-benefits in the form of reduced water usage and solid waste production, in addition to, reduced emissions of non-GHG pollutants such as SO2, NOx, and mercury. Moreover, no adverse energy impact is expected from employing the measures at Unit 4. Thus, considering cost, non-air environmental, and energy impacts, DAQ determines that the combined measures of FDF, ISB, ALR, and CO measures are BSER for Unit 4.
5. BSER for Marshall Units 1 through 4 Marshall Unit 1 BSER DEC shall implement the HRI measure ISB, starting September 1, 2019. Marshall Unit 2 BSER DEC shall implement the HRI measure ISB, starting September 1, 2019. Marshall Unit 3 BSER DEC shall implement the HRI measures FDF, ISB, ALR, and CO, starting September 1, 2019. Marshall Unit 4 BSER DEC shall implement the HRI measures FDF, ISB, ALR, and CO, starting September 1, 2019.
Marshall-Page 17 of 44
Attachment B B-93Attachment B B-93

NOTES REFERENCES
$107,397 A 1
$107,397 DC 2(a)
None
$0 IC 2(a)
$107,397 TCI = DC + IC 2(a)
$805,476 1
-$128,508 3
$676,968 2(b)
8 PL 1$13,425 TCRC = TCI/PL 2(b)
$13,425 IDAC = TCRC 2(b)
$690,392 TAC = DAC + IDAC 2(b)
1,031,260 4
9,898 4
Baseline (2012) Net Generation, MW-h 1,078,626 4
Baseline (2012) Annual Capacity Factor (heat input basis), % 25.63 4
Future (2019) Annual Capacity Factor (projected heat input basis), % 18.00 4
Future (2019) Net Generation, MW-h 757,521 5
49
37
Project Life, Years 8 1
Degradation Factor Across Project Life, % 25 1
0.50 1
0.38 1
CO2 Emissions Reduction (1st year) (corresponding to heat rate improvement), % 0.50
CO2 Emissions Reduction (nth year) (corresponding to heat rate improvement), % 0.38
3,621 6
3,992 6
2,716 6
2,994 6
173 7
205 8
231 7
274 8
202
239
43
3493
1. Duke Energy Submittal, September 11, 2015.
5. Based on baseline net generation and ratio of baseline and future capacity factors.
6. Based on baseline CO2 emissions and capacity factor, future capacity factor, and CO2 emissions reductions percentage.
7. Based on total annual cost including fuel savings and CO2 emissions reductions from baseline.
8. Based on total annual cost excluding fuel savings and CO2 emissions reductions from baseline.
Total Capital Investment (TCI)
Duke Energy Carolinas, LLCMarshall U1Annualized Cost and Cost Per Unit CO2 Reduction forControllable Loss Reduction (Maintain Unit Efficiency)
CAPITAL COST
`
Equipment Cost
Total Direct Costs
Indirect Costs
Total Indirect Costs
Baseline (2012) Net Heat Rate, Btu/kw-hr
Annual Cost
Direct Annual Costs
Fixed & Variable Operation & Maintenance Cost
Fuel Savings
Total Direct Annual Costs (DAC)
Indirect Annual Costs
Project Life
Total Capital Recovery Costs (TCRC)
Total Indirect Annual Costs (IDAC)
Total Annual CostBaseline (2012) CO2 Emissions, metric ton/yr
Cost per Short Ton of CO2 Removed (nth year of project life) (exclude fuel savings)
Heat Rate Reduction (Improvement) (1st year of project life), Btu/kw-hr
Heat Rate Reduction (Improvement) (nth year of project life), Btu/kw-hr
Heat Rate Improvement (1st year) from Baseline Net Heat Rate, %
Heat Rate Improvement (nth year) from Baseline Net Heat Rate, %
CO2 Emissions Reduction (1st year) from Baseline, Metric ton/yr
CO2 Emissions Reduction (nth year) from Baseline, Short ton/yr
CO2 Emissions Reduction (1st year) from Baseline, Metric ton/yr
CO2 Emissions Reduction (nth year) from Baseline, Metric ton/yr
Cost per Short Ton of CO2 Removed (1st year of project life) (include fuel savings)
Cost per Short Ton of CO2 Removed (1st year of project life) (exclude fuel savings)
Cost per Short Ton of CO2 Removed (nth year of project life) (include fuel savings)
4. DAQ Spreadsheet on Fleetwide Calculations for Baseline and Future Years.
Heat Rate Reduction (Improvement) (average over project life), Btu/kw-hr
CO2 Emissions Reduction from Baseline (average over project life), Short ton/yr
Average Cost per Short Ton of CO2 Removed Across the Project Life (include fuel savings)
Average Cost per Short Ton of CO2 Removed Across the Project Life (exclude fuel savings)
2. EPA Air Pollution Control Cost Manual, Sixth Edition, January 2002; EPA/452/B-02-001
a. Section 1, Chapter 2, Paragraph 2.3.1 Elements of Total Capital Investment.
b. Section 1, Chapter 2, Paragraph 2.3.2: Elements of Total Annual Cost.3. Based on baseline net generation and net heat rate, ratio of baseline and future capacity factors, heat rate improvement, and future year (2019) average coal price included in "Annual Energy Outlook 2015", US EIA.
Marshall-Page 18 of 44
Attachment B B-94Attachment B B-94

NOTES REFERENCES
$37,588,860 A 1
$37,588,860 DC 2(a)
None
$0 IC 2(a)
$37,588,860 TCI = DC + IC 2(a)
$53,698 1
-$275,374 3
-$221,675 2(b)
20 PL 1$1,879,443 TCRC = TCI/PL 2(b)
$1,879,443 IDAC = TCRC 2(b)
$1,657,768 TAC = DAC + IDAC 2(b)
1,031,260 4
9,898 4
Baseline (2012) Net Generation, MW-h 1,078,626 4
Baseline (2012) Annual Capacity Factor (heat input basis), % 25.63 4
Future (2019) Annual Capacity Factor (projected heat input basis), % 18.00 4
Future (2019) Net Generation, MW-h 757,521 5
148
37
Project Life, Years 20 1
Degradation Factor Across Project Life, % 75 1
1.50 1
0.38 1
CO2 Emissions Reduction (1st year) (corresponding to heat rate improvement), % 1.50
CO2 Emissions Reduction (nth year) (corresponding to heat rate improvement), % 0.38
10,864 6
11,975 6
2,716 6
2,994 6
138 7
161 8
554 7
646 8
346
404
93
7485
1. Duke Energy Submittal, September 11, 2015.
5. Based on baseline net generation and ratio of baseline and future capacity factors.
6. Based on baseline CO2 emissions and capacity factor, future capacity factor, and CO2 emissions reductions percentage.
7. Based on total annual cost including fuel savings and CO2 emissions reductions from baseline.
8. Based on total annual cost excluding fuel savings and CO2 emissions reductions from baseline.
Total Capital Investment (TCI)
Duke Energy Carolinas, LLCMarshall U1Annualized Cost and Cost Per Unit CO2 Reduction forTurbine Upgrades (HP, IP, LP)
CAPITAL COST
`
Equipment Cost
Total Direct Costs
Indirect Costs
Total Indirect Costs
Baseline (2012) Net Heat Rate, Btu/kw-hr
Annual Cost
Direct Annual Costs
Fixed & Variable Operation & Maintenance Cost
Fuel Savings
Total Direct Annual Costs (DAC)
Indirect Annual Costs
Project Life
Total Capital Recovery Costs (TCRC)
Total Indirect Annual Costs (IDAC)
Total Annual CostBaseline (2012) CO2 Emissions, metric ton/yr
Cost per Short Ton of CO2 Removed (nth year of project life) (exclude fuel savings)
Heat Rate Reduction (Improvement) (1st year of project life), Btu/kw-hr
Heat Rate Reduction (Improvement) (nth year of project life), Btu/kw-hr
Heat Rate Improvement (1st year) from Baseline Net Heat Rate, %
Heat Rate Improvement (nth year) from Baseline Net Heat Rate, %
CO2 Emissions Reduction (1st year) from Baseline, Metric ton/yr
CO2 Emissions Reduction (nth year) from Baseline, Short ton/yr
CO2 Emissions Reduction (1st year) from Baseline, Metric ton/yr
CO2 Emissions Reduction (nth year) from Baseline, Metric ton/yr
Cost per Short Ton of CO2 Removed (1st year of project life) (include fuel savings)
Cost per Short Ton of CO2 Removed (1st year of project life) (exclude fuel savings)
Cost per Short Ton of CO2 Removed (nth year of project life) (include fuel savings)
4. DAQ Spreadsheet on Fleetwide Calculations for Baseline and Future Years.
Heat Rate Reduction (Improvement) (average over project life), Btu/kw-hr
CO2 Emissions Reduction from Baseline (average over project life), Short ton/yr
Average Cost per Short Ton of CO2 Removed Across the Project Life (include fuel savings)
Average Cost per Short Ton of CO2 Removed Across the Project Life (exclude fuel savings)
2. EPA Air Pollution Control Cost Manual, Sixth Edition, January 2002; EPA/452/B-02-001
a. Section 1, Chapter 2, Paragraph 2.3.1 Elements of Total Capital Investment.
b. Section 1, Chapter 2, Paragraph 2.3.2: Elements of Total Annual Cost.3. Based on baseline net generation and net heat rate, ratio of baseline and future capacity factors, heat rate improvement, and future year (2019) average coal price included in "Annual Energy Outlook 2015", US EIA.
Marshall-Page 19 of 44
Attachment B B-95Attachment B B-95

NOTES REFERENCES
$429,587 A 1
$429,587 DC 2(a)
None
$0 IC 2(a)
$429,587 TCI = DC + IC 2(a)
$53,698 1
-$8,371 3
$45,327 2(b)
10 PL 1$42,959 TCRC = TCI/PL 2(b)
$42,959 IDAC = TCRC 2(b)
$88,286 TAC = DAC + IDAC 2(b)
1,031,260 4
9,898 4
Baseline (2012) Net Generation, MW-h 1,078,626 4
Baseline (2012) Annual Capacity Factor (heat input basis), % 25.63 4
Future (2019) Annual Capacity Factor (projected heat input basis), % 18.00 4
Future (2019) Net Generation, MW-h 757,521 5
3
3
Project Life, Years 10 1
Degradation Factor Across Project Life, % 10 1
0.03 1
0.03 1
CO2 Emissions Reduction (1st year) (corresponding to heat rate improvement), % 0.03
CO2 Emissions Reduction (nth year) (corresponding to heat rate improvement), % 0.03
217 6
240 6
196 6
216 6
369 7
404 8
410 7
448 8
389
426
3
228
1. Duke Energy Submittal, September 11, 2015.
5. Based on baseline net generation and ratio of baseline and future capacity factors.
6. Based on baseline CO2 emissions and capacity factor, future capacity factor, and CO2 emissions reductions percentage.
7. Based on total annual cost including fuel savings and CO2 emissions reductions from baseline.
8. Based on total annual cost excluding fuel savings and CO2 emissions reductions from baseline.
Total Capital Investment (TCI)
Duke Energy Carolinas, LLCMarshall U1Annualized Cost and Cost Per Unit CO2 Reduction forFGD Aux Load reduction through Variable Frequency Drives
CAPITAL COST
`
Equipment Cost
Total Direct Costs
Indirect Costs
Total Indirect Costs
Baseline (2012) Net Heat Rate, Btu/kw-hr
Annual Cost
Direct Annual Costs
Fixed & Variable Operation & Maintenance Cost
Fuel Savings
Total Direct Annual Costs (DAC)
Indirect Annual Costs
Project Life
Total Capital Recovery Costs (TCRC)
Total Indirect Annual Costs (IDAC)
Total Annual CostBaseline (2012) CO2 Emissions, metric ton/yr
Cost per Short Ton of CO2 Removed (nth year of project life) (exclude fuel savings)
Heat Rate Reduction (Improvement) (1st year of project life), Btu/kw-hr
Heat Rate Reduction (Improvement) (nth year of project life), Btu/kw-hr
Heat Rate Improvement (1st year) from Baseline Net Heat Rate, %
Heat Rate Improvement (nth year) from Baseline Net Heat Rate, %
CO2 Emissions Reduction (1st year) from Baseline, Metric ton/yr
CO2 Emissions Reduction (nth year) from Baseline, Short ton/yr
CO2 Emissions Reduction (1st year) from Baseline, Metric ton/yr
CO2 Emissions Reduction (nth year) from Baseline, Metric ton/yr
Cost per Short Ton of CO2 Removed (1st year of project life) (include fuel savings)
Cost per Short Ton of CO2 Removed (1st year of project life) (exclude fuel savings)
Cost per Short Ton of CO2 Removed (nth year of project life) (include fuel savings)
4. DAQ Spreadsheet on Fleetwide Calculations for Baseline and Future Years.
Heat Rate Reduction (Improvement) (average over project life), Btu/kw-hr
CO2 Emissions Reduction from Baseline (average over project life), Short ton/yr
Average Cost per Short Ton of CO2 Removed Across the Project Life (include fuel savings)
Average Cost per Short Ton of CO2 Removed Across the Project Life (exclude fuel savings)
2. EPA Air Pollution Control Cost Manual, Sixth Edition, January 2002; EPA/452/B-02-001
a. Section 1, Chapter 2, Paragraph 2.3.1 Elements of Total Capital Investment.
b. Section 1, Chapter 2, Paragraph 2.3.2: Elements of Total Annual Cost.3. Based on baseline net generation and net heat rate, ratio of baseline and future capacity factors, heat rate improvement, and future year (2019) average coal price included in "Annual Energy Outlook 2015", US EIA.
Marshall-Page 20 of 44
Attachment B B-96Attachment B B-96

NOTES REFERENCES
$8,591,739 A 1
$8,591,739 DC 2(a)
None
$0 IC 2(a)
$8,591,739 TCI = DC + IC 2(a)
$53,698 1
-$139,523 3
-$85,824 2(b)
20 PL 1$429,587 TCRC = TCI/PL 2(b)
$429,587 IDAC = TCRC 2(b)
$343,763 TAC = DAC + IDAC 2(b)
1,031,260 4
9,898 4
Baseline (2012) Net Generation, MW-h 1,078,626 4
Baseline (2012) Annual Capacity Factor (heat input basis), % 25.63 4
Future (2019) Annual Capacity Factor (projected heat input basis), % 18.00 4
Future (2019) Net Generation, MW-h 757,521 5
49
45
Project Life, Years 20 1
Degradation Factor Across Project Life, % 10 1
0.50 1
0.45 1
CO2 Emissions Reduction (1st year) (corresponding to heat rate improvement), % 0.50
CO2 Emissions Reduction (nth year) (corresponding to heat rate improvement), % 0.45
3,621 6
3,992 6
3,259 6
3,593 6
86 7
121 8
96 7
135 8
91
128
47
3792
1. Duke Energy Submittal, September 11, 2015.
5. Based on baseline net generation and ratio of baseline and future capacity factors.
6. Based on baseline CO2 emissions and capacity factor, future capacity factor, and CO2 emissions reductions percentage.
7. Based on total annual cost including fuel savings and CO2 emissions reductions from baseline.
8. Based on total annual cost excluding fuel savings and CO2 emissions reductions from baseline.
Total Capital Investment (TCI)
Duke Energy Carolinas, LLCMarshall U1Annualized Cost and Cost Per Unit CO2 Reduction forInduced Draft Fan Replacement
CAPITAL COST
`
Equipment Cost
Total Direct Costs
Indirect Costs
Total Indirect Costs
Baseline (2012) Net Heat Rate, Btu/kw-hr
Annual Cost
Direct Annual Costs
Fixed & Variable Operation & Maintenance Cost
Fuel Savings
Total Direct Annual Costs (DAC)
Indirect Annual Costs
Project Life
Total Capital Recovery Costs (TCRC)
Total Indirect Annual Costs (IDAC)
Total Annual CostBaseline (2012) CO2 Emissions, metric ton/yr
Cost per Short Ton of CO2 Removed (nth year of project life) (exclude fuel savings)
Heat Rate Reduction (Improvement) (1st year of project life), Btu/kw-hr
Heat Rate Reduction (Improvement) (nth year of project life), Btu/kw-hr
Heat Rate Improvement (1st year) from Baseline Net Heat Rate, %
Heat Rate Improvement (nth year) from Baseline Net Heat Rate, %
CO2 Emissions Reduction (1st year) from Baseline, Metric ton/yr
CO2 Emissions Reduction (nth year) from Baseline, Short ton/yr
CO2 Emissions Reduction (1st year) from Baseline, Metric ton/yr
CO2 Emissions Reduction (nth year) from Baseline, Metric ton/yr
Cost per Short Ton of CO2 Removed (1st year of project life) (include fuel savings)
Cost per Short Ton of CO2 Removed (1st year of project life) (exclude fuel savings)
Cost per Short Ton of CO2 Removed (nth year of project life) (include fuel savings)
4. DAQ Spreadsheet on Fleetwide Calculations for Baseline and Future Years.
Heat Rate Reduction (Improvement) (average over project life), Btu/kw-hr
CO2 Emissions Reduction from Baseline (average over project life), Short ton/yr
Average Cost per Short Ton of CO2 Removed Across the Project Life (include fuel savings)
Average Cost per Short Ton of CO2 Removed Across the Project Life (exclude fuel savings)
2. EPA Air Pollution Control Cost Manual, Sixth Edition, January 2002; EPA/452/B-02-001
a. Section 1, Chapter 2, Paragraph 2.3.1 Elements of Total Capital Investment.
b. Section 1, Chapter 2, Paragraph 2.3.2: Elements of Total Annual Cost.3. Based on baseline net generation and net heat rate, ratio of baseline and future capacity factors, heat rate improvement, and future year (2019) average coal price included in "Annual Energy Outlook 2015", US EIA.
Marshall-Page 21 of 44
Attachment B B-97Attachment B B-97

NOTES REFERENCES
$5,369,837 A 1
$5,369,837 DC 2(a)
None
$0 IC 2(a)
$5,369,837 TCI = DC + IC 2(a)
$80,548 1
-$111,618 3
-$31,071 2(b)
20 PL 1$268,492 TCRC = TCI/PL 2(b)
$268,492 IDAC = TCRC 2(b)
$237,421 TAC = DAC + IDAC 2(b)
1,031,260 4
9,898 4
Baseline (2012) Net Generation, MW-h 1,078,626 4
Baseline (2012) Annual Capacity Factor (heat input basis), % 25.63 4
Future (2019) Annual Capacity Factor (projected heat input basis), % 18.00 4
Future (2019) Net Generation, MW-h 757,521 5
40
36
Project Life, Years 20 1
Degradation Factor Across Project Life, % 10 1
0.40 1
0.36 1
CO2 Emissions Reduction (1st year) (corresponding to heat rate improvement), % 0.40
CO2 Emissions Reduction (nth year) (corresponding to heat rate improvement), % 0.36
2,897 6
3,193 6
2,607 6
2,874 6
74 7
109 8
83 7
121 8
78
115
38
3034
1. Duke Energy Submittal, September 11, 2015.
5. Based on baseline net generation and ratio of baseline and future capacity factors.
6. Based on baseline CO2 emissions and capacity factor, future capacity factor, and CO2 emissions reductions percentage.
7. Based on total annual cost including fuel savings and CO2 emissions reductions from baseline.
8. Based on total annual cost excluding fuel savings and CO2 emissions reductions from baseline.
Total Capital Investment (TCI)
Duke Energy Carolinas, LLCMarshall U1Annualized Cost and Cost Per Unit CO2 Reduction forForced Draft Fan Variable Frequency Drive
CAPITAL COST
`
Equipment Cost
Total Direct Costs
Indirect Costs
Total Indirect Costs
Baseline (2012) Net Heat Rate, Btu/kw-hr
Annual Cost
Direct Annual Costs
Fixed & Variable Operation & Maintenance Cost
Fuel Savings
Total Direct Annual Costs (DAC)
Indirect Annual Costs
Project Life
Total Capital Recovery Costs (TCRC)
Total Indirect Annual Costs (IDAC)
Total Annual CostBaseline (2012) CO2 Emissions, metric ton/yr
Cost per Short Ton of CO2 Removed (nth year of project life) (exclude fuel savings)
Heat Rate Reduction (Improvement) (1st year of project life), Btu/kw-hr
Heat Rate Reduction (Improvement) (nth year of project life), Btu/kw-hr
Heat Rate Improvement (1st year) from Baseline Net Heat Rate, %
Heat Rate Improvement (nth year) from Baseline Net Heat Rate, %
CO2 Emissions Reduction (1st year) from Baseline, Metric ton/yr
CO2 Emissions Reduction (nth year) from Baseline, Short ton/yr
CO2 Emissions Reduction (1st year) from Baseline, Metric ton/yr
CO2 Emissions Reduction (nth year) from Baseline, Metric ton/yr
Cost per Short Ton of CO2 Removed (1st year of project life) (include fuel savings)
Cost per Short Ton of CO2 Removed (1st year of project life) (exclude fuel savings)
Cost per Short Ton of CO2 Removed (nth year of project life) (include fuel savings)
4. DAQ Spreadsheet on Fleetwide Calculations for Baseline and Future Years.
Heat Rate Reduction (Improvement) (average over project life), Btu/kw-hr
CO2 Emissions Reduction from Baseline (average over project life), Short ton/yr
Average Cost per Short Ton of CO2 Removed Across the Project Life (include fuel savings)
Average Cost per Short Ton of CO2 Removed Across the Project Life (exclude fuel savings)
2. EPA Air Pollution Control Cost Manual, Sixth Edition, January 2002; EPA/452/B-02-001
a. Section 1, Chapter 2, Paragraph 2.3.1 Elements of Total Capital Investment.
b. Section 1, Chapter 2, Paragraph 2.3.2: Elements of Total Annual Cost.3. Based on baseline net generation and net heat rate, ratio of baseline and future capacity factors, heat rate improvement, and future year (2019) average coal price included in "Annual Energy Outlook 2015", US EIA.
Marshall-Page 22 of 44
Attachment B B-98Attachment B B-98

NOTES REFERENCES
$536,984 A 1
$536,984 DC 2(a)
None
$0 IC 2(a)
$536,984 TCI = DC + IC 2(a)
$53,698 1
-$77,105 3
-$23,406 2(b)
10 PL 1$53,698 TCRC = TCI/PL 2(b)
$53,698 IDAC = TCRC 2(b)
$30,292 TAC = DAC + IDAC 2(b)
1,031,260 4
9,898 4
Baseline (2012) Net Generation, MW-h 1,078,626 4
Baseline (2012) Annual Capacity Factor (heat input basis), % 25.63 4
Future (2019) Annual Capacity Factor (projected heat input basis), % 18.00 4
Future (2019) Net Generation, MW-h 757,521 5
30
22
Project Life, Years 10 1
Degradation Factor Across Project Life, % 25 1
0.30 1
0.23 1
CO2 Emissions Reduction (1st year) (corresponding to heat rate improvement), % 0.30
CO2 Emissions Reduction (nth year) (corresponding to heat rate improvement), % 0.23
2,173 6
2,395 6
1,630 6
1,796 6
13 7
45 8
17 7
60 8
15
52
26
2096
1. Duke Energy Submittal, September 11, 2015.
5. Based on baseline net generation and ratio of baseline and future capacity factors.
6. Based on baseline CO2 emissions and capacity factor, future capacity factor, and CO2 emissions reductions percentage.
7. Based on total annual cost including fuel savings and CO2 emissions reductions from baseline.
8. Based on total annual cost excluding fuel savings and CO2 emissions reductions from baseline.
Total Capital Investment (TCI)
Duke Energy Carolinas, LLCMarshall U1Annualized Cost and Cost Per Unit CO2 Reduction forIntelligent Sootblowers
CAPITAL COST
`
Equipment Cost
Total Direct Costs
Indirect Costs
Total Indirect Costs
Baseline (2012) Net Heat Rate, Btu/kw-hr
Annual Cost
Direct Annual Costs
Fixed & Variable Operation & Maintenance Cost
Fuel Savings
Total Direct Annual Costs (DAC)
Indirect Annual Costs
Project Life
Total Capital Recovery Costs (TCRC)
Total Indirect Annual Costs (IDAC)
Total Annual CostBaseline (2012) CO2 Emissions, metric ton/yr
Cost per Short Ton of CO2 Removed (nth year of project life) (exclude fuel savings)
Heat Rate Reduction (Improvement) (1st year of project life), Btu/kw-hr
Heat Rate Reduction (Improvement) (nth year of project life), Btu/kw-hr
Heat Rate Improvement (1st year) from Baseline Net Heat Rate, %
Heat Rate Improvement (nth year) from Baseline Net Heat Rate, %
CO2 Emissions Reduction (1st year) from Baseline, Metric ton/yr
CO2 Emissions Reduction (nth year) from Baseline, Short ton/yr
CO2 Emissions Reduction (1st year) from Baseline, Metric ton/yr
CO2 Emissions Reduction (nth year) from Baseline, Metric ton/yr
Cost per Short Ton of CO2 Removed (1st year of project life) (include fuel savings)
Cost per Short Ton of CO2 Removed (1st year of project life) (exclude fuel savings)
Cost per Short Ton of CO2 Removed (nth year of project life) (include fuel savings)
4. DAQ Spreadsheet on Fleetwide Calculations for Baseline and Future Years.
Heat Rate Reduction (Improvement) (average over project life), Btu/kw-hr
CO2 Emissions Reduction from Baseline (average over project life), Short ton/yr
Average Cost per Short Ton of CO2 Removed Across the Project Life (include fuel savings)
Average Cost per Short Ton of CO2 Removed Across the Project Life (exclude fuel savings)
2. EPA Air Pollution Control Cost Manual, Sixth Edition, January 2002; EPA/452/B-02-001
a. Section 1, Chapter 2, Paragraph 2.3.1 Elements of Total Capital Investment.
b. Section 1, Chapter 2, Paragraph 2.3.2: Elements of Total Annual Cost.3. Based on baseline net generation and net heat rate, ratio of baseline and future capacity factors, heat rate improvement, and future year (2019) average coal price included in "Annual Energy Outlook 2015", US EIA.
Marshall-Page 23 of 44
Attachment B B-99Attachment B B-99

NOTES REFERENCES
$375,889 A 1
$375,889 DC 2(a)
None
$0 IC 2(a)
$375,889 TCI = DC + IC 2(a)
$53,698 1
-$36,716 3
$16,982 2(b)
3 PL 1$125,296 TCRC = TCI/PL 2(b)
$125,296 IDAC = TCRC 2(b)
$142,278 TAC = DAC + IDAC 2(b)
1,031,260 4
9,898 4
Baseline (2012) Net Generation, MW-h 1,078,626 4
Baseline (2012) Annual Capacity Factor (heat input basis), % 25.63 4
Future (2019) Annual Capacity Factor (projected heat input basis), % 18.00 4
Future (2019) Net Generation, MW-h 757,521 5
20
5
Project Life, Years 3 1
Degradation Factor Across Project Life, % 75 1
0.20 1
0.05 1
CO2 Emissions Reduction (1st year) (corresponding to heat rate improvement), % 0.20
CO2 Emissions Reduction (nth year) (corresponding to heat rate improvement), % 0.05
1,449 6
1,597 6
362 6
399 6
89 7
112 8
356 7
448 8
223
280
12
998
1. Duke Energy Submittal, September 11, 2015.
5. Based on baseline net generation and ratio of baseline and future capacity factors.
6. Based on baseline CO2 emissions and capacity factor, future capacity factor, and CO2 emissions reductions percentage.
7. Based on total annual cost including fuel savings and CO2 emissions reductions from baseline.
8. Based on total annual cost excluding fuel savings and CO2 emissions reductions from baseline.
Total Capital Investment (TCI)
Duke Energy Carolinas, LLCMarshall U1Annualized Cost and Cost Per Unit CO2 Reduction forAH Leakage Reduction
CAPITAL COST
`
Equipment Cost
Total Direct Costs
Indirect Costs
Total Indirect Costs
Baseline (2012) Net Heat Rate, Btu/kw-hr
Annual Cost
Direct Annual Costs
Fixed & Variable Operation & Maintenance Cost
Fuel Savings
Total Direct Annual Costs (DAC)
Indirect Annual Costs
Project Life
Total Capital Recovery Costs (TCRC)
Total Indirect Annual Costs (IDAC)
Total Annual CostBaseline (2012) CO2 Emissions, metric ton/yr
Cost per Short Ton of CO2 Removed (nth year of project life) (exclude fuel savings)
Heat Rate Reduction (Improvement) (1st year of project life), Btu/kw-hr
Heat Rate Reduction (Improvement) (nth year of project life), Btu/kw-hr
Heat Rate Improvement (1st year) from Baseline Net Heat Rate, %
Heat Rate Improvement (nth year) from Baseline Net Heat Rate, %
CO2 Emissions Reduction (1st year) from Baseline, Metric ton/yr
CO2 Emissions Reduction (nth year) from Baseline, Short ton/yr
CO2 Emissions Reduction (1st year) from Baseline, Metric ton/yr
CO2 Emissions Reduction (nth year) from Baseline, Metric ton/yr
Cost per Short Ton of CO2 Removed (1st year of project life) (include fuel savings)
Cost per Short Ton of CO2 Removed (1st year of project life) (exclude fuel savings)
Cost per Short Ton of CO2 Removed (nth year of project life) (include fuel savings)
4. DAQ Spreadsheet on Fleetwide Calculations for Baseline and Future Years.
Heat Rate Reduction (Improvement) (average over project life), Btu/kw-hr
CO2 Emissions Reduction from Baseline (average over project life), Short ton/yr
Average Cost per Short Ton of CO2 Removed Across the Project Life (include fuel savings)
Average Cost per Short Ton of CO2 Removed Across the Project Life (exclude fuel savings)
2. EPA Air Pollution Control Cost Manual, Sixth Edition, January 2002; EPA/452/B-02-001
a. Section 1, Chapter 2, Paragraph 2.3.1 Elements of Total Capital Investment.
b. Section 1, Chapter 2, Paragraph 2.3.2: Elements of Total Annual Cost.3. Based on baseline net generation and net heat rate, ratio of baseline and future capacity factors, heat rate improvement, and future year (2019) average coal price included in "Annual Energy Outlook 2015", US EIA.
Marshall-Page 24 of 44
Attachment B B-100Attachment B B-100

NOTES REFERENCES
$1,073,967 A 1
$1,073,967 DC 2(a)
None
$0 IC 2(a)
$1,073,967 TCI = DC + IC 2(a)
$80,548 1
-$77,105 3
$3,443 2(b)
10 PL 1$107,397 TCRC = TCI/PL 2(b)
$107,397 IDAC = TCRC 2(b)
$110,840 TAC = DAC + IDAC 2(b)
1,031,260 4
9,898 4
Baseline (2012) Net Generation, MW-h 1,078,626 4
Baseline (2012) Annual Capacity Factor (heat input basis), % 25.63 4
Future (2019) Annual Capacity Factor (projected heat input basis), % 18.00 4
Future (2019) Net Generation, MW-h 757,521 5
30
22
Project Life, Years 10 1
Degradation Factor Across Project Life, % 25 1
0.30 1
0.23 1
CO2 Emissions Reduction (1st year) (corresponding to heat rate improvement), % 0.30
CO2 Emissions Reduction (nth year) (corresponding to heat rate improvement), % 0.23
2,173 6
2,395 6
1,630 6
1,796 6
46 7
78 8
62 7
105 8
54
92
26
2096
1. Duke Energy Submittal, September 11, 2015.
5. Based on baseline net generation and ratio of baseline and future capacity factors.
6. Based on baseline CO2 emissions and capacity factor, future capacity factor, and CO2 emissions reductions percentage.
7. Based on total annual cost including fuel savings and CO2 emissions reductions from baseline.
8. Based on total annual cost excluding fuel savings and CO2 emissions reductions from baseline.
Total Capital Investment (TCI)
Duke Energy Carolinas, LLCMarshall U1Annualized Cost and Cost Per Unit CO2 Reduction forCombustion Optimization - CCM / Excess Air / Neural Network
CAPITAL COST
`
Equipment Cost
Total Direct Costs
Indirect Costs
Total Indirect Costs
Baseline (2012) Net Heat Rate, Btu/kw-hr
Annual Cost
Direct Annual Costs
Fixed & Variable Operation & Maintenance Cost
Fuel Savings
Total Direct Annual Costs (DAC)
Indirect Annual Costs
Project Life
Total Capital Recovery Costs (TCRC)
Total Indirect Annual Costs (IDAC)
Total Annual CostBaseline (2012) CO2 Emissions, metric ton/yr
Cost per Short Ton of CO2 Removed (nth year of project life) (exclude fuel savings)
Heat Rate Reduction (Improvement) (1st year of project life), Btu/kw-hr
Heat Rate Reduction (Improvement) (nth year of project life), Btu/kw-hr
Heat Rate Improvement (1st year) from Baseline Net Heat Rate, %
Heat Rate Improvement (nth year) from Baseline Net Heat Rate, %
CO2 Emissions Reduction (1st year) from Baseline, Metric ton/yr
CO2 Emissions Reduction (nth year) from Baseline, Short ton/yr
CO2 Emissions Reduction (1st year) from Baseline, Metric ton/yr
CO2 Emissions Reduction (nth year) from Baseline, Metric ton/yr
Cost per Short Ton of CO2 Removed (1st year of project life) (include fuel savings)
Cost per Short Ton of CO2 Removed (1st year of project life) (exclude fuel savings)
Cost per Short Ton of CO2 Removed (nth year of project life) (include fuel savings)
4. DAQ Spreadsheet on Fleetwide Calculations for Baseline and Future Years.
Heat Rate Reduction (Improvement) (average over project life), Btu/kw-hr
CO2 Emissions Reduction from Baseline (average over project life), Short ton/yr
Average Cost per Short Ton of CO2 Removed Across the Project Life (include fuel savings)
Average Cost per Short Ton of CO2 Removed Across the Project Life (exclude fuel savings)
2. EPA Air Pollution Control Cost Manual, Sixth Edition, January 2002; EPA/452/B-02-001
a. Section 1, Chapter 2, Paragraph 2.3.1 Elements of Total Capital Investment.
b. Section 1, Chapter 2, Paragraph 2.3.2: Elements of Total Annual Cost.3. Based on baseline net generation and net heat rate, ratio of baseline and future capacity factors, heat rate improvement, and future year (2019) average coal price included in "Annual Energy Outlook 2015", US EIA.
Marshall-Page 25 of 44
Attachment B B-101Attachment B B-101

NOTES REFERENCES
$107,397 A 1
$107,397 DC 2(a)
None
$0 IC 2(a)
$107,397 TCI = DC + IC 2(a)
$805,476 1
-$184,112 3
$621,364 2(b)
8 PL 1$13,425 TCRC = TCI/PL 2(b)
$13,425 IDAC = TCRC 2(b)
$634,789 TAC = DAC + IDAC 2(b)
1,307,214 4
9,847 4
Baseline (2012) Net Generation, MW-h 1,370,510 4
Baseline (2012) Annual Capacity Factor (heat input basis), % 33.92 4
Future (2019) Annual Capacity Factor (projected heat input basis), % 27.00 4
Future (2019) Net Generation, MW-h 1,090,913 5
49
37
Project Life, Years 8 1
Degradation Factor Across Project Life, % 25 1
0.50 1
0.38 1
CO2 Emissions Reduction (1st year) (corresponding to heat rate improvement), % 0.50
CO2 Emissions Reduction (nth year) (corresponding to heat rate improvement), % 0.38
5,203 6
5,735 6
3,902 6
4,301 6
111 7
143 8
148 7
190 8
129
167
43
5018
1. Duke Energy Submittal, September 11, 2015.
5. Based on baseline net generation and ratio of baseline and future capacity factors.
6. Based on baseline CO2 emissions and capacity factor, future capacity factor, and CO2 emissions reductions percentage.
7. Based on total annual cost including fuel savings and CO2 emissions reductions from baseline.
8. Based on total annual cost excluding fuel savings and CO2 emissions reductions from baseline.
Total Capital Investment (TCI)
Duke Energy Carolinas, LLCMarshall U2Annualized Cost and Cost Per Unit CO2 Reduction forControllable Loss Reduction (Maintain Unit Efficiency)
CAPITAL COST
`
Equipment Cost
Total Direct Costs
Indirect Costs
Total Indirect Costs
Baseline (2012) Net Heat Rate, Btu/kw-hr
Annual Cost
Direct Annual Costs
Fixed & Variable Operation & Maintenance Cost
Fuel Savings
Total Direct Annual Costs (DAC)
Indirect Annual Costs
Project Life
Total Capital Recovery Costs (TCRC)
Total Indirect Annual Costs (IDAC)
Total Annual CostBaseline (2012) CO2 Emissions, metric ton/yr
Cost per Short Ton of CO2 Removed (nth year of project life) (exclude fuel savings)
Heat Rate Reduction (Improvement) (1st year of project life), Btu/kw-hr
Heat Rate Reduction (Improvement) (nth year of project life), Btu/kw-hr
Heat Rate Improvement (1st year) from Baseline Net Heat Rate, %
Heat Rate Improvement (nth year) from Baseline Net Heat Rate, %
CO2 Emissions Reduction (1st year) from Baseline, Metric ton/yr
CO2 Emissions Reduction (nth year) from Baseline, Short ton/yr
CO2 Emissions Reduction (1st year) from Baseline, Metric ton/yr
CO2 Emissions Reduction (nth year) from Baseline, Metric ton/yr
Cost per Short Ton of CO2 Removed (1st year of project life) (include fuel savings)
Cost per Short Ton of CO2 Removed (1st year of project life) (exclude fuel savings)
Cost per Short Ton of CO2 Removed (nth year of project life) (include fuel savings)
4. DAQ Spreadsheet on Fleetwide Calculations for Baseline and Future Years.
Heat Rate Reduction (Improvement) (average over project life), Btu/kw-hr
CO2 Emissions Reduction from Baseline (average over project life), Short ton/yr
Average Cost per Short Ton of CO2 Removed Across the Project Life (include fuel savings)
Average Cost per Short Ton of CO2 Removed Across the Project Life (exclude fuel savings)
2. EPA Air Pollution Control Cost Manual, Sixth Edition, January 2002; EPA/452/B-02-001
a. Section 1, Chapter 2, Paragraph 2.3.1 Elements of Total Capital Investment.
b. Section 1, Chapter 2, Paragraph 2.3.2: Elements of Total Annual Cost.3. Based on baseline net generation and net heat rate, ratio of baseline and future capacity factors, heat rate improvement, and future year (2019) average coal price included in "Annual Energy Outlook 2015", US EIA.
Marshall-Page 26 of 44
Attachment B B-102Attachment B B-102

NOTES REFERENCES
$9,665,707 A 1
$9,665,707 DC 2(a)
None
$0 IC 2(a)
$9,665,707 TCI = DC + IC 2(a)
$32,219 1
-$157,810 3
-$125,591 2(b)
20 PL 1$483,285 TCRC = TCI/PL 2(b)
$483,285 IDAC = TCRC 2(b)
$357,694 TAC = DAC + IDAC 2(b)
1,307,214 4
9,847 4
Baseline (2012) Net Generation, MW-h 1,370,510 4
Baseline (2012) Annual Capacity Factor (heat input basis), % 33.92 4
Future (2019) Annual Capacity Factor (projected heat input basis), % 27.00 4
Future (2019) Net Generation, MW-h 1,090,913 5
49
25
Project Life, Years 20 1
Degradation Factor Across Project Life, % 50 1
0.50 1
0.25 1
CO2 Emissions Reduction (1st year) (corresponding to heat rate improvement), % 0.50
CO2 Emissions Reduction (nth year) (corresponding to heat rate improvement), % 0.25
5,203 6
5,735 6
2,601 6
2,867 6
62 7
90 8
125 7
180 8
94
135
37
4301
1. Duke Energy Submittal, September 11, 2015.
5. Based on baseline net generation and ratio of baseline and future capacity factors.
6. Based on baseline CO2 emissions and capacity factor, future capacity factor, and CO2 emissions reductions percentage.
7. Based on total annual cost including fuel savings and CO2 emissions reductions from baseline.
8. Based on total annual cost excluding fuel savings and CO2 emissions reductions from baseline.
Total Capital Investment (TCI)
Duke Energy Carolinas, LLCMarshall U2Annualized Cost and Cost Per Unit CO2 Reduction forCondenser rebundle, retubes, rebuilds
CAPITAL COST
`
Equipment Cost
Total Direct Costs
Indirect Costs
Total Indirect Costs
Baseline (2012) Net Heat Rate, Btu/kw-hr
Annual Cost
Direct Annual Costs
Fixed & Variable Operation & Maintenance Cost
Fuel Savings
Total Direct Annual Costs (DAC)
Indirect Annual Costs
Project Life
Total Capital Recovery Costs (TCRC)
Total Indirect Annual Costs (IDAC)
Total Annual CostBaseline (2012) CO2 Emissions, metric ton/yr
Cost per Short Ton of CO2 Removed (nth year of project life) (exclude fuel savings)
Heat Rate Reduction (Improvement) (1st year of project life), Btu/kw-hr
Heat Rate Reduction (Improvement) (nth year of project life), Btu/kw-hr
Heat Rate Improvement (1st year) from Baseline Net Heat Rate, %
Heat Rate Improvement (nth year) from Baseline Net Heat Rate, %
CO2 Emissions Reduction (1st year) from Baseline, Metric ton/yr
CO2 Emissions Reduction (nth year) from Baseline, Short ton/yr
CO2 Emissions Reduction (1st year) from Baseline, Metric ton/yr
CO2 Emissions Reduction (nth year) from Baseline, Metric ton/yr
Cost per Short Ton of CO2 Removed (1st year of project life) (include fuel savings)
Cost per Short Ton of CO2 Removed (1st year of project life) (exclude fuel savings)
Cost per Short Ton of CO2 Removed (nth year of project life) (include fuel savings)
4. DAQ Spreadsheet on Fleetwide Calculations for Baseline and Future Years.
Heat Rate Reduction (Improvement) (average over project life), Btu/kw-hr
CO2 Emissions Reduction from Baseline (average over project life), Short ton/yr
Average Cost per Short Ton of CO2 Removed Across the Project Life (include fuel savings)
Average Cost per Short Ton of CO2 Removed Across the Project Life (exclude fuel savings)
2. EPA Air Pollution Control Cost Manual, Sixth Edition, January 2002; EPA/452/B-02-001
a. Section 1, Chapter 2, Paragraph 2.3.1 Elements of Total Capital Investment.
b. Section 1, Chapter 2, Paragraph 2.3.2: Elements of Total Annual Cost.3. Based on baseline net generation and net heat rate, ratio of baseline and future capacity factors, heat rate improvement, and future year (2019) average coal price included in "Annual Energy Outlook 2015", US EIA.
Marshall-Page 27 of 44
Attachment B B-103Attachment B B-103

NOTES REFERENCES
$37,588,860 A 1
$37,588,860 DC 2(a)
None
$0 IC 2(a)
$37,588,860 TCI = DC + IC 2(a)
$53,698 1
-$394,525 3
-$340,826 2(b)
20 PL 1$1,879,443 TCRC = TCI/PL 2(b)
$1,879,443 IDAC = TCRC 2(b)
$1,538,617 TAC = DAC + IDAC 2(b)
1,307,214 4
9,847 4
Baseline (2012) Net Generation, MW-h 1,370,510 4
Baseline (2012) Annual Capacity Factor (heat input basis), % 33.92 4
Future (2019) Annual Capacity Factor (projected heat input basis), % 27.00 4
Future (2019) Net Generation, MW-h 1,090,913 5
148
37
Project Life, Years 20 1
Degradation Factor Across Project Life, % 75 1
1.50 1
0.38 1
CO2 Emissions Reduction (1st year) (corresponding to heat rate improvement), % 1.50
CO2 Emissions Reduction (nth year) (corresponding to heat rate improvement), % 0.38
15,608 6
17,205 6
3,902 6
4,301 6
89 7
112 8
358 7
449 8
224
281
92
10753
1. Duke Energy Submittal, September 11, 2015.
5. Based on baseline net generation and ratio of baseline and future capacity factors.
6. Based on baseline CO2 emissions and capacity factor, future capacity factor, and CO2 emissions reductions percentage.
7. Based on total annual cost including fuel savings and CO2 emissions reductions from baseline.
8. Based on total annual cost excluding fuel savings and CO2 emissions reductions from baseline.
Total Capital Investment (TCI)
Duke Energy Carolinas, LLCMarshall U2Annualized Cost and Cost Per Unit CO2 Reduction forTurbine Upgrades (HP, IP, LP)
CAPITAL COST
`
Equipment Cost
Total Direct Costs
Indirect Costs
Total Indirect Costs
Baseline (2012) Net Heat Rate, Btu/kw-hr
Annual Cost
Direct Annual Costs
Fixed & Variable Operation & Maintenance Cost
Fuel Savings
Total Direct Annual Costs (DAC)
Indirect Annual Costs
Project Life
Total Capital Recovery Costs (TCRC)
Total Indirect Annual Costs (IDAC)
Total Annual CostBaseline (2012) CO2 Emissions, metric ton/yr
Cost per Short Ton of CO2 Removed (nth year of project life) (exclude fuel savings)
Heat Rate Reduction (Improvement) (1st year of project life), Btu/kw-hr
Heat Rate Reduction (Improvement) (nth year of project life), Btu/kw-hr
Heat Rate Improvement (1st year) from Baseline Net Heat Rate, %
Heat Rate Improvement (nth year) from Baseline Net Heat Rate, %
CO2 Emissions Reduction (1st year) from Baseline, Metric ton/yr
CO2 Emissions Reduction (nth year) from Baseline, Short ton/yr
CO2 Emissions Reduction (1st year) from Baseline, Metric ton/yr
CO2 Emissions Reduction (nth year) from Baseline, Metric ton/yr
Cost per Short Ton of CO2 Removed (1st year of project life) (include fuel savings)
Cost per Short Ton of CO2 Removed (1st year of project life) (exclude fuel savings)
Cost per Short Ton of CO2 Removed (nth year of project life) (include fuel savings)
4. DAQ Spreadsheet on Fleetwide Calculations for Baseline and Future Years.
Heat Rate Reduction (Improvement) (average over project life), Btu/kw-hr
CO2 Emissions Reduction from Baseline (average over project life), Short ton/yr
Average Cost per Short Ton of CO2 Removed Across the Project Life (include fuel savings)
Average Cost per Short Ton of CO2 Removed Across the Project Life (exclude fuel savings)
2. EPA Air Pollution Control Cost Manual, Sixth Edition, January 2002; EPA/452/B-02-001
a. Section 1, Chapter 2, Paragraph 2.3.1 Elements of Total Capital Investment.
b. Section 1, Chapter 2, Paragraph 2.3.2: Elements of Total Annual Cost.3. Based on baseline net generation and net heat rate, ratio of baseline and future capacity factors, heat rate improvement, and future year (2019) average coal price included in "Annual Energy Outlook 2015", US EIA.
Marshall-Page 28 of 44
Attachment B B-104Attachment B B-104

NOTES REFERENCES
$429,587 A 1
$429,587 DC 2(a)
None
$0 IC 2(a)
$429,587 TCI = DC + IC 2(a)
$53,698 1
-$11,994 3
$41,705 2(b)
10 PL 1$42,959 TCRC = TCI/PL 2(b)
$42,959 IDAC = TCRC 2(b)
$84,664 TAC = DAC + IDAC 2(b)
1,307,214 4
9,847 4
Baseline (2012) Net Generation, MW-h 1,370,510 4
Baseline (2012) Annual Capacity Factor (heat input basis), % 33.92 4
Future (2019) Annual Capacity Factor (projected heat input basis), % 27.00 4
Future (2019) Net Generation, MW-h 1,090,913 5
3
3
Project Life, Years 10 1
Degradation Factor Across Project Life, % 10 1
0.03 1
0.03 1
CO2 Emissions Reduction (1st year) (corresponding to heat rate improvement), % 0.03
CO2 Emissions Reduction (nth year) (corresponding to heat rate improvement), % 0.03
312 6
344 6
281 6
310 6
246 7
281 8
273 7
312 8
260
297
3
327
1. Duke Energy Submittal, September 11, 2015.
5. Based on baseline net generation and ratio of baseline and future capacity factors.
6. Based on baseline CO2 emissions and capacity factor, future capacity factor, and CO2 emissions reductions percentage.
7. Based on total annual cost including fuel savings and CO2 emissions reductions from baseline.
8. Based on total annual cost excluding fuel savings and CO2 emissions reductions from baseline.
Total Capital Investment (TCI)
Duke Energy Carolinas, LLCMarshall U2Annualized Cost and Cost Per Unit CO2 Reduction forFGD Aux Load reduction through Variable Frequency Drives
CAPITAL COST
`
Equipment Cost
Total Direct Costs
Indirect Costs
Total Indirect Costs
Baseline (2012) Net Heat Rate, Btu/kw-hr
Annual Cost
Direct Annual Costs
Fixed & Variable Operation & Maintenance Cost
Fuel Savings
Total Direct Annual Costs (DAC)
Indirect Annual Costs
Project Life
Total Capital Recovery Costs (TCRC)
Total Indirect Annual Costs (IDAC)
Total Annual CostBaseline (2012) CO2 Emissions, metric ton/yr
Cost per Short Ton of CO2 Removed (nth year of project life) (exclude fuel savings)
Heat Rate Reduction (Improvement) (1st year of project life), Btu/kw-hr
Heat Rate Reduction (Improvement) (nth year of project life), Btu/kw-hr
Heat Rate Improvement (1st year) from Baseline Net Heat Rate, %
Heat Rate Improvement (nth year) from Baseline Net Heat Rate, %
CO2 Emissions Reduction (1st year) from Baseline, Metric ton/yr
CO2 Emissions Reduction (nth year) from Baseline, Short ton/yr
CO2 Emissions Reduction (1st year) from Baseline, Metric ton/yr
CO2 Emissions Reduction (nth year) from Baseline, Metric ton/yr
Cost per Short Ton of CO2 Removed (1st year of project life) (include fuel savings)
Cost per Short Ton of CO2 Removed (1st year of project life) (exclude fuel savings)
Cost per Short Ton of CO2 Removed (nth year of project life) (include fuel savings)
4. DAQ Spreadsheet on Fleetwide Calculations for Baseline and Future Years.
Heat Rate Reduction (Improvement) (average over project life), Btu/kw-hr
CO2 Emissions Reduction from Baseline (average over project life), Short ton/yr
Average Cost per Short Ton of CO2 Removed Across the Project Life (include fuel savings)
Average Cost per Short Ton of CO2 Removed Across the Project Life (exclude fuel savings)
2. EPA Air Pollution Control Cost Manual, Sixth Edition, January 2002; EPA/452/B-02-001
a. Section 1, Chapter 2, Paragraph 2.3.1 Elements of Total Capital Investment.
b. Section 1, Chapter 2, Paragraph 2.3.2: Elements of Total Annual Cost.3. Based on baseline net generation and net heat rate, ratio of baseline and future capacity factors, heat rate improvement, and future year (2019) average coal price included in "Annual Energy Outlook 2015", US EIA.
Marshall-Page 29 of 44
Attachment B B-105Attachment B B-105

NOTES REFERENCES
$8,591,739 A 1
$8,591,739 DC 2(a)
None
$0 IC 2(a)
$8,591,739 TCI = DC + IC 2(a)
$53,698 1
-$199,893 3
-$146,194 2(b)
20 PL 1$429,587 TCRC = TCI/PL 2(b)
$429,587 IDAC = TCRC 2(b)
$283,393 TAC = DAC + IDAC 2(b)
1,307,214 4
9,847 4
Baseline (2012) Net Generation, MW-h 1,370,510 4
Baseline (2012) Annual Capacity Factor (heat input basis), % 33.92 4
Future (2019) Annual Capacity Factor (projected heat input basis), % 27.00 4
Future (2019) Net Generation, MW-h 1,090,913 5
49
44
Project Life, Years 20 1
Degradation Factor Across Project Life, % 10 1
0.50 1
0.45 1
CO2 Emissions Reduction (1st year) (corresponding to heat rate improvement), % 0.50
CO2 Emissions Reduction (nth year) (corresponding to heat rate improvement), % 0.45
5,203 6
5,735 6
4,682 6
5,161 6
49 7
84 8
55 7
94 8
52
89
47
5448
1. Duke Energy Submittal, September 11, 2015.
5. Based on baseline net generation and ratio of baseline and future capacity factors.
6. Based on baseline CO2 emissions and capacity factor, future capacity factor, and CO2 emissions reductions percentage.
7. Based on total annual cost including fuel savings and CO2 emissions reductions from baseline.
8. Based on total annual cost excluding fuel savings and CO2 emissions reductions from baseline.
Total Capital Investment (TCI)
Duke Energy Carolinas, LLCMarshall U2Annualized Cost and Cost Per Unit CO2 Reduction forInduced Draft Fan Replacement
CAPITAL COST
`
Equipment Cost
Total Direct Costs
Indirect Costs
Total Indirect Costs
Baseline (2012) Net Heat Rate, Btu/kw-hr
Annual Cost
Direct Annual Costs
Fixed & Variable Operation & Maintenance Cost
Fuel Savings
Total Direct Annual Costs (DAC)
Indirect Annual Costs
Project Life
Total Capital Recovery Costs (TCRC)
Total Indirect Annual Costs (IDAC)
Total Annual CostBaseline (2012) CO2 Emissions, metric ton/yr
Cost per Short Ton of CO2 Removed (nth year of project life) (exclude fuel savings)
Heat Rate Reduction (Improvement) (1st year of project life), Btu/kw-hr
Heat Rate Reduction (Improvement) (nth year of project life), Btu/kw-hr
Heat Rate Improvement (1st year) from Baseline Net Heat Rate, %
Heat Rate Improvement (nth year) from Baseline Net Heat Rate, %
CO2 Emissions Reduction (1st year) from Baseline, Metric ton/yr
CO2 Emissions Reduction (nth year) from Baseline, Short ton/yr
CO2 Emissions Reduction (1st year) from Baseline, Metric ton/yr
CO2 Emissions Reduction (nth year) from Baseline, Metric ton/yr
Cost per Short Ton of CO2 Removed (1st year of project life) (include fuel savings)
Cost per Short Ton of CO2 Removed (1st year of project life) (exclude fuel savings)
Cost per Short Ton of CO2 Removed (nth year of project life) (include fuel savings)
4. DAQ Spreadsheet on Fleetwide Calculations for Baseline and Future Years.
Heat Rate Reduction (Improvement) (average over project life), Btu/kw-hr
CO2 Emissions Reduction from Baseline (average over project life), Short ton/yr
Average Cost per Short Ton of CO2 Removed Across the Project Life (include fuel savings)
Average Cost per Short Ton of CO2 Removed Across the Project Life (exclude fuel savings)
2. EPA Air Pollution Control Cost Manual, Sixth Edition, January 2002; EPA/452/B-02-001
a. Section 1, Chapter 2, Paragraph 2.3.1 Elements of Total Capital Investment.
b. Section 1, Chapter 2, Paragraph 2.3.2: Elements of Total Annual Cost.3. Based on baseline net generation and net heat rate, ratio of baseline and future capacity factors, heat rate improvement, and future year (2019) average coal price included in "Annual Energy Outlook 2015", US EIA.
Marshall-Page 30 of 44
Attachment B B-106Attachment B B-106

NOTES REFERENCES
$5,369,837 A 1
$5,369,837 DC 2(a)
None
$0 IC 2(a)
$5,369,837 TCI = DC + IC 2(a)
$80,548 1
-$137,426 3
-$56,879 2(b)
20 PL 1$268,492 TCRC = TCI/PL 2(b)
$268,492 IDAC = TCRC 2(b)
$211,613 TAC = DAC + IDAC 2(b)
1,307,214 4
9,847 4
Baseline (2012) Net Generation, MW-h 1,370,510 4
Baseline (2012) Annual Capacity Factor (heat input basis), % 33.92 4
Future (2019) Annual Capacity Factor (projected heat input basis), % 27.00 4
Future (2019) Net Generation, MW-h 1,090,913 5
34
30
Project Life, Years 20 1
Degradation Factor Across Project Life, % 10 1
0.34 1
0.31 1
CO2 Emissions Reduction (1st year) (corresponding to heat rate improvement), % 0.34
CO2 Emissions Reduction (nth year) (corresponding to heat rate improvement), % 0.31
3,577 6
3,943 6
3,219 6
3,548 6
54 7
89 8
60 7
98 8
57
93
32
3746
1. Duke Energy Submittal, September 11, 2015.
5. Based on baseline net generation and ratio of baseline and future capacity factors.
6. Based on baseline CO2 emissions and capacity factor, future capacity factor, and CO2 emissions reductions percentage.
7. Based on total annual cost including fuel savings and CO2 emissions reductions from baseline.
8. Based on total annual cost excluding fuel savings and CO2 emissions reductions from baseline.
Total Capital Investment (TCI)
Duke Energy Carolinas, LLCMarshall U2Annualized Cost and Cost Per Unit CO2 Reduction forForced Draft Fan Variable Frequency Drive
CAPITAL COST
`
Equipment Cost
Total Direct Costs
Indirect Costs
Total Indirect Costs
Baseline (2012) Net Heat Rate, Btu/kw-hr
Annual Cost
Direct Annual Costs
Fixed & Variable Operation & Maintenance Cost
Fuel Savings
Total Direct Annual Costs (DAC)
Indirect Annual Costs
Project Life
Total Capital Recovery Costs (TCRC)
Total Indirect Annual Costs (IDAC)
Total Annual CostBaseline (2012) CO2 Emissions, metric ton/yr
Cost per Short Ton of CO2 Removed (nth year of project life) (exclude fuel savings)
Heat Rate Reduction (Improvement) (1st year of project life), Btu/kw-hr
Heat Rate Reduction (Improvement) (nth year of project life), Btu/kw-hr
Heat Rate Improvement (1st year) from Baseline Net Heat Rate, %
Heat Rate Improvement (nth year) from Baseline Net Heat Rate, %
CO2 Emissions Reduction (1st year) from Baseline, Metric ton/yr
CO2 Emissions Reduction (nth year) from Baseline, Short ton/yr
CO2 Emissions Reduction (1st year) from Baseline, Metric ton/yr
CO2 Emissions Reduction (nth year) from Baseline, Metric ton/yr
Cost per Short Ton of CO2 Removed (1st year of project life) (include fuel savings)
Cost per Short Ton of CO2 Removed (1st year of project life) (exclude fuel savings)
Cost per Short Ton of CO2 Removed (nth year of project life) (include fuel savings)
4. DAQ Spreadsheet on Fleetwide Calculations for Baseline and Future Years.
Heat Rate Reduction (Improvement) (average over project life), Btu/kw-hr
CO2 Emissions Reduction from Baseline (average over project life), Short ton/yr
Average Cost per Short Ton of CO2 Removed Across the Project Life (include fuel savings)
Average Cost per Short Ton of CO2 Removed Across the Project Life (exclude fuel savings)
2. EPA Air Pollution Control Cost Manual, Sixth Edition, January 2002; EPA/452/B-02-001
a. Section 1, Chapter 2, Paragraph 2.3.1 Elements of Total Capital Investment.
b. Section 1, Chapter 2, Paragraph 2.3.2: Elements of Total Annual Cost.3. Based on baseline net generation and net heat rate, ratio of baseline and future capacity factors, heat rate improvement, and future year (2019) average coal price included in "Annual Energy Outlook 2015", US EIA.
Marshall-Page 31 of 44
Attachment B B-107Attachment B B-107

NOTES REFERENCES
$536,984 A 1
$536,984 DC 2(a)
None
$0 IC 2(a)
$536,984 TCI = DC + IC 2(a)
$53,698 1
-$110,467 3
-$56,769 2(b)
10 PL 1$53,698 TCRC = TCI/PL 2(b)
$53,698 IDAC = TCRC 2(b)
-$3,070 TAC = DAC + IDAC 2(b)
1,307,214 4
9,847 4
Baseline (2012) Net Generation, MW-h 1,370,510 4
Baseline (2012) Annual Capacity Factor (heat input basis), % 33.92 4
Future (2019) Annual Capacity Factor (projected heat input basis), % 27.00 4
Future (2019) Net Generation, MW-h 1,090,913 5
30
22
Project Life, Years 10 1
Degradation Factor Across Project Life, % 25 1
0.30 1
0.23 1
CO2 Emissions Reduction (1st year) (corresponding to heat rate improvement), % 0.30
CO2 Emissions Reduction (nth year) (corresponding to heat rate improvement), % 0.23
3,122 6
3,441 6
2,341 6
2,581 6
-1 7
31 8
-1 7
42 8
-1
36
26
3011
1. Duke Energy Submittal, September 11, 2015.
5. Based on baseline net generation and ratio of baseline and future capacity factors.
6. Based on baseline CO2 emissions and capacity factor, future capacity factor, and CO2 emissions reductions percentage.
7. Based on total annual cost including fuel savings and CO2 emissions reductions from baseline.
8. Based on total annual cost excluding fuel savings and CO2 emissions reductions from baseline.
Total Capital Investment (TCI)
Duke Energy Carolinas, LLCMarshall U2Annualized Cost and Cost Per Unit CO2 Reduction forIntelligent Sootblowers
CAPITAL COST
`
Equipment Cost
Total Direct Costs
Indirect Costs
Total Indirect Costs
Baseline (2012) Net Heat Rate, Btu/kw-hr
Annual Cost
Direct Annual Costs
Fixed & Variable Operation & Maintenance Cost
Fuel Savings
Total Direct Annual Costs (DAC)
Indirect Annual Costs
Project Life
Total Capital Recovery Costs (TCRC)
Total Indirect Annual Costs (IDAC)
Total Annual CostBaseline (2012) CO2 Emissions, metric ton/yr
Cost per Short Ton of CO2 Removed (nth year of project life) (exclude fuel savings)
Heat Rate Reduction (Improvement) (1st year of project life), Btu/kw-hr
Heat Rate Reduction (Improvement) (nth year of project life), Btu/kw-hr
Heat Rate Improvement (1st year) from Baseline Net Heat Rate, %
Heat Rate Improvement (nth year) from Baseline Net Heat Rate, %
CO2 Emissions Reduction (1st year) from Baseline, Metric ton/yr
CO2 Emissions Reduction (nth year) from Baseline, Short ton/yr
CO2 Emissions Reduction (1st year) from Baseline, Metric ton/yr
CO2 Emissions Reduction (nth year) from Baseline, Metric ton/yr
Cost per Short Ton of CO2 Removed (1st year of project life) (include fuel savings)
Cost per Short Ton of CO2 Removed (1st year of project life) (exclude fuel savings)
Cost per Short Ton of CO2 Removed (nth year of project life) (include fuel savings)
4. DAQ Spreadsheet on Fleetwide Calculations for Baseline and Future Years.
Heat Rate Reduction (Improvement) (average over project life), Btu/kw-hr
CO2 Emissions Reduction from Baseline (average over project life), Short ton/yr
Average Cost per Short Ton of CO2 Removed Across the Project Life (include fuel savings)
Average Cost per Short Ton of CO2 Removed Across the Project Life (exclude fuel savings)
2. EPA Air Pollution Control Cost Manual, Sixth Edition, January 2002; EPA/452/B-02-001
a. Section 1, Chapter 2, Paragraph 2.3.1 Elements of Total Capital Investment.
b. Section 1, Chapter 2, Paragraph 2.3.2: Elements of Total Annual Cost.3. Based on baseline net generation and net heat rate, ratio of baseline and future capacity factors, heat rate improvement, and future year (2019) average coal price included in "Annual Energy Outlook 2015", US EIA.
Marshall-Page 32 of 44
Attachment B B-108Attachment B B-108

NOTES REFERENCES
$375,889 A 1
$375,889 DC 2(a)
None
$0 IC 2(a)
$375,889 TCI = DC + IC 2(a)
$53,698 1
-$52,603 3
$1,095 2(b)
3 PL 1$125,296 TCRC = TCI/PL 2(b)
$125,296 IDAC = TCRC 2(b)
$126,391 TAC = DAC + IDAC 2(b)
1,307,214 4
9,847 4
Baseline (2012) Net Generation, MW-h 1,370,510 4
Baseline (2012) Annual Capacity Factor (heat input basis), % 33.92 4
Future (2019) Annual Capacity Factor (projected heat input basis), % 27.00 4
Future (2019) Net Generation, MW-h 1,090,913 5
20
5
Project Life, Years 3 1
Degradation Factor Across Project Life, % 75 1
0.20 1
0.05 1
CO2 Emissions Reduction (1st year) (corresponding to heat rate improvement), % 0.20
CO2 Emissions Reduction (nth year) (corresponding to heat rate improvement), % 0.05
2,081 6
2,294 6
520 6
573 6
55 7
78 8
220 7
312 8
138
195
12
1434
1. Duke Energy Submittal, September 11, 2015.
5. Based on baseline net generation and ratio of baseline and future capacity factors.
6. Based on baseline CO2 emissions and capacity factor, future capacity factor, and CO2 emissions reductions percentage.
7. Based on total annual cost including fuel savings and CO2 emissions reductions from baseline.
8. Based on total annual cost excluding fuel savings and CO2 emissions reductions from baseline.
Total Capital Investment (TCI)
Duke Energy Carolinas, LLCMarshall U2Annualized Cost and Cost Per Unit CO2 Reduction forAH Leakage Reduction
CAPITAL COST
`
Equipment Cost
Total Direct Costs
Indirect Costs
Total Indirect Costs
Baseline (2012) Net Heat Rate, Btu/kw-hr
Annual Cost
Direct Annual Costs
Fixed & Variable Operation & Maintenance Cost
Fuel Savings
Total Direct Annual Costs (DAC)
Indirect Annual Costs
Project Life
Total Capital Recovery Costs (TCRC)
Total Indirect Annual Costs (IDAC)
Total Annual CostBaseline (2012) CO2 Emissions, metric ton/yr
Cost per Short Ton of CO2 Removed (nth year of project life) (exclude fuel savings)
Heat Rate Reduction (Improvement) (1st year of project life), Btu/kw-hr
Heat Rate Reduction (Improvement) (nth year of project life), Btu/kw-hr
Heat Rate Improvement (1st year) from Baseline Net Heat Rate, %
Heat Rate Improvement (nth year) from Baseline Net Heat Rate, %
CO2 Emissions Reduction (1st year) from Baseline, Metric ton/yr
CO2 Emissions Reduction (nth year) from Baseline, Short ton/yr
CO2 Emissions Reduction (1st year) from Baseline, Metric ton/yr
CO2 Emissions Reduction (nth year) from Baseline, Metric ton/yr
Cost per Short Ton of CO2 Removed (1st year of project life) (include fuel savings)
Cost per Short Ton of CO2 Removed (1st year of project life) (exclude fuel savings)
Cost per Short Ton of CO2 Removed (nth year of project life) (include fuel savings)
4. DAQ Spreadsheet on Fleetwide Calculations for Baseline and Future Years.
Heat Rate Reduction (Improvement) (average over project life), Btu/kw-hr
CO2 Emissions Reduction from Baseline (average over project life), Short ton/yr
Average Cost per Short Ton of CO2 Removed Across the Project Life (include fuel savings)
Average Cost per Short Ton of CO2 Removed Across the Project Life (exclude fuel savings)
2. EPA Air Pollution Control Cost Manual, Sixth Edition, January 2002; EPA/452/B-02-001
a. Section 1, Chapter 2, Paragraph 2.3.1 Elements of Total Capital Investment.
b. Section 1, Chapter 2, Paragraph 2.3.2: Elements of Total Annual Cost.3. Based on baseline net generation and net heat rate, ratio of baseline and future capacity factors, heat rate improvement, and future year (2019) average coal price included in "Annual Energy Outlook 2015", US EIA.
Marshall-Page 33 of 44
Attachment B B-109Attachment B B-109

NOTES REFERENCES
$1,073,967 A 1
$1,073,967 DC 2(a)
None
$0 IC 2(a)
$1,073,967 TCI = DC + IC 2(a)
$80,548 1
-$110,467 3
-$29,919 2(b)
10 PL 1$107,397 TCRC = TCI/PL 2(b)
$107,397 IDAC = TCRC 2(b)
$77,477 TAC = DAC + IDAC 2(b)
1,307,214 4
9,847 4
Baseline (2012) Net Generation, MW-h 1,370,510 4
Baseline (2012) Annual Capacity Factor (heat input basis), % 33.92 4
Future (2019) Annual Capacity Factor (projected heat input basis), % 27.00 4
Future (2019) Net Generation, MW-h 1,090,913 5
30
22
Project Life, Years 10 1
Degradation Factor Across Project Life, % 25 1
0.30 1
0.23 1
CO2 Emissions Reduction (1st year) (corresponding to heat rate improvement), % 0.30
CO2 Emissions Reduction (nth year) (corresponding to heat rate improvement), % 0.23
3,122 6
3,441 6
2,341 6
2,581 6
23 7
55 8
30 7
73 8
26
64
26
3011
1. Duke Energy Submittal, September 11, 2015.
5. Based on baseline net generation and ratio of baseline and future capacity factors.
6. Based on baseline CO2 emissions and capacity factor, future capacity factor, and CO2 emissions reductions percentage.
7. Based on total annual cost including fuel savings and CO2 emissions reductions from baseline.
8. Based on total annual cost excluding fuel savings and CO2 emissions reductions from baseline.
Total Capital Investment (TCI)
Duke Energy Carolinas, LLCMarshall U2Annualized Cost and Cost Per Unit CO2 Reduction forCombustion Optimization - CCM / Excess Air / Neural Network
CAPITAL COST
`
Equipment Cost
Total Direct Costs
Indirect Costs
Total Indirect Costs
Baseline (2012) Net Heat Rate, Btu/kw-hr
Annual Cost
Direct Annual Costs
Fixed & Variable Operation & Maintenance Cost
Fuel Savings
Total Direct Annual Costs (DAC)
Indirect Annual Costs
Project Life
Total Capital Recovery Costs (TCRC)
Total Indirect Annual Costs (IDAC)
Total Annual CostBaseline (2012) CO2 Emissions, metric ton/yr
Cost per Short Ton of CO2 Removed (nth year of project life) (exclude fuel savings)
Heat Rate Reduction (Improvement) (1st year of project life), Btu/kw-hr
Heat Rate Reduction (Improvement) (nth year of project life), Btu/kw-hr
Heat Rate Improvement (1st year) from Baseline Net Heat Rate, %
Heat Rate Improvement (nth year) from Baseline Net Heat Rate, %
CO2 Emissions Reduction (1st year) from Baseline, Metric ton/yr
CO2 Emissions Reduction (nth year) from Baseline, Short ton/yr
CO2 Emissions Reduction (1st year) from Baseline, Metric ton/yr
CO2 Emissions Reduction (nth year) from Baseline, Metric ton/yr
Cost per Short Ton of CO2 Removed (1st year of project life) (include fuel savings)
Cost per Short Ton of CO2 Removed (1st year of project life) (exclude fuel savings)
Cost per Short Ton of CO2 Removed (nth year of project life) (include fuel savings)
4. DAQ Spreadsheet on Fleetwide Calculations for Baseline and Future Years.
Heat Rate Reduction (Improvement) (average over project life), Btu/kw-hr
CO2 Emissions Reduction from Baseline (average over project life), Short ton/yr
Average Cost per Short Ton of CO2 Removed Across the Project Life (include fuel savings)
Average Cost per Short Ton of CO2 Removed Across the Project Life (exclude fuel savings)
2. EPA Air Pollution Control Cost Manual, Sixth Edition, January 2002; EPA/452/B-02-001
a. Section 1, Chapter 2, Paragraph 2.3.1 Elements of Total Capital Investment.
b. Section 1, Chapter 2, Paragraph 2.3.2: Elements of Total Annual Cost.3. Based on baseline net generation and net heat rate, ratio of baseline and future capacity factors, heat rate improvement, and future year (2019) average coal price included in "Annual Energy Outlook 2015", US EIA.
Marshall-Page 34 of 44
Attachment B B-110Attachment B B-110

NOTES REFERENCES
$107,397 A 1
$107,397 DC 2(a)
None
$0 IC 2(a)
$107,397 TCI = DC + IC 2(a)
$805,476 1
-$574,796 3
$230,679 2(b)
8 PL 1$13,425 TCRC = TCI/PL 2(b)
$13,425 IDAC = TCRC 2(b)
$244,104 TAC = DAC + IDAC 2(b)
3,062,975 4
9,584 4
Baseline (2012) Net Generation, MW-h 3,263,260 4
Baseline (2012) Annual Capacity Factor (heat input basis), % 47.56 4
Future (2019) Annual Capacity Factor (projected heat input basis), % 51.00 4
Future (2019) Net Generation, MW-h 3,499,291 5
48
36
Project Life, Years 8 1
Degradation Factor Across Project Life, % 25 1
0.50 1
0.38 1
CO2 Emissions Reduction (1st year) (corresponding to heat rate improvement), % 0.50
CO2 Emissions Reduction (nth year) (corresponding to heat rate improvement), % 0.38
16,423 6
18,103 6
12,317 6
13,577 6
13 7
45 8
18 7
60 8
16
53
42
15840
1. Duke Energy Submittal, September 11, 2015.
5. Based on baseline net generation and ratio of baseline and future capacity factors.
6. Based on baseline CO2 emissions and capacity factor, future capacity factor, and CO2 emissions reductions percentage.
7. Based on total annual cost including fuel savings and CO2 emissions reductions from baseline.
8. Based on total annual cost excluding fuel savings and CO2 emissions reductions from baseline.
Total Capital Investment (TCI)
Duke Energy Carolinas, LLCMarshall U3Annualized Cost and Cost Per Unit CO2 Reduction forControllable Loss Reduction (Maintain Unit Efficiency)
CAPITAL COST
`
Equipment Cost
Total Direct Costs
Indirect Costs
Total Indirect Costs
Baseline (2012) Net Heat Rate, Btu/kw-hr
Annual Cost
Direct Annual Costs
Fixed & Variable Operation & Maintenance Cost
Fuel Savings
Total Direct Annual Costs (DAC)
Indirect Annual Costs
Project Life
Total Capital Recovery Costs (TCRC)
Total Indirect Annual Costs (IDAC)
Total Annual CostBaseline (2012) CO2 Emissions, metric ton/yr
Cost per Short Ton of CO2 Removed (nth year of project life) (exclude fuel savings)
Heat Rate Reduction (Improvement) (1st year of project life), Btu/kw-hr
Heat Rate Reduction (Improvement) (nth year of project life), Btu/kw-hr
Heat Rate Improvement (1st year) from Baseline Net Heat Rate, %
Heat Rate Improvement (nth year) from Baseline Net Heat Rate, %
CO2 Emissions Reduction (1st year) from Baseline, Metric ton/yr
CO2 Emissions Reduction (nth year) from Baseline, Short ton/yr
CO2 Emissions Reduction (1st year) from Baseline, Metric ton/yr
CO2 Emissions Reduction (nth year) from Baseline, Metric ton/yr
Cost per Short Ton of CO2 Removed (1st year of project life) (include fuel savings)
Cost per Short Ton of CO2 Removed (1st year of project life) (exclude fuel savings)
Cost per Short Ton of CO2 Removed (nth year of project life) (include fuel savings)
4. DAQ Spreadsheet on Fleetwide Calculations for Baseline and Future Years.
Heat Rate Reduction (Improvement) (average over project life), Btu/kw-hr
CO2 Emissions Reduction from Baseline (average over project life), Short ton/yr
Average Cost per Short Ton of CO2 Removed Across the Project Life (include fuel savings)
Average Cost per Short Ton of CO2 Removed Across the Project Life (exclude fuel savings)
2. EPA Air Pollution Control Cost Manual, Sixth Edition, January 2002; EPA/452/B-02-001
a. Section 1, Chapter 2, Paragraph 2.3.1 Elements of Total Capital Investment.
b. Section 1, Chapter 2, Paragraph 2.3.2: Elements of Total Annual Cost.3. Based on baseline net generation and net heat rate, ratio of baseline and future capacity factors, heat rate improvement, and future year (2019) average coal price included in "Annual Energy Outlook 2015", US EIA.
Marshall-Page 35 of 44
Attachment B B-111Attachment B B-111

NOTES REFERENCES
$5,369,837 A 1
$5,369,837 DC 2(a)
None
$0 IC 2(a)
$5,369,837 TCI = DC + IC 2(a)
$80,548 1
-$241,825 3
-$161,277 2(b)
20 PL 1$268,492 TCRC = TCI/PL 2(b)
$268,492 IDAC = TCRC 2(b)
$107,214 TAC = DAC + IDAC 2(b)
3,062,975 4
9,584 4
Baseline (2012) Net Generation, MW-h 3,263,260 4
Baseline (2012) Annual Capacity Factor (heat input basis), % 47.56 4
Future (2019) Annual Capacity Factor (projected heat input basis), % 51.00 4
Future (2019) Net Generation, MW-h 3,499,291 5
19
17
Project Life, Years 20 1
Degradation Factor Across Project Life, % 10 1
0.19 1
0.17 1
CO2 Emissions Reduction (1st year) (corresponding to heat rate improvement), % 0.19
CO2 Emissions Reduction (nth year) (corresponding to heat rate improvement), % 0.17
6,364 6
7,015 6
5,727 6
6,313 6
15 7
50 8
17 7
55 8
16
53
18
6664
1. Duke Energy Submittal, September 11, 2015.
5. Based on baseline net generation and ratio of baseline and future capacity factors.
6. Based on baseline CO2 emissions and capacity factor, future capacity factor, and CO2 emissions reductions percentage.
7. Based on total annual cost including fuel savings and CO2 emissions reductions from baseline.
8. Based on total annual cost excluding fuel savings and CO2 emissions reductions from baseline.
Total Capital Investment (TCI)
Duke Energy Carolinas, LLCMarshall U3Annualized Cost and Cost Per Unit CO2 Reduction forForced Draft Fan Variable Frequency Drive
CAPITAL COST
`
Equipment Cost
Total Direct Costs
Indirect Costs
Total Indirect Costs
Baseline (2012) Net Heat Rate, Btu/kw-hr
Annual Cost
Direct Annual Costs
Fixed & Variable Operation & Maintenance Cost
Fuel Savings
Total Direct Annual Costs (DAC)
Indirect Annual Costs
Project Life
Total Capital Recovery Costs (TCRC)
Total Indirect Annual Costs (IDAC)
Total Annual CostBaseline (2012) CO2 Emissions, metric ton/yr
Cost per Short Ton of CO2 Removed (nth year of project life) (exclude fuel savings)
Heat Rate Reduction (Improvement) (1st year of project life), Btu/kw-hr
Heat Rate Reduction (Improvement) (nth year of project life), Btu/kw-hr
Heat Rate Improvement (1st year) from Baseline Net Heat Rate, %
Heat Rate Improvement (nth year) from Baseline Net Heat Rate, %
CO2 Emissions Reduction (1st year) from Baseline, Metric ton/yr
CO2 Emissions Reduction (nth year) from Baseline, Short ton/yr
CO2 Emissions Reduction (1st year) from Baseline, Metric ton/yr
CO2 Emissions Reduction (nth year) from Baseline, Metric ton/yr
Cost per Short Ton of CO2 Removed (1st year of project life) (include fuel savings)
Cost per Short Ton of CO2 Removed (1st year of project life) (exclude fuel savings)
Cost per Short Ton of CO2 Removed (nth year of project life) (include fuel savings)
4. DAQ Spreadsheet on Fleetwide Calculations for Baseline and Future Years.
Heat Rate Reduction (Improvement) (average over project life), Btu/kw-hr
CO2 Emissions Reduction from Baseline (average over project life), Short ton/yr
Average Cost per Short Ton of CO2 Removed Across the Project Life (include fuel savings)
Average Cost per Short Ton of CO2 Removed Across the Project Life (exclude fuel savings)
2. EPA Air Pollution Control Cost Manual, Sixth Edition, January 2002; EPA/452/B-02-001
a. Section 1, Chapter 2, Paragraph 2.3.1 Elements of Total Capital Investment.
b. Section 1, Chapter 2, Paragraph 2.3.2: Elements of Total Annual Cost.3. Based on baseline net generation and net heat rate, ratio of baseline and future capacity factors, heat rate improvement, and future year (2019) average coal price included in "Annual Energy Outlook 2015", US EIA.
Marshall-Page 36 of 44
Attachment B B-112Attachment B B-112

NOTES REFERENCES
$536,984 A 1
$536,984 DC 2(a)
None
$0 IC 2(a)
$536,984 TCI = DC + IC 2(a)
$53,698 1
-$172,439 3
-$118,740 2(b)
10 PL 1$53,698 TCRC = TCI/PL 2(b)
$53,698 IDAC = TCRC 2(b)
-$65,042 TAC = DAC + IDAC 2(b)
3,062,975 4
9,584 4
Baseline (2012) Net Generation, MW-h 3,263,260 4
Baseline (2012) Annual Capacity Factor (heat input basis), % 47.56 4
Future (2019) Annual Capacity Factor (projected heat input basis), % 51.00 4
Future (2019) Net Generation, MW-h 3,499,291 5
14
11
Project Life, Years 10 1
Degradation Factor Across Project Life, % 25 1
0.15 1
0.11 1
CO2 Emissions Reduction (1st year) (corresponding to heat rate improvement), % 0.15
CO2 Emissions Reduction (nth year) (corresponding to heat rate improvement), % 0.11
4,927 6
5,431 6
3,695 6
4,073 6
-12 7
20 8
-16 7
26 8
-14
23
13
4752
1. Duke Energy Submittal, September 11, 2015.
5. Based on baseline net generation and ratio of baseline and future capacity factors.
6. Based on baseline CO2 emissions and capacity factor, future capacity factor, and CO2 emissions reductions percentage.
7. Based on total annual cost including fuel savings and CO2 emissions reductions from baseline.
8. Based on total annual cost excluding fuel savings and CO2 emissions reductions from baseline.
Total Capital Investment (TCI)
Duke Energy Carolinas, LLCMarshall U3Annualized Cost and Cost Per Unit CO2 Reduction forIntelligent Sootblowers
CAPITAL COST
`
Equipment Cost
Total Direct Costs
Indirect Costs
Total Indirect Costs
Baseline (2012) Net Heat Rate, Btu/kw-hr
Annual Cost
Direct Annual Costs
Fixed & Variable Operation & Maintenance Cost
Fuel Savings
Total Direct Annual Costs (DAC)
Indirect Annual Costs
Project Life
Total Capital Recovery Costs (TCRC)
Total Indirect Annual Costs (IDAC)
Total Annual CostBaseline (2012) CO2 Emissions, metric ton/yr
Cost per Short Ton of CO2 Removed (nth year of project life) (exclude fuel savings)
Heat Rate Reduction (Improvement) (1st year of project life), Btu/kw-hr
Heat Rate Reduction (Improvement) (nth year of project life), Btu/kw-hr
Heat Rate Improvement (1st year) from Baseline Net Heat Rate, %
Heat Rate Improvement (nth year) from Baseline Net Heat Rate, %
CO2 Emissions Reduction (1st year) from Baseline, Metric ton/yr
CO2 Emissions Reduction (nth year) from Baseline, Short ton/yr
CO2 Emissions Reduction (1st year) from Baseline, Metric ton/yr
CO2 Emissions Reduction (nth year) from Baseline, Metric ton/yr
Cost per Short Ton of CO2 Removed (1st year of project life) (include fuel savings)
Cost per Short Ton of CO2 Removed (1st year of project life) (exclude fuel savings)
Cost per Short Ton of CO2 Removed (nth year of project life) (include fuel savings)
4. DAQ Spreadsheet on Fleetwide Calculations for Baseline and Future Years.
Heat Rate Reduction (Improvement) (average over project life), Btu/kw-hr
CO2 Emissions Reduction from Baseline (average over project life), Short ton/yr
Average Cost per Short Ton of CO2 Removed Across the Project Life (include fuel savings)
Average Cost per Short Ton of CO2 Removed Across the Project Life (exclude fuel savings)
2. EPA Air Pollution Control Cost Manual, Sixth Edition, January 2002; EPA/452/B-02-001
a. Section 1, Chapter 2, Paragraph 2.3.1 Elements of Total Capital Investment.
b. Section 1, Chapter 2, Paragraph 2.3.2: Elements of Total Annual Cost.3. Based on baseline net generation and net heat rate, ratio of baseline and future capacity factors, heat rate improvement, and future year (2019) average coal price included in "Annual Energy Outlook 2015", US EIA.
Marshall-Page 37 of 44
Attachment B B-113Attachment B B-113

NOTES REFERENCES
$375,889 A 1
$375,889 DC 2(a)
None
$0 IC 2(a)
$375,889 TCI = DC + IC 2(a)
$53,698 1
-$164,227 3
-$110,529 2(b)
3 PL 1$125,296 TCRC = TCI/PL 2(b)
$125,296 IDAC = TCRC 2(b)
$14,767 TAC = DAC + IDAC 2(b)
3,062,975 4
9,584 4
Baseline (2012) Net Generation, MW-h 3,263,260 4
Baseline (2012) Annual Capacity Factor (heat input basis), % 47.56 4
Future (2019) Annual Capacity Factor (projected heat input basis), % 51.00 4
Future (2019) Net Generation, MW-h 3,499,291 5
19
5
Project Life, Years 3 1
Degradation Factor Across Project Life, % 75 1
0.20 1
0.05 1
CO2 Emissions Reduction (1st year) (corresponding to heat rate improvement), % 0.20
CO2 Emissions Reduction (nth year) (corresponding to heat rate improvement), % 0.05
6,569 6
7,241 6
1,642 6
1,810 6
2 7
25 8
8 7
99 8
5
62
12
4526
1. Duke Energy Submittal, September 11, 2015.
5. Based on baseline net generation and ratio of baseline and future capacity factors.
6. Based on baseline CO2 emissions and capacity factor, future capacity factor, and CO2 emissions reductions percentage.
7. Based on total annual cost including fuel savings and CO2 emissions reductions from baseline.
8. Based on total annual cost excluding fuel savings and CO2 emissions reductions from baseline.
Total Capital Investment (TCI)
Duke Energy Carolinas, LLCMarshall U3Annualized Cost and Cost Per Unit CO2 Reduction forAH Leakage Reduction
CAPITAL COST
`
Equipment Cost
Total Direct Costs
Indirect Costs
Total Indirect Costs
Baseline (2012) Net Heat Rate, Btu/kw-hr
Annual Cost
Direct Annual Costs
Fixed & Variable Operation & Maintenance Cost
Fuel Savings
Total Direct Annual Costs (DAC)
Indirect Annual Costs
Project Life
Total Capital Recovery Costs (TCRC)
Total Indirect Annual Costs (IDAC)
Total Annual CostBaseline (2012) CO2 Emissions, metric ton/yr
Cost per Short Ton of CO2 Removed (nth year of project life) (exclude fuel savings)
Heat Rate Reduction (Improvement) (1st year of project life), Btu/kw-hr
Heat Rate Reduction (Improvement) (nth year of project life), Btu/kw-hr
Heat Rate Improvement (1st year) from Baseline Net Heat Rate, %
Heat Rate Improvement (nth year) from Baseline Net Heat Rate, %
CO2 Emissions Reduction (1st year) from Baseline, Metric ton/yr
CO2 Emissions Reduction (nth year) from Baseline, Short ton/yr
CO2 Emissions Reduction (1st year) from Baseline, Metric ton/yr
CO2 Emissions Reduction (nth year) from Baseline, Metric ton/yr
Cost per Short Ton of CO2 Removed (1st year of project life) (include fuel savings)
Cost per Short Ton of CO2 Removed (1st year of project life) (exclude fuel savings)
Cost per Short Ton of CO2 Removed (nth year of project life) (include fuel savings)
4. DAQ Spreadsheet on Fleetwide Calculations for Baseline and Future Years.
Heat Rate Reduction (Improvement) (average over project life), Btu/kw-hr
CO2 Emissions Reduction from Baseline (average over project life), Short ton/yr
Average Cost per Short Ton of CO2 Removed Across the Project Life (include fuel savings)
Average Cost per Short Ton of CO2 Removed Across the Project Life (exclude fuel savings)
2. EPA Air Pollution Control Cost Manual, Sixth Edition, January 2002; EPA/452/B-02-001
a. Section 1, Chapter 2, Paragraph 2.3.1 Elements of Total Capital Investment.
b. Section 1, Chapter 2, Paragraph 2.3.2: Elements of Total Annual Cost.3. Based on baseline net generation and net heat rate, ratio of baseline and future capacity factors, heat rate improvement, and future year (2019) average coal price included in "Annual Energy Outlook 2015", US EIA.
Marshall-Page 38 of 44
Attachment B B-114Attachment B B-114

NOTES REFERENCES
$1,073,967 A 1
$1,073,967 DC 2(a)
None
$0 IC 2(a)
$1,073,967 TCI = DC + IC 2(a)
$80,548 1
-$344,878 3
-$264,330 2(b)
10 PL 1$107,397 TCRC = TCI/PL 2(b)
$107,397 IDAC = TCRC 2(b)
-$156,933 TAC = DAC + IDAC 2(b)
3,062,975 4
9,584 4
Baseline (2012) Net Generation, MW-h 3,263,260 4
Baseline (2012) Annual Capacity Factor (heat input basis), % 47.56 4
Future (2019) Annual Capacity Factor (projected heat input basis), % 51.00 4
Future (2019) Net Generation, MW-h 3,499,291 5
29
22
Project Life, Years 10 1
Degradation Factor Across Project Life, % 25 1
0.30 1
0.23 1
CO2 Emissions Reduction (1st year) (corresponding to heat rate improvement), % 0.30
CO2 Emissions Reduction (nth year) (corresponding to heat rate improvement), % 0.23
9,854 6
10,862 6
7,390 6
8,146 6
-14 7
17 8
-19 7
23 8
-17
20
25
9504
1. Duke Energy Submittal, September 11, 2015.
5. Based on baseline net generation and ratio of baseline and future capacity factors.
6. Based on baseline CO2 emissions and capacity factor, future capacity factor, and CO2 emissions reductions percentage.
7. Based on total annual cost including fuel savings and CO2 emissions reductions from baseline.
8. Based on total annual cost excluding fuel savings and CO2 emissions reductions from baseline.
Total Capital Investment (TCI)
Duke Energy Carolinas, LLCMarshall U3Annualized Cost and Cost Per Unit CO2 Reduction forCombustion Optimization - CCM / Excess Air / Neural Network
CAPITAL COST
`
Equipment Cost
Total Direct Costs
Indirect Costs
Total Indirect Costs
Baseline (2012) Net Heat Rate, Btu/kw-hr
Annual Cost
Direct Annual Costs
Fixed & Variable Operation & Maintenance Cost
Fuel Savings
Total Direct Annual Costs (DAC)
Indirect Annual Costs
Project Life
Total Capital Recovery Costs (TCRC)
Total Indirect Annual Costs (IDAC)
Total Annual CostBaseline (2012) CO2 Emissions, metric ton/yr
Cost per Short Ton of CO2 Removed (nth year of project life) (exclude fuel savings)
Heat Rate Reduction (Improvement) (1st year of project life), Btu/kw-hr
Heat Rate Reduction (Improvement) (nth year of project life), Btu/kw-hr
Heat Rate Improvement (1st year) from Baseline Net Heat Rate, %
Heat Rate Improvement (nth year) from Baseline Net Heat Rate, %
CO2 Emissions Reduction (1st year) from Baseline, Metric ton/yr
CO2 Emissions Reduction (nth year) from Baseline, Short ton/yr
CO2 Emissions Reduction (1st year) from Baseline, Metric ton/yr
CO2 Emissions Reduction (nth year) from Baseline, Metric ton/yr
Cost per Short Ton of CO2 Removed (1st year of project life) (include fuel savings)
Cost per Short Ton of CO2 Removed (1st year of project life) (exclude fuel savings)
Cost per Short Ton of CO2 Removed (nth year of project life) (include fuel savings)
4. DAQ Spreadsheet on Fleetwide Calculations for Baseline and Future Years.
Heat Rate Reduction (Improvement) (average over project life), Btu/kw-hr
CO2 Emissions Reduction from Baseline (average over project life), Short ton/yr
Average Cost per Short Ton of CO2 Removed Across the Project Life (include fuel savings)
Average Cost per Short Ton of CO2 Removed Across the Project Life (exclude fuel savings)
2. EPA Air Pollution Control Cost Manual, Sixth Edition, January 2002; EPA/452/B-02-001
a. Section 1, Chapter 2, Paragraph 2.3.1 Elements of Total Capital Investment.
b. Section 1, Chapter 2, Paragraph 2.3.2: Elements of Total Annual Cost.3. Based on baseline net generation and net heat rate, ratio of baseline and future capacity factors, heat rate improvement, and future year (2019) average coal price included in "Annual Energy Outlook 2015", US EIA.
Marshall-Page 39 of 44
Attachment B B-115Attachment B B-115
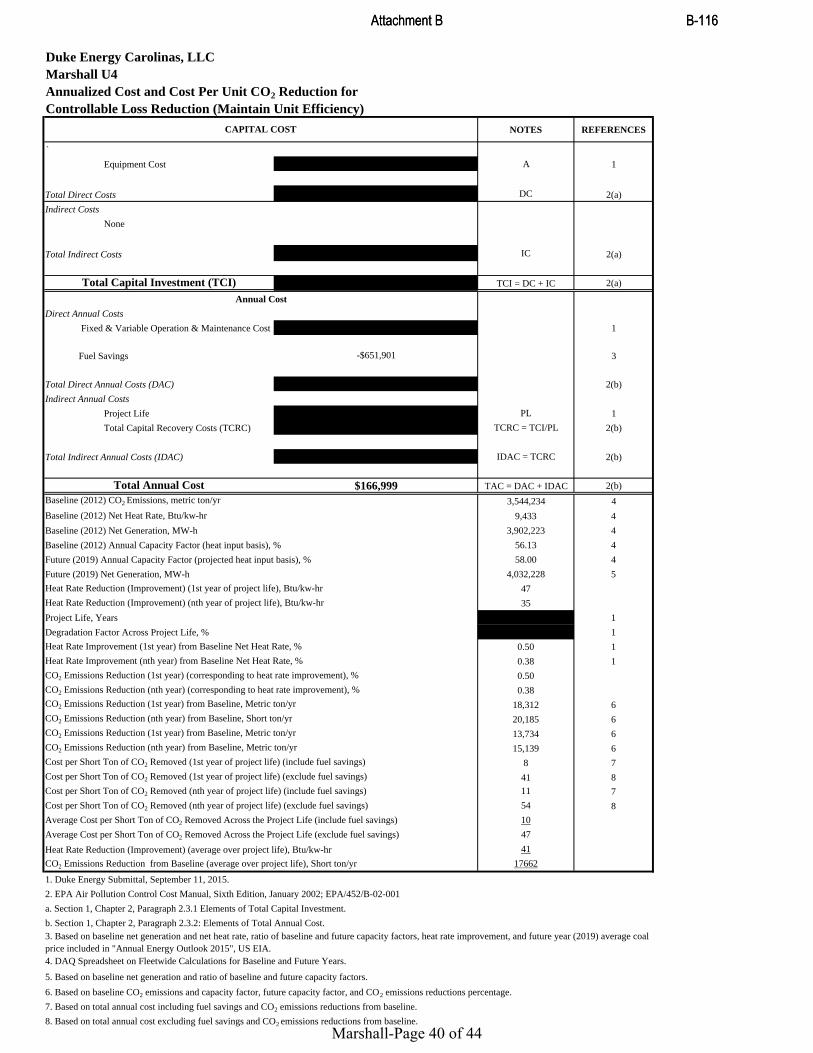
NOTES REFERENCES
$107,397 A 1
$107,397 DC 2(a)
None
$0 IC 2(a)
$107,397 TCI = DC + IC 2(a)
$805,476 1
-$651,901 3
$153,574 2(b)
8 PL 1$13,425 TCRC = TCI/PL 2(b)
$13,425 IDAC = TCRC 2(b)
$166,999 TAC = DAC + IDAC 2(b)
3,544,234 4
9,433 4
Baseline (2012) Net Generation, MW-h 3,902,223 4
Baseline (2012) Annual Capacity Factor (heat input basis), % 56.13 4
Future (2019) Annual Capacity Factor (projected heat input basis), % 58.00 4
Future (2019) Net Generation, MW-h 4,032,228 5
47
35
Project Life, Years 8 1
Degradation Factor Across Project Life, % 25 1
0.50 1
0.38 1
CO2 Emissions Reduction (1st year) (corresponding to heat rate improvement), % 0.50
CO2 Emissions Reduction (nth year) (corresponding to heat rate improvement), % 0.38
18,312 6
20,185 6
13,734 6
15,139 6
8 7
41 8
11 7
54 8
10
47
41
17662
1. Duke Energy Submittal, September 11, 2015.
5. Based on baseline net generation and ratio of baseline and future capacity factors.
6. Based on baseline CO2 emissions and capacity factor, future capacity factor, and CO2 emissions reductions percentage.
7. Based on total annual cost including fuel savings and CO2 emissions reductions from baseline.
8. Based on total annual cost excluding fuel savings and CO2 emissions reductions from baseline.
Total Capital Investment (TCI)
Duke Energy Carolinas, LLCMarshall U4Annualized Cost and Cost Per Unit CO2 Reduction forControllable Loss Reduction (Maintain Unit Efficiency)
CAPITAL COST
`
Equipment Cost
Total Direct Costs
Indirect Costs
Total Indirect Costs
Baseline (2012) Net Heat Rate, Btu/kw-hr
Annual Cost
Direct Annual Costs
Fixed & Variable Operation & Maintenance Cost
Fuel Savings
Total Direct Annual Costs (DAC)
Indirect Annual Costs
Project Life
Total Capital Recovery Costs (TCRC)
Total Indirect Annual Costs (IDAC)
Total Annual CostBaseline (2012) CO2 Emissions, metric ton/yr
Cost per Short Ton of CO2 Removed (nth year of project life) (exclude fuel savings)
Heat Rate Reduction (Improvement) (1st year of project life), Btu/kw-hr
Heat Rate Reduction (Improvement) (nth year of project life), Btu/kw-hr
Heat Rate Improvement (1st year) from Baseline Net Heat Rate, %
Heat Rate Improvement (nth year) from Baseline Net Heat Rate, %
CO2 Emissions Reduction (1st year) from Baseline, Metric ton/yr
CO2 Emissions Reduction (nth year) from Baseline, Short ton/yr
CO2 Emissions Reduction (1st year) from Baseline, Metric ton/yr
CO2 Emissions Reduction (nth year) from Baseline, Metric ton/yr
Cost per Short Ton of CO2 Removed (1st year of project life) (include fuel savings)
Cost per Short Ton of CO2 Removed (1st year of project life) (exclude fuel savings)
Cost per Short Ton of CO2 Removed (nth year of project life) (include fuel savings)
4. DAQ Spreadsheet on Fleetwide Calculations for Baseline and Future Years.
Heat Rate Reduction (Improvement) (average over project life), Btu/kw-hr
CO2 Emissions Reduction from Baseline (average over project life), Short ton/yr
Average Cost per Short Ton of CO2 Removed Across the Project Life (include fuel savings)
Average Cost per Short Ton of CO2 Removed Across the Project Life (exclude fuel savings)
2. EPA Air Pollution Control Cost Manual, Sixth Edition, January 2002; EPA/452/B-02-001
a. Section 1, Chapter 2, Paragraph 2.3.1 Elements of Total Capital Investment.
b. Section 1, Chapter 2, Paragraph 2.3.2: Elements of Total Annual Cost.3. Based on baseline net generation and net heat rate, ratio of baseline and future capacity factors, heat rate improvement, and future year (2019) average coal price included in "Annual Energy Outlook 2015", US EIA.
Marshall-Page 40 of 44
Attachment B B-116Attachment B B-116

NOTES REFERENCES
$5,369,837 A 1
$5,369,837 DC 2(a)
None
$0 IC 2(a)
$5,369,837 TCI = DC + IC 2(a)
$80,548 1
-$212,334 3
-$131,786 2(b)
20 PL 1$268,492 TCRC = TCI/PL 2(b)
$268,492 IDAC = TCRC 2(b)
$136,706 TAC = DAC + IDAC 2(b)
3,544,234 4
9,433 4
Baseline (2012) Net Generation, MW-h 3,902,223 4
Baseline (2012) Annual Capacity Factor (heat input basis), % 56.13 4
Future (2019) Annual Capacity Factor (projected heat input basis), % 58.00 4
Future (2019) Net Generation, MW-h 4,032,228 5
14
13
Project Life, Years 20 1
Degradation Factor Across Project Life, % 10 1
0.15 1
0.14 1
CO2 Emissions Reduction (1st year) (corresponding to heat rate improvement), % 0.15
CO2 Emissions Reduction (nth year) (corresponding to heat rate improvement), % 0.14
5,493 6
6,056 6
4,944 6
5,450 6
23 7
58 8
25 7
64 8
24
61
13
5753
1. Duke Energy Submittal, September 11, 2015.
5. Based on baseline net generation and ratio of baseline and future capacity factors.
6. Based on baseline CO2 emissions and capacity factor, future capacity factor, and CO2 emissions reductions percentage.
7. Based on total annual cost including fuel savings and CO2 emissions reductions from baseline.
8. Based on total annual cost excluding fuel savings and CO2 emissions reductions from baseline.
Total Capital Investment (TCI)
Duke Energy Carolinas, LLCMarshall U4Annualized Cost and Cost Per Unit CO2 Reduction forForced Draft Fan Variable Frequency Drive
CAPITAL COST
`
Equipment Cost
Total Direct Costs
Indirect Costs
Total Indirect Costs
Baseline (2012) Net Heat Rate, Btu/kw-hr
Annual Cost
Direct Annual Costs
Fixed & Variable Operation & Maintenance Cost
Fuel Savings
Total Direct Annual Costs (DAC)
Indirect Annual Costs
Project Life
Total Capital Recovery Costs (TCRC)
Total Indirect Annual Costs (IDAC)
Total Annual CostBaseline (2012) CO2 Emissions, metric ton/yr
Cost per Short Ton of CO2 Removed (nth year of project life) (exclude fuel savings)
Heat Rate Reduction (Improvement) (1st year of project life), Btu/kw-hr
Heat Rate Reduction (Improvement) (nth year of project life), Btu/kw-hr
Heat Rate Improvement (1st year) from Baseline Net Heat Rate, %
Heat Rate Improvement (nth year) from Baseline Net Heat Rate, %
CO2 Emissions Reduction (1st year) from Baseline, Metric ton/yr
CO2 Emissions Reduction (nth year) from Baseline, Short ton/yr
CO2 Emissions Reduction (1st year) from Baseline, Metric ton/yr
CO2 Emissions Reduction (nth year) from Baseline, Metric ton/yr
Cost per Short Ton of CO2 Removed (1st year of project life) (include fuel savings)
Cost per Short Ton of CO2 Removed (1st year of project life) (exclude fuel savings)
Cost per Short Ton of CO2 Removed (nth year of project life) (include fuel savings)
4. DAQ Spreadsheet on Fleetwide Calculations for Baseline and Future Years.
Heat Rate Reduction (Improvement) (average over project life), Btu/kw-hr
CO2 Emissions Reduction from Baseline (average over project life), Short ton/yr
Average Cost per Short Ton of CO2 Removed Across the Project Life (include fuel savings)
Average Cost per Short Ton of CO2 Removed Across the Project Life (exclude fuel savings)
2. EPA Air Pollution Control Cost Manual, Sixth Edition, January 2002; EPA/452/B-02-001
a. Section 1, Chapter 2, Paragraph 2.3.1 Elements of Total Capital Investment.
b. Section 1, Chapter 2, Paragraph 2.3.2: Elements of Total Annual Cost.3. Based on baseline net generation and net heat rate, ratio of baseline and future capacity factors, heat rate improvement, and future year (2019) average coal price included in "Annual Energy Outlook 2015", US EIA.
Marshall-Page 41 of 44
Attachment B B-117Attachment B B-117

NOTES REFERENCES
$536,984 A 1
$536,984 DC 2(a)
None
$0 IC 2(a)
$536,984 TCI = DC + IC 2(a)
$53,698 1
-$391,141 3
-$337,442 2(b)
10 PL 1$53,698 TCRC = TCI/PL 2(b)
$53,698 IDAC = TCRC 2(b)
-$283,744 TAC = DAC + IDAC 2(b)
3,544,234 4
9,433 4
Baseline (2012) Net Generation, MW-h 3,902,223 4
Baseline (2012) Annual Capacity Factor (heat input basis), % 56.13 4
Future (2019) Annual Capacity Factor (projected heat input basis), % 58.00 4
Future (2019) Net Generation, MW-h 4,032,228 5
28
21
Project Life, Years 10 1
Degradation Factor Across Project Life, % 25 1
0.30 1
0.23 1
CO2 Emissions Reduction (1st year) (corresponding to heat rate improvement), % 0.30
CO2 Emissions Reduction (nth year) (corresponding to heat rate improvement), % 0.23
10,987 6
12,111 6
8,240 6
9,083 6
-23 7
9 8
-31 7
12 8
-27
10
25
10597
1. Duke Energy Submittal, September 11, 2015.
5. Based on baseline net generation and ratio of baseline and future capacity factors.
6. Based on baseline CO2 emissions and capacity factor, future capacity factor, and CO2 emissions reductions percentage.
7. Based on total annual cost including fuel savings and CO2 emissions reductions from baseline.
8. Based on total annual cost excluding fuel savings and CO2 emissions reductions from baseline.
Total Capital Investment (TCI)
Duke Energy Carolinas, LLCMarshall U4Annualized Cost and Cost Per Unit CO2 Reduction forIntelligent Sootblowers
CAPITAL COST
`
Equipment Cost
Total Direct Costs
Indirect Costs
Total Indirect Costs
Baseline (2012) Net Heat Rate, Btu/kw-hr
Annual Cost
Direct Annual Costs
Fixed & Variable Operation & Maintenance Cost
Fuel Savings
Total Direct Annual Costs (DAC)
Indirect Annual Costs
Project Life
Total Capital Recovery Costs (TCRC)
Total Indirect Annual Costs (IDAC)
Total Annual CostBaseline (2012) CO2 Emissions, metric ton/yr
Cost per Short Ton of CO2 Removed (nth year of project life) (exclude fuel savings)
Heat Rate Reduction (Improvement) (1st year of project life), Btu/kw-hr
Heat Rate Reduction (Improvement) (nth year of project life), Btu/kw-hr
Heat Rate Improvement (1st year) from Baseline Net Heat Rate, %
Heat Rate Improvement (nth year) from Baseline Net Heat Rate, %
CO2 Emissions Reduction (1st year) from Baseline, Metric ton/yr
CO2 Emissions Reduction (nth year) from Baseline, Short ton/yr
CO2 Emissions Reduction (1st year) from Baseline, Metric ton/yr
CO2 Emissions Reduction (nth year) from Baseline, Metric ton/yr
Cost per Short Ton of CO2 Removed (1st year of project life) (include fuel savings)
Cost per Short Ton of CO2 Removed (1st year of project life) (exclude fuel savings)
Cost per Short Ton of CO2 Removed (nth year of project life) (include fuel savings)
4. DAQ Spreadsheet on Fleetwide Calculations for Baseline and Future Years.
Heat Rate Reduction (Improvement) (average over project life), Btu/kw-hr
CO2 Emissions Reduction from Baseline (average over project life), Short ton/yr
Average Cost per Short Ton of CO2 Removed Across the Project Life (include fuel savings)
Average Cost per Short Ton of CO2 Removed Across the Project Life (exclude fuel savings)
2. EPA Air Pollution Control Cost Manual, Sixth Edition, January 2002; EPA/452/B-02-001
a. Section 1, Chapter 2, Paragraph 2.3.1 Elements of Total Capital Investment.
b. Section 1, Chapter 2, Paragraph 2.3.2: Elements of Total Annual Cost.3. Based on baseline net generation and net heat rate, ratio of baseline and future capacity factors, heat rate improvement, and future year (2019) average coal price included in "Annual Energy Outlook 2015", US EIA.
Marshall-Page 42 of 44
Attachment B B-118Attachment B B-118

NOTES REFERENCES
$375,889 A 1
$375,889 DC 2(a)
None
$0 IC 2(a)
$375,889 TCI = DC + IC 2(a)
$53,698 1
-$186,258 3
-$132,559 2(b)
3 PL 1$125,296 TCRC = TCI/PL 2(b)
$125,296 IDAC = TCRC 2(b)
-$7,263 TAC = DAC + IDAC 2(b)
3,544,234 4
9,433 4
Baseline (2012) Net Generation, MW-h 3,902,223 4
Baseline (2012) Annual Capacity Factor (heat input basis), % 56.13 4
Future (2019) Annual Capacity Factor (projected heat input basis), % 58.00 4
Future (2019) Net Generation, MW-h 4,032,228 5
19
5
Project Life, Years 3 1
Degradation Factor Across Project Life, % 75 1
0.20 1
0.05 1
CO2 Emissions Reduction (1st year) (corresponding to heat rate improvement), % 0.20
CO2 Emissions Reduction (nth year) (corresponding to heat rate improvement), % 0.05
7,325 6
8,074 6
1,831 6
2,019 6
-1 7
22 8
-4 7
89 8
-2
55
12
5046
1. Duke Energy Submittal, September 11, 2015.
5. Based on baseline net generation and ratio of baseline and future capacity factors.
6. Based on baseline CO2 emissions and capacity factor, future capacity factor, and CO2 emissions reductions percentage.
7. Based on total annual cost including fuel savings and CO2 emissions reductions from baseline.
8. Based on total annual cost excluding fuel savings and CO2 emissions reductions from baseline.
Total Capital Investment (TCI)
Duke Energy Carolinas, LLCMarshall U4Annualized Cost and Cost Per Unit CO2 Reduction forAH Leakage Reduction
CAPITAL COST
`
Equipment Cost
Total Direct Costs
Indirect Costs
Total Indirect Costs
Baseline (2012) Net Heat Rate, Btu/kw-hr
Annual Cost
Direct Annual Costs
Fixed & Variable Operation & Maintenance Cost
Fuel Savings
Total Direct Annual Costs (DAC)
Indirect Annual Costs
Project Life
Total Capital Recovery Costs (TCRC)
Total Indirect Annual Costs (IDAC)
Total Annual CostBaseline (2012) CO2 Emissions, metric ton/yr
Cost per Short Ton of CO2 Removed (nth year of project life) (exclude fuel savings)
Heat Rate Reduction (Improvement) (1st year of project life), Btu/kw-hr
Heat Rate Reduction (Improvement) (nth year of project life), Btu/kw-hr
Heat Rate Improvement (1st year) from Baseline Net Heat Rate, %
Heat Rate Improvement (nth year) from Baseline Net Heat Rate, %
CO2 Emissions Reduction (1st year) from Baseline, Metric ton/yr
CO2 Emissions Reduction (nth year) from Baseline, Short ton/yr
CO2 Emissions Reduction (1st year) from Baseline, Metric ton/yr
CO2 Emissions Reduction (nth year) from Baseline, Metric ton/yr
Cost per Short Ton of CO2 Removed (1st year of project life) (include fuel savings)
Cost per Short Ton of CO2 Removed (1st year of project life) (exclude fuel savings)
Cost per Short Ton of CO2 Removed (nth year of project life) (include fuel savings)
4. DAQ Spreadsheet on Fleetwide Calculations for Baseline and Future Years.
Heat Rate Reduction (Improvement) (average over project life), Btu/kw-hr
CO2 Emissions Reduction from Baseline (average over project life), Short ton/yr
Average Cost per Short Ton of CO2 Removed Across the Project Life (include fuel savings)
Average Cost per Short Ton of CO2 Removed Across the Project Life (exclude fuel savings)
2. EPA Air Pollution Control Cost Manual, Sixth Edition, January 2002; EPA/452/B-02-001
a. Section 1, Chapter 2, Paragraph 2.3.1 Elements of Total Capital Investment.
b. Section 1, Chapter 2, Paragraph 2.3.2: Elements of Total Annual Cost.3. Based on baseline net generation and net heat rate, ratio of baseline and future capacity factors, heat rate improvement, and future year (2019) average coal price included in "Annual Energy Outlook 2015", US EIA.
Marshall-Page 43 of 44
Attachment B B-119Attachment B B-119

NOTES REFERENCES
$1,073,967 A 1
$1,073,967 DC 2(a)
None
$0 IC 2(a)
$1,073,967 TCI = DC + IC 2(a)
$80,548 1
-$391,141 3
-$310,593 2(b)
10 PL 1$107,397 TCRC = TCI/PL 2(b)
$107,397 IDAC = TCRC 2(b)
-$203,197 TAC = DAC + IDAC 2(b)
3,544,234 4
9,433 4
Baseline (2012) Net Generation, MW-h 3,902,223 4
Baseline (2012) Annual Capacity Factor (heat input basis), % 56.13 4
Future (2019) Annual Capacity Factor (projected heat input basis), % 58.00 4
Future (2019) Net Generation, MW-h 4,032,228 5
28
21
Project Life, Years 10 1
Degradation Factor Across Project Life, % 25 1
0.30 1
0.23 1
CO2 Emissions Reduction (1st year) (corresponding to heat rate improvement), % 0.30
CO2 Emissions Reduction (nth year) (corresponding to heat rate improvement), % 0.23
10,987 6
12,111 6
8,240 6
9,083 6
-17 7
16 8
-22 7
21 8
-20
18
25
10597
1. Duke Energy Submittal, September 11, 2015.
5. Based on baseline net generation and ratio of baseline and future capacity factors.
6. Based on baseline CO2 emissions and capacity factor, future capacity factor, and CO2 emissions reductions percentage.
7. Based on total annual cost including fuel savings and CO2 emissions reductions from baseline.
8. Based on total annual cost excluding fuel savings and CO2 emissions reductions from baseline.
Total Capital Investment (TCI)
Duke Energy Carolinas, LLCMarshall U4Annualized Cost and Cost Per Unit CO2 Reduction forCombustion Optimization - CCM / Excess Air / Neural Network
CAPITAL COST
`
Equipment Cost
Total Direct Costs
Indirect Costs
Total Indirect Costs
Baseline (2012) Net Heat Rate, Btu/kw-hr
Annual Cost
Direct Annual Costs
Fixed & Variable Operation & Maintenance Cost
Fuel Savings
Total Direct Annual Costs (DAC)
Indirect Annual Costs
Project Life
Total Capital Recovery Costs (TCRC)
Total Indirect Annual Costs (IDAC)
Total Annual CostBaseline (2012) CO2 Emissions, metric ton/yr
Cost per Short Ton of CO2 Removed (nth year of project life) (exclude fuel savings)
Heat Rate Reduction (Improvement) (1st year of project life), Btu/kw-hr
Heat Rate Reduction (Improvement) (nth year of project life), Btu/kw-hr
Heat Rate Improvement (1st year) from Baseline Net Heat Rate, %
Heat Rate Improvement (nth year) from Baseline Net Heat Rate, %
CO2 Emissions Reduction (1st year) from Baseline, Metric ton/yr
CO2 Emissions Reduction (nth year) from Baseline, Short ton/yr
CO2 Emissions Reduction (1st year) from Baseline, Metric ton/yr
CO2 Emissions Reduction (nth year) from Baseline, Metric ton/yr
Cost per Short Ton of CO2 Removed (1st year of project life) (include fuel savings)
Cost per Short Ton of CO2 Removed (1st year of project life) (exclude fuel savings)
Cost per Short Ton of CO2 Removed (nth year of project life) (include fuel savings)
4. DAQ Spreadsheet on Fleetwide Calculations for Baseline and Future Years.
Heat Rate Reduction (Improvement) (average over project life), Btu/kw-hr
CO2 Emissions Reduction from Baseline (average over project life), Short ton/yr
Average Cost per Short Ton of CO2 Removed Across the Project Life (include fuel savings)
Average Cost per Short Ton of CO2 Removed Across the Project Life (exclude fuel savings)
2. EPA Air Pollution Control Cost Manual, Sixth Edition, January 2002; EPA/452/B-02-001
a. Section 1, Chapter 2, Paragraph 2.3.1 Elements of Total Capital Investment.
b. Section 1, Chapter 2, Paragraph 2.3.2: Elements of Total Annual Cost.3. Based on baseline net generation and net heat rate, ratio of baseline and future capacity factors, heat rate improvement, and future year (2019) average coal price included in "Annual Energy Outlook 2015", US EIA.
Marshall-Page 44 of 44
Attachment B B-120Attachment B B-120

1
North Carolina Department of Environmental Quality Division of Air Quality
Supporting Basis
Determination of Best System of Emissions Reduction for CO2 Emissions from Existing Electric Utility Generating Units
October 30, 2015
Facility Duke Energy Progress, Inc., Mayo Electric Generating Plant, Roxboro, NC Facility ID: 7300045 Current Air Quality Permit No. 03478T42 Affected Electric Utility Generating Unit (EGU) Unit 1, with a heat input capacity of 9,800 million Btu per hour, consisting of:
Unit 1A - Coal/No. 2 fuel oil/recycled No. 2 fuel oil-fired electric utility boiler (4,900 million Btu per heat input capacity) equipped with low-NOX burner systems and sodium coal conditioning and alkaline-based fuel additive
Unit 1B - Coal/No. 2 fuel oil/recycled No. 2 fuel oil-fired electric utility boiler (4,900 million Btu
per heat input capacity) equipped with low-NOX burner systems and sodium coal conditioning and alkaline-based fuel additive
Generator rated at 736 MW (nameplate capacity).
1. Introduction The United States Environmental Protection Agency (EPA) has adopted Emission Guidelines for Greenhouse Gas Emissions and Compliance Times for Electric Utility Generating Units on August 3, 2015 and codified it in 40 CFR Subpart UUUU. The affected electric utility steam generating units (EGUs) under these emission guidelines (EG) are steam generating units, integrated gasification combined cycle units (IGCC), and stationary combined cycle or combined heat and power (CHP) combustion turbines that commenced construction on or before January 8, 2014. The EG includes uniform, nationwide emission standards, which are performance-based rates for emissions of greenhouse gases (GHG) expressed as CO2 (lb CO2/net MWh), as follows: Fossil fuel-fired steam generating units or IGCC: 1,534 lb CO2/net MWh (interim, average of
2022-2029), 1,305 lb CO2/net MWh (final, starting 2030)
Natural gas-fired stationary combined cycle combustion turbines (including CHP combustion turbines): 832 lb/net MWh (interim, average of 2022-2029), 771 lb/MWh (final, starting 2030)
Mayo-Page 1 of 13
Attachment B B-121Attachment B B-121

2
In lieu of the above uniform rates, each EGU can comply with state-specific goal (lb CO2/net MWh). The other option is that all affected units in the state, in aggregate, comply with the mass-based state goal (short tons/yr). For North Carolina (NC), the rate-based interim and final goals are 1,311 lb CO2/net MWh and 1,136 lb CO2/net MWh, respectively. Similarly, NC’s mass-based interim and final goals are 56,986,025 short tons/yr and 51,266,234 short tons/yr, respectively. The above standards (whether uniform nationwide rates or state-specific goals) are based upon the determination of Best System of Emissions Reduction (BSER) consisting of following three building blocks: Building Block 1 (BB1) - reducing the carbon intensity of electricity generation by improving the
heat rate of existing coal-fired power plants.
Building Block 2 (BB2) - substituting increased electricity generation from lower-emitting existing natural gas plants for reduced generation from higher-emitting coal-fired power plants.
Building Block 3 (BB3) - substituting increased electricity generation from new zero-emitting renewable energy sources (like wind and solar) for reduced generation from existing coal-fired and natural gas-fired power plants.
The EG requires that each state submit its plan complying with all applicable requirements by the deadline included therein. One of the requirements consists of development of an emission standard (“standard of performance”) and establishment of compliance time for each EGU. The Clean Air Act (CAA) §111(a)(1) defines “standard of performance” as “a standard for emissions of air pollutants which reflects the degree of emission limitation achievable through the application of the best system of emission reduction which (taking into account the cost of achieving such reduction and any non-air quality health and environmental impact and energy requirements) the Administrator determines has been adequately demonstrated”.
2. History of Development of Emission Guidelines under CAA Over the last 40 years, under §111(d), the EPA has regulated four pollutants from five source categories, by promulgating associated EG. These source categories are phosphate fertilizer plants (fluorides), sulfuric acid plants (acid mist), Kraft pulp plants (total reduced sulfur (TRS)), primary aluminum plants (fluorides), and municipal solid waste landfills (landfill gas emissions as non-methane organic compounds (NMOCs))1. The following general principles and/or rationales were used by EPA in establishing BSER for these EGs:
1 See Footnote 18 at 79 FR 41776, July 17, 2014, including ‘‘Phosphate Fertilizer Plants; Final Guideline Document Availability,’’ 42 FR 12022 (March 1, 1977); ‘‘Standards of Performance for New Stationary Sources; Emission Guideline for Sulfuric Acid Mist,’’ 42 FR 55796 (October 18, 1977); ‘‘Kraft Pulp Mills, Notice of Availability of Final Guideline Document,’’ 44 FR 29828 (May 22, 1979); ‘‘Primary Aluminum Plants; Availability of Final Guideline Document,’’ 45 FR 26294 (April 17, 1980); ‘‘Standards of Performance for New Stationary Sources and Guidelines for Control of Existing Sources: Municipal Solid Waste Landfills, Final Rule,’’ 61 FR 9905 (March 12, 1996).
Mayo-Page 2 of 13
Attachment B B-122Attachment B B-122

3
The degree of emission reduction achievable through the application of various demonstrated control technologies.
The technical feasibility of applying various demonstrated technologies to existing sources considering variability in sizes and designs.
The impact of various demonstrated technologies on national energy consumption, water pollution, waste disposal, and ambient air concentrations of a designated pollutant.
The cost of adopting the emission guidelines, after considering control costs for various demonstrated technologies and taking into account the level of any existing controls.
Each of these EGs indicates that the cost of applying various control technologies can have a considerable impact in selection of a BSER for any designated pollutant for existing facilities. They also indicate that the age, size, type, class, and process design of the facility, influence not only the BSER selection process, but can also support a decision-making for whether different EGs are to be established for differing sizes, types, or classes of equipment. The EGs for the above referenced source categories have been established for principal points of emissions (point and fugitive emissions sources) located within the facility and, not for any emissions sources located outside of the facility. Finally, in these EGs, with respect to determining the EG, EPA has consistently recognized that not only the control technology needs to be demonstrated on existing sources, but the degree of emission reduction (performance level) needs to be readily achievable by the control technology.
3. The Division of Air Quality (DAQ)’s Approach for Determination of BSER The DAQ will consider the above general principles in determining BSER for CO2 emissions reduction from each EGU. But, importantly, DAQ will determine BSER for each EGU based upon BB1-type measures only (i.e., measures which can be accomplished within the fence-line of the facility), conforming to the §111(d) of the CAA and the requirements of 40 CFR 60 “Adoption and Submittal of State Plans for Designated Facilities”. Thus, DAQ’s approach will comprise of improving the operational efficiency of the EGUs in order to reduce CO2 emissions from the 2012 baseline levels. The DAQ’s BSER evaluation will specifically be based upon the following: type of EGU remaining useful life of the EGU unit’s baseline data (net heat rate, net generation, annual capacity factor, and CO2 emissions) unit’s projected future capacity factor feasibility of applying specific heat rate improvement (HRI) measure on a given unit whether the measure is adequately demonstrated degree of heat rate reduction potential for feasible HRI measures site-specific limitations associated costs (capital, fixed and variable operational and maintenance (O&M), and fuel savings) cost per ton of CO2 reduction
Mayo-Page 3 of 13
Attachment B B-123Attachment B B-123

4
The evaluation is also based on literature review2 of technical feasibility for various HRI measures, degree of heat rate reduction potential, and costs data (capital, and fixed and variable O&M). It needs to be emphasized here that DAQ’s determination for each EGU will not be based upon some pre-determined HRI target, such as EPA’s selection of a 4.3% HRI potential for EGUs in the Eastern interconnection3, as discussed in the EG. The DAQ’s approach will include those adequately demonstrated, cost-effective measures that assure that the electricity is generated with lower CO2 emissions, thus improving public health and welfare. The selected HRI measures would be expected to produce non-air environmental co-benefits in the form of reduced water usage and solid waste production, in addition to, reductions in emissions of non-GHG pollutants such as SO2, NOx, and mercury. However, it should be noted that as the EGU becomes more cost-competitive due to HRIs, it may be dispatched more frequently and/or at higher loads. If the EGU is utilized more often, some increases in emissions of GHG (as CO2) and similarly, for non-GHG pollutants (such as SO2, NOx, or mercury) are possible, and those could partially offset the emissions reductions achieved through the HRI of the EGU. EPA has determined a cost estimate of $23 per ton4 reasonable for CO2 emissions reduction from EGUs under BB1 implementing HRI measures. EPA has further determined that this cost is reasonable because it achieves “an appropriate balance between cost and amount of reductions.”5 In addition, EPA has used another benchmark in the form of social cost of carbon (SC-CO2) at $40 per ton (2020) to $48 per ton (2030)6 to conclude that the above $23 per ton cost is reasonable. In determining a BSER for a particular EGU, DAQ will use the above cost effectiveness threshold of $23 per ton to determine reasonableness of cost and whether one or more technically feasible measure(s) can be implemented, as long as, collectively, the total cost does not exceed this threshold.
2 “Coal-fired Power Plant Heat Rate Reductions”, Final Report, Sargent & Lundy, Chicago, IL, January 22, 2009. “Analysis of Heat Rate Improvement Potential at Coal-Fired Power Plants”, US Energy Information Administration, Washington, DC, May 2015. S. Corellis, “Range and Applicability of Heat Rate Improvements”, Technical Update, Electric Power Research Institute, Palo Alto, CA, April 2014. 3 Applies to coal-fired EGUs only. 4 See page 446 of 1560 (pre-publication version), Carbon Pollution Emission Guidelines for Existing Stationary Sources: Electric Utility Generating Units Clean Power Plan, August 3, 2015. Based on nation-wide coal fleet capacity of 213 GW, heat rate improvement capital cost of $100/KW, capital charge rate of 14.3%, fleet-wide baseline net heat rate of 10,250 Btu/KWh, heat rate improvement of 4% for coal-fired EGUs, annual capacity factor of 78%, and future (2030) average coal delivered cost of $2.70 per million Btu. See page 2-65, Greenhouse Gas Mitigation Measures, Technical Support Document (TSD) for Carbon Pollution Guidelines for Existing Power Plants”, August 3, 2015. 5 See page 457 of 1560 (pre-publication version), Ibid. 6 See pages 458 and 459 of 1560 (pre-publication version), Ibid.
Mayo-Page 4 of 13
Attachment B B-124Attachment B B-124

5
4. BSER Evaluation
Duke Energy Progress, Inc., Mayo Electric Generating Plant (DEP) has provided information through submittals of July 31 and September 11, 2015, to aid in DAQ’s efforts in determining BSER for CO2 emissions from Unit 1. Additional information was provided through face-to-face meetings and email communication. The submitted information consists of baseline data (net heat rate, net generation, generation-based annual capacity factor, and CO2 emissions) for 2012, projected heat input for future years such as 2019; and cost data (capital cost and annual O&M)7, project life, degradation factor and HRI potential for each of the following measures, for possible implementation on all EGUs of NC-based coal fleet: Controllable Loss Reduction (Maintain Unit Efficiency) [CLR] Sliding Pressure Operation [SPO] Lower FGD Efficiency (as SO2 permit limits allow) [LFGD] Intelligent Sootblowers [ISB] Air Heater Leakage Reduction [ALR] Combustion Optimization - CCM / Excess Air / Neural Network [CO] Online Condenser Cleaning [OCC] Induced and/or Booster Draft Fan Variable Frequency Drive [IBD] Air Heater Exit Gas Temperature Reduction [AHE] Flue Gas Desulfurization Auxiliary Load Reduction through Variable Frequency Drives [FGDA] Boiler Feed Pump Motor Driven Variable Frequency Drive [BFP] Induced Draft Fan Replacement [IDFR] Forced Draft Fan Variable Frequency Drive [FDF] Condenser Rebundle, Retubes, and Rebuilds [CRR] Electrostatic Precipitator (ESP) (Power management, T/R set upgrades) [ESP] Turbine Upgrades (HI, IP, LP) [TUR] Helper Cooling Tower [HCT] DEP has claimed the submitted information on cost, project life, and degradation factors, as “confidential”. The DAQ will treat this specific information (cost data and information on project life and the associated degradation factors) “confidential” until the Director decides that it is not confidential in accordance with NCAC 2Q .0107 “Confidential Information”. Thus, DAQ will not include such information in this document. In general, through these submittals, DEP characterizes the HRIs decreasing over time because the equipment associated with each measure degrades over time due to normal wear and tear, requiring recurrent implementation of HRI projects or measures. DEP further mentions that some of the efficiency projects cannot be performed or the full HRI benefits may not be realized due to unique configuration or physical limitation of a given EGU. In addition, DEP states that operation of any EGU at less than the full load or if cycled between full and partial load will adversely impact EGU’s heat rate. DEP also discusses reduced utilization of its coal-fired fleet in the recent history in response to lower natural gas prices, resulting in some of its coal-fired units, once operated as base-load units, now operating as intermediate duty cycling units.
7 High level estimate in the range of -20% to +75% in 2015 $s.
Mayo-Page 5 of 13
Attachment B B-125Attachment B B-125

6
Finally, DEP adds that any post combustion environmental controls (activated carbon for mercury control, dry bottom and fly ash conversion for coal ash disposal, selective catalytic reduction for NOx control, and Zero Liquid Discharge (ZLD) for wastewater treatment) also adversely impact the heat rate of the EGU, in addition to any other environmental control which might be installed in future (any project implemented since its BSER submittal deadline date of July 31, 2015). With respect to the BSER evaluation, the DAQ has utilized the following data upon verifying or through calculations, for estimating heat rate reduction (Btu/kWh), CO2 emission reduction (short tons/yr), and cost per unit reduction of CO2 ($ per ton) for each measure:
Table 1: Mayo Unit 1
Unit No. 1
Baseline (2012) Net Generation (MWh)
3,539,046
Baseline (2012) Net Heat Rate (Btu/kWh)
11,174
Baseline (2012) CO2 Emissions (Tons/yr)
3,813,684
Baseline (2012) Annual Heat Input (million Btu)
39,545,300
Baseline (2012) Annual Capacity Factor (heat input basis)
0.461
Future (2019) Projected Annual Capacity Factor (heat input basis)
0.260
Future (2019) Projected Coal Delivered Cost ($ per million Btu)
3.92
Commencement of Operation Year 1983
Planned Retirement Year 2035
It needs to be clarified here that, for all NC-based EGUs, owned by Duke Energy (both under Duke Energy Carolinas, LLC (DEC) and Duke Energy Progress (DEP)), DAQ used the actual coal delivered prices for 2014 and scaled them for 20198 to estimate the above coal delivered price of $3.92 per
8 Duke Energy Carolinas The actual, average cost of fuel burned for 12 months ending December 2014 (Jan 2014-Dec 2014) was $3.84 per million Btu (See NCUC Docket No. E-7, Sub 1047, Duke Energy Carolinas, LLC Monthly Fuel Report, February 11, 2015). Duke Energy Progress The actual, average cost of coal burned for 12 months ending January 2015 (Feb 2014-Jan 2015) was $3.57 per million Btu (See NCUC Docket No. E-2, Sub 1064, Duke Energy Progress, Inc. Monthly Fuel Report, March 12, 2015).
Mayo-Page 6 of 13
Attachment B B-126Attachment B B-126

7
million Btu. DAQ will adjust the capital and annual O&M costs estimates, provided by DEC in 2015 dollars, to 2019 dollars, using the growth factor of 1.8 percent compounded annually.9 Mayo Unit 1 BSER Candidates For Unit 1, DEP has determined that measures identified above as SPO, OCC, HCT BFP, and IDFR are either technically infeasible or each have very negligible HRI opportunity. The DAQ agrees with DEP, and will not include them further in the BSER evaluation. Measures IBD, FDF, ISB, and CO were implemented prior to or during 2012 (baseline year). Measures FGDA and ALR were implemented after 2012 but prior to July 2015. The DAQ will not include any other measure in its evaluation if there is any possibility of an increase in collateral emissions, such as measures LFGD and ESP. Thus, the following remaining four measures were considered further in the BSER analysis: CLR, CRR, TUR, and AHE. BSER Measure by Measure Analysis The DAQ has evaluated the remaining four measures for Unit 1 using the methodology described below: First, using the project life (yr) for a given measure, DAQ has transformed capital investment ($) into an indirect annual (capital) cost ($ per yr) by simply dividing capital investment by the project life. Then, it added it to the direct annual (fixed O&M) cost to determine the total annual cost. Next, using the coal delivered price, baseline year (2012) generation and capacity factor, future capacity factor, and average HRI percent (calculated assuming the HRI for a given measure degrades linearly over the project life based on degradation factor); coal fuel savings have been estimated for 2019. Fuel savings due to improved heat rate have been deducted from the total annual cost to determine net annual cost for implementation of a measure. Then, using baseline CO2 emissions, baseline and future capacity factors, and average improvement of heat rate for the EGU (again assuming a decrease in HRI linearly over the measure’s life based on degradation factor) from baseline net heat rate, reduction in CO2 emissions associated with a given measure has been estimated. Finally, cost per unit reduction in CO2 is simply estimated by taking net annual cost and dividing it by CO2 emissions, both determined as above.
Using the EIA (Annual Energy Outlook 2015) [www.eia.gov/beta/aeo/], nationwide coal delivered prices were projected to be: 2013 $2.50 per million Btu 2015 $2.41 per million Btu 2020 $2.54 per million Btu By interpolation, nationwide coal delivered prices for 2014 and 2019 would be approximately $2.46 per million Btu and $2.51 per million, respectively; thus an increase of 2 percent of coal price was projected from 2014 to 2019. Applying this ratio to the DEC’s fleet, the average coal delivered price in 2019 would be 1.02 * $3.84 per million Btu = $3.92 per million Btu. Applying the same ratio to the DEP fleet, the average coal delivered price in 2019 would be 1.02 * $3.57 per million Btu = $3.64 per million Btu. Using the larger value from the above, for conservative calculations, for the entire fleet (both DEC and DEP), the 2019 coal delivered cost is projected to be $3.92 per million Btu. 9 See both GDP Chain-Type Price Index and Metals and Metal Products Indicator, Table A20. Macroeconomics Indicators, USEIA Annual Energy Outlook 2015.
Mayo-Page 7 of 13
Attachment B B-127Attachment B B-127

8
It needs to be emphasized that average HRI percent (calculated using degradation factor across the project life) and not the maximum HRI percent, has been applied to determine fuel savings and CO2 emissions reductions for a given measure. Table 2 includes heat rate reduction (Btu/kWh), CO2 emission reduction (tons/yr), and cost per unit CO2 reduction ($ per ton) for each of the remaining four measures considered for Unit 1.
Table 2: Mayo Unit 1
Measure
Heat Rate Reduction
Btu/kWh
[Project Life Average]
CO2 Emissions Reductions
tons per year [Project Life
Average]
Cost per Unit CO2 Reduction
$ per ton
[Including Fuel Savings]
Is Cost per Unit CO2
Reduction <= $23 per ton?
Controllable Loss Reduction (Maintain Unit Efficiency) [CLR]
49 9,418 47 N
Online Condenser Cleaning [OCC] 0 0 0 -
Condenser Rebundle, Retubes, Rebuilds [CRR]
42 8,073 26 N
Turbine Upgrades (HP, IP, LP) [TUR] 105 20,182 86 N
Helper Cooling Tower [HCT] 0 0 0 -
Induced and/or Booster Draft Fan Variable Frequency Drive [IBD]
-
FGD Aux Load Reduction Through Variable Frequency Drives [FGDA]
-
Boiler Feed Pump Motor Driven Variable Frequency Drive [BFP]
0 0 0 -
Induced Draft Fan Replacement [IDFR] 0 0 0 -
Forced Draft Fan Variable Frequency Drive [FDF]
-
Intelligent Sootblowers [ISB] -
AH Leakage Reduction [ALR] -
Combustion Optimization - CCM / Excess Air / Neural Network [CO]
-
AH Exit Gas Temperature Reduction [AHE]
29 5,651 65 N
Technically infeasible/no opportunity identified
Performed in or prior to baseline year 2012
Performed prior to July 2015 and after baseline year
Mayo-Page 8 of 13
Attachment B B-128Attachment B B-128

9
Refer to the attached spreadsheet on calculations for annualized cost and cost per unit reduction of CO2 for each associated measure included in Table 2 above. It needs to be stated here although the retirement age for each of the units has been estimated by DEP and available to DAQ, there is no need to adjust the above estimated costs, considering the remaining useful life (RUL) of each of the EGUs. Each BSER measure considered has a project life that is less than the RUL of the EGU. Mayo Unit 1 Results If implemented, all of the measures included in Table 2 above would be expected to produce non-air environmental co-benefits in the form of reduced water usage and solid waste production, in addition to, reduced emissions of non-GHG pollutants such as SO2, NOx, and mercury. Moreover, adverse energy impacts would not be expected as well. However, comparing the above estimates with the reasonable cost threshold of $23 per ton, as discussed in Section 3 above, each of the estimated costs included in the table above for Unit 1 can be considered “excessive”, “exorbitant” or “unreasonable”, as stated by EPA in the preamble to the final EG10. In summary, DAQ is determining the estimated costs in $ per ton for each of the measures for Unit 1 unreasonable. Thus, considering cost, non-air environmental, and energy impacts, DAQ determines that none of the measures listed in Table 2 above is BSER for Unit 1.
5. BSER for Mayo Unit 1 Mayo Unit 1 No BSER.
10 Page 298 of 1560 (pre-publication version), Ibid.
Mayo-Page 9 of 13
Attachment B B-129Attachment B B-129

NOTES REFERENCES
$107,397 A 1
$107,397 DC 2(a)
None
$0 IC 2(a)
$107,397 TCI = DC + IC 2(a)
$805,476 1
-$382,588 3
$422,888 2(b)
8 PL 1$13,425 TCRC = TCI/PL 2(b)
$13,425 IDAC = TCRC 2(b)
$436,312 TAC = DAC + IDAC 2(b)
3,459,751 4
11,174 4
Baseline (2012) Net Generation, MW-h 3,539,046 4
Baseline (2012) Annual Capacity Factor (heat input basis), % 46.06 4
Future (2019) Annual Capacity Factor (projected heat input basis), % 26.00 4
Future (2019) Net Generation, MW-h 1,997,725 5
56
42
Project Life, Years 8 1
Degradation Factor Across Project Life, % 25 1
0.50 1
0.38 1
CO2 Emissions Reduction (1st year) (corresponding to heat rate improvement), % 0.50
CO2 Emissions Reduction (nth year) (corresponding to heat rate improvement), % 0.38
9,765 6
10,764 6
7,324 6
8,073 6
41 7
76 8
54 7
101 8
47
89
49
9418
1. Duke Energy Submittal, September 11, 2015.
5. Based on baseline net generation and ratio of baseline and future capacity factors.
6. Based on baseline CO2 emissions and capacity factor, future capacity factor, and CO2 emissions reductions percentage.
7. Based on total annual cost including fuel savings and CO2 emissions reductions from baseline.
8. Based on total annual cost excluding fuel savings and CO2 emissions reductions from baseline.
4. DAQ Spreadsheet on Fleetwide Calculations for Baseline and Future Years.
Heat Rate Reduction (Improvement) (average over project life), Btu/kw-hr
CO2 Emissions Reduction from Baseline (average over project life), Short ton/yr
Average Cost per Short Ton of CO2 Removed Across the Project Life (include fuel savings)
Average Cost per Short Ton of CO2 Removed Across the Project Life (exclude fuel savings)
2. EPA Air Pollution Control Cost Manual, Sixth Edition, January 2002; EPA/452/B-02-001
a. Section 1, Chapter 2, Paragraph 2.3.1 Elements of Total Capital Investment.
b. Section 1, Chapter 2, Paragraph 2.3.2: Elements of Total Annual Cost.3. Based on baseline net generation and net heat rate, ratio of baseline and future capacity factors, heat rate improvement, and future year (2019) average coal price included in "Annual Energy Outlook 2015", US EIA.
Cost per Short Ton of CO2 Removed (nth year of project life) (exclude fuel savings)
Heat Rate Reduction (Improvement) (1st year of project life), Btu/kw-hr
Heat Rate Reduction (Improvement) (nth year of project life), Btu/kw-hr
Heat Rate Improvement (1st year) from Baseline Net Heat Rate, %
Heat Rate Improvement (nth year) from Baseline Net Heat Rate, %
CO2 Emissions Reduction (1st year) from Baseline, Metric ton/yr
CO2 Emissions Reduction (nth year) from Baseline, Short ton/yr
CO2 Emissions Reduction (1st year) from Baseline, Metric ton/yr
CO2 Emissions Reduction (nth year) from Baseline, Metric ton/yr
Cost per Short Ton of CO2 Removed (1st year of project life) (include fuel savings)
Cost per Short Ton of CO2 Removed (1st year of project life) (exclude fuel savings)
Cost per Short Ton of CO2 Removed (nth year of project life) (include fuel savings)
Baseline (2012) Net Heat Rate, Btu/kw-hr
Annual Cost
Direct Annual Costs
Fixed & Variable Operation & Maintenance Cost
Fuel Savings
Total Direct Annual Costs (DAC)
Indirect Annual Costs
Project Life
Total Capital Recovery Costs (TCRC)
Total Indirect Annual Costs (IDAC)
Total Annual CostBaseline (2012) CO2 Emissions, metric ton/yr
Total Capital Investment (TCI)
Duke Energy Progress, Inc.Mayo U1Annualized Cost and Cost Per Unit CO2 Reduction forControllable Loss Reduction (Maintain Unit Efficiency)
CAPITAL COST
`
Equipment Cost
Total Direct Costs
Indirect Costs
Total Indirect Costs
Mayo-Page 10 of 13
Attachment B B-130Attachment B B-130

NOTES REFERENCES
$9,665,707 A 1
$9,665,707 DC 2(a)
None
$0 IC 2(a)
$9,665,707 TCI = DC + IC 2(a)
$32,219 1
-$327,933 3
-$295,714 2(b)
20 PL 1$483,285 TCRC = TCI/PL 2(b)
$483,285 IDAC = TCRC 2(b)
$187,572 TAC = DAC + IDAC 2(b)
3,459,751 4
11,174 4
Baseline (2012) Net Generation, MW-h 3,539,046 4
Baseline (2012) Annual Capacity Factor (heat input basis), % 46.06 4
Future (2019) Annual Capacity Factor (projected heat input basis), % 26.00 4
Future (2019) Net Generation, MW-h 1,997,725 5
56
28
Project Life, Years 20 1
Degradation Factor Across Project Life, % 50 1
0.50 1
0.25 1
CO2 Emissions Reduction (1st year) (corresponding to heat rate improvement), % 0.50
CO2 Emissions Reduction (nth year) (corresponding to heat rate improvement), % 0.25
9,765 6
10,764 6
4,882 6
5,382 6
17 7
48 8
35 7
96 8
26
72
42
8073
1. Duke Energy Submittal, September 11, 2015.
5. Based on baseline net generation and ratio of baseline and future capacity factors.
6. Based on baseline CO2 emissions and capacity factor, future capacity factor, and CO2 emissions reductions percentage.
7. Based on total annual cost including fuel savings and CO2 emissions reductions from baseline.
8. Based on total annual cost excluding fuel savings and CO2 emissions reductions from baseline.
4. DAQ Spreadsheet on Fleetwide Calculations for Baseline and Future Years.
Heat Rate Reduction (Improvement) (average over project life), Btu/kw-hr
CO2 Emissions Reduction from Baseline (average over project life), Short ton/yr
Average Cost per Short Ton of CO2 Removed Across the Project Life (include fuel savings)
Average Cost per Short Ton of CO2 Removed Across the Project Life (exclude fuel savings)
2. EPA Air Pollution Control Cost Manual, Sixth Edition, January 2002; EPA/452/B-02-001
a. Section 1, Chapter 2, Paragraph 2.3.1 Elements of Total Capital Investment.
b. Section 1, Chapter 2, Paragraph 2.3.2: Elements of Total Annual Cost.3. Based on baseline net generation and net heat rate, ratio of baseline and future capacity factors, heat rate improvement, and future year (2019) average coal price included in "Annual Energy Outlook 2015", US EIA.
Cost per Short Ton of CO2 Removed (nth year of project life) (exclude fuel savings)
Heat Rate Reduction (Improvement) (1st year of project life), Btu/kw-hr
Heat Rate Reduction (Improvement) (nth year of project life), Btu/kw-hr
Heat Rate Improvement (1st year) from Baseline Net Heat Rate, %
Heat Rate Improvement (nth year) from Baseline Net Heat Rate, %
CO2 Emissions Reduction (1st year) from Baseline, Metric ton/yr
CO2 Emissions Reduction (nth year) from Baseline, Short ton/yr
CO2 Emissions Reduction (1st year) from Baseline, Metric ton/yr
CO2 Emissions Reduction (nth year) from Baseline, Metric ton/yr
Cost per Short Ton of CO2 Removed (1st year of project life) (include fuel savings)
Cost per Short Ton of CO2 Removed (1st year of project life) (exclude fuel savings)
Cost per Short Ton of CO2 Removed (nth year of project life) (include fuel savings)
Baseline (2012) Net Heat Rate, Btu/kw-hr
Annual Cost
Direct Annual Costs
Fixed & Variable Operation & Maintenance Cost
Fuel Savings
Total Direct Annual Costs (DAC)
Indirect Annual Costs
Project Life
Total Capital Recovery Costs (TCRC)
Total Indirect Annual Costs (IDAC)
Total Annual CostBaseline (2012) CO2 Emissions, metric ton/yr
Total Capital Investment (TCI)
Duke Energy Progress, Inc.Mayo U1Annualized Cost and Cost Per Unit CO2 Reduction forCondenser rebundle, retubes, rebuilds
CAPITAL COST
`
Equipment Cost
Total Direct Costs
Indirect Costs
Total Indirect Costs
Mayo-Page 11 of 13
Attachment B B-131Attachment B B-131

NOTES REFERENCES
$37,588,860 A 1
$37,588,860 DC 2(a)
None
$0 IC 2(a)
$37,588,860 TCI = DC + IC 2(a)
$53,698 1
-$819,831 3
-$766,133 2(b)
20 PL 1$1,879,443 TCRC = TCI/PL 2(b)
$1,879,443 IDAC = TCRC 2(b)
$1,113,310 TAC = DAC + IDAC 2(b)
3,459,751 4
11,174 4
Baseline (2012) Net Generation, MW-h 3,539,046 4
Baseline (2012) Annual Capacity Factor (heat input basis), % 46.06 4
Future (2019) Annual Capacity Factor (projected heat input basis), % 26.00 4
Future (2019) Net Generation, MW-h 1,997,725 5
168
42
Project Life, Years 20 1
Degradation Factor Across Project Life, % 75 1
1.50 1
0.38 1
CO2 Emissions Reduction (1st year) (corresponding to heat rate improvement), % 1.50
CO2 Emissions Reduction (nth year) (corresponding to heat rate improvement), % 0.38
29,294 6
32,292 6
7,324 6
8,073 6
34 7
60 8
138 7
239 8
86
150
105
20182
1. Duke Energy Submittal, September 11, 2015.
5. Based on baseline net generation and ratio of baseline and future capacity factors.
6. Based on baseline CO2 emissions and capacity factor, future capacity factor, and CO2 emissions reductions percentage.
7. Based on total annual cost including fuel savings and CO2 emissions reductions from baseline.
8. Based on total annual cost excluding fuel savings and CO2 emissions reductions from baseline.
4. DAQ Spreadsheet on Fleetwide Calculations for Baseline and Future Years.
Heat Rate Reduction (Improvement) (average over project life), Btu/kw-hr
CO2 Emissions Reduction from Baseline (average over project life), Short ton/yr
Average Cost per Short Ton of CO2 Removed Across the Project Life (include fuel savings)
Average Cost per Short Ton of CO2 Removed Across the Project Life (exclude fuel savings)
2. EPA Air Pollution Control Cost Manual, Sixth Edition, January 2002; EPA/452/B-02-001
a. Section 1, Chapter 2, Paragraph 2.3.1 Elements of Total Capital Investment.
b. Section 1, Chapter 2, Paragraph 2.3.2: Elements of Total Annual Cost.3. Based on baseline net generation and net heat rate, ratio of baseline and future capacity factors, heat rate improvement, and future year (2019) average coal price included in "Annual Energy Outlook 2015", US EIA.
Cost per Short Ton of CO2 Removed (nth year of project life) (exclude fuel savings)
Heat Rate Reduction (Improvement) (1st year of project life), Btu/kw-hr
Heat Rate Reduction (Improvement) (nth year of project life), Btu/kw-hr
Heat Rate Improvement (1st year) from Baseline Net Heat Rate, %
Heat Rate Improvement (nth year) from Baseline Net Heat Rate, %
CO2 Emissions Reduction (1st year) from Baseline, Metric ton/yr
CO2 Emissions Reduction (nth year) from Baseline, Short ton/yr
CO2 Emissions Reduction (1st year) from Baseline, Metric ton/yr
CO2 Emissions Reduction (nth year) from Baseline, Metric ton/yr
Cost per Short Ton of CO2 Removed (1st year of project life) (include fuel savings)
Cost per Short Ton of CO2 Removed (1st year of project life) (exclude fuel savings)
Cost per Short Ton of CO2 Removed (nth year of project life) (include fuel savings)
Baseline (2012) Net Heat Rate, Btu/kw-hr
Annual Cost
Direct Annual Costs
Fixed & Variable Operation & Maintenance Cost
Fuel Savings
Total Direct Annual Costs (DAC)
Indirect Annual Costs
Project Life
Total Capital Recovery Costs (TCRC)
Total Indirect Annual Costs (IDAC)
Total Annual CostBaseline (2012) CO2 Emissions, metric ton/yr
Total Capital Investment (TCI)
Duke Energy Progress, Inc.Mayo U1Annualized Cost and Cost Per Unit CO2 Reduction forTurbine Upgrades (HP, IP, LP)
CAPITAL COST
`
Equipment Cost
Total Direct Costs
Indirect Costs
Total Indirect Costs
Mayo-Page 12 of 13
Attachment B B-132Attachment B B-132

NOTES REFERENCES
$3,758,886 A 1
$3,758,886 DC 2(a)
None
$0 IC 2(a)
$3,758,886 TCI = DC + IC 2(a)
$53,698 1
-$229,553 3
-$175,854 2(b)
7 PL 1$536,984 TCRC = TCI/PL 2(b)
$536,984 IDAC = TCRC 2(b)
$361,129 TAC = DAC + IDAC 2(b)
3,459,751 4
11,174 4
Baseline (2012) Net Generation, MW-h 3,539,046 4
Baseline (2012) Annual Capacity Factor (heat input basis), % 46.06 4
Future (2019) Annual Capacity Factor (projected heat input basis), % 26.00 4
Future (2019) Net Generation, MW-h 1,997,725 5
34
25
Project Life, Years 7 1
Degradation Factor Across Project Life, % 25 1
0.30 1
0.23 1
CO2 Emissions Reduction (1st year) (corresponding to heat rate improvement), % 0.30
CO2 Emissions Reduction (nth year) (corresponding to heat rate improvement), % 0.23
5,859 6
6,458 6
4,394 6
4,844 6
56 7
91 8
75 7
122 8
65
107
29
5651
1. Duke Energy Submittal, September 11, 2015.
5. Based on baseline net generation and ratio of baseline and future capacity factors.
6. Based on baseline CO2 emissions and capacity factor, future capacity factor, and CO2 emissions reductions percentage.
7. Based on total annual cost including fuel savings and CO2 emissions reductions from baseline.
8. Based on total annual cost excluding fuel savings and CO2 emissions reductions from baseline.
4. DAQ Spreadsheet on Fleetwide Calculations for Baseline and Future Years.
Heat Rate Reduction (Improvement) (average over project life), Btu/kw-hr
CO2 Emissions Reduction from Baseline (average over project life), Short ton/yr
Average Cost per Short Ton of CO2 Removed Across the Project Life (include fuel savings)
Average Cost per Short Ton of CO2 Removed Across the Project Life (exclude fuel savings)
2. EPA Air Pollution Control Cost Manual, Sixth Edition, January 2002; EPA/452/B-02-001
a. Section 1, Chapter 2, Paragraph 2.3.1 Elements of Total Capital Investment.
b. Section 1, Chapter 2, Paragraph 2.3.2: Elements of Total Annual Cost.3. Based on baseline net generation and net heat rate, ratio of baseline and future capacity factors, heat rate improvement, and future year (2019) average coal price included in "Annual Energy Outlook 2015", US EIA.
Cost per Short Ton of CO2 Removed (nth year of project life) (exclude fuel savings)
Heat Rate Reduction (Improvement) (1st year of project life), Btu/kw-hr
Heat Rate Reduction (Improvement) (nth year of project life), Btu/kw-hr
Heat Rate Improvement (1st year) from Baseline Net Heat Rate, %
Heat Rate Improvement (nth year) from Baseline Net Heat Rate, %
CO2 Emissions Reduction (1st year) from Baseline, Metric ton/yr
CO2 Emissions Reduction (nth year) from Baseline, Short ton/yr
CO2 Emissions Reduction (1st year) from Baseline, Metric ton/yr
CO2 Emissions Reduction (nth year) from Baseline, Metric ton/yr
Cost per Short Ton of CO2 Removed (1st year of project life) (include fuel savings)
Cost per Short Ton of CO2 Removed (1st year of project life) (exclude fuel savings)
Cost per Short Ton of CO2 Removed (nth year of project life) (include fuel savings)
Baseline (2012) Net Heat Rate, Btu/kw-hr
Annual Cost
Direct Annual Costs
Fixed & Variable Operation & Maintenance Cost
Fuel Savings
Total Direct Annual Costs (DAC)
Indirect Annual Costs
Project Life
Total Capital Recovery Costs (TCRC)
Total Indirect Annual Costs (IDAC)
Total Annual CostBaseline (2012) CO2 Emissions, metric ton/yr
Total Capital Investment (TCI)
Duke Energy Progress, Inc.Mayo U1Annualized Cost and Cost Per Unit CO2 Reduction forAH Exit Gas Temperature Reduction
CAPITAL COST
`
Equipment Cost
Total Direct Costs
Indirect Costs
Total Indirect Costs
Mayo-Page 13 of 13
Attachment B B-133Attachment B B-133

1
North Carolina Department of Environmental Quality Division of Air Quality
Supporting Basis
Determination of Best System of Emissions Reduction for CO2 Emissions from Existing Electric Utility Generating Units
October 30, 2015
Facility Duke Energy Progress, Inc., Roxboro Steam Electric Plant, Semora, NC Facility ID: 7300029 Current Air Quality Permit No. 01001T48 Affected Electric Utility Generating Units (EGUs) One coal/No. 2 fuel oil/recycled No. 2 fuel oil-fired electric utility boiler (4722 million Btu per hour nominally rated heat input capacity) equipped with low-NOX burner and alkaline-based fuel additive (ID No. ES-Unit 1). Generator rated at 410.8 MW (nameplate capacity). One coal/No. 2 fuel oil/recycled No. 2 fuel oil-fired electric utility boiler (7212 million Btu per hour nominally rated heat input capacity) equipped with low-NOX burner and alkaline-based fuel additive (ID No. ES-Unit 2). Generator rated at 657.0 MW (nameplate capacity). Two coal/No. 2 fuel oil/recycled No. 2 fuel oil-fired electric utility boilers (8522 million Btu per hour nominally rated heat input capacity total) equipped with low-NOX burners and alkaline-based fuel additive (ID Nos. ES-Unit 3A and ES-Unit 3B). Generator rated at 745.2 MW (nameplate capacity). Two coal/No. 2 fuel oil/recycled No. 2 fuel oil-fired electric utility boilers (9000 million Btu per hour nominally rated heat input capacity total) equipped with low-NOX burners and alkaline-based fuel additive (ID Nos. ES-Unit 4A and ES-Unit 4B). Generator rated at 745.2 MW (nameplate capacity).
1. Introduction The United States Environmental Protection Agency (EPA) has adopted Emission Guidelines for Greenhouse Gas Emissions and Compliance Times for Electric Utility Generating Units on August 3, 2015 and codified it in 40 CFR Subpart UUUU. The affected electric utility steam generating units (EGUs) under these emission guidelines (EG) are steam generating units, integrated gasification combined cycle units (IGCC), and stationary combined cycle or combined heat and power (CHP) combustion turbines that commenced construction on or before January 8, 2014. The EG includes uniform, nationwide emission standards, which are performance-based rates for emissions of greenhouse gases (GHG) expressed as CO2 (lb CO2/net MWh), as follows: Fossil fuel-fired steam generating units or IGCC: 1,534 lb CO2/net MWh (interim, average of 2022-
2029), 1,305 lb CO2/net MWh (final, starting 2030)
Roxboro-Page 1 of 29
Attachment B B-134Attachment B B-134

2
Natural gas-fired stationary combined cycle combustion turbines (including CHP combustion turbines): 832 lb/net MWh (interim, average of 2022-2029), 771 lb/MWh (final, starting 2030)
In lieu of the above uniform rates, each EGU can comply with state-specific goal (lb CO2/net MWh). The other option is that all affected units in the state, in aggregate, comply with the mass-based state goal (short tons/yr). For North Carolina (NC), the rate-based interim and final goals are 1,311 lb CO2/net MWh and 1,136 lb CO2/net MWh, respectively. Similarly, NC’s mass-based interim and final goals are 56,986,025 short tons/yr and 51,266,234 short tons/yr, respectively. The above standards (whether uniform nationwide rates or state-specific goals) are based upon the determination of Best System of Emissions Reduction (BSER) consisting of following three building blocks: Building Block 1 (BB1) - reducing the carbon intensity of electricity generation by improving the
heat rate of existing coal-fired power plants. Building Block 2 (BB2) - substituting increased electricity generation from lower-emitting existing
natural gas plants for reduced generation from higher-emitting coal-fired power plants. Building Block 3 (BB3) - substituting increased electricity generation from new zero-emitting
renewable energy sources (like wind and solar) for reduced generation from existing coal-fired and natural gas-fired power plants.
The EG requires that each state submit its plan complying with all applicable requirements by the deadline included therein. One of the requirements consists of development of an emission standard (“standard of performance”) and establishment of compliance time for each EGU. The Clean Air Act (CAA) §111(a)(1) defines “standard of performance” as “a standard for emissions of air pollutants which reflects the degree of emission limitation achievable through the application of the best system of emission reduction which (taking into account the cost of achieving such reduction and any non-air quality health and environmental impact and energy requirements) the Administrator determines has been adequately demonstrated”.
2. History of Development of Emission Guidelines under CAA Over the last 40 years, under §111(d), the EPA has regulated four pollutants from five source categories, by promulgating associated EG. These source categories are phosphate fertilizer plants (fluorides), sulfuric acid plants (acid mist), Kraft pulp plants (total reduced sulfur (TRS)), primary aluminum plants (fluorides), and municipal solid waste landfills (landfill gas emissions as non-methane organic compounds (NMOCs))1. The following general principles and/or rationales were used by EPA in establishing BSER for these EGs:
1 See Footnote 18 at 79 FR 41776, July 17, 2014, including ‘‘Phosphate Fertilizer Plants; Final Guideline Document Availability,’’ 42 FR 12022 (March 1, 1977); ‘‘Standards of Performance for New Stationary Sources; Emission Guideline for Sulfuric Acid Mist,’’ 42 FR 55796 (October 18, 1977); ‘‘Kraft Pulp Mills, Notice of Availability of Final Guideline Document,’’ 44 FR 29828 (May 22, 1979); ‘‘Primary Aluminum Plants; Availability of Final Guideline Document,’’ 45 FR 26294 (April 17, 1980); ‘‘Standards of Performance for New Stationary Sources and Guidelines for Control of Existing Sources: Municipal Solid Waste Landfills, Final Rule,’’ 61 FR 9905 (March 12, 1996).
Roxboro-Page 2 of 29
Attachment B B-135Attachment B B-135

3
The degree of emission reduction achievable through the application of various demonstrated control
technologies. The technical feasibility of applying various demonstrated technologies to existing sources
considering variability in sizes and designs. The impact of various demonstrated technologies on national energy consumption, water pollution,
waste disposal, and ambient air concentrations of a designated pollutant. The cost of adopting the emission guidelines, after considering control costs for various demonstrated
technologies and taking into account the level of any existing controls. Each of these EGs indicates that the cost of applying various control technologies can have a considerable impact in selection of a BSER for any designated pollutant for existing facilities. They also indicate that the age, size, type, class, and process design of the facility, influence not only the BSER selection process, but can also support a decision-making for whether different EGs are to be established for differing sizes, types, or classes of equipment. The EGs for the above referenced source categories have been established for principal points of emissions (point and fugitive emissions sources) located within the facility and, not for any emissions sources located outside of the facility. Finally, in these EGs, with respect to determining the EG, EPA has consistently recognized that not only the control technology needs to be demonstrated on existing sources, but the degree of emission reduction (performance level) needs to be readily achievable by the control technology.
3. The Division of Air Quality (DAQ)’s Approach for Determination of BSER The DAQ will consider the above general principles in determining BSER for CO2 emissions reduction from each EGU. But, importantly, DAQ will determine BSER for each EGU based upon BB1-type measures only (i.e., measures which can be accomplished within the fence-line of the facility), conforming to the §111(d) of the CAA and the requirements of 40 CFR 60 “Adoption and Submittal of State Plans for Designated Facilities”. Thus, DAQ’s approach will comprise of improving the operational efficiency of the EGUs in order to reduce CO2 emissions from the 2012 baseline levels. The DAQ’s BSER evaluation will specifically be based upon the following: type of EGU remaining useful life of the EGU unit’s baseline data (net heat rate, net generation, annual capacity factor, and CO2 emissions) unit’s projected future capacity factor feasibility of applying specific heat rate improvement (HRI) measure on a given unit whether the measure is adequately demonstrated degree of heat rate reduction potential for feasible HRI measures site-specific limitations associated costs (capital, fixed and variable operational and maintenance (O&M), and fuel savings) cost per ton of CO2 reduction
Roxboro-Page 3 of 29
Attachment B B-136Attachment B B-136

4
The evaluation is also based on literature review2 of technical feasibility for various HRI measures, degree of heat rate reduction potential, and costs data (capital, and fixed and variable O&M). It needs to be emphasized here that DAQ’s determination for each EGU will not be based upon some pre-determined HRI target, such as EPA’s selection of a 4.3% HRI potential for EGUs in the Eastern interconnection3, as discussed in the EG. The DAQ’s approach will include those adequately demonstrated, cost-effective measures that assure that the electricity is generated with lower CO2 emissions, thus improving public health and welfare. The selected HRI measures would be expected to produce non-air environmental co-benefits in the form of reduced water usage and solid waste production, in addition to, reductions in emissions of non-GHG pollutants such as SO2, NOx, and mercury. However, it should be noted that as the EGU becomes more cost-competitive due to HRIs, it may be dispatched more frequently and/or at higher loads. If the EGU is utilized more often, some increases in emissions of GHG (as CO2) and similarly, for non-GHG pollutants (such as SO2, NOx, or mercury) are possible, and those could partially offset the emissions reductions achieved through the HRI of the EGU. EPA has determined a cost estimate of $23 per ton4 reasonable for CO2 emissions reduction from EGUs under BB1 implementing HRI measures. EPA has further determined that this cost is reasonable because it achieves “an appropriate balance between cost and amount of reductions.”5 In addition, EPA has used another benchmark in the form of social cost of carbon (SC-CO2) at $40 per ton (2020) to $48 per ton (2030)6 to conclude that the above $23 per ton cost is reasonable. In determining a BSER for a particular EGU, DAQ will use the above cost effectiveness threshold of $23 per ton to determine reasonableness of cost and whether one or more technically feasible measure(s) can be implemented, as long as, collectively, the total cost does not exceed this threshold.
4. BSER Evaluation Duke Energy Progress, Inc., Roxboro Steam Electric Plant (DEP) has provided information through submittals of July 31 and September 11, 2015, to aid in DAQ’s efforts in determining BSER for CO2 emissions from Units 1 through 4. Additional information was provided through face-to-face meetings and email communication.
2 “Coal-fired Power Plant Heat Rate Reductions”, Final Report, Sargent & Lundy, Chicago, IL, January 22, 2009. “Analysis of Heat Rate Improvement Potential at Coal-Fired Power Plants”, US Energy Information Administration, Washington, DC, May 2015. S. Corellis, “Range and Applicability of Heat Rate Improvements”, Technical Update, Electric Power Research Institute, Palo Alto, CA, April 2014. 3 Applies to coal-fired EGUs only. 4 See page 446 of 1560 (pre-publication version), Carbon Pollution Emission Guidelines for Existing Stationary Sources: Electric Utility Generating Units Clean Power Plan, August 3, 2015. Based on nation-wide coal fleet capacity of 213 GW, heat rate improvement capital cost of $100/KW, capital charge rate of 14.3%, fleet-wide baseline net heat rate of 10,250 Btu/KWh, heat rate improvement of 4% for coal-fired EGUs, annual capacity factor of 78%, and future (2030) average coal delivered cost of $2.70 per million Btu. See page 2-65, Greenhouse Gas Mitigation Measures, Technical Support Document (TSD) for Carbon Pollution Guidelines for Existing Power Plants”, August 3, 2015. 5 See page 457 of 1560 (pre-publication version), Ibid. 6 See pages 458 and 459 of 1560 (pre-publication version), Ibid.
Roxboro-Page 4 of 29
Attachment B B-137Attachment B B-137

5
The submitted information consists of baseline data (net heat rate, net generation, generation-based annual capacity factor, and CO2 emissions) for 2012, projected heat input for future years such as 2019; and cost data (capital cost and annual O&M)7, project life, degradation factor and HRI potential for each of the following measures, for possible implementation on all EGUs of NC-based coal fleet: Controllable Loss Reduction (Maintain Unit Efficiency) [CLR] Sliding Pressure Operation [SPO] Lower FGD Efficiency (as SO2 permit limits allow) [LFGD] Intelligent Sootblowers [ISB] Air Heater Leakage Reduction [ALR] Combustion Optimization - CCM / Excess Air / Neural Network [CO] Online Condenser Cleaning [OCC] Induced and/or Booster Draft Fan Variable Frequency Drive [IBD] Air Heater Exit Gas Temperature Reduction [AHE] Flue Gas Desulfurization (FGD) Auxiliary Load Reduction through Variable Frequency Drives
[FGDA] Boiler Feed Pump Motor Driven Variable Frequency Drive [BFP] Induced Draft Fan Replacement [IDFR] Forced Draft Fan Variable Frequency Drive [FDF] Condenser Rebundle, Retubes, and Rebuilds [CRR] Electrostatic Precipitator (ESP) (Power management, T/R set upgrades) [ESP] Turbine Upgrades (HI, IP, LP) [TUR] Helper Cooling Tower [HCT] DEP has claimed the submitted information on cost, project life, and degradation factors, as “confidential”. The DAQ will treat this specific information (cost data and information on project life and the associated degradation factors) “confidential” until the Director decides that it is not confidential in accordance with NCAC 2Q .0107 “Confidential Information”. Thus, DAQ will not include such information in this document. In general, through these submittals, DEP characterizes the HRI decreasing over time because the equipment associated with each measure degrades over time due to normal wear and tear, requiring recurrent implementation of HRI projects or measures. DEP further mentions that some of the efficiency projects cannot be performed or the full HRI benefits may not be realized due to unique configuration or physical limitation of a given EGU. In addition, DEP states that operation of any EGU at less than the full load or if cycled between full and partial load will adversely impact EGU’s heat rate. DEP also discusses reduced utilization of its coal-fired fleet in the recent history in response to lower natural gas prices, resulting in some of its coal-fired units, once operated as base-load units, now operating as intermediate duty cycling units. Finally, DEP adds that any post combustion environmental controls (activated carbon for mercury control, dry bottom and fly ash conversion for coal ash disposal, selective catalytic reduction for NOx control, and Zero Liquid Discharge (ZLD) for wastewater treatment) also adversely impact the heat rate of the EGU, in addition to any other environmental control which might be installed in future (any project implemented since its BSER submittal deadline date of July 31, 2015).
7 High level estimate in the range of -20% to +75% in 2015 $s.
Roxboro-Page 5 of 29
Attachment B B-138Attachment B B-138

6
With respect to the BSER evaluation, the DAQ has utilized the following data upon verifying or through calculations, for estimating heat rate reduction (Btu/kWh), CO2 emission reduction (short tons/yr), and cost per unit reduction of CO2 ($ per ton) for each measure:
Table 1 – Roxboro Units 1 through 4
Unit No. 1 2 3 4
Baseline (2012) Net Generation (MWh)
2,025,215 4,151,161 3,685,146 4,101,466
Baseline (2012) Net Heat Rate (Btu/kWh)
9,669 10,158 11,324 10,269
Baseline (2012) CO2 Emissions (Tons/yr)
1,973,768 3,939,610 3,916,660 4,722,499
Baseline (2012) Annual Heat Input (million Btu)
19,581,804 42,167,493 41,730,593 42,117,954
Baseline (2012) Annual Capacity Factor (heat input basis)
0.473 0.667 0.559 0.559
Future (2019) Projected Annual Capacity Factor (heat input basis)
0.310 0.570 0.280 0.220
Future (2019) Projected Coal Delivered Cost ($ per million Btu)
3.92 3.92 3.92 3.92
Commencement of Operation Year
1966 1968 1973 1980
Planned Retirement Year 2032 2032 2035 2035 It needs to be clarified here that, for all NC-based EGUs, owned by Duke Energy (both under DEC and Duke Energy Progress (DEP)), DAQ used the actual coal delivered prices for 2014 and scaled them for 20198 to estimate the above coal delivered price of $3.92 per million Btu. DAQ will adjust the capital
8 Duke Energy Carolinas The actual, average cost of fuel burned for 12 months ending December 2014 (Jan 2014-Dec 2014) was $3.84 per million Btu (See NCUC Docket No. E-7, Sub 1047, Duke Energy Carolinas, LLC Monthly Fuel Report, February 11, 2015). Duke Energy Progress The actual, average cost of coal burned for 12 months ending January 2015 (Feb 2014-Jan 2015) was $3.57 per million Btu (See NCUC Docket No. E-2, Sub 1064, Duke Energy Progress, INC. Monthly Fuel Report, March 12, 2015). Using the EIA (Annual Energy Outlook 2015) [www.eia.gov/beta/aeo/], Nationwide coal delivered prices were / projected to be: 2013 $2.50 per million Btu
Roxboro-Page 6 of 29
Attachment B B-139Attachment B B-139

7
and annual O&M costs estimates, provided by DEP in 2015 dollars, to 2019 dollars, using the growth factor of 1.8 percent compounded annually.9 BSER Candidate Measures for Units 1 through 4 For units 1 through 4, DEP has reasoned that measure SPO increases electric grid reliability risks due to boiler tube or drum damage and unstable operation, and recommended that this measure be removed from BSER evaluation for all coal-fired EGUs (both DEC and DEP). The DAQ agrees with DEP, and will not include these measures further in the BSER evaluation. Roxboro Unit 1 BSER Candidate Measures For Unit 1, DEP has determined that measures identified above as OCC, HCT, BFP and IDFR are either technically infeasible or each have very negligible HRI opportunity. Further, for Unit 1, measures CRR, TUR, ALR and CO were implemented prior to 2012 (baseline year); and measures IBD, FGDA, FDF and ISB were implemented between 2012 and July 31, 2015. Roxboro Unit 2 BSER Candidate Measures For Unit 2, DEP has determined that measures identified above as OCC, HCT, BFP, IDFR and AHE are either technically infeasible or each have very negligible HRI opportunity. Further, for Unit 2, measures CRR, TUR and CO were implemented prior to 2012 (baseline year); and measures FGDA and ALR were implemented between 2012 and July 31, 2015. Roxboro Unit 3 BSER Candidate Measures For Unit 3, DEP has determined that measures identified above as OCC, HCT, BFP, IDFR and AHE are either technically infeasible or each have very negligible HRI opportunity. Further, for Unit 3, measures IBD, FDF and CO were implemented prior to 2012 (baseline year); and measures CRR and FGDA were implemented between 2012 and July 31, 2015. Roxboro Unit 4 BSER Candidate Measures For Unit 4, DEP has determined that measures identified above as OCC, BFP, IDFR and AHE are either technically infeasible or each have very negligible HRI opportunity. Further, for Unit 4, measures IBD, FDF, ALR and CO were implemented prior to 2012 (baseline year); and measures CRR and FGDA were implemented between 2012 and July 31, 2015. Roxboro BSER Measure-by-Measure Analysis
2015 $2.41 per million Btu 2020 $2.54 per million Btu By interpolation, nationwide coal delivered prices for 2014 and 2019 would be approximately $2.46 per million Btu and $2.51 per million, respectively; thus an increase of 2 percent of coal price was projected from 2014 to 2019. Applying this ratio to the DEP’s fleet, the average coal delivered price in 2019 would be 1.02 * $3.84 per million Btu = $3.92 per million Btu. Applying the same ratio to the DEP fleet, the average coal delivered price in 2019 would be 1.02 * $3.57 per million Btu = $3.64 per million Btu. Using the larger value from the above, for conservative calculations, for the entire fleet (both DEP and DEP), the 2019 coal delivered cost is projected to be $3.92 per million Btu. 9 See both GDP Chain-Type Price Index and Metals and Metal Products Indicator, Table A20. Macroeconomics Indicators, USEIA Annual Energy Outlook 2015.
Roxboro-Page 7 of 29
Attachment B B-140Attachment B B-140
8
The DAQ has evaluated the remaining measures for Units 1 through 4 using the methodology described below: First, using the project life (year) for a given measure, DAQ has transformed capital investment ($) into an indirect annual (capital) cost ($ per year) by simply dividing capital investment by the project life. Then, it added it to the direct annual (fixed O&M) cost to determine the total annual cost. Then, using the coal delivered price, baseline year (2012) generation and capacity factor, future capacity factor, and average HRI percent (calculated assuming the HRI for a given measure degrades linearly over the project life based on degradation factor); coal fuel savings have been estimated for 2019. Fuel savings due to improved heat rate have been deducted from the total annual cost to determine net annual cost for implementation of a measure. Next, using baseline CO2 emissions, baseline and future capacity factors, and average improvement of heat rate for each EGU (again, assuming a decrease in HRI linearly over the measure’s life based on degradation factor) from baseline net heat rate, reduction in CO2 emissions associated with a given measure has been estimated. Finally, cost per unit reduction in CO2 is simply estimated by taking net annual cost and dividing it by CO2 emissions, both determined as above. It needs to be emphasized that the average HRI percent (calculated using degradation factor across the project life) and not the maximum HRI percent, has been applied to determine fuel savings and CO2 emissions reductions for a given measure. The following Table 2 (one table for each unit) includes heat rate reduction (Btu/kWh), CO2 emission reduction (tons/yr), and cost per unit CO2 reduction ($ per ton) for each of the remaining measures for Units 1 through 4:
Roxboro-Page 8 of 29
Attachment B B-141Attachment B B-141

9
Table 2
Roxboro Unit 1
Measure
Heat Rate Reduction (Btu/kWh)
[Project Life Average]
CO2 Emissions Reductions
(tons per year) [Project Life
Average]
Cost per Unit CO2 Reduction
($/ton) [Including Fuel
Savings]
Is Cost per Unit CO2 Reduction <= 23 $/ton?
Controllable Loss Reduction (Maintain Unit Efficiency) [CLR]
42 5,655 108 N
Online Condenser Cleaning [OCC] 0 0 0 -
Condenser Rebundle, Retubes, Rebuilds [CRR]
-
Turbine Upgrades (HP, IP, LP) [TUR] -
Helper Cooling Tower [HCT] 0 0 0 -
Induced and/or Booster Draft Fan Variable Frequency Drive [IBD]
-
FGD Aux Load reduction through Variable Frequency Drives [FGDA]
-
Boiler Feed Pump Motor Driven Variable Frequency Drive [BFP]
0 0 0 -
Induced Draft Fan Replacement [IDFR] 0 0 0 -
Forced Draft Fan Variable Frequency Drive [FDF]
-
Intelligent Sootblowers [ISB] -
AH Leakage Reduction [ALR] -
Combustion Optimization - CCM / Excess Air / Neural Network [CO]
-
AH Exit Gas Temperature Reduction [AHE]
25 3,393 138 N
Technically infeasible/no opportunity identified
Performed in or prior to baseline year 2012
Performed prior to July 2015 and after baseline year
Roxboro-Page 9 of 29
Attachment B B-142Attachment B B-142

10
Roxboro Unit 2
Measure
Heat Rate Reduction (Btu/kWh)
[Project Life Average]
CO2 Emissions Reductions
(tons per year) [Project Life
Average]
Cost per Unit CO2 Reduction
($/ton) [Including Fuel
Savings]
Is Cost per Unit CO2 Reduction <= 23 $/ton?
Controllable Loss Reduction (Maintain Unit Efficiency) [CLR]
44 14,721 14 Y
Online Condenser Cleaning [OCC] 0 0 0 -
Condenser Rebundle, Retubes, Rebuilds [CRR]
-
Turbine Upgrades (HP, IP, LP) [TUR] -
Helper Cooling Tower [HCT] 0 0 0 -
Induced and/or Booster Draft Fan Variable Frequency Drive [IBD]
38 12,736 7 Y
FGD Aux Load reduction through Variable Frequency Drives [FGDA]
-
Boiler Feed Pump Motor Driven Variable Frequency Drive [BFP]
0 0 0 -
Induced Draft Fan Replacement [IDFR] 0 0 0 -
Forced Draft Fan Variable Frequency Drive [FDF]
15 4,994 28 N
Intelligent Sootblowers [ISB] 27 8,832 -30 Y
AH Leakage Reduction [ALR] -
Combustion Optimization - CCM / Excess Air / Neural Network [CO]
-
AH Exit Gas Temperature Reduction [AHE]
0 0 0 -
Technically infeasible/no opportunity identified
Performed in or prior to baseline year 2012
Performed prior to July 2015 and after baseline year
Roxboro-Page 10 of 29
Attachment B B-143Attachment B B-143

11
Roxboro Unit 3
Measure
Heat Rate Reduction (Btu/kWh)
[Project Life Average]
CO2 Emissions Reductions
(tons per year) [Project Life
Average]
Cost per Unit CO2 Reduction
($/ton) [Including Fuel
Savings]
Is Cost per Unit CO2 Reduction <= 23 $/ton?
Controllable Loss Reduction (Maintain Unit Efficiency) [CLR]
50 8,583 55 N
Online Condenser Cleaning [OCC] 0 0 0 -
Condenser Rebundle, Retubes, Rebuilds [CRR]
-
Turbine Upgrades (HP, IP, LP) [TUR] 106 18,392 99 N
Helper Cooling Tower [HCT] 0 0 0 -
Induced and/or Booster Draft Fan Variable Frequency Drive [IBD]
-
FGD Aux Load reduction through Variable Frequency Drives [FGDA]
-
Boiler Feed Pump Motor Driven Variable Frequency Drive [BFP]
0 0 0 -
Induced Draft Fan Replacement [IDFR] 0 0 0 -
Forced Draft Fan Variable Frequency Drive [FDF]
-
Intelligent Sootblowers [ISB] 30 5,150 -21 Y
AH Leakage Reduction [ALR] 14 2,452 49 N
Combustion Optimization - CCM / Excess Air / Neural Network [CO]
-
AH Exit Gas Temperature Reduction [AHE]
0 0 0 -
Technically infeasible/no opportunity identified
Performed in or prior to baseline year 2012
Performed prior to July 2015 and after baseline year
Roxboro-Page 11 of 29
Attachment B B-144Attachment B B-144

12
Roxboro Unit 4
Measure
Heat Rate Reduction (Btu/kWh)
[Project Life Average]
CO2 Emissions Reductions
(tons per year) [Project Life
Average]
Cost per Unit CO2 Reduction
($/ton) [Including Fuel
Savings]
Is Cost per Unit CO2 Reduction <= 23 $/ton?
Controllable Loss Reduction (Maintain Unit Efficiency) [CLR]
45 8,122 67 N
Online Condenser Cleaning [OCC] 0 0 0 -
Condenser Rebundle, Retubes, Rebuilds [CRR]
-
Turbine Upgrades (HP, IP, LP) [TUR] 96 17,405 119 N
Helper Cooling Tower [HCT] 18 3,249 116 N
Induced and/or Booster Draft Fan Variable Frequency Drive [IBD]
-
FGD Aux Load reduction through Variable Frequency Drives [FGDA]
-
Boiler Feed Pump Motor Driven Variable Frequency Drive [BFP]
0 0 0 -
Induced Draft Fan Replacement [IDFR] 0 0 0 -
Forced Draft Fan Variable Frequency Drive [FDF]
-
Intelligent Sootblowers [ISB] 27 4,873 -13 Y
AH Leakage Reduction [ALR] -
Combustion Optimization - CCM / Excess Air / Neural Network [CO]
-
AH Exit Gas Temperature Reduction [AHE]
0 0 0 -
Technically infeasible/no opportunity identified
Performed in or prior to baseline year 2012
Performed prior to July 2015 and after baseline year Refer to the attached spreadsheet on calculations for annualized cost and cost per unit reduction of CO2 for each of the HRI measures included in the Table 2 above. The retirement age for each EGU has been estimated by DEP and made available to DAQ. There is no need to adjust the above estimated costs for the remaining useful life (RUL) of the EGUs. Each BSER measure considered has a project life that is less than the RUL of the EGU.
Roxboro-Page 12 of 29
Attachment B B-145Attachment B B-145

13
Roxboro Unit 1 Results Discussion If implemented, all of the measures included in Table 2, Unit 1 above would be expected to produce non-air environmental co-benefits in the form of reduced water usage and solid waste production, in addition to, reduced emissions of non-GHG pollutants such as SO2, NOx, and mercury. Moreover, adverse energy impacts would not be expected as well. The remaining available measures to be considered are CLR and AHE as shown in the table. Comparing the cost estimates for these measures with the reasonable cost threshold of less than or equal to $23 per ton, as discussed in Section 3, each of the estimated costs can be considered “excessive”, “exorbitant” or “unreasonable”, as stated by EPA in the preamble to the final EG10. Thus, DAQ determines that there are no HRI measures available for BSER. In summary, DAQ is determining the estimated costs in $ per ton for each of the measures for Unit 1 unreasonable. Thus, considering cost, non-air environmental, and energy impacts, DAQ determines that none of the measures listed in Table 2 above is BSER for Unit 1. Roxboro Unit 2 Results Discussion The remaining available measures to be considered are CLR, IBD and ISB as shown in Table 2, Unit 2. Comparing the above estimates with the reasonable cost threshold of $23 per ton, as discussed in Section 3, the cost for three of the measures: CLR, IBD and ISB is each less than or equal to $23 per ton at a collective cost of -$9 per ton. Measure FDF is available at a cost of $28 per ton, can be added and still keep the collective cost for all four measures to less than or equal to $23 per ton at $19 per ton. The DAQ will select the combination of measures to maximize CO2 emissions reductions while keeping the collective cost of the selected measures less than or equal to $23 per ton. There are a number of possible combinations of measures that could be evaluated, shown as options 1-5 in Table 3 below. Note the table also includes the contribution to costs and benefits associated with the CLR adjusted and non-adjusted as necessary. First, consider using all four available measures: CLR, IBD, ISB and FDF (Option 6 in Table 3). Based on confidential information DEC has supplied as justification, if a large number of other measures are available for a given unit, then the projected HRI benefit from CLR should be further reduced. Therefore, DAQ has reduced the HRI benefit for CLR anytime there are two or more other measures to be implemented, in this case to from 44 Btu/kWh to 22 Btu/kWh. This results in the cost for CLR being increased from $14 per ton to $71 per ton, and the collective cost for the four measures CLR, IBD, ISB and FDF now increases from $19 per ton to $76 per ton. Therefore, this combination of measures cannot be selected since the collective cost is greater than the $23 per ton threshold. Likewise, it can be seen from the costs in Table 3 that any combination of measures with CLR and two of the remaining three measures will result in collective costs of greater than $23 per ton; therefore those combinations are not discussed or shown in Table 3. Next, consider using measures CLR and IBD (Option 1 in Table 3). In this case, the HRI benefit for CLR does not need to be reduced since only two measures are considered. The collective cost of CLR and IBD is $21 per ton with a CO2 emissions reduction of 27,456 tons per year.
10 Page 298 of 1560 (pre-publication version), Ibid.
Roxboro-Page 13 of 29
Attachment B B-146Attachment B B-146

14
Next, consider using measures CLR and ISB (Option 2 in Table 3). In this case, the HRI benefit for CLR does not need to be reduced since only two measures are considered. The collective cost of CLR and ISB is -$16 per ton with a CO2 emissions reduction of 23,553 tons per year. Next, consider using measures CLR and FDF (Option 3 in Table 3). In this case, the HRI benefit for CLR does not need to be reduced since only two measures are considered. The collective cost of CLR and FDF is $42 per ton with a CO2 emissions reduction of 19,715 tons per year. Next, consider using measures IBD and ISB (Option 4 in Table 3). The collective cost of IBD and ISB is -$24 per ton with a CO2 emissions reduction of 21,568 tons per year. Next, consider using measures IBD, ISB and FDF (Option 5 in Table 3). The collective cost of IBD, ISB and FDF is $4 per ton with a CO2 emissions reduction of 26,563 tons per year.
Table 3: Roxboro Unit 2 Cost and Benefits as a Function of Measure Combinations
Option Measures Btu/kWh $ per ton Tons per year
- CLR with one other measure 44 14 14,721 - CLR with two or more measures 22 71 7,360 - IBD 38 7 12,736 - ISB 27 -30 8,832 - FDF 15 28 4,994 1 CLR+IBD 83 21 27,456 2 CLR+ISB 71 -16 23,553 3 CLR+FDF 60 42 19,715 4 IBD+ISB 65 -24 21,568 5 IBD+ISB+FDF 80 4 26,563 6 CLR+IBD+ISB+FDF 102 76 31,557
There are four combinations with a collective cost of less than or equal to $23 per ton: Options 1, 2, 4 and 5. To maximize CO2 emissions reductions, Option 1 (CLR and IBD) and Option 5 (IBD, ISB and FDF) have the greatest reductions with 27,456 tons per year and 26,563 tons per year respectively. There is some uncertainty about whether the HRI benefits associated with CLR would actually be realized as per the information provided by DEP. Given the small margin of difference between Option 1 and Option 5, the DAQ recommends Option 5(IBD+ISB+FDF). In summary, for the Unit 2 measures IBD, ISB and FDF, DAQ has determined the CO2 emission reduction cost of $4 per ton reasonable. The associated heat rate reduction and CO2 emissions reduction are 80 Btu/kWh and 26,563 tons per year, respectively. In addition, the measures are expected to produce non-air environmental co-benefits in the form of reduced water usage and solid waste production, in addition to reduced emissions of non-GHG pollutants such as SO2, NOx, and mercury. Finally, no adverse energy impact is expected from employing the measures at Unit 2. Thus, DAQ determines that measures IBD, ISB and FDF are the BSER for Roxboro Unit 2. Roxboro Unit 3 Results Discussion For Unit 3, the remaining available measures to be considered are CLR, TUR, ISB and ALR as shown in Table 2, Unit 3. Only one measure, ISB, is less than or equal to $23 per ton at a cost of -$21 per ton.
Roxboro-Page 14 of 29
Attachment B B-147Attachment B B-147

15
Of the three other above measures, none could be considered and still keep the collective cost less than or equal to $23 per ton. In summary, DAQ determines that measure ISB at a cost of -$21 per ton with a HRI benefit of 30 Btu/kWh and a total of 5,150 tons of CO2 reduction is the BSER for Roxboro Unit 3. This measure is expected to produce non-air environmental co-benefits in the form of reduced water usage and solid waste production, in addition to reduced emissions of non-GHG pollutants such as SO2, NOx, and mercury. Finally, no adverse energy impact is expected from employing the measures at Unit 3. Roxboro Unit 4 Results Discussion For Unit 4, the remaining available measures to be considered are CLR, TUR, HCT and ISB as shown in Table 2, Unit 4. Only one measure, ISB, is less than or equal to $23 per ton at a cost of -$13 per ton. Of the three other above measures, none could be added and still keep the collective cost less than or equal to $23 per ton. In summary, DAQ determines that measure ISB at a cost of -$13 per ton with a HRI benefit of 27 Btu/kWh and a total of 4,873 tons of CO2 reduction is the BSER for Roxboro Unit 4. This measure is expected to produce non-air environmental co-benefits in the form of reduced water usage and solid waste production, in addition to reduced emissions of non-GHG pollutants such as SO2, NOx, and mercury. Finally, no adverse energy impact is expected from employing the measure at Unit 4.
5. BSER for Roxboro Units 1, 2, 3 and 4 For Roxboro Unit 1, there are no BSER HRI measures applicable. For Roxboro Unit 2, DEP shall implement HRI measures IBD, ISB and FDF, starting September 1, 2019. For Roxboro Unit 3, DEP shall implement HRI measure ISB, starting September 1, 2019. For Roxboro Unit 4, DEP shall implement HRI measure ISB, starting September 1, 2019.
Roxboro-Page 15 of 29
Attachment B B-148Attachment B B-148

NOTES REFERENCES
$107,397 A 1
$107,397 DC 2(a)
None
$0 IC 2(a)
$107,397 TCI = DC + IC 2(a)
$805,476 1
-$219,772 3
$585,703 2(b)
8 PL 1$13,425 TCRC = TCI/PL 2(b)
$13,425 IDAC = TCRC 2(b)
$599,128 TAC = DAC + IDAC 2(b)
1,790,591 4
9,669 4
Baseline (2012) Net Generation, MW-h 2,025,215 4
Baseline (2012) Annual Capacity Factor (heat input basis), % 47.34 4
Future (2019) Annual Capacity Factor (projected heat input basis), % 31.00 4
Future (2019) Net Generation, MW-h 1,326,186 5
48
36
Project Life, Years 8 1
Degradation Factor Across Project Life, % 25 1
0.50 1
0.38 1
CO2 Emissions Reduction (1st year) (corresponding to heat rate improvement), % 0.50
CO2 Emissions Reduction (nth year) (corresponding to heat rate improvement), % 0.38
5,863 6
6,463 6
4,397 6
4,847 6
93 7
127 8
124 7
169 8
108
148
42
5655
1. Duke Energy Submittal, September 11, 2015.
5. Based on baseline net generation and ratio of baseline and future capacity factors.
6. Based on baseline CO2 emissions and capacity factor, future capacity factor, and CO2 emissions reductions percentage.
7. Based on total annual cost including fuel savings and CO2 emissions reductions from baseline.
8. Based on total annual cost excluding fuel savings and CO2 emissions reductions from baseline.
Direct Annual Costs
Fixed & Variable Operation & Maintenance Cost
Annual Cost
Total Capital Investment (TCI)
Duke Energy Progress, Inc.Roxboro U1Annualized Cost and Cost Per Unit CO2 Reduction forControllable Loss Reduction (Maintain Unit Efficiency)
CAPITAL COST
`
Equipment Cost
Total Direct Costs
Indirect Costs
Total Indirect Costs
Fuel Savings
Total Direct Annual Costs (DAC)
Indirect Annual Costs
Project Life
Total Capital Recovery Costs (TCRC)
Total Indirect Annual Costs (IDAC)
Total Annual CostBaseline (2012) CO2 Emissions, metric ton/yr
Cost per Short Ton of CO2 Removed (nth year of project life) (exclude fuel savings)
Heat Rate Reduction (Improvement) (1st year of project life), Btu/kw-hr
Heat Rate Reduction (Improvement) (nth year of project life), Btu/kw-hr
Heat Rate Improvement (1st year) from Baseline Net Heat Rate, %
Heat Rate Improvement (nth year) from Baseline Net Heat Rate, %
CO2 Emissions Reduction (1st year) from Baseline, Metric ton/yr
CO2 Emissions Reduction (nth year) from Baseline, Short ton/yr
CO2 Emissions Reduction (1st year) from Baseline, Metric ton/yr
CO2 Emissions Reduction (nth year) from Baseline, Metric ton/yr
Cost per Short Ton of CO2 Removed (1st year of project life) (include fuel savings)
Cost per Short Ton of CO2 Removed (1st year of project life) (exclude fuel savings)
Cost per Short Ton of CO2 Removed (nth year of project life) (include fuel savings)
Baseline (2012) Net Heat Rate, Btu/kw-hr
4. DAQ Spreadsheet on Fleetwide Calculations for Baseline and Future Years.
Average Cost per Short Ton of CO2 Removed Across the Project Life (include fuel savings)
Average Cost per Short Ton of CO2 Removed Across the Project Life (exclude fuel savings)
2. EPA Air Pollution Control Cost Manual, Sixth Edition, January 2002; EPA/452/B-02-001
a. Section 1, Chapter 2, Paragraph 2.3.1 Elements of Total Capital Investment.
b. Section 1, Chapter 2, Paragraph 2.3.2: Elements of Total Annual Cost.3. Based on baseline net generation and net heat rate, ratio of baseline and future capacity factors, heat rate improvement, and future year (2019) average coal price included in "Annual Energy Outlook 2015", US EIA.
Heat Rate Reduction (Improvement) (average over project life), Btu/kw-hr
CO2 Emissions Reduction from Baseline (average over project life), Short ton/yr
Roxboro-Page 16 of 29
Attachment B B-149Attachment B B-149

NOTES REFERENCES
$3,758,886 A 1
$3,758,886 DC 2(a)
None
$0 IC 2(a)
$3,758,886 TCI = DC + IC 2(a)
$53,698 1
-$131,863 3
-$78,165 2(b)
7 PL 1$536,984 TCRC = TCI/PL 2(b)
$536,984 IDAC = TCRC 2(b)
$458,819 TAC = DAC + IDAC 2(b)
1,790,591 4
9,669 4
Baseline (2012) Net Generation, MW-h 2,025,215 4
Baseline (2012) Annual Capacity Factor (heat input basis), % 47.34 4
Future (2019) Annual Capacity Factor (projected heat input basis), % 31.00 4
Future (2019) Net Generation, MW-h 1,326,186 5
29
22
Project Life, Years 7 1
Degradation Factor Across Project Life, % 25 1
0.30 1
0.23 1
CO2 Emissions Reduction (1st year) (corresponding to heat rate improvement), % 0.30
CO2 Emissions Reduction (nth year) (corresponding to heat rate improvement), % 0.23
3,518 6
3,878 6
2,638 6
2,908 6
118 7
152 8
158 7
203 8
138
178
25
3393
1. Duke Energy Submittal, September 11, 2015.
5. Based on baseline net generation and ratio of baseline and future capacity factors.
6. Based on baseline CO2 emissions and capacity factor, future capacity factor, and CO2 emissions reductions percentage.
7. Based on total annual cost including fuel savings and CO2 emissions reductions from baseline.
8. Based on total annual cost excluding fuel savings and CO2 emissions reductions from baseline.
Direct Annual Costs
Fixed & Variable Operation & Maintenance Cost
Annual Cost
Total Capital Investment (TCI)
Duke Energy Progress, Inc.Roxboro U1Annualized Cost and Cost Per Unit CO2 Reduction forAH Exit Gas Temperature Reduction
CAPITAL COST
`
Equipment Cost
Total Direct Costs
Indirect Costs
Total Indirect Costs
Fuel Savings
Total Direct Annual Costs (DAC)
Indirect Annual Costs
Project Life
Total Capital Recovery Costs (TCRC)
Total Indirect Annual Costs (IDAC)
Total Annual CostBaseline (2012) CO2 Emissions, metric ton/yr
Cost per Short Ton of CO2 Removed (nth year of project life) (exclude fuel savings)
Heat Rate Reduction (Improvement) (1st year of project life), Btu/kw-hr
Heat Rate Reduction (Improvement) (nth year of project life), Btu/kw-hr
Heat Rate Improvement (1st year) from Baseline Net Heat Rate, %
Heat Rate Improvement (nth year) from Baseline Net Heat Rate, %
CO2 Emissions Reduction (1st year) from Baseline, Metric ton/yr
CO2 Emissions Reduction (nth year) from Baseline, Short ton/yr
CO2 Emissions Reduction (1st year) from Baseline, Metric ton/yr
CO2 Emissions Reduction (nth year) from Baseline, Metric ton/yr
Cost per Short Ton of CO2 Removed (1st year of project life) (include fuel savings)
Cost per Short Ton of CO2 Removed (1st year of project life) (exclude fuel savings)
Cost per Short Ton of CO2 Removed (nth year of project life) (include fuel savings)
Baseline (2012) Net Heat Rate, Btu/kw-hr
4. DAQ Spreadsheet on Fleetwide Calculations for Baseline and Future Years.
Average Cost per Short Ton of CO2 Removed Across the Project Life (include fuel savings)
Average Cost per Short Ton of CO2 Removed Across the Project Life (exclude fuel savings)
2. EPA Air Pollution Control Cost Manual, Sixth Edition, January 2002; EPA/452/B-02-001
a. Section 1, Chapter 2, Paragraph 2.3.1 Elements of Total Capital Investment.
b. Section 1, Chapter 2, Paragraph 2.3.2: Elements of Total Annual Cost.3. Based on baseline net generation and net heat rate, ratio of baseline and future capacity factors, heat rate improvement, and future year (2019) average coal price included in "Annual Energy Outlook 2015", US EIA.
Heat Rate Reduction (Improvement) (average over project life), Btu/kw-hr
CO2 Emissions Reduction from Baseline (average over project life), Short ton/yr
Roxboro-Page 17 of 29
Attachment B B-150Attachment B B-150

NOTES REFERENCES
$107,397 A 1
$107,397 DC 2(a)
None
$0 IC 2(a)
$107,397 TCI = DC + IC 2(a)
$805,476 1
-$617,239 3
$188,236 2(b)
8 PL 1$13,425 TCRC = TCI/PL 2(b)
$13,425 IDAC = TCRC 2(b)
$201,661 TAC = DAC + IDAC 2(b)
3,573,991 4
10,158 4
Baseline (2012) Net Generation, MW-h 4,151,161 4
Baseline (2012) Annual Capacity Factor (heat input basis), % 66.74 4
Future (2019) Annual Capacity Factor (projected heat input basis), % 57.00 4
Future (2019) Net Generation, MW-h 3,545,343 5
51
38
Project Life, Years 8 1
Degradation Factor Across Project Life, % 25 1
0.50 1
0.38 1
CO2 Emissions Reduction (1st year) (corresponding to heat rate improvement), % 0.50
CO2 Emissions Reduction (nth year) (corresponding to heat rate improvement), % 0.38
15,262 6
16,824 6
11,447 6
12,618 6
12 7
49 8
16 7
65 8
14
57
44
14721
1. Duke Energy Submittal, September 11, 2015.
5. Based on baseline net generation and ratio of baseline and future capacity factors.
6. Based on baseline CO2 emissions and capacity factor, future capacity factor, and CO2 emissions reductions percentage.
7. Based on total annual cost including fuel savings and CO2 emissions reductions from baseline.
8. Based on total annual cost excluding fuel savings and CO2 emissions reductions from baseline.
4. DAQ Spreadsheet on Fleetwide Calculations for Baseline and Future Years.
Heat Rate Reduction (Improvement) (average over project life), Btu/kw-hr
CO2 Emissions Reduction from Baseline (average over project life), Short ton/yr
Average Cost per Short Ton of CO2 Removed Across the Project Life (include fuel savings)
Average Cost per Short Ton of CO2 Removed Across the Project Life (exclude fuel savings)
2. EPA Air Pollution Control Cost Manual, Sixth Edition, January 2002; EPA/452/B-02-001
a. Section 1, Chapter 2, Paragraph 2.3.1 Elements of Total Capital Investment.
b. Section 1, Chapter 2, Paragraph 2.3.2: Elements of Total Annual Cost.3. Based on baseline net generation and net heat rate, ratio of baseline and future capacity factors, heat rate improvement, and future year (2019) average coal price included in "Annual Energy Outlook 2015", US EIA.
Cost per Short Ton of CO2 Removed (nth year of project life) (exclude fuel savings)
Heat Rate Reduction (Improvement) (1st year of project life), Btu/kw-hr
Heat Rate Reduction (Improvement) (nth year of project life), Btu/kw-hr
Heat Rate Improvement (1st year) from Baseline Net Heat Rate, %
Heat Rate Improvement (nth year) from Baseline Net Heat Rate, %
CO2 Emissions Reduction (1st year) from Baseline, Metric ton/yr
CO2 Emissions Reduction (nth year) from Baseline, Short ton/yr
CO2 Emissions Reduction (1st year) from Baseline, Metric ton/yr
CO2 Emissions Reduction (nth year) from Baseline, Metric ton/yr
Cost per Short Ton of CO2 Removed (1st year of project life) (include fuel savings)
Cost per Short Ton of CO2 Removed (1st year of project life) (exclude fuel savings)
Cost per Short Ton of CO2 Removed (nth year of project life) (include fuel savings)
Baseline (2012) Net Heat Rate, Btu/kw-hr
Annual Cost
Direct Annual Costs
Fixed & Variable Operation & Maintenance Cost
Fuel Savings
Total Direct Annual Costs (DAC)
Indirect Annual Costs
Project Life
Total Capital Recovery Costs (TCRC)
Total Indirect Annual Costs (IDAC)
Total Annual CostBaseline (2012) CO2 Emissions, metric ton/yr
Total Capital Investment (TCI)
Duke Energy Progress, Inc.Roxboro U2Annualized Cost and Cost Per Unit CO2 Reduction forControllable Loss Reduction (Maintain Unit Efficiency)
CAPITAL COST
`
Equipment Cost
Total Direct Costs
Indirect Costs
Total Indirect Costs
Roxboro-Page 18 of 29
Attachment B B-151Attachment B B-151

NOTES REFERENCES
$10,739,674 A 1
$10,739,674 DC 2(a)
None
$0 IC 2(a)
$10,739,674 TCI = DC + IC 2(a)
$80,548 1
-$534,022 3
-$453,475 2(b)
20 PL 1$536,984 TCRC = TCI/PL 2(b)
$536,984 IDAC = TCRC 2(b)
$83,509 TAC = DAC + IDAC 2(b)
3,573,991 4
10,158 4
Baseline (2012) Net Generation, MW-h 4,151,161 4
Baseline (2012) Annual Capacity Factor (heat input basis), % 66.74 4
Future (2019) Annual Capacity Factor (projected heat input basis), % 57.00 4
Future (2019) Net Generation, MW-h 3,545,343 5
40
36
Project Life, Years 20 1
Degradation Factor Across Project Life, % 10 1
0.40 1
0.36 1
CO2 Emissions Reduction (1st year) (corresponding to heat rate improvement), % 0.40
CO2 Emissions Reduction (nth year) (corresponding to heat rate improvement), % 0.36
12,162 6
13,406 6
10,946 6
12,066 6
6 7
46 8
7 7
51 8
7
49
38
12736
1. Duke Energy Submittal, September 11, 2015.
5. Based on baseline net generation and ratio of baseline and future capacity factors.
6. Based on baseline CO2 emissions and capacity factor, future capacity factor, and CO2 emissions reductions percentage.
7. Based on total annual cost including fuel savings and CO2 emissions reductions from baseline.
8. Based on total annual cost excluding fuel savings and CO2 emissions reductions from baseline.
4. DAQ Spreadsheet on Fleetwide Calculations for Baseline and Future Years.
Heat Rate Reduction (Improvement) (average over project life), Btu/kw-hr
CO2 Emissions Reduction from Baseline (average over project life), Short ton/yr
Average Cost per Short Ton of CO2 Removed Across the Project Life (include fuel savings)
Average Cost per Short Ton of CO2 Removed Across the Project Life (exclude fuel savings)
2. EPA Air Pollution Control Cost Manual, Sixth Edition, January 2002; EPA/452/B-02-001
a. Section 1, Chapter 2, Paragraph 2.3.1 Elements of Total Capital Investment.
b. Section 1, Chapter 2, Paragraph 2.3.2: Elements of Total Annual Cost.3. Based on baseline net generation and net heat rate, ratio of baseline and future capacity factors, heat rate improvement, and future year (2019) average coal price included in "Annual Energy Outlook 2015", US EIA.
Cost per Short Ton of CO2 Removed (nth year of project life) (exclude fuel savings)
Heat Rate Reduction (Improvement) (1st year of project life), Btu/kw-hr
Heat Rate Reduction (Improvement) (nth year of project life), Btu/kw-hr
Heat Rate Improvement (1st year) from Baseline Net Heat Rate, %
Heat Rate Improvement (nth year) from Baseline Net Heat Rate, %
CO2 Emissions Reduction (1st year) from Baseline, Metric ton/yr
CO2 Emissions Reduction (nth year) from Baseline, Short ton/yr
CO2 Emissions Reduction (1st year) from Baseline, Metric ton/yr
CO2 Emissions Reduction (nth year) from Baseline, Metric ton/yr
Cost per Short Ton of CO2 Removed (1st year of project life) (include fuel savings)
Cost per Short Ton of CO2 Removed (1st year of project life) (exclude fuel savings)
Cost per Short Ton of CO2 Removed (nth year of project life) (include fuel savings)
Baseline (2012) Net Heat Rate, Btu/kw-hr
Annual Cost
Direct Annual Costs
Fixed & Variable Operation & Maintenance Cost
Fuel Savings
Total Direct Annual Costs (DAC)
Indirect Annual Costs
Project Life
Total Capital Recovery Costs (TCRC)
Total Indirect Annual Costs (IDAC)
Total Annual CostBaseline (2012) CO2 Emissions, metric ton/yr
Total Capital Investment (TCI)
Duke Energy Progress, Inc.Roxboro U2Annualized Cost and Cost Per Unit CO2 Reduction forInduced and/or booster Draft Fan Variable Frequency Drive
CAPITAL COST
`
Equipment Cost
Total Direct Costs
Indirect Costs
Total Indirect Costs
Roxboro-Page 19 of 29
Attachment B B-152Attachment B B-152

NOTES REFERENCES
$5,369,837 A 1
$5,369,837 DC 2(a)
None
$0 IC 2(a)
$5,369,837 TCI = DC + IC 2(a)
$80,548 1
-$209,420 3
-$128,873 2(b)
20 PL 1$268,492 TCRC = TCI/PL 2(b)
$268,492 IDAC = TCRC 2(b)
$139,619 TAC = DAC + IDAC 2(b)
3,573,991 4
10,158 4
Baseline (2012) Net Generation, MW-h 4,151,161 4
Baseline (2012) Annual Capacity Factor (heat input basis), % 66.74 4
Future (2019) Annual Capacity Factor (projected heat input basis), % 57.00 4
Future (2019) Net Generation, MW-h 3,545,343 5
16
14
Project Life, Years 20 1
Degradation Factor Across Project Life, % 10 1
0.16 1
0.14 1
CO2 Emissions Reduction (1st year) (corresponding to heat rate improvement), % 0.16
CO2 Emissions Reduction (nth year) (corresponding to heat rate improvement), % 0.14
4,769 6
5,257 6
4,292 6
4,732 6
27 7
66 8
30 7
74 8
28
70
15
4994
1. Duke Energy Submittal, September 11, 2015.
5. Based on baseline net generation and ratio of baseline and future capacity factors.
6. Based on baseline CO2 emissions and capacity factor, future capacity factor, and CO2 emissions reductions percentage.
7. Based on total annual cost including fuel savings and CO2 emissions reductions from baseline.
8. Based on total annual cost excluding fuel savings and CO2 emissions reductions from baseline.
4. DAQ Spreadsheet on Fleetwide Calculations for Baseline and Future Years.
Heat Rate Reduction (Improvement) (average over project life), Btu/kw-hr
CO2 Emissions Reduction from Baseline (average over project life), Short ton/yr
Average Cost per Short Ton of CO2 Removed Across the Project Life (include fuel savings)
Average Cost per Short Ton of CO2 Removed Across the Project Life (exclude fuel savings)
2. EPA Air Pollution Control Cost Manual, Sixth Edition, January 2002; EPA/452/B-02-001
a. Section 1, Chapter 2, Paragraph 2.3.1 Elements of Total Capital Investment.
b. Section 1, Chapter 2, Paragraph 2.3.2: Elements of Total Annual Cost.3. Based on baseline net generation and net heat rate, ratio of baseline and future capacity factors, heat rate improvement, and future year (2019) average coal price included in "Annual Energy Outlook 2015", US EIA.
Cost per Short Ton of CO2 Removed (nth year of project life) (exclude fuel savings)
Heat Rate Reduction (Improvement) (1st year of project life), Btu/kw-hr
Heat Rate Reduction (Improvement) (nth year of project life), Btu/kw-hr
Heat Rate Improvement (1st year) from Baseline Net Heat Rate, %
Heat Rate Improvement (nth year) from Baseline Net Heat Rate, %
CO2 Emissions Reduction (1st year) from Baseline, Metric ton/yr
CO2 Emissions Reduction (nth year) from Baseline, Short ton/yr
CO2 Emissions Reduction (1st year) from Baseline, Metric ton/yr
CO2 Emissions Reduction (nth year) from Baseline, Metric ton/yr
Cost per Short Ton of CO2 Removed (1st year of project life) (include fuel savings)
Cost per Short Ton of CO2 Removed (1st year of project life) (exclude fuel savings)
Cost per Short Ton of CO2 Removed (nth year of project life) (include fuel savings)
Baseline (2012) Net Heat Rate, Btu/kw-hr
Annual Cost
Direct Annual Costs
Fixed & Variable Operation & Maintenance Cost
Fuel Savings
Total Direct Annual Costs (DAC)
Indirect Annual Costs
Project Life
Total Capital Recovery Costs (TCRC)
Total Indirect Annual Costs (IDAC)
Total Annual CostBaseline (2012) CO2 Emissions, metric ton/yr
Total Capital Investment (TCI)
Duke Energy Progress, Inc.Roxboro U2Annualized Cost and Cost Per Unit CO2 Reduction forForced Draft Fan Variable Frequency Drive
CAPITAL COST
`
Equipment Cost
Total Direct Costs
Indirect Costs
Total Indirect Costs
Roxboro-Page 20 of 29
Attachment B B-153Attachment B B-153

NOTES REFERENCES
$536,984 A 1
$536,984 DC 2(a)
None
$0 IC 2(a)
$536,984 TCI = DC + IC 2(a)
$53,698 1
-$370,344 3
-$316,645 2(b)
10 PL 1$53,698 TCRC = TCI/PL 2(b)
$53,698 IDAC = TCRC 2(b)
-$262,947 TAC = DAC + IDAC 2(b)
3,573,991 4
10,158 4
Baseline (2012) Net Generation, MW-h 4,151,161 4
Baseline (2012) Annual Capacity Factor (heat input basis), % 66.74 4
Future (2019) Annual Capacity Factor (projected heat input basis), % 57.00 4
Future (2019) Net Generation, MW-h 3,545,343 5
30
23
Project Life, Years 10 1
Degradation Factor Across Project Life, % 25 1
0.30 1
0.23 1
CO2 Emissions Reduction (1st year) (corresponding to heat rate improvement), % 0.30
CO2 Emissions Reduction (nth year) (corresponding to heat rate improvement), % 0.23
9,157 6
10,094 6
6,868 6
7,571 6
-26 7
11 8
-35 7
14 8
-30
12
27
8832
1. Duke Energy Submittal, September 11, 2015.
5. Based on baseline net generation and ratio of baseline and future capacity factors.
6. Based on baseline CO2 emissions and capacity factor, future capacity factor, and CO2 emissions reductions percentage.
7. Based on total annual cost including fuel savings and CO2 emissions reductions from baseline.
8. Based on total annual cost excluding fuel savings and CO2 emissions reductions from baseline.
4. DAQ Spreadsheet on Fleetwide Calculations for Baseline and Future Years.
Heat Rate Reduction (Improvement) (average over project life), Btu/kw-hr
CO2 Emissions Reduction from Baseline (average over project life), Short ton/yr
Average Cost per Short Ton of CO2 Removed Across the Project Life (include fuel savings)
Average Cost per Short Ton of CO2 Removed Across the Project Life (exclude fuel savings)
2. EPA Air Pollution Control Cost Manual, Sixth Edition, January 2002; EPA/452/B-02-001
a. Section 1, Chapter 2, Paragraph 2.3.1 Elements of Total Capital Investment.
b. Section 1, Chapter 2, Paragraph 2.3.2: Elements of Total Annual Cost.3. Based on baseline net generation and net heat rate, ratio of baseline and future capacity factors, heat rate improvement, and future year (2019) average coal price included in "Annual Energy Outlook 2015", US EIA.
Cost per Short Ton of CO2 Removed (nth year of project life) (exclude fuel savings)
Heat Rate Reduction (Improvement) (1st year of project life), Btu/kw-hr
Heat Rate Reduction (Improvement) (nth year of project life), Btu/kw-hr
Heat Rate Improvement (1st year) from Baseline Net Heat Rate, %
Heat Rate Improvement (nth year) from Baseline Net Heat Rate, %
CO2 Emissions Reduction (1st year) from Baseline, Metric ton/yr
CO2 Emissions Reduction (nth year) from Baseline, Short ton/yr
CO2 Emissions Reduction (1st year) from Baseline, Metric ton/yr
CO2 Emissions Reduction (nth year) from Baseline, Metric ton/yr
Cost per Short Ton of CO2 Removed (1st year of project life) (include fuel savings)
Cost per Short Ton of CO2 Removed (1st year of project life) (exclude fuel savings)
Cost per Short Ton of CO2 Removed (nth year of project life) (include fuel savings)
Baseline (2012) Net Heat Rate, Btu/kw-hr
Annual Cost
Direct Annual Costs
Fixed & Variable Operation & Maintenance Cost
Fuel Savings
Total Direct Annual Costs (DAC)
Indirect Annual Costs
Project Life
Total Capital Recovery Costs (TCRC)
Total Indirect Annual Costs (IDAC)
Total Annual CostBaseline (2012) CO2 Emissions, metric ton/yr
Total Capital Investment (TCI)
Duke Energy Progress, Inc.Roxboro U2Annualized Cost and Cost Per Unit CO2 Reduction forIntelligent Sootblowers
CAPITAL COST
`
Equipment Cost
Total Direct Costs
Indirect Costs
Total Indirect Costs
Roxboro-Page 21 of 29
Attachment B B-154Attachment B B-154

NOTES REFERENCES
$107,397 A 1
$107,397 DC 2(a)
None
$0 IC 2(a)
$107,397 TCI = DC + IC 2(a)
$805,476 1
-$358,251 3
$447,224 2(b)
8 PL 1$13,425 TCRC = TCI/PL 2(b)
$13,425 IDAC = TCRC 2(b)
$460,649 TAC = DAC + IDAC 2(b)
3,553,171 4
11,324 4
Baseline (2012) Net Generation, MW-h 3,685,146 4
Baseline (2012) Annual Capacity Factor (heat input basis), % 55.90 4
Future (2019) Annual Capacity Factor (projected heat input basis), % 28.00 4
Future (2019) Net Generation, MW-h 1,845,869 5
57
42
Project Life, Years 8 1
Degradation Factor Across Project Life, % 25 1
0.50 1
0.38 1
CO2 Emissions Reduction (1st year) (corresponding to heat rate improvement), % 0.50
CO2 Emissions Reduction (nth year) (corresponding to heat rate improvement), % 0.38
8,899 6
9,809 6
6,674 6
7,357 6
47 7
83 8
63 7
111 8
55
97
50
8583
1. Duke Energy Submittal, September 11, 2015.
5. Based on baseline net generation and ratio of baseline and future capacity factors.
6. Based on baseline CO2 emissions and capacity factor, future capacity factor, and CO2 emissions reductions percentage.
7. Based on total annual cost including fuel savings and CO2 emissions reductions from baseline.
8. Based on total annual cost excluding fuel savings and CO2 emissions reductions from baseline.
4. DAQ Spreadsheet on Fleetwide Calculations for Baseline and Future Years.
Heat Rate Reduction (Improvement) (average over project life), Btu/kw-hr
CO2 Emissions Reduction from Baseline (average over project life), Short ton/yr
Average Cost per Short Ton of CO2 Removed Across the Project Life (include fuel savings)
Average Cost per Short Ton of CO2 Removed Across the Project Life (exclude fuel savings)
2. EPA Air Pollution Control Cost Manual, Sixth Edition, January 2002; EPA/452/B-02-001
a. Section 1, Chapter 2, Paragraph 2.3.1 Elements of Total Capital Investment.
b. Section 1, Chapter 2, Paragraph 2.3.2: Elements of Total Annual Cost.3. Based on baseline net generation and net heat rate, ratio of baseline and future capacity factors, heat rate improvement, and future year (2019) average coal price included in "Annual Energy Outlook 2015", US EIA.
Cost per Short Ton of CO2 Removed (nth year of project life) (exclude fuel savings)
Heat Rate Reduction (Improvement) (1st year of project life), Btu/kw-hr
Heat Rate Reduction (Improvement) (nth year of project life), Btu/kw-hr
Heat Rate Improvement (1st year) from Baseline Net Heat Rate, %
Heat Rate Improvement (nth year) from Baseline Net Heat Rate, %
CO2 Emissions Reduction (1st year) from Baseline, Metric ton/yr
CO2 Emissions Reduction (nth year) from Baseline, Short ton/yr
CO2 Emissions Reduction (1st year) from Baseline, Metric ton/yr
CO2 Emissions Reduction (nth year) from Baseline, Metric ton/yr
Cost per Short Ton of CO2 Removed (1st year of project life) (include fuel savings)
Cost per Short Ton of CO2 Removed (1st year of project life) (exclude fuel savings)
Cost per Short Ton of CO2 Removed (nth year of project life) (include fuel savings)
Baseline (2012) Net Heat Rate, Btu/kw-hr
Annual Cost
Direct Annual Costs
Fixed & Variable Operation & Maintenance Cost
Fuel Savings
Total Direct Annual Costs (DAC)
Indirect Annual Costs
Project Life
Total Capital Recovery Costs (TCRC)
Total Indirect Annual Costs (IDAC)
Total Annual CostBaseline (2012) CO2 Emissions, metric ton/yr
Total Capital Investment (TCI)
Duke Energy Progress, Inc.Roxboro U3Annualized Cost and Cost Per Unit CO2 Reduction forControllable Loss Reduction (Maintain Unit Efficiency)
CAPITAL COST
`
Equipment Cost
Total Direct Costs
Indirect Costs
Total Indirect Costs
Roxboro-Page 22 of 29
Attachment B B-155Attachment B B-155

NOTES REFERENCES
$37,588,860 A 1
$37,588,860 DC 2(a)
None
$0 IC 2(a)
$37,588,860 TCI = DC + IC 2(a)
$53,698 1
-$767,681 3
-$713,983 2(b)
20 PL 1$1,879,443 TCRC = TCI/PL 2(b)
$1,879,443 IDAC = TCRC 2(b)
$1,165,460 TAC = DAC + IDAC 2(b)
3,553,171 4
11,324 4
Baseline (2012) Net Generation, MW-h 3,685,146 4
Baseline (2012) Annual Capacity Factor (heat input basis), % 55.90 4
Future (2019) Annual Capacity Factor (projected heat input basis), % 28.00 4
Future (2019) Net Generation, MW-h 1,845,869 5
170
42
Project Life, Years 20 1
Degradation Factor Across Project Life, % 75 1
1.50 1
0.38 1
CO2 Emissions Reduction (1st year) (corresponding to heat rate improvement), % 1.50
CO2 Emissions Reduction (nth year) (corresponding to heat rate improvement), % 0.38
26,696 6
29,428 6
6,674 6
7,357 6
40 7
66 8
158 7
263 8
99
164
106
18392
1. Duke Energy Submittal, September 11, 2015.
5. Based on baseline net generation and ratio of baseline and future capacity factors.
6. Based on baseline CO2 emissions and capacity factor, future capacity factor, and CO2 emissions reductions percentage.
7. Based on total annual cost including fuel savings and CO2 emissions reductions from baseline.
8. Based on total annual cost excluding fuel savings and CO2 emissions reductions from baseline.
4. DAQ Spreadsheet on Fleetwide Calculations for Baseline and Future Years.
Heat Rate Reduction (Improvement) (average over project life), Btu/kw-hr
CO2 Emissions Reduction from Baseline (average over project life), Short ton/yr
Average Cost per Short Ton of CO2 Removed Across the Project Life (include fuel savings)
Average Cost per Short Ton of CO2 Removed Across the Project Life (exclude fuel savings)
2. EPA Air Pollution Control Cost Manual, Sixth Edition, January 2002; EPA/452/B-02-001
a. Section 1, Chapter 2, Paragraph 2.3.1 Elements of Total Capital Investment.
b. Section 1, Chapter 2, Paragraph 2.3.2: Elements of Total Annual Cost.3. Based on baseline net generation and net heat rate, ratio of baseline and future capacity factors, heat rate improvement, and future year (2019) average coal price included in "Annual Energy Outlook 2015", US EIA.
Cost per Short Ton of CO2 Removed (nth year of project life) (exclude fuel savings)
Heat Rate Reduction (Improvement) (1st year of project life), Btu/kw-hr
Heat Rate Reduction (Improvement) (nth year of project life), Btu/kw-hr
Heat Rate Improvement (1st year) from Baseline Net Heat Rate, %
Heat Rate Improvement (nth year) from Baseline Net Heat Rate, %
CO2 Emissions Reduction (1st year) from Baseline, Metric ton/yr
CO2 Emissions Reduction (nth year) from Baseline, Short ton/yr
CO2 Emissions Reduction (1st year) from Baseline, Metric ton/yr
CO2 Emissions Reduction (nth year) from Baseline, Metric ton/yr
Cost per Short Ton of CO2 Removed (1st year of project life) (include fuel savings)
Cost per Short Ton of CO2 Removed (1st year of project life) (exclude fuel savings)
Cost per Short Ton of CO2 Removed (nth year of project life) (include fuel savings)
Baseline (2012) Net Heat Rate, Btu/kw-hr
Annual Cost
Direct Annual Costs
Fixed & Variable Operation & Maintenance Cost
Fuel Savings
Total Direct Annual Costs (DAC)
Indirect Annual Costs
Project Life
Total Capital Recovery Costs (TCRC)
Total Indirect Annual Costs (IDAC)
Total Annual CostBaseline (2012) CO2 Emissions, metric ton/yr
Total Capital Investment (TCI)
Duke Energy Progress, Inc.Roxboro U3Annualized Cost and Cost Per Unit CO2 Reduction forTurbine Upgrades (HP, IP, LP)
CAPITAL COST
`
Equipment Cost
Total Direct Costs
Indirect Costs
Total Indirect Costs
Roxboro-Page 23 of 29
Attachment B B-156Attachment B B-156

NOTES REFERENCES
$536,984 A 1
$536,984 DC 2(a)
None
$0 IC 2(a)
$536,984 TCI = DC + IC 2(a)
$53,698 1
-$214,951 3
-$161,252 2(b)
10 PL 1$53,698 TCRC = TCI/PL 2(b)
$53,698 IDAC = TCRC 2(b)
-$107,554 TAC = DAC + IDAC 2(b)
3,553,171 4
11,324 4
Baseline (2012) Net Generation, MW-h 3,685,146 4
Baseline (2012) Annual Capacity Factor (heat input basis), % 55.90 4
Future (2019) Annual Capacity Factor (projected heat input basis), % 28.00 4
Future (2019) Net Generation, MW-h 1,845,869 5
34
25
Project Life, Years 10 1
Degradation Factor Across Project Life, % 25 1
0.30 1
0.23 1
CO2 Emissions Reduction (1st year) (corresponding to heat rate improvement), % 0.30
CO2 Emissions Reduction (nth year) (corresponding to heat rate improvement), % 0.23
5,339 6
5,886 6
4,004 6
4,414 6
-18 7
18 8
-24 7
24 8
-21
21
30
5150
1. Duke Energy Submittal, September 11, 2015.
5. Based on baseline net generation and ratio of baseline and future capacity factors.
6. Based on baseline CO2 emissions and capacity factor, future capacity factor, and CO2 emissions reductions percentage.
7. Based on total annual cost including fuel savings and CO2 emissions reductions from baseline.
8. Based on total annual cost excluding fuel savings and CO2 emissions reductions from baseline.
4. DAQ Spreadsheet on Fleetwide Calculations for Baseline and Future Years.
Heat Rate Reduction (Improvement) (average over project life), Btu/kw-hr
CO2 Emissions Reduction from Baseline (average over project life), Short ton/yr
Average Cost per Short Ton of CO2 Removed Across the Project Life (include fuel savings)
Average Cost per Short Ton of CO2 Removed Across the Project Life (exclude fuel savings)
2. EPA Air Pollution Control Cost Manual, Sixth Edition, January 2002; EPA/452/B-02-001
a. Section 1, Chapter 2, Paragraph 2.3.1 Elements of Total Capital Investment.
b. Section 1, Chapter 2, Paragraph 2.3.2: Elements of Total Annual Cost.3. Based on baseline net generation and net heat rate, ratio of baseline and future capacity factors, heat rate improvement, and future year (2019) average coal price included in "Annual Energy Outlook 2015", US EIA.
Cost per Short Ton of CO2 Removed (nth year of project life) (exclude fuel savings)
Heat Rate Reduction (Improvement) (1st year of project life), Btu/kw-hr
Heat Rate Reduction (Improvement) (nth year of project life), Btu/kw-hr
Heat Rate Improvement (1st year) from Baseline Net Heat Rate, %
Heat Rate Improvement (nth year) from Baseline Net Heat Rate, %
CO2 Emissions Reduction (1st year) from Baseline, Metric ton/yr
CO2 Emissions Reduction (nth year) from Baseline, Short ton/yr
CO2 Emissions Reduction (1st year) from Baseline, Metric ton/yr
CO2 Emissions Reduction (nth year) from Baseline, Metric ton/yr
Cost per Short Ton of CO2 Removed (1st year of project life) (include fuel savings)
Cost per Short Ton of CO2 Removed (1st year of project life) (exclude fuel savings)
Cost per Short Ton of CO2 Removed (nth year of project life) (include fuel savings)
Baseline (2012) Net Heat Rate, Btu/kw-hr
Annual Cost
Direct Annual Costs
Fixed & Variable Operation & Maintenance Cost
Fuel Savings
Total Direct Annual Costs (DAC)
Indirect Annual Costs
Project Life
Total Capital Recovery Costs (TCRC)
Total Indirect Annual Costs (IDAC)
Total Annual CostBaseline (2012) CO2 Emissions, metric ton/yr
Total Capital Investment (TCI)
Duke Energy Progress, Inc.Roxboro U3Annualized Cost and Cost Per Unit CO2 Reduction forIntelligent Sootblowers
CAPITAL COST
`
Equipment Cost
Total Direct Costs
Indirect Costs
Total Indirect Costs
Roxboro-Page 24 of 29
Attachment B B-157Attachment B B-157

NOTES REFERENCES
$375,889 A 1
$375,889 DC 2(a)
None
$0 IC 2(a)
$375,889 TCI = DC + IC 2(a)
$53,698 1
-$102,358 3
-$48,659 2(b)
3 PL 1$125,296 TCRC = TCI/PL 2(b)
$125,296 IDAC = TCRC 2(b)
$76,637 TAC = DAC + IDAC 2(b)
3,553,171 4
11,324 4
Baseline (2012) Net Generation, MW-h 3,685,146 4
Baseline (2012) Annual Capacity Factor (heat input basis), % 55.90 4
Future (2019) Annual Capacity Factor (projected heat input basis), % 28.00 4
Future (2019) Net Generation, MW-h 1,845,869 5
23
6
Project Life, Years 3 1
Degradation Factor Across Project Life, % 75 1
0.20 1
0.05 1
CO2 Emissions Reduction (1st year) (corresponding to heat rate improvement), % 0.20
CO2 Emissions Reduction (nth year) (corresponding to heat rate improvement), % 0.05
3,560 6
3,924 6
890 6
981 6
20 7
46 8
78 7
182 8
49
114
14
2452
1. Duke Energy Submittal, September 11, 2015.
5. Based on baseline net generation and ratio of baseline and future capacity factors.
6. Based on baseline CO2 emissions and capacity factor, future capacity factor, and CO2 emissions reductions percentage.
7. Based on total annual cost including fuel savings and CO2 emissions reductions from baseline.
8. Based on total annual cost excluding fuel savings and CO2 emissions reductions from baseline.
4. DAQ Spreadsheet on Fleetwide Calculations for Baseline and Future Years.
Heat Rate Reduction (Improvement) (average over project life), Btu/kw-hr
CO2 Emissions Reduction from Baseline (average over project life), Short ton/yr
Average Cost per Short Ton of CO2 Removed Across the Project Life (include fuel savings)
Average Cost per Short Ton of CO2 Removed Across the Project Life (exclude fuel savings)
2. EPA Air Pollution Control Cost Manual, Sixth Edition, January 2002; EPA/452/B-02-001
a. Section 1, Chapter 2, Paragraph 2.3.1 Elements of Total Capital Investment.
b. Section 1, Chapter 2, Paragraph 2.3.2: Elements of Total Annual Cost.3. Based on baseline net generation and net heat rate, ratio of baseline and future capacity factors, heat rate improvement, and future year (2019) average coal price included in "Annual Energy Outlook 2015", US EIA.
Cost per Short Ton of CO2 Removed (nth year of project life) (exclude fuel savings)
Heat Rate Reduction (Improvement) (1st year of project life), Btu/kw-hr
Heat Rate Reduction (Improvement) (nth year of project life), Btu/kw-hr
Heat Rate Improvement (1st year) from Baseline Net Heat Rate, %
Heat Rate Improvement (nth year) from Baseline Net Heat Rate, %
CO2 Emissions Reduction (1st year) from Baseline, Metric ton/yr
CO2 Emissions Reduction (nth year) from Baseline, Short ton/yr
CO2 Emissions Reduction (1st year) from Baseline, Metric ton/yr
CO2 Emissions Reduction (nth year) from Baseline, Metric ton/yr
Cost per Short Ton of CO2 Removed (1st year of project life) (include fuel savings)
Cost per Short Ton of CO2 Removed (1st year of project life) (exclude fuel savings)
Cost per Short Ton of CO2 Removed (nth year of project life) (include fuel savings)
Baseline (2012) Net Heat Rate, Btu/kw-hr
Annual Cost
Direct Annual Costs
Fixed & Variable Operation & Maintenance Cost
Fuel Savings
Total Direct Annual Costs (DAC)
Indirect Annual Costs
Project Life
Total Capital Recovery Costs (TCRC)
Total Indirect Annual Costs (IDAC)
Total Annual CostBaseline (2012) CO2 Emissions, metric ton/yr
Total Capital Investment (TCI)
Duke Energy Progress, Inc.Roxboro U3Annualized Cost and Cost Per Unit CO2 Reduction forAH Leakage Reduction
CAPITAL COST
`
Equipment Cost
Total Direct Costs
Indirect Costs
Total Indirect Costs
Roxboro-Page 25 of 29
Attachment B B-158Attachment B B-158

NOTES REFERENCES
$107,397 A 1
$107,397 DC 2(a)
None
$0 IC 2(a)
$107,397 TCI = DC + IC 2(a)
$805,476 1
-$283,772 3
$521,703 2(b)
8 PL 1$13,425 TCRC = TCI/PL 2(b)
$13,425 IDAC = TCRC 2(b)
$535,128 TAC = DAC + IDAC 2(b)
4,284,223 4
10,269 4
Baseline (2012) Net Generation, MW-h 4,101,466 4
Baseline (2012) Annual Capacity Factor (heat input basis), % 53.42 4
Future (2019) Annual Capacity Factor (projected heat input basis), % 21.00 4
Future (2019) Net Generation, MW-h 1,612,332 5
51
39
Project Life, Years 8 1
Degradation Factor Across Project Life, % 25 1
0.50 1
0.38 1
CO2 Emissions Reduction (1st year) (corresponding to heat rate improvement), % 0.50
CO2 Emissions Reduction (nth year) (corresponding to heat rate improvement), % 0.38
8,421 6
9,282 6
6,316 6
6,962 6
58 7
88 8
77 7
118 8
67
103
45
8122
1. Duke Energy Submittal, September 11, 2015.
5. Based on baseline net generation and ratio of baseline and future capacity factors.
6. Based on baseline CO2 emissions and capacity factor, future capacity factor, and CO2 emissions reductions percentage.
7. Based on total annual cost including fuel savings and CO2 emissions reductions from baseline.
8. Based on total annual cost excluding fuel savings and CO2 emissions reductions from baseline.
4. DAQ Spreadsheet on Fleetwide Calculations for Baseline and Future Years.
Heat Rate Reduction (Improvement) (average over project life), Btu/kw-hr
CO2 Emissions Reduction from Baseline (average over project life), Short ton/yr
Average Cost per Short Ton of CO2 Removed Across the Project Life (include fuel savings)
Average Cost per Short Ton of CO2 Removed Across the Project Life (exclude fuel savings)
2. EPA Air Pollution Control Cost Manual, Sixth Edition, January 2002; EPA/452/B-02-001
a. Section 1, Chapter 2, Paragraph 2.3.1 Elements of Total Capital Investment.
b. Section 1, Chapter 2, Paragraph 2.3.2: Elements of Total Annual Cost.3. Based on baseline net generation and net heat rate, ratio of baseline and future capacity factors, heat rate improvement, and future year (2019) average coal price included in "Annual Energy Outlook 2015", US EIA.
Cost per Short Ton of CO2 Removed (nth year of project life) (exclude fuel savings)
Heat Rate Reduction (Improvement) (1st year of project life), Btu/kw-hr
Heat Rate Reduction (Improvement) (nth year of project life), Btu/kw-hr
Heat Rate Improvement (1st year) from Baseline Net Heat Rate, %
Heat Rate Improvement (nth year) from Baseline Net Heat Rate, %
CO2 Emissions Reduction (1st year) from Baseline, Metric ton/yr
CO2 Emissions Reduction (nth year) from Baseline, Short ton/yr
CO2 Emissions Reduction (1st year) from Baseline, Metric ton/yr
CO2 Emissions Reduction (nth year) from Baseline, Metric ton/yr
Cost per Short Ton of CO2 Removed (1st year of project life) (include fuel savings)
Cost per Short Ton of CO2 Removed (1st year of project life) (exclude fuel savings)
Cost per Short Ton of CO2 Removed (nth year of project life) (include fuel savings)
Baseline (2012) Net Heat Rate, Btu/kw-hr
Annual Cost
Direct Annual Costs
Fixed & Variable Operation & Maintenance Cost
Fuel Savings
Total Direct Annual Costs (DAC)
Indirect Annual Costs
Project Life
Total Capital Recovery Costs (TCRC)
Total Indirect Annual Costs (IDAC)
Total Annual CostBaseline (2012) CO2 Emissions, metric ton/yr
Total Capital Investment (TCI)
Duke Energy Progress, Inc.Roxboro U4Annualized Cost and Cost Per Unit CO2 Reduction forControllable Loss Reduction (Maintain Unit Efficiency)
CAPITAL COST
`
Equipment Cost
Total Direct Costs
Indirect Costs
Total Indirect Costs
Roxboro-Page 26 of 29
Attachment B B-159Attachment B B-159

NOTES REFERENCES
$37,588,860 A 1
$37,588,860 DC 2(a)
None
$0 IC 2(a)
$37,588,860 TCI = DC + IC 2(a)
$53,698 1
-$608,083 3
-$554,385 2(b)
20 PL 1$1,879,443 TCRC = TCI/PL 2(b)
$1,879,443 IDAC = TCRC 2(b)
$1,325,058 TAC = DAC + IDAC 2(b)
4,284,223 4
10,269 4
Baseline (2012) Net Generation, MW-h 4,101,466 4
Baseline (2012) Annual Capacity Factor (heat input basis), % 53.42 4
Future (2019) Annual Capacity Factor (projected heat input basis), % 21.00 4
Future (2019) Net Generation, MW-h 1,612,332 5
154
39
Project Life, Years 20 1
Degradation Factor Across Project Life, % 75 1
1.50 1
0.38 1
CO2 Emissions Reduction (1st year) (corresponding to heat rate improvement), % 1.50
CO2 Emissions Reduction (nth year) (corresponding to heat rate improvement), % 0.38
25,263 6
27,847 6
6,316 6
6,962 6
48 7
69 8
190 7
278 8
119
174
96
17405
1. Duke Energy Submittal, September 11, 2015.
5. Based on baseline net generation and ratio of baseline and future capacity factors.
6. Based on baseline CO2 emissions and capacity factor, future capacity factor, and CO2 emissions reductions percentage.
7. Based on total annual cost including fuel savings and CO2 emissions reductions from baseline.
8. Based on total annual cost excluding fuel savings and CO2 emissions reductions from baseline.
4. DAQ Spreadsheet on Fleetwide Calculations for Baseline and Future Years.
Heat Rate Reduction (Improvement) (average over project life), Btu/kw-hr
CO2 Emissions Reduction from Baseline (average over project life), Short ton/yr
Average Cost per Short Ton of CO2 Removed Across the Project Life (include fuel savings)
Average Cost per Short Ton of CO2 Removed Across the Project Life (exclude fuel savings)
2. EPA Air Pollution Control Cost Manual, Sixth Edition, January 2002; EPA/452/B-02-001
a. Section 1, Chapter 2, Paragraph 2.3.1 Elements of Total Capital Investment.
b. Section 1, Chapter 2, Paragraph 2.3.2: Elements of Total Annual Cost.3. Based on baseline net generation and net heat rate, ratio of baseline and future capacity factors, heat rate improvement, and future year (2019) average coal price included in "Annual Energy Outlook 2015", US EIA.
Cost per Short Ton of CO2 Removed (nth year of project life) (exclude fuel savings)
Heat Rate Reduction (Improvement) (1st year of project life), Btu/kw-hr
Heat Rate Reduction (Improvement) (nth year of project life), Btu/kw-hr
Heat Rate Improvement (1st year) from Baseline Net Heat Rate, %
Heat Rate Improvement (nth year) from Baseline Net Heat Rate, %
CO2 Emissions Reduction (1st year) from Baseline, Metric ton/yr
CO2 Emissions Reduction (nth year) from Baseline, Short ton/yr
CO2 Emissions Reduction (1st year) from Baseline, Metric ton/yr
CO2 Emissions Reduction (nth year) from Baseline, Metric ton/yr
Cost per Short Ton of CO2 Removed (1st year of project life) (include fuel savings)
Cost per Short Ton of CO2 Removed (1st year of project life) (exclude fuel savings)
Cost per Short Ton of CO2 Removed (nth year of project life) (include fuel savings)
Baseline (2012) Net Heat Rate, Btu/kw-hr
Annual Cost
Direct Annual Costs
Fixed & Variable Operation & Maintenance Cost
Fuel Savings
Total Direct Annual Costs (DAC)
Indirect Annual Costs
Project Life
Total Capital Recovery Costs (TCRC)
Total Indirect Annual Costs (IDAC)
Total Annual CostBaseline (2012) CO2 Emissions, metric ton/yr
Total Capital Investment (TCI)
Duke Energy Progress, Inc.Roxboro U4Annualized Cost and Cost Per Unit CO2 Reduction forTurbine Upgrades (HP, IP, LP)
CAPITAL COST
`
Equipment Cost
Total Direct Costs
Indirect Costs
Total Indirect Costs
Roxboro-Page 27 of 29
Attachment B B-160Attachment B B-160

NOTES REFERENCES
$8,591,739 A 1
$8,591,739 DC 2(a)
None
$0 IC 2(a)
$8,591,739 TCI = DC + IC 2(a)
$53,698 1
-$113,509 3
-$59,810 2(b)
20 PL 1$429,587 TCRC = TCI/PL 2(b)
$429,587 IDAC = TCRC 2(b)
$369,776 TAC = DAC + IDAC 2(b)
4,284,223 4
10,269 4
Baseline (2012) Net Generation, MW-h 4,101,466 4
Baseline (2012) Annual Capacity Factor (heat input basis), % 53.42 4
Future (2019) Annual Capacity Factor (projected heat input basis), % 21.00 4
Future (2019) Net Generation, MW-h 1,612,332 5
21
15
Project Life, Years 20 1
Degradation Factor Across Project Life, % 25 1
0.20 1
0.15 1
CO2 Emissions Reduction (1st year) (corresponding to heat rate improvement), % 0.20
CO2 Emissions Reduction (nth year) (corresponding to heat rate improvement), % 0.15
3,368 6
3,713 6
2,526 6
2,785 6
100 7
130 8
133 7
174 8
116
152
18
3249
1. Duke Energy Submittal, September 11, 2015.
5. Based on baseline net generation and ratio of baseline and future capacity factors.
6. Based on baseline CO2 emissions and capacity factor, future capacity factor, and CO2 emissions reductions percentage.
7. Based on total annual cost including fuel savings and CO2 emissions reductions from baseline.
8. Based on total annual cost excluding fuel savings and CO2 emissions reductions from baseline.
4. DAQ Spreadsheet on Fleetwide Calculations for Baseline and Future Years.
Heat Rate Reduction (Improvement) (average over project life), Btu/kw-hr
CO2 Emissions Reduction from Baseline (average over project life), Short ton/yr
Average Cost per Short Ton of CO2 Removed Across the Project Life (include fuel savings)
Average Cost per Short Ton of CO2 Removed Across the Project Life (exclude fuel savings)
2. EPA Air Pollution Control Cost Manual, Sixth Edition, January 2002; EPA/452/B-02-001
a. Section 1, Chapter 2, Paragraph 2.3.1 Elements of Total Capital Investment.
b. Section 1, Chapter 2, Paragraph 2.3.2: Elements of Total Annual Cost.3. Based on baseline net generation and net heat rate, ratio of baseline and future capacity factors, heat rate improvement, and future year (2019) average coal price included in "Annual Energy Outlook 2015", US EIA.
Cost per Short Ton of CO2 Removed (nth year of project life) (exclude fuel savings)
Heat Rate Reduction (Improvement) (1st year of project life), Btu/kw-hr
Heat Rate Reduction (Improvement) (nth year of project life), Btu/kw-hr
Heat Rate Improvement (1st year) from Baseline Net Heat Rate, %
Heat Rate Improvement (nth year) from Baseline Net Heat Rate, %
CO2 Emissions Reduction (1st year) from Baseline, Metric ton/yr
CO2 Emissions Reduction (nth year) from Baseline, Short ton/yr
CO2 Emissions Reduction (1st year) from Baseline, Metric ton/yr
CO2 Emissions Reduction (nth year) from Baseline, Metric ton/yr
Cost per Short Ton of CO2 Removed (1st year of project life) (include fuel savings)
Cost per Short Ton of CO2 Removed (1st year of project life) (exclude fuel savings)
Cost per Short Ton of CO2 Removed (nth year of project life) (include fuel savings)
Baseline (2012) Net Heat Rate, Btu/kw-hr
Annual Cost
Direct Annual Costs
Fixed & Variable Operation & Maintenance Cost
Fuel Savings
Total Direct Annual Costs (DAC)
Indirect Annual Costs
Project Life
Total Capital Recovery Costs (TCRC)
Total Indirect Annual Costs (IDAC)
Total Annual CostBaseline (2012) CO2 Emissions, metric ton/yr
Total Capital Investment (TCI)
Duke Energy Progress, Inc.Roxboro U4Annualized Cost and Cost Per Unit CO2 Reduction forHelper Cooling Tower
CAPITAL COST
`
Equipment Cost
Total Direct Costs
Indirect Costs
Total Indirect Costs
Roxboro-Page 28 of 29
Attachment B B-161Attachment B B-161

NOTES REFERENCES
$536,984 A 1
$536,984 DC 2(a)
None
$0 IC 2(a)
$536,984 TCI = DC + IC 2(a)
$53,698 1
-$170,263 3
-$116,565 2(b)
10 PL 1$53,698 TCRC = TCI/PL 2(b)
$53,698 IDAC = TCRC 2(b)
-$62,867 TAC = DAC + IDAC 2(b)
4,284,223 4
10,269 4
Baseline (2012) Net Generation, MW-h 4,101,466 4
Baseline (2012) Annual Capacity Factor (heat input basis), % 53.42 4
Future (2019) Annual Capacity Factor (projected heat input basis), % 21.00 4
Future (2019) Net Generation, MW-h 1,612,332 5
31
23
Project Life, Years 10 1
Degradation Factor Across Project Life, % 25 1
0.30 1
0.23 1
CO2 Emissions Reduction (1st year) (corresponding to heat rate improvement), % 0.30
CO2 Emissions Reduction (nth year) (corresponding to heat rate improvement), % 0.23
5,053 6
5,569 6
3,789 6
4,177 6
-11 7
19 8
-15 7
26 8
-13
22
27
4873
1. Duke Energy Submittal, September 11, 2015.
5. Based on baseline net generation and ratio of baseline and future capacity factors.
6. Based on baseline CO2 emissions and capacity factor, future capacity factor, and CO2 emissions reductions percentage.
7. Based on total annual cost including fuel savings and CO2 emissions reductions from baseline.
8. Based on total annual cost excluding fuel savings and CO2 emissions reductions from baseline.
4. DAQ Spreadsheet on Fleetwide Calculations for Baseline and Future Years.
Heat Rate Reduction (Improvement) (average over project life), Btu/kw-hr
CO2 Emissions Reduction from Baseline (average over project life), Short ton/yr
Average Cost per Short Ton of CO2 Removed Across the Project Life (include fuel savings)
Average Cost per Short Ton of CO2 Removed Across the Project Life (exclude fuel savings)
2. EPA Air Pollution Control Cost Manual, Sixth Edition, January 2002; EPA/452/B-02-001
a. Section 1, Chapter 2, Paragraph 2.3.1 Elements of Total Capital Investment.
b. Section 1, Chapter 2, Paragraph 2.3.2: Elements of Total Annual Cost.3. Based on baseline net generation and net heat rate, ratio of baseline and future capacity factors, heat rate improvement, and future year (2019) average coal price included in "Annual Energy Outlook 2015", US EIA.
Cost per Short Ton of CO2 Removed (nth year of project life) (exclude fuel savings)
Heat Rate Reduction (Improvement) (1st year of project life), Btu/kw-hr
Heat Rate Reduction (Improvement) (nth year of project life), Btu/kw-hr
Heat Rate Improvement (1st year) from Baseline Net Heat Rate, %
Heat Rate Improvement (nth year) from Baseline Net Heat Rate, %
CO2 Emissions Reduction (1st year) from Baseline, Metric ton/yr
CO2 Emissions Reduction (nth year) from Baseline, Short ton/yr
CO2 Emissions Reduction (1st year) from Baseline, Metric ton/yr
CO2 Emissions Reduction (nth year) from Baseline, Metric ton/yr
Cost per Short Ton of CO2 Removed (1st year of project life) (include fuel savings)
Cost per Short Ton of CO2 Removed (1st year of project life) (exclude fuel savings)
Cost per Short Ton of CO2 Removed (nth year of project life) (include fuel savings)
Baseline (2012) Net Heat Rate, Btu/kw-hr
Annual Cost
Direct Annual Costs
Fixed & Variable Operation & Maintenance Cost
Fuel Savings
Total Direct Annual Costs (DAC)
Indirect Annual Costs
Project Life
Total Capital Recovery Costs (TCRC)
Total Indirect Annual Costs (IDAC)
Total Annual CostBaseline (2012) CO2 Emissions, metric ton/yr
Total Capital Investment (TCI)
Duke Energy Progress, Inc.Roxboro U4Annualized Cost and Cost Per Unit CO2 Reduction forIntelligent Sootblowers
CAPITAL COST
`
Equipment Cost
Total Direct Costs
Indirect Costs
Total Indirect Costs
Roxboro-Page 29 of 29
Attachment B B-162Attachment B B-162

1
North Carolina Department of Environmental Quality Division of Air Quality
Supporting Basis
Determination of Best System of Emissions Reduction for CO2 Emissions from Existing Electric Utility Generating Units
October 30, 2015
Facility Westmoreland Partners, LLC, Roanoke Valley Energy Facility, Weldon, NC Facility ID: 4200174 Current Air Quality Permit 06064T19 Affected Electric Utility Generating Units (EGUs) One pulverized coal / No. 2 fuel oil-fired boiler (141,660 lbs per hour coal firing capacity, 1,700 million Btu per hour maximum heat input rate, and 1,896 gallons per hour and 256 million Btu per hour No. 2 fuel oil start-up firing capacity; ID No. E-1 [Unit 1]). Generator rated at 182.3 MW (nameplate capacity). One pulverized coal / No. 2 fuel oil-fired boiler (46,667 lbs per hour coal firing capacity, 560 million Btu per hour maximum heat input rate, and 575 gallons per hour and 77.6 million Btu per hour No. 2 fuel oil start-up firing capacity; ID No. E-15 [Unit 2]). Generator rated at 57.8 MW (nameplate capacity).
1. Introduction The United States Environmental Protection Agency (EPA) has adopted Emission Guidelines for Greenhouse Gas Emissions and Compliance Times for Electric Utility Generating Units on August 3, 2015 and codified it in 40 CFR Subpart UUUU. The affected electric utility steam generating units (EGUs) under these emission guidelines (EG) are steam generating units, integrated gasification combined cycle units (IGCC), and stationary combined cycle or combined heat and power (CHP) combustion turbines that commenced construction on or before January 8, 2014. The EG includes uniform, nationwide emission standards, which are performance-based rates for emissions of greenhouse gases (GHG) expressed as CO2 (lb CO2/net MWh), as follows: Fossil fuel-fired steam generating units or IGCC: 1,534 lb CO2/net MWh (interim, average of
2022-2029), 1,305 lb CO2/net MWh (final, starting 2030)
Natural gas-fired stationary combined cycle combustion turbines (including CHP combustion turbines): 832 lb/net MWh (interim, average of 2022-2029), 771 lb/MWh (final, starting 2030)
Roanoke-Page 1 of 9
Attachment B B-163Attachment B B-163

2
In lieu of the above uniform rates, each EGU can comply with state-specific goal (lb CO2/net MWh). The other option is that all affected units in the state, in aggregate, comply with the mass-based state goal (short tons/yr). For North Carolina (NC), the rate-based interim and final goals are 1,311 lb CO2/net MWh and 1,136 lb CO2/net MWh, respectively. Similarly, NC’s mass-based interim and final goals are 56,986,025 short tons/yr and 51,266,234 short tons/yr, respectively. The above standards (whether uniform nationwide rates or state-specific goals) are based upon the determination of Best System of Emissions Reduction (BSER) consisting of following three building blocks: Building Block 1 (BB1) - reducing the carbon intensity of electricity generation by improving the
heat rate of existing coal-fired power plants.
Building Block 2 (BB2) - substituting increased electricity generation from lower-emitting existing natural gas plants for reduced generation from higher-emitting coal-fired power plants.
Building Block 3 (BB3) - substituting increased electricity generation from new zero-emitting renewable energy sources (like wind and solar) for reduced generation from existing coal-fired and natural gas-fired power plants.
The EG requires that each state submit its plan complying with all applicable requirements by the deadline included therein. One of the requirements consists of development of an emission standard (“standard of performance”) and establishment of compliance time for each EGU. The Clean Air Act (CAA) §111(a)(1) defines “standard of performance” as “a standard for emissions of air pollutants which reflects the degree of emission limitation achievable through the application of the best system of emission reduction which (taking into account the cost of achieving such reduction and any nonair quality health and environmental impact and energy requirements) the Administrator determines has been adequately demonstrated”.
2. History of Development of Emission Guidelines under CAA Over the last 40 years, under §111(d), the EPA has regulated four pollutants from five source categories, by promulgating associated EG. These source categories are phosphate fertilizer plants (fluorides), sulfuric acid plants (acid mist), Kraft pulp plants (total reduced sulfur (TRS)), primary aluminum plants (fluorides), and municipal solid waste landfills (landfill gas emissions as non-methane organic compounds (NMOCs))1. The following general principles and/or rationales were used by EPA in establishing BSER for these EGs: The degree of emission reduction achievable through the application of various demonstrated
control technologies.
1 See Footnote 18 at 79 FR 41776, July 17, 2014, including ‘‘Phosphate Fertilizer Plants; Final Guideline Document Availability,’’ 42 FR 12022 (March 1, 1977); ‘‘Standards of Performance for New Stationary Sources; Emission Guideline for Sulfuric Acid Mist,’’ 42 FR 55796 (October 18, 1977); ‘‘Kraft Pulp Mills, Notice of Availability of Final Guideline Document,’’ 44 FR 29828 (May 22, 1979); ‘‘Primary Aluminum Plants; Availability of Final Guideline Document,’’ 45 FR 26294 (April 17, 1980); ‘‘Standards of Performance for New Stationary Sources and Guidelines for Control of Existing Sources: Municipal Solid Waste Landfills, Final Rule,’’ 61 FR 9905 (March 12, 1996).
Roanoke-Page 2 of 9
Attachment B B-164Attachment B B-164

3
The technical feasibility of applying various demonstrated technologies to existing sources considering variability in sizes and designs.
The impact of various demonstrated technologies on national energy consumption, water pollution, waste disposal, and ambient air concentrations of a designated pollutant.
The cost of adopting the emission guidelines, after considering control costs for various demonstrated technologies and taking into account the level of any existing controls.
Each of these EGs indicates that the cost of applying various control technologies can have a considerable impact in selection of a BSER for any designated pollutant for existing facilities. They also indicate that the age, size, type, class, and process design of the facility, influence not only the BSER selection process, but can also support a decision-making for whether different EGs are to be established for differing sizes, types, or classes of equipment. The EGs for the above referenced source categories have been established for principal points of emissions (point and fugitive emissions sources) located within the facility and, not for any emissions sources located outside of the facility. Finally, in these EGs, with respect to determining the EG, EPA has consistently recognized that not only the control technology needs to be demonstrated on existing sources, but the degree of emission reduction (performance level) needs to be readily achievable by the control technology.
3. The Division of Air Quality (DAQ)’s Approach for Determination of BSER The DAQ will consider the above general principles in determining BSER for CO2 emissions reduction from each EGU. But, importantly, DAQ will determine BSER for each EGU based upon BB1-type measures only (i.e., measures which can be accomplished within the fence-line of the facility), conforming to the §111(d) of the CAA and the requirements of 40 CFR 60 “Adoption and Submittal of State Plans for Designated Facilities”. Thus, DAQ’s approach will comprise of improving the operational efficiency of the EGUs in order to reduce CO2 emissions from the 2012 baseline levels. The DAQ’s BSER evaluation will specifically be based upon the following: type of EGU remaining useful life of the EGU unit’s baseline data (net heat rate, net generation, annual capacity factor, and CO2 emissions) unit’s projected future capacity factor feasibility of applying specific heat rate improvement measure on a given unit whether the measure is adequately demonstrated degree of heat rate reduction potential for feasible heat rate improvement measures site-specific limitations associated costs (capital, fixed and variable operational and maintenance (O&M), and fuel savings) cost per ton of CO2 reduction
The evaluation is also based on literature review2 of technical feasibility for various heat rate improvement measures, degree of heat rate reduction potential, and costs data (capital, and fixed and variable O&M). 2 “Coal-fired Power Plant Heat Rate Reductions”, Final Report, Sargent & Lundy, Chicago, IL, January 22, 2009. “Analysis of Heat Rate Improvement Potential at Coal-Fired Power Plants”, US Energy Information Administration, Washington, DC, May 2015.
Roanoke-Page 3 of 9
Attachment B B-165Attachment B B-165

4
It needs to be emphasized here that DAQ’s determination for each EGU will not be based upon some pre-determined heat rate improvement target, such as EPA’s selection of a 4.3% heat rate improvement potential for EGUs in the Eastern interconnection3, as discussed in the EG. The DAQ’s approach will include those adequately demonstrated, cost-effective measures that assure that the electricity is generated with lower CO2 emissions, thus improving public health and welfare. The selected heat rate improvement measures would be expected to produce non-air environmental co-benefits in the form of reduced water usage and solid waste production, in addition to, reductions in emissions of non-GHG pollutants such as SO2, NOx, and mercury. However, it should be noted that as the EGU becomes more cost-competitive due to heat rate improvements, it may be dispatched more frequently and/or at higher loads. If the EGU is utilized more often, some increases in emissions of GHG (as CO2) and similarly, for non-GHG pollutants (such as SO2, NOx, or mercury) are possible, and those could partially offset the emissions reductions achieved through the heat rate improvement of the EGU. EPA has determined a cost estimate of $23 per ton4 reasonable for CO2 emissions reduction from EGUs under BB1 implementing heat rate improvement measures. EPA has further determined that this cost is reasonable because it achieves “an appropriate balance between cost and amount of reductions.”5 In addition, EPA has used another benchmark in the form of social cost of carbon (SC-CO2) at $40 per ton (2020) to $48 per ton (2030)6 to conclude that the above $23 per ton cost is reasonable. In determining a BSER for a particular EGU, DAQ will use the above cost effectiveness threshold of $23 per ton to determine reasonableness of cost and whether one or more technically feasible measure(s) can be implemented, as long as, collectively, the total cost does not exceed this threshold.
4. BSER Evaluation Westmoreland Partners Roanoke Valley Generating Facility (ROVA) is currently an independent power producer, supplying electric power to Dominion Virginia Power (DVP), but previously operated as a cogeneration facility (prior to August 16, 1993 for Unit 1 and prior to October 12, 2001). As such, ROVA Units 1 and 2 are subject to electric demand of the DVP grid and operate only when other less costly forms of electric generation sources are fully dispatched (utilized). It should be noted that ROVA was a base-load power generating facility until 2013, and starting 2014, it is a peaking-generating facility as per its power purchase contract with the DVP. ROVA maintains Units 1 and 2 in S. Corellis, “Range and Applicability of Heat Rate Improvements”, Technical Update, Electric Power Research Institute, Palo Alto, CA, April 2014. 3 Applies to coal-fired EGUs only. 4 See page 446 of 1560 (pre-publication version), Carbon Pollution Emission Guidelines for Existing Stationary Sources: Electric Utility Generating Units Clean Power Plan, August 3, 2015. Based on nation-wide coal fleet capacity of 213 GW, heat rate improvement capital cost of $100/KW, capital charge rate of 14.3%, fleet-wide baseline net heat rate of 10,250 Btu/KWh, heat rate improvement of 4% for coal-fired EGUs, annual capacity factor of 78%, and future (2030) average coal delivered cost of $2.70 per million Btu. See page 2-65, Greenhouse Gas Mitigation Measures, Technical Support Document (TSD) for Carbon Pollution Guidelines for Existing Power Plants”, August 3, 2015. 5 See page 457 of 1560 (pre-publication version), Ibid. 6 See pages 458 and 459 of 1560 (pre-publication version), Ibid.
Roanoke-Page 4 of 9
Attachment B B-166Attachment B B-166

5
a manner that optimizes its operational efficiency. As per ROVA, given the practice of constant attention to the operation of combustion system, any improvements to heat rate resulting from implementing a specific measure(s) will be nearly immeasurable as a change to the baseline heat rate, especially considering the peaking nature of the facility making difficult the verification of the performance. ROVA has reviewed its current practices and future improvement possibilities for improving heat rate of its EGUs, and have identified two areas of improvements that it believes it can implement without major expenditures, pending evaluation. The two areas of possible improvements are (i) Testing and repairing / controlling air in-leakage in air heater and duct, and (ii) Testing and repairing leakage in valves for condensate / feed water pumps. However, ROVA has not provided any information on cost, efficiency improvement, or the fuel savings, associated with any feasible heat rate improvement measure(s) due to lack of sufficient resources. ROVA has provided the following data for both baseline year (2012) and future year (2014), and stated that 2014 operational data for generation and capacity factor might be considered representative for any future years (as the facility became a peaking facility starting 2014 and slated to remain a peaking facility beyond 2014 as per the current contract with DVP). ROVA Unit 1 Baseline (2012) CO2 Emissions - 1,022,143 metric ton/yr Baseline (2012) Net Heat Rate - 9,281 Btu/kWh Baseline (2012) Net Generation - 1,138,729 MWh Baseline (2012) Heat Inputs - 10,568,482 million Btu Baseline (2012) Annual Capacity Factor - 0.78 (electric power output basis) Future (2019) Projected Annual Capacity Factor - 0.41 (electric power output basis) Future (2019) Projected Coal Delivered Cost - $3.50 per million Btu Commencement of operation of each EGU - May 1994 Planned retirement year - Unknown ROVA Unit 2 Baseline (2012) CO2 Emissions - 354,830 metric ton/yr Baseline (2012) Net Heat Rate - 10,981 Btu/kWh Baseline (2012) Net Generation - 338,612 MWh Baseline (2012) Heat Inputs - 3,718,462 million Btu Baseline (2012) Annual Capacity Factor - 0.86 (electric power output basis) Future (2019) Projected Annual Capacity Factor - 0.22 (electric power output basis) Future (2019) Projected Coal Delivered Cost - $3.50 per million Btu Commencement of operation of each EGU - June 1995 Planned retirement year - Unknown Thus, DAQ will consider ROVA’s 2014 data for generation and capacity factor as representative for future year 2019. For coal delivered price for 2019, as included above, ROVA has escalated actual coal delivered price for 2014 (assuming 7 percent increase per year between 2014 and 2019 for coal and 3 percent increase per year between 2014 and 2019 for transportation of coal). Therefore, DAQ will use the above calculated 2019 costs for coal in determining cost for unit reduction of CO2 for each technically feasible measure.
Roanoke-Page 5 of 9
Attachment B B-167Attachment B B-167

6
Measure: Testing and Repairing for Air In-Leakage in Air Heater and Duct In the absence of site-specific cost data (both capital and O&M) and heat rate potential, DAQ will use the following mid-range cost data and heat rate improvement potential associated with air heater and duct leakage control.7 Capital investment - $400,000 ($300,000 - $500,000) Fixed O&M Cost - $50,000 per year Variable O&M Cost - $0 per year Heat rate improvement (reduction) - 25 Btu/kWh (10 Btu/kWh - 40 Btu/kWh) The DAQ will adjust the above capital and annual O&M costs for 2019 dollars, using the growth factor of 1.8 percent compounded annually.8 In addition to these costs, fixed O&M cost (no capital cost involved) associated with testing for leaks for air in-leakage needs to be added for this measure in order to estimate accurately the cost per unit reduction in CO2
9. Since DAQ is not able to obtain the cost associated with the testing portion of this measure, any conclusions drawn for this measure will be described accordingly. Using the capital charge rate of 14.3%, as discussed in the TSD previously cited in footnote 3, the capital investment can be transformed into an indirect annual (capital) cost and then can be added to the direct annual (fixed O&M) cost to determine the total annual cost. If DAQ uses annual capacity factors (both baseline and future years) based on heat input to the EGU unlike ROVA-estimated annual capacity factors based on electric power output of the EGU, the baseline year (2012) and future year (2019) capacity factors can be estimated as follows10: Baseline (2012) Annual Capacity Factor - 0.71 (Unit 1), 0.76 (Unit 2) [heat input basis] Future (2019) Annual Capacity Factor - 0.388 (Unit 1), 0.18 (Unit 2) [heat input basis] The DAQ will use the above annual capacity factors, as per the term “annual capacity factor” defined in the reference included in footnote 3 above11. With these changes, DAQ’s estimates for cost per unit reduction in CO2 (including fuel saving) are $37 per ton (Unit 1) and $513 per ton (Unit 2) for 2019. Refer to the tabs “Unit 1(E-1)” and “Unit 2(E-15)” in the attached spreadsheet on calculations for annualized cost and cost per unit reduction of CO2 for this heat rate improvement measure.
7 Table 2-4: Summary of Air Heater and Duct Leakage Control Heat Rate Reductions and Costs, Coal-fired Power Plant Heat Rate Reductions, Final Report, Sargent & Lundy, Chicago, IL, January 22, 2009. 8 See both GDP Chain-Type Price Index and Metals and Metal Products Indicator, Table A20. Macroeconomics Indicators, USEIA Annual Energy Outlook 2015. 9 Telephone conversation of Rahul Thaker, DAQ with Chris Hewes, ROVA, October 6, 2015. 10 Baseline (2012) Annual capacity Factors Unit 1 = (10568482 million Btu) / (1700 million Btu/hr * 8760 hr) = 0.71 Unit 2 = (3718462 million Btu) / (560 million Btu/hr * 8760 hr) = 0.76 Future (2019) Annual Capacity Factors Unit 1 = (9737 Btu/kWh * 593073000 kWh) / (1700 million Btu/hr * 8760 hr) = 0.388 Unit 2= (10354 Btu/kWh * 85207000 kWh) / (560 million Btu/hr * 8760 hr) = 0.18 11 Page 1543 of 1560 (pre-publication version), Ibid.
Roanoke-Page 6 of 9
Attachment B B-168Attachment B B-168

7
Both project life (for control of air in-leakage in air heater and duct) and planned retirement year are unknown for each EGU. Therefore, no adjustment to the above calculated estimated costs can be made with respect to remaining useful life of each EGU. If implemented, this measure would be expected to produce non-air environmental co-benefits in the form of reduced water usage and solid waste production, in addition to, reduced emissions of non-GHG pollutants such as SO2, NOx, and mercury. Moreover, adverse energy impacts would not be expected as well. However, comparing it with the reasonable cost threshold of $23 per ton, as discussed above, cost estimates of both $37 per ton CO2 reduction (Unit 1) and $513 per ton of CO2 reduction (Unit 2) can be considered “excessive”, “exorbitant” or “unreasonable”, as stated by EPA in the preamble to the final EG12. As stated above, the facility is currently and for future operating scenario, a peaking facility for electric power production, which can be seen in its low future (projected) annual capacity factors. Thus, any measures for heat rate improvements are expected to present significant costs, very likely exceeding the reasonable cost threshold. If any of its EGUs were to operate at a higher annual capacity factor, then, the cost per unit reduction of CO2 would be reduced. In summary, DAQ is determining these costs ($37 per ton CO2 reduction (Unit 1) and $513 per ton of CO2 reduction (Unit 2) unreasonable (using the cost threshold of $23 per ton CO2). Also, as noted above, these estimated costs will increase as none incorporate additional costs associated with testing for determining air in-leakage. Thus, considering cost, non-air environmental, and energy impacts, DAQ determines that a measure consisting of testing and repairing for air in-leakage for air heater and duct is not a BSER for each unit (Units 1 and 2) at ROVA. Measure: Testing and Repairing Leakage in Valves for Condensate / Feed Water Pumps In the absence of site-specific cost data (both capital and O&M) and heat rate potential, DAQ has reviewed the literature for coal-fired power plant heat rate reductions as cited above. However, it is unable to determine capital or O&M costs associated with this measure. The DAQ expects the associated costs (no capital costs and only fixed O&M in the form of testing costs is involved as per the footnote 9 above) to be relatively minor. Regardless of the costs, DAQ believes that heat rate improvement potential for this measure is negligible. Thus, DAQ determines that this measure is not a BSER.
5. BSER for ROVA Units 1 and 2 None.
12 Page 298 of 1560 (pre-publication version), Ibid.
Roanoke-Page 7 of 9
Attachment B B-169Attachment B B-169

NOTES REFERENCES
$429,588 1
$429,588 DC 2(a)
None
$0 IC 2(a)
$429,588 TCI = DC + IC 2(a)
$53,699 1
$0 1
Fuel Savings -$54,450 3
-$752 2(b)
14.3% CCR 4
$61,431 TCRC = TCI * CCR 2(b), 4
$61,431 IDAC = TCRC 2(b)
$60,679 TAC = DAC + IDAC 2(b)
1022143 5
9281 5
Baseline (2012) Net Generation, MW-h 1138729 5
Baseline (2012) Annual Capacity Factor - Heat Input Basis 0.71 6
Future (2019) Annual Capacity Factor - Heat Input Basis 0.388 6
Future (2019) Net Generation, MW-h 622291 7
25 1
0.27
CO2 Emissions Reduction (corresponding to heat rate improvement), % 0.27
1505 8
1659
$37 9
$77 10
References:
6. Calculated using data provided in reference 5 above.
7. Based on baseline net generation and ratio of baseline and future capacity factors.
8. Based on baseline CO2 emissions and capacity factor, future capacity factor, and CO2 emissions reductions percentage.
9. Based on total annual cost including fuel savings and CO2 emissions reductions from baseline.
10. Based on total annual cost excluding fuel savings and CO2 emissions reductions from baseline.
Cost per Short Ton of CO2 Removed (include fuel savings)
Cost per Short Ton of CO2 Removed (exclude fuel savings)
CO2 Emissions Reduction from Baseline, Short ton/yr
1. Mid-range values taken from Table 2-4: Summary of Air Heater and Duct Leakage Control Heat Rate Reductions and Costs, Coal-fired Power Plant Heat Rate Reductions, Final Report, Sargent & Lundy, Chicago, IL, January 22, 2009. Cost data adjusted for 2019.
4. Greenhouse Gas Mitigation Measures, TSD for Carbon Pollution Guidelines for Existing Power Plants, Section 2.7 Costs, p. 2-62 through 2-66, August 3, 2015.
2. EPA Air Pollution Control Cost Manual, Sixth Edition, January 2002; EPA/452/B-02-001
a. Section 1, Chapter 2, Paragraph 2.3.1 Elements of Total Capital Investment.
b. Section 1, Chapter 2, Paragraph 2.3.2: Elements of Total Annual Cost.
3. Based on baseline net generation and net heat rate, ratio of baseline and future capacity factors, heat rate improvement, and future (2019) projected coal delivered prices included in email of October 8, 2015 (from Don Keisling, ROVA to Rahul Thaker, DAQ).
Baseline (2012) CO2 Emissions, metric ton/yr
Baseline (2012) Net Heat Rate, Btu/kW-hr
Average Heat Rate Reduction (Improvement), Btu/kW-hr
Heat Rate Improvement from Baseline Net Heat Rate, %
CO2 Emissions Reduction from Baseline, Metric ton/yr
Indirect Annual Costs
Capital Charge Rate (CCR)
Total Capital Recovery Costs (TCRC)
Total Indirect Annual Costs (IDAC)
Total Annual Cost
5. CO2 Information Request, Westmoreland Partners, LLC, Roanoke Valley Generating Facility, Weldon, NC, August 31 and
September 30, 2015.
Direct Annual Costs
Annualized Cost and Cost Per Unit CO2 Reduction Associated with Air Heater and Duct Leakage Repair/Control for Unit 1 (E-1)
Roanoke Valley Energy Facility, Weldon, NC Capital Cost
Direct Costs
Equipment Cost
Total Direct Costs
Indirect Costs
Total Indirect Costs
Total Capital Investment (TCI)
Annual Cost
Fixed Operation & Maintenance Cost
Variable Operation and Maintenance Cost
Total Direct Annual Costs (DAC)
Roanoke-Page 8 of 9
Attachment B B-170Attachment B B-170

NOTES REFERENCES
$429,588 1
$429,588 DC 2(a)
None
$0 IC 2(a)
$429,588 TCI = DC + IC 2(a)
$53,699 1
$0 1
Fuel Savings -$7,017 3
$46,681 2(b)
14.3% CCR 4
$61,431 TCRC = TCI * CCR 2(b), 4
$61,431 IDAC = TCRC 2(b)
$108,112 TAC = DAC + IDAC 2(b)
354830 5
10981 5
Baseline (2012) Net Generation, MW-h 338612 5
Baseline (2012) Annual Capacity Factor - Heat Input Basis 0.76 6
Future (2019) Annual Capacity Factor - Heat Input Basis 0.18 6
Future (2019) Net Generation, MW-h 80198 7
25 1
0.23
CO2 Emissions Reduction (corresponding to heat rate improvement), % 0.23
191 8
211
$513 9
$602 10
References:
6. Calculated using data provided in reference 5 above.
7. Based on baseline net generation and ratio of baseline and future capacity factors.
8. Based on baseline CO2 emissions and capacity factor, future capacity factor, and CO2 emissions reductions percentage.
9. Based on total annual cost including fuel savings and CO2 emissions reductions from baseline.
10. Based on total annual cost excluding fuel savings and CO2 emissions reductions from baseline.
Total Direct Costs
Annualized Cost and Cost Per Unit CO2 Reduction Associated with Air Heater and Duct Leakage Repair/Control for Unit 2 (E-15)
Roanoke Valley Energy Facility, Weldon, NC Capital Cost
Direct Costs
Equipment Cost
Total Capital Recovery Costs (TCRC)
Indirect Costs
Total Indirect Costs
Total Capital Investment (TCI)
Annual Cost
Direct Annual Costs
Fixed Operation & Maintenance Cost
Variable Operation and Maintenance Cost
Total Direct Annual Costs (DAC)
Indirect Annual Costs
Capital Charge Rate (CCR)
2. EPA Air Pollution Control Cost Manual, Sixth Edition, January 2002; EPA/452/B-02-001
Total Indirect Annual Costs (IDAC)
Total Annual CostBaseline (2012) CO2 Emissions, metric ton/yr
Baseline (2012) Net Heat Rate, Btu/kW-hr
Average Heat Rate Reduction (Improvement), Btu/kW-hr
Heat Rate Improvement from Baseline Net Heat Rate, %
CO2 Emissions Reduction from Baseline, Metric ton/yr
CO2 Emissions Reduction from Baseline, Short ton/yr
Cost per Short Ton of CO2 Removed (include fuel savings)Cost per Short Ton of CO2 Removed (exclude fuel savings)
1. Mid-range values taken from Table 2-4: Summary of Air Heater and Duct Leakage Control Heat Rate Reductions and Costs, Coal-fired Power Plant Heat Rate Reductions, Final Report, Sargent & Lundy, Chicago, IL, January 22, 2009. Cost data adjusted for 2019.
a. Section 1, Chapter 2, Paragraph 2.3.1 Elements of Total Capital Investment.
b. Section 1, Chapter 2, Paragraph 2.3.2: Elements of Total Annual Cost.
3. Based on baseline net generation and net heat rate, ratio of baseline and future capacity factors, heat rate improvement, and future (2019) projected coal delivered prices included in email of October 8 (from Don Keisling, ROVA to Rahul Thaker, DAQ).
4. Greenhouse Gas Mitigation Measures, TSD for Carbon Pollution Guidelines for Existing Power Plants, Section 2.7 Costs, p. 2-62 through 2-66, August 3, 2015.
5. CO2 Information Request, Westmoreland Partners, LLC, Roanoke Valley Generating Facility, Weldon, NC, August 31 and
September 30, 2015.
Roanoke-Page 9 of 9
Attachment B B-171Attachment B B-171

1
North Carolina Department of Environmental Quality Division of Air Quality
Supporting Basis
Determination of Best System of Emissions Reduction for CO2 Emissions from Existing Electric Utility Generating Units
October 30, 2015
Facility Edgecombe Genco LLC, Battleboro, NC Facility ID: 3300146 Current Air Quality Permit 06563T15 Affected Electric Utility Generating Units (EGUs) Four coal, natural gas, No. 2 fuel oil, No. 4 fuel oil, tire derived fuel (TDF), wood chip-fired electric steam generating boilers, each boiler rated at 375 million Btu per hour heat input (ID Nos. ES-1-1A and ES-1-1B [Unit 1], and ES-2-2A and ES-2-2B [Unit 2]). Each generator rated at 57.4 MW (nameplate capacity).
1. Introduction The United States Environmental Protection Agency (EPA) has adopted Emission Guidelines for Greenhouse Gas Emissions and Compliance Times for Electric Utility Generating Units on August 3, 2015 and codified it in 40 CFR Subpart UUUU. The affected electric utility steam generating units (EGUs) under these emission guidelines (EG) are steam generating units, integrated gasification combined cycle units (IGCC), and stationary combined cycle or combined heat and power (CHP) combustion turbines that commenced construction on or before January 8, 2014. The EG includes uniform, nationwide emission standards, which are performance-based rates for emissions of greenhouse gases (GHG) expressed as CO2 (lb CO2/net MWh), as follows: Fossil fuel-fired steam generating units or IGCC: 1,534 lb CO2/net MWh (interim, average of
2022-2029), 1,305 lb CO2/net MWh (final, starting 2030)
Natural gas-fired stationary combined cycle combustion turbines (including CHP combustion turbines): 832 lb/net MWh (interim, average of 2022-2029), 771 lb/MWh (final, starting 2030)
In lieu of the above uniform rates, each EGU can comply with state-specific goal (lb CO2/net MWh). The other option is that all affected units in the state, in aggregate, comply with the mass-based state goal (short tons/yr). For North Carolina (NC), the rate-based interim and final goals are 1,311 lb CO2/net MWh and 1,136 lb CO2/net MWh, respectively. Similarly, NC’s mass-based interim and final goals are 56,986,025 short tons/yr and 51,266,234 short tons/yr, respectively.
Edgecombe-Page 1 of 9
Attachment B B-172Attachment B B-172

2
The above standards (whether uniform nationwide rates or state-specific goals) are based upon the determination of Best System of Emissions Reduction (BSER) consisting of following three building blocks: Building Block 1 (BB1) - reducing the carbon intensity of electricity generation by improving the
heat rate of existing coal-fired power plants.
Building Block 2 (BB2) - substituting increased electricity generation from lower-emitting existing natural gas plants for reduced generation from higher-emitting coal-fired power plants.
Building Block 3 (BB3) - substituting increased electricity generation from new zero-emitting renewable energy sources (like wind and solar) for reduced generation from existing coal-fired and natural gas-fired power plants.
The EG requires that each state submit its plan complying with all applicable requirements by the deadline included therein. One of the requirements consists of development of an emission standard (“standard of performance”) and establishment of compliance time for each EGU. The Clean Air Act (CAA) §111(a)(1) defines “standard of performance” as “a standard for emissions of air pollutants which reflects the degree of emission limitation achievable through the application of the best system of emission reduction which (taking into account the cost of achieving such reduction and any nonair quality health and environmental impact and energy requirements) the Administrator determines has been adequately demonstrated”.
2. History of Development of Emission Guidelines under CAA Over the last 40 years, under §111(d), the EPA has regulated four pollutants from five source categories, by promulgating associated EG. These source categories are phosphate fertilizer plants (fluorides), sulfuric acid plants (acid mist), Kraft pulp plants (total reduced sulfur (TRS)), primary aluminum plants (fluorides), and municipal solid waste landfills (landfill gas emissions as non-methane organic compounds (NMOCs))1. The following general principles and/or rationales were used by EPA in establishing BSER for these EGs: The degree of emission reduction achievable through the application of various demonstrated
control technologies.
The technical feasibility of applying various demonstrated technologies to existing sources considering variability in sizes and designs.
The impact of various demonstrated technologies on national energy consumption, water pollution, waste disposal, and ambient air concentrations of a designated pollutant.
The cost of adopting the emission guidelines, after considering control costs for various demonstrated technologies and taking into account the level of any existing controls.
1 See Footnote 18 at 79 FR 41776, July 17, 2014, including ‘‘Phosphate Fertilizer Plants; Final Guideline Document Availability,’’ 42 FR 12022 (March 1, 1977); ‘‘Standards of Performance for New Stationary Sources; Emission Guideline for Sulfuric Acid Mist,’’ 42 FR 55796 (October 18, 1977); ‘‘Kraft Pulp Mills, Notice of Availability of Final Guideline Document,’’ 44 FR 29828 (May 22, 1979); ‘‘Primary Aluminum Plants; Availability of Final Guideline Document,’’ 45 FR 26294 (April 17, 1980); ‘‘Standards of Performance for New Stationary Sources and Guidelines for Control of Existing Sources: Municipal Solid Waste Landfills, Final Rule,’’ 61 FR 9905 (March 12, 1996).
Edgecombe-Page 2 of 9
Attachment B B-173Attachment B B-173

3
Each of these EGs indicates that the cost of applying various control technologies can have a considerable impact in selection of a BSER for any designated pollutant for existing facilities. They also indicate that the age, size, type, class, and process design of the facility, influence not only the BSER selection process, but can also support a decision-making for whether different EGs are to be established for differing sizes, types, or classes of equipment. The EGs for the above referenced source categories have been established for principal points of emissions (point and fugitive emissions sources) located within the facility and, not for any emissions sources located outside of the facility. Finally, in these EGs, with respect to determining the EG, EPA has consistently recognized that not only the control technology needs to be demonstrated on existing sources, but the degree of emission reduction (performance level) needs to be readily achievable by the control technology.
3. The Division of Air Quality (DAQ)’s Approach for Determination of BSER The DAQ will consider the above general principles in determining BSER for CO2 emissions reduction from each EGU. But, importantly, DAQ will determine BSER for each EGU based upon BB1-type measures only (i.e., measures which can be accomplished within the fence-line of the facility), conforming to the §111(d) of the CAA and the requirements of 40 CFR 60 “Adoption and Submittal of State Plans for Designated Facilities”. Thus, DAQ’s approach will comprise of improving the operational efficiency of the EGUs in order to reduce CO2 emissions from the 2012 baseline levels. The DAQ’s BSER evaluation will specifically be based upon the following: type of EGU remaining useful life of the EGU unit’s baseline data (net heat rate, net generation, annual capacity factor, and CO2 emissions) unit’s projected future capacity factor feasibility of applying specific heat rate improvement measure on a given unit whether the measure is adequately demonstrated degree of heat rate reduction potential for feasible heat rate improvement measures site-specific limitations associated costs (capital, fixed and variable operational and maintenance (O&M), and fuel savings) cost per ton of CO2 reduction The evaluation is also based on literature review2 of technical feasibility for various heat rate improvement measures, degree of heat rate reduction potential, and costs data (capital, and fixed and variable O&M). It needs to be emphasized here that DAQ’s determination for each EGU will not be based upon some pre-determined heat rate improvement target, such as EPA’s selection of a 4.3% heat rate improvement potential for EGUs in the Eastern interconnection3, as discussed in the EG.
2 “Coal-fired Power Plant Heat Rate Reductions”, Final Report, Sargent & Lundy, Chicago, IL, January 22, 2009. “Analysis of Heat Rate Improvement Potential at Coal-Fired Power Plants”, US Energy Information Administration, Washington, DC, May 2015. S. Corellis, “Range and Applicability of Heat Rate Improvements”, Technical Update, Electric Power Research Institute, Palo Alto, CA, April 2014. 3 Applies to coal-fired EGUs only.
Edgecombe-Page 3 of 9
Attachment B B-174Attachment B B-174

4
The DAQ’s approach will include those adequately demonstrated, cost-effective measures that assure that the electricity is generated with lower CO2 emissions, thus improving public health and welfare. The selected heat rate improvement measures would be expected to produce non-air environmental co-benefits in the form of reduced water usage and solid waste production, in addition to, reductions in emissions of non-GHG pollutants such as SO2, NOx, and mercury. However, it should be noted that as the EGU becomes more cost-competitive due to heat rate improvements, it may be dispatched more frequently and/or at higher loads. If the EGU is utilized more often, some increases in emissions of GHG (as CO2) and similarly, for non-GHG pollutants (such as SO2, NOx, or mercury) are possible, and those could partially offset the emissions reductions achieved through the heat rate improvement of the EGU. EPA has determined a cost estimate of $23 per ton4 reasonable for CO2 emissions reduction from EGUs under BB1 implementing heat rate improvement measures. EPA has further determined that this cost is reasonable because it achieves “an appropriate balance between cost and amount of reductions.”5 In addition, EPA has used another benchmark in the form of social cost of carbon (SC-CO2) at $40 per ton (2020) to $48 per ton (2030)6 to conclude that the above $23 per ton cost is reasonable. In determining a BSER for a particular EGU, DAQ will use the above cost effectiveness threshold of $23 per ton to determine reasonableness of cost and whether one or more technically feasible measure(s) can be implemented, as long as, collectively, the total cost does not exceed this threshold.
4. BSER Evaluation Edgecombe Genco, LLC, has submitted a BSER analysis for each EGU considering numerous heat rate improvement measures as listed below: Soot blower upgrades (replacements) LP steam seal upgrade Condenser maintenance Boiler control system Performance monitoring Partial arc admission Minimizing flow, pressure, and temperature oscillations Cooling system optimization Boiler feed pump overhaul
4 See page 446 of 1560 (pre-publication version), Carbon Pollution Emission Guidelines for Existing Stationary Sources: Electric Utility Generating Units Clean Power Plan, August 3, 2015. Based on nation-wide coal fleet capacity of 213 GW, heat rate improvement capital cost of $100/KW, capital charge rate of 14.3%, fleet-wide baseline net heat rate of 10,250 Btu/KWh, heat rate improvement of 4% for coal-fired EGUs, annual capacity factor of 78%, and future (2030) average coal delivered cost of $2.70 per million Btu. See page 2-65, Greenhouse Gas Mitigation Measures, Technical Support Document (TSD) for Carbon Pollution Guidelines for Existing Power Plants”, August 3, 2015. 5 See page 457 of 1560 (pre-publication version), Ibid. 6 See pages 458 and 459 of 1560 (pre-publication version), Ibid.
Edgecombe-Page 4 of 9
Attachment B B-175Attachment B B-175

5
LP steam path upgrade HP steam seal upgrade Boiler draft system control schemes HP steam path upgrade Steam turbine replacement Cooling tower packing upgrade Lower air heater leakage Economizer replacement IP steam path upgrade IP steam seal upgrade Lower air heater outlet temperature Install variable speed drives (fans and motors) Install variable frequency drives, induced draft fans on flue gas Edgecombe Genco has based its analysis on literature as identified in the previous section, among others, for evaluating types of heat rate improvement methods, technical feasibility, heat rate reduction potential, and costs (both capital and fixed and variable O&M). Wherever actual data on costs are available, the literature data has been supplanted. For example, for soot blower replacement, actual fixed O&M costs were available for the Edgecombe Genco facility. Edgecombe Genco has determined that all of the above heat rate improvement measures are technically feasible, at a cost per unit CO2 reduction in the range of $87 per ton (associated measure - upgrade of soot blowers) to $4,952 per ton (associated measure - install induced draft fans on flue gas), including fuel savings. Based on these estimates, Edgecombe Genco determined the existing soot blower upgrades at a cost of $87 per ton of CO2 emissions reduction (including fuel savings) to be the BSER for the existing EGUs at its facility and declared all other measures listed above not to be BSER based on cost. Refer to Edgecombe Genco's initial (August 31, 2015) and subsequent submittals (September 3 and 9, 2015). Edgecombe Genco has used the following data for the BSER determination consisting of soot blower upgrades on each unit (Unit 1 and Unit 2): Capital investment - $400,000 ± 85% Fixed O&M Cost - $35,000 per year ± 45% Project life for upgraded soot blowers - 40 to 50 years Heat rate improvement (reduction) - 90 Btu/KWh ± 0.5% (0.65% improvement over baseline net heat rate) Baseline (2012) CO2 Emissions - 79,170 metric ton/yr Baseline (2012) Net Heat Rate - 13,779 Btu/KWh Baseline (2012) Net Generation - 61,733 MWh Baseline (2012) Annual Capacity Factor - 0.122 (heat input basis) Future (2030) Annual Capacity Factor - 0.106 (heat input basis) Future (2030) Projected Coal Delivered Cost - $3.82 per million Btu CO2 Emission Reductions (associated with 0.65% heat rate improvement) - 495 short tons/yr Commencement of operation of each EGU - October 1990 Planned retirement year - None prior to 2030 It needs to be emphasized here that Edgecombe Genco burns coal in its boilers for two purposes: steam generation for a nearby pharmaceutical facility and power generation when required for regional
Edgecombe-Page 5 of 9
Attachment B B-176Attachment B B-176

6
electricity reliability. However, as per DAQ’s request, Edgecombe Genco has provided the above data (both generation and emissions) associated with electricity power generation only. In brief, the data does not account for additional fuel burning and emissions associated with steam sent to the pharmaceutical facility. With respect to the indirect annual cost for capital investment, Edgecombe Genco has simply divided the capital investment by 15 (time span between present year 2015 and 2030 final compliance date) to determine the indirect annual (capital) cost, which was then added to the direct annual (O&M) cost to arrive at the total annual cost (direct and indirect) of $87 per ton for each unit. The DAQ has used a different approach to transform the capital investment to indirect annual (capital) cost by using the capital charge rate of 14.3%, as discussed in the TSD previously cited in footnote 3. Assuming that NC’s compliance period for this EGU begins in 2019, the nationwide, average coal delivered cost is projected to be approximately $2.50 per million Btu7. In addition, the DAQ believes that more accurate annual capacity factor (heat input basis) for the baseline year (2012) is 0.1298 instead of 0.122 (as provided by Edgecombe Genco). Finally, DAQ will adjust the capital and annual O&M costs estimates, provided by Edgecombe Genco in 2015 dollars, to 2019 dollars, using the growth factor of 1.8 percent compounded annually.9 With these changes, DAQ’s estimate for cost per unit reduction in CO2 (including fuel savings) is $187 per ton starting 201910 (instead of $87 per ton as estimated by Edgecombe Genco). Refer to the tab “ElecGenOnly” in the attached spreadsheet on calculations for annualized cost and cost per unit reduction of CO2 for the heat rate improvement measure. Thus, Edgecombe Genco’s estimate of $87 per ton can be deemed a conservative and valid estimate. Although the project life for upgraded soot blowers is known (at least 40 years), the planned retirement year is unknown for each EGU. Therefore, no adjustment to this calculated estimated cost of $87 per ton of CO2 can be made. Comparing it with the reasonable cost threshold of $23 per ton, as discussed above, cost estimate of $87 per ton of CO2 reduction at each of the EGUs at the facility can be considered “excessive”, “exorbitant” or “unreasonable”, as stated by EPA in the preamble to the final EG11. It needs to be highlighted here that the facility is an intermittent source for electricity generation and it only generates electricity when dispatched, which can be seen in its low baseline and future (projected)
7 For 2015 and 2020, the nationwide coal delivered prices are $2.41 per million Btu and $2.54 per million Btu, respectively. By interpolating, the 2019 coal delivered price is approximately $2.50 per million Btu. Refer to "Annual Energy Outlook 2015", US EIA. 8 Using 13708 Btu/KWh net and 62858 MWh net (both for Unit 1) and 13851 Btu/KWh net and 60608 MWh net (both for Unit 2), the baseline (2012) annual capacity factors can be calculated as follows: Unit 1 = (13708 Btu/KWh * 62858000 KWh) / (2*375 x 106 Btu/hr * 8760 hr) = 0.131 Unit 2 = (13851 Btu/KWh * 60608000 KWh ) / (2*375 x 106 Btu/hr * 8760 hr) = 0.128 Thus, the average annual capacity factor for these two units is (0.131 + 0.128) / 2 = 0.129 9 See both GDP Chain-Type Price Index and Metals and Metal Products Indicator, Table A20. Macroeconomics Indicators, USEIA Annual Energy Outlook 2015. 10 For year 2030, the cost per unit reduction slightly reduces to $185 per ton of CO2 assuming nationwide fuel delivered price of $2.70 per million Btu as cited in the TSD in footnote 3 above and reference included in footnote 6 above. 11 Page 298 of 1560 (pre-publication version), Ibid.
Edgecombe-Page 6 of 9
Attachment B B-177Attachment B B-177

7
annual capacity factors. In brief, it is not a base-loaded facility for electricity power generation. Thus, any measures for heat rate improvements are expected to present significant costs, very likely exceeding the reasonable cost threshold. If any of its EGUs were to operate at a higher annual capacity factor, then, the cost per unit reduction of CO2 would come down. Separately, if the total output (both electric output to the utility grid and useful thermal output to the nearby pharmaceutical facility) of the EGU and associated CO2 emissions are considered for the baseline year (2012), the cost per unit CO2 reduction drops to $78 per ton for 2019 (compared with $187 per ton using the DAQ’s approach). Refer to the tab “ElecGen+ThermalOutput” in the attached spreadsheet. In summary, although Edgecombe Genco has proposed existing soot blowers upgrades as BSER at a cost of $87 per ton CO2, DAQ is determining this cost unreasonable (using the cost threshold of $23 per ton CO2). In general, this measure is expected to produce non-air environmental co-benefits in the form of reduced water usage and solid waste production, in addition to, reduced emissions of non-GHG pollutants such as SO2, NOx, and mercury. Moreover, no adverse energy impact is expected from employing the measure. Thus, considering cost, non-air environmental, and energy impacts, DAQ determines that there are no identified BSER measures for each unit (Units 1 and 2) at Edgecombe Genco. Finally, the following Table provides the summary of the above discussions.
Existing Soot Blowers Upgrades Cost Effectiveness for CO2 Emissions Reductions
Scenario Edgecombe Genco’s Approach Cost Per Unit Reduction
DAQ’s Approach Cost Per Unit Reduction
Fuel delivered cost $3.82 per million Btu (2030) Divides capital investment of $400,000 by 15 (time period from 2015 to 2030) to determine annual cost for the capital
Fuel delivered cost $2.50 per million Btu (2019) Uses capital charge rate of 14.3% to determine annual cost for $400,000 capital
Electric power output
only
$87 per ton
Baseline (2012) annual capacity factor = 0.122
Future (2030) annual capacity factor = 0.106
$187 per ton
Baseline (2012) annual capacity factor = 0.129
Future (2019) annual capacity factor = 0.106
Electric power
output + useful
thermal output
$37 per ton12
Baseline (2012) annual capacity factor = 0.308
Future (2030) annual capacity factor = 0.267
$78 per ton
Baseline (2012) annual capacity factor = 0.308
Future (2019) annual capacity factor = 0.253
5. BSER for Edgecombe Genco Units 1 and 2
None.
12 Edgecombe Genco did not provide this information. The DAQ calculated this cost using the Edgecombe Genco’s approach for the total EGU output scenario (both electric power output and useful thermal output).
Edgecombe-Page 7 of 9
Attachment B B-178Attachment B B-178

Case 1*
NOTES REFERENCES
$429,588 1
$429,588 DC 2(a)
None
$0 IC 2(a)
$429,588 TCI = DC + IC 2(a)
$37,589 1
$0 1
Fuel Savings -$11,413 3
$26,176 2(b)
14.3% CCR 4
$61,431 TCRC = TCI * CCR 2(b), 4
$61,431 IDAC = TCRC 2(b)
$87,607 TAC = DAC + IDAC 2(b)
79170 1
13779 1
Baseline (2012) Net Generation, MWh 61733 1
Baseline (2012) Annual Capacity Factor - Heat Input Basis 0.129 1
Future (2019) Annual Capacity Factor - Heat Input Basis 0.106 1
Future (2019) Net Generation, MW-h 50726 5
90 1
0.65
CO2 Emissions Reduction (corresponding to heat rate improvement), % 0.65
425 6
468
$187 7
$233 8*Includes Annual Capacity Factors and Emissions Based on Electric Power Output Only.
5. Based on baseline net generation and ratio of baseline and future capacity factors.
6. Based on baseline CO2 emissions and capacity factor, future capacity factor, and CO2 emissions reductions percentage.
7. Based on total annual cost including fuel savings and CO2 emissions reductions from baseline.
8. Based on total annual cost excluding fuel savings and CO2 emissions reductions from baseline.
1. Data averaged for each Unit as per Clean Power Plan BSER, Edgecombe Genco LLC, Battleboro, NC, August 31, 2015. Cost data adjusted for 2019.
4. Greenhouse Gas Mitigation Measures, TSD for Carbon Pollution Guidelines for Existing Power Plants, Section 2.7 Costs, p. 2-62 through 2-66, August 3, 2015.
2. EPA Air Pollution Control Cost Manual, Sixth Edition, January 2002; EPA/452/B-02-001
a. Section 1, Chapter 2, Paragraph 2.3.1 Elements of Total Capital Investment.
b. Section 1, Chapter 2, Paragraph 2.3.2: Elements of Total Annual Cost.
3. Based on baseline net generation and net heat rate, ratio of baseline and future capacity factors, heat rate improvement, and future (2019) average coal delivered price included in "Annual Energy Outlook 2015", US EIA.
References:
Total Capital Recovery Costs (TCRC)
Total Indirect Annual Costs (IDAC)
Total Annual CostBaseline (2012) CO2 Emissions, metric ton/yr
Baseline (2012) Net Heat Rate, Btu/kWh
Average Heat Rate Reduction (Improvement), Btu/kw-hr
Heat Rate Improvement from Baseline Net Heat Rate, %
CO2 Emissions Reduction from Baseline, Metric ton/yr
Cost per Short Ton of CO2 Removed (include fuel savings)
Cost per Short Ton of CO2 Removed (exclude fuel savings)
CO2 Emissions Reduction from Baseline, Short ton/yr
Fixed Operation & Maintenance Cost
Variable Operation and Maintenance Cost
Total Direct Annual Costs (DAC)
Indirect Annual Costs
Capital Charge Rate (CCR)
Direct Annual Costs
Annualized Cost and Cost Per Unit CO2 Reduction for Soot Blowers Upgrades for Unit 1 or Unit 2
Edgecombe Genco LLC, Battleboro, NC
Capital Cost
Direct Costs
Equipment Cost
Total Direct Costs
Indirect Costs
Total Indirect Costs
Total Capital Investment (TCI)
Annual Cost
Edgecombe-Page 8 of 9
Attachment B B-179Attachment B B-179
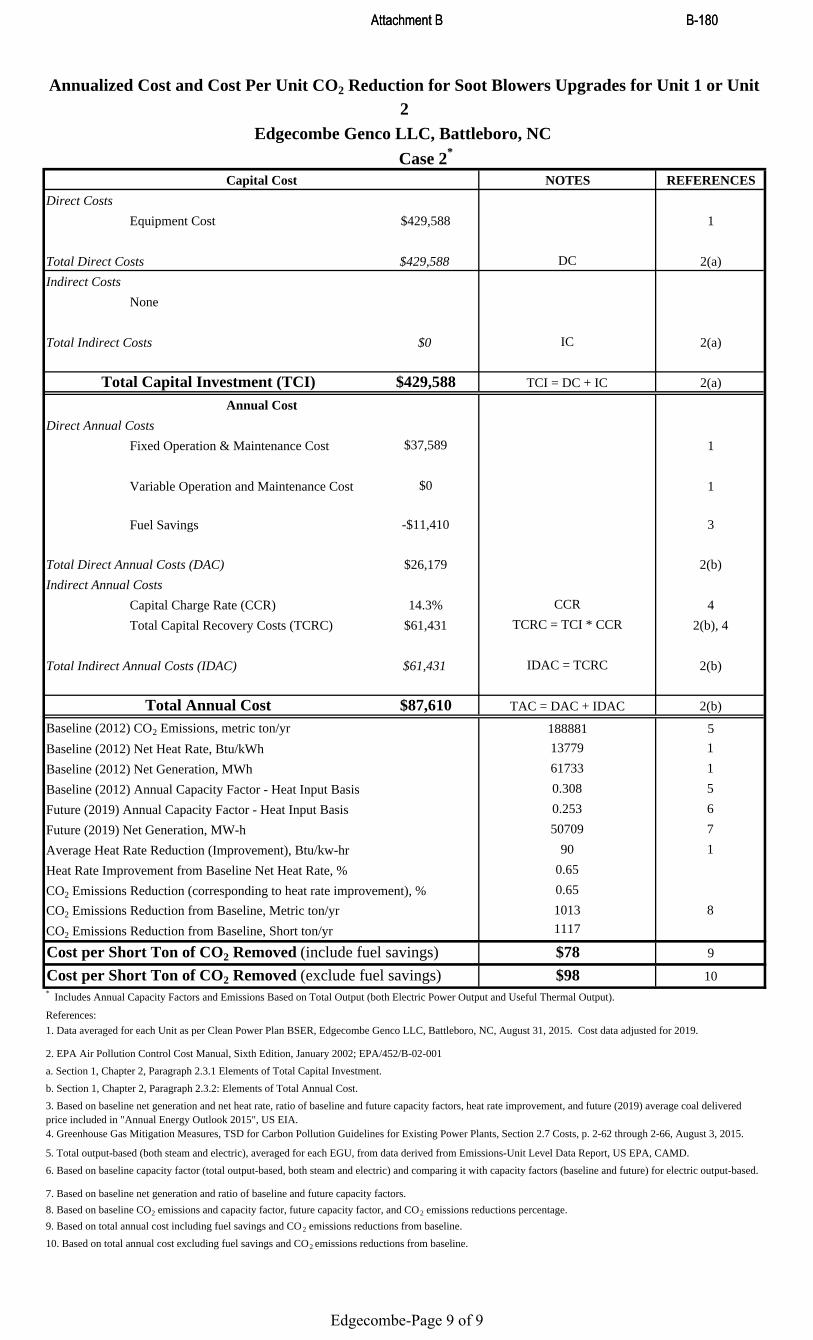
Case 2*
NOTES REFERENCES
$429,588 1
$429,588 DC 2(a)
None
$0 IC 2(a)
$429,588 TCI = DC + IC 2(a)
$37,589 1
$0 1
Fuel Savings -$11,410 3
$26,179 2(b)
14.3% CCR 4
$61,431 TCRC = TCI * CCR 2(b), 4
$61,431 IDAC = TCRC 2(b)
$87,610 TAC = DAC + IDAC 2(b)
188881 5
13779 1
Baseline (2012) Net Generation, MWh 61733 1
Baseline (2012) Annual Capacity Factor - Heat Input Basis 0.308 5
Future (2019) Annual Capacity Factor - Heat Input Basis 0.253 6
Future (2019) Net Generation, MW-h 50709 7
90 1
0.65
CO2 Emissions Reduction (corresponding to heat rate improvement), % 0.65
1013 8
1117
$78 9
$98 10
5. Total output-based (both steam and electric), averaged for each EGU, from data derived from Emissions-Unit Level Data Report, US EPA, CAMD.
7. Based on baseline net generation and ratio of baseline and future capacity factors.
8. Based on baseline CO2 emissions and capacity factor, future capacity factor, and CO2 emissions reductions percentage.
9. Based on total annual cost including fuel savings and CO2 emissions reductions from baseline.
10. Based on total annual cost excluding fuel savings and CO2 emissions reductions from baseline.
6. Based on baseline capacity factor (total output-based, both steam and electric) and comparing it with capacity factors (baseline and future) for electric output-based.
CO2 Emissions Reduction from Baseline, Metric ton/yr
CO2 Emissions Reduction from Baseline, Short ton/yr
Cost per Short Ton of CO2 Removed (include fuel savings)
Cost per Short Ton of CO2 Removed (exclude fuel savings)
References:
2. EPA Air Pollution Control Cost Manual, Sixth Edition, January 2002; EPA/452/B-02-001
a. Section 1, Chapter 2, Paragraph 2.3.1 Elements of Total Capital Investment.
b. Section 1, Chapter 2, Paragraph 2.3.2: Elements of Total Annual Cost.
3. Based on baseline net generation and net heat rate, ratio of baseline and future capacity factors, heat rate improvement, and future (2019) average coal delivered price included in "Annual Energy Outlook 2015", US EIA.4. Greenhouse Gas Mitigation Measures, TSD for Carbon Pollution Guidelines for Existing Power Plants, Section 2.7 Costs, p. 2-62 through 2-66, August 3, 2015.
* Includes Annual Capacity Factors and Emissions Based on Total Output (both Electric Power Output and Useful Thermal Output).
1. Data averaged for each Unit as per Clean Power Plan BSER, Edgecombe Genco LLC, Battleboro, NC, August 31, 2015. Cost data adjusted for 2019.
Heat Rate Improvement from Baseline Net Heat Rate, %
Fixed Operation & Maintenance Cost
Variable Operation and Maintenance Cost
Total Direct Annual Costs (DAC)
Indirect Annual Costs
Capital Charge Rate (CCR)
Total Capital Recovery Costs (TCRC)
Total Indirect Annual Costs (IDAC)
Total Annual CostBaseline (2012) CO2 Emissions, metric ton/yr
Baseline (2012) Net Heat Rate, Btu/kWh
Average Heat Rate Reduction (Improvement), Btu/kw-hr
Direct Annual Costs
Annualized Cost and Cost Per Unit CO2 Reduction for Soot Blowers Upgrades for Unit 1 or Unit 2
Edgecombe Genco LLC, Battleboro, NC
Capital Cost
Direct Costs
Equipment Cost
Total Direct Costs
Indirect Costs
Total Indirect Costs
Total Capital Investment (TCI)
Annual Cost
Edgecombe-Page 9 of 9
Attachment B B-180Attachment B B-180

North Carolina Department of Environment Quality Division of Air Quality
Best System of Emission Reduction (BSER) for Duke Energy’s G G Allen Units 1, 2 and 3
(ORIS code 2718) and Asheville Units 1 and 2 (ORIS code 2706) The EPA’s 111(d) rule for existing EGUs identified Asheville Units 1 and 2 (ORIS code 2706) and Allen Units 1, 2 and 3 (ORIS code 2718) as being subject to the requirements. The purpose of the following information is to provide updated data regarding their upcoming retirements as the basis for explaining why Best System of Emission Reduction (BSER) is no additional control for these units. Each facility consists of coal-fired units that meet the applicability requirements under the 111(d) rule in §60.5845(b) for existing, currently operating fossil fuel-fired EGUs as follows:
(1) Serves a generator connected to a utility power distribution system with a nameplate capacity of 25 MW-net or greater (i.e., capable of selling greater than 25 MW of electricity); and (2) Has a base load rating (i.e., design heat input capacity) greater than 260 GJ/hr (250 MMBtu/hr) heat input of fossil fuel.
However, under a consent decree approved by the U.S. District Court for the Middle District of North Carolina between the EPA and Department of Justice with Duke Energy Corporation, the G G Allen coal-fired Units 1, 2 and 3 are required to be retired by December 31, 2024.1 A comprehensive cost-effectiveness assessment was completed for Units 4 and 5 at plant Allen. These two units are larger than Units 1, 2 and 3, and have been operated at similar capacity levels in recent years. DAQ concluded that BSER for Units 4 and 5 is no additional control. Since Units 1, 2 and 3 are smaller and will be shut down four years earlier than Units 4 and 5, DAQ also concludes that BSER for these units is no additional control. Duke Energy Carolina’s September 2015 Integrated Resource Planning Update Report specifies that all five Allen units (1,127 MW capacity) are projected to be retired in 2028.2 Under a recent North Carolina session law, the Asheville coal-fired Units 1 and 2 owned by Duke Energy Progress are required to retire by January 31, 2020 and be replaced with new natural gas-fired units.3 These units will be shut down just after the compliance date for NC’s 111(d) rules. Based on their limited remaining useful life of only a few years before their retirement, the DAQ concludes that BSER for both Asheville units should be no additional control.
1 U.S. District Court for the Middle District of North Carolina Consent decree, see http://www2.epa.gov/enforcement/duke-energy-corporation-clean-air-act-caa-settlement 2 Duke Energy Carolinas North Carolina 2015 IRP Update Report Integrated Resource Plan, September 1, 2015, see http://www.ncuc.commerce.state.nc.us/docket.htm, Docket E-100 Sub 141. 3 North Carolina Session Law 2015-110, Senate Bill 716, signed into law on June 24, 2015; see http://www.ncleg.net/Sessions/2015/Bills/Senate/PDF/S716v5.pdf.
Attachment B B-181Attachment B B-181

Note that upon retirement for the five subject EGUs, their CO2 emission rate will be reduced to zero, indicative of the ultimate extent of emission control.
Attachment B B-182Attachment B B-182

1
North Carolina Department of Environmental Quality Division of Air Quality
Supporting Basis
Determination of Best System of Emissions Reduction for CO2 Emissions from Existing Electric Utility Generating Units
October 23, 2015
Facility Rosemary Power Station, Roanoke Rapids, NC Facility ID: 4200170 Current Air Quality Permit 06586T16 Affected Electric Utility Generating Units (EGUs) One natural gas/No. 2 fuel oil-fired combined cycle combustion turbine rated at 1136 million Btu per hour heat input when firing natural gas and 1095 million Btu per hour heat input when firing No. 2 fuel (ID No. ES1-CT1), and one natural gas/No. 2 fuel oil-fired combined cycle combustion turbine rated at 541 million Btu per hour heat input when firing natural gas and 525 million Btu per hour heat input when firing No. 2 fuel oil (ID No. ES2-CT2). The two combustion turbines and steam generators are rated at a total of 165 MW (nameplate capacity).
1. Introduction The United States Environmental Protection Agency (EPA) has adopted Emission Guidelines for Greenhouse Gas Emissions and Compliance Times for Electric Utility Generating Units on August 3, 2015 and codified it in 40 CFR Subpart UUUU. The affected electric utility steam generating units (EGUs) under these emission guidelines (EG) are steam generating units, integrated gasification combined cycle units (IGCC), and stationary combined cycle or combined heat and power (CHP) combustion turbines that commenced construction on or before January 8, 2014. The EG includes uniform, nationwide emission standards, which are performance-based rates for emissions of greenhouse gases (GHG) expressed as CO2 (lb CO2/net MWh), as follows: Fossil fuel-fired steam generating units or IGCC: 1,534 lb CO2/net MWh (interim, average of 2022-
2029), 1,305 lb CO2/net MWh (final, starting 2030)
Natural gas-fired stationary combined cycle combustion turbines (including CHP combustion turbines): 832 lb/net MWh (interim, average of 2022-2029), 771 lb/MWh (final, starting 2030)
In lieu of the above uniform rates, each EGU can comply with state-specific goal (lb CO2/net MWh). The other option is that all affected units in the state, in aggregate, comply with the mass-based state goal (short tons/yr). For North Carolina (NC), the rate-based interim and final goals are 1,311 lb CO2/net MWh and 1,136 lb CO2/net MWh, respectively. Similarly, NC’s mass-based interim and final goals are 56,986,025 short tons/yr and 51,266,234 short tons/yr, respectively.
Rosemary-Page 1 of 5
Attachment B B-183Attachment B B-183

2
The above standards (whether uniform nationwide rates or state-specific goals) are based upon the determination of Best System of Emissions Reduction (BSER) consisting of following three building blocks: Building Block 1 (BB1) - reducing the carbon intensity of electricity generation by improving the
heat rate of existing coal-fired power plants.
Building Block 2 (BB2) - substituting increased electricity generation from lower-emitting existing natural gas plants for reduced generation from higher-emitting coal-fired power plants.
Building Block 3 (BB3) - substituting increased electricity generation from new zero-emitting renewable energy sources (like wind and solar) for reduced generation from existing coal-fired power plants.
The EG requires that each state submit its plan complying with all applicable requirements by the deadline included therein. One of the requirements consist of development of emission standard (“standard of performance”) and establishment of compliance time for each EGU. The Clean Air Act (CAA) §111(a)(1) defines “standard of performance” as “a standard for emissions of air pollutants which reflects the degree of emission limitation achievable through the application of the best system of emission reduction which (taking into account the cost of achieving such reduction and any non-air quality health and environmental impact and energy requirements) the Administrator determines has been adequately demonstrated”.
2. History of Development of Emission Guidelines under CAA Over the last 40 years, under §111(d), the EPA has regulated four pollutants from five source categories, by promulgating associated EG. These source categories are phosphate fertilizer plants (fluorides), sulfuric acid plants (acid mist), Kraft pulp plants (total reduced sulfur (TRS)), primary aluminum plants (fluorides), and municipal solid waste landfills (landfill gas emissions as non-methane organic compounds (NMOCs))1. The following general principles / rationales were used by EPA in establishing BSER for these EGs: The degree of emission reduction achievable through the application of various demonstrated control
technologies.
The technical feasibility of applying various demonstrated technologies to existing sources considering variability in sizes and designs.
The impact of various demonstrated technologies on national energy consumption, water pollution, waste disposal, and ambient air concentrations of a designated pollutant.
1 See Footnote 18 at 79 FR 41776, July 17, 2014, including ‘‘Phosphate Fertilizer Plants; Final Guideline Document Availability,’’ 42 FR 12022 (March 1, 1977); ‘‘Standards of Performance for New Stationary Sources; Emission Guideline for Sulfuric Acid Mist,’’ 42 FR 55796 (October 18, 1977); ‘‘Kraft Pulp Mills, Notice of Availability of Final Guideline Document,’’ 44 FR 29828 (May 22, 1979); ‘‘Primary Aluminum Plants; Availability of Final Guideline Document,’’ 45 FR 26294 (April 17, 1980); ‘‘Standards of Performance for New Stationary Sources and Guidelines for Control of Existing Sources: Municipal Solid Waste Landfills, Final Rule,’’ 61 FR 9905 (March 12, 1996).
Rosemary-Page 2 of 5
Attachment B B-184Attachment B B-184

3
The cost of adopting the emission guidelines, after considering control costs for various demonstrated technologies and taking into account the level of any existing controls.
Each of these EGs indicates that the cost of applying various control technologies can have a considerable impact in selection of a BSER for any designated pollutant for existing facilities. They also indicate that the age, size, type, class, and process design of the facility, influence not only the BSER selection process, but can also support a decision-making for whether different EGs are to be established for differing sizes, types, or classes of equipment. The EGs for the above referenced source categories have been established for principal points of emissions (point and fugitive emissions sources) located within the facility and, not for any emissions sources located outside of the facility. Finally, in these EGs, with respect to determining the EG, EPA has consistently recognized that not only the control technology needs to be demonstrated on existing sources, but the degree of emission reduction (performance level) needs to be readily achievable by the control technology.
3. The Division of Air Quality (DAQ)’s Approach for Determination of BSER The DAQ will consider the above general principles in determining BSER for CO2 emissions reduction from each EGU. But, importantly, DAQ will determine BSER for each EGU based upon BB1-type measures only (i.e., measures which can be accomplished within the fence-line of the facility), conforming to the §111(d) of the CAA and the requirements of 40 CFR 60 “Adoption and Submittal of State Plans for Designated Facilities”. Thus, DAQ’s approach will comprise of improving the operational efficiency of the EGUs in order to reduce CO2 emissions from the 2012 baseline levels. The DAQ’s BSER evaluation is based on the following parameters: type of EGU remaining useful life of the EGU unit’s baseline data (net heat rate, net generation, annual capacity factor, and CO2 emissions) unit’s projected future capacity factor whether the measure is adequately demonstrated to reduce heat rate feasibility of applying a specific heat rate improvement measure on a given unit degree of heat rate reduction potential for a specific feasible heat rate improvement measure site-specific limitations associated costs (capital, fixed and variable operational and maintenance (O&M), and fuel
savings) cost per ton of CO2 reduction
The evaluation is also based on literature review2 of technical feasibility for various heat rate improvement measures, degree of heat rate reduction potential, and costs data (capital, and fixed and variable O&M).
2 “Coal-fired Power Plant Heat Rate Reductions”, Final Report, Sargent & Lundy, Chicago, IL, January 22, 2009. “Analysis of Heat Rate Improvement Potential at Coal-Fired Power Plants”, US Energy Information Administration, Washington, DC, May 2015. S. Corellis, “Range and Applicability of Heat Rate Improvements”, Technical Update, Electric Power Research Institute, Palo Alto, CA, April 2014.
Rosemary-Page 3 of 5
Attachment B B-185Attachment B B-185

4
It needs to be emphasized here that DAQ’s determination for each EGU will not be based upon some pre-determined heat rate improvement target, such as EPA’s selection of a 4.3% heat rate improvement potential for EGUs in the Eastern interconnection3, as discussed in the EG. The DAQ’s approach will include those adequately demonstrated, cost-effective measures that assure that the electricity is generated with lower CO2 emissions, thus improving public health and welfare. The selected heat rate improvement measures would be expected to produce non-air environmental co-benefits in the form of reduced water usage and solid waste production, in addition to, reductions in emissions of non-GHG pollutants such as SO2, NOx, and mercury. However, it should be noted that if the unit (EGU) is utilized more often after implementing heat rate improvement measure(s) (as it becomes more competitive due to fuel consumption and economic standpoints), some increases in emissions of GHG (as CO2) and similarly, for non-GHG pollutants (such as SO2, NOx, or mercury) are possible, and those could partially offset the emissions reductions achieved for GHG (as CO2) and non-GHG (such as SO2, NOx, or mercury). EPA has determined a cost estimate of $23 per ton4 reasonable for CO2 emissions reduction from EGUs under BB1 implementing heat rate improvement measures. EPA has further determined that this cost is reasonable because it achieves “an appropriate balance between cost and amount of reductions.”5 In addition, EPA has used another benchmark in the form of social cost of carbon (SC-CO2) at $40 per ton (2020) to $48 per ton (2030)6 to conclude that the above $23 per ton cost is reasonable. The DAQ will use the above cost effectiveness threshold of $23 per ton to determine reasonableness of cost for each of the technically feasible measure in determining BSER for a particular EGU.
4. BSER Evaluation
Rosemary Power Station (Rosemary) has submitted a BSER analysis for each of its EGUs showing various measures to improve heat rate along with associated estimated reductions in heat rate, capital costs (recurring costs have not been evaluated), and other information. In the final Clean Power Plan rule (40 CFR 60 Subpart UUUU) for existing EGUs, EPA “considered heat rate improvement opportunities at oil- and gas-fired steam EGUs and NGCC units and found that the available emission reductions would likely be more expensive or too small to merit consideration as a material component of the BSER.”7 3 Applies to coal-fired EGUs only. 4 See page 446 of 1560 (pre-publication version), Carbon Pollution Emission Guidelines for Existing Stationary Sources: Electric Utility Generating Units Clean Power Plan, August 3, 2015. Based on nation-wide coal fleet capacity of 213 GW, heat rate improvement capital cost of $100/KW, capital charge rate of 14.3%, fleet-wide baseline net heat rate of 10,250 Btu/KWh, heat rate improvement of 4% for coal-fired EGUs, annual capacity factor of 78%, and future (2030) average coal delivered cost of $2.70 per million Btu. See page 2-65, Greenhouse Gas Mitigation Measures, Technical Support Document (TSD) for Carbon Pollution Guidelines for Existing Power Plants”, August 3, 2015. 5 See page 457 of 1560 (pre-publication version), Ibid. 6 See pages 458 and 459 of 1560 (pre-publication version), Ibid. 7 See page 336-337 of 1560 (pre-publication version), Ibid.
Rosemary-Page 4 of 5
Attachment B B-186Attachment B B-186

5
In New Source Performance Standards for new, modified, and reconstructed EGUs (40 CFR Part 60 Subpart TTTT), EPA stated, “For newly constructed and reconstructed base load natural gas-fired stationary combustion turbines, the BSER is the use of efficient NGCC technology. For newly constructed and reconstructed non-base load natural gas-fired stationary combustion turbines, the BSER is the use of clean fuels (i.e., natural gas with an allowance for a small amount of distillate oil). For multi-fuel-fired stationary combustion turbines, the BSER is also the use of clean fuels (e.g., natural gas, ethylene, propane, naphtha, jet fuel kerosene, distillate oils 1 and 2, biodiesel, and landfill gas).”8 Rosemary is a “peaking” facility as operations of its EGUs are severely restricted under various permit conditions, and is not a base-load electric power plant. Based on the above EPA determinations and considering the nature of operations of this facility, DAQ believes that efficient NGCC technology combined with the use of clean fuels (natural gas and distillate fuel) is BSER for EGUs at Rosemary.
5. BSER for Units 1 and 2
Rosemary shall continue to implement efficient NGCC technology and burn only clean fuels (natural gas, distillate fuel) starting September 1, 2019.
8 See page 462 of 768, Standards of Performance for Greenhouse Gas Emissions from New, Modified, and Reconstructed Stationary Sources: Electric Utility Generating Units, August 3, 2015.
Rosemary-Page 5 of 5
Attachment B B-187Attachment B B-187

1
North Carolina Department of Environmental Quality Division of Air Quality
Supporting Basis
Determination of Best System of Emissions Reduction for CO2 Emissions from Existing Electric Utility Generating Units
October 23, 2015
Facility Buck Combined Cycle Facility (Duke Energy Carolinas LLC), Salisbury, NC Facility ID: 8000004 Current Air Quality Permit 03786T31 Affected Electric Utility Generating Units (EGUs) Two nominal 170 MW (GE Model 7FA) natural gas-fired combined-cycle combustion turbines rated at 1984.1 million Btu per hour maximum heat input each, equipped a heat recovery steam generator with natural gas-fired duct burners rated at 620 million Btu per hour heat input each (ID Nos. ES-11 and ES-12). The two turbines and steam generators are rated at a total of 691.1 MW (nameplate capacity).
1. Introduction The United States Environmental Protection Agency (EPA) has adopted Emission Guidelines for Greenhouse Gas Emissions and Compliance Times for Electric Utility Generating Units on August 3, 2015 and codified it in 40 CFR Subpart UUUU. The affected electric utility steam generating units (EGUs) under these emission guidelines (EG) are steam generating units, integrated gasification combined cycle units (IGCC), and stationary combined cycle or combined heat and power (CHP) combustion turbines that commenced construction on or before January 8, 2014. The EG includes uniform, nationwide emission standards, which are performance-based rates for emissions of greenhouse gases (GHG) expressed as CO2 (lb CO2/net MWh), as follows: Fossil fuel-fired steam generating units or IGCC: 1,534 lb CO2/net MWh (interim, average of 2022-
2029), 1,305 lb CO2/net MWh (final, starting 2030)
Natural gas-fired stationary combined cycle combustion turbines (including CHP combustion turbines): 832 lb/net MWh (interim, average of 2022-2029), 771 lb/MWh (final, starting 2030)
In lieu of the above uniform rates, each EGU can comply with state-specific goal (lb CO2/net MWh). The other option is that all affected units in the state, in aggregate, comply with the mass-based state goal (short tons/yr). For North Carolina (NC), the rate-based interim and final goals are 1,311 lb CO2/net MWh and 1,136 lb CO2/net MWh, respectively. Similarly, NC’s mass-based interim and final goals are 56,986,025 short tons/yr and 51,266,234 short tons/yr, respectively.
Buck-Page 1 of 5
Attachment B B-188Attachment B B-188

2
The above standards (whether uniform nationwide rates or state-specific goals) are based upon the determination of Best System of Emissions Reduction (BSER) consisting of following three building blocks: Building Block 1 (BB1) - reducing the carbon intensity of electricity generation by improving the
heat rate of existing coal-fired power plants.
Building Block 2 (BB2) - substituting increased electricity generation from lower-emitting existing natural gas plants for reduced generation from higher-emitting coal-fired power plants.
Building Block 3 (BB3) - substituting increased electricity generation from new zero-emitting renewable energy sources (like wind and solar) for reduced generation from existing coal-fired power plants.
The EG requires that each state submit its plan complying with all applicable requirements by the deadline included therein. One of the requirements consist of development of emission standard (“standard of performance”) and establishment of compliance time for each EGU. The Clean Air Act (CAA) §111(a)(1) defines “standard of performance” as “a standard for emissions of air pollutants which reflects the degree of emission limitation achievable through the application of the best system of emission reduction which (taking into account the cost of achieving such reduction and any non-air quality health and environmental impact and energy requirements) the Administrator determines has been adequately demonstrated”.
2. History of Development of Emission Guidelines under CAA Over the last 40 years, under §111(d), the EPA has regulated four pollutants from five source categories, by promulgating associated EG. These source categories are phosphate fertilizer plants (fluorides), sulfuric acid plants (acid mist), Kraft pulp plants (total reduced sulfur (TRS)), primary aluminum plants (fluorides), and municipal solid waste landfills (landfill gas emissions as non-methane organic compounds (NMOCs))1. The following general principles / rationales were used by EPA in establishing BSER for these EGs: The degree of emission reduction achievable through the application of various demonstrated control
technologies.
The technical feasibility of applying various demonstrated technologies to existing sources considering variability in sizes and designs.
The impact of various demonstrated technologies on national energy consumption, water pollution, waste disposal, and ambient air concentrations of a designated pollutant.
1 See Footnote 18 at 79 FR 41776, July 17, 2014, including ‘‘Phosphate Fertilizer Plants; Final Guideline Document Availability,’’ 42 FR 12022 (March 1, 1977); ‘‘Standards of Performance for New Stationary Sources; Emission Guideline for Sulfuric Acid Mist,’’ 42 FR 55796 (October 18, 1977); ‘‘Kraft Pulp Mills, Notice of Availability of Final Guideline Document,’’ 44 FR 29828 (May 22, 1979); ‘‘Primary Aluminum Plants; Availability of Final Guideline Document,’’ 45 FR 26294 (April 17, 1980); ‘‘Standards of Performance for New Stationary Sources and Guidelines for Control of Existing Sources: Municipal Solid Waste Landfills, Final Rule,’’ 61 FR 9905 (March 12, 1996).
Buck-Page 2 of 5
Attachment B B-189Attachment B B-189
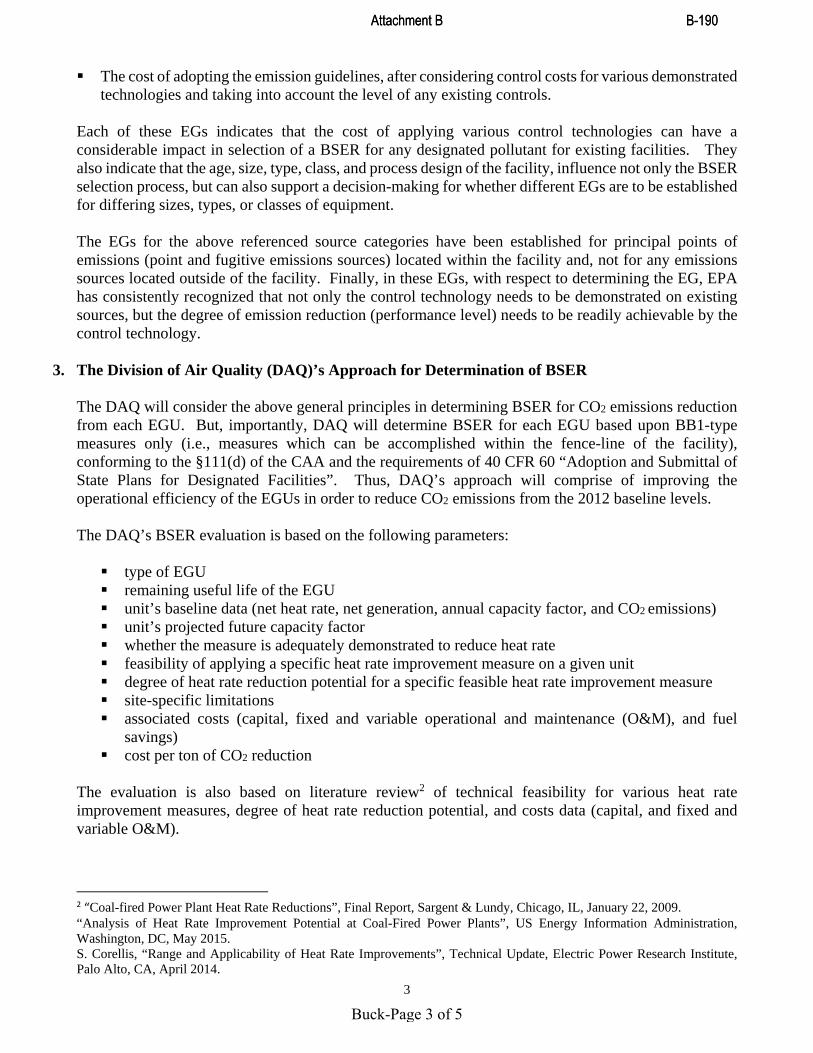
3
The cost of adopting the emission guidelines, after considering control costs for various demonstrated technologies and taking into account the level of any existing controls.
Each of these EGs indicates that the cost of applying various control technologies can have a considerable impact in selection of a BSER for any designated pollutant for existing facilities. They also indicate that the age, size, type, class, and process design of the facility, influence not only the BSER selection process, but can also support a decision-making for whether different EGs are to be established for differing sizes, types, or classes of equipment. The EGs for the above referenced source categories have been established for principal points of emissions (point and fugitive emissions sources) located within the facility and, not for any emissions sources located outside of the facility. Finally, in these EGs, with respect to determining the EG, EPA has consistently recognized that not only the control technology needs to be demonstrated on existing sources, but the degree of emission reduction (performance level) needs to be readily achievable by the control technology.
3. The Division of Air Quality (DAQ)’s Approach for Determination of BSER The DAQ will consider the above general principles in determining BSER for CO2 emissions reduction from each EGU. But, importantly, DAQ will determine BSER for each EGU based upon BB1-type measures only (i.e., measures which can be accomplished within the fence-line of the facility), conforming to the §111(d) of the CAA and the requirements of 40 CFR 60 “Adoption and Submittal of State Plans for Designated Facilities”. Thus, DAQ’s approach will comprise of improving the operational efficiency of the EGUs in order to reduce CO2 emissions from the 2012 baseline levels. The DAQ’s BSER evaluation is based on the following parameters: type of EGU remaining useful life of the EGU unit’s baseline data (net heat rate, net generation, annual capacity factor, and CO2 emissions) unit’s projected future capacity factor whether the measure is adequately demonstrated to reduce heat rate feasibility of applying a specific heat rate improvement measure on a given unit degree of heat rate reduction potential for a specific feasible heat rate improvement measure site-specific limitations associated costs (capital, fixed and variable operational and maintenance (O&M), and fuel
savings) cost per ton of CO2 reduction
The evaluation is also based on literature review2 of technical feasibility for various heat rate improvement measures, degree of heat rate reduction potential, and costs data (capital, and fixed and variable O&M).
2 “Coal-fired Power Plant Heat Rate Reductions”, Final Report, Sargent & Lundy, Chicago, IL, January 22, 2009. “Analysis of Heat Rate Improvement Potential at Coal-Fired Power Plants”, US Energy Information Administration, Washington, DC, May 2015. S. Corellis, “Range and Applicability of Heat Rate Improvements”, Technical Update, Electric Power Research Institute, Palo Alto, CA, April 2014.
Buck-Page 3 of 5
Attachment B B-190Attachment B B-190
4
It needs to be emphasized here that DAQ’s determination for each EGU will not be based upon some pre-determined heat rate improvement target, such as EPA’s selection of a 4.3% heat rate improvement potential for EGUs in the Eastern interconnection3, as discussed in the EG. The DAQ’s approach will include those adequately demonstrated, cost-effective measures that assure that the electricity is generated with lower CO2 emissions, thus improving public health and welfare. The selected heat rate improvement measures would be expected to produce non-air environmental co-benefits in the form of reduced water usage and solid waste production, in addition to, reductions in emissions of non-GHG pollutants such as SO2, NOx, and mercury. However, it should be noted that if the unit (EGU) is utilized more often after implementing heat rate improvement measure(s) (as it becomes more competitive due to fuel consumption and economic standpoints), some increases in emissions of GHG (as CO2) and similarly, for non-GHG pollutants (such as SO2, NOx, or mercury) are possible, and those could partially offset the emissions reductions achieved for GHG (as CO2) and non-GHG (such as SO2, NOx, or mercury). EPA has determined a cost estimate of $23 per ton4 reasonable for CO2 emissions reduction from EGUs under BB1 implementing heat rate improvement measures. EPA has further determined that this cost is reasonable because it achieves “an appropriate balance between cost and amount of reductions.”5 In addition, EPA has used another benchmark in the form of social cost of carbon (SC-CO2) at $40 per ton (2020) to $48 per ton (2030)6 to conclude that the above $23 per ton cost is reasonable. The DAQ will use the above cost effectiveness threshold of $23 per ton to determine reasonableness of cost for each of the technically feasible measure in determining BSER for a particular EGU.
4. BSER Evaluation
Duke Energy Carolinas LLC (DEC) has submitted a BSER analysis for the EGUs at this facility showing three possible measures that are available to improve heat rate along with associated estimated reductions in heat rate, costs (capital, and operation and maintenance), and other information. In the final Clean Power Plan rule (40 CFR 60 Subpart UUUU) for existing EGUs, EPA “considered heat rate improvement opportunities at oil- and gas-fired steam EGUs and NGCC units and found that the available emission reductions would likely be more expensive or too small to merit consideration as a material component of the BSER.”7 3 Applies to coal-fired EGUs only. 4 See page 446 of 1560 (pre-publication version), Carbon Pollution Emission Guidelines for Existing Stationary Sources: Electric Utility Generating Units Clean Power Plan, August 3, 2015. Based on nation-wide coal fleet capacity of 213 GW, heat rate improvement capital cost of $100/KW, capital charge rate of 14.3%, fleet-wide baseline net heat rate of 10,250 Btu/KWh, heat rate improvement of 4% for coal-fired EGUs, annual capacity factor of 78%, and future (2030) average coal delivered cost of $2.70 per million Btu. See page 2-65, Greenhouse Gas Mitigation Measures, Technical Support Document (TSD) for Carbon Pollution Guidelines for Existing Power Plants”, August 3, 2015. 5 See page 457 of 1560 (pre-publication version), Ibid. 6 See pages 458 and 459 of 1560 (pre-publication version), Ibid. 7 See page 336-337 of 1560 (pre-publication version), Ibid.
Buck-Page 4 of 5
Attachment B B-191Attachment B B-191

5
In New Source Performance Standards for new, modified, and reconstructed EGUs (40 CFR Part 60 Subpart TTTT), EPA stated, “For newly constructed and reconstructed base load natural gas-fired stationary combustion turbines, the BSER is the use of efficient NGCC technology. For newly constructed and reconstructed non-base load natural gas-fired stationary combustion turbines, the BSER is the use of clean fuels (i.e., natural gas with an allowance for a small amount of distillate oil). For multi-fuel-fired stationary combustion turbines, the BSER is also the use of clean fuels (e.g., natural gas, ethylene, propane, naphtha, jet fuel kerosene, distillate oils 1 and 2, biodiesel, and landfill gas).”8 Based on the above EPA determinations, DAQ believes that efficient NGCC technology combined with the use of natural gas9 is BSER for EGUs at the Buck Combined Cycle Facility.
5. BSER for Units ES-11 and ES-12 DEC shall continue to implement efficient NGCC technology and burn only natural gas starting September 1, 2019, at this facility.
8 See page 462 of 768, Standards of Performance for Greenhouse Gas Emissions from New, Modified, and Reconstructed Stationary Sources: Electric Utility Generating Units, August 3, 2015. 9 Buck EGUs burn natural gas only.
Buck-Page 5 of 5
Attachment B B-192Attachment B B-192
1
North Carolina Department of Environmental Quality Division of Air Quality
Supporting Basis
Determination of Best System of Emissions Reduction for CO2 Emissions from Existing Electric Utility Generating Units
October 23, 2015
Facility Dan River Combined Cycle Facility (Duke Energy Carolinas LLC), Eden, NC Facility ID: 7900015 Current Air Quality Permit 03455T30 Affected Electric Utility Generating Units (EGUs) Two nominal 170 MW (GE Model 7FA) natural gas-fired combined-cycle combustion turbines rated at 1984.1 million Btu per hour maximum heat input each, equipped a heat recovery steam generator with natural gas-fired duct burners rated at 620 million Btu per hour heat input each (ID Nos. ES-11 and ES-12). The two turbines and steam generators are rated at a total of 691.1 MW (nameplate capacity).
1. Introduction The United States Environmental Protection Agency (EPA) has adopted Emission Guidelines for Greenhouse Gas Emissions and Compliance Times for Electric Utility Generating Units on August 3, 2015 and codified it in 40 CFR Subpart UUUU. The affected electric utility steam generating units (EGUs) under these emission guidelines (EG) are steam generating units, integrated gasification combined cycle units (IGCC), and stationary combined cycle or combined heat and power (CHP) combustion turbines that commenced construction on or before January 8, 2014. The EG includes uniform, nationwide emission standards, which are performance-based rates for emissions of greenhouse gases (GHG) expressed as CO2 (lb CO2/net MWh), as follows: Fossil fuel-fired steam generating units or IGCC: 1,534 lb CO2/net MWh (interim, average of 2022-
2029), 1,305 lb CO2/net MWh (final, starting 2030)
Natural gas-fired stationary combined cycle combustion turbines (including CHP combustion turbines): 832 lb/net MWh (interim, average of 2022-2029), 771 lb/MWh (final, starting 2030)
In lieu of the above uniform rates, each EGU can comply with state-specific goal (lb CO2/net MWh). The other option is that all affected units in the state, in aggregate, comply with the mass-based state goal (short tons/yr). For North Carolina (NC), the rate-based interim and final goals are 1,311 lb CO2/net MWh and 1,136 lb CO2/net MWh, respectively. Similarly, NC’s mass-based interim and final goals are 56,986,025 short tons/yr and 51,266,234 short tons/yr, respectively.
DanRiver-Page 1 of 5
Attachment B B-193Attachment B B-193

2
The above standards (whether uniform nationwide rates or state-specific goals) are based upon the determination of Best System of Emissions Reduction (BSER) consisting of following three building blocks: Building Block 1 (BB1) - reducing the carbon intensity of electricity generation by improving the
heat rate of existing coal-fired power plants.
Building Block 2 (BB2) - substituting increased electricity generation from lower-emitting existing natural gas plants for reduced generation from higher-emitting coal-fired power plants.
Building Block 3 (BB3) - substituting increased electricity generation from new zero-emitting renewable energy sources (like wind and solar) for reduced generation from existing coal-fired power plants.
The EG requires that each state submit its plan complying with all applicable requirements by the deadline included therein. One of the requirements consist of development of emission standard (“standard of performance”) and establishment of compliance time for each EGU. The Clean Air Act (CAA) §111(a)(1) defines “standard of performance” as “a standard for emissions of air pollutants which reflects the degree of emission limitation achievable through the application of the best system of emission reduction which (taking into account the cost of achieving such reduction and any non-air quality health and environmental impact and energy requirements) the Administrator determines has been adequately demonstrated”.
2. History of Development of Emission Guidelines under CAA Over the last 40 years, under §111(d), the EPA has regulated four pollutants from five source categories, by promulgating associated EG. These source categories are phosphate fertilizer plants (fluorides), sulfuric acid plants (acid mist), Kraft pulp plants (total reduced sulfur (TRS)), primary aluminum plants (fluorides), and municipal solid waste landfills (landfill gas emissions as non-methane organic compounds (NMOCs))1. The following general principles / rationales were used by EPA in establishing BSER for these EGs: The degree of emission reduction achievable through the application of various demonstrated control
technologies.
The technical feasibility of applying various demonstrated technologies to existing sources considering variability in sizes and designs.
The impact of various demonstrated technologies on national energy consumption, water pollution,
waste disposal, and ambient air concentrations of a designated pollutant.
1 See Footnote 18 at 79 FR 41776, July 17, 2014, including ‘‘Phosphate Fertilizer Plants; Final Guideline Document Availability,’’ 42 FR 12022 (March 1, 1977); ‘‘Standards of Performance for New Stationary Sources; Emission Guideline for Sulfuric Acid Mist,’’ 42 FR 55796 (October 18, 1977); ‘‘Kraft Pulp Mills, Notice of Availability of Final Guideline Document,’’ 44 FR 29828 (May 22, 1979); ‘‘Primary Aluminum Plants; Availability of Final Guideline Document,’’ 45 FR 26294 (April 17, 1980); ‘‘Standards of Performance for New Stationary Sources and Guidelines for Control of Existing Sources: Municipal Solid Waste Landfills, Final Rule,’’ 61 FR 9905 (March 12, 1996).
DanRiver-Page 2 of 5
Attachment B B-194Attachment B B-194

3
The cost of adopting the emission guidelines, after considering control costs for various demonstrated technologies and taking into account the level of any existing controls.
Each of these EGs indicates that the cost of applying various control technologies can have a considerable impact in selection of a BSER for any designated pollutant for existing facilities. They also indicate that the age, size, type, class, and process design of the facility, influence not only the BSER selection process, but can also support a decision-making for whether different EGs are to be established for differing sizes, types, or classes of equipment. The EGs for the above referenced source categories have been established for principal points of emissions (point and fugitive emissions sources) located within the facility and, not for any emissions sources located outside of the facility. Finally, in these EGs, with respect to determining the EG, EPA has consistently recognized that not only the control technology needs to be demonstrated on existing sources, but the degree of emission reduction (performance level) needs to be readily achievable by the control technology.
3. The Division of Air Quality (DAQ)’s Approach for Determination of BSER The DAQ will consider the above general principles in determining BSER for CO2 emissions reduction from each EGU. But, importantly, DAQ will determine BSER for each EGU based upon BB1-type measures only (i.e., measures which can be accomplished within the fence-line of the facility), conforming to the §111(d) of the CAA and the requirements of 40 CFR 60 “Adoption and Submittal of State Plans for Designated Facilities”. Thus, DAQ’s approach will comprise of improving the operational efficiency of the EGUs in order to reduce CO2 emissions from the 2012 baseline levels. The DAQ’s BSER evaluation is based on the following parameters: type of EGU remaining useful life of the EGU unit’s baseline data (net heat rate, net generation, annual capacity factor, and CO2 emissions) unit’s projected future capacity factor whether the measure is adequately demonstrated to reduce heat rate feasibility of applying a specific heat rate improvement measure on a given unit degree of heat rate reduction potential for a specific feasible heat rate improvement measure site-specific limitations associated costs (capital, fixed and variable operational and maintenance (O&M), and fuel
savings) cost per ton of CO2 reduction
The evaluation is also based on literature review2 of technical feasibility for various heat rate improvement measures, degree of heat rate reduction potential, and costs data (capital, and fixed and variable O&M).
2 “Coal-fired Power Plant Heat Rate Reductions”, Final Report, Sargent & Lundy, Chicago, IL, January 22, 2009. “Analysis of Heat Rate Improvement Potential at Coal-Fired Power Plants”, US Energy Information Administration, Washington, DC, May 2015. S. Corellis, “Range and Applicability of Heat Rate Improvements”, Technical Update, Electric Power Research Institute, Palo Alto, CA, April 2014.
DanRiver-Page 3 of 5
Attachment B B-195Attachment B B-195

4
It needs to be emphasized here that DAQ’s determination for each EGU will not be based upon some pre-determined heat rate improvement target, such as EPA’s selection of a 4.3% heat rate improvement potential for EGUs in the Eastern interconnection3, as discussed in the EG. The DAQ’s approach will include those adequately demonstrated, cost-effective measures that assure that the electricity is generated with lower CO2 emissions, thus improving public health and welfare. The selected heat rate improvement measures would be expected to produce non-air environmental co-benefits in the form of reduced water usage and solid waste production, in addition to, reductions in emissions of non-GHG pollutants such as SO2, NOx, and mercury. However, it should be noted that if the unit (EGU) is utilized more often after implementing heat rate improvement measure(s) (as it becomes more competitive due to fuel consumption and economic standpoints), some increases in emissions of GHG (as CO2) and similarly, for non-GHG pollutants (such as SO2, NOx, or mercury) are possible, and those could partially offset the emissions reductions achieved for GHG (as CO2) and non-GHG (such as SO2, NOx, or mercury). EPA has determined a cost estimate of $23 per ton4 reasonable for CO2 emissions reduction from EGUs under BB1 implementing heat rate improvement measures. EPA has further determined that this cost is reasonable because it achieves “an appropriate balance between cost and amount of reductions.”5 In addition, EPA has used another benchmark in the form of social cost of carbon (SC-CO2) at $40 per ton (2020) to $48 per ton (2030)6 to conclude that the above $23 per ton cost is reasonable. The DAQ will use the above cost effectiveness threshold of $23 per ton to determine reasonableness of cost for each of the technically feasible measure in determining BSER for a particular EGU.
4. BSER Evaluation
Duke Energy Carolinas LLC (DEC) has submitted a BSER analysis for the EGUs at this facility showing three possible measures that are available to improve heat rate along with associated estimated reductions in heat rate, costs (capital, and operation and maintenance), and other information. In the final Clean Power Plan rule (40 CFR 60 Subpart UUUU) for existing EGUs, EPA “considered heat rate improvement opportunities at oil- and gas-fired steam EGUs and NGCC units and found that the available emission reductions would likely be more expensive or too small to merit consideration as a material component of the BSER.”7 3 Applies to coal-fired EGUs only. 4 See page 446 of 1560 (pre-publication version), Carbon Pollution Emission Guidelines for Existing Stationary Sources: Electric Utility Generating Units Clean Power Plan, August 3, 2015. Based on nation-wide coal fleet capacity of 213 GW, heat rate improvement capital cost of $100/KW, capital charge rate of 14.3%, fleet-wide baseline net heat rate of 10,250 Btu/KWh, heat rate improvement of 4% for coal-fired EGUs, annual capacity factor of 78%, and future (2030) average coal delivered cost of $2.70 per million Btu. See page 2-65, Greenhouse Gas Mitigation Measures, Technical Support Document (TSD) for Carbon Pollution Guidelines for Existing Power Plants”, August 3, 2015. 5 See page 457 of 1560 (pre-publication version), Ibid. 6 See pages 458 and 459 of 1560 (pre-publication version), Ibid. 7 See page 336-337 of 1560 (pre-publication version), Ibid.
DanRiver-Page 4 of 5
Attachment B B-196Attachment B B-196

5
In New Source Performance Standards for new, modified, and reconstructed EGUs (40 CFR Part 60 Subpart TTTT), EPA stated, “For newly constructed and reconstructed base load natural gas-fired stationary combustion turbines, the BSER is the use of efficient NGCC technology. For newly constructed and reconstructed non-base load natural gas-fired stationary combustion turbines, the BSER is the use of clean fuels (i.e., natural gas with an allowance for a small amount of distillate oil). For multi-fuel-fired stationary combustion turbines, the BSER is also the use of clean fuels (e.g., natural gas, ethylene, propane, naphtha, jet fuel kerosene, distillate oils 1 and 2, biodiesel, and landfill gas).”8 Based on the above EPA determinations, regardless of information provided by Duke on technically feasible heat improvement measures, DAQ believes that efficient NGCC technology combined with the use of natural gas9 is BSER for EGUs at the Dan River Combined Cycle Facility.
5. BSER for Units ES-11 and ES-12 DEC shall continue to implement efficient NGCC technology and burn only natural gas starting September 1, 2019, at this facility.
8 See page 462 of 768, Standards of Performance for Greenhouse Gas Emissions from New, Modified, and Reconstructed Stationary Sources: Electric Utility Generating Units, August 3, 2015. 9 Dan River EGUs burn natural gas only.
DanRiver-Page 5 of 5
Attachment B B-197Attachment B B-197

1
North Carolina Department of Environmental Quality Division of Air Quality
Supporting Basis
Determination of Best System of Emissions Reduction for CO2 Emissions from Existing Electric Utility Generating Units
October 23, 2015
Facility H. F. Lee Steam Electric Plant (Duke Energy Progress), Goldsboro, NC Facility ID: 9600017 Current Air Quality Permit 01812T40 Affected Electric Utility Generating Units (EGUs) Three natural gas/No. 2 fuel oil-fired simple/combined-cycle internal combustion turbines, each equipped with a heat recovery steam generator with natural gas-fired duct burner, rated at 2,224 million Btu per hour heat input rate each when firing natural gas, and 2,153 million Btu per hour heat input rate each when firing No. 2 fuel oil in the simple-cycle mode; and rated at 2,248 million Btu per hour heat input rate each and 453 million Btu per hour heat input rate (each duct burner) when firing natural gas and 2,153 million Btu per hour heat input rate each with no duct burner firing when firing No. 2 fuel oil in the combined-cycle mode (ID Nos. Lee IC Unit No. 1A, Lee IC Unit No. 1B and Lee IC Unit No. 1C). The three turbines and steam generators are rated at a total of 1068 MW (nameplate capacity).
1. Introduction The United States Environmental Protection Agency (EPA) has adopted Emission Guidelines for Greenhouse Gas Emissions and Compliance Times for Electric Utility Generating Units on August 3, 2015 and codified it in 40 CFR Subpart UUUU. The affected electric utility steam generating units (EGUs) under these emission guidelines (EG) are steam generating units, integrated gasification combined cycle units (IGCC), and stationary combined cycle or combined heat and power (CHP) combustion turbines that commenced construction on or before January 8, 2014. The EG includes uniform, nationwide emission standards, which are performance-based rates for emissions of greenhouse gases (GHG) expressed as CO2 (lb CO2/net MWh), as follows: Fossil fuel-fired steam generating units or IGCC: 1,534 lb CO2/net MWh (interim, average of 2022-
2029), 1,305 lb CO2/net MWh (final, starting 2030)
Natural gas-fired stationary combined cycle combustion turbines (including CHP combustion turbines): 832 lb/net MWh (interim, average of 2022-2029), 771 lb/MWh (final, starting 2030)
In lieu of the above uniform rates, each EGU can comply with state-specific goal (lb CO2/net MWh). The other option is that all affected units in the state, in aggregate, comply with the mass-based state goal (short tons/yr).
Lee-Page 1 of 5
Attachment B B-198Attachment B B-198

2
For North Carolina (NC), the rate-based interim and final goals are 1,311 lb CO2/net MWh and 1,136 lb CO2/net MWh, respectively. Similarly, NC’s mass-based interim and final goals are 56,986,025 short tons/yr and 51,266,234 short tons/yr, respectively. The above standards (whether uniform nationwide rates or state-specific goals) are based upon the determination of Best System of Emissions Reduction (BSER) consisting of following three building blocks: Building Block 1 (BB1) - reducing the carbon intensity of electricity generation by improving the
heat rate of existing coal-fired power plants.
Building Block 2 (BB2) - substituting increased electricity generation from lower-emitting existing natural gas plants for reduced generation from higher-emitting coal-fired power plants.
Building Block 3 (BB3) - substituting increased electricity generation from new zero-emitting renewable energy sources (like wind and solar) for reduced generation from existing coal-fired power plants.
The EG requires that each state submit its plan complying with all applicable requirements by the deadline included therein. One of the requirements consist of development of emission standard (“standard of performance”) and establishment of compliance time for each EGU. The Clean Air Act (CAA) §111(a)(1) defines “standard of performance” as “a standard for emissions of air pollutants which reflects the degree of emission limitation achievable through the application of the best system of emission reduction which (taking into account the cost of achieving such reduction and any non-air quality health and environmental impact and energy requirements) the Administrator determines has been adequately demonstrated”.
2. History of Development of Emission Guidelines under CAA Over the last 40 years, under §111(d), the EPA has regulated four pollutants from five source categories, by promulgating associated EG. These source categories are phosphate fertilizer plants (fluorides), sulfuric acid plants (acid mist), Kraft pulp plants (total reduced sulfur (TRS)), primary aluminum plants (fluorides), and municipal solid waste landfills (landfill gas emissions as non-methane organic compounds (NMOCs))1. The following general principles / rationales were used by EPA in establishing BSER for these EGs: The degree of emission reduction achievable through the application of various demonstrated control
technologies.
The technical feasibility of applying various demonstrated technologies to existing sources considering variability in sizes and designs.
1 See Footnote 18 at 79 FR 41776, July 17, 2014, including ‘‘Phosphate Fertilizer Plants; Final Guideline Document Availability,’’ 42 FR 12022 (March 1, 1977); ‘‘Standards of Performance for New Stationary Sources; Emission Guideline for Sulfuric Acid Mist,’’ 42 FR 55796 (October 18, 1977); ‘‘Kraft Pulp Mills, Notice of Availability of Final Guideline Document,’’ 44 FR 29828 (May 22, 1979); ‘‘Primary Aluminum Plants; Availability of Final Guideline Document,’’ 45 FR 26294 (April 17, 1980); ‘‘Standards of Performance for New Stationary Sources and Guidelines for Control of Existing Sources: Municipal Solid Waste Landfills, Final Rule,’’ 61 FR 9905 (March 12, 1996).
Lee-Page 2 of 5
Attachment B B-199Attachment B B-199

3
The impact of various demonstrated technologies on national energy consumption, water pollution, waste disposal, and ambient air concentrations of a designated pollutant.
The cost of adopting the emission guidelines, after considering control costs for various demonstrated technologies and taking into account the level of any existing controls.
Each of these EGs indicates that the cost of applying various control technologies can have a considerable impact in selection of a BSER for any designated pollutant for existing facilities. They also indicate that the age, size, type, class, and process design of the facility, influence not only the BSER selection process, but can also support a decision-making for whether different EGs are to be established for differing sizes, types, or classes of equipment. The EGs for the above referenced source categories have been established for principal points of emissions (point and fugitive emissions sources) located within the facility and, not for any emissions sources located outside of the facility. Finally, in these EGs, with respect to determining the EG, EPA has consistently recognized that not only the control technology needs to be demonstrated on existing sources, but the degree of emission reduction (performance level) needs to be readily achievable by the control technology.
3. The Division of Air Quality (DAQ)’s Approach for Determination of BSER The DAQ will consider the above general principles in determining BSER for CO2 emissions reduction from each EGU. But, importantly, DAQ will determine BSER for each EGU based upon BB1-type measures only (i.e., measures which can be accomplished within the fence-line of the facility), conforming to the §111(d) of the CAA and the requirements of 40 CFR 60 “Adoption and Submittal of State Plans for Designated Facilities”. Thus, DAQ’s approach will comprise of improving the operational efficiency of the EGUs in order to reduce CO2 emissions from the 2012 baseline levels. The DAQ’s BSER evaluation is based on the following parameters: type of EGU remaining useful life of the EGU unit’s baseline data (net heat rate, net generation, annual capacity factor, and CO2 emissions) unit’s projected future capacity factor whether the measure is adequately demonstrated to reduce heat rate feasibility of applying a specific heat rate improvement measure on a given unit degree of heat rate reduction potential for a specific feasible heat rate improvement measure site-specific limitations associated costs (capital, fixed and variable operational and maintenance (O&M), and fuel
savings) cost per ton of CO2 reduction
The evaluation is also based on literature review2 of technical feasibility for various heat rate improvement measures, degree of heat rate reduction potential, and costs data (capital, and fixed and variable O&M).
2 “Coal-fired Power Plant Heat Rate Reductions”, Final Report, Sargent & Lundy, Chicago, IL, January 22, 2009. “Analysis of Heat Rate Improvement Potential at Coal-Fired Power Plants”, US Energy Information Administration, Washington, DC, May 2015.
Lee-Page 3 of 5
Attachment B B-200Attachment B B-200

4
It needs to be emphasized here that DAQ’s determination for each EGU will not be based upon some pre-determined heat rate improvement target, such as EPA’s selection of a 4.3% heat rate improvement potential for EGUs in the Eastern interconnection3, as discussed in the EG. The DAQ’s approach will include those adequately demonstrated, cost-effective measures that assure that the electricity is generated with lower CO2 emissions, thus improving public health and welfare. The selected heat rate improvement measures would be expected to produce non-air environmental co-benefits in the form of reduced water usage and solid waste production, in addition to, reductions in emissions of non-GHG pollutants such as SO2, NOx, and mercury. However, it should be noted that if the unit (EGU) is utilized more often after implementing heat rate improvement measure(s) (as it becomes more competitive due to fuel consumption and economic standpoints), some increases in emissions of GHG (as CO2) and similarly, for non-GHG pollutants (such as SO2, NOx, or mercury) are possible, and those could partially offset the emissions reductions achieved for GHG (as CO2) and non-GHG (such as SO2, NOx, or mercury). EPA has determined a cost estimate of $23 per ton4 reasonable for CO2 emissions reduction from EGUs under BB1 implementing heat rate improvement measures. EPA has further determined that this cost is reasonable because it achieves “an appropriate balance between cost and amount of reductions.”5 In addition, EPA has used another benchmark in the form of social cost of carbon (SC-CO2) at $40 per ton (2020) to $48 per ton (2030)6 to conclude that the above $23 per ton cost is reasonable. The DAQ will use the above cost effectiveness threshold of $23 per ton to determine reasonableness of cost for each of the technically feasible measure in determining BSER for a particular EGU.
4. BSER Evaluation
Duke Energy Carolinas LLC (Duke) has submitted a BSER analysis for the EGUs at this facility showing five possible measures that are available to improve heat rate along with associated estimated reductions in heat rate, costs (capital, and operation and maintenance), and other information. In the final Clean Power Plan rule (40 CFR 60 Subpart UUUU) for existing EGUs, EPA “considered heat rate improvement opportunities at oil- and gas-fired steam EGUs and NGCC units and found that
S. Corellis, “Range and Applicability of Heat Rate Improvements”, Technical Update, Electric Power Research Institute, Palo Alto, CA, April 2014. 3 Applies to coal-fired EGUs only. 4 See page 446 of 1560 (pre-publication version), Carbon Pollution Emission Guidelines for Existing Stationary Sources: Electric Utility Generating Units Clean Power Plan, August 3, 2015. Based on nation-wide coal fleet capacity of 213 GW, heat rate improvement capital cost of $100/KW, capital charge rate of 14.3%, fleet-wide baseline net heat rate of 10,250 Btu/KWh, heat rate improvement of 4% for coal-fired EGUs, annual capacity factor of 78%, and future (2030) average coal delivered cost of $2.70 per million Btu. See page 2-65, Greenhouse Gas Mitigation Measures, Technical Support Document (TSD) for Carbon Pollution Guidelines for Existing Power Plants”, August 3, 2015. 5 See page 457 of 1560 (pre-publication version), Ibid. 6 See pages 458 and 459 of 1560 (pre-publication version), Ibid.
Lee-Page 4 of 5
Attachment B B-201Attachment B B-201

5
the available emission reductions would likely be more expensive or too small to merit consideration as a material component of the BSER.”7 In New Source Performance Standards for new, modified, and reconstructed EGUs (40 CFR Part 60 Subpart TTTT), EPA stated, “For newly constructed and reconstructed base load natural gas-fired stationary combustion turbines, the BSER is the use of efficient NGCC technology. For newly constructed and reconstructed non-base load natural gas-fired stationary combustion turbines, the BSER is the use of clean fuels (i.e., natural gas with an allowance for a small amount of distillate oil). For multi-fuel-fired stationary combustion turbines, the BSER is also the use of clean fuels (e.g., natural gas, ethylene, propane, naphtha, jet fuel kerosene, distillate oils 1 and 2, biodiesel, and landfill gas).”8 Based on the above EPA determinations, DAQ believes that efficient NGCC technology combined with the use of clean fuels (natural gas and distillate fuel) is BSER for EGUs at the H. F. Lee Steam Electric Plant.
5. BSER for Units Lee IC Unit No. 1A, Lee IC Unit No. 1B and Lee IC Unit No. 1C Duke shall continue to implement efficient NGCC technology and burn only clean fuels (natural gas, distillate fuel) starting September 1, 2019.
7 See page 336-337 of 1560 (pre-publication version), Ibid. 8 See page 462 of 768, Standards of Performance for Greenhouse Gas Emissions from New, Modified, and Reconstructed Stationary Sources: Electric Utility Generating Units, August 3, 2015.
Lee-Page 5 of 5
Attachment B B-202Attachment B B-202

1
North Carolina Department of Environmental Quality Division of Air Quality
Supporting Basis
Determination of Best System of Emissions Reduction for CO2 Emissions from Existing Electric Utility Generating Units
October 23, 2015
Facility L.V. Sutton Electric Plant (Duke Energy Progress), Wilmington, NC Facility ID: 6500036 Current Air Quality Permit 01318T30 Affected Electric Utility Generating Units (EGUs) Two natural gas/No. 2 fuel oil-fired simple/combined-cycle internal combustion turbines, each equipped with a heat recovery steam generator with natural gas-fired duct burner, rated at 2,224 million Btu per hour heat input rate each when firing natural gas, and 2,153 million Btu per hour heat input rate each when firing No. 2 fuel oil in the simple-cycle mode; and rated at 2,264 million Btu per hour heat input rate each and 453 million Btu per hour heat input rate (each duct burner) when firing natural gas and 2,153 million Btu per hour heat input rate each with no duct burner firing when firing No. 2 fuel oil in the combined-cycle mode (ID Nos. Turbine 1A and Turbine 1B). The two turbines and steam generators are rated at a total of 625 MW (nameplate capacity).
1. Introduction The United States Environmental Protection Agency (EPA) has adopted Emission Guidelines for Greenhouse Gas Emissions and Compliance Times for Electric Utility Generating Units on August 3, 2015 and codified it in 40 CFR Subpart UUUU. The affected electric utility steam generating units (EGUs) under these emission guidelines (EG) are steam generating units, integrated gasification combined cycle units (IGCC), and stationary combined cycle or combined heat and power (CHP) combustion turbines that commenced construction on or before January 8, 2014. The EG includes uniform, nationwide emission standards, which are performance-based rates for emissions of greenhouse gases (GHG) expressed as CO2 (lb CO2/net MWh), as follows: Fossil fuel-fired steam generating units or IGCC: 1,534 lb CO2/net MWh (interim, average of 2022-
2029), 1,305 lb CO2/net MWh (final, starting 2030)
Natural gas-fired stationary combined cycle combustion turbines (including CHP combustion turbines): 832 lb/net MWh (interim, average of 2022-2029), 771 lb/MWh (final, starting 2030)
In lieu of the above uniform rates, each EGU can comply with state-specific goal (lb CO2/net MWh). The other option is that all affected units in the state, in aggregate, comply with the mass-based state goal (short tons/yr).
Sutton-Page 1 of 5
Attachment B B-203Attachment B B-203

2
For North Carolina (NC), the rate-based interim and final goals are 1,311 lb CO2/net MWh and 1,136 lb CO2/net MWh, respectively. Similarly, NC’s mass-based interim and final goals are 56,986,025 short tons/yr and 51,266,234 short tons/yr, respectively. The above standards (whether uniform nationwide rates or state-specific goals) are based upon the determination of Best System of Emissions Reduction (BSER) consisting of following three building blocks: Building Block 1 (BB1) - reducing the carbon intensity of electricity generation by improving the
heat rate of existing coal-fired power plants.
Building Block 2 (BB2) - substituting increased electricity generation from lower-emitting existing natural gas plants for reduced generation from higher-emitting coal-fired power plants.
Building Block 3 (BB3) - substituting increased electricity generation from new zero-emitting renewable energy sources (like wind and solar) for reduced generation from existing coal-fired power plants.
The EG requires that each state submit its plan complying with all applicable requirements by the deadline included therein. One of the requirements consist of development of emission standard (“standard of performance”) and establishment of compliance time for each EGU. The Clean Air Act (CAA) §111(a)(1) defines “standard of performance” as “a standard for emissions of air pollutants which reflects the degree of emission limitation achievable through the application of the best system of emission reduction which (taking into account the cost of achieving such reduction and any non-air quality health and environmental impact and energy requirements) the Administrator determines has been adequately demonstrated”.
2. History of Development of Emission Guidelines under CAA Over the last 40 years, under §111(d), the EPA has regulated four pollutants from five source categories, by promulgating associated EG. These source categories are phosphate fertilizer plants (fluorides), sulfuric acid plants (acid mist), Kraft pulp plants (total reduced sulfur (TRS)), primary aluminum plants (fluorides), and municipal solid waste landfills (landfill gas emissions as non-methane organic compounds (NMOCs))1. The following general principles / rationales were used by EPA in establishing BSER for these EGs: The degree of emission reduction achievable through the application of various demonstrated control
technologies.
The technical feasibility of applying various demonstrated technologies to existing sources considering variability in sizes and designs.
1 See Footnote 18 at 79 FR 41776, July 17, 2014, including ‘‘Phosphate Fertilizer Plants; Final Guideline Document Availability,’’ 42 FR 12022 (March 1, 1977); ‘‘Standards of Performance for New Stationary Sources; Emission Guideline for Sulfuric Acid Mist,’’ 42 FR 55796 (October 18, 1977); ‘‘Kraft Pulp Mills, Notice of Availability of Final Guideline Document,’’ 44 FR 29828 (May 22, 1979); ‘‘Primary Aluminum Plants; Availability of Final Guideline Document,’’ 45 FR 26294 (April 17, 1980); ‘‘Standards of Performance for New Stationary Sources and Guidelines for Control of Existing Sources: Municipal Solid Waste Landfills, Final Rule,’’ 61 FR 9905 (March 12, 1996).
Sutton-Page 2 of 5
Attachment B B-204Attachment B B-204

3
The impact of various demonstrated technologies on national energy consumption, water pollution, waste disposal, and ambient air concentrations of a designated pollutant.
The cost of adopting the emission guidelines, after considering control costs for various demonstrated technologies and taking into account the level of any existing controls.
Each of these EGs indicates that the cost of applying various control technologies can have a considerable impact in selection of a BSER for any designated pollutant for existing facilities. They also indicate that the age, size, type, class, and process design of the facility, influence not only the BSER selection process, but can also support a decision-making for whether different EGs are to be established for differing sizes, types, or classes of equipment. The EGs for the above referenced source categories have been established for principal points of emissions (point and fugitive emissions sources) located within the facility and, not for any emissions sources located outside of the facility. Finally, in these EGs, with respect to determining the EG, EPA has consistently recognized that not only the control technology needs to be demonstrated on existing sources, but the degree of emission reduction (performance level) needs to be readily achievable by the control technology.
3. The Division of Air Quality (DAQ)’s Approach for Determination of BSER The DAQ will consider the above general principles in determining BSER for CO2 emissions reduction from each EGU. But, importantly, DAQ will determine BSER for each EGU based upon BB1-type measures only (i.e., measures which can be accomplished within the fence-line of the facility), conforming to the §111(d) of the CAA and the requirements of 40 CFR 60 “Adoption and Submittal of State Plans for Designated Facilities”. Thus, DAQ’s approach will comprise of improving the operational efficiency of the EGUs in order to reduce CO2 emissions from the 2012 baseline levels. The DAQ’s BSER evaluation is based on the following parameters: type of EGU remaining useful life of the EGU unit’s baseline data (net heat rate, net generation, annual capacity factor, and CO2 emissions) unit’s projected future capacity factor whether the measure is adequately demonstrated to reduce heat rate feasibility of applying a specific heat rate improvement measure on a given unit degree of heat rate reduction potential for a specific feasible heat rate improvement measure site-specific limitations associated costs (capital, fixed and variable operational and maintenance (O&M), and fuel
savings) cost per ton of CO2 reduction
The evaluation is also based on literature review2 of technical feasibility for various heat rate improvement measures, degree of heat rate reduction potential, and costs data (capital, and fixed and variable O&M).
2 “Coal-fired Power Plant Heat Rate Reductions”, Final Report, Sargent & Lundy, Chicago, IL, January 22, 2009. “Analysis of Heat Rate Improvement Potential at Coal-Fired Power Plants”, US Energy Information Administration, Washington, DC, May 2015.
Sutton-Page 3 of 5
Attachment B B-205Attachment B B-205

4
It needs to be emphasized here that DAQ’s determination for each EGU will not be based upon some pre-determined heat rate improvement target, such as EPA’s selection of a 4.3% heat rate improvement potential for EGUs in the Eastern interconnection3, as discussed in the EG. The DAQ’s approach will include those adequately demonstrated, cost-effective measures that assure that the electricity is generated with lower CO2 emissions, thus improving public health and welfare. The selected heat rate improvement measures would be expected to produce non-air environmental co-benefits in the form of reduced water usage and solid waste production, in addition to, reductions in emissions of non-GHG pollutants such as SO2, NOx, and mercury. However, it should be noted that if the unit (EGU) is utilized more often after implementing heat rate improvement measure(s) (as it becomes more competitive due to fuel consumption and economic standpoints), some increases in emissions of GHG (as CO2) and similarly, for non-GHG pollutants (such as SO2, NOx, or mercury) are possible, and those could partially offset the emissions reductions achieved for GHG (as CO2) and non-GHG (such as SO2, NOx, or mercury). EPA has determined a cost estimate of $23 per ton4 reasonable for CO2 emissions reduction from EGUs under BB1 implementing heat rate improvement measures. EPA has further determined that this cost is reasonable because it achieves “an appropriate balance between cost and amount of reductions.”5 In addition, EPA has used another benchmark in the form of social cost of carbon (SC-CO2) at $40 per ton (2020) to $48 per ton (2030)6 to conclude that the above $23 per ton cost is reasonable. The DAQ will use the above cost effectiveness threshold of $23 per ton to determine reasonableness of cost for each of the technically feasible measure in determining BSER for a particular EGU.
4. BSER Evaluation
Duke Energy Carolinas LLC (Duke) has submitted a BSER analysis for the EGUs at this facility showing four possible measures that are available to improve heat rate along with associated estimated reductions in heat rate, costs (capital, and operation and maintenance), and other information. In the final Clean Power Plan rule (40 CFR 60 Subpart UUUU) for existing EGUs, EPA “considered heat rate improvement opportunities at oil- and gas-fired steam EGUs and NGCC units and found that
S. Corellis, “Range and Applicability of Heat Rate Improvements”, Technical Update, Electric Power Research Institute, Palo Alto, CA, April 2014. 3 Applies to coal-fired EGUs only. 4 See page 446 of 1560 (pre-publication version), Carbon Pollution Emission Guidelines for Existing Stationary Sources: Electric Utility Generating Units Clean Power Plan, August 3, 2015. Based on nation-wide coal fleet capacity of 213 GW, heat rate improvement capital cost of $100/KW, capital charge rate of 14.3%, fleet-wide baseline net heat rate of 10,250 Btu/KWh, heat rate improvement of 4% for coal-fired EGUs, annual capacity factor of 78%, and future (2030) average coal delivered cost of $2.70 per million Btu. See page 2-65, Greenhouse Gas Mitigation Measures, Technical Support Document (TSD) for Carbon Pollution Guidelines for Existing Power Plants”, August 3, 2015. 5 See page 457 of 1560 (pre-publication version), Ibid. 6 See pages 458 and 459 of 1560 (pre-publication version), Ibid.
Sutton-Page 4 of 5
Attachment B B-206Attachment B B-206

5
the available emission reductions would likely be more expensive or too small to merit consideration as a material component of the BSER.”7 In New Source Performance Standards for new, modified, and reconstructed EGUs (40 CFR Part 60 Subpart TTTT), EPA stated, “For newly constructed and reconstructed base load natural gas-fired stationary combustion turbines, the BSER is the use of efficient NGCC technology. For newly constructed and reconstructed non-base load natural gas-fired stationary combustion turbines, the BSER is the use of clean fuels (i.e., natural gas with an allowance for a small amount of distillate oil). For multi-fuel-fired stationary combustion turbines, the BSER is also the use of clean fuels (e.g., natural gas, ethylene, propane, naphtha, jet fuel kerosene, distillate oils 1 and 2, biodiesel, and landfill gas).”8 Based on the above EPA determinations, DAQ believes that efficient NGCC technology combined with the use of clean fuels (natural gas and distillate fuel) is BSER for EGUs at the L.V. Sutton Electric Plant.
5. BSER for Units Turbine 1A and Turbine 1B Duke shall continue to implement efficient NGCC technology and burn only clean fuels (natural gas, distillate fuel) starting September 1, 2019.
7 See page 336-337 of 1560 (pre-publication version), Ibid. 8 See page 462 of 768, Standards of Performance for Greenhouse Gas Emissions from New, Modified, and Reconstructed Stationary Sources: Electric Utility Generating Units, August 3, 2015.
Sutton-Page 5 of 5
Attachment B B-207Attachment B B-207

1
North Carolina Department of Environmental Quality Division of Air Quality
Supporting Basis
Determination of Best System of Emissions Reduction for CO2 Emissions from Existing Electric Utility Generating Units
October 23, 2015
Facility Richmond County Combustion Turbine Facility (Duke Energy Progress), Hamlet, NC Facility ID: 7700070 Current Air Quality Permit 08759T17 Affected Electric Utility Generating Units (EGUs) Two natural gas/No. 2 fuel oil-fired combined-cycle internal combustion turbines, each equipped with a heat recovery steam generator and a steam turbine nominally rated at 1,628 million Btu per hour heat input each when firing natural gas, and 1,819 million Btu per hour heat input each when firing No. 2 fuel oil (ID Nos. Unit 7 and Unit 8); and Two natural gas/No. 2 fuel oil-fired simple/combined cycle internal combustion turbines, each equipped with a heat recovery steam generator with natural gas-fired duct burner, rated at 2,084 million Btu per hour heat input rate each when firing natural gas and 1,983 million Btu per hour heat input rate each when firing No. 2 fuel oil in the simple-cycle mode; and rated at 2,225 million Btu per hour heat input rate each when firing natural gas and 390 million Btu per hour heat input rate (each duct burner) when firing natural gas and 1,983 million Btu per hour heat input rate each with no duct burner firing when firing No. 2 fuel and in the combined-cycle mode (ID Nos. ES-13 and ES-14). The four turbines and two steam generators are rated at a total of 1239.3 MW (nameplate capacity).
1. Introduction The United States Environmental Protection Agency (EPA) has adopted Emission Guidelines for Greenhouse Gas Emissions and Compliance Times for Electric Utility Generating Units on August 3, 2015 and codified it in 40 CFR Subpart UUUU. The affected electric utility steam generating units (EGUs) under these emission guidelines (EG) are steam generating units, integrated gasification combined cycle units (IGCC), and stationary combined cycle or combined heat and power (CHP) combustion turbines that commenced construction on or before January 8, 2014. The EG includes uniform, nationwide emission standards, which are performance-based rates for emissions of greenhouse gases (GHG) expressed as CO2 (lb CO2/net MWh), as follows: Fossil fuel-fired steam generating units or IGCC: 1,534 lb CO2/net MWh (interim, average of 2022-
2029), 1,305 lb CO2/net MWh (final, starting 2030)
Natural gas-fired stationary combined cycle combustion turbines (including CHP combustion turbines): 832 lb/net MWh (interim, average of 2022-2029), 771 lb/MWh (final, starting 2030)
Smith-Page 1 of 5
Attachment B B-208Attachment B B-208

2
In lieu of the above uniform rates, each EGU can comply with state-specific goal (lb CO2/net MWh). The other option is that all affected units in the state, in aggregate, comply with the mass-based state goal (short tons/yr). For North Carolina (NC), the rate-based interim and final goals are 1,311 lb CO2/net MWh and 1,136 lb CO2/net MWh, respectively. Similarly, NC’s mass-based interim and final goals are 56,986,025 short tons/yr and 51,266,234 short tons/yr, respectively. The above standards (whether uniform nationwide rates or state-specific goals) are based upon the determination of Best System of Emissions Reduction (BSER) consisting of following three building blocks: Building Block 1 (BB1) - reducing the carbon intensity of electricity generation by improving the
heat rate of existing coal-fired power plants.
Building Block 2 (BB2) - substituting increased electricity generation from lower-emitting existing natural gas plants for reduced generation from higher-emitting coal-fired power plants.
Building Block 3 (BB3) - substituting increased electricity generation from new zero-emitting renewable energy sources (like wind and solar) for reduced generation from existing coal-fired power plants.
The EG requires that each state submit its plan complying with all applicable requirements by the deadline included therein. One of the requirements consist of development of emission standard (“standard of performance”) and establishment of compliance time for each EGU. The Clean Air Act (CAA) §111(a)(1) defines “standard of performance” as “a standard for emissions of air pollutants which reflects the degree of emission limitation achievable through the application of the best system of emission reduction which (taking into account the cost of achieving such reduction and any non-air quality health and environmental impact and energy requirements) the Administrator determines has been adequately demonstrated”.
2. History of Development of Emission Guidelines under CAA Over the last 40 years, under §111(d), the EPA has regulated four pollutants from five source categories, by promulgating associated EG. These source categories are phosphate fertilizer plants (fluorides), sulfuric acid plants (acid mist), Kraft pulp plants (total reduced sulfur (TRS)), primary aluminum plants (fluorides), and municipal solid waste landfills (landfill gas emissions as non-methane organic compounds (NMOCs))1. The following general principles / rationales were used by EPA in establishing BSER for these EGs: The degree of emission reduction achievable through the application of various demonstrated control
technologies.
1 See Footnote 18 at 79 FR 41776, July 17, 2014, including ‘‘Phosphate Fertilizer Plants; Final Guideline Document Availability,’’ 42 FR 12022 (March 1, 1977); ‘‘Standards of Performance for New Stationary Sources; Emission Guideline for Sulfuric Acid Mist,’’ 42 FR 55796 (October 18, 1977); ‘‘Kraft Pulp Mills, Notice of Availability of Final Guideline Document,’’ 44 FR 29828 (May 22, 1979); ‘‘Primary Aluminum Plants; Availability of Final Guideline Document,’’ 45 FR 26294 (April 17, 1980); ‘‘Standards of Performance for New Stationary Sources and Guidelines for Control of Existing Sources: Municipal Solid Waste Landfills, Final Rule,’’ 61 FR 9905 (March 12, 1996).
Smith-Page 2 of 5
Attachment B B-209Attachment B B-209

3
The technical feasibility of applying various demonstrated technologies to existing sources
considering variability in sizes and designs.
The impact of various demonstrated technologies on national energy consumption, water pollution, waste disposal, and ambient air concentrations of a designated pollutant.
The cost of adopting the emission guidelines, after considering control costs for various demonstrated technologies and taking into account the level of any existing controls.
Each of these EGs indicates that the cost of applying various control technologies can have a considerable impact in selection of a BSER for any designated pollutant for existing facilities. They also indicate that the age, size, type, class, and process design of the facility, influence not only the BSER selection process, but can also support a decision-making for whether different EGs are to be established for differing sizes, types, or classes of equipment. The EGs for the above referenced source categories have been established for principal points of emissions (point and fugitive emissions sources) located within the facility and, not for any emissions sources located outside of the facility. Finally, in these EGs, with respect to determining the EG, EPA has consistently recognized that not only the control technology needs to be demonstrated on existing sources, but the degree of emission reduction (performance level) needs to be readily achievable by the control technology.
3. The Division of Air Quality (DAQ)’s Approach for Determination of BSER The DAQ will consider the above general principles in determining BSER for CO2 emissions reduction from each EGU. But, importantly, DAQ will determine BSER for each EGU based upon BB1-type measures only (i.e., measures which can be accomplished within the fence-line of the facility), conforming to the §111(d) of the CAA and the requirements of 40 CFR 60 “Adoption and Submittal of State Plans for Designated Facilities”. Thus, DAQ’s approach will comprise of improving the operational efficiency of the EGUs in order to reduce CO2 emissions from the 2012 baseline levels. The DAQ’s BSER evaluation is based on the following parameters: type of EGU remaining useful life of the EGU unit’s baseline data (net heat rate, net generation, annual capacity factor, and CO2 emissions) unit’s projected future capacity factor whether the measure is adequately demonstrated to reduce heat rate feasibility of applying a specific heat rate improvement measure on a given unit degree of heat rate reduction potential for a specific feasible heat rate improvement measure site-specific limitations associated costs (capital, fixed and variable operational and maintenance (O&M), and fuel
savings) cost per ton of CO2 reduction
Smith-Page 3 of 5
Attachment B B-210Attachment B B-210

4
The evaluation is also based on literature review2 of technical feasibility for various heat rate improvement measures, degree of heat rate reduction potential, and costs data (capital, and fixed and variable O&M). It needs to be emphasized here that DAQ’s determination for each EGU will not be based upon some pre-determined heat rate improvement target, such as EPA’s selection of a 4.3% heat rate improvement potential for EGUs in the Eastern interconnection3, as discussed in the EG. The DAQ’s approach will include those adequately demonstrated, cost-effective measures that assure that the electricity is generated with lower CO2 emissions, thus improving public health and welfare. The selected heat rate improvement measures would be expected to produce non-air environmental co-benefits in the form of reduced water usage and solid waste production, in addition to, reductions in emissions of non-GHG pollutants such as SO2, NOx, and mercury. However, it should be noted that if the unit (EGU) is utilized more often after implementing heat rate improvement measure(s) (as it becomes more competitive due to fuel consumption and economic standpoints), some increases in emissions of GHG (as CO2) and similarly, for non-GHG pollutants (such as SO2, NOx, or mercury) are possible, and those could partially offset the emissions reductions achieved for GHG (as CO2) and non-GHG (such as SO2, NOx, or mercury). EPA has determined a cost estimate of $23 per ton4 reasonable for CO2 emissions reduction from EGUs under BB1 implementing heat rate improvement measures. EPA has further determined that this cost is reasonable because it achieves “an appropriate balance between cost and amount of reductions.”5 In addition, EPA has used another benchmark in the form of social cost of carbon (SC-CO2) at $40 per ton (2020) to $48 per ton (2030)6 to conclude that the above $23 per ton cost is reasonable. The DAQ will use the above cost effectiveness threshold of $23 per ton to determine reasonableness of cost for each of the technically feasible measure in determining BSER for a particular EGU.
2 “Coal-fired Power Plant Heat Rate Reductions”, Final Report, Sargent & Lundy, Chicago, IL, January 22, 2009. “Analysis of Heat Rate Improvement Potential at Coal-Fired Power Plants”, US Energy Information Administration, Washington, DC, May 2015. S. Corellis, “Range and Applicability of Heat Rate Improvements”, Technical Update, Electric Power Research Institute, Palo Alto, CA, April 2014. 3 Applies to coal-fired EGUs only. 4 See page 446 of 1560 (pre-publication version), Carbon Pollution Emission Guidelines for Existing Stationary Sources: Electric Utility Generating Units Clean Power Plan, August 3, 2015. Based on nation-wide coal fleet capacity of 213 GW, heat rate improvement capital cost of $100/KW, capital charge rate of 14.3%, fleet-wide baseline net heat rate of 10,250 Btu/KWh, heat rate improvement of 4% for coal-fired EGUs, annual capacity factor of 78%, and future (2030) average coal delivered cost of $2.70 per million Btu. See page 2-65, Greenhouse Gas Mitigation Measures, Technical Support Document (TSD) for Carbon Pollution Guidelines for Existing Power Plants”, August 3, 2015. 5 See page 457 of 1560 (pre-publication version), Ibid. 6 See pages 458 and 459 of 1560 (pre-publication version), Ibid.
Smith-Page 4 of 5
Attachment B B-211Attachment B B-211

5
4. BSER Evaluation
Duke Energy Progress, Inc. (DEP) has submitted a BSER analysis for the EGUs at this facility showing four possible measures that are available to improve heat rate for Units 7 and 8, and five measures that are available for Units ES-13 and ES-14, along with associated estimated reductions in heat rate, costs (capital, and operation and maintenance), and other information. In the final Clean Power Plan rule (40 CFR 60 Subpart UUUU) for existing EGUs, EPA “considered heat rate improvement opportunities at oil- and gas-fired steam EGUs and NGCC units and found that the available emission reductions would likely be more expensive or too small to merit consideration as a material component of the BSER.”7 In New Source Performance Standards for new, modified, and reconstructed EGUs (40 CFR Part 60 Subpart TTTT), EPA stated, “For newly constructed and reconstructed base load natural gas-fired stationary combustion turbines, the BSER is the use of efficient NGCC technology. For newly constructed and reconstructed non-base load natural gas-fired stationary combustion turbines, the BSER is the use of clean fuels (i.e., natural gas with an allowance for a small amount of distillate oil). For multi-fuel-fired stationary combustion turbines, the BSER is also the use of clean fuels (e.g., natural gas, ethylene, propane, naphtha, jet fuel kerosene, distillate oils 1 and 2, biodiesel, and landfill gas).”8 Based on the above EPA determinations, DAQ believes that efficient NGCC technology combined with the use of clean fuels (natural gas and distillate fuel) is BSER for EGUs at the Richmond County Combustion Turbine Facility.
5. BSER for Unit 7, Unit 8, ES-13 and ES-14 DEP shall continue to implement efficient NGCC technology and burn only clean fuels (natural gas, distillate fuel) starting September 1, 2019.
7 See page 336-337 of 1560 (pre-publication version), Ibid. 8 See page 462 of 768, Standards of Performance for Greenhouse Gas Emissions from New, Modified, and Reconstructed Stationary Sources: Electric Utility Generating Units, August 3, 2015.
Smith-Page 5 of 5
Attachment B B-212Attachment B B-212

1
North Carolina Department of Environmental Quality Division of Air Quality
Supporting Basis
Determination of Best System of Emissions Reduction for CO2 Emissions from Existing Electric Utility Generating Units
October 23, 2015
Facility Public Works Commission Butler-Warner Generation Plant, Fayetteville, NC Facility ID: 2600094 Current Air Quality Permit 03029T17 Affected Electric Utility Generating Units (EGUs) Six natural gas/No. 2 fuel oil-fired simple-cycle/combined-cycle turbine generators rated at 341.1 million Btu per hour nominal heat input rate (ID Nos. GT-1(1), GT-2(2), GT-3(3), GT-6(6), GT-7(7) and GT-8(8)). The steam turbine portion for all six combined-cycle combustion turbines is identified as Generator 9. The six turbines and steam generators are rated at a total of 245.8 MW (nameplate capacity).
1. Introduction The United States Environmental Protection Agency (EPA) has adopted Emission Guidelines for Greenhouse Gas Emissions and Compliance Times for Electric Utility Generating Units on August 3, 2015 and codified it in 40 CFR Subpart UUUU. The affected electric utility steam generating units (EGUs) under these emission guidelines (EG) are steam generating units, integrated gasification combined cycle units (IGCC), and stationary combined cycle or combined heat and power (CHP) combustion turbines that commenced construction on or before January 8, 2014. The EG includes uniform, nationwide emission standards, which are performance-based rates for emissions of greenhouse gases (GHG) expressed as CO2 (lb CO2/net MWh), as follows: Fossil fuel-fired steam generating units or IGCC: 1,534 lb CO2/net MWh (interim, average of 2022-
2029), 1,305 lb CO2/net MWh (final, starting 2030)
Natural gas-fired stationary combined cycle combustion turbines (including CHP combustion turbines): 832 lb/net MWh (interim, average of 2022-2029), 771 lb/MWh (final, starting 2030)
In lieu of the above uniform rates, each EGU can comply with state-specific goal (lb CO2/net MWh). The other option is that all affected units in the state, in aggregate, comply with the mass-based state goal (short tons/yr). For North Carolina (NC), the rate-based interim and final goals are 1,311 lb CO2/net MWh and 1,136 lb CO2/net MWh, respectively. Similarly, NC’s mass-based interim and final goals are 56,986,025 short tons/yr and 51,266,234 short tons/yr, respectively.
Warner-Page 1 of 5
Attachment B B-213Attachment B B-213

2
The above standards (whether uniform nationwide rates or state-specific goals) are based upon the determination of Best System of Emissions Reduction (BSER) consisting of following three building blocks: Building Block 1 (BB1) - reducing the carbon intensity of electricity generation by improving the
heat rate of existing coal-fired power plants.
Building Block 2 (BB2) - substituting increased electricity generation from lower-emitting existing natural gas plants for reduced generation from higher-emitting coal-fired power plants.
Building Block 3 (BB3) - substituting increased electricity generation from new zero-emitting renewable energy sources (like wind and solar) for reduced generation from existing coal-fired power plants.
The EG requires that each state submit its plan complying with all applicable requirements by the deadline included therein. One of the requirements consist of development of emission standard (“standard of performance”) and establishment of compliance time for each EGU. The Clean Air Act (CAA) §111(a)(1) defines “standard of performance” as “a standard for emissions of air pollutants which reflects the degree of emission limitation achievable through the application of the best system of emission reduction which (taking into account the cost of achieving such reduction and any non-air quality health and environmental impact and energy requirements) the Administrator determines has been adequately demonstrated”.
2. History of Development of Emission Guidelines under CAA Over the last 40 years, under §111(d), the EPA has regulated four pollutants from five source categories, by promulgating associated EG. These source categories are phosphate fertilizer plants (fluorides), sulfuric acid plants (acid mist), Kraft pulp plants (total reduced sulfur (TRS)), primary aluminum plants (fluorides), and municipal solid waste landfills (landfill gas emissions as non-methane organic compounds (NMOCs))1. The following general principles / rationales were used by EPA in establishing BSER for these EGs: The degree of emission reduction achievable through the application of various demonstrated control
technologies.
The technical feasibility of applying various demonstrated technologies to existing sources considering variability in sizes and designs.
The impact of various demonstrated technologies on national energy consumption, water pollution, waste disposal, and ambient air concentrations of a designated pollutant.
1 See Footnote 18 at 79 FR 41776, July 17, 2014, including ‘‘Phosphate Fertilizer Plants; Final Guideline Document Availability,’’ 42 FR 12022 (March 1, 1977); ‘‘Standards of Performance for New Stationary Sources; Emission Guideline for Sulfuric Acid Mist,’’ 42 FR 55796 (October 18, 1977); ‘‘Kraft Pulp Mills, Notice of Availability of Final Guideline Document,’’ 44 FR 29828 (May 22, 1979); ‘‘Primary Aluminum Plants; Availability of Final Guideline Document,’’ 45 FR 26294 (April 17, 1980); ‘‘Standards of Performance for New Stationary Sources and Guidelines for Control of Existing Sources: Municipal Solid Waste Landfills, Final Rule,’’ 61 FR 9905 (March 12, 1996).
Warner-Page 2 of 5
Attachment B B-214Attachment B B-214

3
The cost of adopting the emission guidelines, after considering control costs for various demonstrated technologies and taking into account the level of any existing controls.
Each of these EGs indicates that the cost of applying various control technologies can have a considerable impact in selection of a BSER for any designated pollutant for existing facilities. They also indicate that the age, size, type, class, and process design of the facility, influence not only the BSER selection process, but can also support a decision-making for whether different EGs are to be established for differing sizes, types, or classes of equipment. The EGs for the above referenced source categories have been established for principal points of emissions (point and fugitive emissions sources) located within the facility and, not for any emissions sources located outside of the facility. Finally, in these EGs, with respect to determining the EG, EPA has consistently recognized that not only the control technology needs to be demonstrated on existing sources, but the degree of emission reduction (performance level) needs to be readily achievable by the control technology.
3. The Division of Air Quality (DAQ)’s Approach for Determination of BSER The DAQ will consider the above general principles in determining BSER for CO2 emissions reduction from each EGU. But, importantly, DAQ will determine BSER for each EGU based upon BB1-type measures only (i.e., measures which can be accomplished within the fence-line of the facility), conforming to the §111(d) of the CAA and the requirements of 40 CFR 60 “Adoption and Submittal of State Plans for Designated Facilities”. Thus, DAQ’s approach will comprise of improving the operational efficiency of the EGUs in order to reduce CO2 emissions from the 2012 baseline levels. The DAQ’s BSER evaluation is based on the following parameters: type of EGU remaining useful life of the EGU unit’s baseline data (net heat rate, net generation, annual capacity factor, and CO2 emissions) unit’s projected future capacity factor whether the measure is adequately demonstrated to reduce heat rate feasibility of applying a specific heat rate improvement measure on a given unit degree of heat rate reduction potential for a specific feasible heat rate improvement measure site-specific limitations associated costs (capital, fixed and variable operational and maintenance (O&M), and fuel
savings) cost per ton of CO2 reduction
The evaluation is also based on literature review2 of technical feasibility for various heat rate improvement measures, degree of heat rate reduction potential, and costs data (capital, and fixed and variable O&M).
2 “Coal-fired Power Plant Heat Rate Reductions”, Final Report, Sargent & Lundy, Chicago, IL, January 22, 2009. “Analysis of Heat Rate Improvement Potential at Coal-Fired Power Plants”, US Energy Information Administration, Washington, DC, May 2015. S. Corellis, “Range and Applicability of Heat Rate Improvements”, Technical Update, Electric Power Research Institute, Palo Alto, CA, April 2014.
Warner-Page 3 of 5
Attachment B B-215Attachment B B-215

4
It needs to be emphasized here that DAQ’s determination for each EGU will not be based upon some pre-determined heat rate improvement target, such as EPA’s selection of a 4.3% heat rate improvement potential for EGUs in the Eastern interconnection3, as discussed in the EG. The DAQ’s approach will include those adequately demonstrated, cost-effective measures that assure that the electricity is generated with lower CO2 emissions, thus improving public health and welfare. The selected heat rate improvement measures would be expected to produce non-air environmental co-benefits in the form of reduced water usage and solid waste production, in addition to, reductions in emissions of non-GHG pollutants such as SO2, NOx, and mercury. However, it should be noted that if the unit (EGU) is utilized more often after implementing heat rate improvement measure(s) (as it becomes more competitive due to fuel consumption and economic standpoints), some increases in emissions of GHG (as CO2) and similarly, for non-GHG pollutants (such as SO2, NOx, or mercury) are possible, and those could partially offset the emissions reductions achieved for GHG (as CO2) and non-GHG (such as SO2, NOx, or mercury). EPA has determined a cost estimate of $23 per ton4 reasonable for CO2 emissions reduction from EGUs under BB1 implementing heat rate improvement measures. EPA has further determined that this cost is reasonable because it achieves “an appropriate balance between cost and amount of reductions.”5 In addition, EPA has used another benchmark in the form of social cost of carbon (SC-CO2) at $40 per ton (2020) to $48 per ton (2030)6 to conclude that the above $23 per ton cost is reasonable. The DAQ will use the above cost effectiveness threshold of $23 per ton to determine reasonableness of cost for each of the technically feasible measure in determining BSER for a particular EGU.
4. BSER Evaluation Public Works Commission Butler-Warner Generation Plant (PWC Butler-Warner) has submitted an analysis for the EGUs stating that BSER measures could result in possible heat rate improvements. The analysis included the associated estimated reductions in heat rate, costs, CO2 reductions, and other information. The measures were excluded due to cost and plant age. PWC Butler-Warner provided no details on which measures were included in their analysis. In the final Clean Power Plan rule (40 CFR 60 Subpart UUUU) for existing EGUs, EPA “considered heat rate improvement opportunities at oil- and gas-fired steam EGUs and NGCC units and found that
3 Applies to coal-fired EGUs only. 4 See page 446 of 1560 (pre-publication version), Carbon Pollution Emission Guidelines for Existing Stationary Sources: Electric Utility Generating Units Clean Power Plan, August 3, 2015. Based on nation-wide coal fleet capacity of 213 GW, heat rate improvement capital cost of $100/KW, capital charge rate of 14.3%, fleet-wide baseline net heat rate of 10,250 Btu/KWh, heat rate improvement of 4% for coal-fired EGUs, annual capacity factor of 78%, and future (2030) average coal delivered cost of $2.70 per million Btu. See page 2-65, Greenhouse Gas Mitigation Measures, Technical Support Document (TSD) for Carbon Pollution Guidelines for Existing Power Plants”, August 3, 2015. 5 See page 457 of 1560 (pre-publication version), Ibid. 6 See pages 458 and 459 of 1560 (pre-publication version), Ibid.
Warner-Page 4 of 5
Attachment B B-216Attachment B B-216

5
the available emission reductions would likely be more expensive or too small to merit consideration as a material component of the BSER.”7 In New Source Performance Standards for new, modified, and reconstructed EGUs (40 CFR Part 60 Subpart TTTT), EPA stated, “For newly constructed and reconstructed base load natural gas-fired stationary combustion turbines, the BSER is the use of efficient NGCC technology. For newly constructed and reconstructed non-base load natural gas-fired stationary combustion turbines, the BSER is the use of clean fuels (i.e., natural gas with an allowance for a small amount of distillate oil). For multi-fuel-fired stationary combustion turbines, the BSER is also the use of clean fuels (e.g., natural gas, ethylene, propane, naphtha, jet fuel kerosene, distillate oils 1 and 2, biodiesel, and landfill gas).”8 Based on the above EPA determinations, DAQ believes that efficient NGCC technology combined with the use of clean fuels (natural gas and distillate fuel) is BSER for EGUs at PWC Butler-Warner.
5. BSER for Units GT-1, GT-2, GT-3, GT-6, GT-7 and GT-8 PWC Butler-Warner shall continue to implement efficient NGCC technology and burn only clean fuels (natural gas, distillate fuel) starting September 1, 2019.
7 See page 336-337 of 1560 (pre-publication version), Ibid. 8 See page 462 of 768, Standards of Performance for Greenhouse Gas Emissions from New, Modified, and Reconstructed Stationary Sources: Electric Utility Generating Units, August 3, 2015.
Warner-Page 5 of 5
Attachment B B-217Attachment B B-217

1
North Carolina Department of Environmental Quality Division of Air Quality
Supporting Basis
Determination of Best System of Emissions Reduction for CO2 Emissions from Existing Electric Utility Generating Units
October 23, 2015
Facility Plant Rowan County (Southern Power Company), Salisbury, NC Facility ID: 8000163 Current Air Quality Permit 08758T17 Affected Electric Utility Generating Units (EGUs) One natural gas/No. 2 fuel oil-fired combined-cycle internal combustion turbine rated at 1,628 million Btu per hour heat input rate when firing natural gas and 1,875 million Btu per hour heat input rate when firing No. 2 fuel oil (ID No. Unit 4), and one natural gas-fired combined-cycle internal combustion turbine rated at 1,628 million Btu per hour heat input (ID No. Unit 5). The two turbines and steam generators are rated at a total of 593.8 MW (nameplate capacity).
1. Introduction The United States Environmental Protection Agency (EPA) has adopted Emission Guidelines for Greenhouse Gas Emissions and Compliance Times for Electric Utility Generating Units on August 3, 2015 and codified it in 40 CFR Subpart UUUU. The affected electric utility steam generating units (EGUs) under these emission guidelines (EG) are steam generating units, integrated gasification combined cycle units (IGCC), and stationary combined cycle or combined heat and power (CHP) combustion turbines that commenced construction on or before January 8, 2014. The EG includes uniform, nationwide emission standards, which are performance-based rates for emissions of greenhouse gases (GHG) expressed as CO2 (lb CO2/net MWh), as follows: Fossil fuel-fired steam generating units or IGCC: 1,534 lb CO2/net MWh (interim, average of 2022-
2029), 1,305 lb CO2/net MWh (final, starting 2030)
Natural gas-fired stationary combined cycle combustion turbines (including CHP combustion turbines): 832 lb/net MWh (interim, average of 2022-2029), 771 lb/MWh (final, starting 2030)
In lieu of the above uniform rates, each EGU can comply with state-specific goal (lb CO2/net MWh). The other option is that all affected units in the state, in aggregate, comply with the mass-based state goal (short tons/yr). For North Carolina (NC), the rate-based interim and final goals are 1,311 lb CO2/net MWh and 1,136 lb CO2/net MWh, respectively. Similarly, NC’s mass-based interim and final goals are 56,986,025 short tons/yr and 51,266,234 short tons/yr, respectively.
Rowan-Page 1 of 5
Attachment B B-218Attachment B B-218

2
The above standards (whether uniform nationwide rates or state-specific goals) are based upon the determination of Best System of Emissions Reduction (BSER) consisting of following three building blocks: Building Block 1 (BB1) - reducing the carbon intensity of electricity generation by improving the
heat rate of existing coal-fired power plants.
Building Block 2 (BB2) - substituting increased electricity generation from lower-emitting existing natural gas plants for reduced generation from higher-emitting coal-fired power plants.
Building Block 3 (BB3) - substituting increased electricity generation from new zero-emitting renewable energy sources (like wind and solar) for reduced generation from existing coal-fired and natural gas-fired power plants.
The EG requires that each state submit its plan complying with all applicable requirements by the deadline included therein. One of the requirements consists of development of an emission standard (“standard of performance”) and establishment of compliance time for each EGU. The Clean Air Act (CAA) §111(a)(1) defines “standard of performance” as “a standard for emissions of air pollutants which reflects the degree of emission limitation achievable through the application of the best system of emission reduction which (taking into account the cost of achieving such reduction and any non-air quality health and environmental impact and energy requirements) the Administrator determines has been adequately demonstrated”.
2. History of Development of Emission Guidelines under CAA Over the last 40 years, under §111(d), the EPA has regulated four pollutants from five source categories, by promulgating associated EG. These source categories are phosphate fertilizer plants (fluorides), sulfuric acid plants (acid mist), Kraft pulp plants (total reduced sulfur (TRS)), primary aluminum plants (fluorides), and municipal solid waste landfills (landfill gas emissions as non-methane organic compounds (NMOCs))1. The following general principles and/or rationales were used by EPA in establishing BSER for these EGs: The degree of emission reduction achievable through the application of various demonstrated control
technologies.
The technical feasibility of applying various demonstrated technologies to existing sources considering variability in sizes and designs.
The impact of various demonstrated technologies on national energy consumption, water pollution, waste disposal, and ambient air concentrations of a designated pollutant.
1 See Footnote 18 at 79 FR 41776, July 17, 2014, including ‘‘Phosphate Fertilizer Plants; Final Guideline Document Availability,’’ 42 FR 12022 (March 1, 1977); ‘‘Standards of Performance for New Stationary Sources; Emission Guideline for Sulfuric Acid Mist,’’ 42 FR 55796 (October 18, 1977); ‘‘Kraft Pulp Mills, Notice of Availability of Final Guideline Document,’’ 44 FR 29828 (May 22, 1979); ‘‘Primary Aluminum Plants; Availability of Final Guideline Document,’’ 45 FR 26294 (April 17, 1980); ‘‘Standards of Performance for New Stationary Sources and Guidelines for Control of Existing Sources: Municipal Solid Waste Landfills, Final Rule,’’ 61 FR 9905 (March 12, 1996).
Rowan-Page 2 of 5
Attachment B B-219Attachment B B-219

3
The cost of adopting the emission guidelines, after considering control costs for various demonstrated technologies and taking into account the level of any existing controls.
Each of these EGs indicates that the cost of applying various control technologies can have a considerable impact in selection of a BSER for any designated pollutant for existing facilities. They also indicate that the age, size, type, class, and process design of the facility, influence not only the BSER selection process, but can also support a decision-making for whether different EGs are to be established for differing sizes, types, or classes of equipment. The EGs for the above referenced source categories have been established for principal points of emissions (point and fugitive emissions sources) located within the facility and, not for any emissions sources located outside of the facility. Finally, in these EGs, with respect to determining the EG, EPA has consistently recognized that not only the control technology needs to be demonstrated on existing sources, but the degree of emission reduction (performance level) needs to be readily achievable by the control technology.
3. The Division of Air Quality (DAQ)’s Approach for Determination of BSER The DAQ will consider the above general principles in determining BSER for CO2 emissions reduction from each EGU. But, importantly, DAQ will determine BSER for each EGU based upon BB1-type measures only (i.e., measures which can be accomplished within the fence-line of the facility), conforming to the §111(d) of the CAA and the requirements of 40 CFR 60 “Adoption and Submittal of State Plans for Designated Facilities”. Thus, DAQ’s approach will comprise of improving the operational efficiency of the EGUs in order to reduce CO2 emissions from the 2012 baseline levels. The DAQ’s BSER evaluation is based on the following parameters: type of EGU remaining useful life of the EGU unit’s baseline data (net heat rate, net generation, annual capacity factor, and CO2 emissions) unit’s projected future capacity factor whether the measure is adequately demonstrated to reduce heat rate feasibility of applying a specific heat rate improvement measure on a given unit degree of heat rate reduction potential for a specific feasible heat rate improvement measure site-specific limitations associated costs (capital, fixed and variable operational and maintenance (O&M), and fuel
savings) cost per ton of CO2 reduction
The evaluation is also based on literature review2 of technical feasibility for various heat rate improvement measures, degree of heat rate reduction potential, and costs data (capital, and fixed and variable O&M).
2 “Coal-fired Power Plant Heat Rate Reductions”, Final Report, Sargent & Lundy, Chicago, IL, January 22, 2009. “Analysis of Heat Rate Improvement Potential at Coal-Fired Power Plants”, US Energy Information Administration, Washington, DC, May 2015. S. Corellis, “Range and Applicability of Heat Rate Improvements”, Technical Update, Electric Power Research Institute, Palo Alto, CA, April 2014.
Rowan-Page 3 of 5
Attachment B B-220Attachment B B-220

4
It needs to be emphasized here that DAQ’s determination for each EGU will not be based upon some pre-determined heat rate improvement target, such as EPA’s selection of a 4.3% heat rate improvement potential for EGUs in the Eastern interconnection3, as discussed in the EG. The DAQ’s approach will include those adequately demonstrated, cost-effective measures that assure that the electricity is generated with lower CO2 emissions, thus improving public health and welfare. The selected heat rate improvement measures would be expected to produce non-air environmental co-benefits in the form of reduced water usage and solid waste production, in addition to, reductions in emissions of non-GHG pollutants such as SO2, NOx, and mercury. However, it should be noted that as the EGU becomes more cost-competitive due to heat rate improvements, it may be dispatched more frequently and/or at higher loads. If the EGU is utilized more often, some increases in emissions of GHG (as CO2) and similarly, for non-GHG pollutants (such as SO2, NOx, or mercury) are possible, and those could partially offset the emissions reductions achieved through the heat rate improvement of the EGU. EPA has determined a cost estimate of $23 per ton4 reasonable for CO2 emissions reduction from EGUs under BB1 implementing heat rate improvement measures. EPA has further determined that this cost is reasonable because it achieves “an appropriate balance between cost and amount of reductions.”5 In addition, EPA has used another benchmark in the form of social cost of carbon (SC-CO2) at $40 per ton (2020) to $48 per ton (2030)6 to conclude that the above $23 per ton cost is reasonable. The DAQ will use the above cost effectiveness threshold of $23 per ton to determine reasonableness of cost for each of the technically feasible measure in determining BSER for a particular EGU.
4. BSER Evaluation
Plant Rowan County has submitted a BSER analysis for each EGU stating that they are not aware of any potential opportunities available for achieving meaningful CO2 emissions reductions. They believe that their ongoing efficient combined-cycle generation technology represents the BSER for natural gas-fired combined cycle (NGCC) EGUs. In the final Clean Power Plan rule (40 CFR 60 Subpart UUUU) for existing EGUs, EPA “considered heat rate improvement opportunities at oil- and gas-fired steam EGUs and NGCC units and found that the available emission reductions would likely be more expensive or too small to merit consideration as a material component of the BSER.”7 3 Applies to coal-fired EGUs only. 4 See page 446 of 1560 (pre-publication version), Carbon Pollution Emission Guidelines for Existing Stationary Sources: Electric Utility Generating Units Clean Power Plan, August 3, 2015. Based on nation-wide coal fleet capacity of 213 GW, heat rate improvement capital cost of $100/KW, capital charge rate of 14.3%, fleet-wide baseline net heat rate of 10,250 Btu/KWh, heat rate improvement of 4% for coal-fired EGUs, annual capacity factor of 78%, and future (2030) average coal delivered cost of $2.70 per million Btu. See page 2-65, Greenhouse Gas Mitigation Measures, Technical Support Document (TSD) for Carbon Pollution Guidelines for Existing Power Plants”, August 3, 2015. 5 See page 457 of 1560 (pre-publication version), Ibid. 6 See pages 458 and 459 of 1560 (pre-publication version), Ibid. 7 See page 336-337 of 1560 (pre-publication version), Ibid.
Rowan-Page 4 of 5
Attachment B B-221Attachment B B-221

5
In New Source Performance Standards for new, modified, and reconstructed EGUs (40 CFR Part 60 Subpart TTTT), EPA stated, “For newly constructed and reconstructed base load natural gas-fired stationary combustion turbines, the BSER is the use of efficient NGCC technology. For newly constructed and reconstructed non-base load natural gas-fired stationary combustion turbines, the BSER is the use of clean fuels (i.e., natural gas with an allowance for a small amount of distillate oil). For multi-fuel-fired stationary combustion turbines, the BSER is also the use of clean fuels (e.g., natural gas, ethylene, propane, naphtha, jet fuel kerosene, distillate oils 1 and 2, biodiesel, and landfill gas).”8 Based on the above EPA determinations, DAQ believes that efficient NGCC technology combined with the use of clean fuels (natural gas and distillate fuel) is BSER for the EGUs at Plant Rowan County.
5. BSER for Units 4 and 5 Plant Rowan County shall continue to implement efficient NGCC technology and burn only clean fuels (natural gas, distillate fuel) starting September 1, 2019.
8 See page 462 of 768, Standards of Performance for Greenhouse Gas Emissions from New, Modified, and Reconstructed Stationary Sources: Electric Utility Generating Units, August 3, 2015.
Rowan-Page 5 of 5
Attachment B B-222Attachment B B-222

North Carolina Department of Environment Quality Division of Air Quality
Justification for Excluding Elizabethtown Energy (ORIS code 10380) and Lumberton
Energy (ORIS code 10382) from 111(d) Requirements The EPA’s 111(d) rule for existing EGUs identified Elizabethtown Energy (ORIS code 10380) and Lumberton Energy facilities as being subject to the requirements. The purpose of the following information is to provide updated data regarding the operation and permitting status of the two facilities and to explain why they no longer meet the 111(d) criteria for an affected unit under the 111(d) rule. Each facility:
- consists of 2 units with each unit initially designed with 215 million Btu/hr heat input with a combined nameplate capacity of 35 MWe. - is equipped with overfire air, SNCR, multiclone, dry sorbent injection system and baghouse. - has not been in operation since 2009, but has kept its Title V permit active. - was previously permitted to burn fossil fuels (coal/natural gas/No. 2 and 4 fuel oils) and non-CISWI subject fuels subject to the federal Clean Air Interstate Rule (CAIR). - is permitted as an industrial boiler subject to Subpart JJJJJJ as the units do not meet the applicability criteria as an EGU subject to the federal Subpart UUUUU MATS rule. - is currently owned under the new name of North Carolina Renewable Power - Elizabethtown, LLC and North Carolina Renewable Power - Lumberton, LLC, respectively. The Elizabethtown facility continues to be non-operational and permitted to burn fossil-fuels and non-CISWI subject fuels. However, the Lumberton facility has recently become operational and permitted to burn non-CISWI subject wood/poultry litter but not fossil fuels in steam/electric generating boilers which were de-rated to 180 MMBtu/hr heat input.
The applicability requirements under the 111(d) rule in §60.5845 for existing fossil fuel-fired EGUs are as follows:
(1) Serves a generator connected to a utility power distribution system with a nameplate capacity of 25 MW-net or greater (i.e., capable of selling greater than 25 MW of electricity); (2) Has a base load rating (i.e., design heat input capacity) greater than 260 GJ/hr (250 MMBtu/hr) heat input of fossil fuel (either alone or in combination with any other fuel).
Note that §60.5850(a)(3) of the rule excludes non-fossil fuel-fired units (i.e., units that are capable of combusting 50 percent or more non-fossil fuel) that have always historically limited the use of fossil fuels to 10 percent or less of the annual capacity factor, or are subject to a federally enforceable permit limiting fossil fuel use to 10 percent or less of the annual capacity
Attachment B B-223Attachment B B-223

factor. Due to the ambiguity contained in paragraphs §60.5845(b)(1) and (2), the DAQ requested a clarification to EPA Region 4. The EPA confirmed that an EGU must meet both criteria to be subject to the regulations. Since both Elizabethtown and Lumberton facilities meet only one of the requirements (nameplate capacity greater than 25 MW-net criteria), and the Lumberton facility is permitted to burn only non-fossil fuels, the DAQ concludes that both facilities should be excluded from 111(d) requirements.
Attachment B B-224Attachment B B-224


![Synthesis and Electronic Structure Determination of ...Synthesis and Electronic Structure Determination of Uranium(VI) Ligand Radical Complexes Supporting Information Khrystyna Herasymchuk,[a]](https://img.pdfslide.net/doc/110x75/5fc71ca8d374536eb17058c6/synthesis-and-electronic-structure-determination-of-synthesis-and-electronic.jpg)