Embed Size (px)
Citation preview

S1
Supporting Information
A Fully Synthetic and Self-Adjuvanting Globo H-Based Anticancer
Vaccine Elicited Strong T Cell-Mediated Antitumor Immunity
Zhifang Zhou, Guochao Liao, Satadru S. Mandal, Sharad Suryawanshi, and Zhongwu Guo*
Department of Chemistry, Wayne State University, 1501 Cass Avenue, Detroit, Michigan 48202,
United States
* Corresponding author: [email protected]
Table of Contents:
I. Conjugate Synthesis and Analysis Experiments ...............................................................S1
II. Size Analysis of the MPLA Conjugate Liposomes ………..............................................S4
III. Calculated Antibody Titers of ELISA Experiments………..............................................S5
IV. Raw Data for the Cytokine Release Assays………………..............................................S6
V. Assays of MPLA- and KLH Specific Antibodies ............................................................S7
VI. NMR and MS Spectra of Synthesized Compounds...........................................................S9
I. Conjugate Synthesis and Analysis Experiments
General Experimental Methods. Chemicals and materials were obtained from commercial
sources and were used as received without further purification unless otherwise noted. MS 4 Å
was flame-dried under high vacuum and used immediately after cooling under a N2 atmosphere.
Analytical TLC was carried out on silica gel 60Å F254 plates with detection by a UV detector
and/or by charring with 15% (v/v) H2SO4 in EtOH. NMR spectra were recorded on a 400, 500,
or 600 MHz machine with chemical shifts reported in ppm (δ) downfield from tetramethylsilane
(TMS) that was used as an internal reference.
Electronic Supplementary Material (ESI) for Chemical Science.This journal is © The Royal Society of Chemistry 2015

S2
Compound 6. To a stirred solution of 4 (18 mg, 8 μmol) and p-nitrophenol (5.9 mg, 42 μmol) in
CH2Cl2 (5 mL) was added EDC·HCl (8.2 mg, 42 μmol) in an ice bath. After the mixture was
stirred at rt for 5 h, it was diluted with CH2Cl2, washed with brine, dried over anhydrous Na2SO4,
and condensed in vacuum. The residue was purified on a TLC plate (MeOH/CH2Cl2, 1:20, v/v)
to give the activated ester 6 as a white floppy solid (16 mg, 83.5%). Its spectroscopic data were
identical to that reported in the literature (Z. Zhou, M. Mondal, G. Liao and Z. Guo, Org. Biomol.
Chem., 2014, 12, 3238-3245).
Compound S2. A mixture of S1 (10.0 mg, 4.46 μmol, Z. Zhou, M. Mondal, G. Liao and Z. Guo,
Org. Biomol. Chem., 2014, 12, 3238-3245) and 10% Pd-C (10.0 mg) in CH2Cl2-MeOH (3:1, 8
mL) was stirred under an atmosphere of H2 at rt for 12 h. Thereafter, the catalyst was removed
by filtration through a Celite pad, and the Celite pad was subsequently washed with CH2Cl2-
MeOH-H2O (3:3:1). The combined filtrates were concentrated in vacuum, to give S2 as a yellow
solid (7.0 mg, 93.7%). 1H NMR (600 MHz, CDCl3:CD3OD:D2O=3:3:1): δ 5.05-4.90 (br, 2H),
4.88-4.80 (br, 1H), 4.46-4.37 (br, 1H), 3.85-3.80 (br, 4H), 3.80-3.75 (m, 3H), 3.75-3.60 (br, 1H),
3.60-3.42 (m, 2H), 3.41-3.20 (m, 3H), 2.98 (br, 1H, ½CH2NH2), 2.90 (br, 1H, ½CH2NH2), 2.43-
2.00 (m, 12 H, lipid), 1.50-0.95(br, 108 H, 54 x CH2, lipid), 0.81-0.60 (18 H, 6 x CH3, lipid). 13
C
NMR (150 MHz, CDCl3:CD3OD:D2O=3:3:1): δ 173.71, 173.57, 172.34, 171.32, 171.00, 101.53,
75.18, 74.02, 71.26, 70.87, 68.60, 68.15, 60.03, 53.68, 52.87, 48.96, 48.81, 48.67, 48.52, 48.24,
48.10, 42.01, 41.60, 41.13, 40.98, 40.33, 37.27, 36.94, 34.27, 33.90, 33.80, 31.68, 31.14, 31.05,

S3
29.93, 29.87, 29.82, 29.42, 29.32, 29.29, 29.25, 29.12, 28.98, 28.95, 25.34, 25.25, 25.05, 25.00,
24.86, 24.81, 22.42, 13.71; 31
P NMR (400 MHz, CDCl3:CD3OD:D2O=3:3:1): δ 0.405; HRMS
(ESI, TOF): calcd. For C90H171N3O22P [M+H]+ m/z, 1677.2091; found, 1677.2091. (S2 was used
as the capture reagent for ELISA analysis of MPLA-specific antibodies.)
Analysis of the carbohydrate loading of glycoconjugates (R. E. Wrolstad, T. E. Acree and E.
A. Decker, Current Protocols in Food Analytical Chemistry, John Wiley & Sons, Inc., 2001):
The sugar calibration curve was prepared using a standard solution of fucose, galactose, N-
acetylgalactosamine, and glucose (1.2 mg/mL in 1/3/1/1 molar ratio) in distilled water. Aliquots
were transferred to 10 dry 10 ml tubes in 5 μL increments ranging from 5 to 50 μL. In another 10
mL test tube, accurately weighed samples of the glycoconjugates to be analyzed were placed. At
this point, all the tubes should contain between 5 to 50 μg of sugar, and one should contain an
unknown amount of sugar to be determined. To all of the tubes were sequentially added 500 μL
of 4% phenol and 2.5 mL of 96% sulfuric acid. The glycosyl linkages were cleaved and a
colored complex was formed in this step. Solutions were transferred from the test tubes to
cuvettes and measured at the wavelength of 490 nm. The calibration curve was obtained by
plotting A490 against the weight (μg) of sugar in the standard samples. The amount of sugar
present in each unknown sample was calculated based on the A490 of the unknown sample
against the calibration curve, while the free proteins KLH and HSA were used as blank controls
for conjugates 2 and 3, respectively. The carbohydrate loading of each glycoconjugate was
calculated according to the following equation, and the results for KLH conjugate 2 and HSA
conjugate 3 were 8.0% and 14.0%, respectively.
Carbohydrate loading % = sugar weight in a tested sample/total weight of the sample × 100%
Procedure for SDS-PAGE analysis of glycoconjugates: The mixture of a glycoconjugate (1 µg)
in 0.1 M PSB buffer (1 µl), LDS NuPAGE® sample buffer (4 ×, 2.5 µl), reducing agent (10×, 1
µl), and deionized water (5.5 µl) was heated at 70 °C for 10 min, and loaded onto the sodium
dodecyl sulfate polyacrylamide gel. The upper buffer chamber was filled with 200 ml of 1 × SDS
running buffer containing 500 µl of NuPAGE® antioxidant, and the lower buffer chamber was
filled with 600 ml of 1 × SDS running buffer. The gel was run at 200 V for 2 h, and stained with
Coomassie brilliant blue R-250 for 8 h (Ref: NuPAGE® technical instructions of Invitrogen).

S4
Figure S1. The SDS-PAGE results. Lane 0: molecular markers; Lane 1: KLH protein; Lane 2: KLH-
Globo H conjugate 2.
II. Size Analysis of the MPLA Conjugate Liposomes
The liposomal formulation of Globo H-MPLA conjugate 1 prepared for the immunization of mice
was subjected dynamic light scattering (DLS). The sample was tested five times, and the results
are listed in Table S1. It was concluded that the average diameter of the liposome was 1,429.2 ±
249 (standard deviation) nm with the polydispersity index (PDI) around 0.5832 (Figure S2).
Table S1. DLS analysis results for the liposomal formulation of Globo H-MPLA conjugate 1
test PDI Size (d, nm) % volume Width (d, nm)
# 1 0.54 1503 96.5 225.2
# 2 0.472 1816 92.1 402.7
# 3 0.704 1366 100 173.2
# 4 0.521 1302 96 203.1
# 5 0.679 1159 94.1 173.7
Ave 0.5832 1429.2 95.74
SD 0.1023 249.12 2.947
Figure S2. Size distribution of the liposomes of conjugate 1 based on DLS volume analysis

S5
III. Calculated Antibody Titers of ELISA Experiments
Table S2. The total antibody titers of pooled antisera induced by conjugates 1 and 2 (Figure 2A)
1 2
Mean SD N Mean SD N
d0 0 0 3 0 0 3
d21 47824 3211 3 3299 481 3
d27 57648 2452 3 10937 2417 3
d38 63038 1595 3 29128 3110 3
Table S3. The IgG antibody titers of pooled antisera induced by conjugates 1 and 2 (Figure 2B)
1 2
Mean SD N Mean SD N
d0 0 0 3 0 0 3
d21 46449 7768 3 2783 655 3
d27 65577 850 3 8273 2600 3
d38 69406 1584 3 29383 3326 3
Table S4. The antibody titers of IgG subclasses in individual antiserum induced by 1 (Figure 3A)
mouse 1 2 3 4 5 6 Mean
IgG1 108952 3853 63146 12321 64011 130594 63813
IgG2b 10552 1 155 12 2430 14317 4578
IgG2c 6039 0 291 1751 55 5232 2228
IgG3 2177 0 2 14 7092 27667 6159
Table S4. The antibody titers of IgG subclasses in individual antiserum induced by 2 (Figure 3B)
mouse 1 2 3 4 5 6 Mean
IgG1 20952 22450 4333 22678 33973 65033 28237
IgG2b 21324 1772 2269 5963 17979 454 8294
IgG2c 22 2601 6299 15 1536 1 1746
IgG3 210 0 253 5148 2623 911 1524
Table S5. The antibody titers of IgM in individual antiserum induced by conjugate 1 and 2
mouse 1 2 3 4 5 6 Mean
Conjugate 1 2932 401 0 4866 39471 101153 24804
Conjugate 2 28681 20618 16195 8 2 19789 14216

S6
IV. Raw Data for the Cytokine Release Assays
Figure S3. The expression levels of cytokines, including IL-3, IL-4, IL-9, IL-10, IL-12, IL-12p70, IL-13,
IFN-γ, MCP-1, MCP-5, and RANTES, have significantly increased in the antisera derived
from mice immunized with Globo H-MPLA 1, compared to that of normal mouse sera.
Figure S4. The expression levels of cytokines, including GCSF, GM-CSF, IL-3, IL-4, IL-5, IL-6, IL-9,
IL-10, IL-12, IL-12p70, IL-13, IFN-γ, MCP-1, MCP-5, RANTES, and TNF-α, have
significantly increased in the antisera derived from mice immunized with Globo H-MPLA 1,
compared to that of normal mouse sera.
Globo H-KLH antisera Normal sera
+ -
normal sera Globo H-MPLA antisera

S7
Figure S5. The membrane map for experiments to obtain the results in Figures S3 and S4.
V. Assays of MPLA- and KLH Specific Antibodies
MPLA-specific antibody titer was determined by ELISA, similar to that used to measure other
antibodies but using MPLA as the capture reagent to coat the NUNC PolySorpTM
96-well plates.
The MPLA derivative S2 used for coating plates was dissolved in 0.2% triethylamine to get a
final concentration of 0.03 mg/ml. After the solvent was evaporated, the plates were treated with
blocking buffer following the normal protocol of ELISA. The MPLA-specific total antibody titer
of the day 38 serum pooled from mice immunized with Globo H-MPLA conjugate 1 was 59,666,
as compared to the Globo H-specific total antibody titer of 63,038 (Figure S6).
Figure S6. Titers of the Globo H- and MPLA-specific total antibodies in the pooled antiserum induced by
conjugate 1. Data are presented as mean ± SEM. The difference of Globo H- and MPLA-
specific total antibody titers is not statistically significant.

S8
KLH-specific antibody titer was determined by ELISA, similar to that used to measure other
antibodies but using KLH as the capture reagent to coat the plates. KLH powder was dissolved in
the coating buffer (0.1 M bicarbonate, pH 9.6) to get a final concentration of 2 μg/mL. Each well
of the plates was treated with 100 μL of KLH coating solution at 37 °C for 1 h and then with a
blocking buffer following the normal protocol of ELISA. The KLH-specific antibody titer of the
day 38 antiserum pooled from mice immunized with Globo H-KLH conjugate 2 was 293,919,
and its Globo H-specific antibody titer was 23,177 (Figure S7). Evidently, the KLH conjugate
provoked much stronger anti-KLH antibody response than the anti-globo H antibody response.
Figure S7. Titers of the Globo H- and KLH-specific antibodies in the pooled antiserum induced by
conjugate 2. Data are presented as mean ± SEM. * Compared to the Globo H-specific total
antibody titer, the difference is statistically very significant (P < 0.0001).
*

S9
VI. NMR and MS Spectra of Synthesized Compounds
0.0
0.5
1.0
1.5
2.0
2.5
3.0
3.5
4.0
4.5
5.0
5.5
6.0
6.5
7.0
7.5
8.0
8.5
2.0
3
1.6
1
.8
0.9
0
.9
2.7
4
.1
10.7
0
.9
4.2
3.3
5
.6
2.0
2
.0 2
.9
6.1
1
.4
12.0
9
8.4
1
8.2
Agilent 600 NNMR spectrometer
ppm
O
O
O
BnO
HN
O O
OH
N
O
OB
n
O
NH
O
O
O
OOO
BnO
O
OO
O
OB
n
P OB
nO
BnO
NO
2

S10
1H NMR Spectrum of compound 6 (CDCl3, 600 MHz)
1H Spectrum of compound 7 [CDCl3:CD3OD:D2O (3:3:1) 600 MHz]

S11
1H-
1H COSY Spectrum of compound 7 [CDCl3:CD3OD:D2O (3:3:1) 600 MHz]

S12
1H-
13C HMQC NMR Spectrum of compound 7 [CDCl3:CD3OD:D2O (3:3:1) 600/150 MHz]
S13
-125-100
-75-50
-250
2550
ppm
Mercury 400 spectrometer
31P NMR Spectrum of compound 7 [CDCl3:CD3OD:D2O (3:3:1) 400 MHz]

S14
MALTI-TOF MS spectrum of compound 7
HRMS (ESI MS) spectrum of compound 7
Exact Mass: 3356.89Molecular Weight: 3359.07

S15
1H NMR Spectrum of compound 1 [CDCl3:CD3OD:D2O (5:3:1) 600 MHz]
O O
OH
OOHOOH
HOOH
O OH
O
OHOH
OH
OO
OHOH
O
HOO
O
NHAc
OHOH
O
OHHO
OH
NH
HN
O
O
O
O
O
O
HOHN
OO
OHN
OH
OO
OOHO
O
O
O
O
OH
P
OHO
HO
10
1010
8
8
10

S16
-100-75
-50-25
025
5075
Mercury 400 spectrometer
ppm
31P NMR Spectrum of compound 1 [CDCl3:CD3OD:D2O (5:3:1) 400 MHz]
O O
OH
OOHOOH
HOOH
O OH
O
OHOH
OH
OO
OHOH
O
HOO
O
NHAc
OHOH
O
OHHO
OH
NH
HN
O
O
O
O
O
O
HOHN
OO
OHN
OH
OO
OOHO
O
O
O
O
OH
P
OHO
HO
10
1010
8
8
10
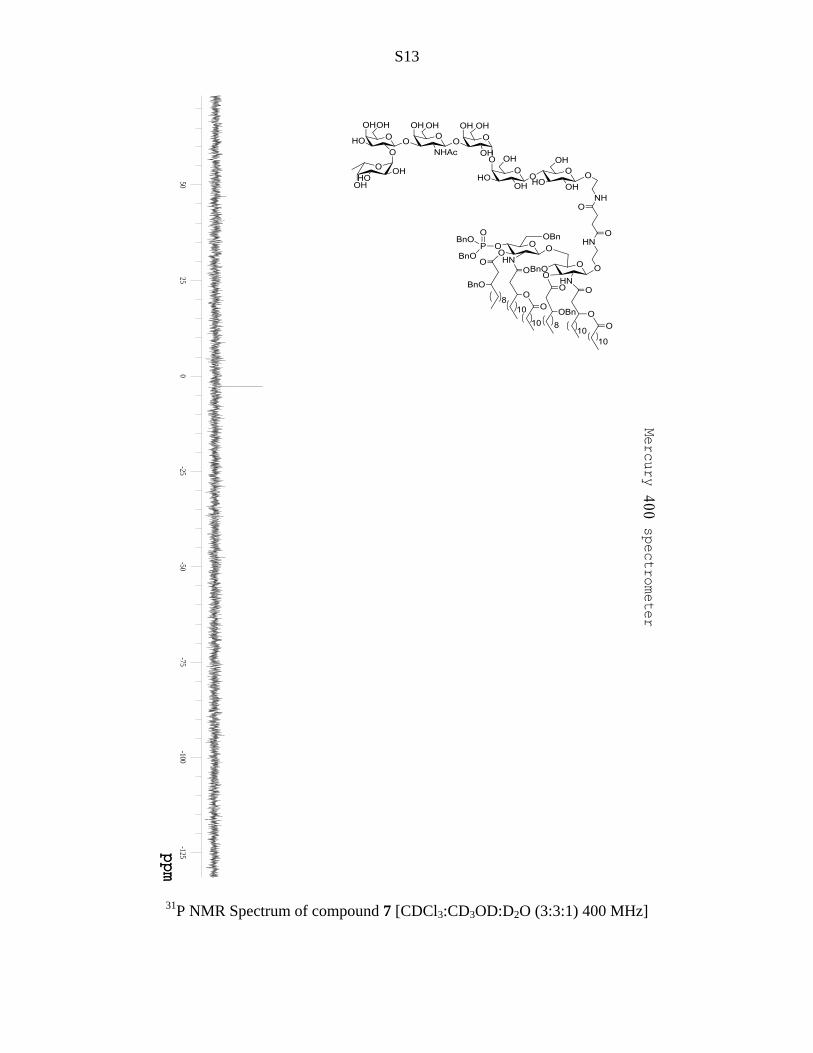
S17
MS (ESI MS) spectrum of compound 1
O O
OH
OOHOOH
HOOH
O OH
O
OHOH
OH
OO
OHOH
O
HOO
O
NHAc
OHOH
O
OHHO
OH
NH
HN
O
O
O
O
O
O
HOHN
OO
OHN
OH
OO
OOHO
O
O
O
O
OH
P
OHO
HO
10
1010
8
8
10

S18
MALTI-TOF MS spectrum of HSA protein

S19
MALTI-TOF MS spectrum of compound 3

S20
1H NMR Spectrum of compound S2 [CDCl3:CD3OD:D2O (3:3:1) 600 MHz]

S21
13C NMR Spectrum of compound S2 [CDCl3:CD3OD:D2O (3:3:1) 600 MHz]

S22
1H-
1H COSY NMR Spectrum of compound S2 [CDCl3:CD3OD:D2O (3:3:1) 600 MHz]

S23
1H-
13C HMQC NMR Spectrum of compound S2 [CDCl3:CD3OD:D2O (3:3:1) 600 MHz]

S24
31P
NMR Spectrum of compound S2 [CDCl3:CD3OD:D2O (3:3:1) 400 MHz]

S25
HRMS (ESI MS) spectrum of compound S2


![[M/Rh(Cp*)4W8O32] (M = Rh(1) and Ir(2) Supporting ... · S1 Supporting Information A comprehensive approach providing a new synthetic route for bimetallic electrocatalysts via isopoly](https://img.pdfslide.net/doc/110x75/5e2ae4c27336f63dc33f1b31/mrhcp4w8o32-m-rh1-and-ir2-supporting-s1-supporting-information.jpg)