Embed Size (px)
Citation preview
Supporting information:
High efficiency quasi 2D lead bromide perovskite solar cells using various barrier molecules
Bat-El Cohen1, Małgorzata Wierzbowska2, Lioz Etgar1*
1The Hebrew University of Jerusalem, Institute of Chemistry, Casali Center for Applied Chemistry, Jerusalem, Israel
2Institute of Physics, Polish Academy of Sciences, Al. Lotnikó w 32/46, PL-02-668, Warsaw, Poland
*E-mail: [email protected]
Figure 1S: Optical microscope images for layered PSCs ((R)2(MA)n-1PbnBr3n+1, n=50) where (A) R= benzyl ammonium; (B) phenylethyl ammonium; (C) propylphenyl ammonium; (D) 3D (MAPbBr3).
R Voc (v) Jsc (mA/cm2) FF (%) Efficiency (%)
BA 1.18 ± 0.04 (1.24)
8.2 ± 0.6 (8.8)
64 ± 2(67)
6.1 ± 0.1(7.3)
PEA 1.28 ± 0.01 (1.28)
7.9 ± 0.4(7.4)
56 ± 5(64)
5.6 ± 0.4(6.1)
PPA 1.15 ± 0.01 (1.14)
7.3 ± 0.2(7.5)
57 ± 3(64)
4.8 ± 0.2(5.1)
Table 1S: Average photovoltaic results for HTM free PSCs with layered perovskite (R)2(MA)n-
1PbnBr3n+1 were n=40.
Electronic Supplementary Material (ESI) for Sustainable Energy & Fuels.This journal is © The Royal Society of Chemistry 2017
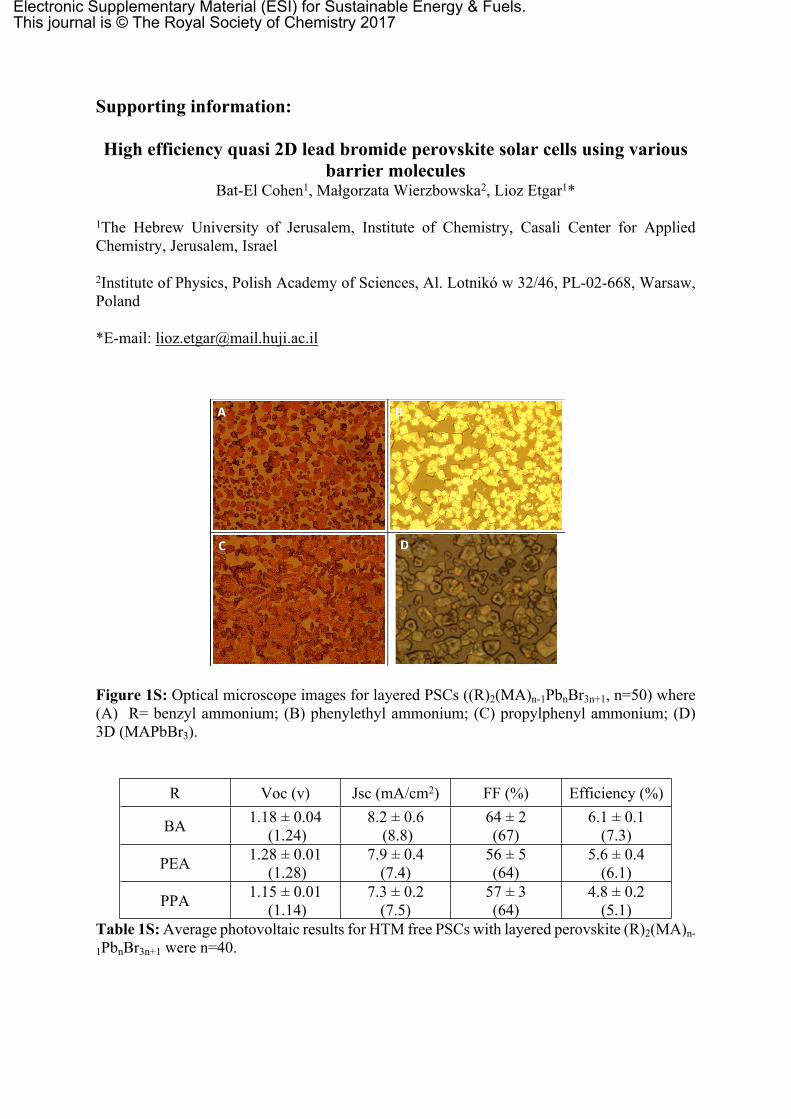
R Voc (v) Jsc (mA/cm2) FF (%) Efficiency (%)
BA 1.17 ± 0.05(1.14)
8.6 ± 0.8(9.7)
62 ± 3(66)
6.2 ± 0.5(7.3)
PEA 1.23 ± 0.03 (1.25)
8.1 ± 0.8(8.2)
55 ± 5(62)
5.4 ± 0.3(6.3)
PPA 1.15 ± 0.01 (1.16)
8.5 ± 0.3 (8.7)
60 ± 2(60)
5.8 ± 0.2(6.1)
Table 2S: Average photovoltaic results for HTM free PSCs with layered perovskite (R)2(MA)n-
1PbnBr3n+1 were n=60.
Figure 2S: Exciton binding energies according to Elliott formula.
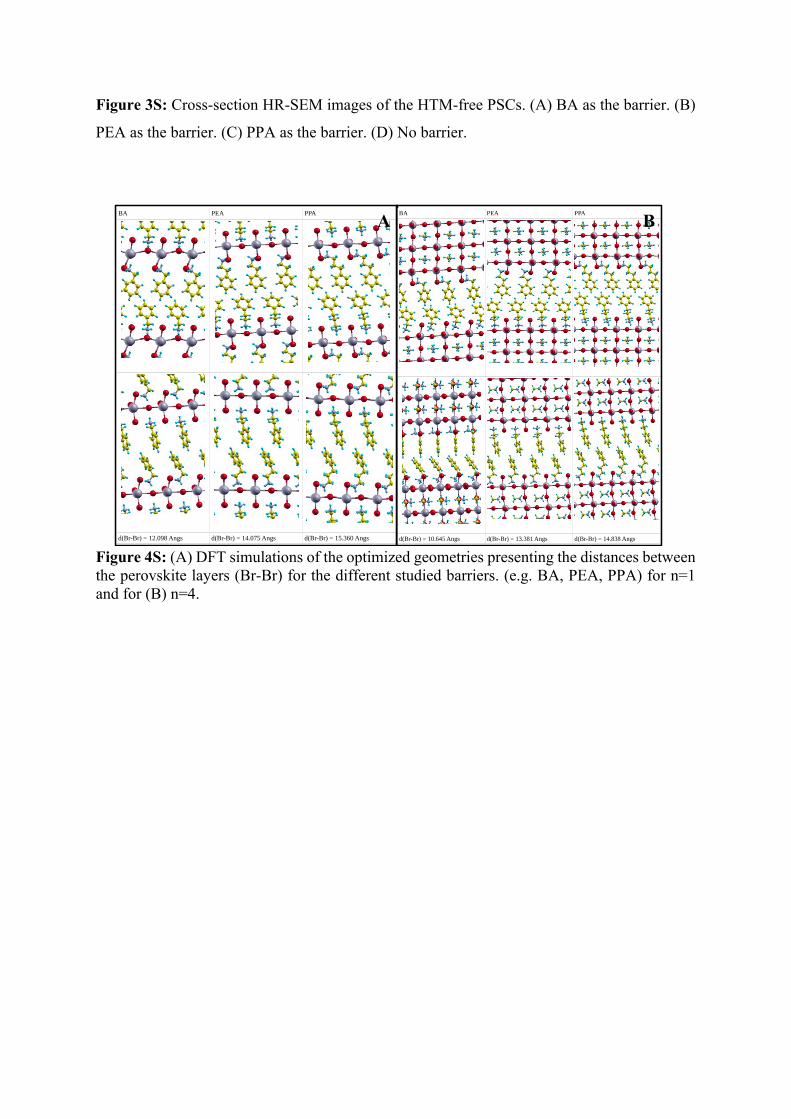
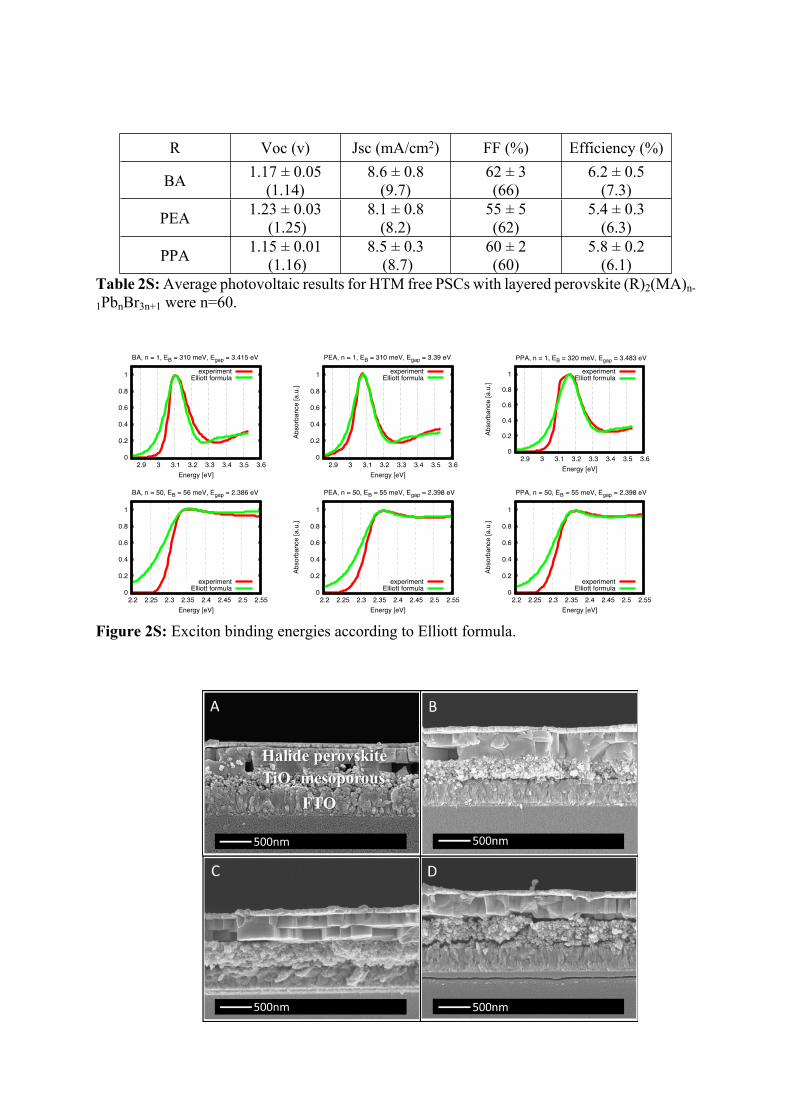
Figure 3S: Cross-section HR-SEM images of the HTM-free PSCs. (A) BA as the barrier. (B)
PEA as the barrier. (C) PPA as the barrier. (D) No barrier.
Figure 4S: (A) DFT simulations of the optimized geometries presenting the distances between the perovskite layers (Br-Br) for the different studied barriers. (e.g. BA, PEA, PPA) for n=1 and for (B) n=4.
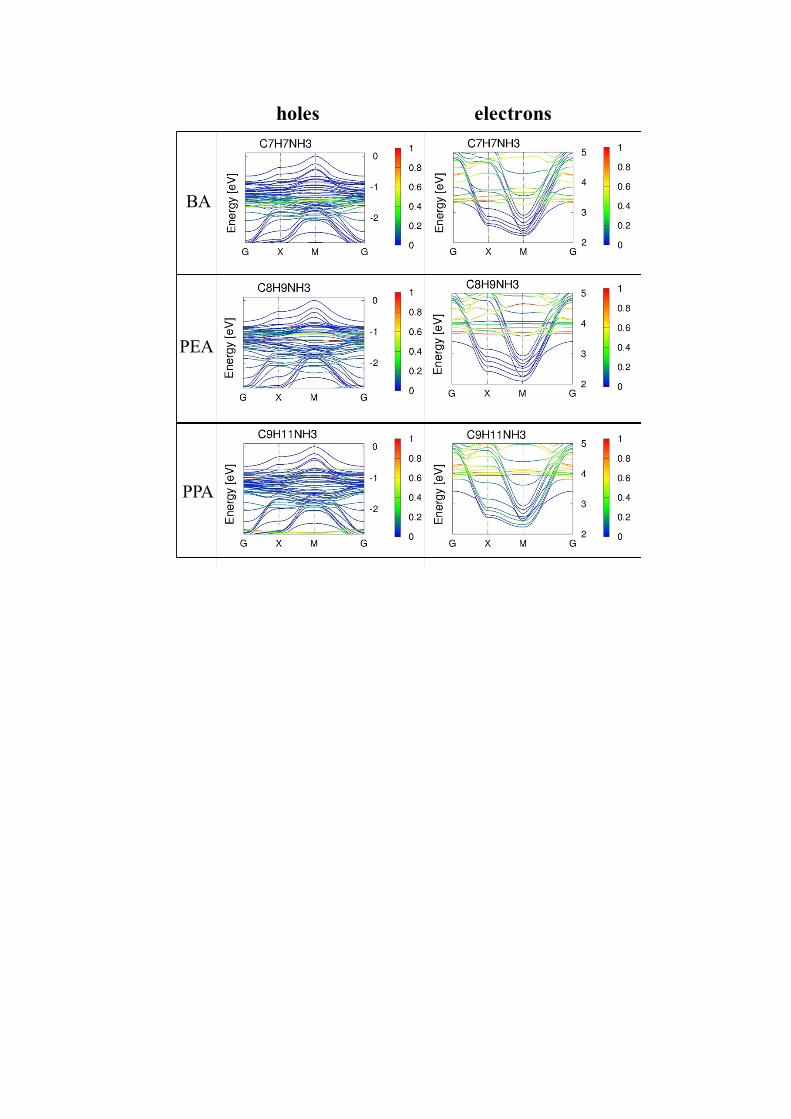
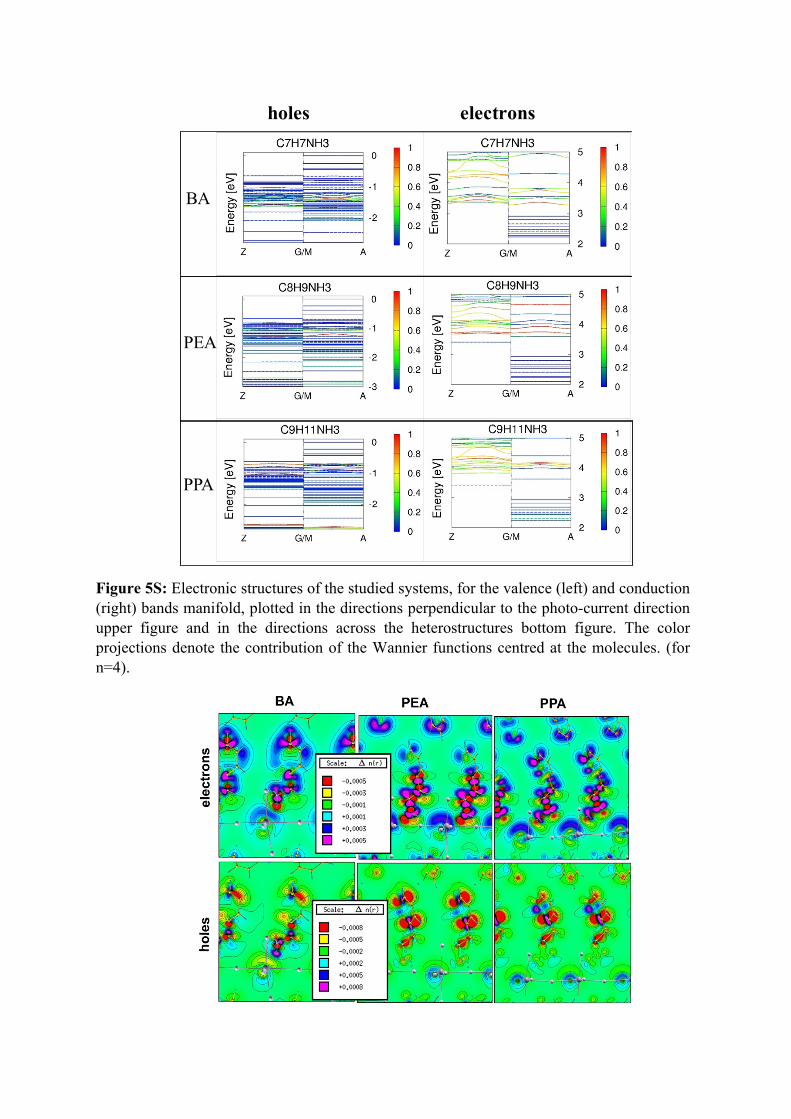
Figure 5S: Electronic structures of the studied systems, for the valence (left) and conduction (right) bands manifold, plotted in the directions perpendicular to the photo-current direction upper figure and in the directions across the heterostructures bottom figure. The color projections denote the contribution of the Wannier functions centred at the molecules. (for n=4).
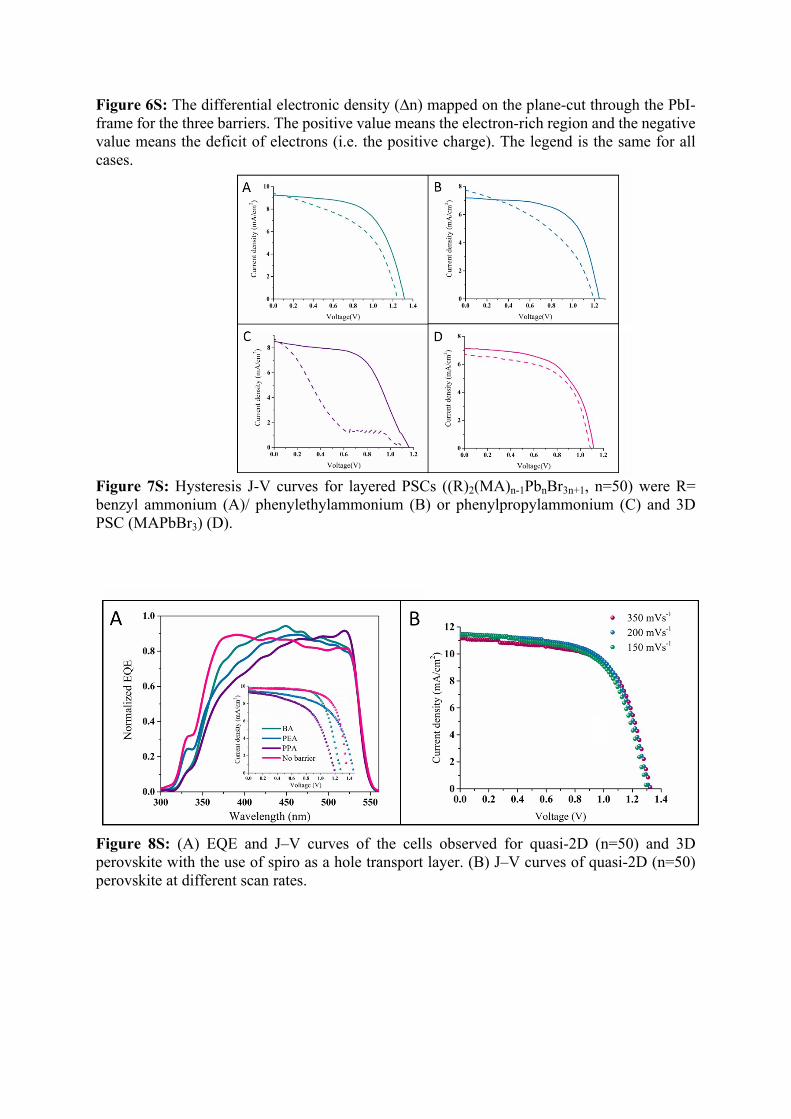
Figure 6S: The differential electronic density (∆n) mapped on the plane-cut through the PbI-frame for the three barriers. The positive value means the electron-rich region and the negative value means the deficit of electrons (i.e. the positive charge). The legend is the same for all cases.
Figure 7S: Hysteresis J-V curves for layered PSCs ((R)2(MA)n-1PbnBr3n+1, n=50) were R= benzyl ammonium (A)/ phenylethylammonium (B) or phenylpropylammonium (C) and 3D PSC (MAPbBr3) (D).
Figure 8S: (A) EQE and J–V curves of the cells observed for quasi-2D (n=50) and 3D perovskite with the use of spiro as a hole transport layer. (B) J–V curves of quasi-2D (n=50) perovskite at different scan rates.
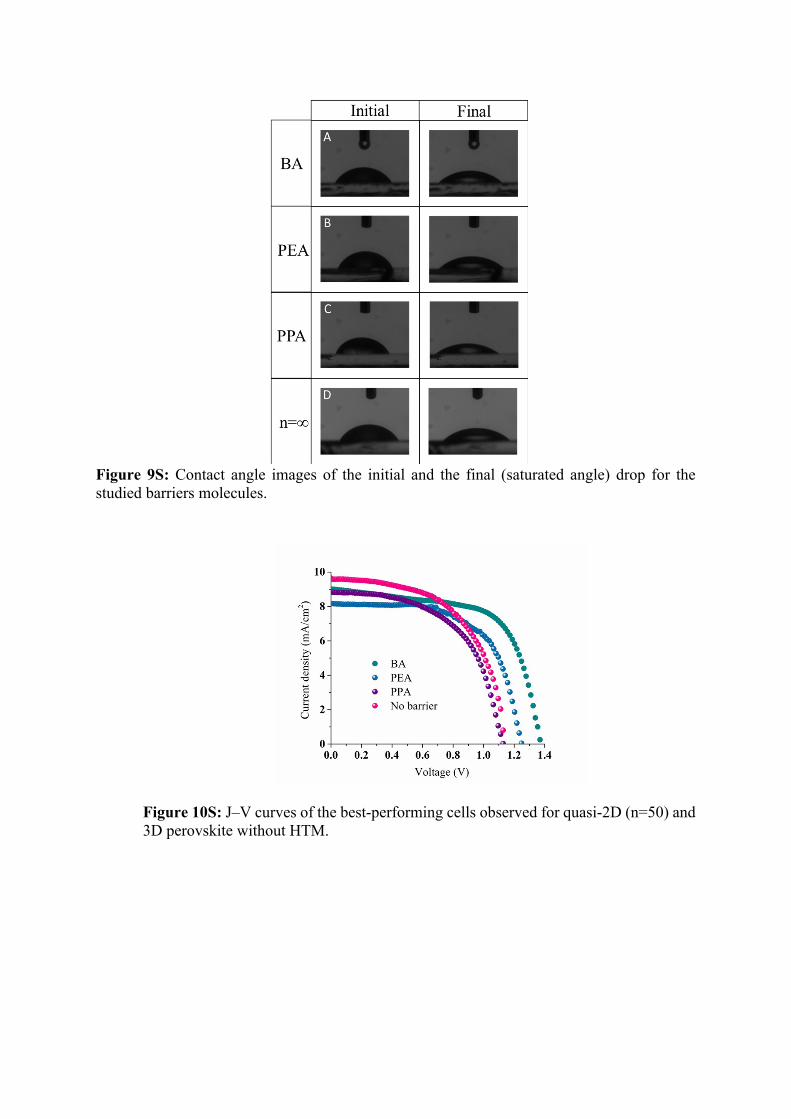
Figure 9S: Contact angle images of the initial and the final (saturated angle) drop for the studied barriers molecules.
Figure 10S: J–V curves of the best-performing cells observed for quasi-2D (n=50) and 3D perovskite without HTM.
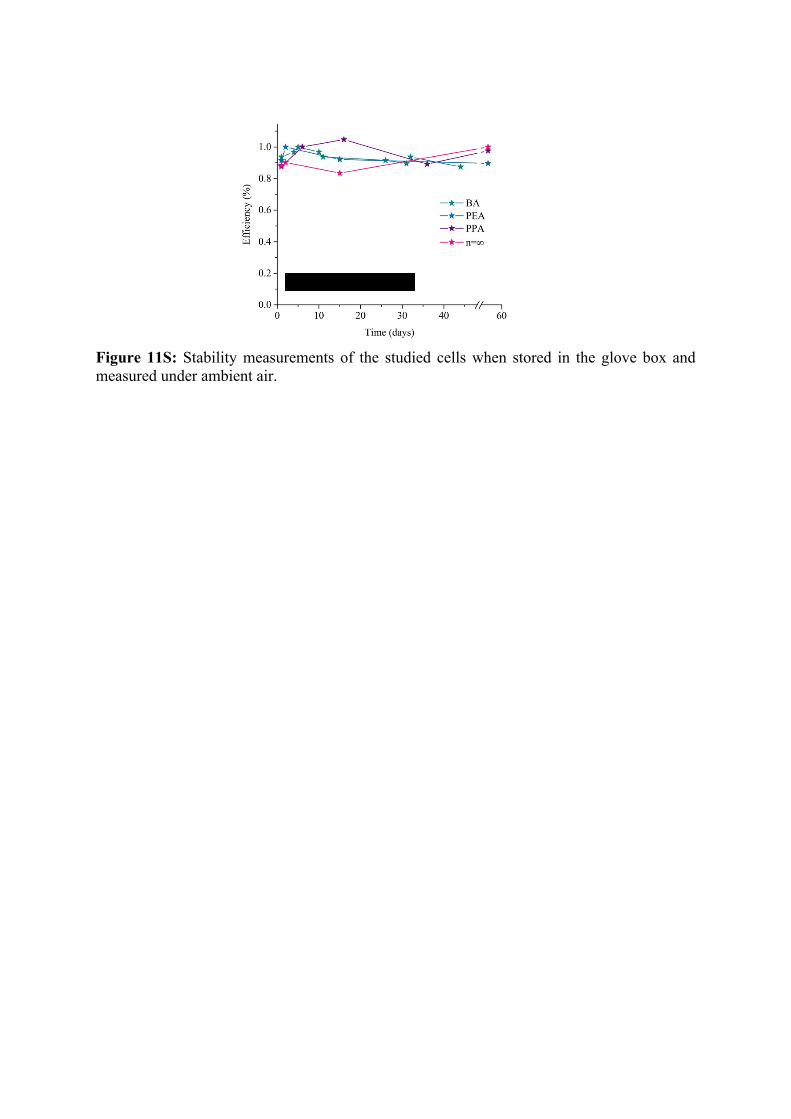
Figure 11S: Stability measurements of the studied cells when stored in the glove box and measured under ambient air.
Theoretical calculations
Technical details
The excitonic binding, Eb, energies were obtained from a fit of the absorbance spectra to the phenomenological spectrum of the Elliott formula [1], which contains the band gap and dispersion parameters for the excitonic and continuum transitions, respectively. The position of the absorbance peak is shifted to the “red”, with respect to the band gap, by the binding energy of the exciton. While the electrical band gap is not known from the optical experiment, the same Eb parameter is sensitive to the relative difference between the maximum of the first absorption peak and the minimum before the continuum shoulder. Thus, an experienced eye can see, even without calculations, that the excitons are more bound for n=1 than for n=50. Smaller contribution to Eb is correlated with the width of the absorption peak; Eb is higher for n=1 and PPA than for smaller molecules.
The electronic structure calculations were performed with the density functional method [2] implemented in the Quantum ESPRESSO code [3], which rests on the pseudopotentials for the atomic cores and plane waves. The generalized gradient approximation for the exchange-correlation functional was chosen for Perdew, Burk and Ernzerhof [4]. The kinetic energy cutoff for the wave functions wasset to 60 Ry. The geometries were optimized with the Broyden-Fletcher- Goldfarb-Shanno algorithm [5] until forces were smaller than 7·10-3 eV/Å . The band structures were accurately interpolated with the use of the maximally-localized Wannier functions [6,7] obtained with the wannier90 package [8]. The same numerical tool was used for the electrical conductivity calculations according to the Boltzmann semiempirical equations, which base on the energy bands dispersions [9] within the constant relaxation time approximation time assumed for 10 fs for all cases.
[1] Elliott, R. Intensity of Optical Absorption by Excitons. Phys. Rev. 108, 1384−1389 (1957)[2] Hohenberg, P.; Kohn, W. Inhomogeneous Electron Gas. Phys. Rev. 1964, 136, B864.[3] Giannozzi, P. et al. QUANTUM ESPRESSO: a modular and open-source software project for quantum simulations of materials. J. Phys.: Condens. Matter. 2009, 21, 395502.[4] Perdew, J. P.; Burke, K.; Ernzerhof, M. Generalized gradient approximation made simple.Phys. Rev. Lett. 1996, 77, 3865.[5] Fletcher, R. Practical methods of optimization; John Wiley & Sons, 2013.[6] Marzari, N.; Vanderbilt, D. Maximally Localized Generalized Wannier Functions for Composite Energy Bands. Phys. Rev. B: Condens. Matter Mater. Phys. 1997, 56, 12847.[7] Marzari, N.; Mostofi, A. A.; Yates, J. R.; Souza, I.; Vanderbilt, D. Maximally Localized Wannier Functions: Theory and Applications. Rev. Mod. Phys. 2012, 84, 1419−1475[8] Mostofi, A. A.; Yates, Y. R.; Lee, Y. S.; Souza, I.; Vanderbilt, D.; Marzari, N. wannier90: A Tool for Obtaining Maximally-Localised Wannier Functions. Comput. Phys. Commun. 2008, 178, 685−699.[9] Pizzi, G.; Volja, D.; Kozinsky, B.; Fornari, M.; Marzari, N. Boltz Wann: A Code for The Evaluation of Thermoelectric and Electronic Transport Properties with a Maximally-Localized Wannier Functions Basis. Comput. Phys. Commun. 2014, 185, 422−429.