Embed Size (px)
Citation preview

Supporting Information
Label-free Detection of pH Based on the I-Motif by Using an Aggregation-
Caused Quenching Strategy DNA peroxidase
Boshi Fu+, Jinguo Huang, Dongsheng Bai, Yalun Xie, Yang Wang, Shaoru Wang*, Xiang Zhou*
† College of Chemistry and Molecular Sciences, Key Laboratory of Biomedical Polymers of Ministry of Education, Wuhan University, Wuhan, Hubei, 430072, P. R. of China.,
¶ State Key Laboratory of Natural and Biomimetic Drugs, Peking University, Beijing, China.
Materials methods and instrumentation. The following solvents, compounds and reagents were commercially available: Perylene-3,4,9,10-tetra-carboxylic dianhydride was bought from Sigma-Aldrich. 2-Methyl-1-propanol, SuperDry was bought from J&K (Beijing, China). Methyl iodide, NaOH, sodium acetate and acetic acid were bought from SCRC (Shanghai, China). All the oligonucleotides were synthesized and purified with PAGE by Sangon Biochemistry Co.,Ltd. (Shanghai, China) All stock and buffer solutions were prepared using water purified with the RU Water Purification System (Millipore, Billerica, MA, USA). 1H and 13C NMR spectra were recorded on Varian Mercury 300 spectrometers, respectively. API-ES were recorded on Agilent LC/MS 6120B(Agilent, USA).
Cell culture
HeLa cells (CCTCC, China) were cultured in DMEM medium (Hyclone, Thermo Fisher Scientific Inc., MA) supplemented with 10% FBS ((Hyclone, Thermo Fisher Scientific Inc., MA), 1% penicillin and streptomycin. For all cell experiments, cells were trypsinized and seeded in a 96-well culture plates, and for confocal experience, cells were seeded in 35 mm glass-bottomed dishes, then incubated in a humidified 37 °C incubator supplied with 5.0% CO2. HeLa cells were digested by trypsin and washed with PBS buffer (10 mM, pH 7.4).
Circular Dichroic Studies. The circular dichroism spectra were collected on ChirascanTM CD spectroscopy (Applied Photophysics, Leatherhead, United Kingdom). CD spectra were collected from 220 to 330 nm and with a scanning speed of 200 nm/min. The bandwidth was 5 nm, and the response time was 2 s. All CD spectra were baseline-corrected for signal contributions due to the buffer and were the average of at least two runs. All spectra were taken at ambient temperature unless otherwise specified.
Fluorescent Emission Spectra. All Spectra were collected on PerkinElmer LS 55 with an excitation wavelength of 498 nm, the excitation and emission slit widths were 10 and 20 nm, respectively. All spectra were taken at ambient temperature unless otherwise specified.
1
Electronic Supplementary Material (ESI) for ChemComm.This journal is © The Royal Society of Chemistry 2015

Table S1 Sequences of oligomers used in the study.
Oligomer Sequence(from 5’to 3’)
oligo-M1 CCCTAACCCTAACCCTAACCC
oligo-M2 CCCCAAACCCCAAACCCCAAACCCC
oligo-M3 CCCCCTTTTCCCCCTTTTCCCCCTTTTCCCCC
oligo-K1 TAACCAATGTGCAGACTACTGT
Compound 1 was prepared by the literature methods1.
Molecular model study The molecular model of oligo-M1 in the single-strand conformation was built by nab program2 form Amber 123. The molecular model of oligo-M1 in the single-strand conformation was built by modifying the known crystal structure (PDB_ID: 1EL2)4. A series of essential minimization process and molecular dynamics were carried to get the optimize structures (Amber99 force field was used5). The structure of compound 1 was optimized with B3LYP/6-311G using Gaussian 09 and Gauss View 5.0 packages6.The flexible ligand docking was done with the DOCK6.0 module in DOCK6.17. Visualization was achieved by using UCSF Chimera8.
Calculations for sigmoidal transition midpoint value. The sigmoidal fit was done to processing data from spectra in origin8.0. The transition midpoint values were calculated using Logistic equation.
2
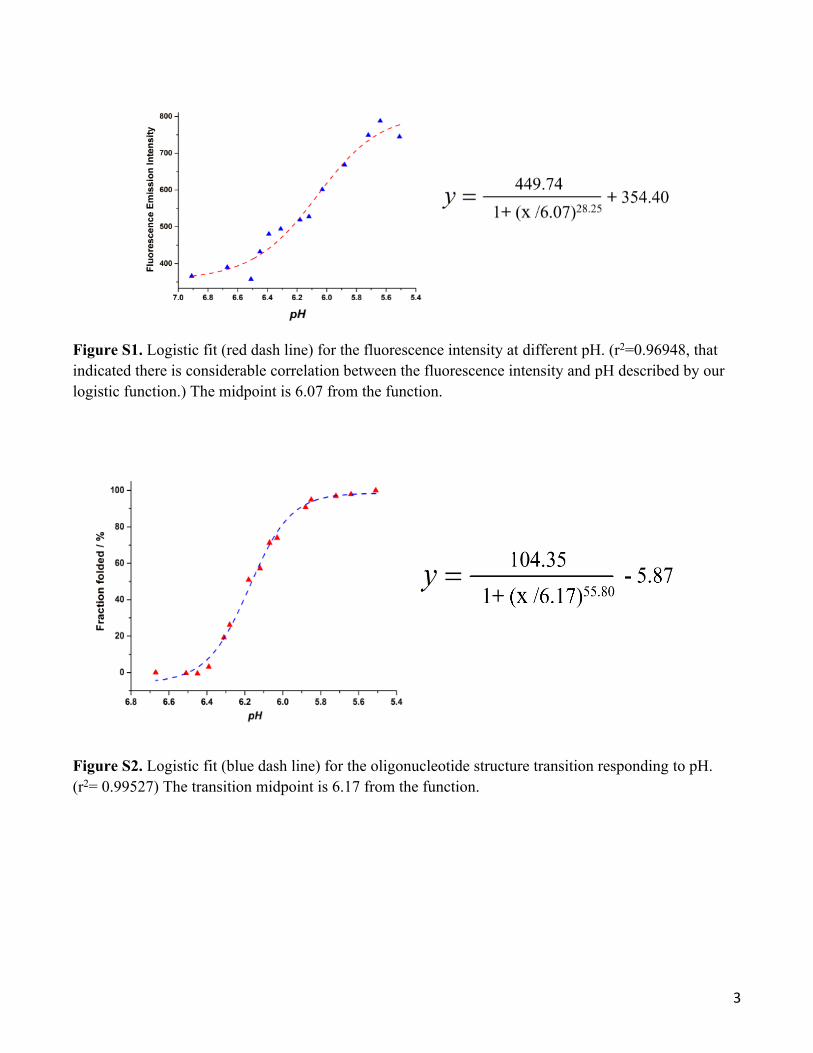
Figure S1. Logistic fit (red dash line) for the fluorescence intensity at different pH. (r2=0.96948, that indicated there is considerable correlation between the fluorescence intensity and pH described by our logistic function.) The midpoint is 6.07 from the function.
Figure S2. Logistic fit (blue dash line) for the oligonucleotide structure transition responding to pH. (r2= 0.99527) The transition midpoint is 6.17 from the function.
3
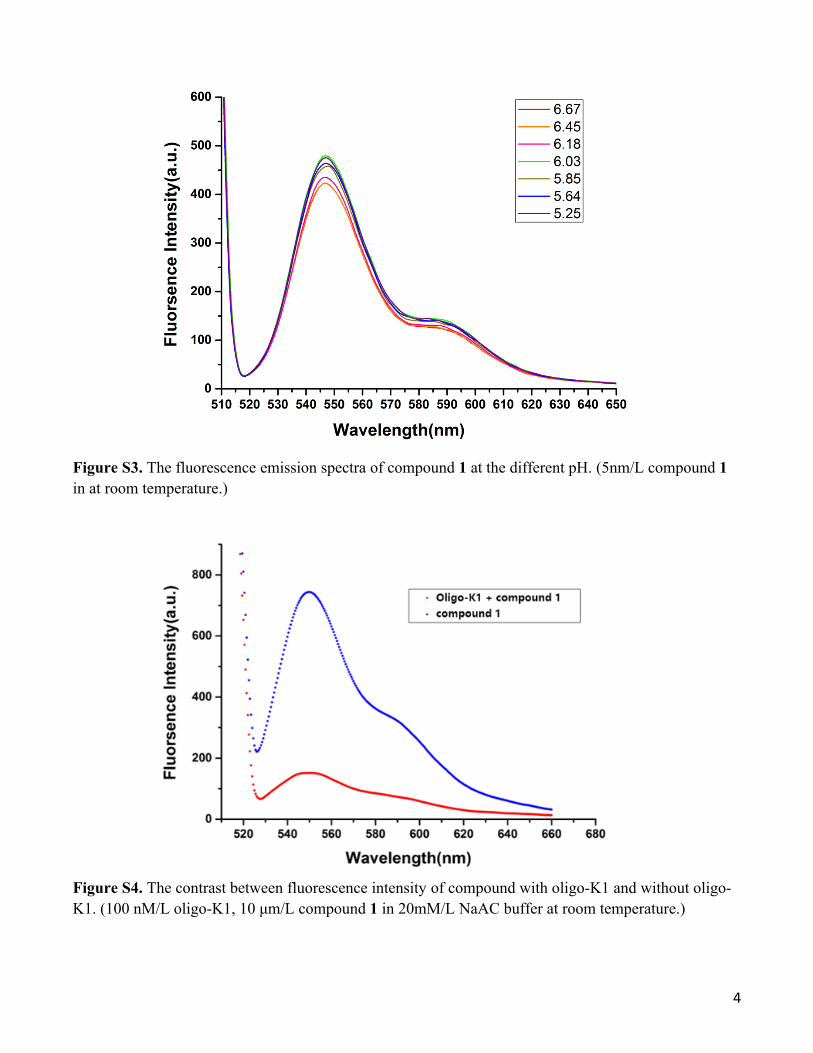
Figure S3. The fluorescence emission spectra of compound 1 at the different pH. (5nm/L compound 1 in at room temperature.)
Figure S4. The contrast between fluorescence intensity of compound with oligo-K1 and without oligo-K1. (100 nM/L oligo-K1, 10 μm/L compound 1 in 20mM/L NaAC buffer at room temperature.)
4

Figure S5. The fluorescence emission spectra of Oligo-K1 (the single-strand oligonucleotide) with compound 1 at different pH. (100 nM/L oligo-K1, 10 μM/L compound 1 in 20 mM/L NaAC buffer at room temperature.)
Figure S6. The circular dichroism spectra of the oligo-M1 at different pH values (5.25,5.51,5.64,5.72,5.88,6.03,6.12,6.18,6.31,6.39,6.45,6.51,6.67,6.91). All samples were prepared by 10 µM/L oligo-M1, in 20 mM/L NaAC buffer at room temperature.
5

Figure S7. The fluorescence emission spectra of compound 1 (50 μm/L) and Oligo-M2 (100 nM/L) at different pH values.
Figure S6. The circular dichroism spectra of Oligo-M2 (10 µM/L) at different pH values.
6
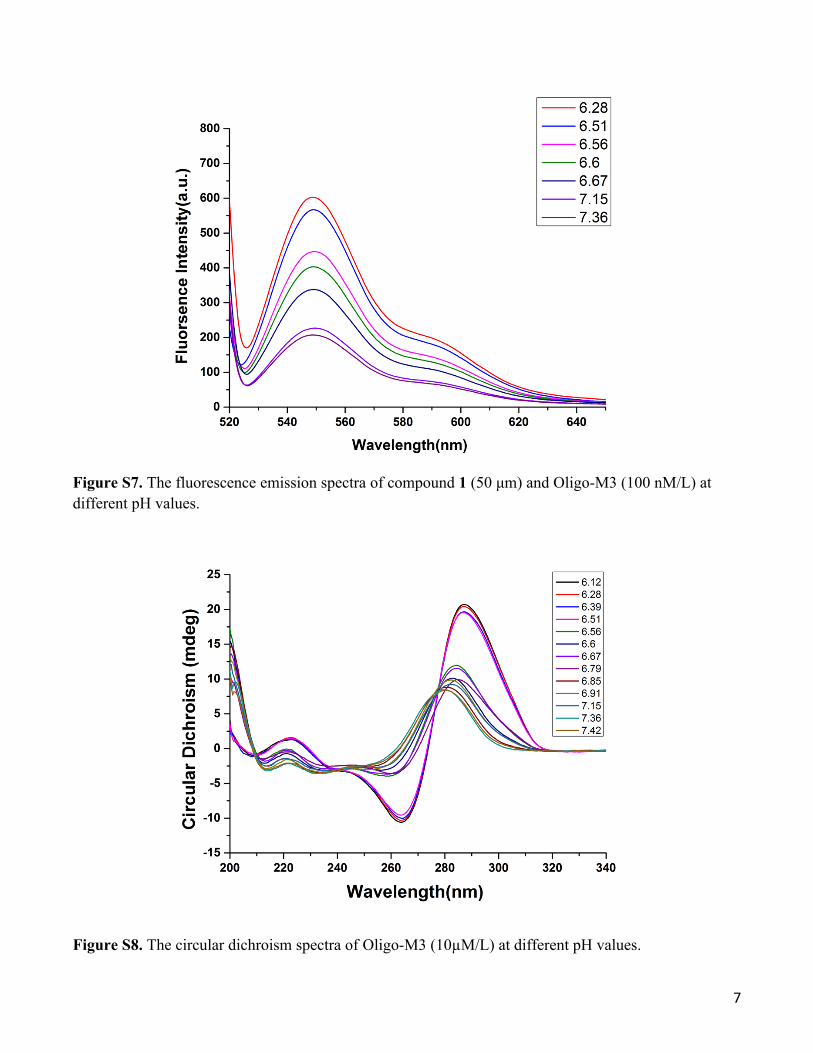
Figure S7. The fluorescence emission spectra of compound 1 (50 μm) and Oligo-M3 (100 nM/L) at different pH values.
Figure S8. The circular dichroism spectra of Oligo-M3 (10µM/L) at different pH values.
7

Figure S9. (A) The circular dichroism of Oligo-M1 with Compound 1. (B) The circular dichroism of Oligo-M1 without Compound 1. (C) The melting temperature of Oligo-M1 with Compound 1,Tm=43.22. (D) The melting temperature of Oligo-M1 with Compound 1,Tm=43.69. All sample contained 20mM NaAC buffer, 10µm DNA, pH=5.5. CD absorbance at 290 nm was recorded in a quartz cuvette of 0.1 cm path length.
8
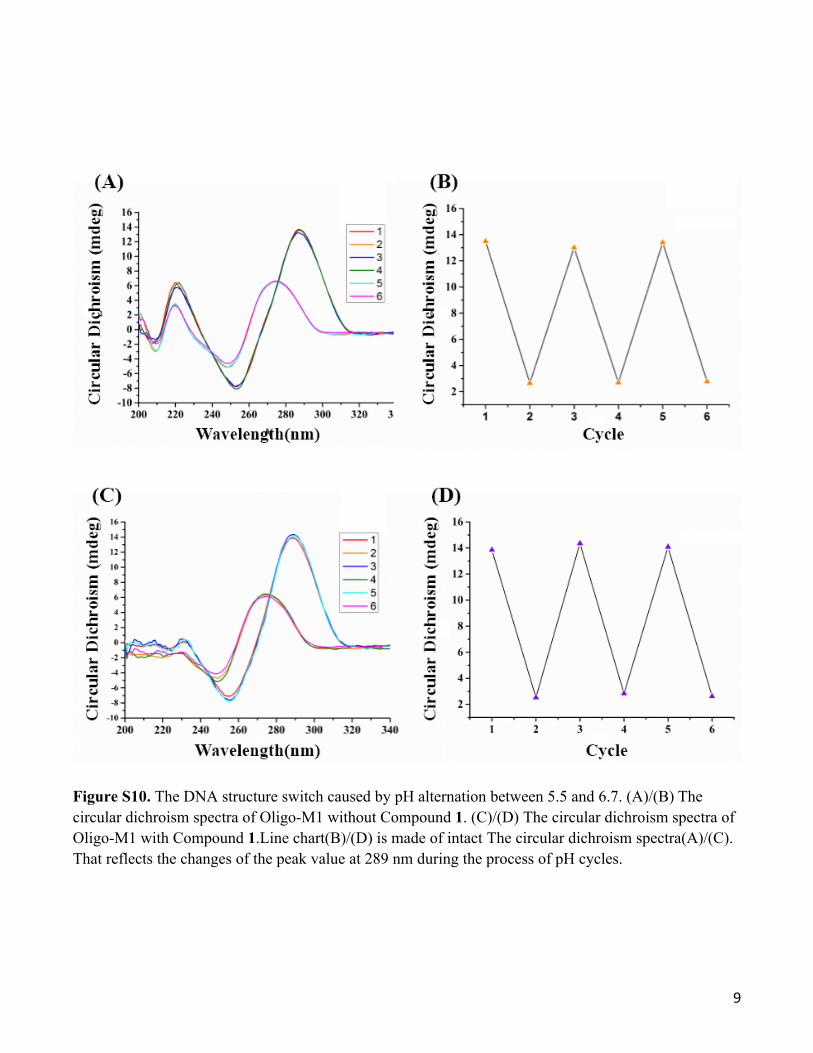
Figure S10. The DNA structure switch caused by pH alternation between 5.5 and 6.7. (A)/(B) The circular dichroism spectra of Oligo-M1 without Compound 1. (C)/(D) The circular dichroism spectra of Oligo-M1 with Compound 1.Line chart(B)/(D) is made of intact The circular dichroism spectra(A)/(C). That reflects the changes of the peak value at 289 nm during the process of pH cycles.
9

Figure S11. (A) Molecular model of Oligo-M1 in the single-strand conformation with compound 1. The red arrows indicate predicted binding sites, and adequate intervals are provided to accommodate the aggregation of compound 1. (B) Molecular model of Oligo-M1 in the i-motif conformation. There are no rational binding sites for the monomers or the aggregation of compound 1. (C) 3-D structure of compound 1 simulated by the Gaussian 09W Program.
1. B. Wang, C. Yu, Angew Chem Int Edit, 2010, 49, 1485-1488.
2. D. A. Case, T. E. Cheatham, T. Darden, H. Gohlke, R. Luo, K. M. Merz, A. Onufriev, C. Simmerling, B. Wang, R. J. Woods, J Comput Chem, 2005, 26, 1668-1688.
3. D. Case, T. Darden, T. Cheatham III, C. Simmerling, J. Wang, R. Duke, R. Luo, R. Walker, W. Zhang, K. Merz, University of California, San Francisco 2012, 1, 3.
4. A. T. Phan, M. Guéron, J.-L. Leroy, J Mol Biol, 2000, 299, 123-144.
5. T. E. Cheatham III, P. Cieplak, P. A. Kollman, J Biomol Struct Dyn 1999, 16, 845-862.
10

6. M. Frisch, G. Trucks, H. B. Schlegel, G. Scuseria, M. Robb, J. Cheeseman, G. Scalmani, V. Barone, B. Mennucci, G. Petersson, Inc., Wallingford, CT 2009, 200.
7. P. T. Lang, S. R. Brozell, S. Mukherjee, E. F. Pettersen, E. C. Meng, V. Thomas, R. C. Rizzo, D. A. Case, T. L. James, I. D. Kuntz, Rna, 2009, 15, 1219-1230.
8. E. F. Pettersen, T. D. Goddard, C. C. Huang, G. S. Couch, D. M. Greenblatt, E. C. Meng, T. E. Ferrin, J J Comput Chem, 2004, 25, 1605-1612.
11

![Human genome-wide repair map of DNA damage caused by the ... · Human genome-wide repair map of DNA damage caused by the cigarette smoke carcinogen benzo[a]pyrene Wentao Li a, Jinchuan](https://img.pdfslide.net/doc/110x75/5f0b5aae7e708231d4301a3b/human-genome-wide-repair-map-of-dna-damage-caused-by-the-human-genome-wide-repair.jpg)