Embed Size (px)
Citation preview
Page | - 1 -
Supporting Information
Cellulose Derived Graphenic Fibers for Capacitive Desalination of
Brackish Water
Nalenthiran Pugazhenthiran,1 Soujit Sen Gupta,
1 Anupama Prabhath,
1 Muthu Manikandan,
1
Jakka Ravindran Swathy,1 V. Kalyan Raman
2 and Thalappil Pradeep
1,*
1DST Unit of Nanoscience (DST UNS) and Thematic Unit of Excellence (TUE). Department
of Chemistry, Indian Institute of Technology Madras, Chennai 600 036, India.
2Centre of Excellence (Biotechnology) & Water and wastewater Technology, Thermax
Limited, Pune 411019, India
E-mail: [email protected]; Fax: +91-44-2257-0545.

Page | - 2 -
Figure S1. EDS spectrum of the layer-by-layer stacked carbon-graphite electrode before SiO2
etching. Inset: Its corresponding SEM image and elemental mapping images.
C
O Si
Si
C
O
Energy, keV
Page | - 3 -
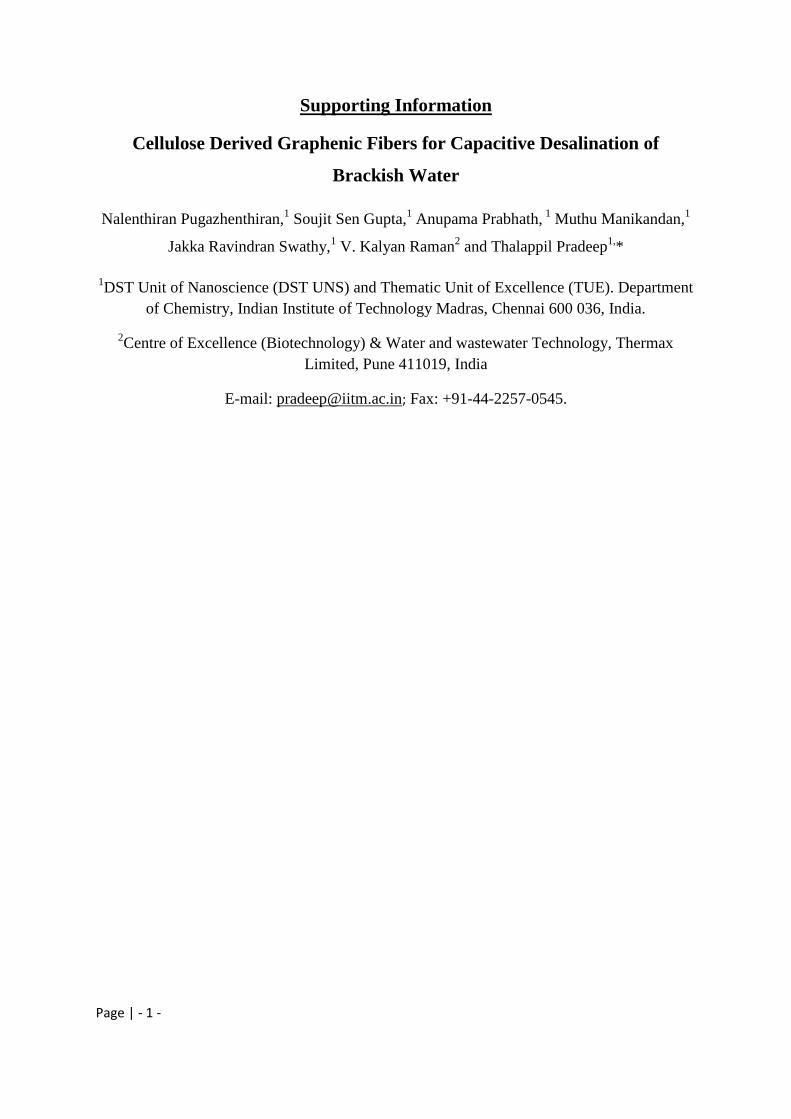
Figure S2. EDS spectrum of the layer-by-layer stacked carbon-graphite electrode after
etching SiO2. Inset: SEM and Elemental mapping images.
Energy, keV
C
Si O
C
O
Page | - 4 -
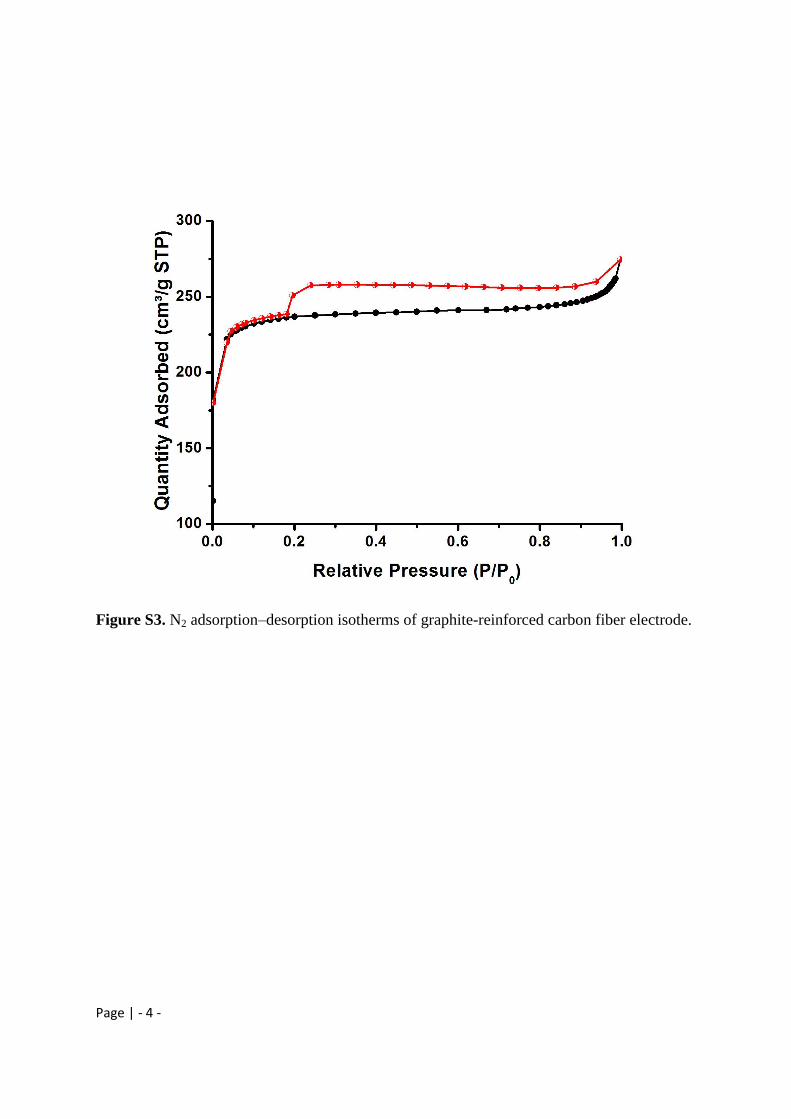
Figure S3. N2 adsorption–desorption isotherms of graphite-reinforced carbon fiber electrode.
Page | - 5 -
0 2 4 6 8 10 12 14 16 180
20
40
60
80
100
Cu
rren
t (m
A)
Potential (mV)
-0.8 -0.6 -0.4 -0.2 0.0 0.2-0.25
-0.20
-0.15
-0.10
-0.05
0.00
0.05
0.10
0.15
Cu
rren
t(A
)
Potential(V)
2 mV/s
10 mV/s
50 mv/s
100 mV/s
200 mV/s
A B
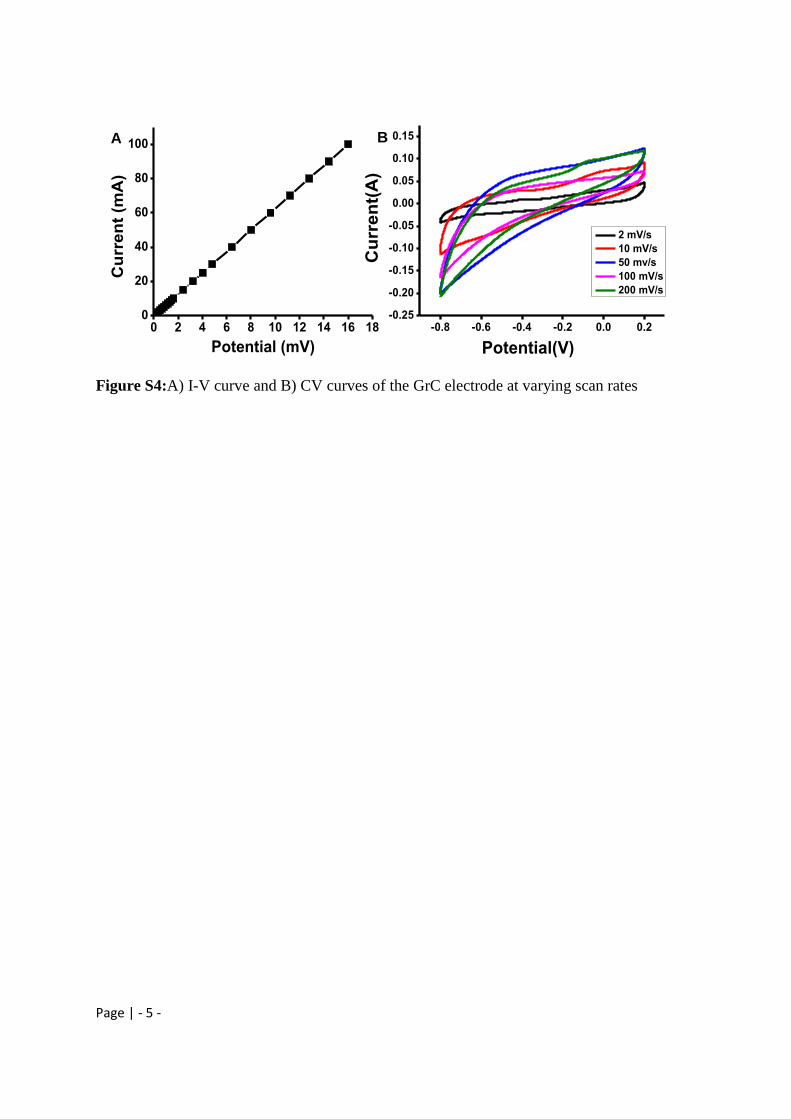
Figure S4:A) I-V curve and B) CV curves of the GrC electrode at varying scan rates
Page | - 6 -
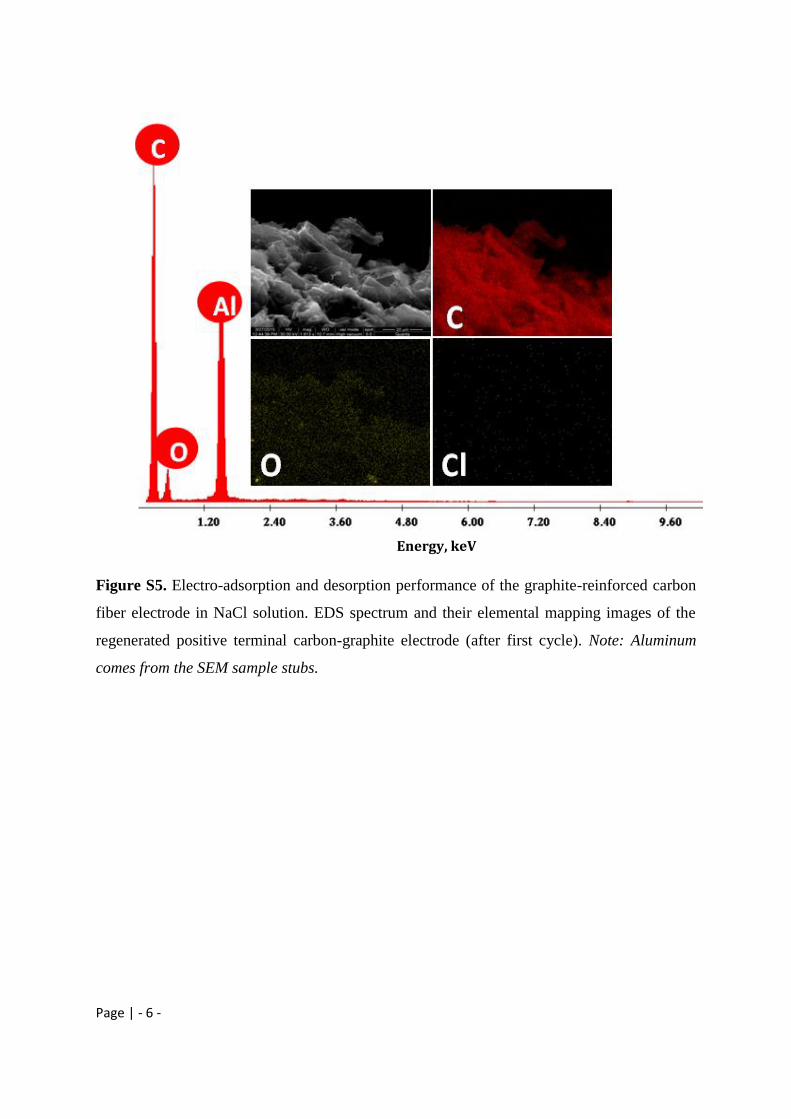
Figure S5. Electro-adsorption and desorption performance of the graphite-reinforced carbon
fiber electrode in NaCl solution. EDS spectrum and their elemental mapping images of the
regenerated positive terminal carbon-graphite electrode (after first cycle). Note: Aluminum
comes from the SEM sample stubs.
Energy, keV
Page | - 7 -
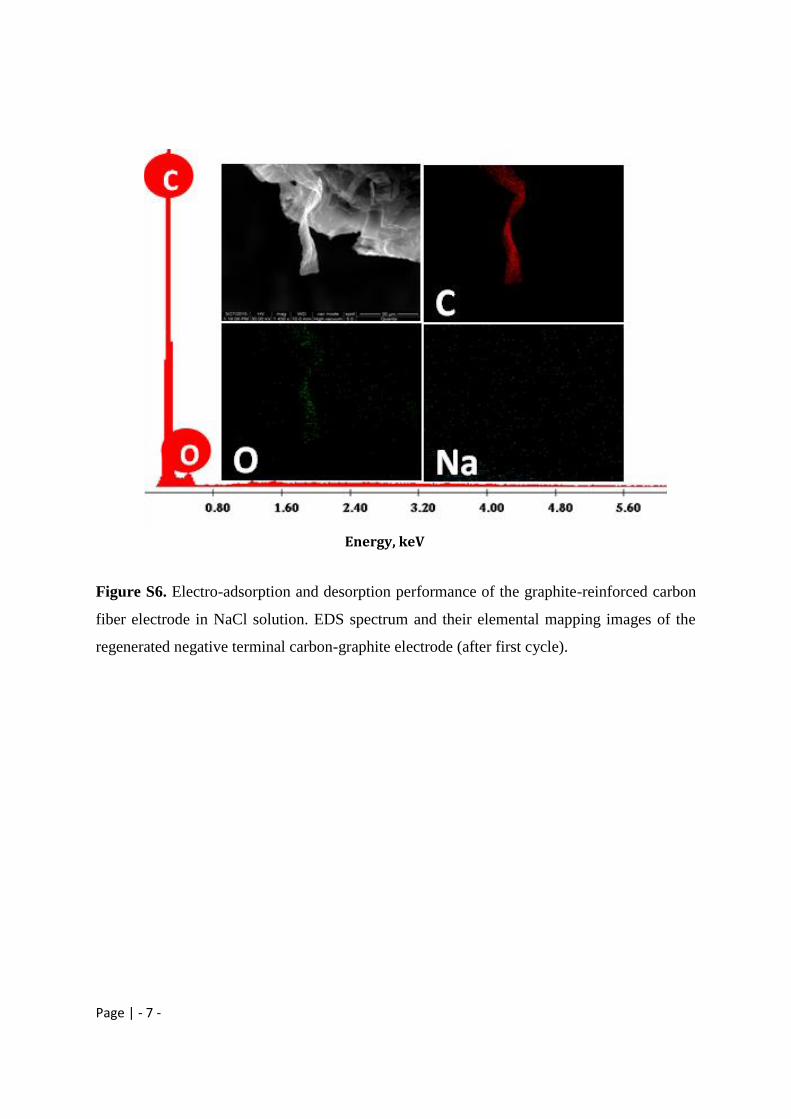
Figure S6. Electro-adsorption and desorption performance of the graphite-reinforced carbon
fiber electrode in NaCl solution. EDS spectrum and their elemental mapping images of the
regenerated negative terminal carbon-graphite electrode (after first cycle).
Energy, keV
Page | - 8 -
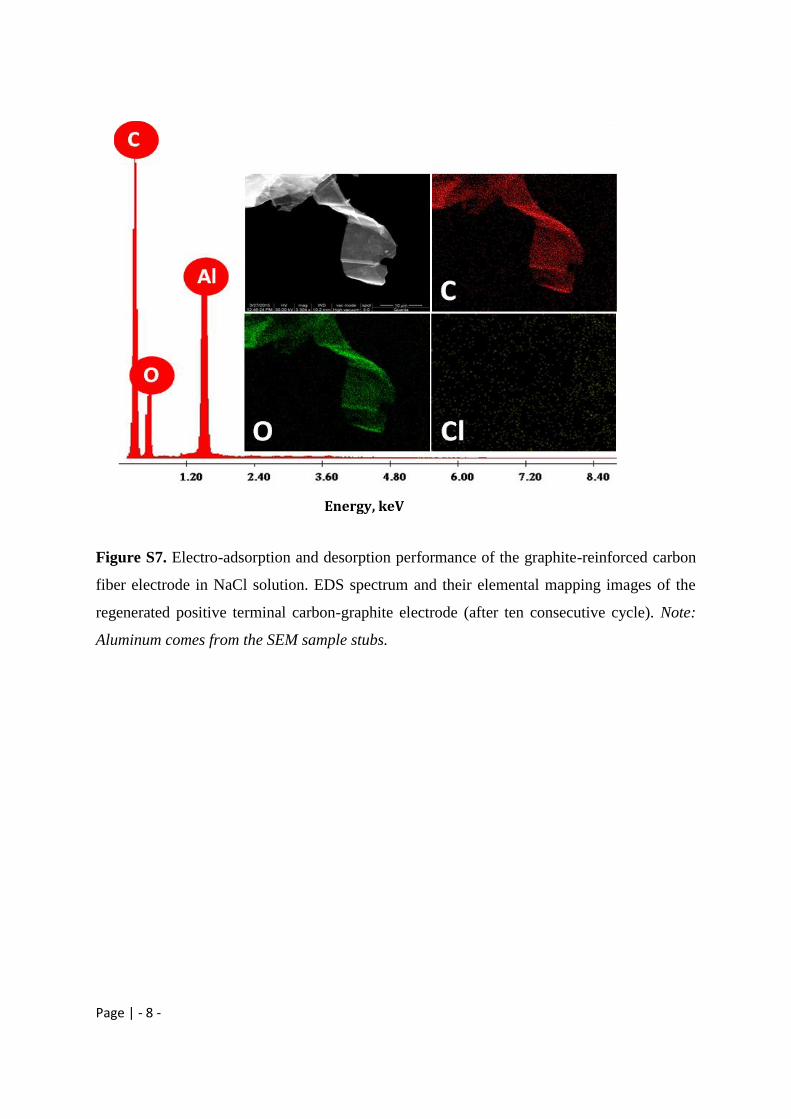
Figure S7. Electro-adsorption and desorption performance of the graphite-reinforced carbon
fiber electrode in NaCl solution. EDS spectrum and their elemental mapping images of the
regenerated positive terminal carbon-graphite electrode (after ten consecutive cycle). Note:
Aluminum comes from the SEM sample stubs.
Energy, keV

Page | - 9 -
Figure S8. Electro-adsorption and desorption performance of the graphite-reinforced carbon
fiber electrode in NaCl solution. EDS spectrum and their elemental mapping images of the
regenerated negative terminal carbon-graphite electrode (after ten consecutive cycle).
Energy, keV

Page | - 10 -
Figure S9. Plot of CDI results of electro-adsorption and desorption performance of the
graphite-reinforced carbon fiber electrode in different charged species ie., Na+, Mg
2+ and
Fe3+
.
Time (min)

Page | - 11 -
Energy, keV
O
C
CaMg
MgO Ca
C0 20 40 60 80 100 1200.6
0.7
0.8
0.9
1.0
0 20 40 60 80 100 120
Electro-desorption
Electro-adsorption
Time (min)
Ct/C
0
0.0
0.1
0.2
0.3
0.4
1-(C
0 /Ct )
Figure S10. Electro-adsorption and electro-desorption performance of the graphite-
reinforced carbon fiber electrode in MgCl2 solution. EDS spectrum and their elemental
mapping images of the negative terminal after electro-adsorption of the carbon-graphite
electrode. Note: Calcium is from the water used.
C
Page | - 12 -
Energy, keV
FeO
C
C
O Fe
0 20 40 60 80 100 120
0.4
0.6
0.8
1.0
0 20 40 60 80 100 120
Electro-adsorption
Time (min)
Ct/C
0
0.0
0.2
0.4
0.6
Electro-desorption 1-(C
0 /Ct )
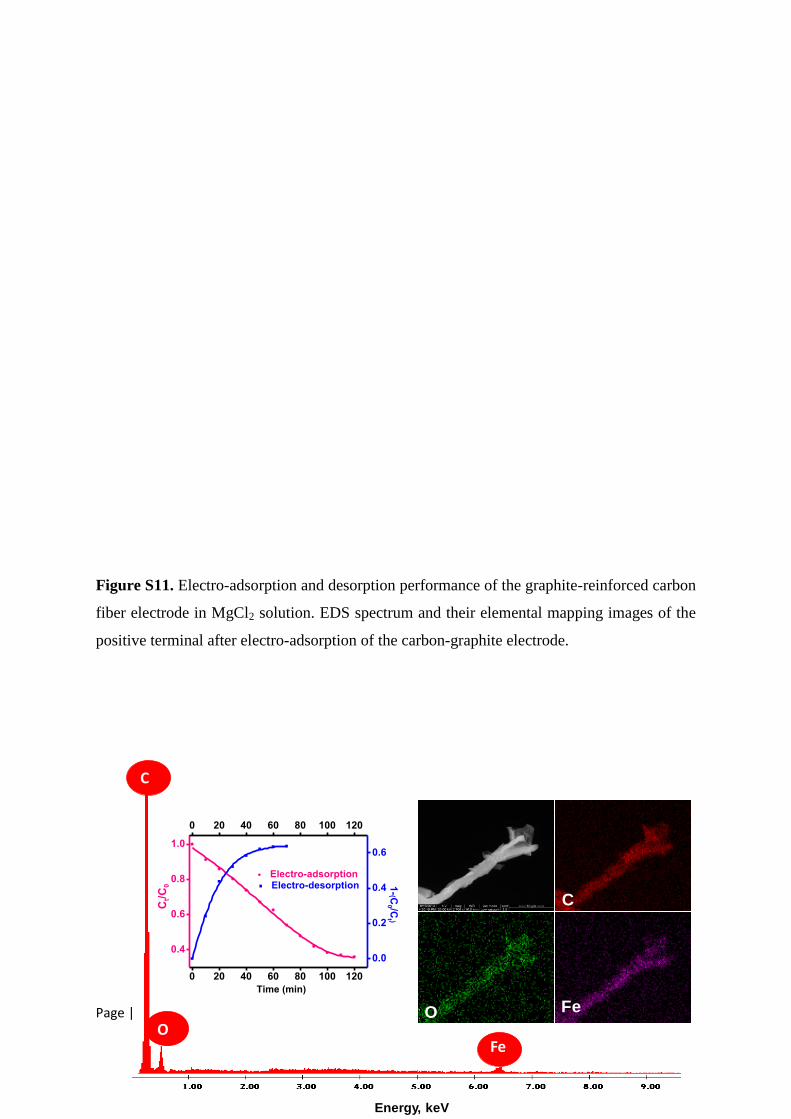
Figure S11. Electro-adsorption and desorption performance of the graphite-reinforced carbon
fiber electrode in MgCl2 solution. EDS spectrum and their elemental mapping images of the
positive terminal after electro-adsorption of the carbon-graphite electrode.
Page | - 13 -
Figure S12. Electro-adsorption and desorption performance of the graphite-reinforced carbon
fiber electrode in FeCl3 solution. EDS spectrum and their elemental mapping images of the
negative terminal after electro-adsorption on the carbon-graphite electrode.
Page | - 14 -
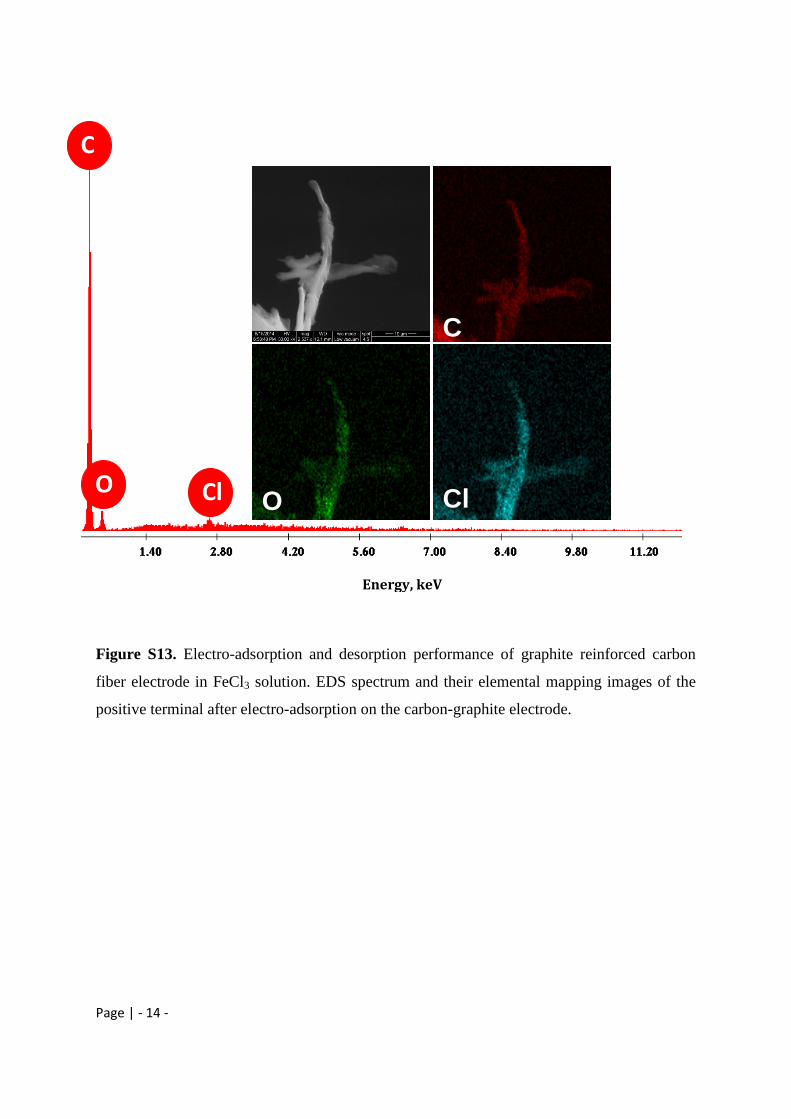
Figure S13. Electro-adsorption and desorption performance of graphite reinforced carbon
fiber electrode in FeCl3 solution. EDS spectrum and their elemental mapping images of the
positive terminal after electro-adsorption on the carbon-graphite electrode.
C
O Cl
Energy, keV
C
O Cl
Page | - 15 -
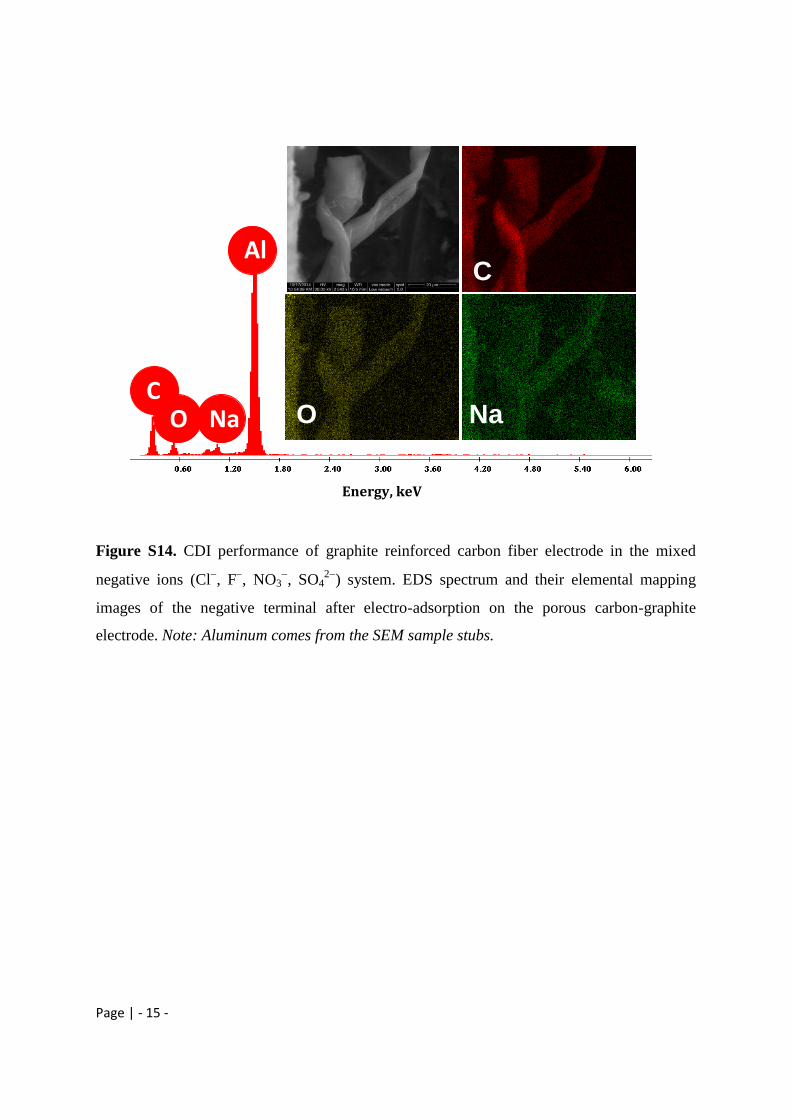
Figure S14. CDI performance of graphite reinforced carbon fiber electrode in the mixed
negative ions (Cl, F
, NO3
, SO4
2) system. EDS spectrum and their elemental mapping
images of the negative terminal after electro-adsorption on the porous carbon-graphite
electrode. Note: Aluminum comes from the SEM sample stubs.
O C
Na
Al
Energy, keV
C
Na O
Page | - 16 -
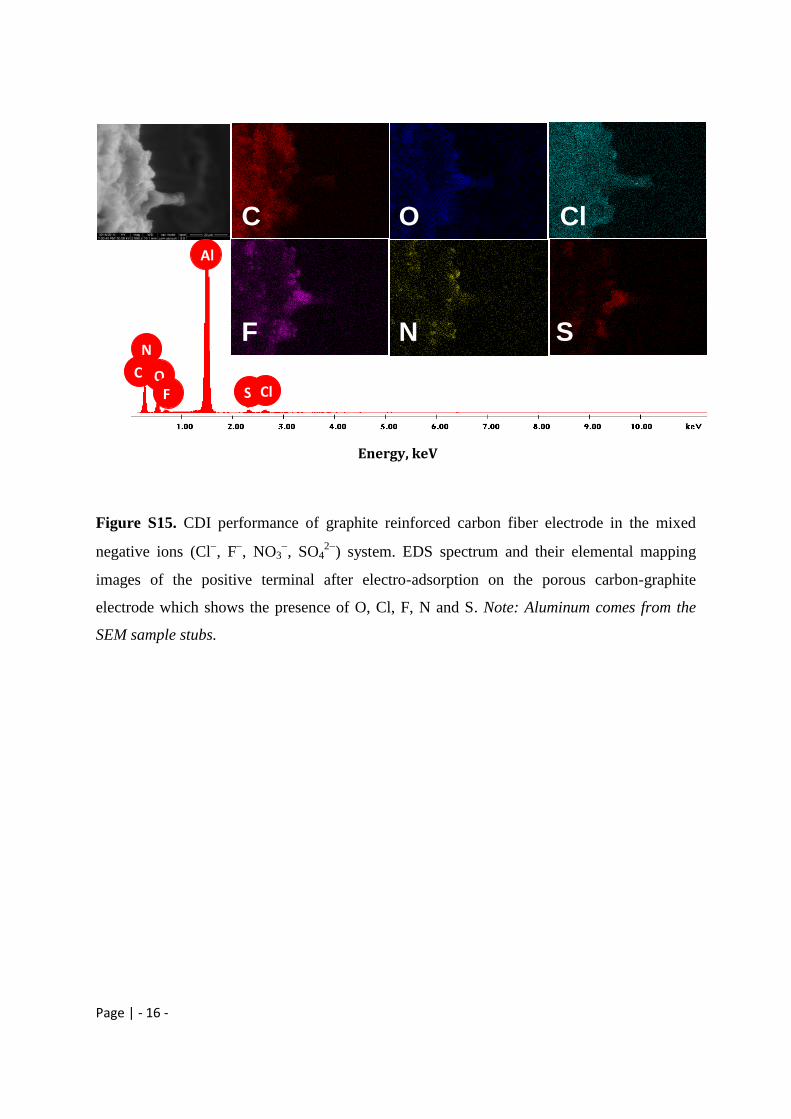
Figure S15. CDI performance of graphite reinforced carbon fiber electrode in the mixed
negative ions (Cl, F
, NO3
, SO4
2) system. EDS spectrum and their elemental mapping
images of the positive terminal after electro-adsorption on the porous carbon-graphite
electrode which shows the presence of O, Cl, F, N and S. Note: Aluminum comes from the
SEM sample stubs.
Energy, keV
C O Cl
F N S
O
N
C
F S Cl
Al
Page | - 17 -
0.4
0.6
0.8
1.0
0.7
0.8
0.9
1.0
0 20 40 60 80 100 1200.8
0.9
1.0
250 mg/L
500 mg/L
1000 mg/L
Time (min)
C0/C
t
C
B
A
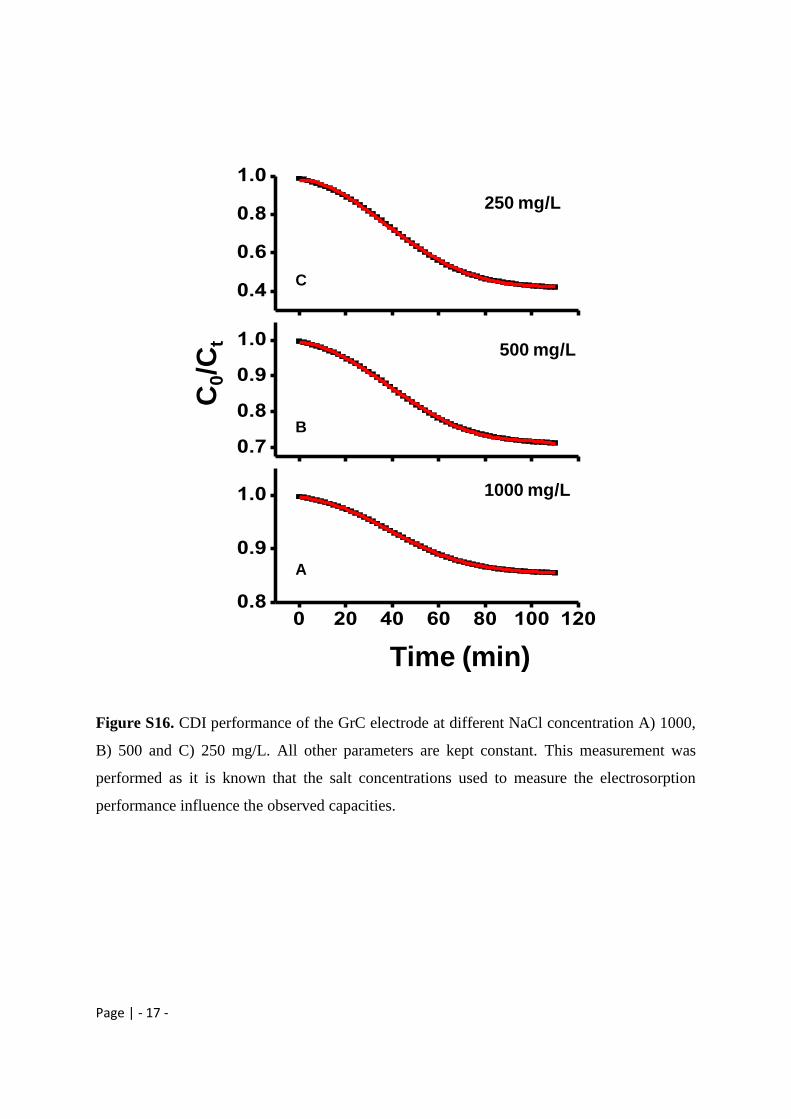
Figure S16. CDI performance of the GrC electrode at different NaCl concentration A) 1000,
B) 500 and C) 250 mg/L. All other parameters are kept constant. This measurement was
performed as it is known that the salt concentrations used to measure the electrosorption
performance influence the observed capacities.