Embed Size (px)
Citation preview
S1
Supporting information
Dual Tuning of Ni−Co−A (A = P, Se, O) Nanosheets by Anion
Substitution and Holey Engineering for Efficient Hydrogen Evolution
Zhiwei Fang,†§ Lele Peng,†§ Yumin Qian,† Xiao Zhang,† Yujun Xie,‡ Judy J. Cha,‡ Guihua Yu†*
† Materials Science and Engineering Program and Department of Mechanical Engineering, The
University of Texas at Austin, Austin, Texas 78712, United States
‡ Department of Mechanical Engineering and Materials Science, Yale University, New Haven,
Connecticut 06520, United States
§These authors contributed equally to this work.
*Email: [email protected]

S2
Experimental Section:
Synthesis of NiCo(OH)x/rGO Hybrid Intermediate:
GO is prepared from purified natural graphite by a modified Hummers method. 0.4 mg/mL of
GO suspension was prepared by adding 30 mg of GO into 75 mL EG and was ultrasonicated for 2 h.
After 0.5 mmol Ni(Ac)2·4H2O and 1.0 mmol Co(Ac)2·4H2O were added to 25mL EG, Ni2+ /Co2+
mixed solution (Ni2+ /Co2+=1:2) was added to GO suspension and refluxed at 170 ℃ for 2 h. After
the reaction, the final products were centrifuged at 7800 rpm for 10 min, and washed with water and
ethanol. The hybrid intermediate was dried by the freeze-drying method. All chemicals were used
without further purification and purchased from commercial sources.
Synthesis of NCO Holey Nanosheets:
NiCo(OH)x/rGO hybrid intermediate is annealed at 400 ℃ in the air for 2 h with a heating rate
of 0.5 ℃ min─1 from room temperature, and the final product is NiCo2O4. Synthesis of NCO holey
nanosheets with different Ni/Co ratio was similar to that of the NCO holey nanosheets except for the
different amount of NiAc2 and CoAc2 in the media.
Samples Ni(Ac)2·4H2O / mmol Co(Ac)2·4H2O / mmol Molar ratio of Ni in oxide
(Ni/Ni+Co)/%
Co3O4 0 1.5 0
NiCo2O4 0.5 1.0 33
NiCoOx 0.75 0.75 50
NiO 1.5 0 100
Synthesis of NCS Holey Nanosheets:
NiCo2Se4 holey nanosheets were obtained by a solution-based phase transformation: 0.04mmol
oxide precursor (~10mg) was added into 25mL EG was ultrasonicated for 2h, and 0.20mmol Na2SeO3
(~29mg, a little excess) was dissolved into 15mL EG. And then NiCo2O4 EG dispersion was added
to Na2SeO3 EG solution under vigorous stirring. After dropping 1mL N2H4 into the solution, the
mixture was refluxed at 180°C for 2 h. The possible transformation reactions are as follows:
SeO32 ̶+ N2H4 = Se + N2 + 2OH ̶ + H2O
Se + 6OH ̶ = 2Se2 ̶ + SeO32 ̶ + 3H2O
2Co3++N2H4+2OH ̶ =2Co2+ +N2 + 2H2O
Se+3Se2 ̶ + Ni2+ + 2Co2+ = NiCo2Se4

S3
It should be noted that the transformation reaction for holey nanosheets is easier, compared with bulk
phase, due to the smaller size and high surface area of nanoparticles. Synthesis of other selenides is
similar to that of the NCS except for the oxide precursor with a different composition.
Synthesis of NCP holey Nanosheets:
NCP holey nanosheets were obtained by a chemical vapor deposition phase transformation:
0.04mmol oxide precursor (~10 mg) and 264 mg NaHPO2·H2O (molar ratio: ~1:30) are placed at
two porcelains. NaH2PO2 at the upstream side of the furnace. Subsequently, the samples were heated
at 300°C for 2 h with a heating speed of 10 °C min─1 in Ar atmosphere. The product was collected
after cooled to ambient temperature under Ar. The possible transformation mechanism:
4NaH2PO2·H2O = 2PH3 + 5H2O + Na4P2O7 (Decomposition, T >250℃)
PH3 + Ni(Ⅱ)Co(Ⅱ,Ⅲ)Ox → NiCoO2 (NiO·CoO) + P + H2O (Reduction)
4PH3 + 3NiCoO2 = 3NiCoP + P + 6H2O (Phosphidation)
Synthesis of other phosphides is the similar to that of the NCP holey nanosheets except for the oxide
precursor with a different composition.
Synthesis of NCP Nanosheets (No Holes):
1mmol CoCl2·6H2O, 0.5mmol NiCl2·6H2O and 1.5mmol HMT (Hexamethylenetetramine)
were dispersed in 150mL H2O and refluxed at 120℃ for 1h. After the reaction, the final products
were centrifuged at 7800rpm for 10min, and washed with water and ethanol. After freeze-drying, the
process is similar to that of the NCP holey nanosheets except for the precursor.
Structural Characterization:
Powder XRD patterns were collected on a Philips Vertical Scanning diffractometer to identify
the phase of the as-synthesized samples. SEM, EDX, STEM (Hitachi S5500) and TEM (JEOL
2010F) were used to characterize the morphology of the samples.
Electrical Transport Property Measurement:
The NCO, NCS and NCP holey nanosheet powders were cold-pressed (hydraulically) into
pellets with a diameter of 3mm by a physical property measurement system (PPMS-9, Quantum
Design) using four-point probe method under high vacuum condition.
Electrochemical Measurement:
All of the HER measurements performed on Ni foam electrode were under identical conditions
with the same catalyst mass loading: 10 mg of catalyst and 100 µL of 5 wt% Nafion solution were

S4
dispersed in 0.9 mL ethanol solvent by 30 min sonication to form a homogeneous ink. 50 μL of the
catalyst dispersion (10.0 mg mL─1) were then transferred onto the Ni foam electrode (NF, the
pretreated Ni foam with a fixed area of 0.5 cm × 0.5 cm coated with water-resistant silicone glue,
double-faced) via a drop casting approach. The mass loading of catalyst on Ni foam is 1.0 mg cm─2.
The HER measurements performed on glassy carbon electrode (GCE) were also under the identical
conditions with the same catalyst mass loading: 4 mg of catalyst and 40 µL of 5 wt% Nafion solution
were dispersed in 1.0 mL ethanol solvent by 30 min sonication to form a homogeneous ink. 5 μL of
the catalyst dispersion (4.0 mg mL─1) were then transferred onto the glassy carbon rotating disk
electrode (RDE, 0.07 cm2, 1600 rpm, Pine Research Instrumentation, USA) via a controlled drop
casting approach.
All the electrochemical measurements for HER and OER test were conducted in a three-
electrode electrochemical cell using saturated Ag/AgCl electrode as the reference electrode, a
platinum wire as the counter electrode and the sample modified glassy carbon electrode as the
working electrode on a BioLogic Instrument (BioLogic VMP-3model). For HER test, linear sweep
voltammograms (LSV) polarization curves were obtained by sweeping the potential from 0 V to 0.8
V at a sweep rate of 5 mV s−1 in 1.0M KOH. For OER test, cyclic voltammograms (CVs) were
performed at a scan rate of 50 mV s─1 from 0~0.8V (vs. saturated Ag/AgCl electrode). After CV
activation for 20 cycles, LSV polarization curves were obtained by sweeping the potential from 0 V
to 0.8 V at a sweep rate of 5 mV s−1 in 1.0 M KOH solution, corrected by 95% IR-correction. For the
chronoamperometric test, a static overpotential was fixed for a certain time during the continuous
electrocatalytic process to obtain the curve of the time dependence of the current density. The
chronopotentiometric measurement was performed at a current density of 10 mA cm─2.
Electrochemical Calculation:
The potentials in this work were converted to a reversible hydrogen electrode (RHE) scale
according to the Nernst equation (ERHE = EAg/AgCl + 0.059 pH + 0.197); the overpotential (η) was
calculated according to the following formula: η (V) = ERHE - 1.23 V.
The values of TOF (turnover frequency) were calculated by assuming that every atom (Ni, Co,
P) is involved in the catalysis (lower TOF limits were calculated):
𝑇𝑂𝐹 =𝑗 × 𝐴
2 × 𝐹 × 𝑛
where j (mA cm─2) is the measured current density at η = 200 mV, A (0.5 cm─2) is the geometry
surface area of Ni foam electrode, the number 2 means 4 electrons mol─1 of O2, F is Faraday's
constant (96485C mol─1), and n is the moles of coated metal atom on the electrode calculated by
assuming the sample is composed of solid 10 nm particles.1

S5
Computational Details:
The first principles calculations based on the Density Functional Theory (DFT) were performed
within spin-polarized generalized gradient approximation (GGA). Core electron states were
represented by the SG15 Optimized Norm-Conserving Vanderbilt pseudopotentials2 method as
implemented in PWMAT.3 The Perdew–Burke–Ernzerhof4 exchange correlation functional and a
plane wave representation for the wave function with a cut-off energy of 50 Ry were used. Lattice
parameters were fully relaxed, then six transition metal layer slab separated by a vacuum layer 15 Å
wide was adopted for the simulation. The bottom TM polyhedron were fixed during the atomic
relaxation with a threshold of 0.02eV/A to mimic the true surface. Different site of NCO, NCS, NCP
for H adsorption is calculated (Fig S15). The H adsorption energy is calculated as the following:
∆𝐸 = 𝐸𝑠𝑙𝑎𝑏+𝐻 − 𝐸𝑠𝑙𝑎𝑏 −1
2𝐸𝐻2
Where the first term is the enthalpy of H adsorbed system, the second term is the enthalpy of the slab,
the third term is enthalpy of the hydrogen molecules. The slab of NCO, NCS and NCP we choose as
in Figure S16.

S6
S1. Raman spectra of GO and NCO holey nanosheets.
Figure S1. Raman spectra of GO and NCO holey nanosheets: Raman spectra of GO exhibits
vibrational peaks at around 1360 and 1590 cm−1, which can be ascribed to the D and G bands,
respectively. For NCO, peaks at 480, 520 and 695 cm−1 which can be attributed to the vibrational
modes of spinel NiCoOx phase. No peaks are shown at around 1360 or 1590 cm−1 or similar to other
carbon, indicating that no carbon residues are present in NCO holey nanosheets.

S7
S2. Microscopy images and particle/hole distribution in NCA holey nanosheets.
Figure S2. STEM and SEM (inset) images of a) NCO, b) NCP and c) NCS holey nanosheets (scale
bar: 200 nm, inset: 500 nm). Particle size distribution in d) NCO (8-12 nm) e) NCP (12-18 nm) and
f) NCS (10-15nm) holey nanosheets. Hole size distribution in g) NCO (8-12 nm) h) NCP (12-18 nm)
and i) NCS (12-18 nm) holey nanosheets.

S8
S3. STEM and HRTEM images of NCP holey nanosheets.
Figure S3. Nanoholes in holey NCP nanosheets: a) STEM and b) HRTEM images (scale bar: 200
nm in a and 10 nm in b).

S9
S4. XRD pattern of holey oxides with different composition.
Figure S4. XRD patterns of holey oxides with different composition: Note that NiCoOx is a mixed
phase (Ni/Co ratio is 1:1) composed of NiCo2O4 and NiO.

S10
S5. XRD pattern of holey phosphides with different composition
Figure S5. XRD patterns of holey phosphides with different composition.

S11
S6. XRD pattern of holey selenides with different composition
Figure S6. XRD patterns of holey selenides with different composition.

S12
S7. XRD of NCP control samples
Figure S7. XRD patterns of control NCP nanosheets (no holes) and holey NCP nanosheets.
S13
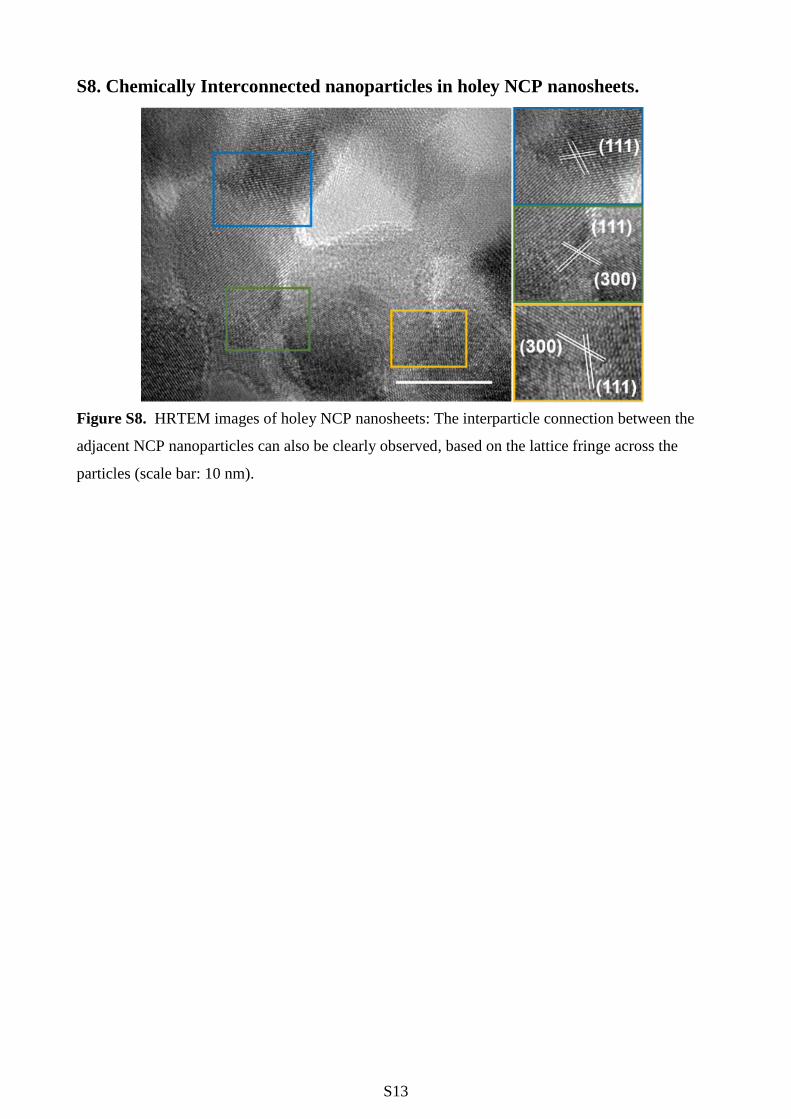
S8. Chemically Interconnected nanoparticles in holey NCP nanosheets.
Figure S8. HRTEM images of holey NCP nanosheets: The interparticle connection between the
adjacent NCP nanoparticles can also be clearly observed, based on the lattice fringe across the
particles (scale bar: 10 nm).

S14
S9. SEM of NCP control samples.
Figure S9. STEM images of a) holey NCP and b) control NCP nanosheets (no holes) (Scale bar:
200 nm).

S15
S10. XPS of NCP, NCS and NCO holey nanosheets
Figure S10. XPS test of a series of NCA holey nanosheets: a) Ni 2p3/2 spectrum, b) Co 2p3/2 spectrum,
and c) P 2p spectrum of NCP holey nanosheets; d) Ni 2p3/2 spectrum, e) Co 2p3/2 spectrum, and f) P
2p spectrum of NCS holey nanosheets; f) Ni 2p3/2 spectrum, g) Co 2p3/2 spectrum, and h) P 2p
spectrum of NCO holey nanosheets.
140 138 136 134 132 130 128
P-O
Inte
ns
ity
/ a
.u.
P 2p1/2
P
Binding Energy / eV792 788 784 780 776
Inte
ns
ity
/ a
.u.
sat.
Binding Energy / eV
Co 2p3/2 Co+(CoP)
868 864 860 856 852
Ni 2p3/2
Inte
ns
ity
/ a
.u.
Binding Energy / eV
Ni+(Ni-P)
sat.
64 62 60 58 56 54 52 50
Binding Energy / eV
Se 3d
Se 3d3/2
Se 3d5/2
Se-O
Inte
ns
ity
/ a
.u.
536 532 528 524
O1
O1
O1
O 1s
Binding Energy / eV
Inte
ns
ity
/ a
.u.
868 864 860 856 852Binding Energy / eV
Ni 2p3/2
sat.
Ni3+Ni2+In
ten
sit
y /
a.u
.
868 864 860 856 852
sat.
Ni 2p3/2
Binding Energy / eV
Inte
ns
ity
/ a
.u.
Ni+ (Ni-Se)
Ni2+Ni3+
792 788 784 780 776
Inte
ns
ity
/ a
.u.
Binding Energy / eV
Co 2p3/2
Co2+
Co3+
792 788 784 780 776
Co+(Co-Se)
sat.
Binding Energy / eV
Co 2p3/2
Inte
ns
ity
/ a
.u.
Co2+
Co3+
a b c
d e f
g h i

S16
S11. 95% IR-correction of LSV data
Figure S11. LSV polarization curves of NCP holey nanosheets with or without IR correction for
HER: the polarization curves were corrected for ohmic losses throughout the system. Firstly, the
equivalent series resistance (Rs) is obtained from the EIS Nyquist plot as the first intercept of the
main arc with the real axis. Afterwards, the ohmic losses can be calculated and extracted from the
raw polarization curves using Ohm’s Law, further giving the IR-corrected data. The values of Rs in
the various measurements are low and very similar to one another (8 ~ 12 Ω for GC electrode, and
~1.5 Ω for Ni foam in 1.0 M KOH aqueous solution)
S17
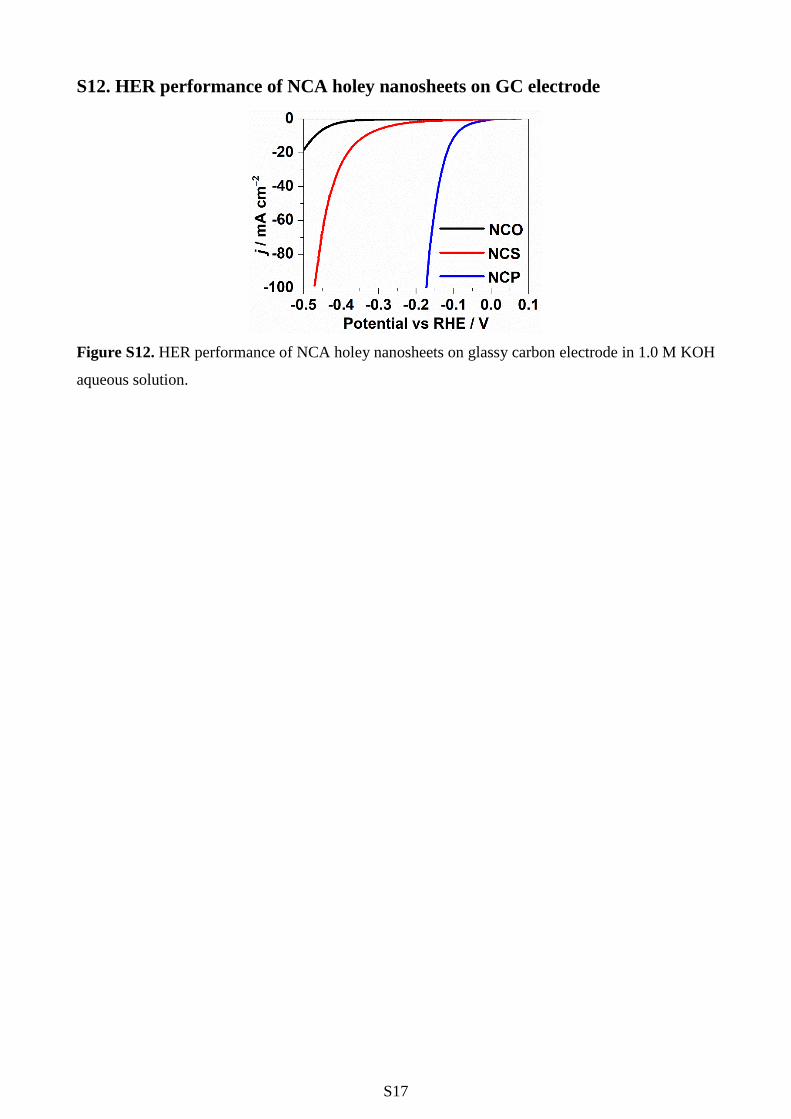
S12. HER performance of NCA holey nanosheets on GC electrode
Figure S12. HER performance of NCA holey nanosheets on glassy carbon electrode in 1.0 M KOH
aqueous solution.

S18
S13. Tafel slope of NCA holey nanosheets.
Figure S13. Tafel slope of NCA holey nanosheets on Ni foam electrode in 1.0 M KOH aqueous
solution.
S19
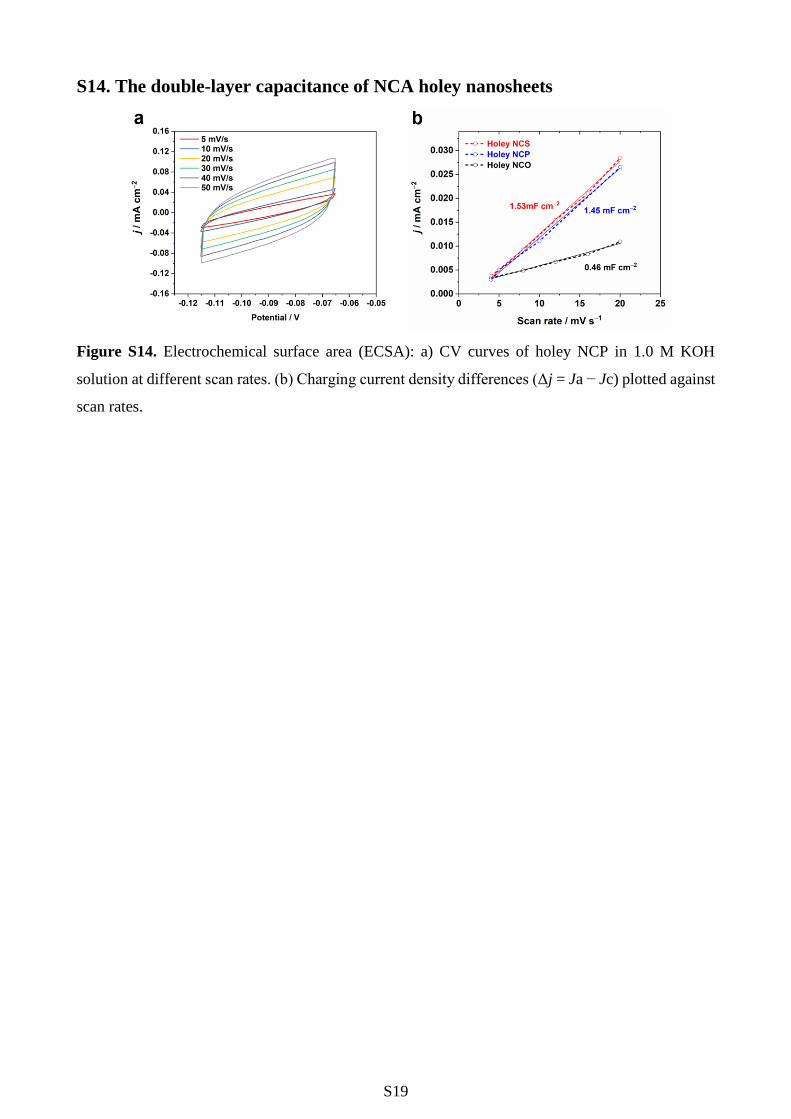
S14. The double-layer capacitance of NCA holey nanosheets
Figure S14. Electrochemical surface area (ECSA): a) CV curves of holey NCP in 1.0 M KOH
solution at different scan rates. (b) Charging current density differences (Δj = Ja − Jc) plotted against
scan rates.

S20
S15. Normalized HER performance (electrochemical active surface area).
Figure S15. IR-corrected polarization curves for holey NCS and NCO catalysts after the
electrochemical active surface area normalization: The specific capacitance obtained in S13 can be
converted into an electrochemical active surface area (ECSA) using the specific capacitance value
for a flat standard with 1 cm2 of real surface area. The specific capacitance for a flat surface is
generally found to be in the range of 20-60 µF cm─2.5-8 Here we assume 40 µF cm─2. The ECSA of
holey NCP, holey NCS and holey NCO electrodes are 36.25 cm2/mg, 38.25 cm2/mg and 11.5 cm2/mg
respectively. Compared with the GSA (geometry surface area of 0.5 cm2, the much larger ECSA than
GSA can be attributed to the rough surface of holey structure as shown in microscopy images.

S21
S16. Model of NCO, NCS and NCP for hydrogen adsorption
Figure S16. The crystal face of (111) in NCO, (010) in NCS and (001) in NCP for hydrogen
adsorption

S22
S17. Tafel plots of Ni/Co-based phosphides holey nanosheets.
Figure S17. Tafel plots of a series of Ni/Co-based phosphide holey nanosheets on Ni foam
electrode in 1.0 M KOH aqueous solution.

S23
S18. OER performance of NCP and NCO holey nanosheets on GC electrode
Figure S18. OER performance of holey nanosheets on glassy carbon electrode: a) polarization curves
of NCP and NCO holey; b) stability test of NCP holey nanosheets: holey NCP exhibits about 300
mV overpotential for OER on GC electrode, and maintain less than 340 mV overpotential over 8 h.

S24
S19. Ex-situ XPS of NCP holey nanosheets after OER test.
Figure S19. XPS of Co 2p3/2 and P 2p spectrum in NiCoP before and after OER for 100 cycles: P 2p
peaks disappear (transformation of P in NiCoP into phosphates during the OER and dissolution), and
main peaks in Co 2p3/2 can be attributed to CoOOH and NiOOH species formed during AC treatment.

S25
S20. XRD of NCP electrocatalyst after OER test.
Figure S20. XRD pattern of NiCoP electrocatalyst after OER for 100 cycles.
S26
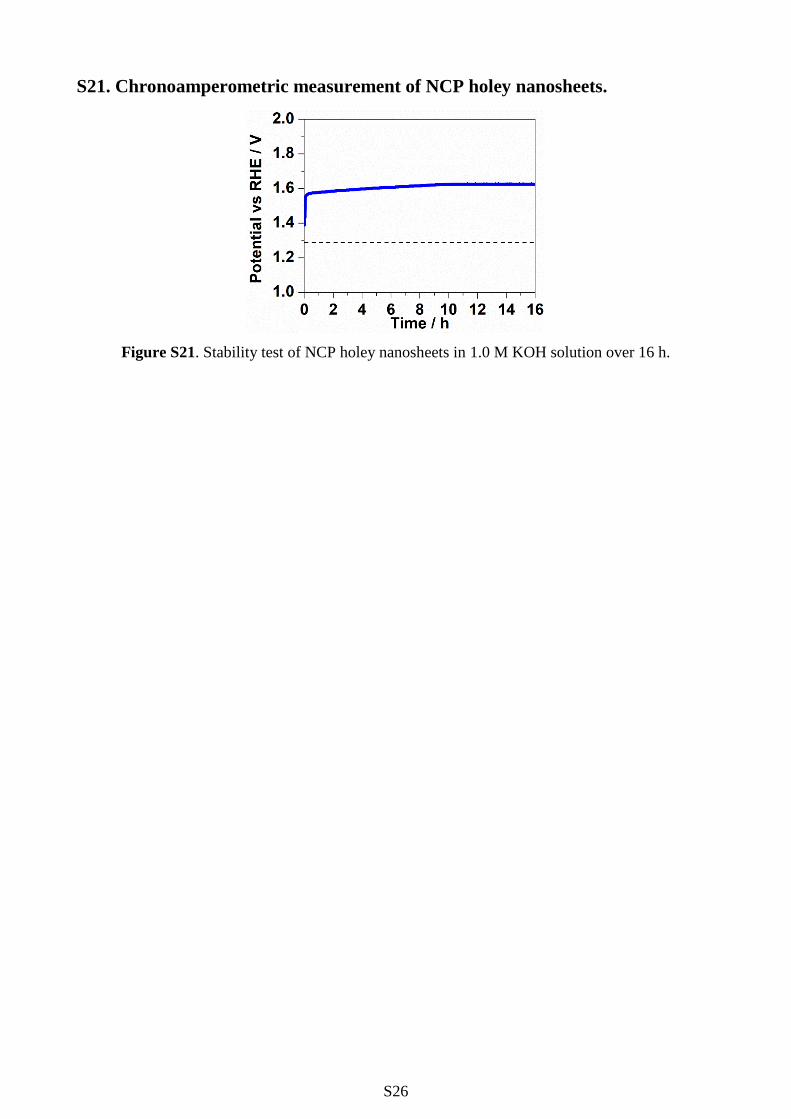
S21. Chronoamperometric measurement of NCP holey nanosheets.
Figure S21. Stability test of NCP holey nanosheets in 1.0 M KOH solution over 16 h.

S27
Table S1. Turnover Frequency of Holey NCA at -0.2 V (vs RHE).
Holey NCO Holey NCS Holey NCP
TOF/ S─1atom─1 0.00031 0.0034 0.732

S28
Table S2. Hydrogen Adsorption Enthalpy / eV of NCA.
NCO Bridge (Ni-Co) Co4 Co8 Hollow O8
Site* 3 1 2 4 5
Adsorption Enthalpy -1.80 -1.39 -1.96 -1.75 -2.52
NCS Bridge (Se-Se) Co H Ni Se
Site 3 1 4 2 5
Adsorption Enthalpy -1.55 -1.91 -1.90 -1.95 -1.82
NCP P Co P-hollow (Ph) Ni-hollow (Nh)
Site 1 2 3 4
Adsorption Enthalpy 0.36 -0.09 -1.44 -0.19
*Site numbers are corresponding to the numbers shown in Figure 3c
S29
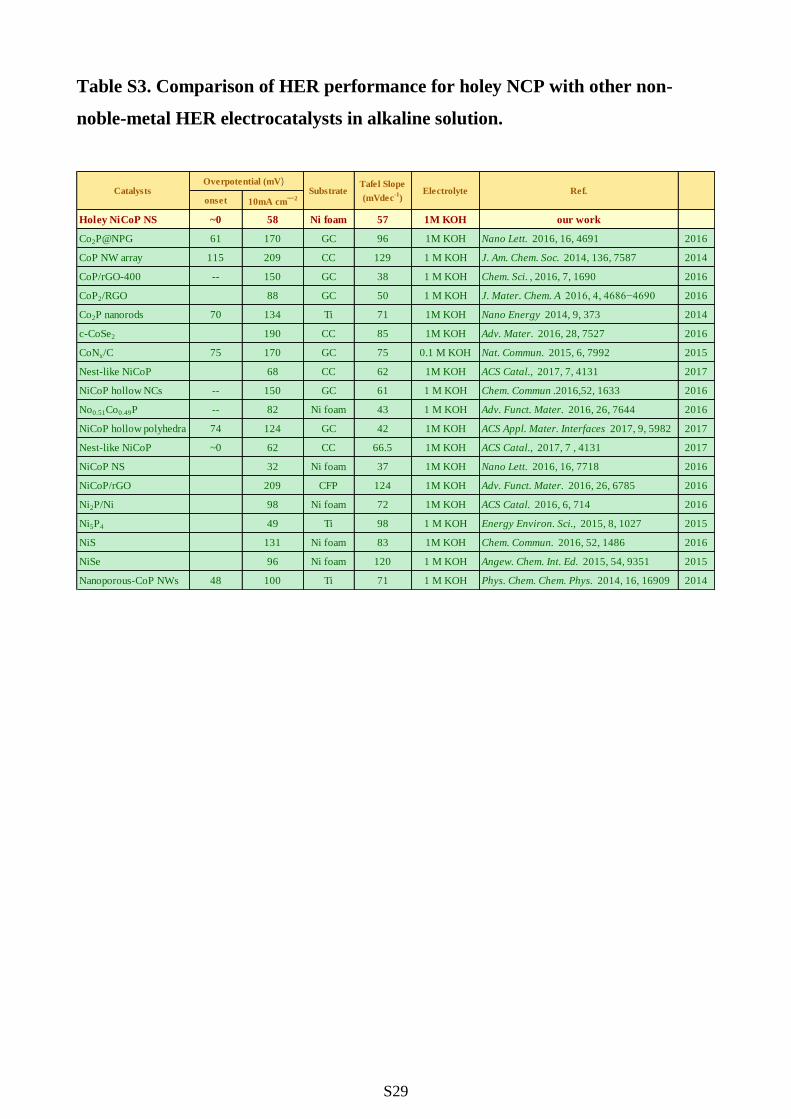
Table S3. Comparison of HER performance for holey NCP with other non-
noble-metal HER electrocatalysts in alkaline solution.
onset 10mA cm─2
Holey NiCoP NS ~0 58 Ni foam 57 1M KOH our work
Co2P@NPG 61 170 GC 96 1M KOH Nano Lett. 2016, 16, 4691 2016
CoP NW array 115 209 CC 129 1 M KOH J. Am. Chem. Soc. 2014, 136, 7587 2014
CoP/rGO-400 -- 150 GC 38 1 M KOH Chem. Sci. , 2016, 7, 1690 2016
CoP2/RGO 88 GC 50 1 M KOH J. Mater. Chem. A 2016, 4, 4686−4690 2016
Co2P nanorods 70 134 Ti 71 1M KOH Nano Energy 2014, 9, 373 2014
c-CoSe2 190 CC 85 1M KOH Adv. Mater. 2016, 28, 7527 2016
CoNx/C 75 170 GC 75 0.1 M KOH Nat. Commun. 2015, 6, 7992 2015
Nest-like NiCoP 68 CC 62 1M KOH ACS Catal., 2017, 7, 4131 2017
NiCoP hollow NCs -- 150 GC 61 1 M KOH Chem. Commun .2016,52, 1633 2016
No0.51Co0.49P -- 82 Ni foam 43 1 M KOH Adv. Funct. Mater. 2016, 26, 7644 2016
NiCoP hollow polyhedra 74 124 GC 42 1M KOH ACS Appl. Mater. Interfaces 2017, 9, 5982 2017
Nest-like NiCoP ~0 62 CC 66.5 1M KOH ACS Catal., 2017, 7 , 4131 2017
NiCoP NS 32 Ni foam 37 1M KOH Nano Lett. 2016, 16, 7718 2016
NiCoP/rGO 209 CFP 124 1M KOH Adv. Funct. Mater. 2016, 26, 6785 2016
Ni2P/Ni 98 Ni foam 72 1M KOH ACS Catal. 2016, 6, 714 2016
Ni5P4 49 Ti 98 1 M KOH Energy Environ. Sci., 2015, 8, 1027 2015
NiS 131 Ni foam 83 1M KOH Chem. Commun. 2016, 52, 1486 2016
NiSe 96 Ni foam 120 1 M KOH Angew. Chem. Int. Ed. 2015, 54, 9351 2015
Nanoporous-CoP NWs 48 100 Ti 71 1 M KOH Phys. Chem. Chem. Phys. 2014, 16, 16909 2014
Ref.ElectrolyteCatalystsTafel Slope
(mVdec-1
)Substrate
Overpotential (mV)

S30
Table S4. Comparison of HER performance for holey NCP with other non-
noble-metal HER electrocatalysts at all-pH values.
alkaline neutral acidic
Holey NiCoP NS 58 170 80 Ni foam our work
Co2P@NPG 170 130 103 GC Nano Lett. 2016, 16, 4691
Co0.59Fe0.41P nanocubes 92 -- 72 GC Nanoscale 2015, 7, 11055
Nanoporous-CoP NWs 100 178 78 Ti foilPhys. Chem. Chem. Phys. 2014, 16,
16909Co2P nanorods ~150 -- 134 Ti Nano Energy 2014, 9, 373
CoP/rGO-400 150 -- 105 GC Chem. Sci ., 2016, 7, 1690
NiCoP/rGO 209 124 31 CFP Adv. Funct. Mater . 2016, 26, 6785
Co9S8@C 250 280 240 GC ACS Appl. Mater. Interfaces 2015, 7, 980
Co-NRCNTs 370 540 260 GC Angew. Chem. Int.Ed . 2014, 126, 4461
CoNx/C 170 247 133 GC Nat. Commun . 2015, 6, 7992
CoP nanowire 209 106 67 CC J. Am. Chem. Soc . 2014, 136, 7587
Ni3S2 223 170 ineffective Ni foam J. Am. Chem. Soc. 2015, 137, 14023
Mn-Co-P 76 86 49 Ti ACS Catal. 2017, 7, 98
Overpotential (mV) @10mA cm─2
Catalysts Substrate Ref.
S31
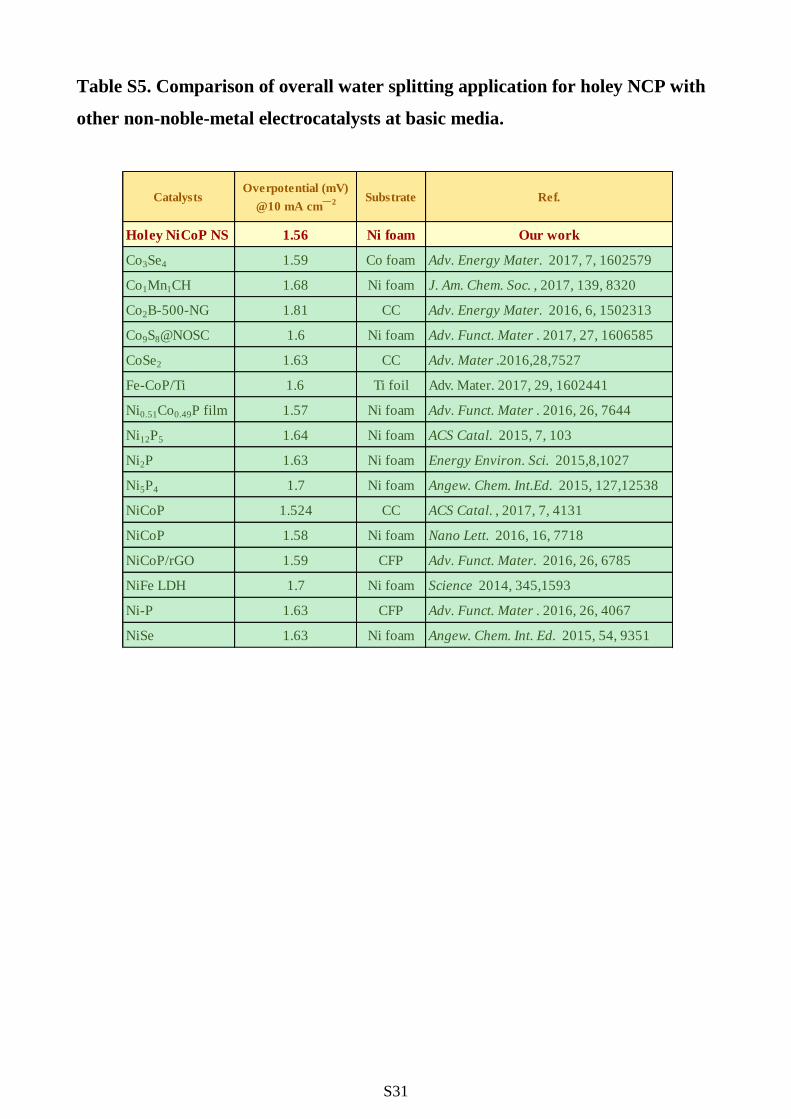
Table S5. Comparison of overall water splitting application for holey NCP with
other non-noble-metal electrocatalysts at basic media.
CatalystsOverpotential (mV)
@10 mA cm─2 Substrate Ref.
Holey NiCoP NS 1.56 Ni foam Our work
Co3Se4 1.59 Co foam Adv. Energy Mater. 2017, 7, 1602579
Co1Mn1CH 1.68 Ni foam J. Am. Chem. Soc. , 2017, 139, 8320
Co2B-500-NG 1.81 CC Adv. Energy Mater. 2016, 6, 1502313
Co9S8@NOSC 1.6 Ni foam Adv. Funct. Mater . 2017, 27, 1606585
CoSe2 1.63 CC Adv. Mater .2016,28,7527
Fe-CoP/Ti 1.6 Ti foil Adv. Mater. 2017, 29, 1602441
Ni0.51Co0.49P film 1.57 Ni foam Adv. Funct. Mater . 2016, 26, 7644
Ni12P5 1.64 Ni foam ACS Catal. 2015, 7, 103
Ni2P 1.63 Ni foam Energy Environ. Sci. 2015,8,1027
Ni5P4 1.7 Ni foam Angew. Chem. Int.Ed. 2015, 127,12538
NiCoP 1.524 CC ACS Catal. , 2017, 7, 4131
NiCoP 1.58 Ni foam Nano Lett. 2016, 16, 7718
NiCoP/rGO 1.59 CFP Adv. Funct. Mater. 2016, 26, 6785
NiFe LDH 1.7 Ni foam Science 2014, 345,1593
Ni-P 1.63 CFP Adv. Funct. Mater . 2016, 26, 4067
NiSe 1.63 Ni foam Angew. Chem. Int. Ed. 2015, 54, 9351
S32
References
1. Tian, J.; Liu, Q.; Asiri, A. M.; Sun, X., J. Am. Chem. Soc. 2014, 136, 7587-7590.
2. Schlipf, M.; Gygi, F., Comput. Phys. Commun. 2015, 196, 36-44.
3. Jia, W.; Fu, J.; Cao, Z.; Wang, L.; Chi, X.; Gao, W.; Wang, L.-W., J. Comput. Phys. 2013, 251,
102-115.
4. Perdew, J. P.; Burke, K.; Ernzerhof, M., Phys. Rev. Lett. 1996, 77, 3865.
5. Kibsgaard, J.; Tsai, C.; Chan, K.; Benck, J. D.; Nørskov, J. K.; Abild-Pedersen, F.; Jaramillo, T.
F., Energy Environ. Sci. 2015, 8, 3022-3029.
6. Kötz, R.; Carlen, M., Electrochim. Acta 2000, 45, 2483-2498.
7. Grahame, D. C., Chem. Rev. 1947, 41, 441-501.
8. Conway, B.; Tilak, B., Electrochim. Acta 2002, 47, 3571-3594.