Embed Size (px)
Citation preview
Supporting Information for “A Homochiral Three-Dimensional Zinc Aspartate Framework that Displays Multiple Coordination Modes and Geometries” Jamie A. Gould, James T. A. Jones, John Bacsa, Yaroslav Z. Khimyak and Matthew J. Rosseinsky * INDEX Experimental Procedures 2 Solid state NMR 3 Crystallography Report 3-4 Powder X-ray Diffraction 5-6 SEM images of bulk material of 1 7 Thermogravimetric analysis 8 Spacefilling view of 1 9 Connolly surfaces 10-11
Supplementary Material (ESI) for Chemical CommunicationsThis journal is (c) The Royal Society of Chemistry 2010
Experimental Procedures Synthesis of single crystals of 1: A 23ml Teflon lined Parr autoclave was charged with Zn carbonate basic (0.1g, 0.88mmol by Zn), L-aspartic acid (0.117g, 0.88mmol) and 4,4′-bipyridyl (0.137g, 0.88mmol) in a water/methanol mixture (2/2ml respectively), giving a molar composition for the reaction of 1:1:1 Zn:asp:bipy. The resulting mixture was stirred at RT for 30min, whilst the pH was adjusted to 6.0 using NaOH. Finally, the reagents were heated at 130 ºC for 2 days, and cooled at a rate of 0.2 ºC min-1 to room temperature. The product was filtered and washed with water and methanol, yielding platelet single crystals of 1 and an amorphous gel phase which could not be indexed by powder X-ray diffraction. Bulk powder synthesis of 1: In a 100ml round-bottomed flask, L-aspartic acid (1g, 7.51mmol) was dissolved in a water/methanol mixture (17/33ml respectively) by heating to 80 ºC. ZnCO3 basic was added (0.85g, 7.51mmol by Zn). The resulting mixture was refluxed for 8h, to yield a white crystalline powder. Microanalysis (%): found (calc. for Zn3(C4H5NO4)3(H2O)2) C = 23.21 (23.04), H = 2.91 (3.06) N = 6.68 (6.72). Determination of the bulk chirality of [Zn(asp)]: Firstly, the aspartic acid needs to be extracted from the bulk material, and is done so by adding 1M NaOH (4 ml) to the framework (~ 30 mg) and removing the resulting precipitate by filtration. The addition of NaOH to the framework results in the precipitation of Zn(OH)2, which is insoluble in weak basic aqueous solution. Removal of the solid leaves disodium-aspartate in the filtrate. The filtrate is neutralised by the addition of 1M HCl and the aqueous solution removed by rotary evaporation. The resulting white solid is a mixture of aspartic acid (1H NMR) and NaCl (generated by the neutralisation step) as confirmed by elemental analysis. Once the aspartic acid has been recovered from the bulk framework sample it is necessary to derivatise this prior to GC analysis. The carboxylic acid groups are first converted to methyl esters by heating in MeOH (4ml) and HCl (4M, 1ml) in a 20 ml round-bottom flask equipped with a condenser for 4 hours. The primary amine is transformed into an amide by reaction with TFA (0.5 ml in 5 ml DCM, RT overnight) as outlined for the diol derivatisation. The NaCl present in the mixture does not interfere with either of the two steps of the derivatisation procedure and is not removed until the very end when the Asp(OMe/TFA) derivative is dissolved in DCM and the NaCl is simply filtered off. The solution concentration for GC analysis is 0.5% (w/v) Asp(OMe/TFA) in DCM, and is carried out using a Lipodex-E capillary-GC column at 120°C.
Supplementary Material (ESI) for Chemical CommunicationsThis journal is (c) The Royal Society of Chemistry 2010
Solid state NMR: Solid state NMR spectra were recorded at 9.4T on a Bruker DSX400 spectrometer equipped with a 4mm 1H/X/Y triple resonance probehead. Samples were spun in zirconia rotors using dry N2 bearing gas. The 1H-13C CP/MAS NMR spectra were acquired at 400.16 MHz for 1H and 100.56 MHz for 13C at MAS rate of 10.0 kHz. A 1H π/2 pulse length was 3.0 μs and the recycle delay was 10 s. Two Phase Pulse Modulation (TPPM) decoupling was used during acquisition. The CP contact time was 2.0 ms with the Hartmann–Hahn matching condition set using Hexamethylbenzene (HMB). The 13C chemical shifts are quoted in ppm with respect to TMS. Crystallography Structure Report for Framework 1 at 100(2) K Crystal data for 1: Zn3(C4H5NO4)3 (H2O), M = 607.40, colourless platelet, 0.20 × 0.10 × 0.10 mm3, monoclinic, space group P21 (No. 4), a = 8.484(3), b = 10.491(3), c = 10.187(3) Å, β = 93.552(7)°, V = 905.0(5) Å3, Z = 2, Dc = 2.247 g/cm3, F000 = 611, Bruker D8 diffractometer with APEX detector, MoKα, λ = 0.71073 Å, T = 100(2)K, 2θmax = 54.9º, 2561 reflections collected, 2432 unique (Rint = 0.0272). Final GooF = 1.063, R1 = 0.0599, wR2 = 0.1309, R indices based on 1970 reflections with I>2sigma(I) (refinement on F2), 277 parameters, 170 restraints. Lp and absorption corrections applied, μ = 4.025 mm-1. Absolute structure parameter = 0.11(4) .1 Data collection, structure solution and refinement A crystal was mounted on a glass fibre and placed in a cold stream at 100K. Single crystal X-ray data were collected on a Bruker D8 diffractometer with an APEX CCD detector, and 1.5 kW graphite monochromated Mo radiation. The detector to crystal distance was 60 mm. Scan widths of 0.3º were used throughout the data collection. The data collection was performed using three ω scans yielding data in the θ range 1.94 to 25.34° with an average completeness of 94%. The frames were integrated with the SAINT v6.45a (Bruker, 2005).2 An absorption correction using face-indexing was carried out using the program SADABS V2008-1 (Bruker, 2008)3. The structure was solved and refined with X-SEED,4 a graphical interface to SHELX Sheldrick, 2008).5 The positions of the hydrogen atoms were refined with constraints. In the final cycles of refinement all non-hydrogen atoms were refined anisotropically. Restraints were used since the data to parameter ratio was 8.4. SIMU and DELU restraints were used on the thermal motion parameters were used to give more physically reasonable thermal parameters and to increase the effective data to parameter ratio for the refinement, thereby improving the accuracy of the refined bond distances and angles.
1 Flack, H. D. Acta Cryst. 1983, A39, 876-881. 2 Bruker (2005), SAINT V6.45a, Bruker AXS Inc., Madison, WI, USA. 3 Bruker (2008), SADABS V2008-1, Bruker AXS Inc., Madison, WI, USA. 4 Barbour, L. J. (2001), "X-Seed – A software tool for supramolecular crystallography"
J. Supramol. Chem. 1, 189-191. 5 Sheldrick, G.M. (2008), Acta Cryst. A64, 112-122.
Supplementary Material (ESI) for Chemical CommunicationsThis journal is (c) The Royal Society of Chemistry 2010

Within the structure there is a disordered water molecule, located in a small cavity in the structure. The corresponding electron density is diffuse, and there are two electron peaks instead of one in the channel. No donors/acceptor atoms suitable for classical hydrogen bond formation with the water molecules were found (to place hydrogen atoms), and therefore this water molecule is modelled as partially occupying two sites in the crystal without hydrogen atoms. We modelled this water as having two unique sites with isotropic thermal parameters, rather than occupying a single site with a prolate ellipsoid to represent the diffuse electron density.
Supplementary Material (ESI) for Chemical CommunicationsThis journal is (c) The Royal Society of Chemistry 2010
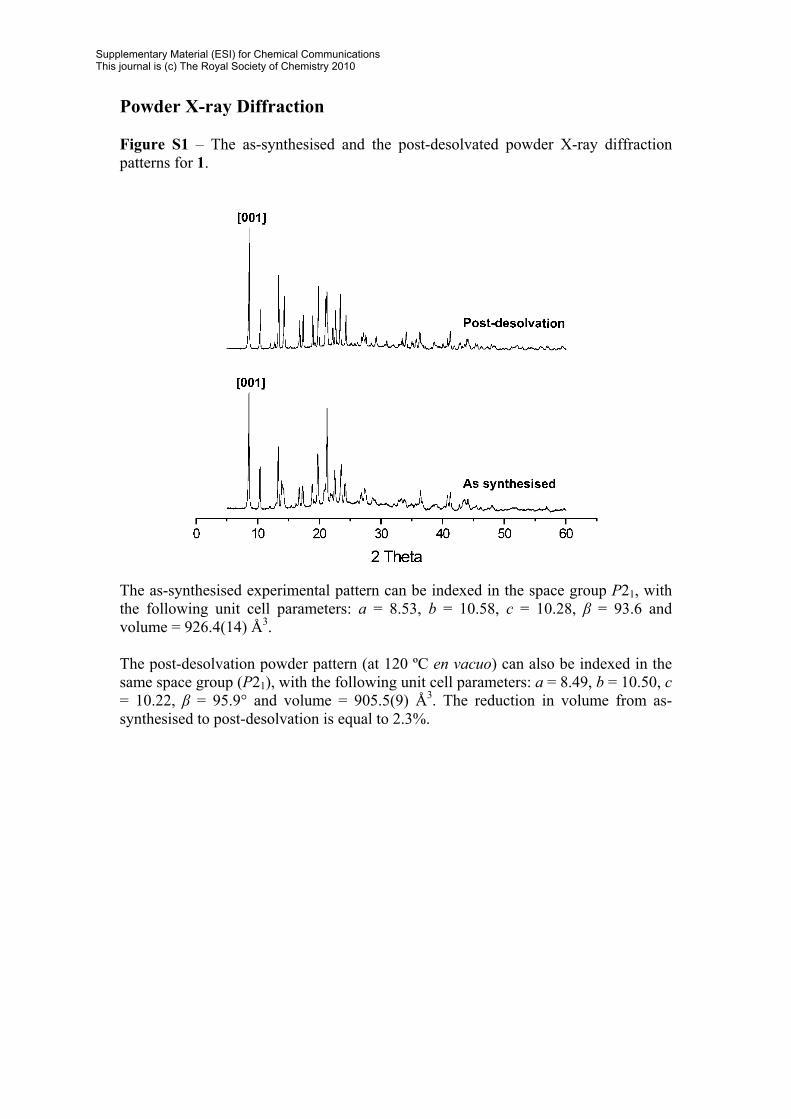
Powder X-ray Diffraction Figure S1 – The as-synthesised and the post-desolvated powder X-ray diffraction patterns for 1.
The as-synthesised experimental pattern can be indexed in the space group P21, with the following unit cell parameters: a = 8.53, b = 10.58, c = 10.28, β = 93.6 and volume = 926.4(14) Å3. The post-desolvation powder pattern (at 120 ºC en vacuo) can also be indexed in the same space group (P21), with the following unit cell parameters: a = 8.49, b = 10.50, c = 10.22, β = 95.9° and volume = 905.5(9) Å3. The reduction in volume from as-synthesised to post-desolvation is equal to 2.3%.
Supplementary Material (ESI) for Chemical CommunicationsThis journal is (c) The Royal Society of Chemistry 2010
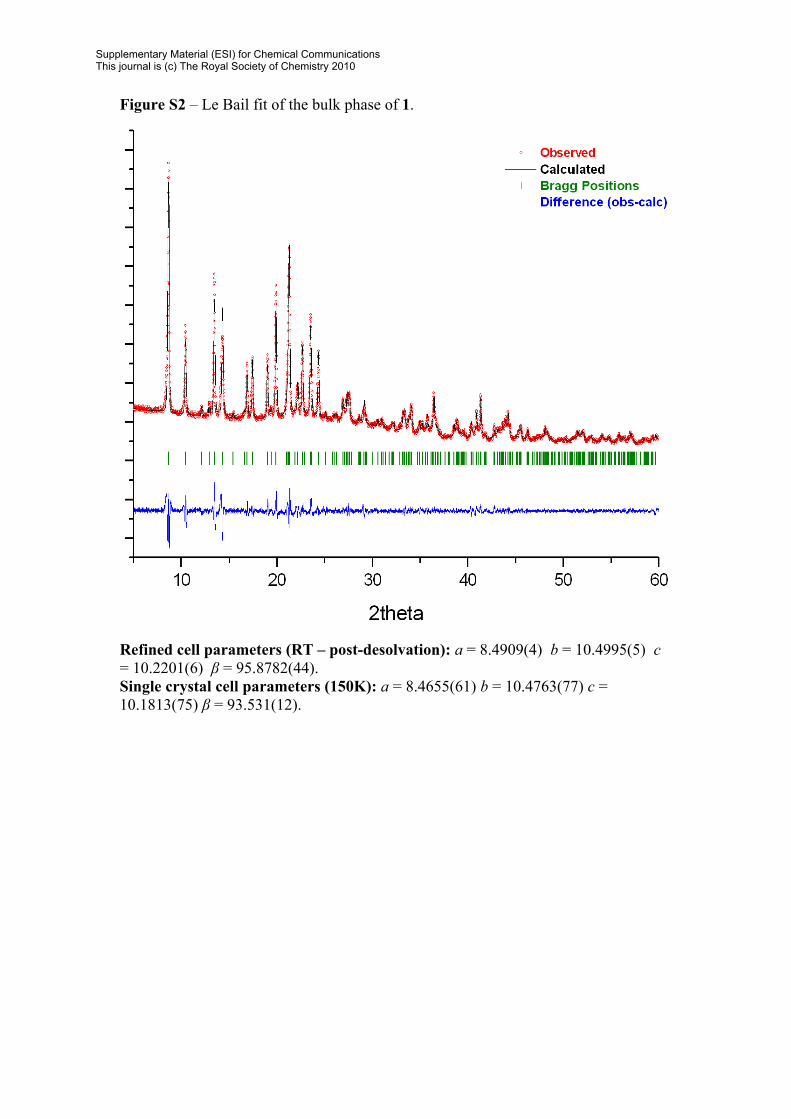
Figure S2 – Le Bail fit of the bulk phase of 1.
Refined cell parameters (RT – post-desolvation): a = 8.4909(4) b = 10.4995(5) c = 10.2201(6) β = 95.8782(44). Single crystal cell parameters (150K): a = 8.4655(61) b = 10.4763(77) c = 10.1813(75) β = 93.531(12).
Supplementary Material (ESI) for Chemical CommunicationsThis journal is (c) The Royal Society of Chemistry 2010
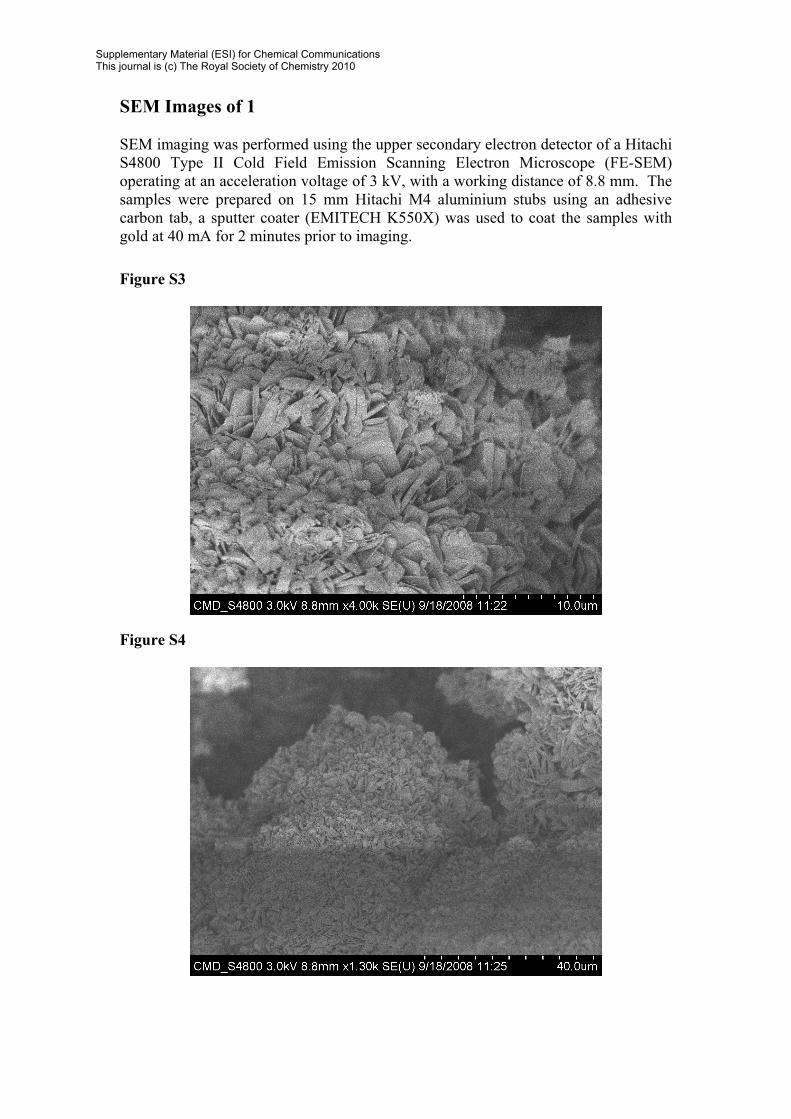
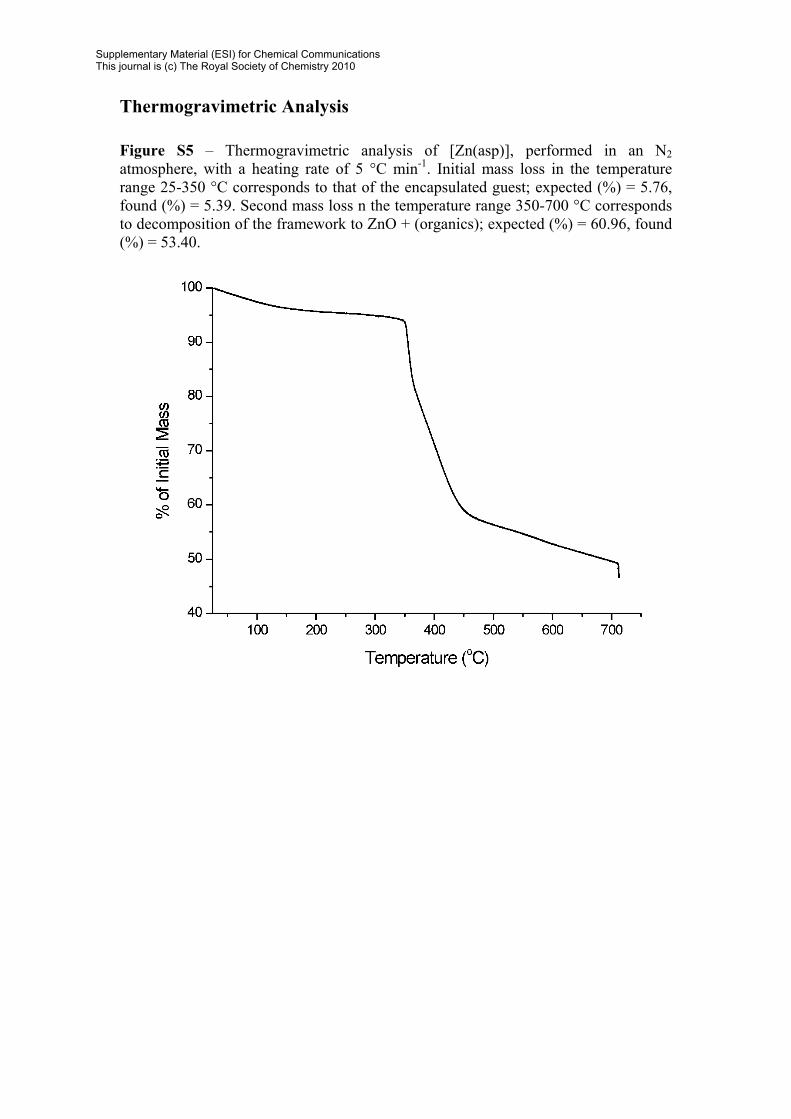
SEM Images of 1 SEM imaging was performed using the upper secondary electron detector of a Hitachi S4800 Type II Cold Field Emission Scanning Electron Microscope (FE-SEM) operating at an acceleration voltage of 3 kV, with a working distance of 8.8 mm. The samples were prepared on 15 mm Hitachi M4 aluminium stubs using an adhesive carbon tab, a sputter coater (EMITECH K550X) was used to coat the samples with gold at 40 mA for 2 minutes prior to imaging. Figure S3
Figure S4
Supplementary Material (ESI) for Chemical CommunicationsThis journal is (c) The Royal Society of Chemistry 2010
Thermogravimetric Analysis Figure S5 – Thermogravimetric analysis of [Zn(asp)], performed in an N2 atmosphere, with a heating rate of 5 °C min-1. Initial mass loss in the temperature range 25-350 °C corresponds to that of the encapsulated guest; expected (%) = 5.76, found (%) = 5.39. Second mass loss n the temperature range 350-700 °C corresponds to decomposition of the framework to ZnO + (organics); expected (%) = 60.96, found (%) = 53.40.
Supplementary Material (ESI) for Chemical CommunicationsThis journal is (c) The Royal Society of Chemistry 2010
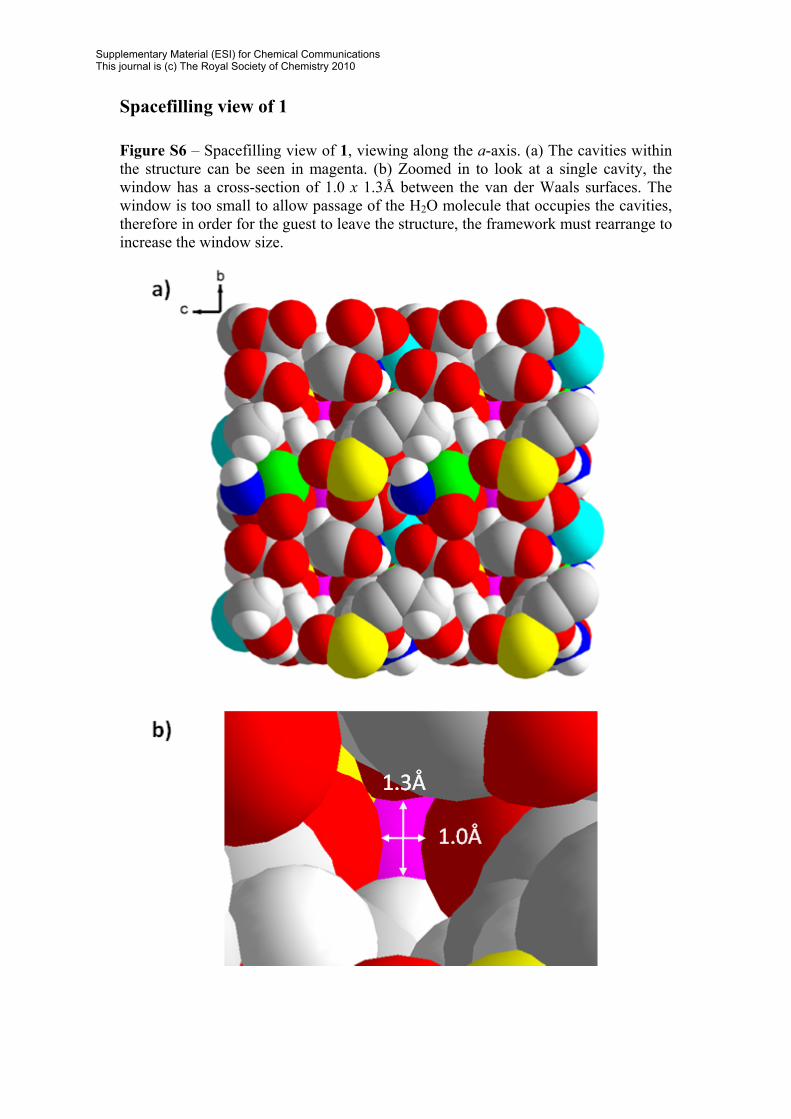
Spacefilling view of 1 Figure S6 – Spacefilling view of 1, viewing along the a-axis. (a) The cavities within the structure can be seen in magenta. (b) Zoomed in to look at a single cavity, the window has a cross-section of 1.0 x 1.3Å between the van der Waals surfaces. The window is too small to allow passage of the H2O molecule that occupies the cavities, therefore in order for the guest to leave the structure, the framework must rearrange to increase the window size.
Supplementary Material (ESI) for Chemical CommunicationsThis journal is (c) The Royal Society of Chemistry 2010
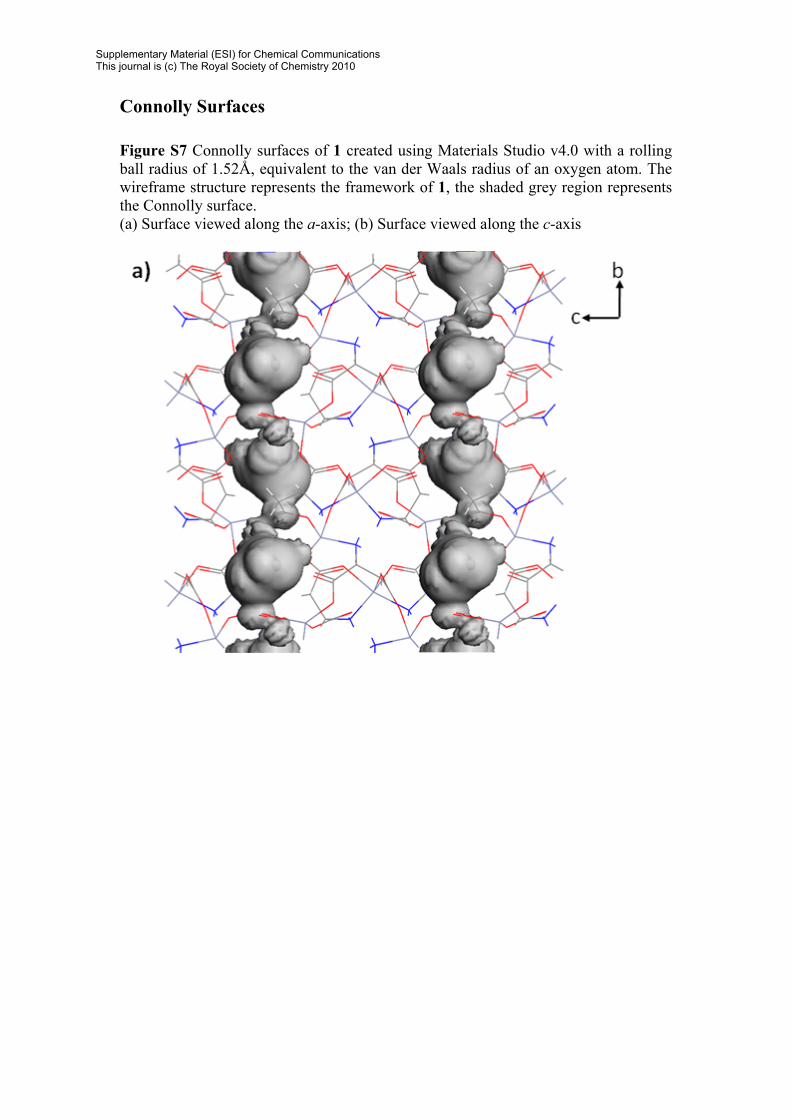
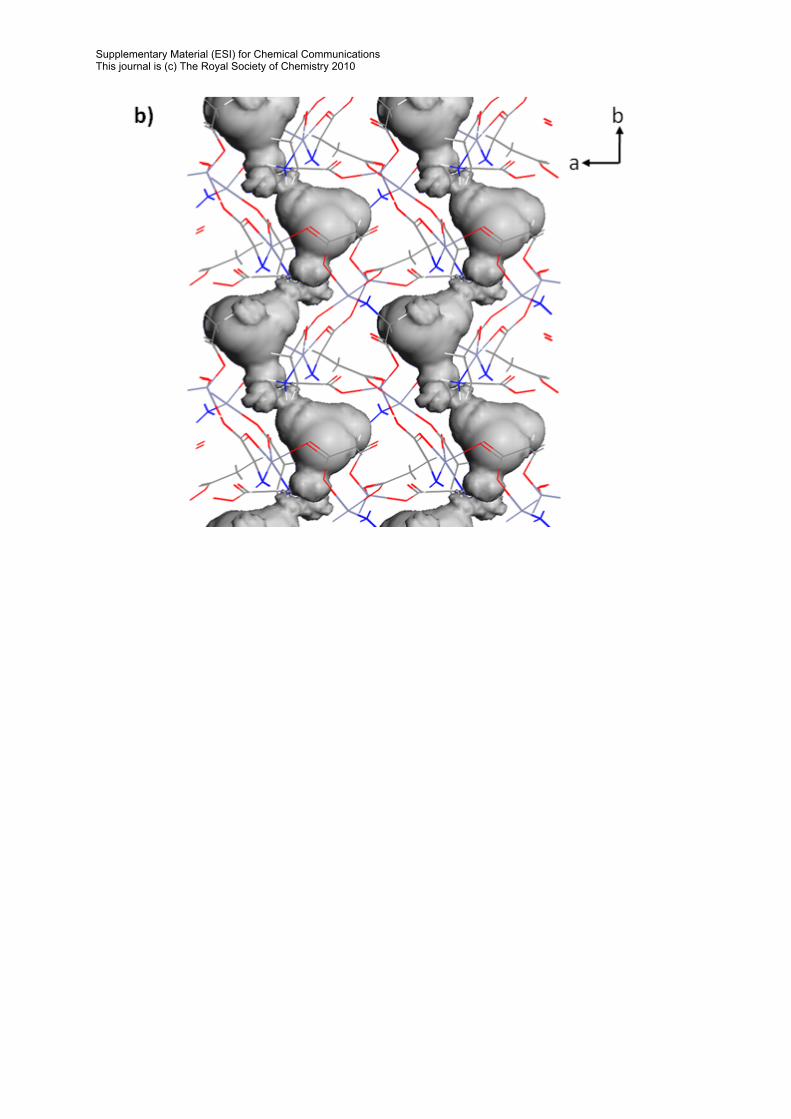
Connolly Surfaces Figure S7 Connolly surfaces of 1 created using Materials Studio v4.0 with a rolling ball radius of 1.52Å, equivalent to the van der Waals radius of an oxygen atom. The wireframe structure represents the framework of 1, the shaded grey region represents the Connolly surface. (a) Surface viewed along the a-axis; (b) Surface viewed along the c-axis
Supplementary Material (ESI) for Chemical CommunicationsThis journal is (c) The Royal Society of Chemistry 2010
Supplementary Material (ESI) for Chemical CommunicationsThis journal is (c) The Royal Society of Chemistry 2010


![Homochiral BINOL-based macrocycles with π-electron-rich ... · stable organic nanotubes from the macrocyclic structures as molecular building blocks [11]. Cyclic peptides [12-14],](https://img.pdfslide.net/doc/110x75/5fca123a846c3356f60a2069/homochiral-binol-based-macrocycles-with-electron-rich-stable-organic-nanotubes.jpg)