Embed Size (px)
Citation preview

1
Supporting information for
Ultralong cycling and wide temperature lithium metal batteries
enabled by solid polymer electrolytes interpenetrated with
poly(liquid crystal) network
Meng Yaoab, Haitao Zhang*ab, Kun Donga, Bosen Lia, Chunxian Xinga, Manyu Dangc,
Suojiang Zhang*ab
a Beijing Key Laboratory of Ionic Liquids Clean Process, Institute of Process Engineering,
Chinese Academy of Sciences, Beijing, 100190, China
b School of Chemical Engineering, University of Chinese Academy of Sciences, Beijing,
100049, China
c Department of Electronic and Electrical, University College London, London, England
E-mail address: [email protected]; [email protected]
Electronic Supplementary Material (ESI) for Journal of Materials Chemistry A.This journal is © The Royal Society of Chemistry 2021

2
Section 1
The ionic conductivities of SPES were tested on an electrochemical working
station via alternating-current (AC) impedance analysis employing stainless steel
(SS)/SPE/SS from 0.1 Hz to 10 kHz. The testing temperatures were in the range from
20 to 80 °C with a step size of 5 °C min-1, and σ of SPE was calculated by
electrochemical impedance spectra (EIS) using the equation:
(1)𝜎 =
𝐿𝑆 ∙ 𝑅𝑏
Where Rb is the bulk resistance; L is the thickness; S is surface area of SPEs. The
electrical conductivity of the solid electrolyte is calculated using the equation:
(2) Υ =
𝐼𝑆𝐿
𝑈𝑆
Activation energy Ea can be calculated according to the Vogel−Tammann−Fulcher
(VTF) equation:
(3)𝜎 = 𝐴𝑇 ‒ 0.5𝑒
‒ 𝐸𝑎𝑅(𝑇 ‒ 𝑇0)
The value of prefactor A is related to the effective charge carrier concentration. To
means glass transition temperature (Tg ). To test the electrochemical stability of the SPE,
the LSV (linear sweep voltammetry) was investigated employing SS/SPE/Li under 1
mV s-1 scan rate from 2 to 6 V. of SPE was measured by CHI604A with DC 𝑡𝐿𝑖 +
polarization and AC impedance employing a symmetric cell of Li/SPE/Li. The t+ can
be calculated according to the equation[1]:

3
(3)𝑡𝐿𝑖 + =
𝐼𝑆(∆𝑉 ‒ 𝐼0𝑅𝑡𝑜)
𝐼0(∆𝑉 ‒ 𝐼𝑠𝑅𝑡𝑠)
Where , are the initial and steady current through the Li/SPE/Li cell, which 𝐼0 𝐼𝑠
were measured by DC polarization with a voltage ( = 20 mV). and are the ∆𝑉 𝑅𝑡𝑜 𝑅𝑡𝑠
initial and steady resistances between the SPE and Li metal electrode which were
obtained by AC impedance in the frequency between 0.1 Hz and 10 kHz.
To further explore the compatibility of SPE with Li, the lithium striping/plating
experiments employing the same cell was conducted in a LAND CT2001A battery test
system at room temperature with the current density of 0.1 mA cm-1 (the sum of the
charge and discharge times was 2 h).
4
Fig. S1 Photographs of a) P-PLC-IL; b-c) folded and scrunched P-PLC-IL; and d) After being folded and scrunched , no damage on the P-PLC-IL is observed.

5
Fig. S2 Thickness of the porous P-PLC-IL SPE (60 μm).

6
Fig. S3 a, b) SEM images of the cross section of SPE; c) EDS mapping of the cross section of SPE

7
Fig. S4 a) FTIR spectrum of pristine PVDF-HFP; b) FTIR spectra of P-PLC-IL and P-IL SPEs and PVDF-HFP

8
Fig. S5 DSC profiles of the P-PLC-IL, P-LC-IL, P-PLC and P-IL SPEs.

9
Fig. S6 XRD patterns of PVDF, P-IL, P-PLC and P-PLC-ILFor the pure PVDF-HFP samples, two strong diffraction peaks are observed at the 2θ value of 18.5 θ and 20.4 θ, which corresponds to the α-phase crystals and β-phase crystals of the PVDF-HFP phase[2], respectively. However, the two diffraction peaks were distinctively weakened in the P-PLC-IL samples, indicating that the α-phase and β-phase crystals were effectively suppressed in the P-PLC-IL[3].

10
Fig. S7 TGA curves of (a) PVDF-HFP and (b) P-PLC
11
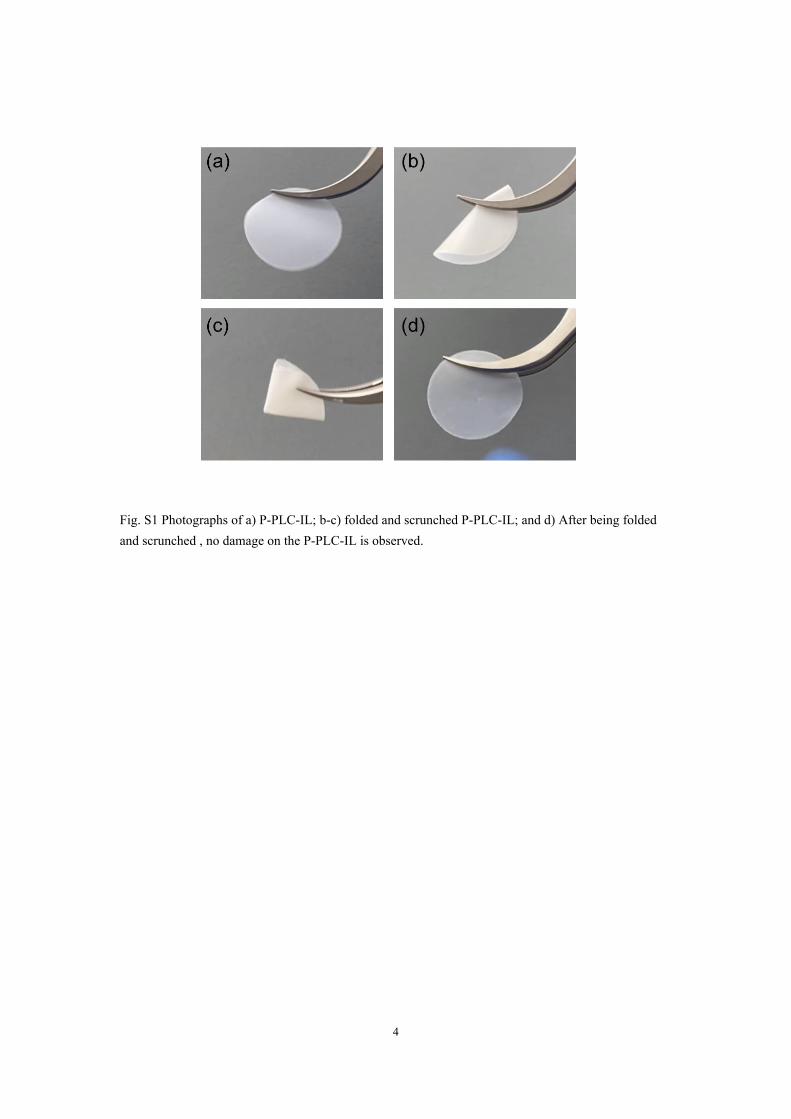
Fig. S8 Celgard 2325 with a fire from an alcohol lamp

12
Fig. S9 Nyquist plots of SS/P-PLC-IL/SS at various temperatures

13
Fig. S10 Electronic conductivity of P-PLC-IL Electronic conductivity was determined at room temperature using potentiostatic coulometry measurements, run on a symmetric SS/P-PLC-IL/SS cell and applying a 1 V polarization ( U ). Under given cell conditions, the ion flow decreased with time due to the pile-up of ions at the SS electrode. The electronic flow remained constant during the experiment as a result of the blocking effect of the electrodes

14
Sample A (S cm-1K1/2) T0 (K) Ea (kJ mol-1) R2
P-IL
P-PLC
0.48
0.12
237.1
208.3
2.50
1.43
0.982
0.991
P-LC-IL 0.75 224.4 2.59 0.991
P-PLC-IL 0.33 207.3 1.54 0.998
Tab. S1 The respective VTF parameters and results of P-IL, P-LC-IL, P-PLC and P-PLC-IL.

15
Fig. S11 FT-IR spectra with Gasussian-Lorentzian fitting curves of the (a) P-PLC-IL and (b) P-IL.The FT-IR spectra with wavenumber ranging from 725 to 755 cm-1 are displayed to evaluate the dissociation degree of LiTFSI in P-PLC-IL and P-IL. The peaks at ~ 740 cm-1 and ~746 cm-1 can be assigned to the free TFSI- and bonded Li-TFSI ion pairs, respectively[4].

16
Fig. S12 a, b, c) The chronoamperometry profiles of symmetric Li/SPE/Li battery with potential steps of 50 mV at room temperature. Inset: the EIS before and after polarization.

17
Fig. S13 Galvanostatic charge/discharge tests of lithium symmetric batteries assembled with P-PLC-IL at 0.1, 0.2 and 0.4 mA cm-2

18
Fig. S14 a, b) surface SEM images of lithium chip from Li/P-LC-IL/Li and Li/P-PLC /Li after 100 h at 0.2 mA cm-2

19
Fig. S15 Cycling performance of the P-IL, P-LC-IL and P-PLC based batteries under 1 C rate at room temperature

20
Fig. S16 Representative charge/discharge profiles of the (a) Li/P-PLC-IL/LFP and (b) Li/Celgard/LFP full cell at 1 C at room temperature

21
Fig. S17 a) The cycle performance of Li/P-PLC-IL/LFP full battery at 0.3 C at room temperature; b) representative charge/discharge profiles of Li/P-PLC-IL/LFP full battery

22
Fig. S18 Nyquist plots of the SS/P-PLC-IL/SS at various temperatures

23
Fig. S19 Representative charge/discharge profiles of Li/P-PLC-IL/LFP full battery under 0.1 C rate at 0 °CIt should be noted that the overpotentials of cell decreased gradually in the initial 10 cycles, and remain unchanged in the following 10 cycles, indicating the improved ionic transport at the interface after cycles of activation.

24
Fig. S20 Nyquist plots of the of fresh Li/P-PLC-IL/Li cell measured at various temperatures.

25
Tab. S2. Comparison of our work with previously reported SPEs[5-13].

26
Fig. S21 The cycling performance of Li/P-PLC-IL/LFP under 5 C rate at 100 °C

27
Fig. S22 Representative charge/discharge profiles of the Li/P-PLC-IL/LFP full battery under 3 C rate (a) and 5 C (b) rate at 100 °C

28
Fig. S23 a, b) Discharge capacity and Coulombic efficiency of Li/P-PLC-IL/LCO and Li/P-PLC-IL/NCM811 at room temperature under 0.1 C; All of two battery delivered a relatively initial Coulombic efficiency (93 % to LCO, 81 % to NCM811), which may due to the formation of SEI film on the electrodes surface [14, 15].

29
References[1] B. Park, J.L. Schaefer, J. Electrochem. Soc. 167 (2020) 070545.[2] Y. Yang, Q. Wu, D. Wang, C. Ma, Z. Chen, C. Zhu, Y. Gao, C. Li, J. Membr. Sci. 595 (2020) 117549.[3] Y. Yang, Q. Wu, D. Wang, C. Ma, Z. Chen, Q. Su, C. Zhu, C. Li, J. Membr. Sci. 612 (2020) 118424.[4] X. Guan, Q. Wu, X. Zhang, X. Guo, C. Li, J. Xu, Chem. Eng. J. 382 (2020) 122935.[5] G.T. Kim, G.B. Appetecchi, M. Carewska, M. Joost, A. Balducci, M. Winter, S. Passerini, J. Power Sources 195 (2010) 6130-6137.[6] X. Li, Y. Zheng, C.Y. Li, Energy Storage Mater. 29 (2020) 273-280.[7] X. Wang, H. Zhu, Gaetan M.A. Girard, R. Yunis, D.R. MacFarlane, D. Mecerreyes, A.J. Bhattacharyya, P.C. Howlett, M. Forsyth, J. Mater. Chem. A 5 (2017) 23844-23852.[8] S. Zhang, Z. Li, Y. Guo, L. Cai, P. Manikandan, K. Zhao, Y. Li, V.G. Pol, Chem. Eng. J. 400 (2020) 125996.[9] G.B. Appetecchi, G.T. Kim, M. Montanino, M. Carewska, R. Marcilla, D. Mecerreyes, I. De Meatza, J. Power Sources 195 (2010) 3668-3675.[10] L. Yu, S. Guo, Y. Lu, Y. Li, X. Lan, D. Wu, R. Li, S. Wu, X. Hu, Adv. Energy Mater. 9 (2019) 1900257.[11] M. Yan, W. Qu, Q. Su, S. Chen, Y. Xing, Y. Huang, N. Chen, Y. Li, L. Li, F. Wu, R. Chen, ACS Appl. Mater. Inter. 12 (2020) 13950-13958.[12] W. Fan, X. Zhang, C. Li, S. Zhao, J. Wang, ACS Appl. Energy Mater. 2 (2019) 4513-4520.[13] G. Wang, X. Zhu, A. Rashid, Z. Hu, P. Sun, Q. Zhang, L. Zhang, J. Mater. Chem. A 8 (2020) 13351-13363.[14] A. Pelz, T.S. Dörr, P. Zhang, P.W. de Oliveira, M. Winter, H.-D. Wiemhöfer, T. Kraus, Chem. Mater. 31 (2019) 277-285.[15] D. Lin, P.Y. Yuen, Y. Liu, W. Liu, N. Liu, R.H. Dauskardt, Y. Cui, Adv. Mater. 30 (2018) 1802661.