Embed Size (px)
Citation preview
1
SUPPORTING INFORMATION
Modulating the cytocompatibility of tridimensional carbon nanotube-based
scaffolds
Stefania Nardecchia, María Concepción Serrano*, María Concepción Gutiérrez, María
Luisa Ferrer, and Francisco del Monte F*
Materials and Methods (extended version)
1. Materials
Chemical reagents were purchased from Sigma-Aldrich and used as received
unless otherwise indicated. For scaffold preparation, low molecular weight chitosan
(Batch#06513AE, Brookfield viscosity 20000 cps), chondroitin sulphate
(Batch#STBB3576, bovine trachea), gelatin (Batch#1189632-52205137, porcine skin),
and MWCNTs (reference number 659258, 110-170 nm in diameter, 5-9 m in length,
according to manufacturer specifications) were used. Cell culture media and
supplements were purchased from Lonza.
2. Purification and chemical functionalization of MWCNTs
MWCNTs were first purified and functionalized by acidic treatment with HNO3.
Typically, concentrated HNO3 (40 ml, 14 M) were added to MWCNTs (800 mg) in a
round-bottom glass flask. The suspension was stirred overnight to guarantee
homogenous dispersion of the nanotubes and then heated at 130 ºC for 5 h. After
cooling at room temperature, it was filtered under vacuum by using cellulose filters with
0.2 m pore size and several washes in distilled water in order to eliminate any acidic
residues. Once the pH in the washes was stabilized at 5.5, MWCNTs were freeze-dried
for 24 h and stored until used. To simplify, the so obtained MWCNTs will be named as
long MWCNTs (LN). The short MWCNTs (SN) were obtained by simple exposure of
LN to a stronger acidic treatment. Particularly, 200 mg of LN were sonicated for 4 h
Electronic Supplementary Material (ESI) for Journal of Materials Chemistry BThis journal is © The Royal Society of Chemistry 2013
2
(DT102H, Bandelin Sondez Digitex) in a concentrated solution containing H2SO4 and
HNO3 (12 ml, 3:1). The temperature in the bath was maintained below 40 ºC along the
process. After treatment, SN were allowed to cool down at room temperature, then
repeatedly washed in distilled water and finally freeze-dried as described above.
3. Preparation of cross-linked CNT-based scaffolds
Chitosan/MWCNT cross-linked scaffolds were prepared by using the ISISA
process as previously described.15, 35
Briefly, chitosan solutions (1 wt %) were made by
dissolving chitosan (CHI, 0.1 g) into an aqueous solution of acetic acid (10 g, 0.15 M,
pH 4.5). Either LN or SN MWCNTs (300 mg) were then dispersed in the chitosan
solution (5 g, 1 wt %) by stirring at room temperature for 24 h and finally sonicated for
4 min. The suspension was then collected into insulin syringes (1 ml) and two different
freezing ISISA methodologies were applied in order to modify the scaffold channel
dimensions. Some of the samples were dipped at a constant rate of 5.9 mm min-1
into a
cold bath maintained at a constant temperature of -196 C (liquid nitrogen). In the other
case, the suspensions were dipped at a constant rate of 0.9 mm min-1
into an ethanol
bath at –65 ºC (dry ice). After this unidirectional freezing procedure, samples were
freeze-dried using a thermoSavant Micromodulyo freeze-drier. The resulting monoliths
were additionally exposed to glutaraldehyde vapors (GA, 50 wt % in distilled water) at
room temperature for 24 h in order to obtain structure reinforcement by chitosan
crosslinking. Finally, the so obtained scaffolds (LNCHI and SNCHI, containing either
long or short MWCNTs, respectively) were aerated for 24 h. A similar methodology
was used for the fabrication of CNT-based scaffolds made of either chondroitin sulphate
(CHO) or gelatin (GEL). Both polymers were dissolved in distilled water (1 wt %) prior
to MWCNT addition. The resulting scaffolds were crosslinked by exposure to
Electronic Supplementary Material (ESI) for Journal of Materials Chemistry BThis journal is © The Royal Society of Chemistry 2013
3
hexamethylene diisocyanate (HMDI) vapors at 37 ºC for 7 days. The so obtained
scaffolds (LNCHO and SNCHO for chondroitin sulphate; LNGEL and SNGEL for
gelatin) were also aerated for further 24 h before use. In all cases, singular scaffolds
were obtained from freeze-dried monoliths by a similar procedure of cryo-fracture.
Differences found between scaffolds are, therefore, attributed to the intrinsic scaffold
composition and not to manipulation of the monolith.
Prior to the fabrication of CNT-based scaffolds, GEL was initially dissolved in
distilled water at 50 ºC for 3 h under stirring. After cooling at 4 ºC, the resulting
hydrogel was dialyzed in distilled water and further dissolved at 50 ºC. The final
solution was then freeze-dried and stored at 4 ºC until used. As an additional precaution,
nanotube dispersion and syringe preparation for GEL-containing scaffolds were
performed at 37 ºC to avoid undesired gelation.
4. Preparation of polymer- and MWCNT/polymer-coated glass coverslips
Solutions of CHI (2 % w/v in acetic acid), CHO (6 % w/v in distilled water) and
GEL (2 % w/v in distilled water), as well as MWCNT suspensions (6 % w/v LN or SN)
in each polymer solution (CHI 1 wt % in acetic acid, CHO 1 wt % and GEL 1 wt % in
distilled water), were prepared and used to homogeneously coat circular glass coverslips
by spin-coating at 300 (for CHI) or 450 rpm (for CHO and GEL). Further crosslinking
of the coated coverslips was achieved by exposure to either GA or HMDI vapors for 30
min or 7 days, respectively.
5. Scaffold characterization
Details of scaffold architecture, cross-section morphology and pore size were
examined by using a DSM-950 scanning electron microscope (SEM, Zeiss). Scaffold
Electronic Supplementary Material (ESI) for Journal of Materials Chemistry BThis journal is © The Royal Society of Chemistry 2013
4
porosity was measured from SEM images by using the UTHSCSA ImageTool software,
version 3.00. Briefly, pores were delimited in each scaffold image and their area
converted to m2 by calibration with the scale bars. Porosity was then expressed as pore
area per m2 (AP) and pore width (WP). Additional SEM micrographs were acquired in a
Hitachi S-4700 scanning electron microscope equipped with the MeX software package
(version 5.0.1, Alicona) that allowed for 3D data acquisition and object reconstruction
using stereo-photogrammetry. Specifically, the software identified common points at
different focus depths on a block of three overlapped 2D images that were taken at
different tilt angles (5, 0 and -5º). Finally, the software allocated every point from the
original 2D images into a 3D mapping that allowed object reconstruction. The root
mean square (RMS) roughness (Rq) was obtained from the reconstructed 3D model of
the different specimens for a path lenght of 15 m.
The mechanical properties of the different scaffolds were measured at room
temperature by using a Perkin-Elmer DMA7 equipment, as previously described.60
Briefly, the bending strength, f, was determined by a three-point bending test and the
Young’s modulus calculated from the slopes of the load-deflection curves.
Scaffold conductivity was measured by using a four-point method.61
Particularly,
a constant current (1 mA) was applied between contact points made of silver electrodes
by using a digital multimeter Fluke 8840. Two of the contact points were placed at the
edges of the scaffold cylinder in the same longitudinal plane (1 cm in length) with a pair
of micromanipulators. The voltage drop in the scaffold surface was then measured by
using another two silver electrodes located at the scaffold surface by slightly pressuring
the scaffold with another pair of micromanipulators. The accuracy of the voltage
measurement was approximately 1 V. Conductivity was then calculated by using the
following equation: = [L/(πr2·R)], where L is the distance between the electrodes on
Electronic Supplementary Material (ESI) for Journal of Materials Chemistry BThis journal is © The Royal Society of Chemistry 2013
5
the upper part of the scaffold, R is the measurement recorded by the multimeter and r
the diameter of the scaffold cylinder.
6. Cell culture
Prior to cell culture, scaffolds (ca. 4.5 mm in diameter, ca. 3 mm in thickness)
were sterilized under UV radiation for 20 min per side and preconditioned in culture
medium for 24 h to eliminate any toxic residues from the synthesis. Three different cell
types were tested: murine L929 fibroblasts, human osteoblast-like Saos-2 cells and
porcine endothelial cells derived from peripheral blood progenitors (ECPC), obtained as
previously described.62
A total of 105 cells was seeded on the top part of the scaffolds in
a small fraction of media (typically 30 l) and allowed to attach for 20 min.
Immediately after, scaffolds were completely covered with complete media as follows:
DMEM supplemented with fetal bovine serum (10 %), streptomycin (100 UI ml-1
),
penicillin (100 UI ml-1
), and L-glutamine (1 mM) for fibroblasts and osteoblasts, and
EGM-2 media for ECPC cells. Cultures were maintained in static conditions at 37 ºC in a
sterile incubator under a CO2 (5 %) atmosphere for different times. Tissue culture
polystyrene (TCP) was used as a control surface. Culture media was replaced every
other day. Cell cultures were visualized by using an Axiovert CFL-40 optical
microscope with an Axiocam ICC-1 digital camera coupled (Zeiss) when possible.
For cell size comparison, and assuming cells as entities with an ellipsoidal shape
for simplification, cell dimensions were expressed as l/w ratios, where l is the cell
length (i.e., the longest cell dimension) and w the cell width (i.e., the shortest
dimension). In this sense, the higher the value of the l/w ratio is, the more elongated the
cell morphology is; whereas a l/w ratio close to the unitary value correlates with a more
square cell shape. According to this, cell size was measured and averaged from at least
25 cells from each cell type either right after trypsin treatment for cell detachment (cells
Electronic Supplementary Material (ESI) for Journal of Materials Chemistry BThis journal is © The Royal Society of Chemistry 2013
6
in suspension before seeding) or after culture on TCP for 48 h under standard culture
conditions (adhered in culture).
7. Viability and apoptosis studies
To test cell viability, cells cultured on the different substrates were analyzed by
using a Live/Dead® Viability kit (Invitrogen) according to manufacturer’s instructions.
This kit is based on the use of two probes: calcein and ethidium homodimer-1 (EthD-1).
Calcein is a non-fluorescent cell-permeable dye that gets converted into a strongly
green-light-emitting compound after contact with intracellular esterases and then
retained inside live cells. On the contrary, EthD-1 is a DNA-intercalating agent that
penetrates cell membranes in dead cells and emits orange/red fluorescence when
inserted into the DNA double helix. After staining, samples were visualized by using a
Leica SP5 confocal laser scanning microscope. The fluorescence of both probes was
excited by an Argon laser tuning to 488 nm. After excitation, emitted fluorescence was
separated by using a triple dicroic filter 488/561/633 and measured at 505-570 nm for
green fluorescence (calcein) and 630-750 nm for red fluorescence (EthD-1). Physical
reflexion from the scaffolds after excitation at 488 nm was also recorded and used to
visualize the scaffold structure and the relative cellular location. To quantify cell
viability, at least 6 square fields were randomly distributed in 20x confocal images and
the number of live (green), dead (red) and apoptotic (green and red) cells counted per
square and averaged.
Apoptotic cells in the cultures were specifically detected by using an annexin V-
FITC apoptosis detection kit (Sigma). Briefly, Saos-2 osteoblasts and ECPC cells were
cultured at a density of 5·104 cells per scaffold. Twenty-four hours after seeding, cell
cultures were washed with PBS (twice) and incubated with annexin V-FITC conjugate
(5 l in 500 l of PBS) for 10 min protected from light. Simultaneous staining with the
Electronic Supplementary Material (ESI) for Journal of Materials Chemistry BThis journal is © The Royal Society of Chemistry 2013
7
probe EthD-1 allowed for the discrimination among early apoptotic (green
fluorescence), late apoptotic (green and red) and dead cells (red). Stained cells were
then visualized by using a Leica DMI 6000B fluorescence microscope. As a result of
the externalization of phosphatidylserine, apoptotic cells were detected by their green
fluorescence emission. Additionally, some cells were exposed to H2O2 (1 mM in PBS)
for 90 min prior to annexin V incubation to serve as positive control of apoptosis
induction. Cell viability in these cultures was tested in parallel as previously described.
8. Cell adhesion and morphology studies by scanning electron microscopy (SEM)
Cells cultured on the scaffolds for 48 h were rinsed in PBS twice and fixed with
glutaraldehyde 2.5 % in PBS for 30 min. After washing in distilled water, dehydration
was performed by slow water replacement using series of ethanol solutions (30 %, 50
%, 70 %, and 90 %) for 15 min twice and a final dehydration in absolute ethanol for 30
min. Samples were then allowed to dry at room temperature for 24 h, and then mounted
in stubs and coated in vacuum with gold. Cell cultures on scaffolds were examined with
a DSM-950 scanning electron microscope (SEM, Zeiss).
9. Time-lapse confocal laser scanning microscopy (CLSM) recording
Cell migration on the different scaffolds was investigated by using time-lapse
CLSM recording. Briefly, Saos-2 cells were seeded at a density of 2.5·104 cells per
scaffold and permitted to adhere on the scaffold surface for 20 min. Due to the opacity
of CNT-based scaffolds, cells were labeled to allow their visualization with alexa
fluor® 594-conjugated wheat germ agglutinin (WGA, 5 g ml-1
in PBS, Invitrogen), a
fluorescent lectin that selectively binds to N-acetylglucosamine and N-acetylneuramic
acid residues present in cell glycoproteins. After 5 minutes of incubation at room
Electronic Supplementary Material (ESI) for Journal of Materials Chemistry BThis journal is © The Royal Society of Chemistry 2013
8
temperature, cell movements were recorded for at least 3 hours by using a Leica SP5
confocal laser scanning microscope with an acclimatized chamber (37 ºC, 5 % CO2).
Simultaneous laser reflection on the scaffold surface permitted a perfect visualization of
the scaffold architecture. Cells on TCP were visualized without WGA staining as the
transparency of the substrate allowed for their direct observation.
10. Statistics
Values were expressed as mean ± standard deviation. Statistical analysis was
performed using the Statistical Package for the Social Sciences software (SPSS),
version 17.0. Comparisons among three or more groups were done by analysis of
variance (ANOVA), followed by either Scheffé or Games-Howell post hoc tests
depending on variance homogeneity among groups. For comparisons between two
groups, t Student test was performed. In all statistical evaluations, p < 0.05 was
considered statistically significant.
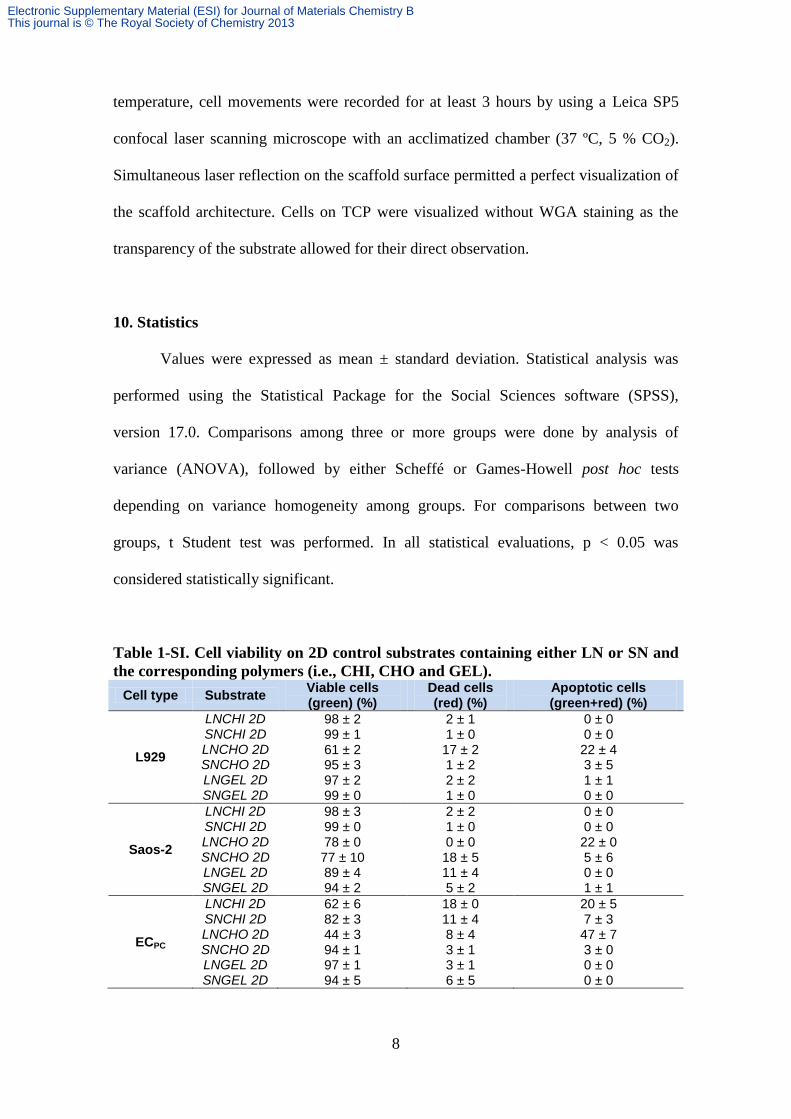
Table 1-SI. Cell viability on 2D control substrates containing either LN or SN and
the corresponding polymers (i.e., CHI, CHO and GEL).
Cell type Substrate Viable cells (green) (%)
Dead cells (red) (%)
Apoptotic cells (green+red) (%)
L929
LNCHI 2D SNCHI 2D LNCHO 2D SNCHO 2D LNGEL 2D SNGEL 2D
98 ± 2 99 ± 1 61 ± 2 95 ± 3 97 ± 2 99 ± 0
2 ± 1 1 ± 0 17 ± 2 1 ± 2 2 ± 2 1 ± 0
0 ± 0 0 ± 0 22 ± 4 3 ± 5 1 ± 1 0 ± 0
Saos-2
LNCHI 2D SNCHI 2D LNCHO 2D SNCHO 2D LNGEL 2D SNGEL 2D
98 ± 3 99 ± 0 78 ± 0 77 ± 10 89 ± 4 94 ± 2
2 ± 2 1 ± 0 0 ± 0 18 ± 5 11 ± 4 5 ± 2
0 ± 0 0 ± 0 22 ± 0 5 ± 6 0 ± 0 1 ± 1
ECPC
LNCHI 2D SNCHI 2D LNCHO 2D SNCHO 2D LNGEL 2D SNGEL 2D
62 ± 6 82 ± 3 44 ± 3 94 ± 1 97 ± 1 94 ± 5
18 ± 0 11 ± 4 8 ± 4 3 ± 1 3 ± 1 6 ± 5
20 ± 5 7 ± 3 47 ± 7 3 ± 0 0 ± 0 0 ± 0
Electronic Supplementary Material (ESI) for Journal of Materials Chemistry BThis journal is © The Royal Society of Chemistry 2013
9
Additional Figures
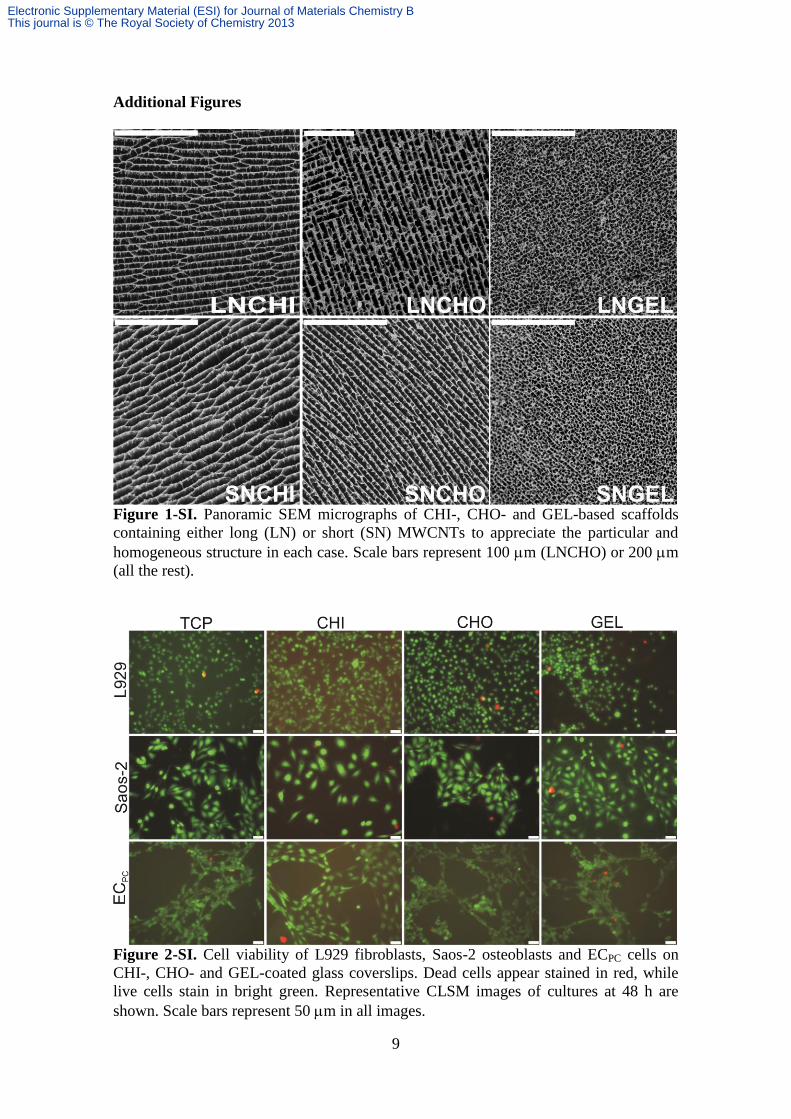
Figure 1-SI. Panoramic SEM micrographs of CHI-, CHO- and GEL-based scaffolds
containing either long (LN) or short (SN) MWCNTs to appreciate the particular and
homogeneous structure in each case. Scale bars represent 100 m (LNCHO) or 200 m
(all the rest).
Figure 2-SI. Cell viability of L929 fibroblasts, Saos-2 osteoblasts and ECPC cells on
CHI-, CHO- and GEL-coated glass coverslips. Dead cells appear stained in red, while
live cells stain in bright green. Representative CLSM images of cultures at 48 h are
shown. Scale bars represent 50 m in all images.
Electronic Supplementary Material (ESI) for Journal of Materials Chemistry BThis journal is © The Royal Society of Chemistry 2013
10
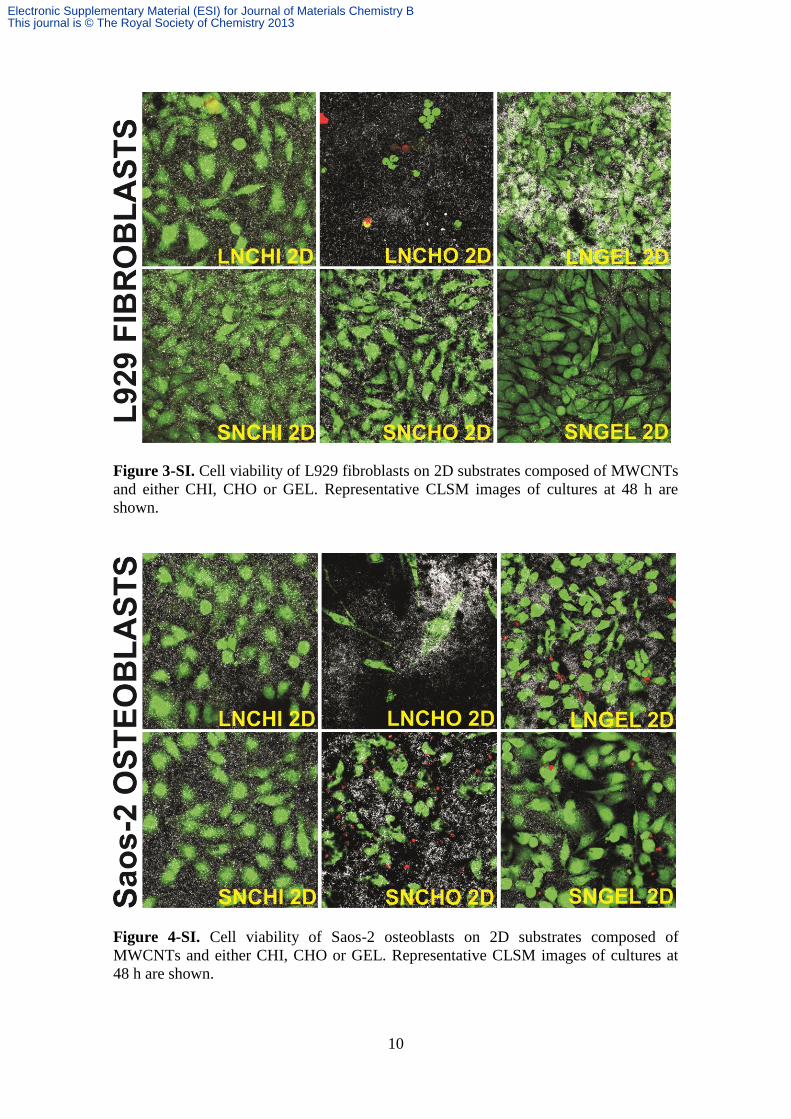
Figure 3-SI. Cell viability of L929 fibroblasts on 2D substrates composed of MWCNTs
and either CHI, CHO or GEL. Representative CLSM images of cultures at 48 h are
shown.
Figure 4-SI. Cell viability of Saos-2 osteoblasts on 2D substrates composed of
MWCNTs and either CHI, CHO or GEL. Representative CLSM images of cultures at
48 h are shown.
Electronic Supplementary Material (ESI) for Journal of Materials Chemistry BThis journal is © The Royal Society of Chemistry 2013
11
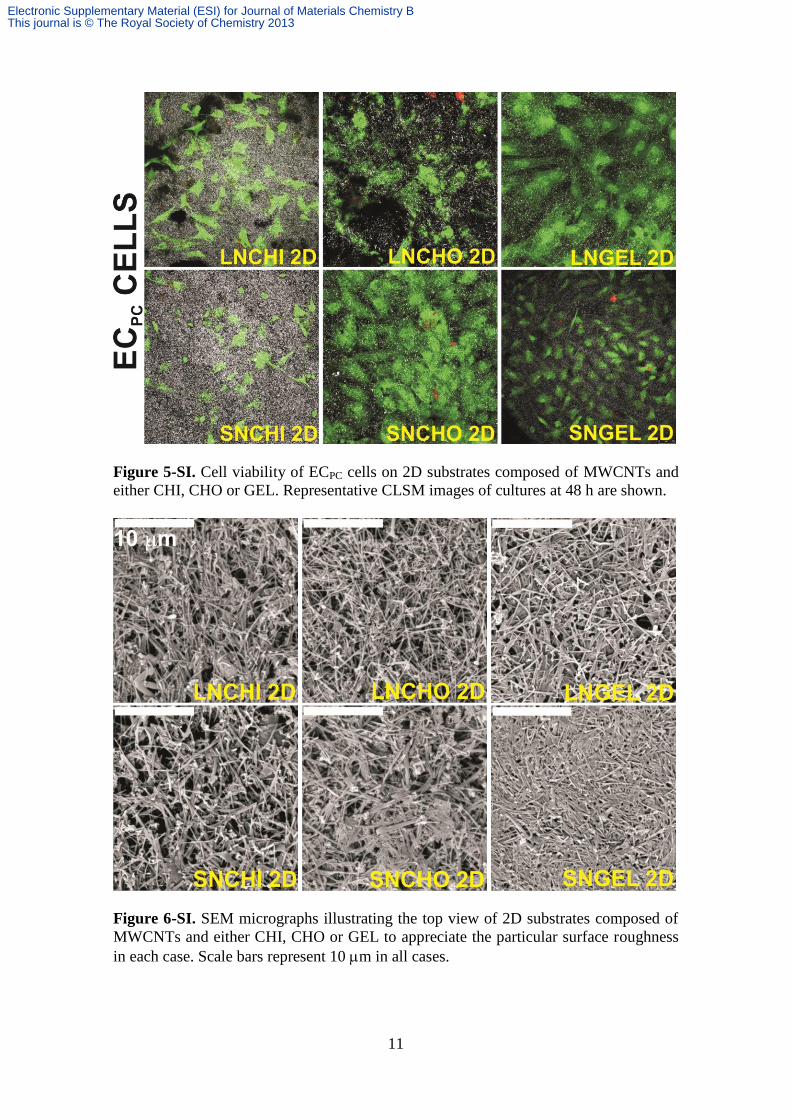
Figure 5-SI. Cell viability of ECPC cells on 2D substrates composed of MWCNTs and
either CHI, CHO or GEL. Representative CLSM images of cultures at 48 h are shown.
Figure 6-SI. SEM micrographs illustrating the top view of 2D substrates composed of
MWCNTs and either CHI, CHO or GEL to appreciate the particular surface roughness
in each case. Scale bars represent 10 m in all cases.
Electronic Supplementary Material (ESI) for Journal of Materials Chemistry BThis journal is © The Royal Society of Chemistry 2013
12
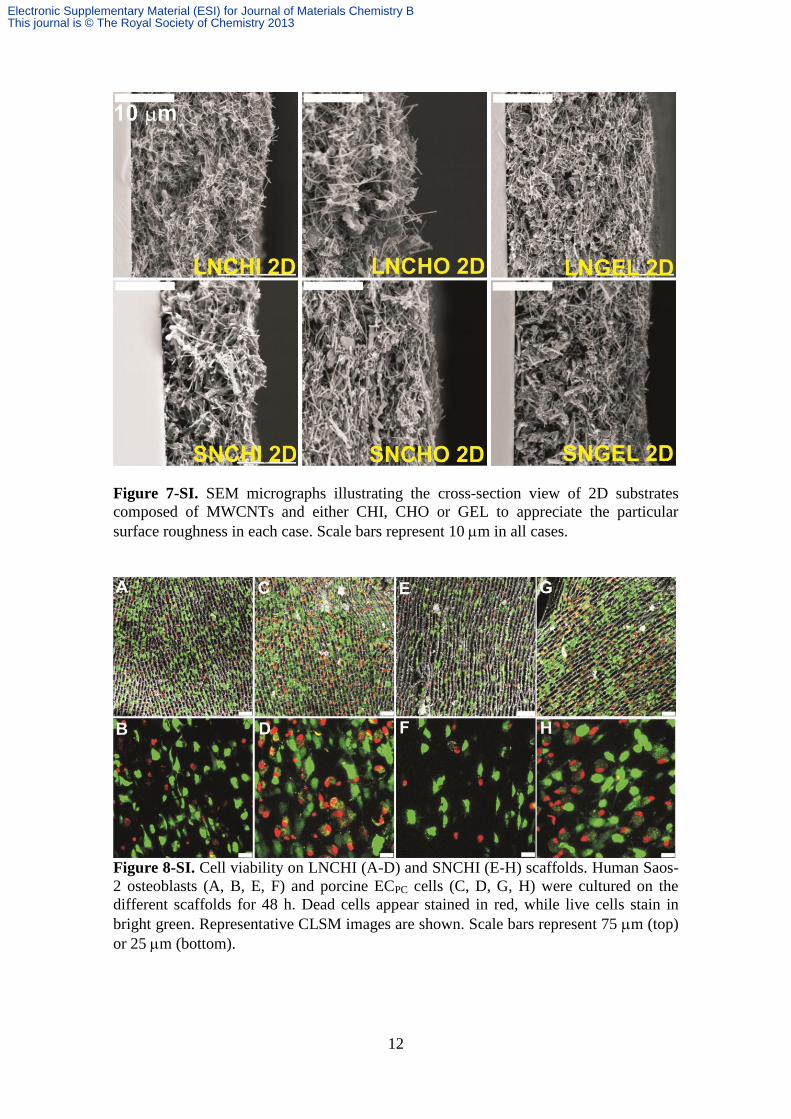
Figure 7-SI. SEM micrographs illustrating the cross-section view of 2D substrates
composed of MWCNTs and either CHI, CHO or GEL to appreciate the particular
surface roughness in each case. Scale bars represent 10 m in all cases.
Figure 8-SI. Cell viability on LNCHI (A-D) and SNCHI (E-H) scaffolds. Human Saos-
2 osteoblasts (A, B, E, F) and porcine ECPC cells (C, D, G, H) were cultured on the
different scaffolds for 48 h. Dead cells appear stained in red, while live cells stain in
bright green. Representative CLSM images are shown. Scale bars represent 75 m (top)
or 25 m (bottom).
Electronic Supplementary Material (ESI) for Journal of Materials Chemistry BThis journal is © The Royal Society of Chemistry 2013
13
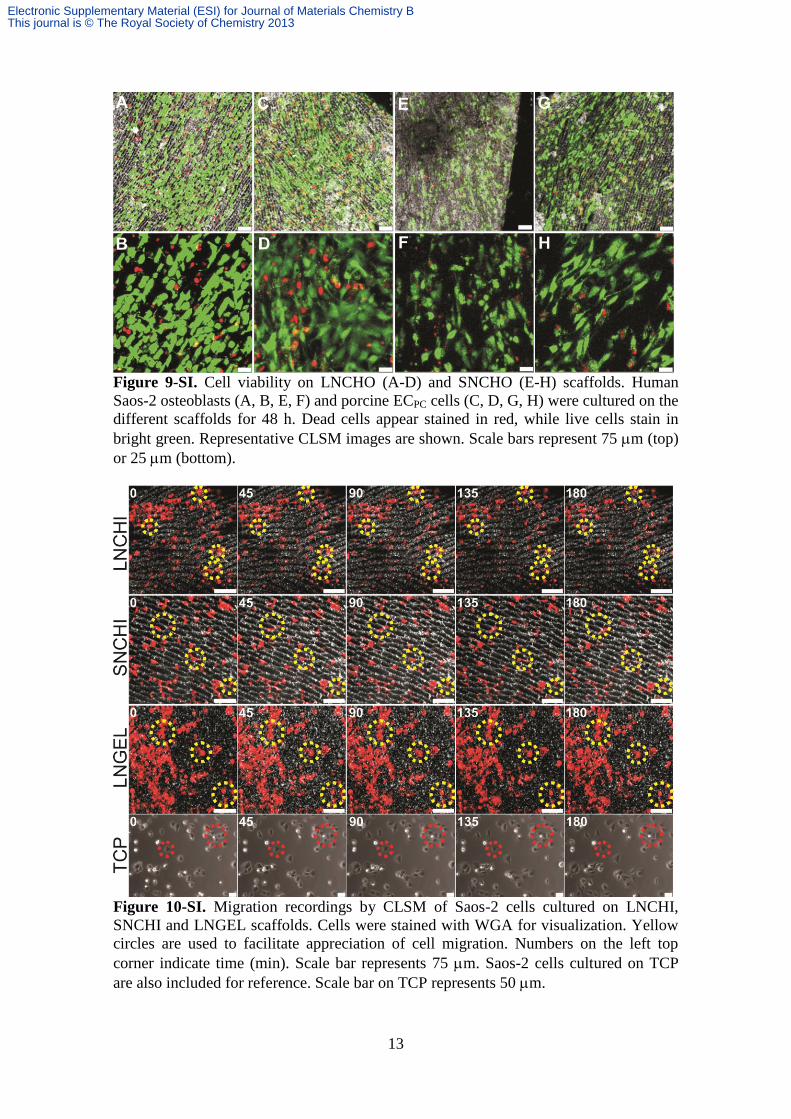
Figure 9-SI. Cell viability on LNCHO (A-D) and SNCHO (E-H) scaffolds. Human
Saos-2 osteoblasts (A, B, E, F) and porcine ECPC cells (C, D, G, H) were cultured on the
different scaffolds for 48 h. Dead cells appear stained in red, while live cells stain in
bright green. Representative CLSM images are shown. Scale bars represent 75 m (top)
or 25 m (bottom).
Figure 10-SI. Migration recordings by CLSM of Saos-2 cells cultured on LNCHI,
SNCHI and LNGEL scaffolds. Cells were stained with WGA for visualization. Yellow
circles are used to facilitate appreciation of cell migration. Numbers on the left top
corner indicate time (min). Scale bar represents 75 m. Saos-2 cells cultured on TCP
are also included for reference. Scale bar on TCP represents 50 m.
Electronic Supplementary Material (ESI) for Journal of Materials Chemistry BThis journal is © The Royal Society of Chemistry 2013
14
Movie 1-SI. Time-lapse CLSM recording of Saos-2 cell migration on LNCHI scaffolds.
Movie 2-SI. Time-lapse CLSM recording of Saos-2 cell migration on SNCHI scaffolds.
Movie 3-SI. Time-lapse CLSM recording of Saos-2 cell migration on LNGEL
scaffolds.
Electronic Supplementary Material (ESI) for Journal of Materials Chemistry BThis journal is © The Royal Society of Chemistry 2013