Embed Size (px)
Citation preview

Supporting information
Periodic tiling of triangular and square nanotubes in a
cationic metal-organic framework for selective anion
exchange
Bai-Qiao Song,a Xin-Long Wang,*a Yu-Teng Zhang,a Xue-Song Wu,a Hong-Sheng Liu,*b Kui-Zhan Shaoa and Zhong-Min Su*a
a Institute of Functional Material Chemistry, Key Lab of Polyoxometalate Science of
Ministry of Education, Faculty of Chemistry, Northeast Normal University;
Changchun, 130024, Jilin, China. Fax: (+86) 431-85684009; Tel: (+86) 431-
85099108. E-mail: [email protected]; [email protected] School of Chemistry and Chemical Engineering, Daqing Normal University; Key
Laboratory of Oilfield Applied chemistry, College of Heilongjiang Province, Daqing
163712, E-mail: [email protected].
Electronic Supplementary Material (ESI) for ChemComm.This journal is © The Royal Society of Chemistry 2015

S1. Materials and Measurements
Chemicals were purchased from commercial sources and used without further
purification. Powder X-ray diffraction (PXRD) was carried out with an X-ray
diffractometer of Rigaku, Rint 2000. The C, H, and N elemental analyses were
conducted on a Perkin-Elmer 240C elemental analyzer. The FT-IR spectra were
recorded from KBr pellets in the range 4000-400 cm-1 on a Mattson Alpha-Centauri
spectrometer. Thermogravimetric analyses (TGA) were carried out on a Perkin-Elmer
TG-7 analyzer heated from room temperature to 800 °C at a ramp rate of 5 °C/min
under nitrogen. UV-Visible absorption spectral measurements were carried out using
a U-3010 Spectrophotometer.
S2. Synthesis
The ligand 1,3-Bis(4-carboxyphenyl)imidazolium Chloride (H2L+Cl-) was prepared
following the method as described in the literature.1
[In(OH)L]5(NO3)5·33H2O·14DMF (1): A solid mixture of H2L+Cl- (34 mg, 0.1
mmol), In(NO3)3·4.5H2O (38 mg, 0.1 mmol) was suspended in DMF (5 ml) in a 10 ml
vial, which was stirred for about 1 h to get the clear solution. Then the vials were
tightly capped and put in an oven to heat at 60 °C for 15 days. The resulting colorless
block crystals were filtered, washed, and dried in air; Yield: ca. 64% based on 1 mol
of H2L+Cl-. Elemental analysis calcd (%) for 1 C127H224In5N29O87 (4123.45): C 36.99,
H 5.48, N 9.85%; found: C 38.12, H 4.65, N 9.23%. IR (cm-1): 3430(m), 3075(w),
2928(w), 1664(s), 1611(w), 1550(m), 1386(s), 1254(m), 1183(w), 1092(w), 1064(w),
1058(w), 1011(w), 943(w), 862(w), 781(s), 693(w), 660(w), 6198(w), 530(w).
S3. Ion-exchange experiments
Ion-exchange experiments were performed by immersing the MOF materials in the
dye/dimethylformamide (DMF) solution, which was kept still during the entire ion-
exchange process. UV–vis absorbance measurements were performed periodically for
the upper clear solution, which was poured back to the original system after each
measurement to keep the total amount of sample constant. For most measurements,
the molar ratio between MOF and dye was kept at 20:1 to make it within the
detectable range of UV–vis measurements as well as to reduce the time for the ion-

exchange process. The percentage of dye remaining in the solution is calculated by
comparing the absorbance maximum with the original dye solution.
In a typical measurement, 8.25 mg (2 μmol) as-synthesized 1 was weighed out to a 10
ml vial, and 6 mL DMF solution containing 0.22 mg (0.5 μmol) Orange G was added
to the vial. Then the upper clear solution was taken out for UV–vis absorbance
measurement at 0 h, 2 h, 4 h, 6 h, 8 h, 12 h, 16 h, 24 h and 36 h, respectively. After
each measurement, the solution was poured back to the original vial to avoid the loss
of the sample. The absorbance at maximum wavelength (λmax = 503.5 nm for OG2-)
was chosen to calculate the dye content during the ion-exchange process by the
following formula:
D = At / A0 × 100%
where D is the dye content in DMF solution, A0 is the characteristic absorbency of
OG2- solution before ion-exchange. At is the characteristic absorbency of OG2-
solutions at different times (t = 0 h, 2 h, 4 h, 6 h, 8 h, 12 h, 16 h, 24 h, 36 h) in the ion-
exchange experiment.
The release experiment was carried out right after the completion of an ion-exchange
process of OG2- on 1. It was triggered by replacing the upper clear DMF solution by
the same volume of DMF solution containing 85.0mg (1 mmol) NaNO3. The cycle
experiments were done by performing ion-exchange, release, and filtering in turn for 6
cycles. The measurements were performed after completion of ion-exchange and
release. Stirring is used to accelerate the ion-exchange process.
The ion exchange capacity experiment was carried out by dissolving 13.6 mg (30
μmol) OG2- into 10 mL of DMF, and 33.0 mg (8 μmol) of 1 was applied for the ion-
exchange. Considering the -2 charge of OG2-, the applied 4:3 molar ratio between 1
and OG2- actually gives a molar ratio of NO3- to RSO3
- as 2:3. The above OG2-
solution shows high absorbance, so solutions need to be diluted for UV–vis
measurement. The ion-exchange and release process was accelerated by stirring
mechanically. After a period of about 72 h, the ion-exchange process reached
equilibrium. By comparing the UV–vis absorbance of the solutions before and after
ion-exchange, it was calculated that approximately 16.64 μmol of OG2- remained in

the solution at the end of the ion-exchange process, which corresponds to about 66.8%
of the NO3- in 1 being replaced by the OG2-.
S4. X-ray crystallography
Single-crystal X-ray diffraction data were recorded on a Bruker Apex CCD
diffractometer with graphite-monochromated MoKα radiation (λ = 0.71073 Å) at
293K. Absorption corrections were applied using multi-scan technique. All the
structures were solved by Direct Method of SHELXS-972 and refined by full-matrix
least-squares techniques using the SHELXL-97 program3 within WINGX.4 Single
crystals of 1 were found to be weakly diffracting. Such a problem is relatively
common in the field of framework materials and is typical for highly porous materials
with extensive structural disorder. Numerous attempts were made at growing the
crystals under a variety of conditions to slow the crystallisation process and give less
disordered crystals. Various other techniques, such as cold mounting or desolvating
the crystals before analysis were also attempted. All methods to obtain a better
diffraction pattern were unsuccessful, indicating that it is likely that the limitations to
the data and resulting refinement model are intrinsic to the inherent structural disorder.
The structural model reported was refined against the best diffraction data obtained.
When combined with the known chemical composition of the ligand and other
structural information from related materials, a sound model of the framework
structure was obtained, albeit with no information on solvent molecules and anion
location.
For 1, its asymmetric unit contains five crystallographically independent In3+-ions and
five complete linker molecules, which means there exist totally ten 6-membered rings
(benzene ring), and five 5-membered rings (Imidazolium ring). As mentioned above,
it is common to find structural disorder in highly porous metal-organic frameworks.
Among the ten benzene rings and the five Imidazolium rings, several ones are
disordered over two sites and the occupancies of the two disordered parts have been
fixed at 0.5:0.5. The instruction “SAME” was used to restraint the 1,2- and 1,3-
distacnes in the 6- or 5-membered rings of the two disordered parts to be similar.
Command “SIMU” and “DELU” were used to restraint the thermal parameters of

atoms in the two disordered parts. All the non-hydrogen atoms have been refined
anisotropically. However, even some atoms in the ligand were disordered over two
sites, their thermal parameters are still high, which results in some C-level errors. The
fixing occupancies for disordered atom leads to many G-level errors which can’t be
completely avoided.
Some residual electron densities, which should be considered as peaks from heavily
disordered solvent molecules and counterions, did not give a chemical meaningful
result after a careful refinement. Therefore, the contributions of the disordered solvent
molecules and counterions were removed from the diffraction data using the
SQUEEZE routine of PLATON5 software and then final refinements were carried out.
The final platon.sqf file was attached to the CIF file and the electron numbers in the
void obtained from the platon.sqf file has been used to calculate the guest solvent
molecules crystallizing in the pore of 1. These molecules are further estimated by
TGA analysis combining with element analysis, and the results were introduced to the
formula directly. The H atoms on the bridging OH groups cannot be found from the
residual peaks and directly included into the final molecular formula, too. The
addition of the solvent and H atoms to the formula unit generates significant A-level
and B-level errors (e.g. density, chemical formula, density) in the final CIF output.
At the final stage of the refinement, the highest residual peak of 1.20 eA-3 can be
found around the In atom. This place is featureless and not possible for any atom due
to the close distance to In, and should be due to the "series termination errors". The
detailed crystallographic data and structure refinement parameters for 1 are
summarized in Table S1. Crystallographic data for the structure reported in this paper
have also been deposited with the CCDC as deposition no. CCDC 1055468 (available
free of charge, on application to the CCDC, 12 Union Rd., Cambridge CB2 1EZ, U.K.;
e-mail [email protected]).

Table S1. Crystal data and structure refinements for compound 1
Compound reference 1Chemical formula C127H224In5N29O87
Formula Mass 4123.45Crystal system Monoclinica/(Å) 15.3713(11)b/(Å) 37.512(3)c/(Å) 38.979(3)α/° 90β/° 105.255(2)γ/° 90Unit cell volume/(Å)3 21684(3)Temperature/K 293(2)Space group P21/cNo. of formula units per unit cell, Z 4Theta range for data collection (degree) 1.75 to 25.00No. of reflections measured 98836No. of independent reflections 36527Rint 0.0813Final R1 values (I > 2σ(I))a 0.0534Final wR(F2) values (I > 2σ(I))b 0.1103Final R1 values (all data) 0.0963Final wR(F2) values (all data) 0.1161Goodness of fit on F2 1.005aR1=Σ||Fo|-|Fc||/Σ|Fo|. bwR2= |Σw(|Fo|2-|Fc|2)|/ Σ|w(Fo
2)2|1/2

Figure S1. a) The V-shaped ligand connects with four different In atoms; b) and c) Infinite zigzag chain of cis-connected, corner-sharing InO4(OH)2-polyhedra which can be regarded as a 5-fold pseudo-helical chain. The cis located bridging oxygen atoms from the OH groups has been highlighted in pink; d) View of the 3D framework along the [100] direction which shows two different nanotublar channels. In: green, C: grey, H: light grey, and O: red.
Figure S2. View of the 3D framework along the [010] direction.

Figure S3. a), b) and c) View of the square tube along b axis shows that the 5-fold pseudo-helical chains serving as pillars and the imidazolium-based ligands as the walls. d), e) and f) View of the triangular tube along b axis. Interestingly, the V-shaped ligands on the wall of these two types of tubular channels are arranged in a way of “< > < >”, which results in gates or windows on the wall between the two contiguous metal-organic tubes.

Figure S4. Infrared spectrum of fresh 1. The channels in the structure are not empty but contain solvent molecules, viz., water and DMF along with nitrate anions to balance the charge. The broad peak at 3430 cm−1 in the IR spectrum of the complex indicates the presence of water molecules in the structure. Sharp peak at 1664 cm−1
appears for free CO stretching vibrations of dimethylformamide molecules, inside the channels. Another sharp peak at 1386 cm−1 appears due to the presence of the nitrate anions.
Figure S5. TGA curve of compound 1.

Figure S6. Three kinds of metal-organic frameworks which can be constructed by the similar chain-like [In(OH)(CO2)2]n SBU and different dicarboxylate ligands. The structures are viewed along the chain-like SBU. a) 1 constructed by connecting V-shaped cationic imidazolium-based dicarboxylate ligand with [In(OH)(CO2)2]n which demonstrates snub square tessellation pattern (32.4.3.4). b) MIL-68-In constructed by connecting terephthalate or BDC with [In(OH)(CO2)2]n which shows trihexagonal (or kagome) pattern (3.6.3.6)6. c) MIL-53-In constructed by connecting terephthalate or BDC with [In(OH)(CO2)2]n which exhibits square pattern (44).7 The different topology pattern maybe ascribe to the different geometry of the ligands8 and the different synthetic conditions also play vital role because MIL-53-In and MIL-68-In consist of same SBU and same ligand. The snub square tiling was firstly realized in chain-like SBU based metal-organic framework by this work.9 The one-dimensional rod-shaped (or chain-like) inorganic building units will be favourable for both the regular and semiregular Archimedean tiling patterns because when all the inorganic chains are arranged parallel to each other along one direction, the connection between these inorganic chain by the ligands will be versatile.10

Figure S7. A series of azo type dyes with similar backbone but different charges and sizes were used in the ion-exchange experiment.

Figure S8. According to the rule proposed by Feng et al.,11 in order to estimate the accessibility of organic dyes to the pore, the dimensions of the organic dyes are defined as x × y × z (x ≤ y ≤ z), wherein x, y and z are the three edges of a cuboid that can just include the molecule, and they are chosen to make y as small as possible.12
Table S2 Molecular weight and dimensions of guest dye molecules with different charges used in the ion-exchange experiment.Name Methylene
BlueSudan I Acid Orange
7Orange G
Abbr. MLB SDI AO7 OGCharge + 1 0 - 1 - 2Mw 284.40 248.28 327.33 406.38x (Å) 4.00 3.68 5.44 5.44y (Å) 7.93 9.74 10.03 10.14z (Å) 16.34 13.55 15.67 15.64Name New Coccine Croscein
Scarlet 3BAcid Black 1 Methyl Blue
Abbr. NC CS3B AB1 MBCharge - 3 - 2 - 2 - 2Mw 535.49 510.50 570.51 753.82x (Å) 5.44 5.44 5.44 13.89y (Å) 10.48 10.61 11.15 14.35z (Å) 17.38 21.81 22.93 24.49

Figure S9. a) and b) The lower and upper limit of the square channel: dmin = 15.1 Å and dmax = 20.3 Å. The lower limit of the channel size dmin is the diameter of the maximum fit circle while the upper limit of the channel size dmax is the diagonal length of the maximum fit square; Based on the dimensional model for organic dyes mentioned above, the y value of all the anionic dyes used in our experiments are smaller than the dmin of the square channel (15.1 Å), which means all these anionic dyes can enter the square channel. However, for the triangular channel, the situation is different. We can estimate that when 1.1547x + y ≤ 15.1 Å (x ≤ y), the anionic dye can enter the triangular channel. Based on this relationship, unfortunately, all the anion dyes in our experiment can’t enter the triangular channel.

Figure S10. UV-vis absorbance of dye-contained DMF solution at different time during the ion-exchange process with 1 as the host. a) SDI0, b)AO7-, c) OG2-, and d) NC3-. These four dyes with different charge show the similar size. The results suggest the neutral SDI0 can’t be exchanged with NO3
- in the framework while the other three anion dyes can be exchanged.
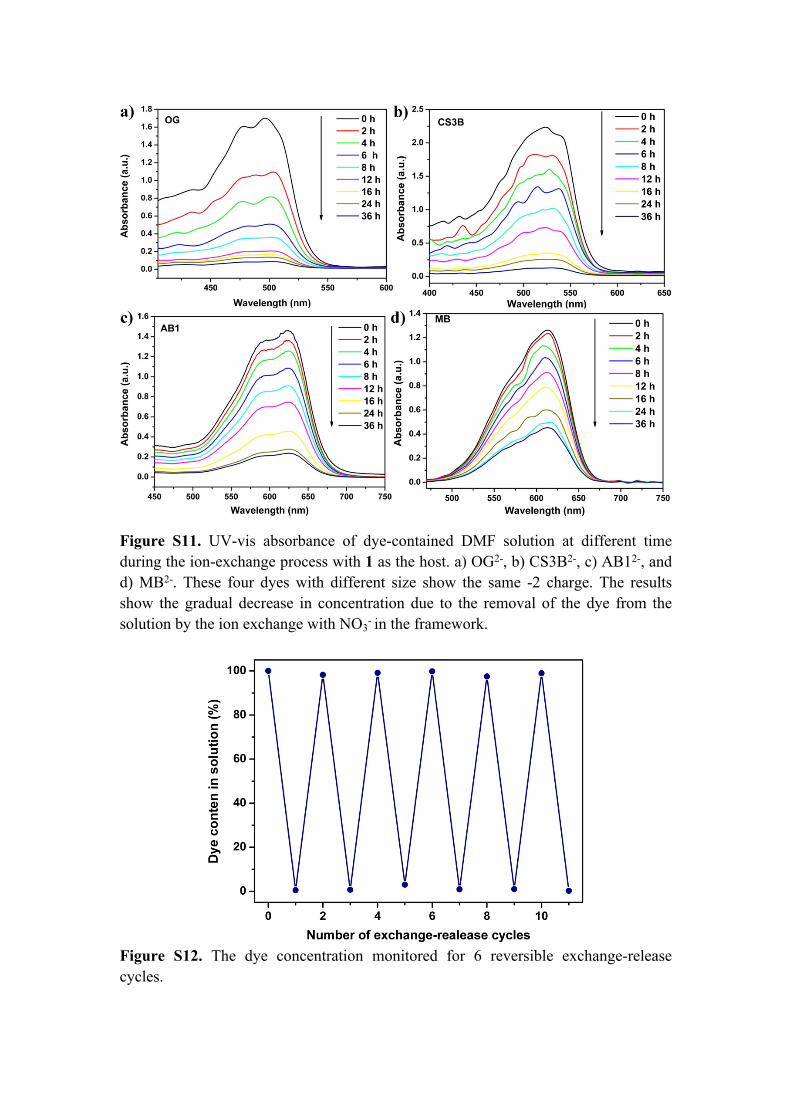
Figure S11. UV-vis absorbance of dye-contained DMF solution at different time during the ion-exchange process with 1 as the host. a) OG2-, b) CS3B2-, c) AB12-, and d) MB2-. These four dyes with different size show the same -2 charge. The results show the gradual decrease in concentration due to the removal of the dye from the solution by the ion exchange with NO3
- in the framework.
Figure S12. The dye concentration monitored for 6 reversible exchange-release cycles.

References
1. A. Aijaz, P. Lama and P. K. Bharadwaj, Inorg. Chem., 2010, 49, 5883.2. G. M. Sheldrick, SHELXS-97: Program for X-ray crystal structure solution;, University of Göttingen:
Göttingen, Germany, 1997.3. G. M. Sheldrick, SHELXL-97: Program for X-ray Crystal Structure Refinement; , University of
Göttingen: Göttingen, Germany, 1997.4. L. J. Farrugia, WINGX: A Windows Program for Crystal Structure Analysis; , University of Glasgow:
Glasgow, UK, 1988.5. A. Spek, J. Appl. Crystallogr., 2003, 36, 7.6. C. Volkringer, M. Meddouri, T. Loiseau, N. Guillou, J. Marrot, G. Férey, M. Haouas, F. Taulelle, N.
Audebrand and M. Latroche, Inorg. Chem., 2008, 47, 11892.7. E. V. Anokhina, M. Vougo-Zanda, X. Wang and A. J. Jacobson, J. Am. Chem. Soc., 2005, 127, 15000.8. H. Reinsch, M. Krüger, J. Marrot and N. Stock, Inorg. Chem., 2013, 52, 1854.9. J. A. Millan, D. Ortiz, G. van Anders and S. C. Glotzer, ACS Nano, 2014, 8, 2918.10. (a) N. L. Rosi, J. Kim, M. Eddaoudi, B. Chen, M. O'Keeffe and O. M. Yaghi, J. Am. Chem. Soc., 2005,
127, 1504; (b) H. Deng, S. Grunder, K. E. Cordova, C. Valente, H. Furukawa, M. Hmadeh, F. Gándara, A. C. Whalley, Z. Liu, S. Asahina, H. Kazumori, M. O’Keeffe, O. Terasaki, J. F. Stoddart and O. M. Yaghi, Science, 2012, 336, 1018; (c) S. Yang, A. J. Ramirez-Cuesta, R. Newby, V. Garcia-Sakai, P. Manuel, S. K. Callear, S. I. Campbell, C. C. Tang and M. Schröder, Nat. Chem., 2015, 7, 121; (d) A. Fateeva, P. A. Chater, C. P. Ireland, A. A. Tahir, Y. Z. Khimyak, P. V. Wiper, J. R. Darwent and M. J. Rosseinsky, Angew. Chem. Int. Ed., 2012, 51, 7440; (e) S. Bureekaew, S. Horike, M. Higuchi, M. Mizuno, T. Kawamura, D. Tanaka, N. Yanai and S. Kitagawa, Nat. Mater., 2009, 8, 831; (f) E. Alvarez, N. Guillou, C. Martineau, B. Bueken, B. Van de Voorde, C. Le Guillouzer, P. Fabry, F. Nouar, F. Taulelle, D. de Vos, J.-S. Chang, K. H. Cho, N. Ramsahye, T. Devic, M. Daturi, G. Maurin and C. Serre, Angew. Chem. Int. Ed., 2015, 54, 3664; (g) A. Greenaway, B. Gonzalez-Santiago, P. M. Donaldson, M. D. Frogley, G. Cinque, J. Sotelo, S. Moggach, E. Shiko, S. Brandani, R. F. Howe and P. A. Wright, Angew. Chem. Int. Ed. Engl., 2014, 53, 13483; (h) Z. R. Herm, B. M. Wiers, J. A. Mason, J. M. van Baten, M. R. Hudson, P. Zajdel, C. M. Brown, N. Masciocchi, R. Krishna and J. R. Long, Science, 2013, 340, 960; (i) E. D. Bloch, W. L. Queen, R. Krishna, J. M. Zadrozny, C. M. Brown and J. R. Long, Science, 2012, 335, 1606.
11. X. Zhao, X. Bu, T. Wu, S.-T. Zheng, L. Wang and P. Feng, Nat. Commun., 2013, 4, 2344.12. J. A. Johnson, X. Zhang, T. C. Reeson, Y.-S. Chen and J. Zhang, J. Am. Chem. Soc., 2014, 136, 15881.