Embed Size (px)
Citation preview
S1
Supporting Information
For
Stabilizing Nickel-Rich Layered Cathode Materials by a High-Charge
Cation Doping Strategy: Zirconium-Doped LiNi0.6Co0.2Mn0.2O2
Florian Schippera,#, Mudit Dixita,#, Daniela Kovachevab, Michael Taliankerc, Ortal Haika,
Judith Grinblata, Evan M. Eriksona, Chandan Ghantya, Dan T. Majora,z,
Boris Markovskya,z, Doron Aurbacha
aDepartment of Chemistry and the Lise Meitner-Minerva Center of Computational
Quantum Chemistry, Bar-Ilan University, Ramat-Gan 52900, IsraelbInstitute of General Chemistry, Bulgarian Academy of Sciences, Sofia 1113, Bulgaria
cDepartment of Materials Engineering, Ben-Gurion University of the Negev,
Beer-Sheva 84105, Israel
zCorresponding authors.
#These authors contributed equally to this work.
E-mail: [email protected] Tel. + 972 3 531 88 32; Fax. + 972 3 738 40 53
E-mail: [email protected] Tel. + 972 3 531 73 92; Fax. + 972 3 738 40 53
Electronic Supplementary Material (ESI) for Journal of Materials Chemistry A.This journal is © The Royal Society of Chemistry 2016
S2
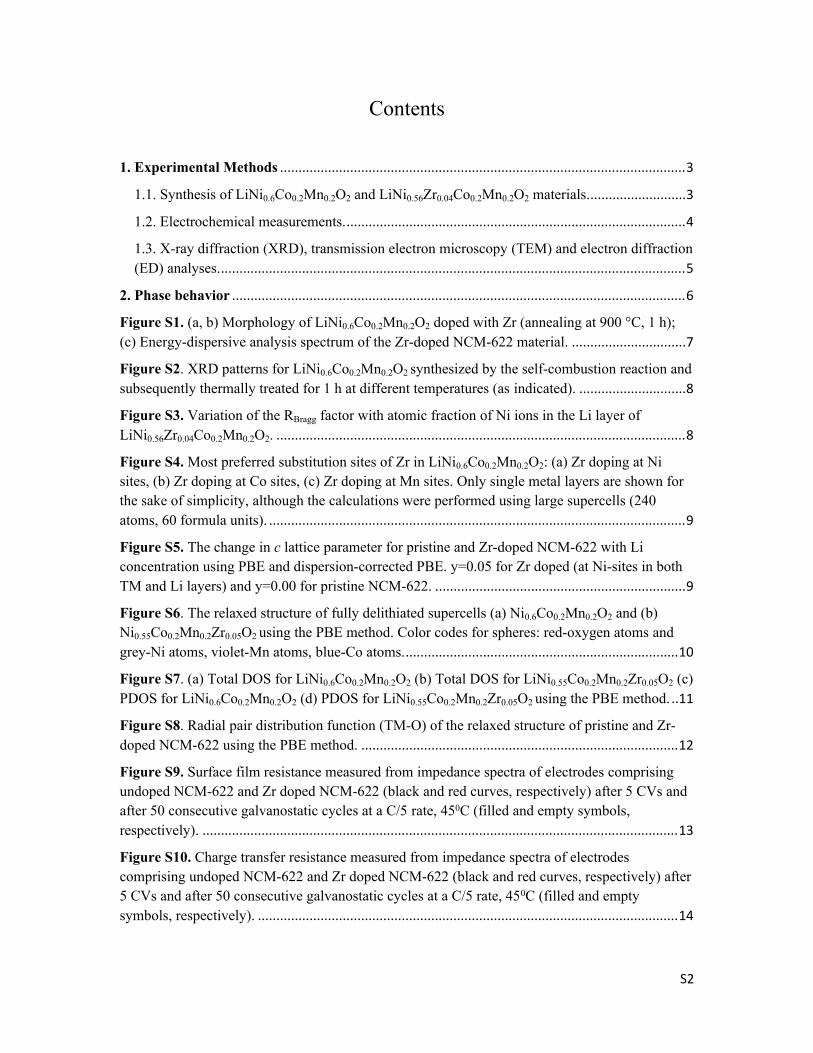
Contents
1. Experimental Methods ..............................................................................................................3
1.1. Synthesis of LiNi0.6Co0.2Mn0.2O2 and LiNi0.56Zr0.04Co0.2Mn0.2O2 materials...........................3
1.2. Electrochemical measurements.............................................................................................4
1.3. X-ray diffraction (XRD), transmission electron microscopy (TEM) and electron diffraction (ED) analyses...............................................................................................................................5
2. Phase behavior ...........................................................................................................................6
Figure S1. (a, b) Morphology of LiNi0.6Co0.2Mn0.2O2 doped with Zr (annealing at 900 °C, 1 h); (c) Energy-dispersive analysis spectrum of the Zr-doped NCM-622 material. ...............................7
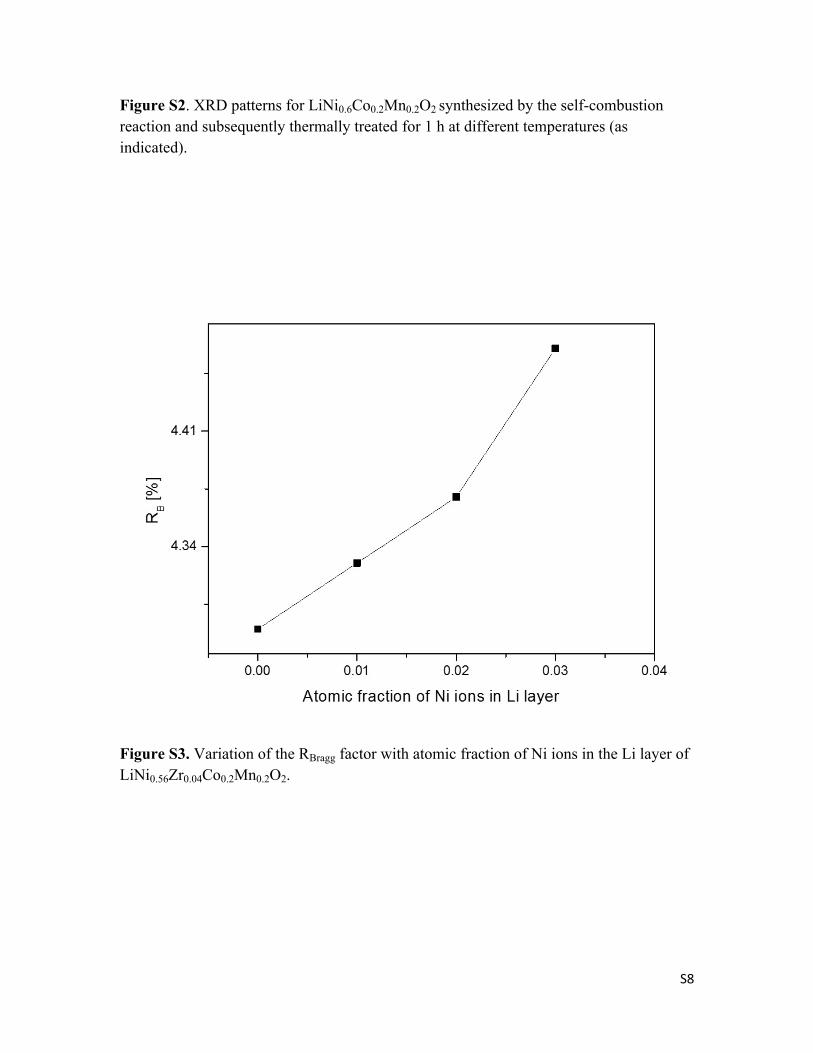
Figure S2. XRD patterns for LiNi0.6Co0.2Mn0.2O2 synthesized by the self-combustion reaction and subsequently thermally treated for 1 h at different temperatures (as indicated). .............................8
Figure S3. Variation of the RBragg factor with atomic fraction of Ni ions in the Li layer of LiNi0.56Zr0.04Co0.2Mn0.2O2. ...............................................................................................................8
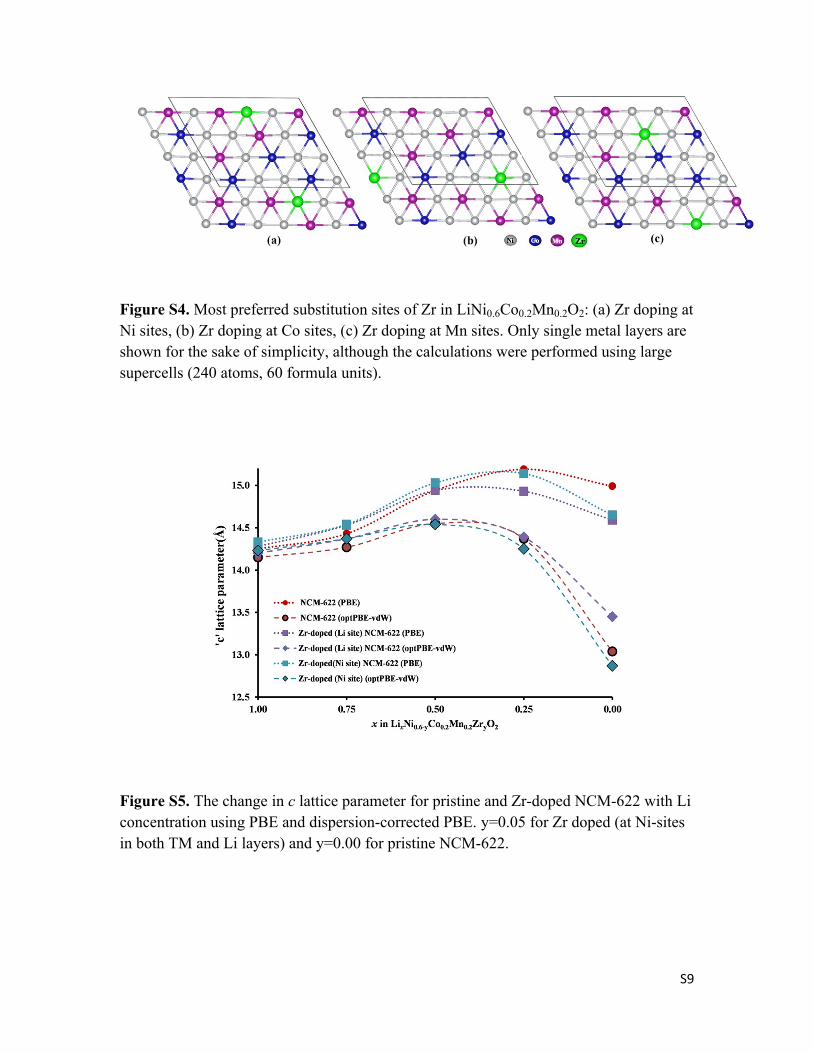
Figure S4. Most preferred substitution sites of Zr in LiNi0.6Co0.2Mn0.2O2: (a) Zr doping at Ni sites, (b) Zr doping at Co sites, (c) Zr doping at Mn sites. Only single metal layers are shown for the sake of simplicity, although the calculations were performed using large supercells (240 atoms, 60 formula units). .................................................................................................................9
Figure S5. The change in c lattice parameter for pristine and Zr-doped NCM-622 with Li concentration using PBE and dispersion-corrected PBE. y=0.05 for Zr doped (at Ni-sites in both TM and Li layers) and y=0.00 for pristine NCM-622. ....................................................................9
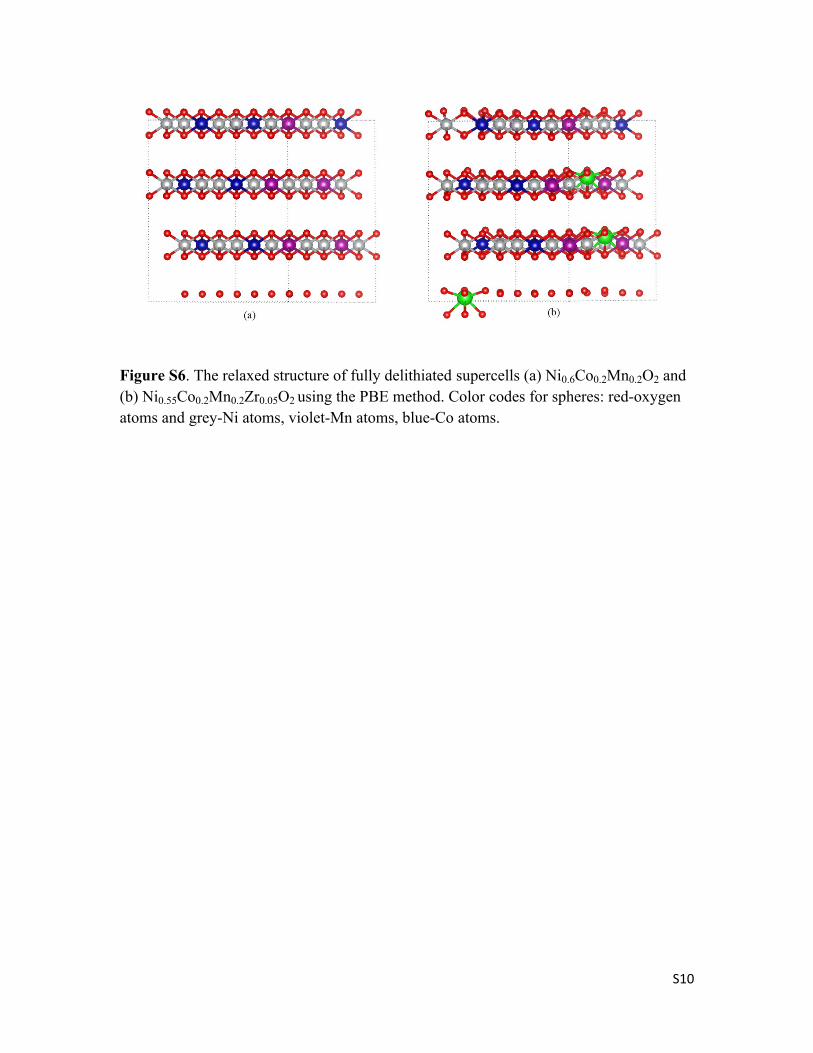
Figure S6. The relaxed structure of fully delithiated supercells (a) Ni0.6Co0.2Mn0.2O2 and (b) Ni0.55Co0.2Mn0.2Zr0.05O2 using the PBE method. Color codes for spheres: red-oxygen atoms and grey-Ni atoms, violet-Mn atoms, blue-Co atoms...........................................................................10
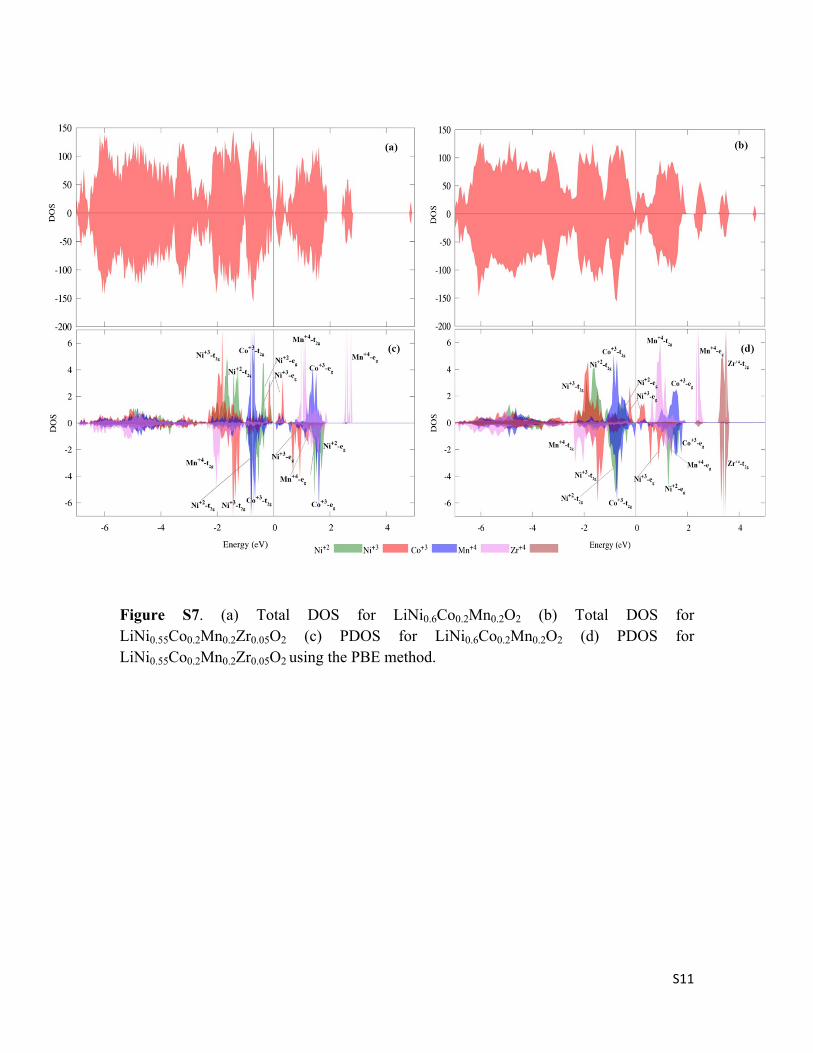
Figure S7. (a) Total DOS for LiNi0.6Co0.2Mn0.2O2 (b) Total DOS for LiNi0.55Co0.2Mn0.2Zr0.05O2 (c) PDOS for LiNi0.6Co0.2Mn0.2O2 (d) PDOS for LiNi0.55Co0.2Mn0.2Zr0.05O2 using the PBE method. ..11
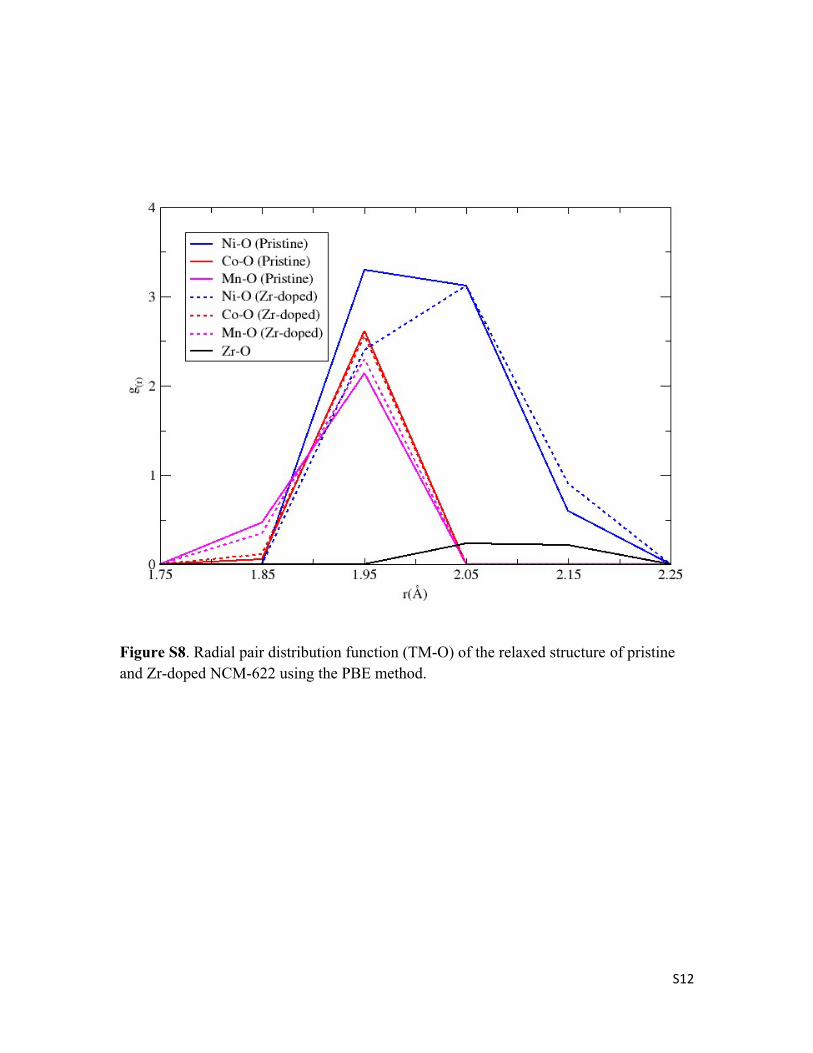
Figure S8. Radial pair distribution function (TM-O) of the relaxed structure of pristine and Zr-doped NCM-622 using the PBE method. ......................................................................................12
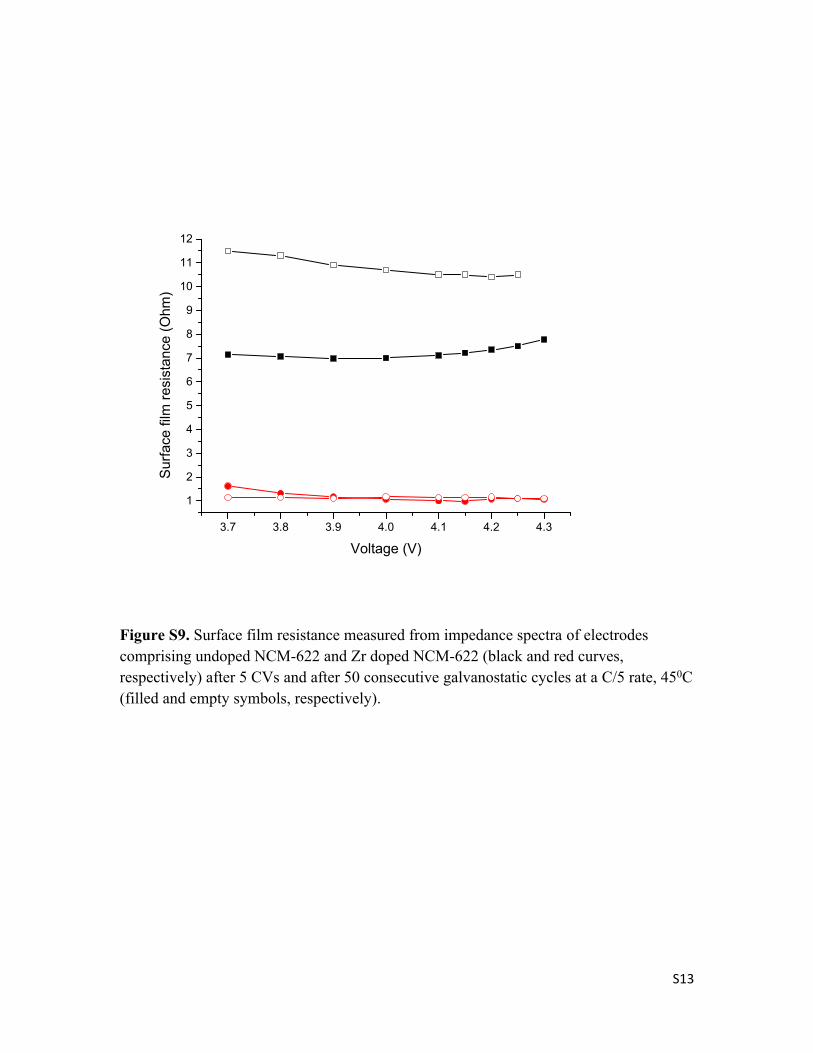
Figure S9. Surface film resistance measured from impedance spectra of electrodes comprising undoped NCM-622 and Zr doped NCM-622 (black and red curves, respectively) after 5 CVs and after 50 consecutive galvanostatic cycles at a C/5 rate, 450C (filled and empty symbols, respectively). .................................................................................................................................13
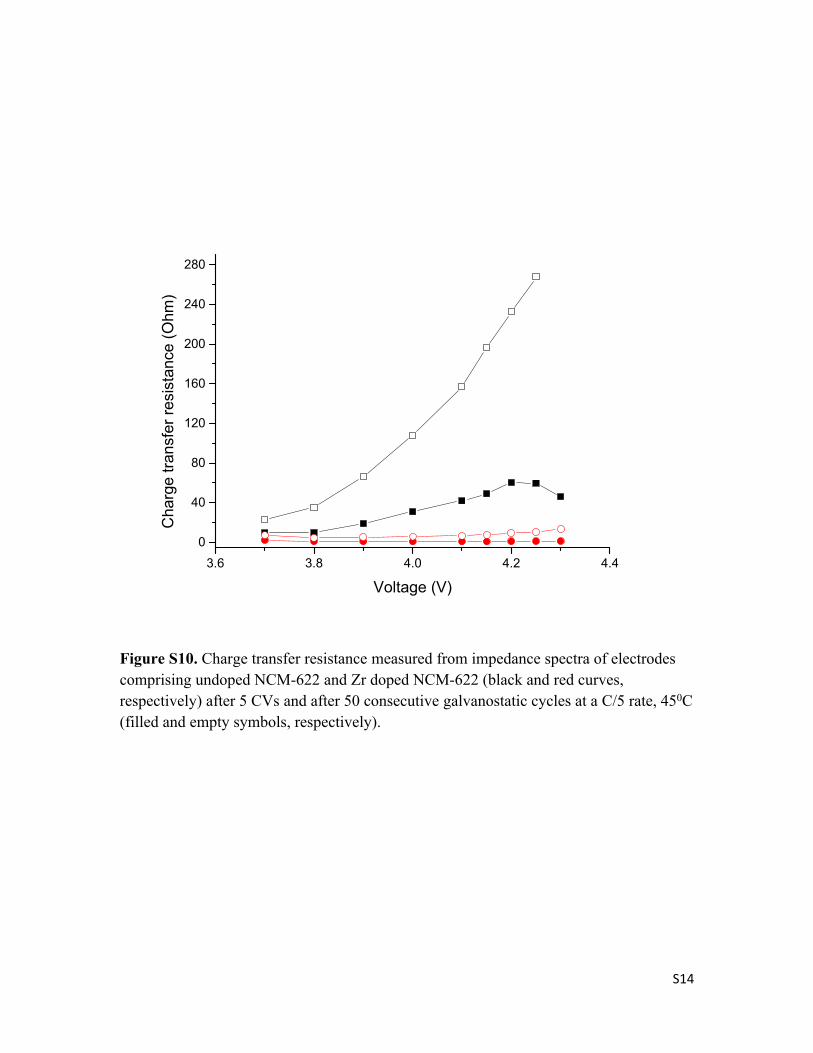
Figure S10. Charge transfer resistance measured from impedance spectra of electrodes comprising undoped NCM-622 and Zr doped NCM-622 (black and red curves, respectively) after 5 CVs and after 50 consecutive galvanostatic cycles at a C/5 rate, 450C (filled and empty symbols, respectively). ..................................................................................................................14
S3
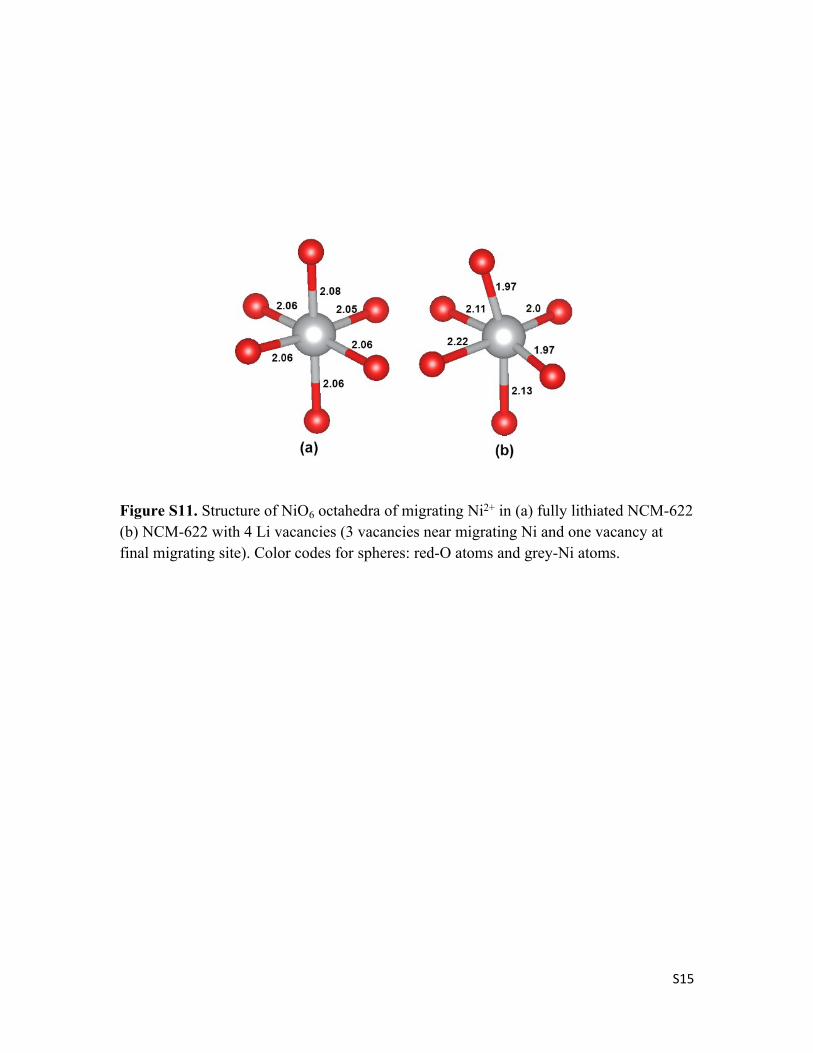
Figure S11. Structure of NiO6 octahedra of migrating Ni2+ in (a) fully lithiated NCM-622 (b) NCM-622 with 4 Li vacancies (3 vacancies near migrating Ni and one vacancy at final migrating site). Color codes for spheres: red-O atoms and grey-Ni atoms. ...................................................15
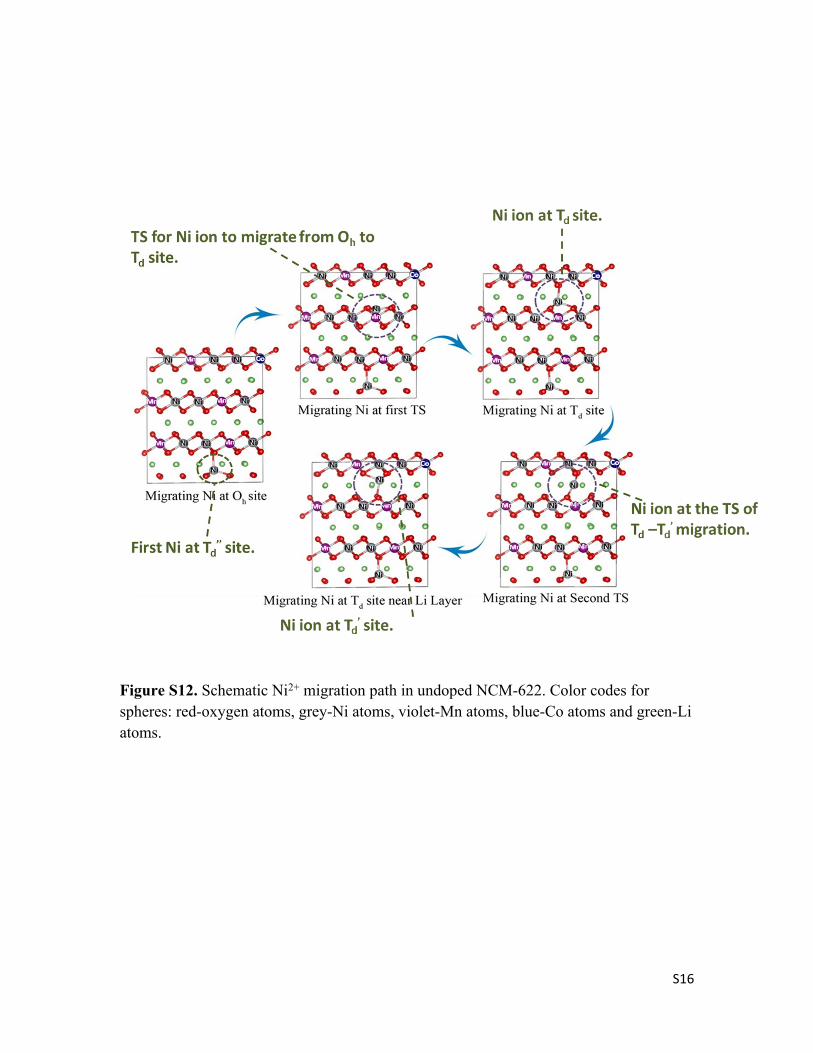
Figure S12. Schematic Ni2+ migration path in undoped NCM-622. Color codes for spheres: red-oxygen atoms, grey-Ni atoms, violet-Mn atoms, blue-Co atoms and green-Li atoms...................16
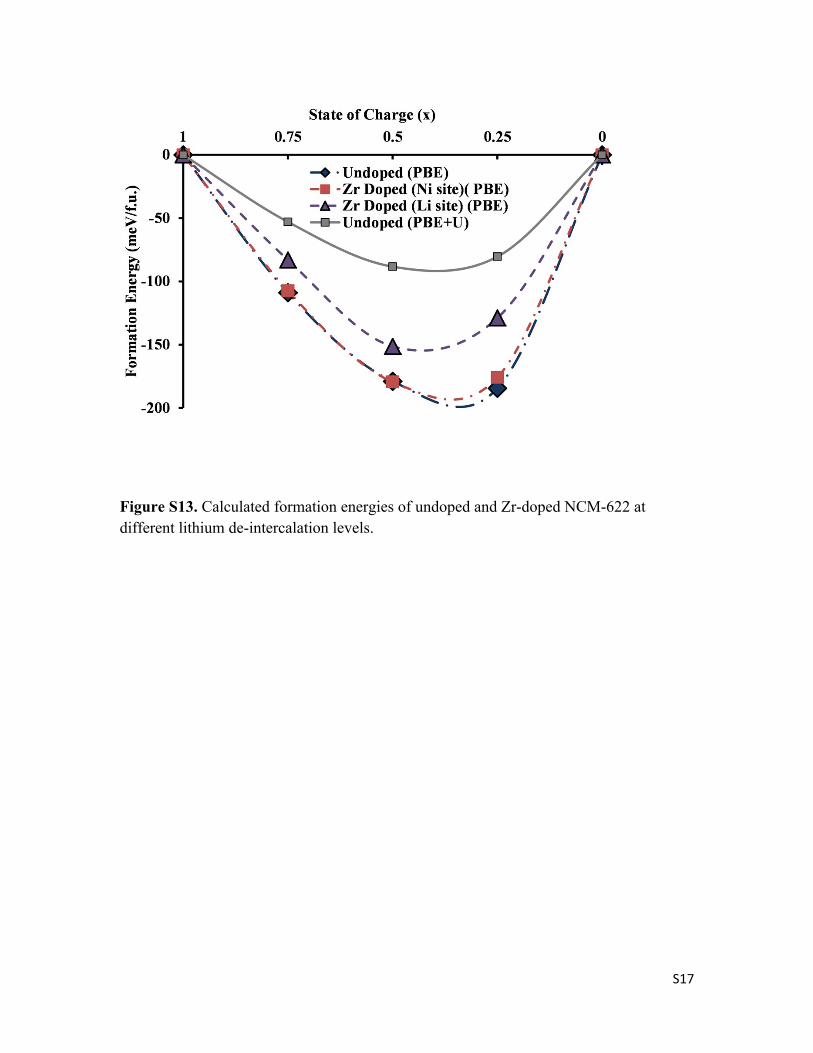
Figure S13. Calculated formation energies of undoped and Zr-doped NCM-622 at different lithium de-intercalation levels. ......................................................................................................17
1. Experimental Methods
1.1. Synthesis of LiNi0.6Co0.2Mn0.2O2 and LiNi0.56Zr0.04Co0.2Mn0.2O2 materials.
Cathode materials, undoped and Zr-doped NCM-622, were synthesized via the solution
combustion technique. Analytical grade LiOH.H2O, Ni(NO3)2.6H2O, Co(NO3)2
.6H2O,
Mn(NO3)2.4H2O, Zr(NO3)2
.nH2O (ZrO2=43.5%) were used as oxidizers and sucrose
(C12H22O11) was used as a fuel for this reaction. The molar ratio between the nitrates and
sucrose was calculated according to the principles of combustion reaction on the basis of
the total oxidizing and reducing power of the metal nitrates and the sucrose. A small
excess of lithium (2%) is added based on our previous experience.1 The metal nitrates
and sucrose were dissolved in an optimal amount of distilled water to obtain clear
S4
solutions and subsequently mixed in a single laboratory dish, which was then placed in a
heater to slow evaporation of the water. Upon heating the solution, the self-igniting and
exothermic reaction starts at around 400 °C. The combustion process produced a
voluminous amorphous mass, which was heat treated at 400 oC for 1 h to ensure the
burning of residual organic components. Contrary to the synthesis of spinel-type cathode
materials, the layered ones need higher synthesis temperature.2 XRD patterns in Figure
S2 show the effect of increasing the annealing temperature on the evolution of the layered
structure towards separation of TM ions and Li ions onto their respective planes. Rietveld
analysis revealed, however, that the materials obtained after heat treatment at 600, 700
and 800 oC showed a high level of cation mixing between the Li and 3d-metal layers. For
example the presence of 3d metal ions in the Li layer was found to be as high as 0.25 for
the NCM-622 material heated at 700 oC.
1.2. Electrochemical measurements. Electrochemical tests were carried out in
two- and three-electrode cells in a 2325 coin-type and pouch-type configuration with a
Celgard, Inc. polypropylene separator. The working electrodes were composites of a
mixture of LiNi0.6Co0.2Mn0.2O2 materials (undoped or Zr-doped), carbon black (CB) and
polyvinylidendifluoride (PVdF) binder (80:10:10 by weight) on aluminum foil (from
Strem). We prepared also thin-film working electrodes comprising only active
LiNi0.6Co0.2Mn0.2O2 materials embedded into Al-foil by wiping. These electrodes were
free from CB and PVdF, their thickness was 0.5, as measured by the focused ion-beam
technique. Lithium disks or plates and lithium chips served as counter and reference
electrodes. Electrochemical cells were assembled in glove boxes filled with highly pure
argon (VAC, Inc.). We used electrolyte solutions (high purity, Li battery grade)
S5
comprising ethyl-methyl carbonate (EMC) and ethylene carbonate (EC) (weight ratio of
7:3) and 1M LiPF6 from BASF. The content of hydrofluoric acid and water in the
solutions was not more than 30 ppm and 10 ppm, respectively. After assembling, the
electrochemical cells were stored at room temperature for 12 – 24 h to ensure a complete
impregnation of the electrodes and the separators with the electrolyte solution. The
electrochemical measurements were performed using standard equipment as described
previously8. All the potentials in this paper are given vs. Li/Li+. For statistical reasons,
the measurements were repeated and the accuracy of the calculations of the electrodes'
capacity was around 95%.
1.3. X-ray diffraction (XRD), transmission electron microscopy (TEM) and
electron diffraction (ED) analyses. X-ray powder diffraction (XRD) measurements
were performed using an AXS D8 Advance diffractometer from Bruker, Inc. (Germany)
in the 2 range from 10° to 110°, with a step size of 0.02°, at a 15 sec/step rate. The
analysis of the XRD patterns was carried out using the PowderCell program and the
FullProf program as described elsewhere.3, 4 HR-TEM examinations of the
LiNi0.6Co0.2Mn0.2O2 and Zr-doped materials was performed with a JEOL JEM-2100
(LaB6) high resolution electron microscope, and convergent beam electron diffraction
(CBED) technique (4 - 7 nm probe size) was employed for structural characterization of
the obtained nano-particles. Samples for the TEM studies were prepared by methodology
described in ref.5

S6
2. Phase behavior on Li de-intercalation
The formation energies of the partially delithiated phase (LixMO2) give direct
indication of the phase behavior of cathode materials upon Li de-intercalation. The
formation energies are calculated using the following equation:
(S1) 2 2 2( ) ( ) (1 ) ( )F xE E Li MO xE LiMO x E MO
where is the total energy (per formula unit) of partially de-intercalated 2( )xE Li MO
states, is the total energy of fully intercalated states and is the total 2( )E LiMO 2( )E MO
energy of fully deintercalated states.
The results clearly show that Zr doping at Ni sites does not reduce the absolute formation
energies (Figure S13). These results suggest that the phase stability of partially
delithiated states are maintained on Zr doping and a solid solution of partially delthiated
states is expected. Interestingly, the smooth experimental voltage profile confirms the
above-suggested solid-solution behavior. On the other hand, Zr doping in the Li layer
reduces the absolute formation energy, suggesting that significant amounts of Zr in the Li
layer can reduce the phase stability of partially delithiated states. We also note that the
magnitude of formation energies using the PBE+U method is lower than that obtained
using the PBE method for NCM-622.
S7
MnNi
CoZr
500 nm
300 nm
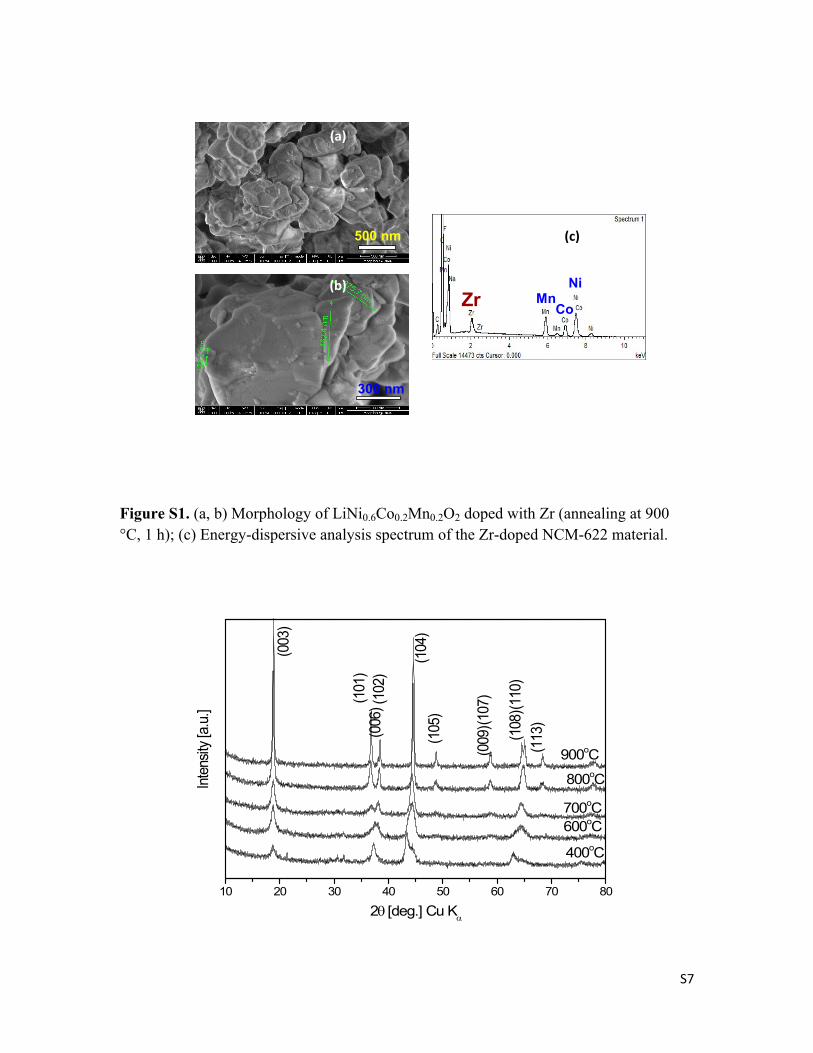
Figure S1. (a, b) Morphology of LiNi0.6Co0.2Mn0.2O2 doped with Zr (annealing at 900 °C, 1 h); (c) Energy-dispersive analysis spectrum of the Zr-doped NCM-622 material.
10 20 30 40 50 60 70 80
(113
)(1
10)
(108
)
(009
)(107
)
(105
)(1
04)
(102
)(0
06)(1
01)
900oC
800oC
700oC600oC
Inte
nsity
[a.u
.]
2[deg.] Cu K
400oC
(003
)
(a)
(b)
(c)
S8
Figure S2. XRD patterns for LiNi0.6Co0.2Mn0.2O2 synthesized by the self-combustion reaction and subsequently thermally treated for 1 h at different temperatures (as indicated).
Figure S3. Variation of the RBragg factor with atomic fraction of Ni ions in the Li layer of LiNi0.56Zr0.04Co0.2Mn0.2O2.
S9
Figure S4. Most preferred substitution sites of Zr in LiNi0.6Co0.2Mn0.2O2: (a) Zr doping at Ni sites, (b) Zr doping at Co sites, (c) Zr doping at Mn sites. Only single metal layers are shown for the sake of simplicity, although the calculations were performed using large supercells (240 atoms, 60 formula units).
Figure S5. The change in c lattice parameter for pristine and Zr-doped NCM-622 with Li concentration using PBE and dispersion-corrected PBE. y=0.05 for Zr doped (at Ni-sites in both TM and Li layers) and y=0.00 for pristine NCM-622.
S10
Figure S6. The relaxed structure of fully delithiated supercells (a) Ni0.6Co0.2Mn0.2O2 and (b) Ni0.55Co0.2Mn0.2Zr0.05O2 using the PBE method. Color codes for spheres: red-oxygen atoms and grey-Ni atoms, violet-Mn atoms, blue-Co atoms.
S11
Figure S7. (a) Total DOS for LiNi0.6Co0.2Mn0.2O2 (b) Total DOS for LiNi0.55Co0.2Mn0.2Zr0.05O2 (c) PDOS for LiNi0.6Co0.2Mn0.2O2 (d) PDOS for LiNi0.55Co0.2Mn0.2Zr0.05O2 using the PBE method.
S12
Figure S8. Radial pair distribution function (TM-O) of the relaxed structure of pristine and Zr-doped NCM-622 using the PBE method.
S13
Figure S9. Surface film resistance measured from impedance spectra of electrodes comprising undoped NCM-622 and Zr doped NCM-622 (black and red curves, respectively) after 5 CVs and after 50 consecutive galvanostatic cycles at a C/5 rate, 450C (filled and empty symbols, respectively).
3.7 3.8 3.9 4.0 4.1 4.2 4.3
1
2
3
4
5
6
7
8
9
10
11
12
Sur
face
film
resi
stan
ce (O
hm)
Voltage (V)
S14
Figure S10. Charge transfer resistance measured from impedance spectra of electrodes comprising undoped NCM-622 and Zr doped NCM-622 (black and red curves, respectively) after 5 CVs and after 50 consecutive galvanostatic cycles at a C/5 rate, 450C (filled and empty symbols, respectively).
3.6 3.8 4.0 4.2 4.40
40
80
120
160
200
240
280
Cha
rge
trans
fer r
esis
tanc
e (O
hm)
Voltage (V)
S15
Figure S11. Structure of NiO6 octahedra of migrating Ni2+ in (a) fully lithiated NCM-622 (b) NCM-622 with 4 Li vacancies (3 vacancies near migrating Ni and one vacancy at final migrating site). Color codes for spheres: red-O atoms and grey-Ni atoms.
S16
Figure S12. Schematic Ni2+ migration path in undoped NCM-622. Color codes for spheres: red-oxygen atoms, grey-Ni atoms, violet-Mn atoms, blue-Co atoms and green-Li atoms.
S17
Figure S13. Calculated formation energies of undoped and Zr-doped NCM-622 at different lithium de-intercalation levels.
S18
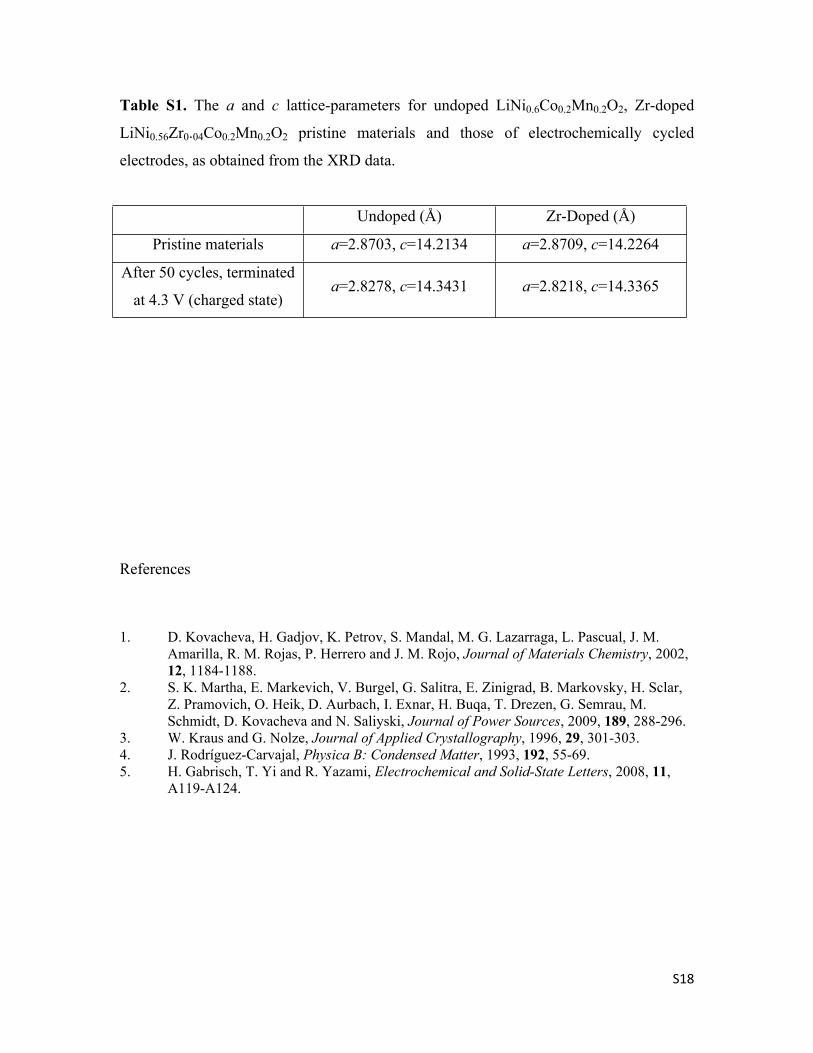
Table S1. The a and c lattice-parameters for undoped LiNi0.6Co0.2Mn0.2O2, Zr-doped
LiNi0.56Zr0.04Co0.2Mn0.2O2 pristine materials and those of electrochemically cycled
electrodes, as obtained from the XRD data.
Undoped (Å) Zr-Doped (Å)
Pristine materials a=2.8703, c=14.2134 a=2.8709, c=14.2264
After 50 cycles, terminated
at 4.3 V (charged state)a=2.8278, c=14.3431 a=2.8218, c=14.3365
References
1. D. Kovacheva, H. Gadjov, K. Petrov, S. Mandal, M. G. Lazarraga, L. Pascual, J. M. Amarilla, R. M. Rojas, P. Herrero and J. M. Rojo, Journal of Materials Chemistry, 2002, 12, 1184-1188.
2. S. K. Martha, E. Markevich, V. Burgel, G. Salitra, E. Zinigrad, B. Markovsky, H. Sclar, Z. Pramovich, O. Heik, D. Aurbach, I. Exnar, H. Buqa, T. Drezen, G. Semrau, M. Schmidt, D. Kovacheva and N. Saliyski, Journal of Power Sources, 2009, 189, 288-296.
3. W. Kraus and G. Nolze, Journal of Applied Crystallography, 1996, 29, 301-303.4. J. Rodríguez-Carvajal, Physica B: Condensed Matter, 1993, 192, 55-69.5. H. Gabrisch, T. Yi and R. Yazami, Electrochemical and Solid-State Letters, 2008, 11,
A119-A124.