Embed Size (px)
Citation preview

Supporting informationWagner et al. 10.1073/pnas.0804090105SI Materials and MethodsStrains, Plasmids, and Culture Conditions. Escherichia coli strainsBL21(DE3), BL21(DE3)pLysS, BL21(DE3)pLysE,Lemo21(DE3), Lemo41(DE3), Lemo43(DE3), C41(DE3), andC43(DE3) were used in this study (1, 2). Lemo indicates that cellsharbor a pACYC-derived plasmid with the gene encoding T7lysozyme under control of an L-rhamnose inducible promoter (Fig.S5). Proteins [E. coli EnvZ, GltP, PheP, PstA, RarD, UhpT, YfbF,YiaM, YidC, YijD, YqcE, Shewanella oneidensis transporter A(SOTA), and the rat neurotensin receptor (NTR) N-terminallyfused to the maltose binding protein, and the human tetraspannins(Tsp) A and B)] were overexpressed as GFP fusions from apET28a� derived vector as described (3–5). The gene encoding theMBP-NTR fusion protein was amplified from vector pMalp-2-NTR-HMTX (6) by using the primers ‘‘pMBP�XhoI�f’’ and‘‘NTR�KpnI�r’ and was subsequently cloned into pGFPe digestedwith XhoI and KpnI. Primer sequences are listed in Table S4.eGFP-His was expressed from a pET20b vector (7). Cells weregrown aerobically in standard Luria-Bertani broth supplementedwith kanamycin (50 �g/ml) and if cells harbored pLemo or pLysS/Ealso chloramphenicol (30 �g/ml). Over night cultures were diluted1:50. Cultures were grown in shaker flasks at 30°C in an Innova 4330(New Brunswick Scientific) shaker at 180 rpm. Growth was mon-itored by measuring the OD600 with a Shimadzu UV-1601 spec-trophotometer. T7 lysozyme expression was induced by addition of10–2000 �M L-rhamnose to the culture medium. For all experi-ments, protein expression was induced by the addition of 0.4 mMisopropyl-�-D-thiogalactopyranoside (IPTG) (final concentration)at an OD600 of 0.4–0.5. Cells were harvested at the indicated timepoints after induction.
GFP Fluorescence Measurements and Flow Cytometry. Expression ofrecombinant protein-GFP fusions and GFP was monitored bymeasuring whole cell GFP fluorescence in a spectrofluorometerand in-gel as described before (3, 7). In-gel f luorescence showedthat in all experiments �95% of the overexpressed material wasfull-length fusion. For on-line fluorescence measurements cellswere cultured in a 96-well plate in a spectrofluorometer. Anal-ysis of cells overexpressing GFP-fusion proteins and control cellsby means of flow cytometry was done as described before byusing a FACSCalibur (BD Biosciences) instrument (8).
Purification of mRNA, Reverse Transcription, and Quantitative PCR.For the purification of total RNA, �0.5 A600 unit of bacterialculture was added to two times the volume of RNAprotect BacteriaReagent (Qiagen). After mixing and 5-min incubation at roomtemperature, bacteria were collected by centrifugation. Cells werelysed and RNA extracted with the RNeasy kit (Qiagen). Afterelution, nucleic acid concentrations were determined by spectro-photometry (NanoVue, GE Healthcare) and residual DNA wasremoved by incubating the samples with 2 U of TURBO DNase(Ambion). After DNase inactivation, RNA was recovered, quan-tified, and used for first-strand cDNA synthesis by using OmniscriptReverse Transcriptase (Qiagen). For cDNA synthesis, 1 �g of totalRNA and 1 �M of random nonamers (Gene Link) were used. Thereverse transcription product was 10 times diluted and 10 ng ofcDNA was used for real-time PCR. RNA transcripts were quanti-fied by using an ABI Prism 7000 sequence detection system(Applied Biosystems) by using Universal ProbeLibrary Probes(Roche). Primer and probe sequences are listed in Table S4. Forcomparative quantitative analysis, transcript levels were normalizedby using transcript levels of ihf as a standard (9). Data were
processed by using 7000 system SDS software (Applied Biosys-tems).
Sequencing of lacUV5 Promoters and Genes Encoding T7RNAP. Astretch of the chromosomal region covering the promoter govern-ing expression of T7RNAP and the gene encoding T7RNAP wasamplified from BL21(DE3), C41(DE3), and C43(DE3) by using theRoche Expand Long Template PCR System and the followingprimers: ‘‘T7�f’’ and ‘‘T7�r.’’ The PCR product was purified on anagarose gel and extracted by using the QiaexII gel extraction kit(Qiagen). The PCR product was sequenced by using the BigDyeTerminator v1.1 cycle sequencing kit from Applied biosystems andthe following primers: ‘‘T7�seq�f,’’ ‘‘T7�seq�r,’’ ‘‘T7�seq243r,’’‘‘T7�seq745�r,’’ ‘‘T7�seq1180�f,’’ ‘‘T7�seq1672�f,’’ ‘‘T7�seq2521�f,’’‘‘T7p�seq529�r,’’ and ‘‘T7p�seq271�r’’. For sequence analysis andalignments Vector NTI software (Invitrogen) was used. Primersequences are listed in Table S4.
Construction of pLemo. A portion of pRha109 (10) containing thegenes rhaS, rhaR, the promoter rhaBAD and the multiple cloningsite was PCR amplified by using primers ‘‘pRha�EheI�f’’ and‘‘pRha�XmaJI�r’’ (Table S4). The purified PCR product was di-gested and cloned into the backbone of pACYC-DUET-1 (Nova-gen) (11) digested with EheI and XmaJI. The XbaI restriction sitewithin the p15A origin was eliminated by Quikchange site directedmutagenesis (TCTAGA to TCTAGG) following the instructions ofthe manufacturer (Stratagene). The resulting plasmid was namedpTACO2. pLemo was constructed by ligating the PCR-amplifiedproduct of the T7 Lysozyme mutant K128Y (12) into pTACO2digested with SalI and BamHI. PCR primers used were‘‘T7LysY�SalI�f’’ and ‘‘T7LysY�BamHI�r’’ (Table S4). We used avariant of T7 lysozyme (K128Y) (LysY) that has no amidase activitybut retains full inhibition of T7 RNA polymerase (12). It should benoted that there are no differences between the different forms ofT7 lysozyme on overexpression yields (data not shown).
Promoter Swaps. Swaps of the promoters controlling expression ofT7RNAP in BL21(DE3) and C43(DE3) were performed by usingan approach based on the Red Swap method (13). First, a multiplecloning site was introduced between the FRT site and priming siteP2 of pKD13 by QuikChange site directed mutagenesis (Strat-agene) by using the following primers: ‘‘pKD13i�QC�f’’ and‘‘pKD13i�QC�r.’’ The resulting plasmid was designated pKD13i.The promoters controlling expression of T7RNAP in BL21(DE3)and C43(DE3) were amplified from the PCR products used for thesequencing by using the primers ‘‘lacUV5�NdeI�f’’ and‘‘lacUV5�KpnI�r.’’ The purified PCR products were digested andcloned into pKD13i digested with NdeI and KpnI. Primers‘‘lacUV5�ECOLI�swap�HP1� and ’’lacUV5�ECOLI�swap�HP2i‘‘were used to amplify the kanamycin resistance cassette frompKD13i-lacUV5(BL21) and pKD13i-lacUV5mutated(C43), re-spectively. BL21(DE3) and C43(DE3) harboring plasmid pKD46(13) were grown in SOB medium supplemented with 100 �g/mlampicillin and 0.2% L-arabinose and used to make competent cells.After electroporation with the PCR product, kanamycin resistantcolonies were isolated on agar plates, which were supplementedwith 30 �g/ml kanamycin. A swap of the promoters and insertionof the kanamycin resistance cassette was verified by PCR with thefollowing primers: k1, k2 (13), ’’lacUV5�U,‘‘ and ’’T7�seq243r.‘‘Each of the two resulting promoter swaps was transduced intoBL21(DE3) and C43(DE3), respectively, by P1 transduction (14).The resulting strains were designated ’’SW1323� [BL21(DE3) with
Wagner et al. www.pnas.org/cgi/content/short/0804090105 1 of 11

the mutated lacUV5 promoter from C43(DE3)], ‘‘SW1333�[BL21(DE3) with lacUV5 from BL21(DE3)], ’’SW1325�[C43(DE3) with the mutated lacUV5 promoter from C43(DE3)]and ‘‘SW1335� [C43(DE3) with lacUV5 from BL21(DE3)]. Sub-sequently, the kanamycin resistance cassette was removed by usingthe Flp recombinase (13, 15). To confirm the swaps, promoterswere sequenced as described above by using the primer’’T7p�seq271�r.‘‘ For sequence analysis and alignments Vector NTIsoftware (Invitrogen) was used. Primer sequences are listed inTable S4.
Analysis of Whole Cell Lysates by 2D-Gel Electrophoresis, ImageAnalysis and Statistics. Two-dimensional-gel electrophoresis ofwhole cell lysates was performed as described before (16). Forcomparative analysis spot intensities were quantified by thePDQuest v.8.0 software (Bio-Rad). The quantification of saturatedspots and ‘‘trains’’ of spots was approximated by using the ‘‘contourtool’’ of the program. Spot volumes were normalized by using ‘‘allvalid spots.’’ In total, 483 spots were identified consistently. Foreach spot a two-way ANOVA was performed on log transformeddata, with treatment (� protein overexpression) and strain asfactors, resulting in a P value for each spot; 49 spots with missingdata in at least one complete replicate group were excluded fromthe ANOVA-analysis, but information about these spots is pro-vided in Table S2, and marked as ‘‘qualitative’’ information. The Pvalues were ordered and the calculated false discovery rate(FDR)0.05-level was 0.014, with FDR �0.05 considered significant.Significant effects [‘‘treatment,’’ ‘‘strain,’’ ‘‘treatment and strain’’(no interaction), and ‘‘interaction’’] were found for 122 spots (TableS2 and Table S3).
Analysis of Cytoplasmic Membranes by 2-D Blue Native Electrophore-sis, Image Analysis and Statistic. Isolation of cytoplasmic membraneswas carried out as described before by using two subsequent sets ofsucrose density gradients (8). Two-dimensional blue native elec-trophoresis (2D BN/SDS/PAGE) was performed as describedpreviously (8, 17). Gels were run with independent triplicatesamples; i.e., each gel contained sample from different bacterialcolonies and cultures. The gels were stained with colloidal Coo-massie (18) and scanned by using a GS-800 densitometer fromBio-Rad. For comparative analysis spot intensities were quantifiedby the PDQuest v.8.0 software (Bio-Rad). The quantification ofsaturated spots was approximated by using the contour tool of theprogram. Spot quantities were normalized by using all valid spots.Output was a list of spots and their intensities in each of the gels(Table S1). In total, 183 trustworthy spots were identified. For eachspot a two-way ANOVA was performed on log transformed data,
with treatment (� protein overexpression) and strain as factors; 36spots with missing data in all replicates, for some combination oftreatment and strain, were excluded from the ANOVA-analysis.The effect of those spots is termed qualitative in Table S1. Theinteraction term between treatment and strain was also included inthe model. A test was done of the whole model (H0: intercept only)resulting in a P value for each spot. The P values were ordered andthe calculated false discovery rate (FDR)0.05-level was 0.0375. A testwith a P value below the FDR0.05-level was considered as signifi-cant. This approach resulted in 123 spots with some kind ofsignificant effects in the ANOVA-analysis. A grouping of the spotson the kind of effect was done. The effects were treatment, strain,treatment and strain (no interaction) and interaction. The effectsare shown in Table S1. The grouping criteria are shown in Table S3.
Protein Identification by Mass Spectrometry and Bioinformatics. Pro-teins were identified by peptide mass finger printing by usingMALDI-TOF MS essentially as described in (8) with only a fewmodifications. Spectral annotations (in particular assignments ofmono-isotopic masses) were verified by manual inspection for alarge number of measurements. Matrix, autoproteolytic trypsinfragments, and/or contaminant peaks (e.g., keratin) in MALDI-TOF spectra were removed by the software Peak Eraser v2.01(Lighthouse data). A list with removed peaks (assigned masses) isprovided in Table S5. The resulting peptide mass (peak) lists wereused to search the SwissProt 54.6 database (release 12/04/07) for E.coli (9304 sequences) with Mascot (v2.0; Matrix Science), by usingthe following search parameters: significant protein MOWSE scoreat P � 0.05, no missed cleavages allowed, variable methionineoxidation, fixed carbamidomethylation of cysteines, and minimummass accuracy 50 ppm. These search results were filtered applyingthe following three criteria for positive identification: (i) MinimumMOWSE score �50, (ii) �four matching peptides with an errordistribution within � 25 ppm, and (iii) �15% sequence coverage.The minimum ratio of matched to unmatched peaks accepted was0.25. Applying these criteria, false positive rates were �1%, asdetermined earlier (8). For several critical samples, the peptideswere also analyzed by nano-LC-ESI-MS/MS as described before(8). Synonymous gene names are given in the tables in supportinginformation. Ambiguous protein assignments (resulting from mul-tiple peptides matching to several proteins) were not occurring.
Activity Measurements of Respiratory Chain Complexes. Succinatedehydrogenase, FoF1-ATP synthase activities, and NADH con-sumption of inverted membrane vesicles isolated from cellsoverexpressing YidC-GFP and control cells harvested 4 h afterinduction were determined as described previously (19, 20).
1. Studier FW (1991) Use of bacteriophage T7 lysozyme to improve an inducible T7expression system. J Mol Biol 219:37–44.
2. Miroux B, Walker JE (1996) Over-production of proteins in Escherichia coli: Mutanthosts that allow synthesis of some membrane proteins and globular proteins at highlevels. J Mol Biol 260:289–298.
3. Drew D, et al. (2005) A scalable, GFP-based pipeline for membrane protein overex-pression screening and purification. Protein Sci 14:2011–2017.
4. Waldo GS, Standish BM, Berendzen J, Terwilliger TC (1999) Rapid protein-folding assayusing green fluorescent protein. Nat Biotechnol 17:691–695.
5. Daley DO, et al. (2005) Global topology analysis of the Escherichia coli inner membraneproteome. Science 308:1321–1323.
6. Grisshammer R, Duckworth R, Henderson R (1993) Expression of a rat neurotensinreceptor in Escherichia coli. Biochem J 295 (Pt 2):571–576.
7. Drew D, Lerch M, Kunji E, Slotboom DJ, de Gier JW (2006) Optimization of membraneprotein overexpression and purification using GFP fusions. Nat Methods 3:303–313.
8. Wagner S, et al. (2007) Consequences of membrane protein overexpression in Esche-richia coli. Mol Cell Proteomics 6:1527–1550.
9. Baez-Viveros JL, et al. (2007) Metabolic transcription analysis of engineered Escherichiacoli strains that overproduce L-phenylalanine. Microb Cell Fact 6:30.
10. Giacalone MJ, et al. (2006) Toxic protein expression in Escherichia coli using a rhamnose-based tightly regulated and tunable promoter system. Biotechniques 40:355–364.
11. Tolia NH, Joshua-Tor L (2006) Strategies for protein coexpression in Escherichia coli. NatMethods 3:55–64.
12. Cheng X, Zhang X, Pflugrath JW, Studier FW (1994) The structure of bacteriophage T7lysozyme, a zinc amidase and an inhibitor of T7 RNA polymerase. Proc Natl Acad SciUSA 91:4034–4038.
13. Datsenko KA, Wanner BL (2000) One-step inactivation of chromosomal genes inEscherichia coli K-12 using PCR products. Proc Natl Acad Sci USA 97:6640–6645.
14. Miller JH (1992) A short course in bacterial genetics (Cold Spring Harbor LaboratoryPress, Cold Spring Harbor, NY).
15. Cherepanov PP, Wackernagel W (1995) Gene disruption in Escherichia coli: TcR andKmR cassettes with the option of Flp-catalyzed excision of the antibiotic-resistancedeterminant. Gene 158:9–14.
16. Baars L, et al. (2006) Defining the role of the Escherichia coli chaperone SecB usingcomparative proteomics. J Biol Chem 281:10024–10034.
17. Schagger H, von Jagow G (1991) Blue native electrophoresis for isolation ofmembrane protein complexes in enzymatically active form. Anal Biochem 199:223–231.
18. Neuhoff V, Arold N, Taube D, Ehrhardt W (1988) Improved staining of proteins inpolyacrylamide gels including isoelectric focusing gels with clear background at nano-gram sensitivity using Coomassie Brilliant Blue G-250 and R-250. Electrophoresis 9:255–262.
19. Nouwen N, van der Laan M, Driessen AJ (2001) SecDFyajC is not required for themaintenance of the proton motive force. FEBS Lett 508:103–106.
20. van der Laan M, et al. (2003) A conserved function of YidC in the biogenesis ofrespiratory chain complexes. Proc Natl Acad Sci USA 100:5801–5806.
21. Green J, Paget MS (2004) Bacterial redox sensors. Nat Rev Microbiol 2:954–966.
Wagner et al. www.pnas.org/cgi/content/short/0804090105 2 of 11

13
15
26
31
34
3536
49
52
75
79
85
86
88
90
9399
100
107
108
110
114
119
122
133
4
5
7
1718
24
29
30
41
44
50
61
6364
66
67
68
72
73
77
78
87
94
106
136
53
59
60
70
113
117
120
130
135
23
32
33
37
39
71
83
84
91 98
116
121
126
128
129
132
138
1
6
8
9
10
1112
1416
19
20
2122
23
25
27
28
38
4042
45
4647
48
51
5455
56
57
58
6265
69
74
76
80
81
82
89
92
95 96
97
101102103
104
105
109
111112 115
118
124
125
127
131
134
137 75 -
50 -
37 -
25 -
20 -
15 -
10 -MM/kDa
BL21pLysS YidC-GFPBL21pLysS control
75 -
50 -
37 -
25 -
20 -
15 -
10 -MM/kDa
SD
S -
pol
yacr
ylam
ide
gel e
lect
roph
ores
is
75 -
50 -
37 -
25 -
20 -
15 -
10 -
MM/kDa
C41 YidC-GFPC41 control
75 -
50 -
37 -
25 -
20 -
15 -
10 -
MM/kDa
75 -
50 -
37 -
25 -
20 -
15 -
10 -
MM/kDa
C43 YidC-GFPC43 control
75 -
100 -100 -
100 -100 -
100 -100 -
50 -
37 -
25 -
20 -
15 -
10 -
MM/kDa
440
kDa
-
160
kDa
-
66 k
Da
-
880
kDa
-
nativemass
Blue Native - PAGE
Fig. S1. Analysis of cytoplasmic membrane fractions by 2D BN/SDS/PAGE. Cells expressing YidC-GFP and control cells were cultured as described in the SIMaterials and Methods and harvested four hrs after addition of IPTG. Isolated cytoplasmic membranes were analyzed by 2D blue native electrophoresis (2DBN/SDS/PAGE) as described in the SI Materials and Methods. One representative gel of each group is shown. The indicated proteins were identified by MALDI-TOFMS and PMF, and nano-LC-ESI-MS/MS as described in SI Materials and Methods. Spot numbers are shown on the gel of the replicate group were they had thehighest accumulation levels. The spot numbers refer to Table S1.
Wagner et al. www.pnas.org/cgi/content/short/0804090105 3 of 11

BL21pLysScontrol
C41control
C43control
BL21pLysSYidC-GFP
C41YidC-GFP
C43YidC-GFP
BL21pLysScontrol
0.984 0.938 0.918 0.738 N.A. N.A.
C41control
0.983 0.954 N.A. 0.825 N.A.
C43control
0.981 N.A. N.A. 0.854
BL21pLysSYidC-GFP
0.959 0.896 0.875
C41YidC-GFP
0.984 0.978
C43YidC-GFP
0.956
0
25
50
75
100
125
BL21p
LysS
cont
rol
BL21p
LysS
YidC-G
FP
C41co
ntro
l
C41YidC
-GFP
C43co
ntro
l
C43YidC
-GFP
relativeactivity
Succinate DH activityNADH consumptionATP synthase activity
A.
B.
Fig. S2. Effect of YidC-GFP overexpression on the inner membrane proteome and on the performance of respiratory chain complexes of BL21(DE3)pLysS,C41(DE3), and C43(DE3). Cytoplasmic membranes of cells overexpressing GFP-fusion proteins and of control cells were isolated as described in SI Materials andMethods. Cytoplasmic membrane isolates were analyzed by 2D BN/SDS/PAGE as described in SI Materials and Methods. Correlation coefficients of proteinaccumulation levels were calculated by PDQuest v.8.0. Correlation coefficients within a replicate group (gray fill) are calculated from the spot intensities of thereplicate gels of a certain group. Correlation coefficients between replicate groups (no fill) are based on the mean values of each replicate group (A). Cellsexpressing YidC-GFP and control cells were cultured as described in SI Materials and Methods and harvested 4 h after addition of IPTG. Isolation of cytoplasmicmembranes was carried out as described in SI Materials and Methods. Succinate dehydrogenase, FoF1-ATP synthase activities, and NADH consumption of invertedmembrane vesicles isolated from cells overexpressing YidC-GFP and control cells harvested 4 h after induction were determined as described in SI Materials andMethods. Activities of BL21(DE3)pLysS control cells were set to 100 (B).
Wagner et al. www.pnas.org/cgi/content/short/0804090105 4 of 11

1213
17
28
33
35
38
4265
6667
7074 77
83
102 107
108
117
118120
130
132
8
242550
110
131
7 22
27
29
45
59
64
79
88
9495
100
106124
5
1568
72
8489
101103 105
111
113
125
127 128
3
6
9
10
14
181920
23
31
32
3637
5152
6061
63
6971 73
76
9091
9697
98
104
109
116
119
121
129
70 -
60 -
50 -
40 -
30 -
20 -
15 -
10 -
MM/kDa
BL21pLysS YidC-GFPBL21pLysS control
1
2
4 11
16
21
26
30
34
3940
41
43
44
4647
4849
53
54
55
565758
62
75
78 8081
82
8586
87
9293
99
112
114115
122123
126
133
70 -
60 -
50 -
40 -
30 -
20 -
15 -
10 -
MM/kDa
SD
S -
pol
yacr
ylam
ide
gel e
lect
roph
ores
is
isoelectric focusing
pH 6.04.0 5.0
70 -
60 -
50 -
40 -
30 -
20 -
15 -
10 -
MM/kDa
C41 YidC-GFPC41 control
70 -
60 -
50 -
40 -
30 -
20 -
15 -
10 -
MM/kDa
70 -
60 -
50 -
40 -
30 -
20 -
15 -
10 -
MM/kDa
C43 YidC-GFPC43 control
70 -
100 -100 -
100 -100 -
100 -100 -
60 -
50 -
40 -
30 -
20 -
15 -
10 -
MM/kDa
Fig. S3. Analysis of whole cell lysates by 2D-gel electrophoresis. Cells expressing YidC-GFP and control cells were cultured as described in SI Materials andMethods section and harvested 4 h after addition of IPTG. Two-dimensional-gel electrophoresis of whole cell lysates was performed as described in SI Materialsand Methods. Quantification data and results of the ANOVA analysis are shown in Table S2. One representative gel of each group is shown. The indicated proteinswere identified by MALDI-TOF MS and PMF as described in SI Materials and Methods. Spot numbers are shown on the gel of the replicate group where theyhad the highest accumulation level. The spot numbers refer to Table S2.
Wagner et al. www.pnas.org/cgi/content/short/0804090105 5 of 11

BL21pLysS control
C41 control
C43 control
BL21pLysS YidC-GFP
C41 YidC-GFP
C43 YidC-GFP
0 20 40 60 80 100
rbsB, 88
proX*, 97
oppA, 129
ompF, 6
ompA, 119
hisJ, 14
ytfQ, 85
ydgA, 21
yddS, 74
ydcS, 133
ugpB, 122
treA, 46
rbsB, 89
proX, 87
oppA, 107
malS, 48
hisJ, 12
glpQ, 33
dppA, 102
cpdB, 47
chiA, 78
artI, 30
argT, 13
araF*, 42
agp, 58
genenames
index
B.
A.
0 20 40 60 80 100
glcB, 130
lpdA, 73
ackA, 98
sucD, 111
mdh, 66
pgk, 17
gapA*, 116
genenames
index
glycolysiscitrate cyc.
acetate-ptaglyox.
Fig. S4. Relative quantification of spots representing cytoplasmic proteins analyzed by 2D-gel electrophoresis. (A) proteins that are part of energy generatingsystems that showed significantly changed accumulation levels (P value below false discovery rate (FDR) 0.05-level in two-way ANOVA) in Coomassie stained2D-gels of whole cell lysates of cells overexpressing YidC-GFP for 4 h and the control. For each protein, the value of the strain showing the highest accumulationlevels was set to 100. Primary gene names were taken from Swiss-Prot (www.expasy.org). Numbers behind gene names refer to spots in Table S2 and Fig. S3. Anasterisk behind the gene name indicates that two proteins were identified in a particular spot, the annotation is therefore tentative. In the Walker strains theaccumulation levels of components involved in the TCA cycle and glyoxylate-bypass were less decreased, and components involved in glycolysis and theacetate-pta pathway less increased, than in BL21(DE3)pLysS. This points to less activation of the Arc two-component system, which mediates adaptive responsesto changing respiratory conditions by monitoring the redox state of the Q pool, in the Walker strains (21). This is in keeping with the oxygen consumptionmeasurements over time (Fig. 1G). (B) secretory proteins that showed significantly changed accumulation levels (see A for details). Gene names in italics indicateprecursor forms of secretory proteins.
Wagner et al. www.pnas.org/cgi/content/short/0804090105 6 of 11

Fig. S5. Map of pLemo.
Wagner et al. www.pnas.org/cgi/content/short/0804090105 7 of 11
contro
l
0 10 100250
500500
7501000
15002000
µM rha
YidC-GFP
250 -
75 -
50 -
37 -
25 -
20 -
15 -MM/kDa
A.
B
0
1
2
3
4
5
6
7
8
0 500 1000 1500 2000
rhamnose concentration / µM
Aggregation/%
oftotal
cellularprotein
YidC-GFPcontrol
Lemo 0 µM rha Lemo 1000 µM rha
0 30 60 90 120 0 30 60 90 120min
ClpB
IbpA/B
C. D.
IbpA/B
contro
l
YidC-GFP
µM rha 500 0 250 1000
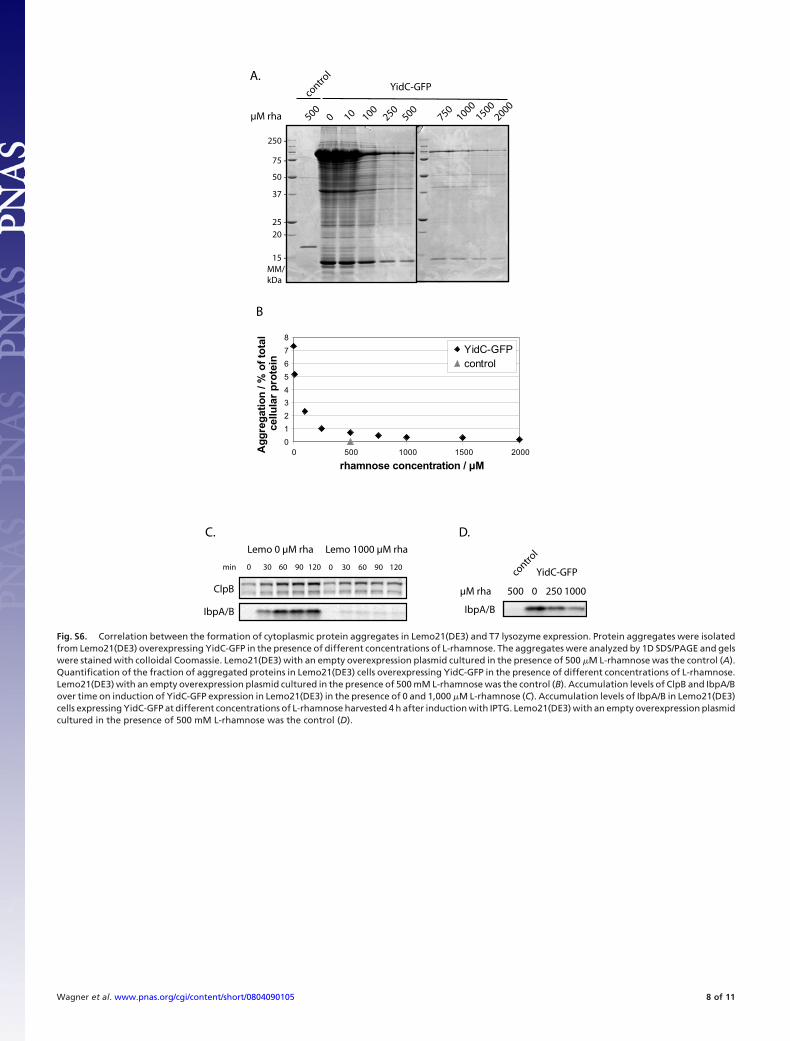
Fig. S6. Correlation between the formation of cytoplasmic protein aggregates in Lemo21(DE3) and T7 lysozyme expression. Protein aggregates were isolatedfrom Lemo21(DE3) overexpressing YidC-GFP in the presence of different concentrations of L-rhamnose. The aggregates were analyzed by 1D SDS/PAGE and gelswere stained with colloidal Coomassie. Lemo21(DE3) with an empty overexpression plasmid cultured in the presence of 500 �M L-rhamnose was the control (A).Quantification of the fraction of aggregated proteins in Lemo21(DE3) cells overexpressing YidC-GFP in the presence of different concentrations of L-rhamnose.Lemo21(DE3) with an empty overexpression plasmid cultured in the presence of 500 mM L-rhamnose was the control (B). Accumulation levels of ClpB and IbpA/Bover time on induction of YidC-GFP expression in Lemo21(DE3) in the presence of 0 and 1,000 �M L-rhamnose (C). Accumulation levels of IbpA/B in Lemo21(DE3)cells expressing YidC-GFP at different concentrations of L-rhamnose harvested 4 h after induction with IPTG. Lemo21(DE3) with an empty overexpression plasmidcultured in the presence of 500 mM L-rhamnose was the control (D).
Wagner et al. www.pnas.org/cgi/content/short/0804090105 8 of 11

Table S3. Grouping criteria ANOVA analysis
Treatment Strain Treatment and strain (no interaction) Interaction
P value treatment �0.05 �0.05 �0.05 0–1P value strain �0.05 �0.05 �0.05 0–1P value interaction �0.05 �0.05 �0.05 �0.05
Wagner et al. www.pnas.org/cgi/content/short/0804090105 9 of 11
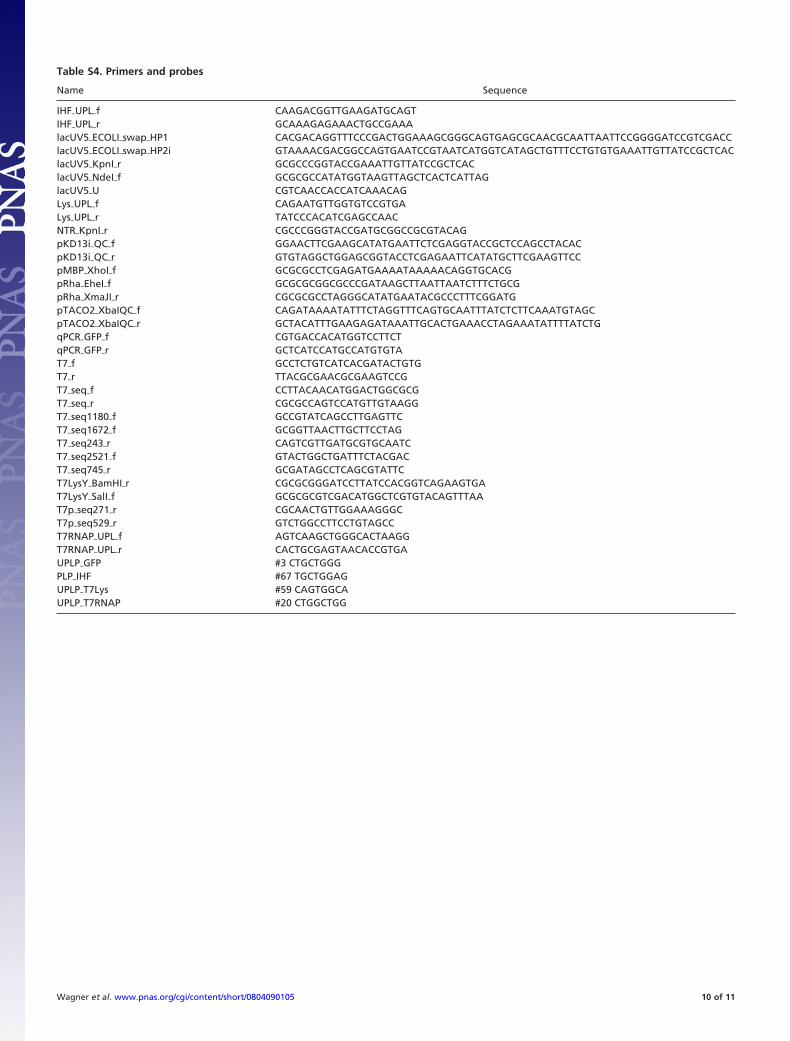
Table S4. Primers and probes
Name Sequence
IHF�UPL�f CAAGACGGTTGAAGATGCAGTIHF�UPL�r GCAAAGAGAAACTGCCGAAAlacUV5�ECOLI�swap�HP1 CACGACAGGTTTCCCGACTGGAAAGCGGGCAGTGAGCGCAACGCAATTAATTCCGGGGATCCGTCGACClacUV5�ECOLI�swap�HP2i GTAAAACGACGGCCAGTGAATCCGTAATCATGGTCATAGCTGTTTCCTGTGTGAAATTGTTATCCGCTCAClacUV5�KpnI�r GCGCCCGGTACCGAAATTGTTATCCGCTCAClacUV5�NdeI�f GCGCGCCATATGGTAAGTTAGCTCACTCATTAGlacUV5�U CGTCAACCACCATCAAACAGLys�UPL�f CAGAATGTTGGTGTCCGTGALys�UPL�r TATCCCACATCGAGCCAACNTR�KpnI�r CGCCCGGGTACCGATGCGGCCGCGTACAGpKD13i�QC�f GGAACTTCGAAGCATATGAATTCTCGAGGTACCGCTCCAGCCTACACpKD13i�QC�r GTGTAGGCTGGAGCGGTACCTCGAGAATTCATATGCTTCGAAGTTCCpMBP�XhoI�f GCGCGCCTCGAGATGAAAATAAAAACAGGTGCACGpRha�EheI�f GCGCGCGGCGCCCGATAAGCTTAATTAATCTTTCTGCGpRha�XmaJI�r CGCGCGCCTAGGGCATATGAATACGCCCTTTCGGATGpTACO2�XbaIQC�f CAGATAAAATATTTCTAGGTTTCAGTGCAATTTATCTCTTCAAATGTAGCpTACO2�XbaIQC�r GCTACATTTGAAGAGATAAATTGCACTGAAACCTAGAAATATTTTATCTGqPCR�GFP�f CGTGACCACATGGTCCTTCTqPCR�GFP�r GCTCATCCATGCCATGTGTAT7�f GCCTCTGTCATCACGATACTGTGT7�r TTACGCGAACGCGAAGTCCGT7�seq�f CCTTACAACATGGACTGGCGCGT7�seq�r CGCGCCAGTCCATGTTGTAAGGT7�seq1180�f GCCGTATCAGCCTTGAGTTCT7�seq1672�f GCGGTTAACTTGCTTCCTAGT7�seq243�r CAGTCGTTGATGCGTGCAATCT7�seq2521�f GTACTGGCTGATTTCTACGACT7�seq745�r GCGATAGCCTCAGCGTATTCT7LysY�BamHI�r CGCGCGGGATCCTTATCCACGGTCAGAAGTGAT7LysY�SalI�f GCGCGCGTCGACATGGCTCGTGTACAGTTTAAT7p�seq271�r CGCAACTGTTGGAAAGGGCT7p�seq529�r GTCTGGCCTTCCTGTAGCCT7RNAP�UPL�f AGTCAAGCTGGGCACTAAGGT7RNAP�UPL�r CACTGCGAGTAACACCGTGAUPLP�GFP #3 CTGCTGGGPLP�IHF #67 TGCTGGAGUPLP�T7Lys #59 CAGTGGCAUPLP�T7RNAP #20 CTGGCTGG
Wagner et al. www.pnas.org/cgi/content/short/0804090105 10 of 11

Other Supporting Information Files
Table S1 (XLS)Table S2 (XLS)
Table S5. Removed peaks of spectra obtained by MALDI-TOF using Peak Erazor
Blank Keratin Keratin 1 Keratin 8 Keratin 9 Keratin 10 Keratin 18 Trypsin Unknown
553.2600 1060.5170 758.4520 1105.5676 1277.5796 807.4001 848.4114 842.5100 832.3500662.3500 1126.5400 874.4990 2297.2213 1307.6714 1031.5988 1037.5705 856.5100 870.5000700.4400 2193.9820 973.5310 2510.3188 2299.2169 1064.6104 864.5100 1036.3800737.4200 1033.5160 2705.1538 1090.5315 906.5049 1091.5300750.2800 1066.5169 3264.5066 1109.4904 1045.5642 1108.4200772.4100 1127.5407 1365.6399 2211.1046 1108.4200778.3100 1175.6310 1381.6487 2225.3000 1234.6100804.3500 1179.6010 1707.7727 2239.1000 1277.7200853.4500 1265.6378 2283.1807 1296.7000887.3800 1302.7010 1300.5000975.4900 1357.6960 1320.5400978.3900 1383.6900 1434.7400992.4700 1393.7320 1493.74001019.5700 1475.7490 1791.75001219.7100 1638.8600 1794.74001252.4300 1657.7930 1837.95001410.6300 1687.9700 1851.93001419.6300 1716.8510 1940.95001474.6200 1765.7340 2225.09001559.6600 1993.9772 2239.04001607.7700 2383.9510 2284.12002391.1000 2501.2524 2300.10002568.2600 2565.1640 2399.03002760.2600 3095.6278 2717.09002960.2900 2807.25003268.5000 2872.28003399.5000 3324.62004148.9900 3338.7000
Wagner et al. www.pnas.org/cgi/content/short/0804090105 11 of 11