Embed Size (px)
Citation preview
Supporting InformationArnold et al. 10.1073/pnas.1222809110SI Materials and MethodsRT-qPCR. Following total RNA extraction from half of a mousespinal cord, quantitative PCR for mouse and human trans-activating response region DNA binding protein (TDP-43) wasperformed on 40 ng of total cDNA using the iQSYBR Greensupermix (Bio-Rad) with the iCycler iQ detection systemaccording to manufacturer’s instructions. Mus musculus ribo-somal protein S9 (Rps9, NM_029767) and actin γ-subunit protein(Actg1, NM_009609) genes were also measured as endogenousreferences across all experimental conditions.
Immunohistochemistry. Anesthetized mice were transcardiallyperfused with 4% (vol/vol) paraformaldehyde in phosphate buffer(pH 7.4), cryoprotected in 30% (wt/vol) sucrose, and embedded inTissueTek OCT (Sakura). Following cryosectioning, 30-μm free-floating sections were washed three times in PBS before beingincubated with blocking solution containing PBS with 1.5% (wt/vol) BSA and 0.5% (wt/vol) Tween-20 at room temperature.Sections were then incubated with primary antibody in PBS, 0.3%(wt/vol) Triton-X 100 overnight at room temperature. The fol-lowing day, the sections were washed three times with PBS andincubatedwith secondary antibody in PBS, 0.3%Triton-X100 for 1h at room temperature. After a final wash in PBS, sections weremounted, dried at room temperature and coverslipped in ProLongGold antifade mounting media (Invitrogen). The following pri-mary antibodies and dilutions used were as follows: anti–c-myc(mouse Millipore clone 4A6 or rabbit Sigma #C3956, 1:500),rabbit anti-TDP-43 (ProteinTech 12892, 1:500), mouse anti-CC1/APC (Calbiochem, 1:500), mouse anti-GFAP (Chemicon,1:1,000), mouse anti–NeuN-488 (directly conjugated; Chemicon,1:1,000), goat anti-choline acetyl-transferase (anti-ChAT) (Milli-pore, 1:300), rat anti-Ctip2 (Abcam, 1:500). For detection of pri-mary antibodies, donkey anti-rabbit, anti-mouse, or anti-goat Cy3,Cy5, or FITC-conjugated secondary antibodies (Jackson Im-munoResearch) were diluted at 1:500.For H&E staining, 10-μm cryosections of hindlimb muscle
(including the gastrocnemius, soleus, and plantaris sections)were stained following a standard protocol established in ourlaboratory.
Protein Extraction and Immunoblotting. Following RNA extraction,the protein fraction of TriZOL-extracted spinal cords was iso-lated for immunoblotting. Briefly, following DNA precipitationwith ethanol, the protein fraction was extracted using 0.3 Mguanidine hydrochloride in 95% ethanol (vol/vol) and 2.5% (vol/vol) glycerol. Following washes with guanidine hydrochloride/ethanol/glycerol, the protein pellet was washed once more in 95%ethanol (vol/vol) with 2.5% (vol/vol) glycerol and resuspended in10 mM Tris pH 7.5 with 1% SDS and 0.02% beta-mercapto-ethanol. Additionally, tissues were dissected and mechanicallyhomogenized in 4 mL/g of high salt buffer (50 mM Tris pH 7.5,750 mMNaCl, 5 mMEDTA and protease inhibitors) on ice, thenbriefly sonicated in intervals of 30 s for 5 min. Samples wereanalyzed using electrophoresis and immunoblotting with an an-tibody recognizing both mouse and human TDP-43 (ProteinTech12892; 1:1,000) or mouse GAPDH (AbCam clone 6C5, 1:20,000).
Quantification of Neuromuscular Junctions and Innervation. Briefly,floating 40-μm sections of gastrocnemius were incubated inblocking solution [PBS, 0.5% (vol/vol) Tween-20, 1.5% (wt/vol)BSA] for 4 h at room temperature. Sections were then incubatedovernight at room temperature with polyclonal rabbit anti-
synaptophysin antibody diluted in PBS, 0.3% Triton-X 100 at 1:50(Invitrogen). The following day, the sections were washed in PBSand incubated first with donkey anti-rabbit Cy3 (Jackson Im-munoResearch) and α-bungarotoxin Alexa488 (Invitrogen) at1:500 for 1 h at room temperature and then with fluoromyelin red(Invitrogen) at 1:300 for 30 min. Following a final wash, the sec-tions were mounted and dried overnight before coverslipping.
Animal Behavior and Electrophysiology. Accelerating rotarod. Cohortsof sex-matched, age-matched, transgenic animals and littermatecontrols were tested for time to fall on accelerating rotarod (UGOBasile; 2–40 rpm) over three trials with a maximum time of 300 sper trial at each time point (21 d, 3–4 mo, 6–7 mo, 10–12 mo,and 15–18 mo). Latency to fall was recorded in seconds once themice fell from the bar or rotated once around the bar to elimi-nate variability from passive rotation in accordance to protocolsreported elsewhere (1–3). Following a 1-d training session, trialswere repeated over a 3-d period for each time point. The datashown is the average of all three trials for the three sessionsfollowing the training session ± SEM. Statistical analysis wasperformed using one-way ANOVA with Bonferroni’s post hoctest for statistical measures.Grip strength. Cohorts of sex-matched, age-matched transgenicanimals and littermate controls were tested for loss of hindlimbgrip strength using a grip strength meter (Columbus Instruments)at 10–12 mo of age. Mice were held in front of a horizontal bar,such that only the hindlimb paws were able to grasp the bar andgently pulled back with steady force until both paws released thebar. Peak tension was recorded for five consecutive trials overthree separate weekly sessions. The data shown is the average ±SEM of trials of all sessions. Statistical analysis was performedusing one-way ANOVA with Bonferroni’s post hoc test for sta-tistical measures.Analysis of tremor or hindlimb clasping. A blinded observer sub-jectively scored mice at each of the time points listed (3–4, 6–7,and 10–12 mo of age) as being either affected or unaffected byeither of the two phenotypes described. Mice were classified asbeing affected by tremor if they displayed a persistent tremorwhen held flat in the observer’s hand. Mice were scored as dis-playing hindlimb clasping if they displayed retraction of thehindlimbs after being lifted by the tail for 30 s or less. A per-centage of affected animals is shown with statistical analysisperformed using Fisher’s exact test.Spinal cord surface motor-evoked potentials recording. Spinal cordsurface motor-evoked potentials were recorded from the dorsalsurface of the lower thoracic (Th12) spinal cord. Under isofluraneanesthesia [2.0–2.5% (vol/vol) maintenance; in room air], ani-mals were mounted into a stereotaxic frame and the scalp overmotor cortex was cut open to expose the skull. Stimulation wasperformed using a pair of stimulating electrodes consisting ofone silver-ball electrode placed into the skull over the motorcortex and one stainless-steel needle inserted into the hardpalate behind the upper incisors. A dental drill was used toperform a laminectomy of T11 vertebra exposing the T12 spinalsegment. Evoked responses were recorded by a pair of flexiblesilver-ball electrodes placed on the dura surface of the exposedT12 spinal segment. A reference silver-chloride disk electrodewas placed subcutaneously on the contralateral side of the re-cording. After electrode placement, animals were injected withketamine (150 mg·kg·h, i.p.) and isoflurane anesthesia was dis-continued. Stimulation pulses were 0.1-ms long with amplitudes7 mA delivered by a DS3 constant current isolated stimulator
Arnold et al. www.pnas.org/cgi/content/short/1222809110 1 of 8
(Digitimer). Recording electrodes were connected to an activeheadstage (3110W Headstage; Warner Instruments) and signal-amplified using DP-311 differential amplifier (Warner Instru-ments). Amplified signal was acquired by the PowerLab 8/30data acquisition system (ADInstruments) at sampling frequencyof 20 kHz, digitized and stored in PC for analysis.Myogenic motor-evoked potentials recording. Animals were anes-thetized with ketamine (150 mg/kg, i.p.) and two 30-G stainlesssteel stimulating electrodes were placed subcutaneously overlyingthe left and right motor cortex. Motor-evoked potentials wereelicited by transcranial electrical stimulation with a pulse durationof 1 ms at 7 mA using a DS3 constant current isolated stimulator(Digitimer). Responses were recorded from the gastrocnemiusmuscle using a 30-G platinum transcutaneous needle electrodes(distance between recording electrodes∼1 cm; Grass Technolo-gies, Astro-Med,). Recording electrodes were connected to anactive headstage (3110W Headstage; Warner Instruments) andsignal-amplified using DP-311 differential amplifier (WarnerInstruments). Amplified signal was acquired by the PowerLab 8/30 data-acquisition system (ADInstruments) at sampling fre-quency of 20 kHz, digitized and stored in PC for analysis.Resting electromyographic recording.Animals were anesthetized with2.5% isoflurane and the left hindlimb shaved. To record elec-tromyographic, two 30-G platinum transcutaneous needle elec-trodes (Grass Technologies, Astro-Med) were placed into thegastrocnemius muscle (distance between recording electrodes ∼1cm). Electrodes were connected to an active headstage (3110WHeadstage; Warner Instruments), recorded signal-amplified us-ing DP-311 differential amplifier (Warner Instruments), anddigitalized by the PowerLab 8/30 data-acquisition system (ADInstruments). The recorded signal was sampled at 20 kHz andstored in PC for analysis.The statistical analyses of electrophysiological data were per-
formed by Student t tests. P < 0.01 was considered to be statis-tically significant. The results were expressed as means ± SE.
Nuclear-Cytosolic Fractionation.Briefly, cortex and spinal cords weredissected, weighed, and fresh tissue was gently lysed in 10× (vol/wt)hypotonic buffer A (10 mM Hepes-KOH pH 7.4, 10 mM KCl, 1.5
mM MgCl, 0.5 mM EDTA, 0.5 mM EGTA), 1× protease in-hibitors (Roche) using a dounce homogenizer. After 20 min onice, 2.5 M sucrose [0.5× (vol/wt)] was added and samples werecentrifuged at 800 × g for 5 min. The supernatant was collected asthe cytosolic fraction, and the nuclear pellet was washed withbuffer A. Following centrifugation, the nuclear pellet was re-suspended in 5× (vol/wt) high-salt buffer B [10 mM Hepes-KOHpH 7.4, 0.42 M NaCl, 2.5% (vol/vol) glycerol, 1.5 mM MgCl, 0.5mM EDTA, 0.5 mM EGTA, 1 mM DTT, 1× protease inhibitors],and incubated at 4 °C while rotating at 60 rpm for 1 h. Both thenuclear and cytosolic fractions were then centrifuged at highspeed (16,100 × g) for 10 min at 4 °C.
Sequential Biochemical Fractionation. Cortex and spinal cords frommice were dissected, weighed, and homogenized in 4 mL/g ofhigh-salt buffer (HS buffer: 50 mM Tris pH7.5, 750 mM NaCl, 5mM EDTA, and protease inhibitor mixture), and then centri-fuged at 45,000 × g for 30 min at 4 °C. The pellets were reex-tracted with HS buffer, followed by two sequential extractionswith HS buffer containing 1% (wt/vol) Triton X-100 (TX frac-tions). Pellets were homogenized in 500 μL of HS buffer con-taining 1 M sucrose, and upon centrifugation, floating myelinwas removed. Pellets were then extracted with 2 mL/g of ureabuffer (7 M urea, 2 M thiourea, 4% (wt/vol) CHAPS, 30 mMTris pH 8.5), followed by 2 mL/g of SDS loading buffer.Equivalent volumes of samples were separated on 4–12%Bis-Tris gradient gels for immunoblotting with the indicatedantibodies.
RT-PCR Validation of Splicing Targets Identified by Microarray. cDNAwas generated by reverse-transcribing 1 μg of total RNA ex-tracted from the cortex and spinal cord of 2-mo-old transgenicanimals using oligo (dT) primer and SuperScript III reversetranscriptase (Invitrogen) according to the manufacturer’s in-structions. To test candidate splicing targets as identified bymicroarray, PCR amplification was performed for 28 cycles usingcDNA template with primers falling in exons flanking the al-ternate cassette exons. Products were separated on 10% acryl-amide-TBE gels and then stained with SYBR Gold (Invitrogen).
1. Boudreau RL, et al. (2009) Nonallele-specific silencing of mutant and wild-typehuntingtin demonstrates therapeutic efficacy in Huntington’s disease mice. Mol Ther17(6):1053–1063.
2. Hockly E, Woodman B, Mahal A, Lewis CM, Bates G (2003) Standardization andstatistical approaches to therapeutic trials in the R6/2 mouse. Brain Res Bull 61(5):469–479.
3. Mandillo S, et al. (2008) Reliability, robustness, and reproducibility in mouse behavioralphenotyping: a cross-laboratory study. Physiol Genomics 34(3):243–255.
Arnold et al. www.pnas.org/cgi/content/short/1222809110 2 of 8
65 94 96Non-Tg
Line
0
1234
1 2 1 21 20.25x 0.5x 1.0xNon-Tg 65 94 96Line
TDP-43Wild-Type
CB
D
F
Total Brain Homogenate
GAPDH
Wild
-Typ
enon-Tg
Q331K
-low
Q331K
M33
7V
0.25x 0.5x 1.0x
GAPDH
Fold
Cha
nge TDP-43Wild-Type
huTDP-43moTDP-43
A
huTDP-43moTDP-43
1 2 1 21 20.25x 0.5x 1.0xNon-Tg 31 103 109Line
TDP-43Q331K
GAPDH
huTDP-43moTDP-43
MoTDP-43HuTDP-43
31 103 109Non-Tg
Line
TDP-43Q331K
0
1234
Fold
Cha
nge
E
1 2 1 21 20.25x 0.5x 1.0xNon-Tg 14 76 106Line
TDP-43M337V
GAPDH
huTDP-43moTDP-43
34
14 76 106Non-Tg
Line
0
12
Fold
Cha
nge
Spinal Cord mRNA Levels
(normalized to non-transgenic)
Total Spinal Cord Homogenate
TDP-43M337VG
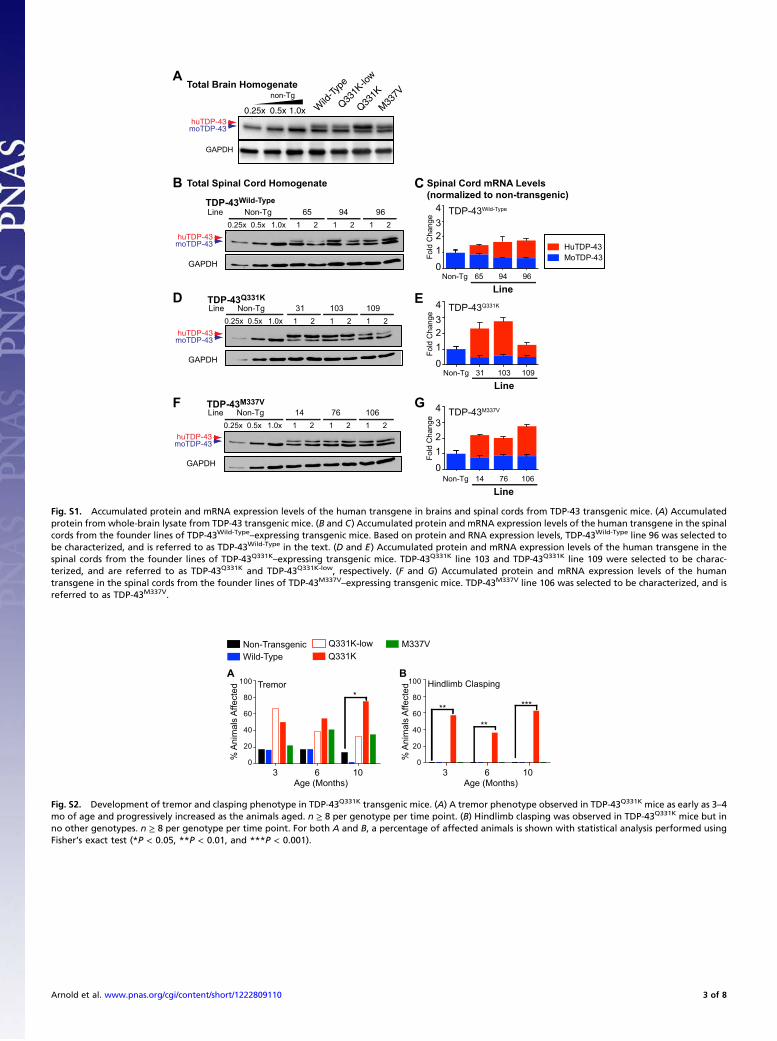
Fig. S1. Accumulated protein and mRNA expression levels of the human transgene in brains and spinal cords from TDP-43 transgenic mice. (A) Accumulatedprotein from whole-brain lysate from TDP-43 transgenic mice. (B and C) Accumulated protein and mRNA expression levels of the human transgene in the spinalcords from the founder lines of TDP-43Wild-Type
–expressing transgenic mice. Based on protein and RNA expression levels, TDP-43Wild-Type line 96 was selected tobe characterized, and is referred to as TDP-43Wild-Type in the text. (D and E) Accumulated protein and mRNA expression levels of the human transgene in thespinal cords from the founder lines of TDP-43Q331K
–expressing transgenic mice. TDP-43Q331K line 103 and TDP-43Q331K line 109 were selected to be charac-terized, and are referred to as TDP-43Q331K and TDP-43Q331K-low, respectively. (F and G) Accumulated protein and mRNA expression levels of the humantransgene in the spinal cords from the founder lines of TDP-43M337V
–expressing transgenic mice. TDP-43M337V line 106 was selected to be characterized, and isreferred to as TDP-43M337V.
0
20
40
60
80
100A B
Tremor
Non-TransgenicWild-Type
Q331K-lowQ331K
% A
nim
als
Affe
cted
3 6 10
*
Age (Months)
M337V
0
20
40
60
80
100
% A
nim
als
Affe
cted
3 6 10Age (Months)
**
**
***
Hindlimb Clasping
Fig. S2. Development of tremor and clasping phenotype in TDP-43Q331K transgenic mice. (A) A tremor phenotype observed in TDP-43Q331K mice as early as 3–4mo of age and progressively increased as the animals aged. n ≥ 8 per genotype per time point. (B) Hindlimb clasping was observed in TDP-43Q331K mice but inno other genotypes. n ≥ 8 per genotype per time point. For both A and B, a percentage of affected animals is shown with statistical analysis performed usingFisher’s exact test (*P < 0.05, **P < 0.01, and ***P < 0.001).
Arnold et al. www.pnas.org/cgi/content/short/1222809110 3 of 8
0
100
200
300A Motor Performance
10 17
B Non-Transgenic TDP-43Wild-Type TDP-43Q331K
20 m
onth
s
25 m
*******
***
Late
ncy
to F
all (
sec)
Age (Months)
3 10 200
500
1000
1500
Non-TransgenicWild-Type
Q331KQ331K-low
M337V
# of
Mot
or A
xons
Age (Months)
C
******
L5 Motor Axons
2 4 6 8 10 12 140
40
80
120
Non-TransgenicTDP-43Wild-TypeTDP-43Q331K
axons axons
Axon Diameter ( m)
# of
Axo
ns
D
20 months
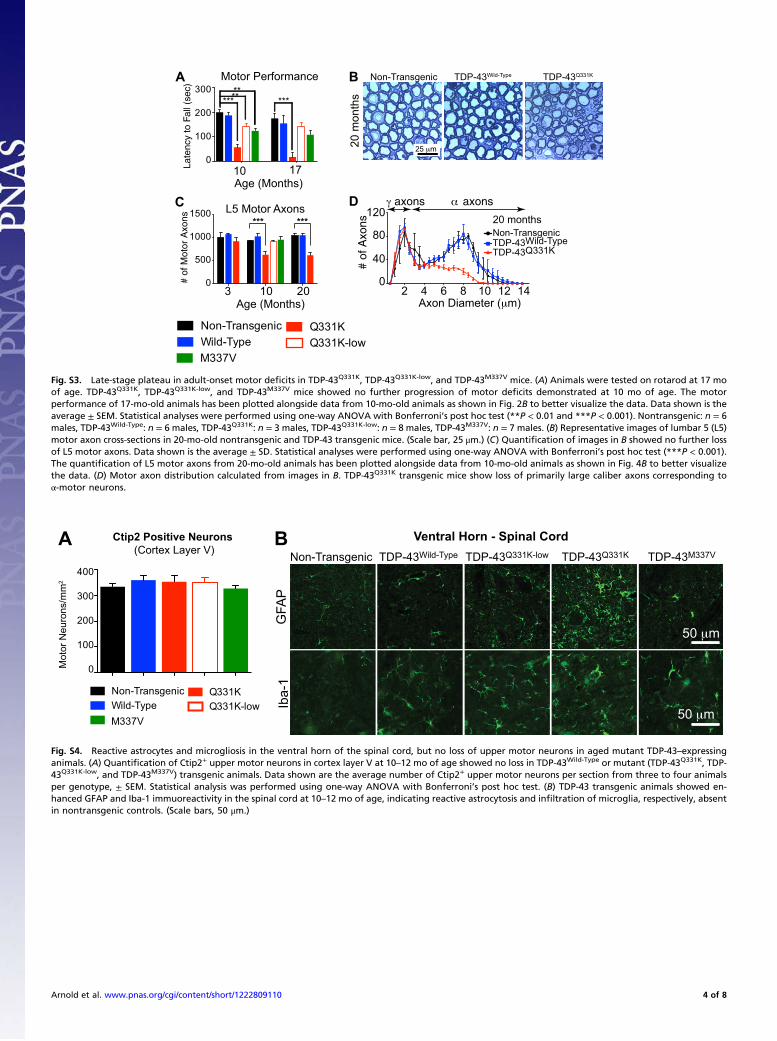
Fig. S3. Late-stage plateau in adult-onset motor deficits in TDP-43Q331K, TDP-43Q331K-low, and TDP-43M337V mice. (A) Animals were tested on rotarod at 17 moof age. TDP-43Q331K, TDP-43Q331K-low, and TDP-43M337V mice showed no further progression of motor deficits demonstrated at 10 mo of age. The motorperformance of 17-mo-old animals has been plotted alongside data from 10-mo-old animals as shown in Fig. 2B to better visualize the data. Data shown is theaverage ± SEM. Statistical analyses were performed using one-way ANOVA with Bonferroni’s post hoc test (**P < 0.01 and ***P < 0.001). Nontransgenic: n = 6males, TDP-43Wild-Type: n = 6 males, TDP-43Q331K: n = 3 males, TDP-43Q331K-low: n = 8 males, TDP-43M337V: n = 7 males. (B) Representative images of lumbar 5 (L5)motor axon cross-sections in 20-mo-old nontransgenic and TDP-43 transgenic mice. (Scale bar, 25 μm.) (C) Quantification of images in B showed no further lossof L5 motor axons. Data shown is the average ± SD. Statistical analyses were performed using one-way ANOVA with Bonferroni’s post hoc test (***P < 0.001).The quantification of L5 motor axons from 20-mo-old animals has been plotted alongside data from 10-mo-old animals as shown in Fig. 4B to better visualizethe data. (D) Motor axon distribution calculated from images in B. TDP-43Q331K transgenic mice show loss of primarily large caliber axons corresponding toα-motor neurons.
Non-Transgenic TDP-43Wild-Type
50 m
GFA
PIb
a-1
50 m
Ventral Horn - Spinal Cord
TDP-43Q331K-low TDP-43Q331K TDP-43M337V
0
100
200
300
400
Ctip2 Positive Neurons
(Cortex Layer V)
Mot
or N
euro
ns/m
m2
A B
Non-TransgenicWild-Type
Q331KQ331K-low
M337V
Fig. S4. Reactive astrocytes and microgliosis in the ventral horn of the spinal cord, but no loss of upper motor neurons in aged mutant TDP-43–expressinganimals. (A) Quantification of Ctip2+ upper motor neurons in cortex layer V at 10–12 mo of age showed no loss in TDP-43Wild-Type or mutant (TDP-43Q331K, TDP-43Q331K-low, and TDP-43M337V) transgenic animals. Data shown are the average number of Ctip2+ upper motor neurons per section from three to four animalsper genotype, ± SEM. Statistical analysis was performed using one-way ANOVA with Bonferroni’s post hoc test. (B) TDP-43 transgenic animals showed en-hanced GFAP and Iba-1 immuoreactivity in the spinal cord at 10–12 mo of age, indicating reactive astrocytosis and infiltration of microglia, respectively, absentin nontransgenic controls. (Scale bars, 50 μm.)
Arnold et al. www.pnas.org/cgi/content/short/1222809110 4 of 8
High Salt (HS) extraction45,000 xg, 30 min
pelletsupernatant High Salt + Triton X-100 (1%)(HS-T) extraction
PrP-TDP-43 Mouse:Wild-Type
M337VQ331K
Q331K-lowSpinal Cords
repeat 1X
45,000 xg, 30 min
(HS-1 and 2)
repeat 1X
pelletsupernatant (HS-T 1 and 2)
Immunoblot HS-1 (B)
High Salt + 1M Sucrose extraction45,000 xg, 30 min
pelletsupernatant (remove myelin) Urea Extraction (7M Urea)
45,000 xg, 30 min
supernatant(Urea)
Immunoblot Urea (C)
pellet
SDS Extraction
Immunoblot SDS (D)
A
huTDP-43moTDP-43
FUS
NF-H(SMI-32)
NF-L(p68)
Peripherin
Ponceau
Non-T
g
Wild
-Type
M337V
Q331K
Q331K
-low
Non-T
g
Wild
-Type
M337V
Q331K
Q331K
-low
Non-T
g
Wild
-Type
M337V
Q331K
Q331K
-low
Urea SDSHS-1
(Higher Exposures of (B, C and D)
TDP-43B C D
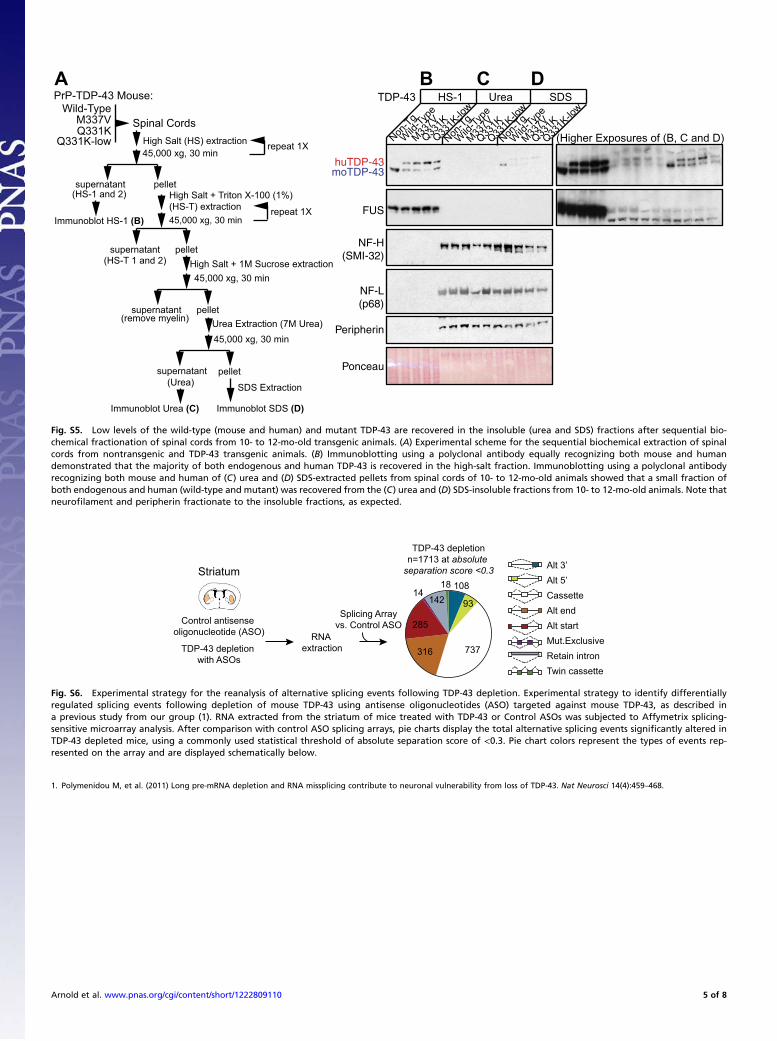
Fig. S5. Low levels of the wild-type (mouse and human) and mutant TDP-43 are recovered in the insoluble (urea and SDS) fractions after sequential bio-chemical fractionation of spinal cords from 10- to 12-mo-old transgenic animals. (A) Experimental scheme for the sequential biochemical extraction of spinalcords from nontransgenic and TDP-43 transgenic animals. (B) Immunoblotting using a polyclonal antibody equally recognizing both mouse and humandemonstrated that the majority of both endogenous and human TDP-43 is recovered in the high-salt fraction. Immunoblotting using a polyclonal antibodyrecognizing both mouse and human of (C) urea and (D) SDS-extracted pellets from spinal cords of 10- to 12-mo-old animals showed that a small fraction ofboth endogenous and human (wild-type and mutant) was recovered from the (C) urea and (D) SDS-insoluble fractions from 10- to 12-mo-old animals. Note thatneurofilament and peripherin fractionate to the insoluble fractions, as expected.
TDP-43 depletionn=1713 at absolute
separation score <0.3
108
93
737 316
285
14 142
18
Alt 3’Alt 5’CassetteAlt endAlt start
Retain intronTwin cassette
Mut.Exclusive
Splicing Arrayvs. Control ASO
RNA extraction
Striatum
Control antisense oligonucleotide (ASO)
TDP-43 depletion with ASOs
Fig. S6. Experimental strategy for the reanalysis of alternative splicing events following TDP-43 depletion. Experimental strategy to identify differentiallyregulated splicing events following depletion of mouse TDP-43 using antisense oligonucleotides (ASO) targeted against mouse TDP-43, as described ina previous study from our group (1). RNA extracted from the striatum of mice treated with TDP-43 or Control ASOs was subjected to Affymetrix splicing-sensitive microarray analysis. After comparison with control ASO splicing arrays, pie charts display the total alternative splicing events significantly altered inTDP-43 depleted mice, using a commonly used statistical threshold of absolute separation score of <0.3. Pie chart colors represent the types of events rep-resented on the array and are displayed schematically below.
1. Polymenidou M, et al. (2011) Long pre-mRNA depletion and RNA missplicing contribute to neuronal vulnerability from loss of TDP-43. Nat Neurosci 14(4):459–468.
Arnold et al. www.pnas.org/cgi/content/short/1222809110 5 of 8
Splicing changes with the same direction as depletionA
Splicing changes with the opposite direction as depletionB
C Splicing changes that are unchanged in depletion
0
5
10
Ctnnd1
Inclusion
Exclusion
in/e
x
Atp2b1
in/e
x
***
* *
0
1
2
WTNon-Tg Q331K Q331K-low KD
**
WTNon-Tg Q331K Q331K-low KD
**
**
Inclusion
Exclusion
0.0
0.2
0.4
012
Ppm2c AU040829
Caly
in/e
x
Inclusion
Exclusion
in/e
xin
/ex
***
***
** **
0
2
4
WTNon-Tg Q331K Q331K-low KD
***
15
20
WTNon-Tg Q331K Q331K-low KD
WTNon-Tg Q331K Q331K-low KD
TDP-43 Wild-Type
TDP-43 Q331K
TDP-43 Q331K-low
TDP-43 depletion
Non-Transgenic
in/ex = ratio of inclusion to exclusion
***
***
***
InclusionExclusion
Inclusion
Exclusion
0.0
0.2
0.4
Zfp414WTNon-Tg Q331K Q331K-low
Inclusion
Exclusion
in/e
x
***
KD
0
5
10
Kcnj3
in/e
x
***
* *
WTNon-Tg Q331K Q331K-low KD
Inclusion
Exclusion
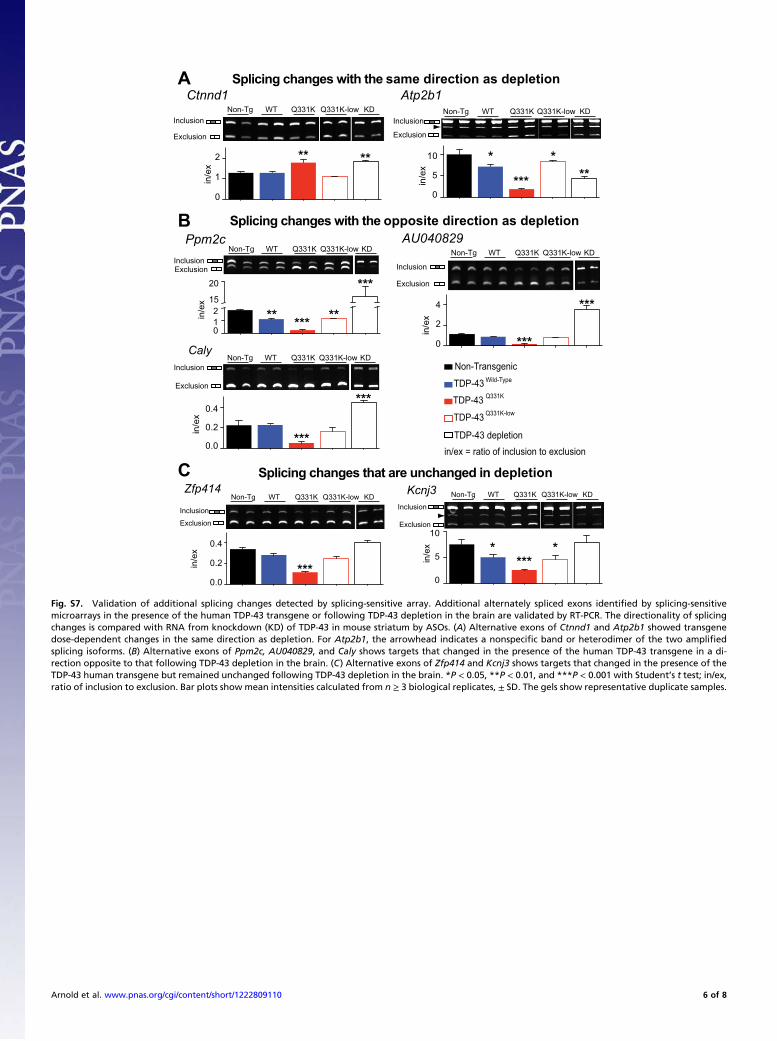
Fig. S7. Validation of additional splicing changes detected by splicing-sensitive array. Additional alternately spliced exons identified by splicing-sensitivemicroarrays in the presence of the human TDP-43 transgene or following TDP-43 depletion in the brain are validated by RT-PCR. The directionality of splicingchanges is compared with RNA from knockdown (KD) of TDP-43 in mouse striatum by ASOs. (A) Alternative exons of Ctnnd1 and Atp2b1 showed transgenedose-dependent changes in the same direction as depletion. For Atp2b1, the arrowhead indicates a nonspecific band or heterodimer of the two amplifiedsplicing isoforms. (B) Alternative exons of Ppm2c, AU040829, and Caly shows targets that changed in the presence of the human TDP-43 transgene in a di-rection opposite to that following TDP-43 depletion in the brain. (C) Alternative exons of Zfp414 and Kcnj3 shows targets that changed in the presence of theTDP-43 human transgene but remained unchanged following TDP-43 depletion in the brain. *P < 0.05, **P < 0.01, and ***P < 0.001 with Student’s t test; in/ex,ratio of inclusion to exclusion. Bar plots show mean intensities calculated from n ≥ 3 biological replicates, ± SD. The gels show representative duplicate samples.
Arnold et al. www.pnas.org/cgi/content/short/1222809110 6 of 8
1. Polymenidou M, et al. (2011) Long pre-mRNA depletion and RNA missplicing contribute to neuronal vulnerability from loss of TDP-43. Nat Neurosci 14(4):459–468.
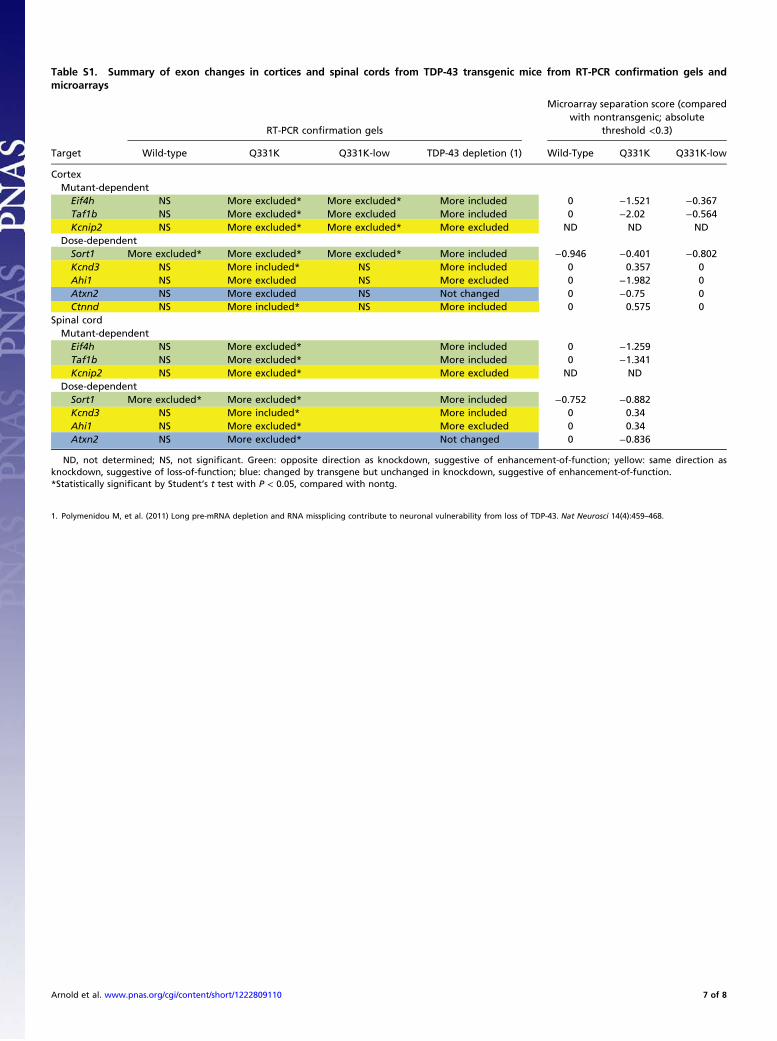
Table S1. Summary of exon changes in cortices and spinal cords from TDP-43 transgenic mice from RT-PCR confirmation gels andmicroarrays
RT-PCR confirmation gels
Microarray separation score (comparedwith nontransgenic; absolute
threshold <0.3)
Target Wild-type Q331K Q331K-low TDP-43 depletion (1) Wild-Type Q331K Q331K-low
CortexMutant-dependent
Eif4h NS More excluded* More excluded* More included 0 −1.521 −0.367Taf1b NS More excluded* More excluded More included 0 −2.02 −0.564Kcnip2 NS More excluded* More excluded* More excluded ND ND ND
Dose-dependentSort1 More excluded* More excluded* More excluded* More included −0.946 −0.401 −0.802Kcnd3 NS More included* NS More included 0 0.357 0Ahi1 NS More excluded NS More excluded 0 −1.982 0Atxn2 NS More excluded NS Not changed 0 −0.75 0Ctnnd NS More included* NS More included 0 0.575 0
Spinal cordMutant-dependent
Eif4h NS More excluded* More included 0 −1.259Taf1b NS More excluded* More included 0 −1.341Kcnip2 NS More excluded* More excluded ND ND
Dose-dependentSort1 More excluded* More excluded* More included −0.752 −0.882Kcnd3 NS More included* More included 0 0.34Ahi1 NS More excluded* More excluded 0 0.34Atxn2 NS More excluded* Not changed 0 −0.836
ND, not determined; NS, not significant. Green: opposite direction as knockdown, suggestive of enhancement-of-function; yellow: same direction asknockdown, suggestive of loss-of-function; blue: changed by transgene but unchanged in knockdown, suggestive of enhancement-of-function.*Statistically significant by Student’s t test with P < 0.05, compared with nontg.
Arnold et al. www.pnas.org/cgi/content/short/1222809110 7 of 8
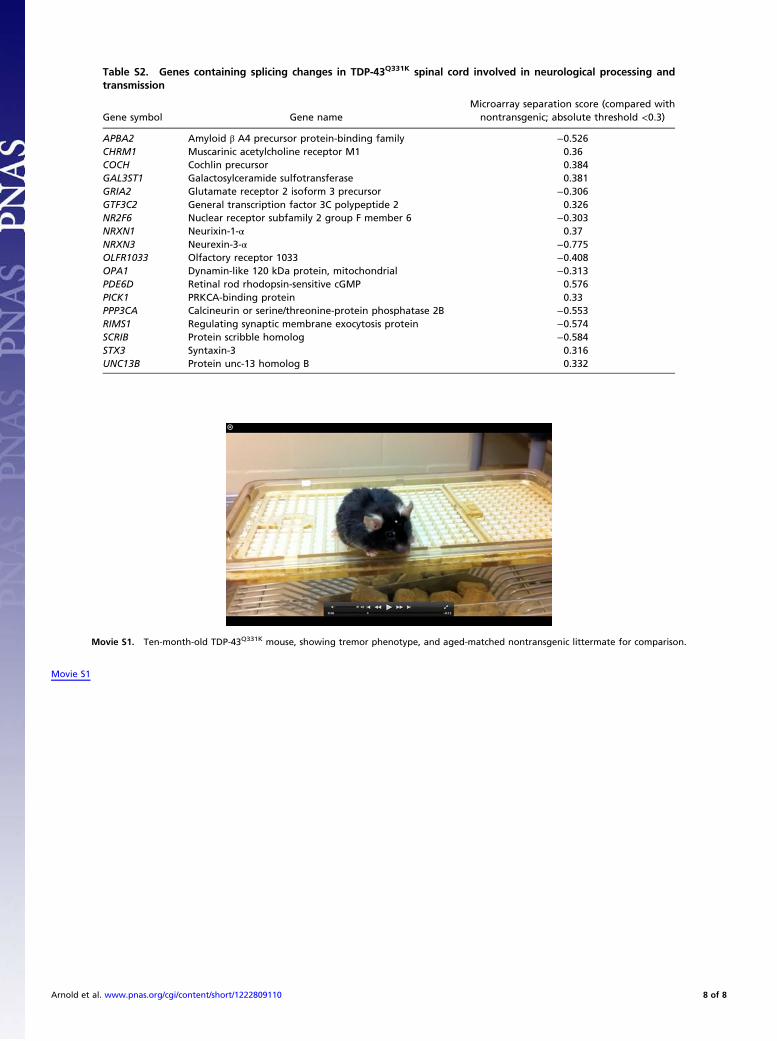
Table S2. Genes containing splicing changes in TDP-43Q331K spinal cord involved in neurological processing andtransmission
Gene symbol Gene nameMicroarray separation score (compared with
nontransgenic; absolute threshold <0.3)
APBA2 Amyloid β A4 precursor protein-binding family −0.526CHRM1 Muscarinic acetylcholine receptor M1 0.36COCH Cochlin precursor 0.384GAL3ST1 Galactosylceramide sulfotransferase 0.381GRIA2 Glutamate receptor 2 isoform 3 precursor −0.306GTF3C2 General transcription factor 3C polypeptide 2 0.326NR2F6 Nuclear receptor subfamily 2 group F member 6 −0.303NRXN1 Neurixin-1-α 0.37NRXN3 Neurexin-3-α −0.775OLFR1033 Olfactory receptor 1033 −0.408OPA1 Dynamin-like 120 kDa protein, mitochondrial −0.313PDE6D Retinal rod rhodopsin-sensitive cGMP 0.576PICK1 PRKCA-binding protein 0.33PPP3CA Calcineurin or serine/threonine-protein phosphatase 2B −0.553RIMS1 Regulating synaptic membrane exocytosis protein −0.574SCRIB Protein scribble homolog −0.584STX3 Syntaxin-3 0.316UNC13B Protein unc-13 homolog B 0.332
Movie S1. Ten-month-old TDP-43Q331K mouse, showing tremor phenotype, and aged-matched nontransgenic littermate for comparison.
Movie S1
Arnold et al. www.pnas.org/cgi/content/short/1222809110 8 of 8

![Tris[tris(ethane-1,2-diamine)cobalt(II)] bis[octacyanidomolybdate(V)] dihydratemypage.just.edu.cn/_upload/article/files/30/fc/684d... · 2017. 6. 8. · Tris[tris(ethane-1,2-diamine)cobalt(II)]](https://img.pdfslide.net/doc/110x75/60d9aab9684bc31d7d4fd5e5/tristrisethane-12-diaminecobaltii-bisoctacyanidomolybdatev-2017-6-8.jpg)


![Bis[tris(1,10-phenanthroline)nickel(II)] tris ... · Bis[tris(1,10-phenanthroline)nickel(II)] tris[dicyanidoargentate(I)] nitrate 4.2-hydrate Muhammad Monim-ul-Mehboob,a Muhammad](https://img.pdfslide.net/doc/110x75/5f74462041fcef38863090d7/bistris110-phenanthrolinenickelii-tris-bistris110-phenanthrolinenickelii.jpg)