Embed Size (px)
Citation preview

S1
Supporting Information
Synthesis and characterisation of a trithiocarbonate for the decoration of carbon
nanostructures
Patrizio Salice,*a Michele Mauri,
b Micaela Castellino,
c Martina De Marco,
a Alberto Bianchi,
b
Alessandro Virga,d Alberto Tagliaferro,
d Roberto Simonutti,
b and Enzo Menna
a
a Università di Padova, Dipartimento di Scienze Chimiche, via Marzolo, 1, 35131, Padova, Italy
b Università di Milano-Bicocca, Dipartimento di Scienza dei Materiali, via Cozzi, 53, 20126,
Milano, Italy
c Center for Space Human Robotics, Istituto Italiano di Tecnologia,, Corso Trento, 21,
10129,Torino, Italy.
d Politecnico di Torino, Dipartimento Scienza Applicata e Tecnologia, Corso Duca degli Abruzzi,
24, 10129,Torino, Italy
E-mail: [email protected]
1. Instruments, materials and methods S2
2. Synthesis and characterization of dodecyl 4-formylbenzyltrithiocarbonate (1) S4
3. Synthesis and characterization of the fulleropyrrolidine 2 S8
4. Synthesis and characterization of SWCNT-TTC S12
5. Synthesis and characterization of DWCNT-TTC S17
6. Synthesis and characterization of MWCNT-TTC S22
7. Synthesis and characterization of graphite-TTC S27
8. Polymerisation of styrene in the presence of MWCNT-TTC S32
Electronic Supplementary Material (ESI) for Chemical CommunicationsThis journal is © The Royal Society of Chemistry 2013

S2
1. Instruments, materials and methods
All the reagents and solvents were purchased from Sigma-Aldrich and were used as received if not
otherwise specified. Single-walled carbon nanotubes (SWCNTs) and double-walled carbon nanotubes
(DWCNTs) were provided by Cheap Tubes Inc and were used as received. Multi-walled carbon nanotubes
(MWCNTs) were purchased from Sigma-Aldrich (product # 677248). [60]Fullerene was purchased from
Bucky USA and was used as received. Graphite was purchased from Superior Graphite and was used as
received.
Dispersions of carbon nanostructures (CNSs) were achieved using the Sonicator 3000 (Misonix) with the
following pulse parameters: time on = 3 sec, time off = 3 sec, power level = 2 (4-6 watt). Carbon nanotubes
were sonicated for 30 minutes, while graphite for 7 hours. The resulting dispersions were centrifuged with an
MR23i Jouan ultracentrifuge equipped with a SWM 180.5 swinging bucket rotor (Thermo electron
corporation) at 3000 rpm for 10 minutes. Absorption spectra in air-equilibrated solvents were registered with
a Varian Cary 5000 spectrophotometer, at room temperature, between 280 and 1400 nm, data interval = 0.5
nm, scan rate = 300 nm/min, SBW = 2 nm. DLS measurements of CNS samples dispersed in air-equilibrated
DMF were performed with a Zetasizer Nano S (Malvern Instruments) at 20 °C setting 20 runs of 10 seconds
for each measurement. Raman spectra of CNSs, drop-casted on pre-cleaned glass micro slides (Corning)
and annealed at 110°C, were recorded with an Invia Renishaw Raman microspectrometer (50× objective)
using the 633 nm line of a He–Ne laser at room temperature with a low laser power. Thermogravimetric
analyses (TGA) of CNSs samples, precipitated by adding methanol and dried at 80 °C at 0.2 mbar for 4 h,
were carried out with a Q5000IR TGA (TA Instruments) under air by an isotherm at 100 °C for 10 minutes
followed by heating at 10 °C/min rate till 1000 °C.
A ZEISS SUPRA 40 Field-Emission Scanning Electron Microscope (FESEM) has been used to analyze the
samples surface morphology and degree of dispersion. As the samples were conducting, no special charge
suppression was necessary.
A PHI-5000 Versa Probe X-ray Photoelectron Spectroscopy (XPS) device equipped with a monochromatic Al
X-ray source (1486.6 eV energy, 15 kV voltage and 25 W), has been used in order to investigate samples
surface chemical composition. A spot size of 100 µm has been used. Different Pass Energy (PE) values
have been chosen for the various types of spectra acquisition: 187 eV for survey spectra and 23 eV for high
resolution peak spectra. XPS analysis have been made with CasaXPS Software (Version 2.3.13).
Relative atomic concentration has been evaluated after subtracting the background with a Shirley function.
The values measured are reported in the following table.
Electronic Supplementary Material (ESI) for Chemical CommunicationsThis journal is © The Royal Society of Chemistry 2013

S3
Table 1. Properties of the most soluble fractions of functionalized CNSs.
concentration
[a]
/ mg mL-1
aggregate size
[b] /
nm D/G
[c] DF
[d]
Relative atomic concentration[e]
/%
C N S
Graphite-
TTC 0.050 /
[f]
0.48
(0.28) 1/17 77.6 0.5 1.0
SWCNT-
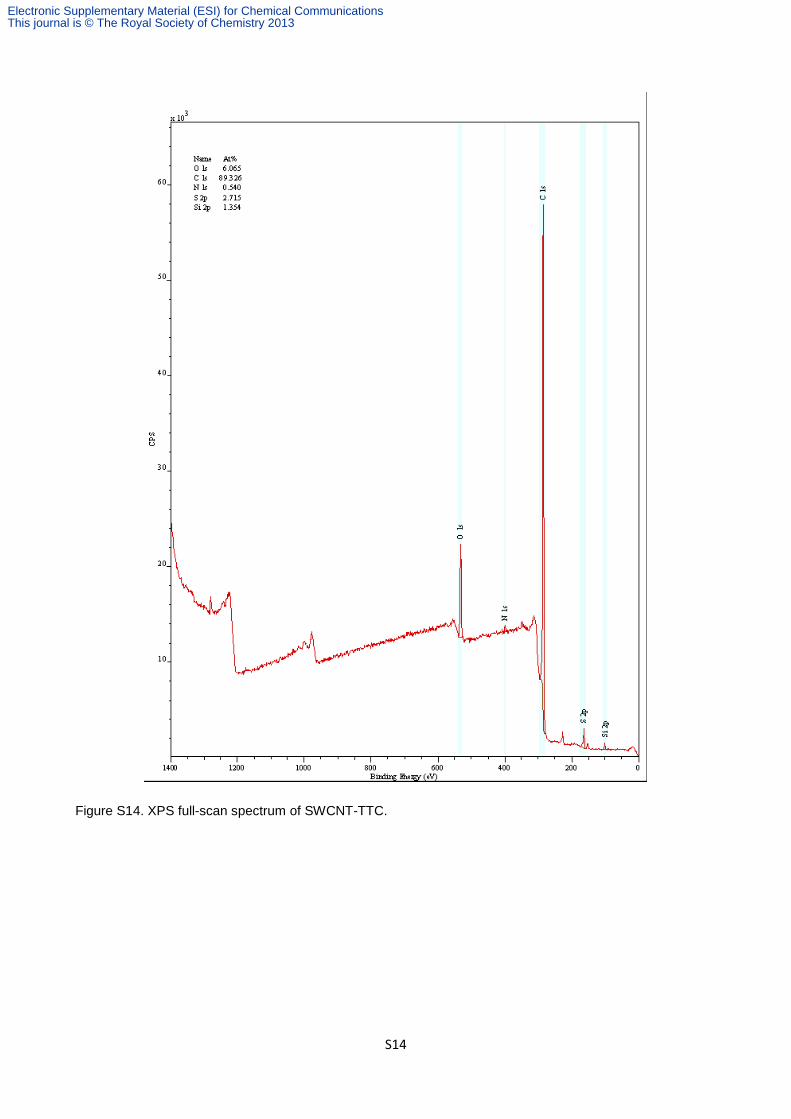
TTC 0.38 60
0.13
(0.06) 1/25 89.3 0.5 2.7
DWCNT-
TTC 0.52 30
0.14
(0.10) 1/27 91.7 1.3 3.5
MWCNT-
TTC 1.10 60
1.68
(1.64) 1/129 93.5 0.6 1.4
[a] Concentration in DMF determined by TGA. Error of ± 5%. [b] Dimension of the aggregates from DLS analysis. Error ± 10%. [c] Ratio between the intensity of the D and the G band of the Raman spectra. The value for the pristine CNSs is reported in brackets. Error ± 5%. [d] Degree of functionalization for the CNSs expressed as the ratio between the moles of functional group and the moles of available reactive sites (C=C) determined by TGA. Error of ± 5%. [e] From XPS measurements. [f] No DLS data due to excessive aggregation.
Electronic Supplementary Material (ESI) for Chemical CommunicationsThis journal is © The Royal Society of Chemistry 2013

S4
2. Synthesis of dodecyl 4-formylbenzyltrithiocarbonate (1)
The reaction was carried out under nitrogen atmosphere. CS2 (0.30 mL, 5.0 mmol) is added
dropwise to a solution of dodecanthiol (1.2 mL, 5.0 mmol) and Aliquat 336 (11 µL, 0.0024 µmol) in
aqueous KOH (20% w/w, 1.5 mL). Immediately the solution turned bright yellow. After 15 minutes
under magnetic stirring, 4-(bromomethyl)benzaldehyde (1.0 g, 5.0 mmol) was added and the
reaction mixture was heated at 75 °C for 45 minutes. The reaction was monitored by TLC on silica
gel (eluent: ETP/ Et2O 9:1, RF(product) = 0.4). The reaction is quenched with deionized water (100
mL) and washed with petroleum ether (4 x 70 mL). The organic phase was dried over MgSO4 and
the solvent was removed at reduced pressure obtaining a yellow solid which was purified by
column chromatography on silica gel (eluent: ETP/ Et2O 9:1, RF(product) = 0.4). The desired
product was obtained as yellow crystals by recrystallization from methanol. (790 mg, 2.0 mmol).
40% yield.1
1H NMR (300 MHz, CDCl3, δ): 9.99 (s, 1H), 7.83 (d, J = 8.2 Hz, 2H), 7.52 (d, J = 8.1 Hz, 2H), 4.68 (s,
2H), 3.38 (s, 2H), 1.71 (s, 2H -), 1.27 (s, 18H), 0.89 (s, 3H). 13C NMR (125 MHz, CDCl3, δ): 221, 192.00, 143.05, 136.00, 130.30, 41.21, 41.07, 40.69, 37.71,
32.29, 30.14 , 28.99 , 28.29, 23.08, 14.53.
mp 48.3-48-6 °C
Anal. Calcd for C21H32OS3: C, 63.59; H, 8.13; O, 4.03; S, 24.25. Found: C, 63.45; H, 8.19; O, 4.14; S,
24.22.
1 Formation of byproduct was not observed. Indeed, conversion yield is expected to be higher than
the isolated yield. The 40 % yield is obtained after isolating a highly pure portion of the material by
column chromatography and crystallization.
Electronic Supplementary Material (ESI) for Chemical CommunicationsThis journal is © The Royal Society of Chemistry 2013

S5
Figure S1: 1H-NMR spectrum of 2 (300 MHz, CDCl3).
Figure S2: 13C-NMR spectrum of 1 (125 MHz, CDCl3).
Electronic Supplementary Material (ESI) for Chemical CommunicationsThis journal is © The Royal Society of Chemistry 2013

S6
250 300 350 400 450 500
0
5000
10000
15000
20000
Mo
lar
ex
tin
cti
on
co
eff
icie
nt
[L m
ol-1
cm
-1]
Wavelength [nm]
306 nm250 nm
Figure S3: UV-vis absorption spectrum of 1 in air-equilibrated hexane.
Figure S4: FT-IR absorption spectrum of 1 (KBr pellet).
Electronic Supplementary Material (ESI) for Chemical CommunicationsThis journal is © The Royal Society of Chemistry 2013

S7
44 46 48 50 52 54 56 58 60
-6
-5
-4
-3
-2
-1
0
He
at
flo
w [
W/g
]
Temperature [°C]
Figure S5: DSC thermogram of 1 (1 °C/min under nitrogen).
0 1000 2000 3000 4000 5000
0
20
40
60
80
100
We
igh
t [%
]
Time [sec]
0.0
0.2
0.4
0.6
0.8
1.0Normalized:
ion current @ 78 m/z
weight derivative
Figure S6: TGA-MS analysis including: (a) weight loss (grey); (b) normalized weight derivative
(blue); and (c) normalized ion current at 78 m/z (red) of 1 (10 °C/min under air).
Electronic Supplementary Material (ESI) for Chemical CommunicationsThis journal is © The Royal Society of Chemistry 2013

S8
3. Synthesis and characterization of the fulleropyrrolidine 2
The reaction was carried out under nitrogen atmosphere. Sarcosine (28 mg, 0.31 mmol) and the
aldehyde 1 (84 mg, 0.21 mmo) were added portionwise to a solution of C60 (0.10 g, 0.14 mmol) in
chlorobenzene (10 mL) heated at 130 °C. The reaction is monitored by TLC (stationary phase: silica
gel; eluent: hexane/toluene 2:1; RF(product) = 0.48). After 60 minutes the solvent was removed at
reduced pressure obtaining a brown solid which was purified by column chromatography on silica
gel (eluent: hexane/toluene 2:1). The desired product was obtained as brown powder (32 mg,
0.028 mmol). 20% yield.
1H NMR (300 MHz, CDCl3/CS2 1:2) : δ 7.75 (d, J = 7.1 Hz, 2H), 7.39 (d, J = 8.3 Hz, 2H), 4.98 (d, J = 9.5
Hz, 1H), 4.92 (s, 1H), 4.61 (s, 2H), 4.26 (d, J = 9.5 Hz, 1H), 3.35 (t, 2H), 2.80 (s, 3H), 1.68 (m, 2H),
1.26 (s, 18H), 0.88 (s, 3H, CH3).
13C NMR (126 MHz, CDCl3/CS2 1:2) : δ 222.5, 156.04, 153.81, 153.15, 152.98, 147.22, 146.58,
146.34, 146.26, 146.08, 146.00, 145.88, 145.69, 145.49, 145.43, 145.32, 145.20, 145.09, 144.64,
144.56, 144.34, 143.09, 142.96, 142.64, 142.56, 142.51, 142.22, 142.17, 142.11, 141.99, 141.85,
141.79, 141.63, 141.51, 140.17, 140.13, 139.91, 139.50, 136.82, 136.48, 135.82, 135.67, 135.55,
129.76, 129.48, 83.23, 83.11, 70.15, 69.86, 68.89, 41.37, 41.14, 40.92, 40.02, 39.91, 37.57, 37.26,
36.96, 32.17, 29.92, 29.84, 29.75, 29.63, 29.42, 29.22, 28.27, 23.06, 14.45, 14.36.
APPI-MS (m/z) C83H37NS3 m/z: 1144 (M+∙).
Electronic Supplementary Material (ESI) for Chemical CommunicationsThis journal is © The Royal Society of Chemistry 2013
S9
,
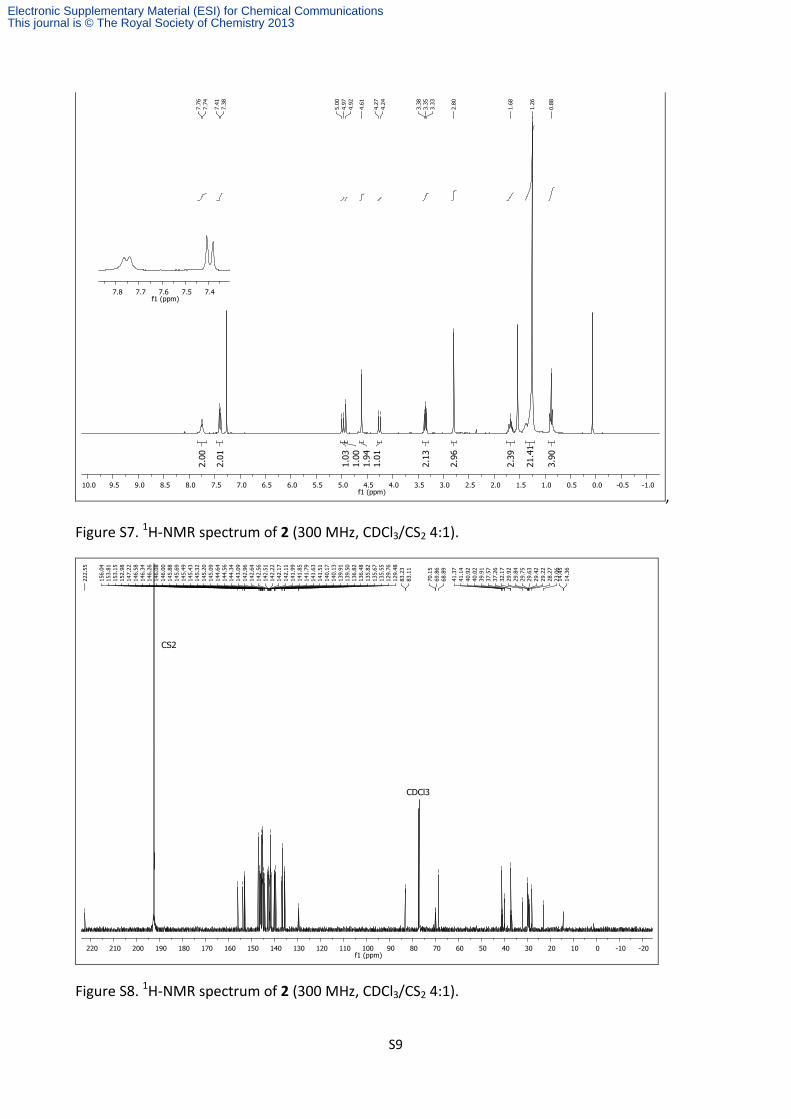
Figure S7. 1H-NMR spectrum of 2 (300 MHz, CDCl3/CS2 4:1).
Figure S8. 1H-NMR spectrum of 2 (300 MHz, CDCl3/CS2 4:1).
Electronic Supplementary Material (ESI) for Chemical CommunicationsThis journal is © The Royal Society of Chemistry 2013

S10
300 350 400 450 500 550 600
0,0
0,2
0,4
0,6
0,8
1,0
Ab
so
rba
nce
Wavelength [nm]
Figure S9. UV-vis absorption spectrum of 2 in air-equilibrated hexane.
100 200 300 400 500 600 700 800
0
10
20
30
40
50
60
70
80
90
100
We
igh
t / %
We
igh
t los
s d
eriv
ativ
e / %
°C-1
Temperature / °C
0.0
0.5
1.0
1.5
2.0
2.5
3.0
3.5
4.0
Figure S10. Thermogram of 2 under air with heating rate 10 °C min-1. The solid line refers to weight
(left axis), the dashed one to weight loss derivative (right axis).
Electronic Supplementary Material (ESI) for Chemical CommunicationsThis journal is © The Royal Society of Chemistry 2013

S11
Figure S11. APPI-MS spectrum of 2; (m/z) C83H37NS3 m/z: 1144 (M+).
Electronic Supplementary Material (ESI) for Chemical CommunicationsThis journal is © The Royal Society of Chemistry 2013
S12
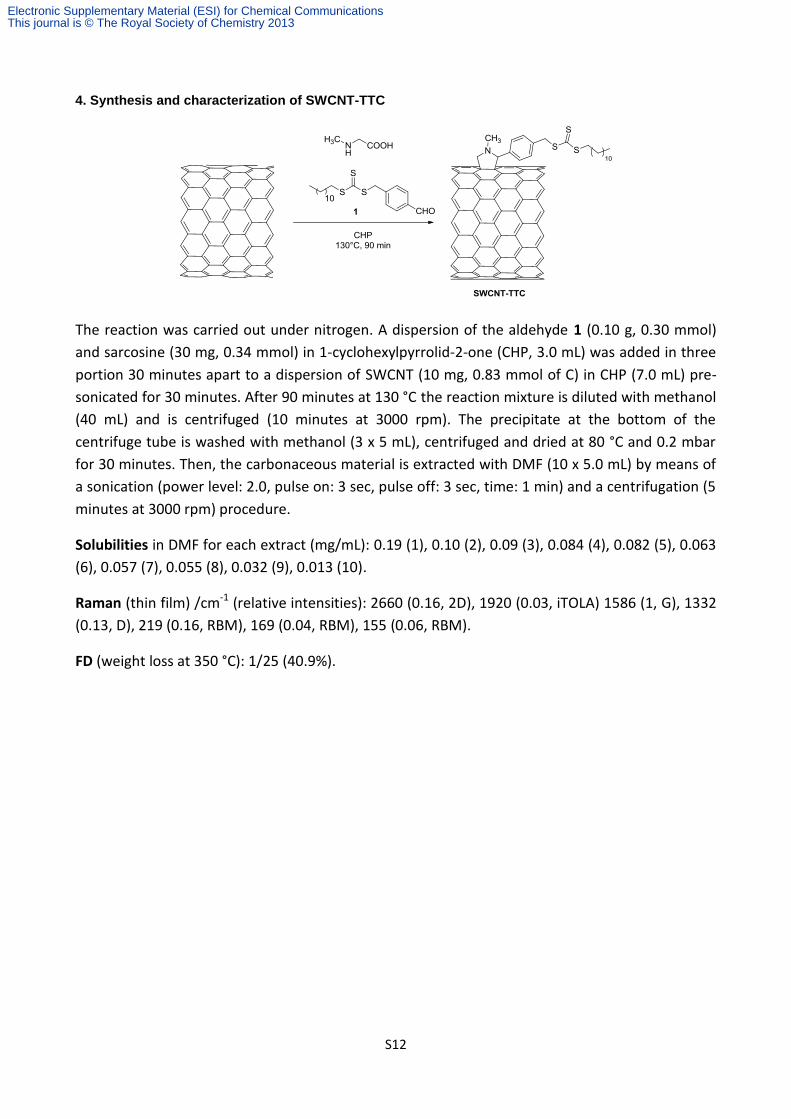
4. Synthesis and characterization of SWCNT-TTC
The reaction was carried out under nitrogen. A dispersion of the aldehyde 1 (0.10 g, 0.30 mmol)
and sarcosine (30 mg, 0.34 mmol) in 1-cyclohexylpyrrolid-2-one (CHP, 3.0 mL) was added in three
portion 30 minutes apart to a dispersion of SWCNT (10 mg, 0.83 mmol of C) in CHP (7.0 mL) pre-
sonicated for 30 minutes. After 90 minutes at 130 °C the reaction mixture is diluted with methanol
(40 mL) and is centrifuged (10 minutes at 3000 rpm). The precipitate at the bottom of the
centrifuge tube is washed with methanol (3 x 5 mL), centrifuged and dried at 80 °C and 0.2 mbar
for 30 minutes. Then, the carbonaceous material is extracted with DMF (10 x 5.0 mL) by means of
a sonication (power level: 2.0, pulse on: 3 sec, pulse off: 3 sec, time: 1 min) and a centrifugation (5
minutes at 3000 rpm) procedure.
Solubilities in DMF for each extract (mg/mL): 0.19 (1), 0.10 (2), 0.09 (3), 0.084 (4), 0.082 (5), 0.063
(6), 0.057 (7), 0.055 (8), 0.032 (9), 0.013 (10).
Raman (thin film) /cm-1 (relative intensities): 2660 (0.16, 2D), 1920 (0.03, iTOLA) 1586 (1, G), 1332
(0.13, D), 219 (0.16, RBM), 169 (0.04, RBM), 155 (0.06, RBM).
FD (weight loss at 350 °C): 1/25 (40.9%).
Electronic Supplementary Material (ESI) for Chemical CommunicationsThis journal is © The Royal Society of Chemistry 2013

S13
1 2 3 4 5
0.0
0.1
0.2
0.3
0.4
Co
nce
ntr
atio
n [m
g/m
L]
Extract
SWCNT
SWCNT-TTC
Figure S12. Concentration of pristine SWCNT (light grey) and SWCNT-TTC (dark grey) extracted with DMF (5
fractions, 5 mL each).
10-6
10-5
10-4
10-3
10-2
10-1
100
101
102
0
50
100
150
200
Volume [m3]
Co
un
ts
1 10 100 1000 10000
Size [nm]
Figure S13. DLS number distributions for SWCNT-TTC present in the first DMF extract.
Electronic Supplementary Material (ESI) for Chemical CommunicationsThis journal is © The Royal Society of Chemistry 2013
S14
Figure S14. XPS full-scan spectrum of SWCNT-TTC.
Electronic Supplementary Material (ESI) for Chemical CommunicationsThis journal is © The Royal Society of Chemistry 2013

S15
Figure S15. FESEM images of SWCNT-TTC at (a) 2 kX, (b) 50 kX, (c) 150 kX, and (d) 500 kX
magnifications.
Electronic Supplementary Material (ESI) for Chemical CommunicationsThis journal is © The Royal Society of Chemistry 2013

S16
100 200 300 400 500 600 700 800
0
10
20
30
40
50
60
70
80
90
100
We
igh
t / %
We
igh
t los
s d
eriv
ativ
e / %
°C-1
Temperature / °C
0.00
0.25
0.50
0.75
1.00
Figure S16. Thermogram of SWCNT-TTC under air with heating rate 10 °C min-1. The solid line
refers to weight (left axis), the dashed one to weight loss derivative (right axis).
500 1000 1500 2000 2500 3000
0.0
0.2
0.4
0.6
0.8
1.0
No
rma
lize
d in
ten
sity
Raman shift [cm-1]
100 150 200 250 300 350 1200 1250 1300 1350 1400
Figure S17. Raman spectra of SWCNT-TTC (red line) and pristine SWCNT (black line). The insets
highlight the differences in the RBMs (left) and in the D bands (right) following functionalization.
Electronic Supplementary Material (ESI) for Chemical CommunicationsThis journal is © The Royal Society of Chemistry 2013

S17
5. Synthesis and characterization of DWCNT-TTC
The reaction was carried out under nitrogen. A dispersion of the aldehyde 1 (0.10 g, 0.30 mmol)
and sarcosine (30 mg, 0.34 mmol) in CHP (3.0 mL) was added in three portion 30 minutes apart to
a dispersion of DWCNT (10 mg, 0.83 mmol of C) in CHP (7.0 mL) pre-sonicated for 30 minutes.
After 90 minutes at 130 °C the reaction mixture is diluted with methanol (40 mL) and is
centrifuged (10 minutes at 3000 rpm). The precipitate at the bottom of the centrifuge tube is
washed with methanol (3 x 5 mL), centrifuged and dried at 80 °C and 0.2 mbar for 30 minutes.
Then, the carbonaceous material is extracted with DMF (10 x 5.0 mL) by means of a sonication
(power level: 2.0, pulse on: 3 sec, pulse off: 3 sec, time: 1 min) and a centrifugation (5 minutes at
3000 rpm) procedure.
Solubilities in DMF for each extract (mg/mL): 0.26 (1), 0.19 (2), 0.15 (3), 0.13 (4), 0.11 (5), 0.08 (6),
0.069 (7), 0.051 (8), 0.041 (9), 0.037 (10).
Raman (thin film) /cm-1 (relative intensities): 2627 (0.20, 2D), 1587 (1, G), 1329 (0.13, D), 256
(0.03, RBM), 219 (0.10, RBM), 156 (0.06), 136 (0.04).
FD (weight loss at 450 °C): 1/27 (39.2%).
Electronic Supplementary Material (ESI) for Chemical CommunicationsThis journal is © The Royal Society of Chemistry 2013

S18
1 2 3 4 5
0.0
0.2
0.4
0.6
Co
nce
ntr
atio
n [m
g/m
L]
Extract
DWCNT
DWCNT-TTC
Figure S18. Concentration of pristine DWCNT (light grey) and DWCNT-TTC (dark grey) extracted with DMF
(5 fractions, 5 mL each).
10-6
10-5
10-4
10-3
10-2
10-1
100
101
102
0
50
100
150
200
250
300
Co
un
ts
Volume [m3]
1 10 100 1000 10000
Size [nm]
Figure S19. DLS number distributions for DWCNT-TTC present in the first DMF extract.
Electronic Supplementary Material (ESI) for Chemical CommunicationsThis journal is © The Royal Society of Chemistry 2013

S19
Figure S20. XPS full-scan spectrum of DWCNT-TTC.
Electronic Supplementary Material (ESI) for Chemical CommunicationsThis journal is © The Royal Society of Chemistry 2013

S20
Figure S21. FESEM images of DWCNT-TTC at (a) 5 kX, (b) 50 kX, (c) 150 kX, and (d) 300 kX
magnifications.
Electronic Supplementary Material (ESI) for Chemical CommunicationsThis journal is © The Royal Society of Chemistry 2013

S21
100 200 300 400 500 600 700 800
0
10
20
30
40
50
60
70
80
90
100
We
igh
t / %
We
igh
t los
s d
eriv
ativ
e / %
°C-1
Temperature / °C
0.00
0.25
0.50
0.75
1.00
Figure S22. Thermogram of DWCNT-TTC under air with heating rate 10 °C min-1. The solid line
refers to weight (left axis), the dashed one to weight loss derivative (right axis).
500 1000 1500 2000 2500 3000
0.0
0.2
0.4
0.6
0.8
1.0
Norm
aliz
ed inte
nsity
Raman shift [cm-1]
100 150 200 250 300 350 1200 1250 1300 1350 1400 1450
Figure S23. Raman spectra of DWCNT-TTC (red line) and pristine DWCNT (black line). The insets
highlight the differences in the RBMs (left) and in the D bands (right) following functionalization.
Electronic Supplementary Material (ESI) for Chemical CommunicationsThis journal is © The Royal Society of Chemistry 2013
S22
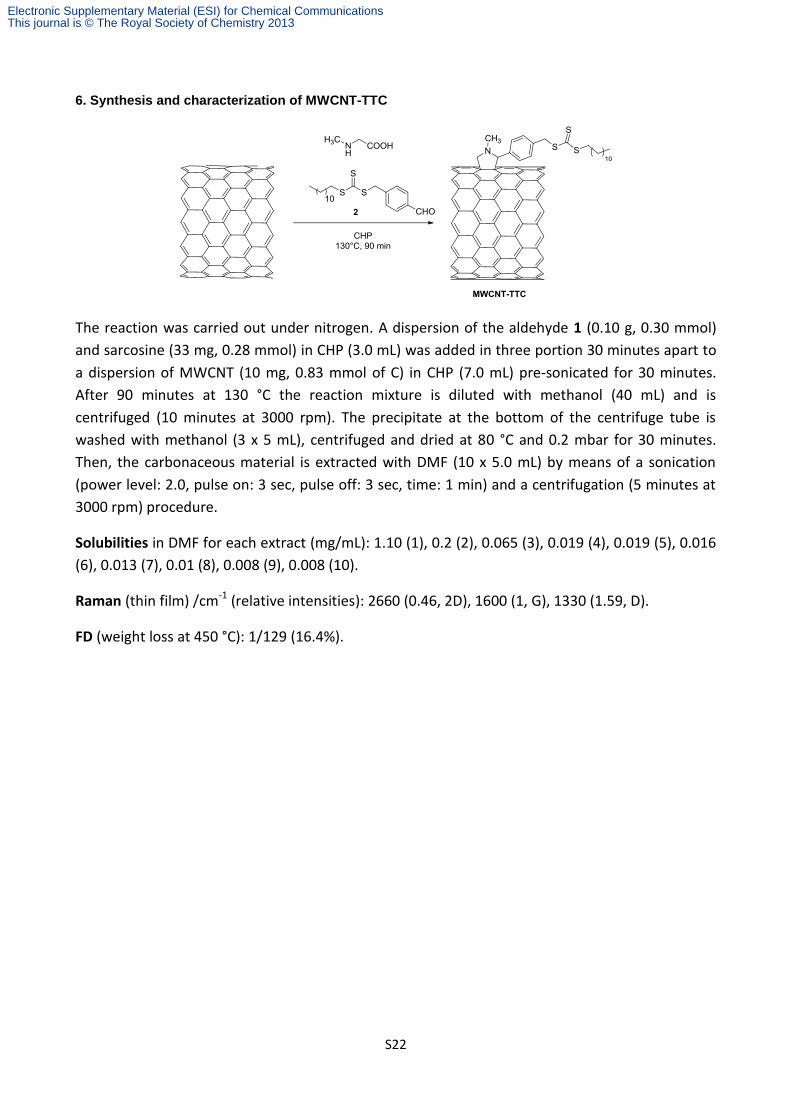
6. Synthesis and characterization of MWCNT-TTC
The reaction was carried out under nitrogen. A dispersion of the aldehyde 1 (0.10 g, 0.30 mmol)
and sarcosine (33 mg, 0.28 mmol) in CHP (3.0 mL) was added in three portion 30 minutes apart to
a dispersion of MWCNT (10 mg, 0.83 mmol of C) in CHP (7.0 mL) pre-sonicated for 30 minutes.
After 90 minutes at 130 °C the reaction mixture is diluted with methanol (40 mL) and is
centrifuged (10 minutes at 3000 rpm). The precipitate at the bottom of the centrifuge tube is
washed with methanol (3 x 5 mL), centrifuged and dried at 80 °C and 0.2 mbar for 30 minutes.
Then, the carbonaceous material is extracted with DMF (10 x 5.0 mL) by means of a sonication
(power level: 2.0, pulse on: 3 sec, pulse off: 3 sec, time: 1 min) and a centrifugation (5 minutes at
3000 rpm) procedure.
Solubilities in DMF for each extract (mg/mL): 1.10 (1), 0.2 (2), 0.065 (3), 0.019 (4), 0.019 (5), 0.016
(6), 0.013 (7), 0.01 (8), 0.008 (9), 0.008 (10).
Raman (thin film) /cm-1 (relative intensities): 2660 (0.46, 2D), 1600 (1, G), 1330 (1.59, D).
FD (weight loss at 450 °C): 1/129 (16.4%).
Electronic Supplementary Material (ESI) for Chemical CommunicationsThis journal is © The Royal Society of Chemistry 2013

S23
1 2 3 4 5
0.0
0.2
0.4
0.6
0.8
1.0
1.2
Co
nce
ntr
atio
n [m
g/m
L]
Extract
MWCNT
MWCNT-TTC
Figure S24. Concentration of pristine MWCNT (light grey) and MWCNT-TTC (dark grey) extracted with DMF
(5 fractions, 5 mL each).
10-6
10-5
10-4
10-3
10-2
10-1
100
101
102
0
50
100
150
200
Size [nm]
Co
un
ts
Volume [m3]
1 10 100 1000 10000
Figure S25. DLS number distributions for MWCNT-TTC present in the first DMF extract.
Electronic Supplementary Material (ESI) for Chemical CommunicationsThis journal is © The Royal Society of Chemistry 2013

S24
Figure S26. XPS full-scan spectrum of MWCNT-TTC.
Electronic Supplementary Material (ESI) for Chemical CommunicationsThis journal is © The Royal Society of Chemistry 2013

S25
Figure S27. FESEM images of MWCNT-TTC at (a) 5 kX, (b) 50 kX, (c) 150 kX, and (d) 300 kX
magnifications.
Electronic Supplementary Material (ESI) for Chemical CommunicationsThis journal is © The Royal Society of Chemistry 2013

S26
100 200 300 400 500 600 700 800
0
10
20
30
40
50
60
70
80
90
100
We
igh
t / %
We
igh
t los
s d
eriv
ativ
e / %
°C-1
Temperature / °C
0.00
0.25
0.50
0.75
1.00
Figure S28. Thermogram of MWCNT-TTC under air with heating rate 10 °C min-1. The solid line
refers to weight (left axis), the dashed one to weight loss derivative (right axis).
500 1000 1500 2000 2500 3000
0.0
0.2
0.4
0.6
0.8
1.0
1.2
1.4
1.6
No
rma
lize
d in
ten
sity
Raman shift [cm-1]
1250 1300 1350 1400
Figure S29. Comparison between the Raman spectra of MWCNT-TTC (red line) and pristine
MWCNT (black line). The insets highlight the differences in the D bands (right) following
functionalization.
Electronic Supplementary Material (ESI) for Chemical CommunicationsThis journal is © The Royal Society of Chemistry 2013

S27
7. Synthesis and characterization of graphite-TTC
The reaction was carried out under nitrogen. A dispersion of the aldehyde 1 (0.10 g, 0.30 mmol)
and sarcosine (40 mg, 0.50 mmol) in CHP (3.0 mL) was added in three portion 30 minutes apart to
a dispersion of graphite (10 mg, 0.83 mmol of C) in CHP (7.0 mL) pre-sonicated for 7 hours. After
90 minutes at 130 °C the reaction mixture is diluted with methanol (40 mL) and is centrifuged (10
minutes at 3000 rpm). The precipitate at the bottom of the centrifuge tube is washed with
methanol (3 x 5 mL), centrifuged and dried at 80 °C and 0.2 mbar for 30 minutes. Then, the
carbonaceous material is extracted with DMF (7 x 5.0 mL) by means of a sonication (power level:
2.0, pulse on: 3 sec, pulse off: 3 sec, time: 1 min) and a centrifugation (5 minutes at 3000 rpm)
procedure.
Solubilities in DMF for each extract (mg/mL): 0.0509 (1), 0.0299 (2), 0.0210 (3), 0.0183 (4), 0.0153
(5), 0.0143 (6), 0.0137 (7).
Raman (thin film) /cm-1 (relative intensities): 2676 (0.39, 2D), 1581 (1, G), 1332 (0.0.48, D).
FD (weight loss at 450 °C): 1/36 (51 %).
Electronic Supplementary Material (ESI) for Chemical CommunicationsThis journal is © The Royal Society of Chemistry 2013

S28
1 2 3 4 5
0.00
0.01
0.02
0.03
0.04
0.05
Co
nce
ntr
atio
n [m
g/m
L]
Extract
Graphite
Graphite-TTC
Figure S30. Concentration of pristine graphite (light grey) and graphite-TTC (dark grey) extracted with DMF
(5 fractions, 5 mL each).
Electronic Supplementary Material (ESI) for Chemical CommunicationsThis journal is © The Royal Society of Chemistry 2013

S29
Figure S31. XPS full-scan spectrum of graphite-TTC.
Electronic Supplementary Material (ESI) for Chemical CommunicationsThis journal is © The Royal Society of Chemistry 2013

S30
Figure S32. FESEM images of graphite-TTC at (a) 10 kX, (b) 50 kX, (c) 100 kX, and (d) 500 kX
magnifications.
Electronic Supplementary Material (ESI) for Chemical CommunicationsThis journal is © The Royal Society of Chemistry 2013

S31
100 200 300 400 500 600 700 800
0
10
20
30
40
50
60
70
80
90
100
We
igh
t / %
We
igh
t los
s d
eriv
ativ
e / %
°C-1
Temperature / °C
0.00
0.25
0.50
0.75
1.00
Figure S33. Thermogram of graphite-TTC under air with heating rate 10 °C min-1. The solid line
refers to weight (left axis), the dashed one to weight loss derivative (right axis).
500 1000 1500 2000 2500 3000
0.0
0.2
0.4
0.6
0.8
1.0
Norm
aliz
ed inte
nsity
Raman shift [cm-1]
1200 1250 1300 1350 1400 2500 2600 2700 2800
Figure S34. Raman spectra of graphite-TTC (red line) and pristine graphite. The insets highlight the
differences in the D band (right) and in the G’ bands (left) following functionalization
Electronic Supplementary Material (ESI) for Chemical CommunicationsThis journal is © The Royal Society of Chemistry 2013
S32
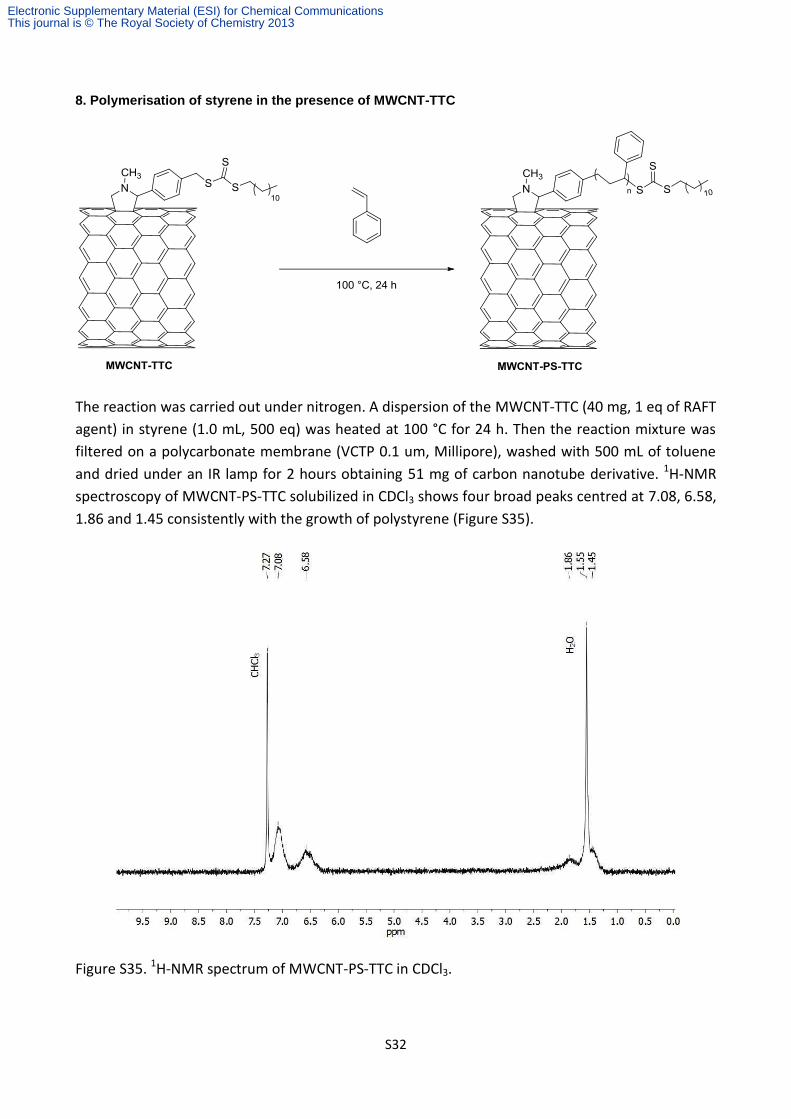
8. Polymerisation of styrene in the presence of MWCNT-TTC
The reaction was carried out under nitrogen. A dispersion of the MWCNT-TTC (40 mg, 1 eq of RAFT
agent) in styrene (1.0 mL, 500 eq) was heated at 100 °C for 24 h. Then the reaction mixture was
filtered on a polycarbonate membrane (VCTP 0.1 um, Millipore), washed with 500 mL of toluene
and dried under an IR lamp for 2 hours obtaining 51 mg of carbon nanotube derivative. 1H-NMR
spectroscopy of MWCNT-PS-TTC solubilized in CDCl3 shows four broad peaks centred at 7.08, 6.58,
1.86 and 1.45 consistently with the growth of polystyrene (Figure S35).
Figure S35. 1H-NMR spectrum of MWCNT-PS-TTC in CDCl3.
Electronic Supplementary Material (ESI) for Chemical CommunicationsThis journal is © The Royal Society of Chemistry 2013

S33
Uv-vis spectroscopy of the same solution of MWCNT-PS-TTC in CDCl3 shows a peak at 304 nm
corresponding to the TTC moiety, a residual absorbance above 400 nm consistent with the
plasmonic band of MWCNTs and an intense absorption below 280 nm corresponding to the
absorption of polystyrene.
300 400 500 600 700 800
0.0
0.2
0.4
0.6
0.8
1.0
1.2
1.4
Ab
so
rba
nc
e
Wavelenght [nm]
Figure S36. Absorption spectrum of MWCNT-PS-TTC in CDCl3.
Electronic Supplementary Material (ESI) for Chemical CommunicationsThis journal is © The Royal Society of Chemistry 2013