Embed Size (px)
Citation preview
Copyright WILEY‐VCH Verlag GmbH & Co. KGaA, 69469 Weinheim, Germany, 2014.
Supporting Information
for Adv. Mater., DOI: 10.1002/adma.201303369
Highly-Efficient Capillary Photoelectrochemical Water Splitting Using Cellulose Nanofiber-Templated TiO2
Photoanodes Zhaodong Li, Chunhua Yao, Yanhao Yu, Zhiyong Cai,* and Xudong Wang*
1
Copyright WILEY-VCH Verlag GmbH & Co. KGaA, 69469 Weinheim, Germany, 2013.
Supporting Information for Adv. Mater., DOI: 10.1002/adma.201303369
Highly-Efficient Capillary Photoelectrochemical Water Splitting Using Cellulose
Nanofiber-Templated TiO2 Photoanodes
Zhaodong Li, Chunhua Yao, Yanhao Yu, Zhiyong Cai,* Xudong Wang *
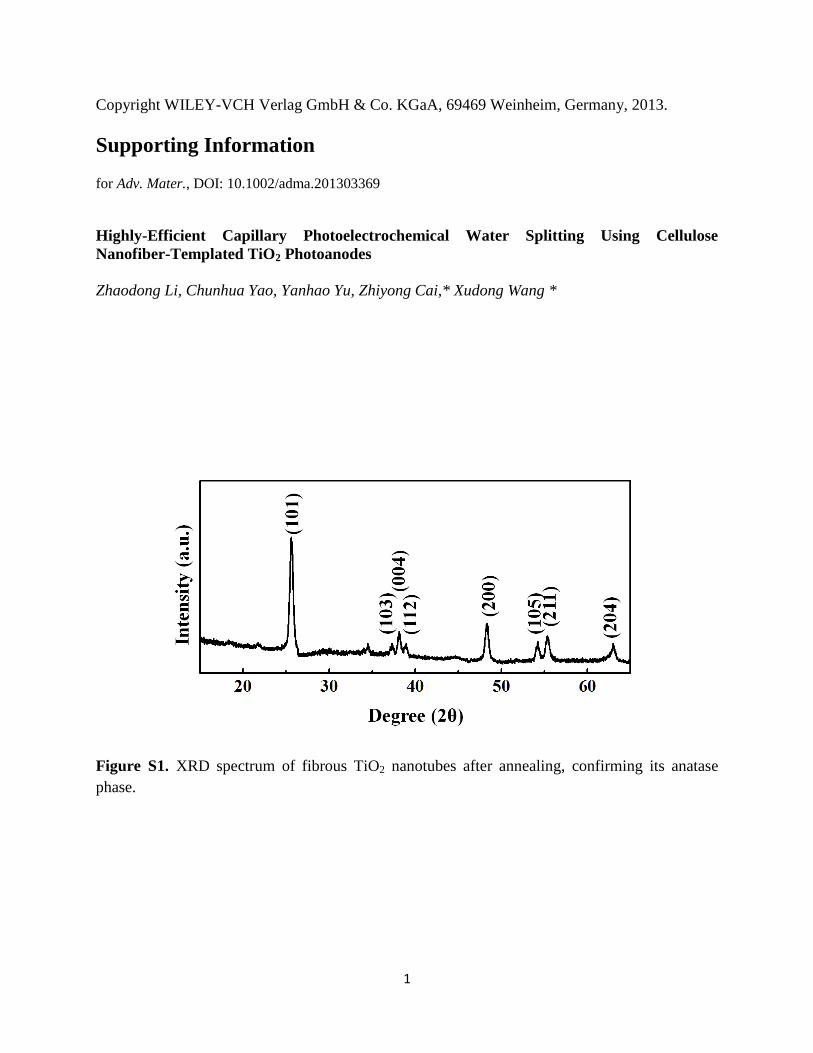
Figure S1. XRD spectrum of fibrous TiO2 nanotubes after annealing, confirming its anatase
phase.

2
Figure S2. Schematic illustration (a) and a photo (b) of capillary PEC setup.

3
Figure S3. Calculated efficiencies versus bias voltages for capillary and in-electrolyte PEC
setups using cellulose-templated TiO2 photoanodes annealed in O2 atmosphere. (a) Under Xe
lamp illumination. (b) Under AM 1.5 G illumination.
4
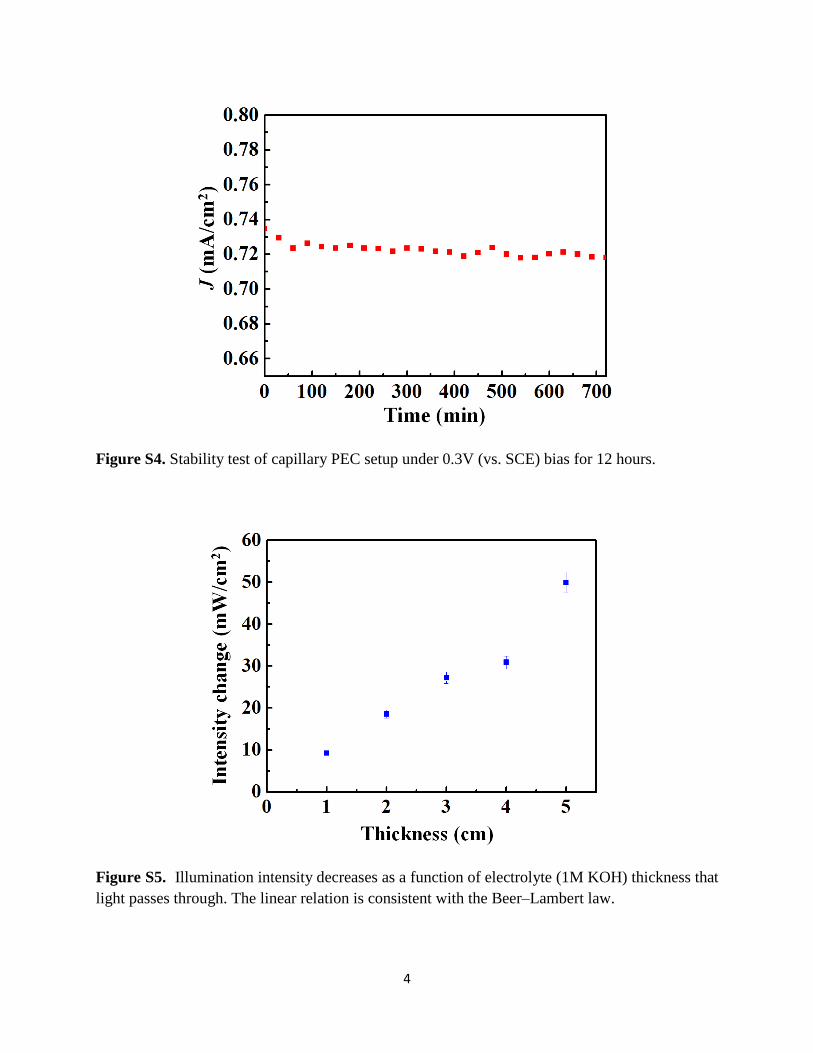
Figure S4. Stability test of capillary PEC setup under 0.3V (vs. SCE) bias for 12 hours.
Figure S5. Illumination intensity decreases as a function of electrolyte (1M KOH) thickness that
light passes through. The linear relation is consistent with the Beer–Lambert law.
5
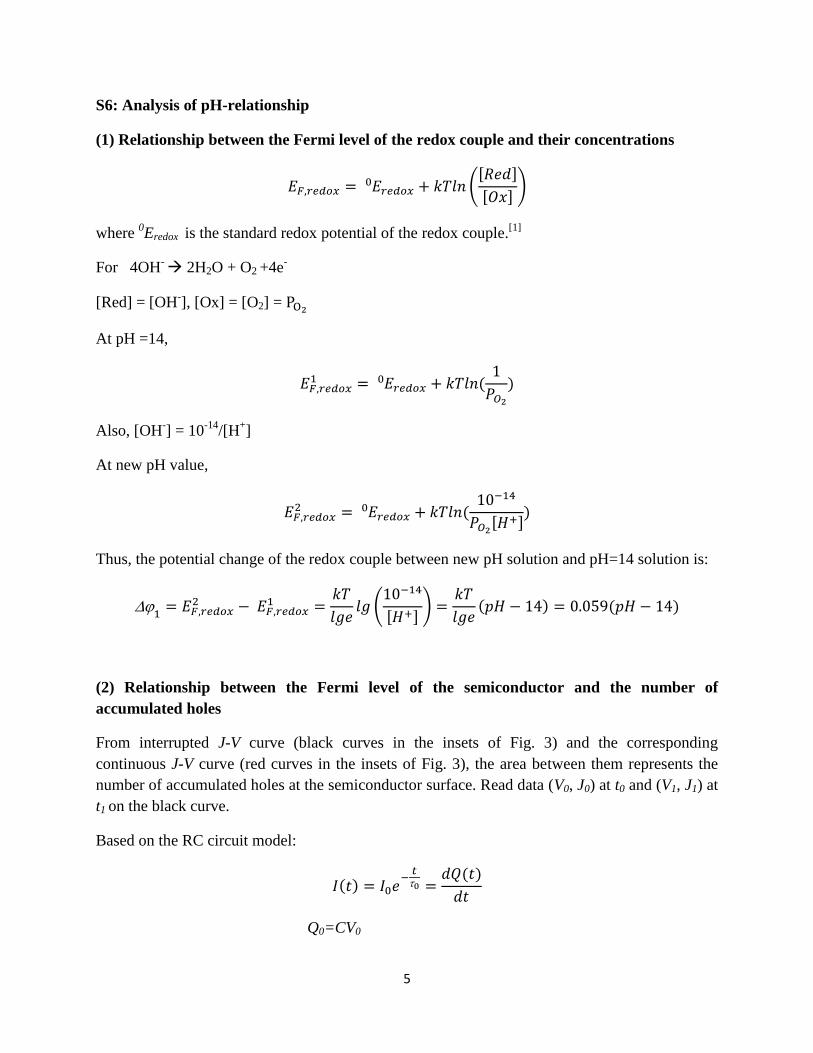
S6: Analysis of pH-relationship
(1) Relationship between the Fermi level of the redox couple and their concentrations
(
[ ]
[ ])
where 0Eredox is the standard redox potential of the redox couple.
[1]
For 4OH- 2H2O + O2 +4e
-
[Red] = [OH-], [Ox] = [O2] =
At pH =14,
Also, [OH-] = 10
-14/[H
+]
At new pH value,
[ ]
Thus, the potential change of the redox couple between new pH solution and pH=14 solution is:
(
[ ])
(2) Relationship between the Fermi level of the semiconductor and the number of
accumulated holes
From interrupted J-V curve (black curves in the insets of Fig. 3) and the corresponding
continuous J-V curve (red curves in the insets of Fig. 3), the area between them represents the
number of accumulated holes at the semiconductor surface. Read data (V0, J0) at t0 and (V1, J1) at
t1 on the black curve.
Based on the RC circuit model:
Q0=CV0

6
I0 = V0/R = Q0/RC
Thus,
Let t=t1-t0, where t can be achieved by (V1-V0 )/S, S is the scan speed = 0.05V/s.
Put (J0, 0) and (J1, t) into the equation to obtain the value of Q0 (C cm-2
)
For in-electrolyte PEC setup and capillary PEC setup, the average Q0 /e value were obtained as
8.241012
(cm-2
) and 3.431012
(cm-2
).
In our experiments, the thickness of the TiO2 nanotube film was ~10 μm. Therefore, the
concentrations of trapped holes were approximately 8.241015
(cm-3
) and 3.431015
(cm-3
) for in-
electrolyte and capillary setups, respectively.
The current spikes diminish at higher potential as a larger proportion of holes have sufficient
potential to oxidize water.[2]
Previous research also revealed that the magnitude of the current
spikes decreases with increasing positive bias. This effect was explained by bending of the
favored band due to positive potentials.[3]
Therefore, understanding the difference between the
number of accumulated holes for the two PEC setups is equivalent to investigating the difference
of band shifting using the following equations:
N1 is the carrier concentration in TiO2 photoanodes; N2 = N1+ N, where N (>0) is the change of
hole concentration determined from J-V curves ( N~51015
cm-3
). Typically, for n-type TiO2,
N1=~1017
(cm-3
). Thus,
(
) (
)
(3) Relationship between pH and accumulated charges.
The water oxidation reaction occurs when the over potential between semiconductor and
electrolyte is met. Assume the value of over potential does not change in our TiO2 - KOH system
and in the two PEC setups, the TiO2 nanotube photoanodes did not change. Thus, the calculated
potential difference for the semiconductor described in section 2 is actually the potential
difference for KOH solution.
Let
, we have:

7
(
)
For N1~1017
, N~51015
, kT~0.025eV
Then, pH ≈ 14.02
To confirm the pH effect, PEC measurement was performed within an electrolyte with a pH
value of 14.02 using the in-electrolyte setup. As shown in Figure S6, no initial current spikes
were observed.
Figure S6. J-V characteristics of cellulose-templated TiO2 photoanodes measured under
interrupted illumination using in-electrolyte PEC setup, where the pH value of electrolyte was
14.02. Inset is enlarged top regions of one Jph cycle showing the flatness of initial current.

8
Figure S7. (a) TEM image of fibrous TiO2 nanotubes obtained after 600 °C 24 hours annealing
in vacuum. (b) TEM image showing TiO2 wall with uniform thickness. (c) HRTEM image of
TiO2 wall showing good crystallinity.
9
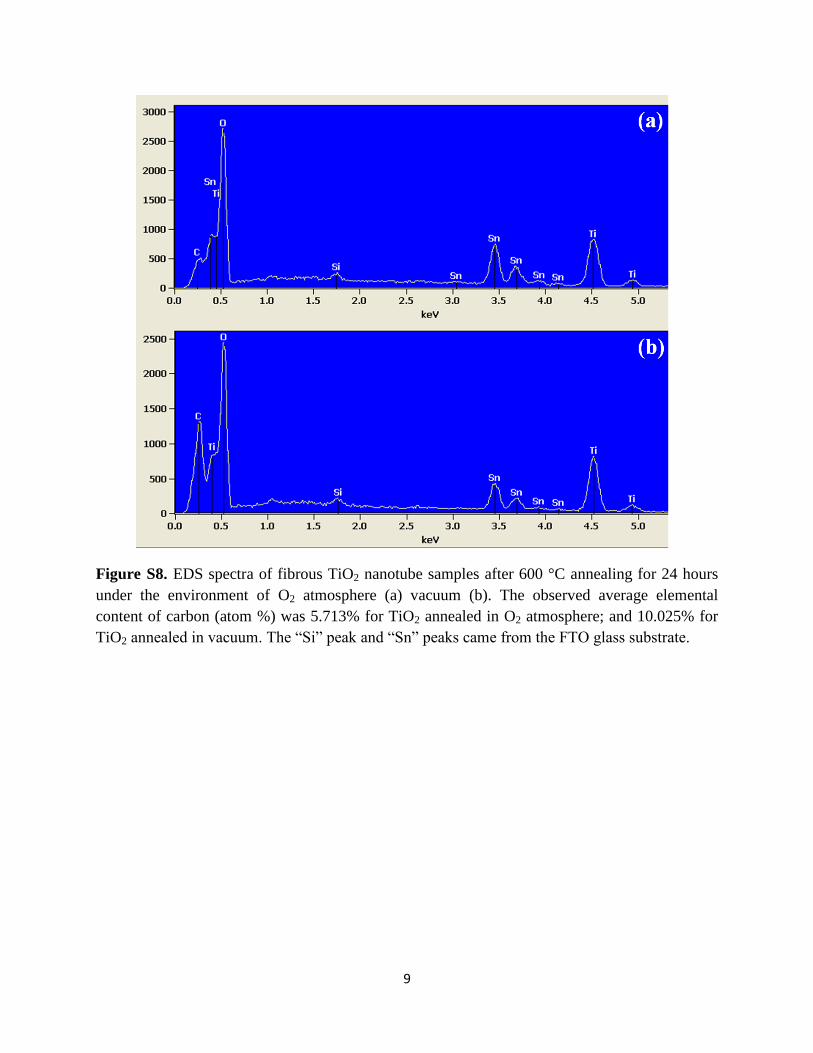
Figure S8. EDS spectra of fibrous TiO2 nanotube samples after 600 °C annealing for 24 hours
under the environment of O2 atmosphere (a) vacuum (b). The observed average elemental
content of carbon (atom %) was 5.713% for TiO2 annealed in O2 atmosphere; and 10.025% for
TiO2 annealed in vacuum. The “Si” peak and “Sn” peaks came from the FTO glass substrate.
10
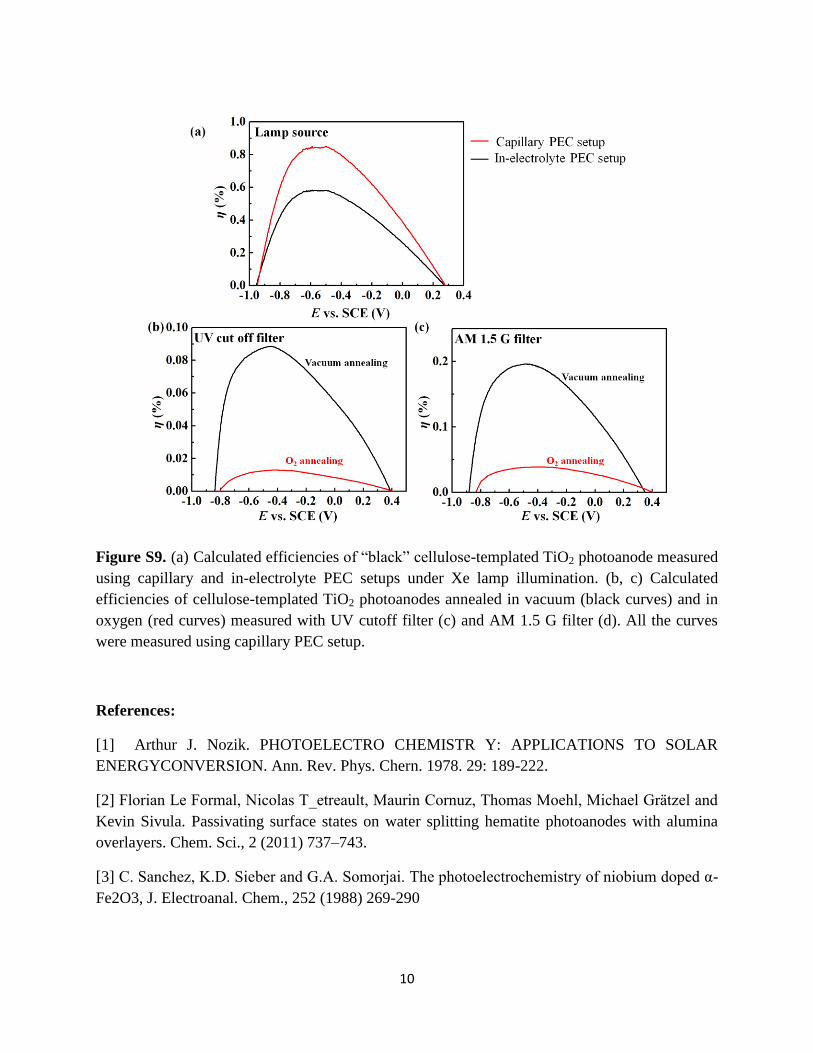
Figure S9. (a) Calculated efficiencies of “black” cellulose-templated TiO2 photoanode measured
using capillary and in-electrolyte PEC setups under Xe lamp illumination. (b, c) Calculated
efficiencies of cellulose-templated TiO2 photoanodes annealed in vacuum (black curves) and in
oxygen (red curves) measured with UV cutoff filter (c) and AM 1.5 G filter (d). All the curves
were measured using capillary PEC setup.
References:
[1] Arthur J. Nozik. PHOTOELECTRO CHEMISTR Y: APPLICATIONS TO SOLAR
ENERGYCONVERSION. Ann. Rev. Phys. Chern. 1978. 29: 189-222.
[2] Florian Le Formal, Nicolas T_etreault, Maurin Cornuz, Thomas Moehl, Michael Grӓtzel and
Kevin Sivula. Passivating surface states on water splitting hematite photoanodes with alumina
overlayers. Chem. Sci., 2 (2011) 737–743.
[3] C. Sanchez, K.D. Sieber and G.A. Somorjai. The photoelectrochemistry of niobium doped α-
Fe2O3, J. Electroanal. Chem., 252 (1988) 269-290