Embed Size (px)
Citation preview

SUPPORTING LOW EMISSIONS DEVELOPMENT IN THE ETHIOPIAN DAIRY CATTLE SECTOR
Reducing enteric methane for food security and livelihoods


Published by
the Food and Agriculture Organization of the United Nations
and
the New Zealand Agricultural Greenhouse Gas Research Centre
Rome, 2017
SUPPORTING LOW EMISSIONS DEVELOPMENT IN THE ETHIOPIAN DAIRY CATTLE SECTOR
Reducing enteric methane for food security and livelihoods

The designations employed and the presentation of material in this information product do not imply the expression of any opinion whatsoever on the part of the Food and Agriculture Organization of the United Nations (FAO) or New Zealand Agricultural Greenhouse Gas Research Centre (NZAGRC) concerning the legal or development status of any country, territory, city or area or of its authorities, or concerning the delimitation of its frontiers or boundaries. The mention of specific companies or products of manufacturers, whether or not these have been patented, does not imply that these have been endorsed or recommended by FAO or NZAGRC in preference to others of a similar nature that are not mentioned. The views expressed in this information product are those of the author(s) and do not necessarily reflect the views or policies of FAO or NZAGRC.
ISBN 978-92-5-109632-1
FAO encourages the use, reproduction and dissemination of material in this information product. Except where otherwise indicated, material may be copied, downloaded and printed for private study, research and teaching purposes, or for use in non-commercial products or services, provided that appropriate acknowledgement of FAO as the source and copyright holder is given and that FAO’s endorsement of users’ views, products or services is not implied in any way.
All requests for translation and adaptation rights, and for resale and other commercial use rights should be made via www.fao.org/contact-us/licence-request or addressed to [email protected].
FAO information products are available on the FAO website (www.fao.org/publications) and can be purchased through [email protected]
© FAO, 2017
Recommended citation:FAO & New Zealand Agricultural Greenhouse Gas Research Centre. 2017. Supporting low emissions development in the Ethiopian dairy cattle sector – reducing enteric methane for food security and livelihoods. Rome. 34 pp.

iii
Acknowledgements iv
Executive summary v
Chapter 1A CLIMATE-RESILIENT AND GREEN GROWTH PATH FOR THE ETHIOPIAN DAIRY CATTLE SECTOR 1
Chapter 2OBJECTIVES AND APPROACH 2
Chapter 3OVERVIEW OF DAIRY PRODUCTION IN ETHIOPIA 5 Chapter 4EMISSIONS AND EMISSION INTENSITIES FROM THE DAIRY CATTLE SECTOR 10 Chapter 5EXPLORING THE MITIGATION POTENTIAL IN DAIRY CATTLE PRODUCTION 16
Chapter 6PRIORITIZATION OF INTERVENTIONS TO ADDRESS ENTERIC METHANE 21
Chapter 7UNLOCKING THE ‘NO REGRETS’ OPPORTUNITIES 25
Contents

iv
Acknowledgements
This document is a product of the collaborative ef-
fort between the Food and Agriculture Organization
of the United Nations (FAO); Climate Science Centre,
Ethiopia; the New Zealand Agricultural Greenhouse
Gas Research Center (NZAGRC) and the Climate and
Clean Air Coalition (CCAC).
In collaboration with FAO and NZAGRC, the
project was jointly led by a national core team com-
prising of Zewdu Eshetu (Climate Science Centre,
Ethiopia); Million Tadesse (Climate Science Centre,
Ethiopia); Getnet Assefa (Ethiopian Institute of
Agricultural Research).
Overall project implementation, guidance and sup-
port has been provided by the Project Team including
Carolyn Opio (FAO), Henning Steinfeld (FAO), Pierre
Gerber (FAO/World Bank), Harinder Makkar (FAO),
Harry Clark (New Zealand Agricultural Greenhouse
Gas Research Centre - NZAGRC), and Victoria Hatton
(New Zealand Agricultural Greenhouse Gas Research
Centre – NZAGRC). Alessandra Falcucci (FAO), Monica
Rulli (FAO) and Juliana Lopes (FAO) provided input in
the research, modelling and analytical work.
This report has been written by Carolyn Opio
(FAO), Harry Clark (NZAGRC), Pierre Gerber (FAO/
World Bank) and Henning Steinfeld (FAO).
Finally, special thanks to the Climate and Clean
Air Coalition (CCAC), the New Zealand Government
and Food and Agriculture Organization of the
United Nations for the funding support.

v
Executive summary
This study evaluates the potential for improving milk
production while reducing enteric methane emis-
sion intensity from dairy cattle production in Ethio-
pia. The overall objective of this study is to support
Ethiopia in identifying low-cost strategies to reduce
enteric CH4 emissions while contributing to the coun-
tries’ short- to long-term social and economic devel-
opment and increasing resilience to climate change.
Benefits of a climate resilient and green growth strategy for the dairy sectorLike many other economies in transition, Ethiopia
aims to achieve middle-income status by 2025 while
developing a green economy. In 2011, the Govern-
ment of Ethiopia initiated a bold policy process to
accelerate development to attain middle-income sta-
tus by 2025, while adopting green growth pathways
that foster development and sustainability. The Cli-
mate-Resilient Green Economy (CRGE) was initiated
to protect the country from the adverse impacts of
climate change by identifying environmentally sus-
tainable economic opportunities that could acceler-
ate the country’s development. In its CRGE strategy,
the country recognizes that the pursuit of a conven-
tional development path would, among other ad-
verse effects, result in a sharp increase in GHG emis-
sions and unsustainable use of natural resources. To
avoid such negative effects, and address the dual
challenge of promoting development and reducing
GHG emissions, the green growth pathway envisag-
es limiting national greenhouse gas emission levels
to 150 million tonnes CO2 eq. instead of 400 million
tonnes CO2 eq. in 2030 under business as usual (BAU)
scenario. One of the key pillars of this strategy is to
improve livestock productivity to ensure food secu-
rity and improvement in farmers’ livelihoods while
mitigating emissions. In particular, the dairy sector
has been identified as a priority sector for the Gov-
ernment, which aims to increase Ethiopian milk pro-
duction at an average annual growth rate of 15.5%
during the Growth and Transformation Plan GTP II
period (2015-2020).
Adopting a green growth pathway for the dairy
sector could benefit Ethiopia in several ways:
• Milk production from the cattle sector remains
one of the most important economic sectors in
Ethiopia. The dairy sector contributes considera-
bly to the national Gross Domestic Product (GDP).
It has a share of 40% in the agricultural GDP and
12–16% in the national GDP. The latter is about
twice as high as it is in neighboring countries in
Eastern Africa, mainly because of the significantly
higher share of agriculture in the Ethiopian GDP.
• There are about 11.4 million livestock producing
households in Ethiopia (Central Statistics Agency
(CSA) of Ethiopia, 2013). Depending on the pro-
duction zone, cattle are the dominant species in
70% to 90% of livestock producing households,
depending on the production zone, and thus
dominate smallholder income generation and
milk production in all production zones. In addi-
tion, smallholder farmers represent about 85%
of the population and are responsible for 98% of
the milk production. Considering the importance
of the dairy cattle sector enterprise to rural liveli-
hoods and its potential role in poverty reduction,
implementing a low-emissions development strat-
egy for the dairy sector through the adoption of
performance-enhancing technologies is expected
to significantly increase milk yields with net bene-
fits in the short and medium term producers.
• Rapidly increasing population size with a grow-
ing rate of urbanization is driving the growth in
demand for dairy products in Ethiopia. Current
human population of Ethiopia is estimated at
about 93 million and is increasing at a rate of 3%
per annum. Currently, Ethiopia’s milk consump-
tion is only 19 liters per person per year – 10%

vi
of Sudan’s and 20% of Kenya’s – but urbanization
is driving up consumption: for example, per capita
consumption in Addis Ababa is currently 52 liters
per person. At the same time, the sector is unable to
meet this expanding demand as a result of the large
productivity gap; average annual milk yield per cow
ranges from 270kg - 3600kg. As a consequence, a
proportion of the local demand for dairy products is
currently being met through imports; between 2011
and 2013, Ethiopia spent approximately US$ 11–15
million in foreign exchange on imports of milk and
milk products.
• With an economy highly dependent on agriculture,
Ethiopia is likely to suffer disproportionately from
the impacts of climate change. Given that 80% of
the population depends on agriculture for their
livelihoods, increasing the resilience of agriculture
is a priority for Ethiopia. Current climate variability
is already imposing a significant challenge to Ethi-
opia by affecting food security, water and energy
supply, poverty reduction and sustainable develop-
ment efforts, as well as by causing natural resource
degradation and natural disasters. Productivity-en-
hancing technologies are also important in increas-
ing the resilience of production systems and house-
holds to climate change.
Emissions and emission intensities from the dairy cattle sectorMilk production from dairy in Ethiopia takes place
in 4 main production systems: (i) mixed crop-live-
stock systems; (ii) pastoral and agro-pastoral systems;
(iii) small-scale commercial systems; and (iv) medi-
um-scale commercial systems.1
This study found that in 2013, the dairy cattle
sector in Ethiopia emitted 116.3 million tonnes
carbon dioxide equivalent (CO2 eq.). Within this,
enteric methane represents about 87% of the total
GHG emissions from dairy production, equivalent to
101.2 million tonnes CO2 eq. Emissions associated
with the management of stored manure (CH4 and
N2O) contributes an additional 14.4 million tonnes
CO2 eq., 12.3% of the total GHG emissions from the
dairy cattle sector.
The two dairy systems (rural mixed crop-livestock
system and the agro-pastoral/pastoral systems) are
responsible for the bulk of the emissions; 56% and
43% of the total GHG emissions associated with the
production of milk, respectively. The small-scale and
medium-scale commercial production systems make
small contributions to the total GHG emissions, 1.1%
and 0.2%, respectively.
The results indicate that the emission intensity
of milk in Ethiopia is on average 24.5 Kg CO2 eq./
kg FPCM.2 Emission intensity were on average 44.6,
18.9, 8.7 and 3.8 kg CO2 eq./ kg FPCM for mixed
crop-livestock, pastoral and agro-pastoral, small-
scale commercial; and medium-scale commercial
systems, respectively.
There is a strong inverse correlation between the
emission intensity and the average annual milk yield
per cow in dairy production systems in Ethiopia.
Increasing milk production from 250 to 900 kg per
cow can result in a reduction in emissions intensity
from 45 kg CO2 eq./kg FPCM to 12 kg CO2 eq./kg
FPCM, i.e. 73% decrease in emission intensity com-
pared to baseline.3
Options for improving productivity and enteric methane mitigationImproving animal and herd productivity is one of the
key pathways to reduce enteric CH4 emissions per
unit of product. Reducing enteric CH4 via increasing
productivity can have a monetary value; several ac-
tivities that reduce methane emissions have low or
negative economic cost when the value of the gains
in output (in product) is considered.
Research has already identified several technol-
ogies that if comprehensively applied throughout
the sector would make a rapid and important con-
tribution to improving the technical performance
and profitability of production while reducing GHG
emissions. Improved practices and technologies such
as strategic supplementary feeding, and improving
the diet quality, adequate animal health control,
and genetic improvement of animals are some of the
techniques that can improve dairy productivity and
reduce emission intensity.
1 See section 3 for a detailed description of dairy production systems in Ethiopia.2 Fat-and-protein corrected milk 3 Baseline defined as a measurement or description of a scenario used as a basis for comparison.

vii
This assessment evaluated interventions for the
main dairy production systems. The following crite-
ria were used to select interventions:
• Interventions had to have potential for improv-
ing productivity while at the same time reducing
enteric CH4 emissions per unit of output.
• Interventions had to be feasible in the short or
medium term. Feasibility was first determined by
sectoral experts and selected interventions had to
have already been implemented or in use at least
at farm level in Ethiopia.
A team of national experts identified key areas
to address low-productivity in dairy systems includ-
ing (i) improving the quality and availability of feed
resources; (ii) strategic feeding and supplementation
to address the constraint of feed seasonality; (iii)
improved herd management and animal health
interventions; and (iv) improving the genetic poten-
tial of local breeds. Within this broad categorization,
7 single interventions and 1 ‘package’ consisting of
a combination of single interventions were assessed
in this study.
Mitigation of enteric methane can play an important role in food security and climate strategiesThis work shows that significant reductions in meth-
ane emission intensity can be realized through the
adoption of existing and proven technologies and
practices. With the application of a combined set of
interventions results in a reduction potential in abso-
lute enteric methane of about 9.6 million tonnes of
CO2 equivalent, or 10% of the baseline enteric meth-
ane emissions and a corresponding increase in milk
production by 170%.
Implementing the individual interventions would
reduce enteric CH4 intensity by between 15% and
62% (kg CO2 eq./kg FPCM), depending on the inter-
vention and production system. These emissions
reduction potentials can be considered conservative,
in that the analysis did not assume any major chang-
es in technology or change in production systems but
focused on reducing the efficiency gap between pro-
ducers in the same production system. All interven-
tions returned a positive productivity outcome with
increases in production ranging between 8% - 180%.
More significant reductions in emissions can be
achieved through the combination of herd and
health management, genetics, and nutrition and
feeding management strategies. This study esti-
mates a reduction potential of 36%-65% in emission
intensity and an increase in production (expressed
in FPCM) of 62% -225% compared to the baseline
situation.
Prioritization of interventions for enteric methaneFrom the analysis, all interventions preselected and
assessed not only yield mitigation benefits but also
provide production and financial benefits. The in-
terventions assessed all returned a benefit-cost ra-
tio greater than 1 (ranging between 1.6 and 3.2). A
preliminary ranking of interventions per production
systems to identify those with high reduction poten-
tial, increased production and high economic return
was undertaken to provide an indication of what is
workable.
The rural mixed crop-livestock system, the use
of improved breeds, urea feed-based interventions
and disease control had moderate to high impact;
moderate impact on emission reduction and returns
on investment and a high impact on productivity.
Only two interventions (supplementation with legu-
minous shrubs and trypanosomosis control) were
tested in the pastoral/agro-pastoral systems; the
control of trypanosomosis in the extensive systems
appears to be the most effective intervention in
reducing enteric methane emission intensity, while
having a positive impact on production and returns
to farmers.

1
CHAPTER 1
A climate-resilient and green growth path for the Ethiopian dairy cattle sector
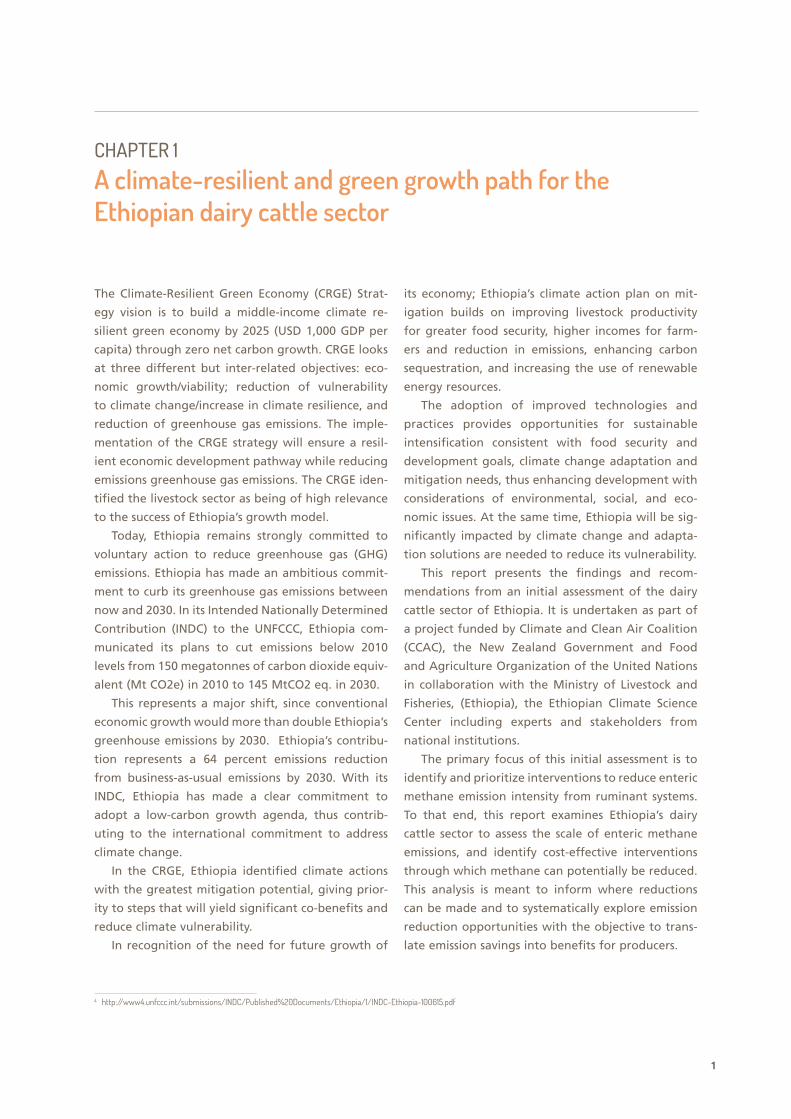
The Climate-Resilient Green Economy (CRGE) Strat-
egy vision is to build a middle-income climate re-
silient green economy by 2025 (USD 1,000 GDP per
capita) through zero net carbon growth. CRGE looks
at three different but inter-related objectives: eco-
nomic growth/viability; reduction of vulnerability
to climate change/increase in climate resilience, and
reduction of greenhouse gas emissions. The imple-
mentation of the CRGE strategy will ensure a resil-
ient economic development pathway while reducing
emissions greenhouse gas emissions. The CRGE iden-
tified the livestock sector as being of high relevance
to the success of Ethiopia’s growth model.
Today, Ethiopia remains strongly committed to
voluntary action to reduce greenhouse gas (GHG)
emissions. Ethiopia has made an ambitious commit-
ment to curb its greenhouse gas emissions between
now and 2030. In its Intended Nationally Determined
Contribution (INDC) to the UNFCCC, Ethiopia com-
municated its plans to cut emissions below 2010
levels from 150 megatonnes of carbon dioxide equiv-
alent (Mt CO2e) in 2010 to 145 MtCO2 eq. in 2030.
This represents a major shift, since conventional
economic growth would more than double Ethiopia’s
greenhouse emissions by 2030. Ethiopia’s contribu-
tion represents a 64 percent emissions reduction
from business-as-usual emissions by 2030. With its
INDC, Ethiopia has made a clear commitment to
adopt a low-carbon growth agenda, thus contrib-
uting to the international commitment to address
climate change.
In the CRGE, Ethiopia identified climate actions
with the greatest mitigation potential, giving prior-
ity to steps that will yield significant co-benefits and
reduce climate vulnerability.
In recognition of the need for future growth of
its economy; Ethiopia’s climate action plan on mit-
igation builds on improving livestock productivity
for greater food security, higher incomes for farm-
ers and reduction in emissions, enhancing carbon
sequestration, and increasing the use of renewable
energy resources.
The adoption of improved technologies and
practices provides opportunities for sustainable
intensification consistent with food security and
development goals, climate change adaptation and
mitigation needs, thus enhancing development with
considerations of environmental, social, and eco-
nomic issues. At the same time, Ethiopia will be sig-
nificantly impacted by climate change and adapta-
tion solutions are needed to reduce its vulnerability.
This report presents the findings and recom-
mendations from an initial assessment of the dairy
cattle sector of Ethiopia. It is undertaken as part of
a project funded by Climate and Clean Air Coalition
(CCAC), the New Zealand Government and Food
and Agriculture Organization of the United Nations
in collaboration with the Ministry of Livestock and
Fisheries, (Ethiopia), the Ethiopian Climate Science
Center including experts and stakeholders from
national institutions.
The primary focus of this initial assessment is to
identify and prioritize interventions to reduce enteric
methane emission intensity from ruminant systems.
To that end, this report examines Ethiopia’s dairy
cattle sector to assess the scale of enteric methane
emissions, and identify cost-effective interventions
through which methane can potentially be reduced.
This analysis is meant to inform where reductions
can be made and to systematically explore emission
reduction opportunities with the objective to trans-
late emission savings into benefits for producers.
4 http://www4.unfccc.int/submissions/INDC/Published%20Documents/Ethiopia/1/INDC-Ethiopia-100615.pdf

2
This study seeks to identify and evaluate low-
cost options that Ethiopia can implement in the
short-to-medium term geared towards improving
productivity in dairy production systems, reducing
enteric methane emissions and fostering economic
development.
Three main methodological steps were employed in
this study (Figure 2.1):
1) Definition of the baseline scenario. Including
the selection and characterization of production
system, estimation of GHG emissions and emis-
sion intensity, and identification of key drivers of
low productivity and emission intensity.
2) Explore the mitigation potential. Identifica-
tion of system specific interventions consistent
with development objectives for improving pro-
ductivity, addressing enteric methane emissions
and assessment of the mitigation potential.
3) Prioritization of interventions. Prioritization
of interventions is undertaken by drawing on
modeling results and cost-benefit analysis. Three
criteria - methane abatement, the impact on
production and profitability for farmers - are
used in the prioritization of interventions.
A key focus of this work is on interventions that
reduce emission intensity while maintaining or
increasing production such that climate change and
productivity improvement can be pursued simulta-
neously (Box 1).
The analysis focuses on the dairy cattle sector, a
strategic sector of importance to Ethiopia that was
jointly identified in consultation with front-line
government ministries e.g. ministry of livestock,
environment, academia institutions, and public and
private stakeholders.
The study undertakes biophysical modeling
and scenario analysis using the Global Livestock
Environmental Assessment Model (GLEAM) to pro-
vide a broad perspective of opportunities and the
potential achievable goals in terms of productivity
gains and emission intensity reduction in the dairy
sector (Box 2).
Figure 2.1: Process framework for the identification and prioritization of interventions to address enteric methane
CHAPTER 2
Objectives and approach

SUPPORTING LOW EMISSIONS DEVELOPMENT IN THE ETHIOPIAN DAIRY CATTLE SECTOR
3
Box 1: Absolute emissions versus emission intensity
Box 2: Modelling GHG emissions from dairy production systems in Ethiopia
The primary drivers of enteric methane emissions are feed
intake, and fermentation characteristics of that feed in
the rumen. In general, management practices that in-
crease the proportion of feed used to produce meat or
milk rather than maintain the animal, reduce the amount
of methane per unit of animal product produced (emis-
sions intensity).
Higher individual animal productivity generates more
animal product and more methane per animal but as a
smaller proportion of the feed consumed is used to main-
tain the animal, emissions intensity is reduced. The same
amount of animal product can be produced with few-
er methane emissions if producers keep fewer animals.
More intensive production provides flexibility to control
emissions and generally improves profitability. However,
increasing feed intake per animal will always lead to an
increase in total farm methane production unless the
total number of animals is reduced. In low and medi-
um income countries, the concept of emission intensi-
ty remains the most attractive mitigation route because
it allows for the harnessing of synergies between food
security and development objectives and climate change
mitigation goal. Emissions intensity reductions will reduce
absolute emissions below business-as-usual.
In this study, the Global Livestock Environmental Assess-
ment Model (GLEAM; Gerber et al. 2013) is the main
analytical tool used to assess the emissions and emis-
sion intensities in the baseline scenario and to assess the
emission reduction potentials of selected interventions.
GLEAM is a spatial model of livestock production
systems that represents the biophysical relationships
between livestock populations (FAO, 2007, 2011a), pro-
duction, and feed inputs (including the relative contri-
bution of feed types—forages, crop residues, and con-
centrates—to animal diets) for each livestock species,
country, and production system. The production param-
eters and data in GLEAM have been drawn from an ex-
haustive review of the literature and validated through
consultation with experts during several joint projects
and workshops. The relationships between GHG emis-
sions and production have also been cross validated for
ruminants across a range of regions and studies, and
published reports on GLEAM have also been through rig-
orous peer review (Opio et al. 2013; Gerber et al. 2013).
GLEAM works at a definition level of 1 km2, the spatially
explicit GLEAM model framework allows the incorpora-
tion of heterogeneity in emissions, emission reductions
and production responses.
The model was further developed to meet the needs
of this study. The dairy production systems in GLEAM
were further refined to reflect the specificities of the
dairy cattle production systems in Ethiopia and the da-
tabase of production systems parameters was updated
with more recent and system specific information and
data on populations, performance parameters, feeding
systems, manure management, etc. taken from national
databases.
The GLEAM framework is used to characterize the
baseline production and GHG emission output of the
dairy production systems. Emissions and emission inten-
sities are reported as CO2 eq. emissions, based on 100-
year global warming potential (GWP100) conversions
factors; methane = 34, nitrous oxide = 298.
The abatement potentials for each practice were
calculated by estimating the changes from the baseline
GHG emissions, following the application of each system
specific intervention. To specify each abatement practice
within GLEAM, it was necessary to incorporate addition-
al data and information on the impacts associated with
the application of the interventions. These data were ob-
tained from a range of literature sources and databases
as elaborated in the supplementary information.
The calculations are performed twice, first for the
baseline scenario and then for the mitigation scenario.
Emission intensity reductions and changes in productivity
achieved can then be compared to those under baseline
scenario.
Source: http://www.fao.org/gleam/en/

SUPPORTING LOW EMISSIONS DEVELOPMENT IN THE ETHIOPIAN DAIRY CATTLE SECTOR
4
The scenario analysis uses the outputs of the bio-
physical analysis combined with information taken
from published literature, existing studies and expert
knowledge on potential impacts of each intervention
on herd performance and production to quantify the
emission intensity reduction potential.
The range of options evaluated (referred to as
“interventions”) were selected by national sector
experts based on their potential for methane emission
intensity reductions, their impact on yield and their
feasibility in terms of political, social, institutional, and
other preconditions. The interventions identified are
presented individually and with a subset evaluated as a
‘package’, in order to demonstrate to stakeholders how
a combination of interventions would impact reduction
potential and productivity gains. It also gives the
ability to assess this flexibly within the framework
of political conditions, available resources, and other
considerations. Figure 2.2 presents the generic steps
undertaken in the identification of interventions and
assessment of their impacts on enteric methane emis-
sions and production.
For purposes of prioritization of interventions,
the assessment considered three aspects: the emis-
sion reduction potential, the production impacts and
the profitability for farmers assessed by quantifying
the return to farmers per dollar invested. The impacts
on enteric methane emissions and production were
assessed using the GLEAM model described above.
The cost-benefit analysis of selected interventions
to assess the profitability for farmers were quantified
using typical farm input and output costs provided
by local experts and are presented as a ratio of the
$ returned per $ invested. The purpose of the cost
benefit analysis is to guide decisions on which inter-
ventions would be profitable for farmers.
Consultation withexperts to identify
system specific interventions
Literature reviewto provide
evidence and data of impacts
List of technologies and practices
List of parameters and quantified impacts
Quantified impacts for single and packages of interventions:
El reduction potential (kg C02 eq./kg FPCM)and productivity change (kg FPCM)
Quantified emissionreduction impacts
1.
2.
Model impact on emissions and
emission intensitiesand productivity
3.
Select and design intervention
packages and modelling of impact
4.
Figure 2.2: Process for exploring mitigation impacts

5
Ethiopia has the largest national livestock population
in Africa. Recent data estimates 54 million cattle, of
which 32.6 million are involved in the dairy sector. The
vast majority of the cattle are mainly kept by small-
holders. Of the total 16.5 million Ethiopian farms with
cattle, 95% are holdings with less than five head of
cattle. And 5% of the farms have 10 or more head of
cattle; almost one million farms are in this category.
Indigenous stock produce 97% of the milk pro-
duced by cattle and the remaining 3% comes from
improved exotic crosses and pure grade exotic cattle.
These smallholders keep additional cattle to provide
traction power, to produce meat and manure, and to
serve as an insurance in times of drought or a house-
hold emergency. With these multiple functions, cattle
serve as a vehicle for improving food security and
better livelihood of the rural population.
Rapidly increasing population with a growing rate
of urbanization is resulting in a shift in demand for
dairy products. Current human population of Ethiopia
is estimated at about 93 million and is increasing at a
rate of 3% per annum (Central Statistics Agency, CSA
2014). Dairy development can lead to income gen-
erating activities in the rural areas increasing farm
incomes and employment opportunities.
Milk production in Ethiopia takes place within
four main dairy production systems: medium-scale
commercial, small-scale commercial, rural mixed
crop-livestock dairy system and pastoral/agro-pasto-
ral. The latter two systems are classified as rural dairy
production systems.
Map 3.1 illustrates the distribution of dairy cattle
herd across the regions. The Ethiopian dairy cattle
population is distributed over all regions of the coun-
try. The four regions with the greatest number of
dairy cattle are shown in Map 3.1 below. Almost all
of the cows in Tigray, Amhara, Oromia and Southern
Nations Nationalities and People region (SNNP) are
located in highlands. The highlands are also the
regions with market-oriented milk production.
There is however considerable diversity within
these four high level categories of production sys-
tems.
• Pastoralism is the major system of milk production
in the lowlands. It is estimated that about 36%
of the dairy population are found in the pastoral
areas. Due to the erratic nature of rainfall that
results in shortage of feed availability, milk pro-
duction in the agro-pastoral/pastoral system is low
and highly seasonal. The reliance of the agro-pas-
toral and pastoral systems on the overgrazed nat-
ural resource base makes them most vulnerable to
climate change hence interventions that improve
natural grassland management can increase pro-
ductivity and resilience at the same time targeting
these systems are most likely to increase their
adaptive capacity.
• The rural mixed crop-livestock dairy system is
part of the subsistence farming systems that are
mainly concentrated in the highlands. It is found
in the mid-and high altitude agro-ecological zones
where cereals and cash crops are dominant com-
ponents of the farming systems. It is estimated
that 63% of the dairy cattle population are found
in the mixed crop-livestock dairy system and about
72% of the total milk production in Ethiopia is
produced on these smallholder farms. In this sys-
tem, cattle are used for traction and milk is mainly
consumed in the household or sold to neighbors.
Surplus milk is converted to butter or ghee and
fermented dairy products such as local types of
yoghurt and soft cheese.
• The small-scale and medium-scale commercial pro-
duction systems are on the other hand located
mainly in close proximity to towns and cities. Pro-
duction is market oriented and specifically targets
consumers in urban areas and producers tend to
have a better understanding of dairy manage-
ment. Farmers use part or all of their land to grow
fodder crops for their dairy cattle. The animals do
CHAPTER 3
Overview of dairy production in Ethiopia

SUPPORTING LOW EMISSIONS DEVELOPMENT IN THE ETHIOPIAN DAIRY CATTLE SECTOR
6
Map 3.1: Share of dairy cattle herd by production system and region
98.9%
46.4%
98.7%
83.8%
98.7%100%
100%
Somali
Oromia
Afar
Amhara
SNNPR
Tigray
Gambela
Beneshangul Gumu Dire Dawa
HarariAddis Ababa
Rural mixed crop-livestock
52.1%
14.9%
100%
100%
100%
Somali
Oromia
AfarAmhara
SNNPR
Tigray
Gambela
Dire Dawa
HarariAddis Ababa
Beneshangul Gumu
Pastoral and agro-pastoral
1.2%
1.4%
0.9%
1.2%
Somali
Oromia
Afar
Amhara
SNNPR
Tigray
Gambela
Beneshangul Gumu Dire Dawa
HarariAddis Ababa
Small-commercial dairy
0.2%
0.1%
1.1%
0.4%
0.1%
Somali
Oromia
Afar
Amhara
SNNPR
Tigray
Gambela
Dire Dawa
HarariAddis Ababa
Beneshangul Gumu
Medium-commercial dairy
not provide draft but their manure is used as fer-
tilizer. Milk is the main source of farm income and
the herd is dominated by improved or crossbreed
cattle.
Table 3.1 provides a summarized description of
the characteristics of dairy production systems in
Ethiopia.
Based on the above classification and characteri-
zation, milk production systems represent a gradually
increasing level of management and investment. The
higher levels of management and investments are
found near the main urban markets where the higher
milk prices can be obtained.
Ethiopia produces approximately 3.8 million litres
of milk from 12 million milking cows – an average of
1.7 litres per cow per day over an average lactation
period of 180 days. In terms of production system
contribution to milk production, the rural mixed
crop-livestock dairy system produces the largest share
of milk, contributing 72% of total milk supply from
65% of milking animals. Pastoral/agro-pastoral sys-
tems and the market-oriented systems contribute
24% and 4% of the total milk, respectively, with 34%
and 1% of the milking cows, respectively (Figure 3.1).
The generally low productivity of dairy animals
(Figure 3.2) and low number of high-yielding geno-
types results in a shortage of supply of dairy products
relative to demand and increases the dependence on
imports. Milk yield performance of cows as reported
by farmers varies widely across the different dairy
production systems, mainly due to differences in
breed and management. It ranges from 1.5 litres per
cow per day in pastoral and agro-pastoral systems to
20 litres per cow per day in medium-scale commercial.

SUPPORTING LOW EMISSIONS DEVELOPMENT IN THE ETHIOPIAN DAIRY CATTLE SECTOR
7
Figure 3.1: Production system milk yield and contribution to milk production
Note: Size of bubble: share of milking cows represents the share of milking cows in each system. 65% (rural mixed crop-livestock); 34% (pastoral/agro-pastoral) and 1% (market oriented).
-5
0
5
10
15
20
25
0 10 20 30 40 50 60 70 80 90
Ave
rage
milk
yie
ld p
er c
ow p
er d
ay
Contribution to milk production (%)
Medium-scale commercial
Small-scale commercial
Pastoral/agro-pastoral
Rural mixed crop-livestock
Figure 3.2: Average milk yield per lactation (kg per cow per lactation) by production system
360225
885
3000
432270
1062
3600
504315
1239
4200
Rural mixed crop-livestock
Pastoral andagro-pastoral system
Small commercial dairy Medium commercial dairy
Lactation period 5 months Lactation period 6 months Lactation period 7 months
0
500
1000
1500
2000
2500
3000
3500
4000
4500
Ann
ual m
ilk y
ield
per
cow
(kg)

SUPPORTING LOW EMISSIONS DEVELOPMENT IN THE ETHIOPIAN DAIRY CATTLE SECTOR
8
Table 3.1: Summary of dairy production systems in Ethiopia
Production system Characteristics Description
MIXED CROP-LIVESTOCK SYSTEMS
Traditional crop-livestock farms inrural areas
Average size Smallholder farms, average of 4 cows per household
Feed-base Extensive natural pasture based grazing system, roadside grazing, cut and carry and crop residues
Genotype Largely indigenous Zebu breed
Health Mortality rate – 4%, high morbidity due to internal and external parasites. Vaccination for some important diseases
Reproductive strategy Uncontrolled natural mating widespread, calving season all year
Productivity About 400-680 kg milk per lactation
Level of investment Very low investment except land opportunity cost, little or no external inputs
Crop-livestock farms withintensive cropping
Average size Average of 5 cows per household
Feed-base Extensive natural pasture based grazing system, roadside grazing, cut and carry feeding systems, crop residues and supplementary feeds (home-made concentrate) fed to crossbred cattle
Genotype Indigenous Zebu cattle and cross-bred cattle
Health High mortality rate and morbidity due to internal and external parasites
Reproductive strategy Natural mating with communal bullsLimited artificial insemination
Productivity Indigenous cattle: milk yield 1.2 kg per cow/dayCrossbred: 6 kg per cow/day
Level of investment Low level of investment
SMALL-SCALE COMMERCIAL LIVESTOCK SYSTEMS
Intensified crop-livestock farmsin rural areas
Average size Smallholder farms average of 4 cows per household
Feed-base Limited grazing, improved forage for cut and carry, crop residues, home-made concentrate (wheat bran, wheat middlings, oilseed cake)
Genotype Indigenous Zebu cattle and cross-bred cattle
Health Mortality rate (5%), morbidity (due to internal parasites). Vaccination done
Reproductive strategyNatural mating with bullsArtificial insemination also practised. Early weaning practised
Productivity 460-782 kg milk per cow per lactation period
Peri-urban farms
Average size Average number of 5 cows per household
Feed-base Crop residues, supplementary feed or homemade concentrate of wheat, wheat middlings, oilseed cake, molasses, bran minerals and salts
Genotype Crossbred and grade dairy cattle
Health Common health problems: mastitis, infertility, bovine tuberculosis. Low mortality, vaccination undertaken.
Reproductive strategy Artificial insemination
Productivity Average daily milk yield per cow 10-12 kg per cow per day
Level of investment Medium level of investment ( purchase of improved breed, inputs such as feed, veterinary drugs, services, labor)
(cont.)

SUPPORTING LOW EMISSIONS DEVELOPMENT IN THE ETHIOPIAN DAIRY CATTLE SECTOR
9
Production system Characteristics Description
MEDIUM-SCALE COMMERCIAL LIVESTOCK SYSTEMS
Urban farms in secondary farms
Average size Average number of 5-10 cows per household
Feed-base Supplementary feed or concentrate , purchased fodder (hay) and crop residues
Genotype Pure exotic and grade dairy cattle
Health Common health problems: mastitis, infertility, bovine tuberculosis. Low mortality, vaccination undertaken
Reproductive strategy Artificial insemination and limited natural mating
Productivity Average daily milk yield per cow 10-12 kg per cow per day
Level of investment Medium level of investment ( purchase of improved breed, AI, inputs such as feed, veterinary drugs and services, labor)
Intra-urban dairy farmsin Addis Ababa
Average size Average number: 10-50 cows per farm
Feed-base Supplementary feed or concentrate, mineral and salt, molasses, purchased fodder (hay) and crop residues
Genotype Crossbred, Pure exotic and grade dairy cattle
Health Common health problems: mastitis, infertility, bovine tuberculosis. Low mortality and morbidity, vaccination undertaken
Reproductive strategy Artificial insemination and limited natural mating
Productivity Average daily milk yield per cow 15-20 kg per cow per day
Level of investment Medium level of investment ( purchase of improved breed, AI, inputs such as feed, veterinary drugs and services, labor)
Specialized dairy farms
Average size Average number: 50 cows per farm
Feed-base Cultivated forage and legumes, concentrate feed, hay, silage
Genotype Pure exotic and grade dairy cattle
Health Common health problems: mastitis, bovine tuberculosis
Reproductive strategy Artificial insemination
Productivity Average daily milk yield per cow 20 kg per cow per day
Level of investment High level of investment
PASTROAL AND AGRO-PASTORAL LIVESTOCK SYSTEMS
Average size Large herds of indigenous cattle up to 200 head or more.
Feed-base Natural pasture for extensive rangeland grazing including crop residues for agro-pastoral systems
Genotype Indigenous zebu cattle
Health Common health problems: tick-borne diseases, trypanosomosis, bovine tuberculosis. Vaccination in some area
Reproductive strategy Uncontrolled mating with communal breeding bulls
Productivity Average daily milk yield per cow 1.5 kg per cow per day
Level of investment No/low level of investment (no/limited external inputs)
Table 3.1: cont.

10
Somali
Oromia
Afar
Amhara
SNNPR
Tigray
Gambela
Beneshangul GumuDire Dawa
HarariAddis Ababa
Total GHG emissionsThousand tonnes CO2 eq.
8305,0505,8109,39014,95032,30045,170
Cells with low density of animals
Milk production from the cattle dairy sector in Ethi-
opia is responsible for about 116.3 million tonnes
CO2 eq. in 2013 (GLEAM, 2016). These emissions are
distributed throughout the entire country as shown
in Map 4.1. Absolute emissions are concentrated in
three regions with the highest share of the national
dairy herd (80%): Oromia (34%), SNNPR (31%) and
Amhara (14%).
The activities and processes that contributed
towards the GHG emissions from dairy cattle is shown
in Figure 4.1. Figure 4.1 presents the GHG profile
which is dominated by methane (97.3%), while the
contribution of nitrous oxide (N2O) and carbon diox-
ide (CO2) is negligible (2.1% and 0.5% of the total,
respectively).
Approximately 87% of the emissions arise from
methane produced by the rumination of cows and
10% from the management of stored manure. Nitrous
oxide arising from dung and urine contributes about
2.1%. The contribution from the production of feed
is negligible because the proportion of external
inputs such as supplementary feed and fertilizer for
feed production is low.
Map 4.1: Regional distribution of regional greenhouse gas emission from milk production
Source: GLEAM, 2016
CHAPTER 4
Emissions and emission intensities fromthe dairy cattle sector

SUPPORTING LOW EMISSIONS DEVELOPMENT IN THE ETHIOPIAN DAIRY CATTLE SECTOR
11
Figure 4.1: Share of total emissions by emission source
Source: GLEAM, 2016
Production system contribution to the total GHG emissions and milk productionFigure 4.2 illustrates emissions in absolute terms dis-
aggregated by dairy production system and sources
of emissions. The rural mixed crop livestock system is
responsible for a large share of total GHG emissions;
contributing 56% of total emissions, while the pas-
toral and agro-pastoral system contributes 43% (Fig-
ure 4.2). The market-oriented farms, small-scale and
medium-scale commercial production systems make
small contribution to the total absolute emissions,
1.1%, and 0.2%, respectively.
Across all production systems methane emissions
from enteric fermentation comprise the bulk of
emissions ranging from 80% - 88% of the total emis-
sions. Emissions from manure management (nitrous
oxide and methane) make up the remaining share;
ranging from 11% in pastoral and agro-pastoral
systems to 19% in medium-scale commercial dairy.
Greenhouse gas emissions per kg of fat-and-protein corrected milk (FPCM)At national level, the emission intensity of milk pro-
duced in Ethiopia is on average 24.5 kg CO2 eq./kg
FPCM; the highest values for pastoral and agro-pas-
toral systems and the lowest in medium-scale com-
mercial systems. Emissions were on average, 44.6,
18.9, 8.7 and 3.8 kg CO2 eq./kg FPCM for the pastoral
and agro-pastoral, rural mixed crop-livestock, small-
scale and medium-scale commercial systems, respec-
tively (Figure 4.3).
Variability in emission intensity within dairy production systemsAt production system level, there is a wide variation
in emission intensity which is closely related to diver-
sity the production and management practices in the
4 dairy production systems (Figure 4.4).
At production system level, the highest variabil-
Enteric CH4
87%
Manure managementCH4
10.3%
Manure managementN2O
2.0% FeedCO20.4%
Manure depositedon pasture
N200.1%
Crop residuesN2O
0.002%Fertilizer
N2O0.001%
Manure appliedN2O
0.003%

SUPPORTING LOW EMISSIONS DEVELOPMENT IN THE ETHIOPIAN DAIRY CATTLE SECTOR
12
Figure 4.2: Absolute emissions by production system and emission source
Source: GLEAM, 2016
0
10
20
30
40
50
60
70
80
0
10
20
30
40
50
60
70
Shar
e of
nati
onal
milk
pro
ducti
on (%
)
Mill
ion
ton
nes
CO2
eq.
Share of total milk production
Rural mixed crop-livestock
Pastoral andagro-pastoral
Small-scalecommercial dairy
Medium-scalecommercial dairy
Manure applied, N2O
Fertilizer, N2O
Crop residues, N2O
Manure deposited on pasture, N2O
Feed, CO2
Manure management, N2O
Manure management, CH4
Enteric CH4
ity in emission intensity is observed for the pastoral
and agro-pastoral systems with a range from 25
to 70 kg CO2 eq./ kg FPCM (Figure 4.4). In medium
commercial dairy systems, 50% of the producers are
spread over a smaller range of values, indicating
less variation in emission intensity. The existence of
a wide variability is strong indication of the poten-
tial for reductions in GHG intensity of milk through
the adoption of practices associated improvements
in efficiency.
Drivers of emissions and emission intensities A number of factors influence emissions and emis-
sion intensitiesfrom dairy production in Ethiopia:
• Inadequate and poor quality feed. An inadequate
supply of quality feed is the major factor limiting
dairy production in Ethiopia. Feeds, are either not
available in sufficient quantities due to fluctuat-
ing weather conditions or even when available
are of poor nutritional quality. The diet is largely
made up of low quality feed products such as crop
residues (between 30-35 percent of the ration
in the rural mixed crop livestock system and the
two market oriented systems) and native pastures
of poor nutritive value (56% in the rural mixed
crop-livestock and 90% in the agro-pastoral and
pastoral systems). Consequently, the digestibility
of average feed ration in all 4 systems is very low:
43%, 45%, in pastoral systems, and rural mixed
crop-livestock system, respectively and 49% in the
market-oriented systems. These constraints explain
the low milk yields and short lactations, high mor-
tality of young stock, longer parturition intervals,

SUPPORTING LOW EMISSIONS DEVELOPMENT IN THE ETHIOPIAN DAIRY CATTLE SECTOR
13
Figure 4.3: Average emission intensity per kg FPCM, by system
Source: GLEAM, 2016
0
5
10
15
20
25
30
35
40
45
50
Kg C
O2
eq./
kg F
PCM
Manure applied, N2O
Fertilizer, N2O
Crop residues, N2O
Manure deposited on pasture, N2O
Feed, CO2
Manure management, N2O
Manure management, CH4
Enteric CH4
Rural mixedcrop-livestock
Pastoral andagro-pastoral
Small-scalecommercial dairy
Medium-scalecommercial dairy
kg C
O2 e
q. p
er k
g FP
CM
75
70
65
60
55
50
45
40
35
30
25
20
15
10
5
0Rural mixed
crop-livestockPastoral andagro-pastoral
Small-scalecommercial dairy
Medium-scalecommercial dairy
Figure 4.4: Variability in milk emission intensity, by production system

SUPPORTING LOW EMISSIONS DEVELOPMENT IN THE ETHIOPIAN DAIRY CATTLE SECTOR
14
low animal weights and high enteric methane
emissions per unit of metabolizable energy.
• Animal health. The prevalence of various animal
diseases, tick-borne diseases, internal and external
parasites affects the performance of dairy cattle.
Animal health affects emission intensity through
the “unproductive emissions” related to mortality
and morbidity. Calf mortality is high in all sys-
tems, and particularly in the pastoral and mixed
crop-livestock systems where mortality ranges
between 12%-16%. Many of the health problems
result from poor animal condition as a result of
inadequate nutrition, but also from the limited
access to animal health services. Morbidity has
an indirect effect on emission intensities through
slow growth rate, reduced mature weight, poor
reproductive performance and decreased milk
production. This is particularly true for improved
exotic dairy cattle breeds which are often inher-
ently more susceptible to diseases compared to
the indigenous cattle.
• Reproductive efficiency. Reproductive efficiency
affects emission intensity by influencing the por-
tion of the herd that is in production (e.g. milked
cows and young stock fattened for meat). It is also
a key parameters to the economic performance
of dairy systems. Improvements in reproductive
performance is a major efficiency goal of the dairy
industry. However, achieving this goal is currently
hampered by a number of factors, particularly
feed availability and quality. Poor reproductive
performance in the Ethiopian dairy herd is man-
ifested in a number of parameters such as low
fertility rates (50%), delayed time to reach puberty
and age at first calving (2.8 and 3.6 years in rural
mixed crop-livestock and pastoral systems, respec-
tively). The proportion of lactating cows ranges
from 26%-28% which implies a large proportion
of the dairy herd comprises of non-productive
stock (bulls, replacements and dry cows).
• Genetic limitation and a low number of improved
genotypes. About 97% of the cattle population
in Ethiopia are indigenous. While adapted to
feed and water shortages, disease challenges, and
harsh climates, the productivity of these breeds is
generally low. Milk production is as low as 0.5 to
2 litres per cow per day over a lactation period of
160-200 days.
Figure 4.5: Variation in greenhouse gas (GHG) emission intensity of milk in relation to milk productivity per cow (kg FPCM, fat and protein corrected milk per cow). Each dot represents a district
R² = 0.8675
0
5
10
15
20
25
30
35
40
45
50
55
60
65
70
75
80
85
0 250 500 750 1000 1250 1500 1750 2000 2250 2500 2750 3000 3250
kg C
O2eq
. per
kg
FPCM
kg FPCM per cow year
3500 3750 4000 4250 4500
Rural mixed crop-livestock Pastoral and agro-pastoral Small-scale commercialMedium-scale commercial

SUPPORTING LOW EMISSIONS DEVELOPMENT IN THE ETHIOPIAN DAIRY CATTLE SECTOR
15
All these factors contribute to low milk yield,
both at animal and herd levels. As a result, we
observe a strong inverse correlation between the
emission intensity and the average annual milk
yield per animal in dairy production systems in
Ethiopia (Figure 4.5). For animals with a higher
annual milk yield, the overall farm GHG emissions
(from all animal cohorts) are distributed over a
larger amount of milk. In terms of feed energy utili-
zation, the herd directs a higher percentage of feed
energy intake to generate the products, rather than
simply maintain body and reproduction functions.
The R2 value describes the proportion of the
variation in values that is explained by the trend. In
other words, an R2 value of 0.87 means that 87%
the variation in emissions intensity is explained by
milk production per cow. According to the trend
line, increasing per cow milk production from 250
to 900 kg per cow would decrease emissions inten-
sity from 45 kg CO2 eq./kg FPCM to 12 kg CO2 eq./
kg FPCM, i.e. 73%.

16
The analysis of current production shows that man-
agement practices and technologies that increase
milk production per cow will reduce the GHG emis-
sions intensity of milk production. This approach to
mitigation also serves the national objective of in-
creasing overall milk output.
The abatement technologies and practices
assessed in this study were selected for their potential
impact on enteric CH4. Another important considera-
tion taken into account during the selection of target
interventions was the need to integrate mitigation
with a number of key developmental goals for the
dairy sector, such as its role in promoting food securi-
ty, rural and overall economic development.
The mitigation options evaluated in this analysis
were selected in a consultative process with national
experts where those options identified as having
the potential for large improvements in productivity
were assessed alongside their potential to reduce
on-farm greenhouse gas emission intensity while
taking into account the feasibility of implementation
and their potential economic benefits at the farm
level. Box 3 summarizes the criteria used to identify
interventions to be included in the analysis.
The interventions evaluated covered areas rang-
ing from improved feeding practices to better herd
heath and animal husbandry practices management
and improved genetics. These comprised: supple-
mentation with leguminous shrubs, supplementation
with urea-molasses multi-nutrient blocks, use of urea
treated crop residues, supplementation with high
protein/energy concentrate, artificial insemination,
disease control (trypanosomosis), and use of sexed
semen. Interventions were selected to address the
key drivers of low productivity and inefficiencies in
production cycle. These are summarized in Table 5.1.
CHAPTER 5
Exploring the mitigation potentialin dairy cattle production
Table 5.1: Summary of selected interventions for Ethiopian dairy systems
Practice Objective Constraint addressed Benefits
1. Supplementation with leguminous shrubs
Improve management of forage resources by better matching available resources to animal requirements/herd nutrient demand
Addresses feed scarcity and quality constraints
Improved animal and herd health
Higher conception rates
Improved weaning weights
2. Supplementation with urea-molasses multi-nutrient blocks (UMMB) Improve the quality of diet Low quantity and quality
of forage
Increased intake and digestibility
Improved growth rates
Shorter finishing periods and/or higher slaughter weights
3. Use of urea-treated crop residues
4. Supplementation with low-cost high protein/energy concentrates
Increase adequacy of dietAddress energy and protein constraints during periods of low availability and quality
Improved cow condition
Improved reproductive performance
Higher conception rates
5. Disease control (trypanosomosis)
Control a disease that affects both physical and financial performance of dairy herds
High mortality and morbidity
Reduction in mortality and morbidity
Increase in animal productivity
Improvements in reproductive performance (fertility, age at first calving)
6. Use of superior genetics (improved breeds)
Improve production and reproductive traits
Low productivity of the indigenous cattle breeds
Increased weaning weights
Improved conception rates
Higher calf survival
Increased final weights
Increased milk yields

SUPPORTING LOW EMISSIONS DEVELOPMENT IN THE ETHIOPIAN DAIRY CATTLE SECTOR
17
Three principal criteria were used to identify interventions
for analysis in the study; the potential for improving
production efficiency, feasibility of adoption by
farmers and the potential to reduce enteric meth-
ane emission intensity.
Improving production efficiency: A good strategy that
farmers can implement to decrease methane emissions.
Using this approach comprises the adoption of effective
management of forage and other feed resources (e.g.
supplementation, ration balancing), improved fertility
and reproductive management of the herd, greater use
of animals selected for improved production and better
animal health management.
Reduction in enteric CH4 emission intensity: Many
measures that have the potential to increase productiv-
ity are associated with increased individual animal per-
formance and this increased performance is generally
associated with a higher level of absolute emissions (un-
less animal numbers are decreasing) but reduced emis-
sions intensity. The figure below demonstrates some of
these impacts. The use of improved breeds results in an
increase in absolute emissions per animal because ani-
mals are more productive. Overall, however, a reduction
in emission intensity occurs because productivity increas-
es. Similarly, controlling disease results in a decrease in
mortality and increase in number of animals in the herd
hence increase in absolute emissions. From an emission
intensity perspective, these interventions however trans-
late into a decrease in emission intensity (see Figure 5.1).
Some however can result in a decrease in both absolute
enteric emissions and emissions intensity (see feed-based
interventions in figure below).
Feasibility of implementation: The third criterion is that
the interventions had to be feasible in the short or me-
dium term. For the purposes of selecting interventions,
“feasibility” was first determined by sectoral experts in
terms of their technical potential, production system and
territorial applicability, and market development. The
study also assumed reliance on existing and proven tech-
nologies. The selected interventions were discussed with
a broader group of stakeholder to assess the social and
institutional feasibility of adoption and up-scaling of in-
terventions. Ensuring that this criterion was met required
investigation of information on barriers that keep farmers
from adopting these interventions at large scale. Other
factors taken into consideration included: location of
interventions should be informed by location of drivers/
barriers such as how geophysical aspects can affect appli-
cability; and the potential to provide additional benefits,
e.g. poverty reduction.
Impact of technical interventions on absolute emissions by systems
Box 3: Criteria for selection of interventions
7.9
-20.
4
-1.2
- 8.5
- 3.7
4.8
-12.
3
3.2
-1.8
- 8.4 -5
.4-3.0
-10.
5 - 8.7
-
25
-
20
-
15-
10
- 5
0
5
10
Use of improvedbreeds
Supplementationwith leguminous
shrubs
Use of ureamolasses
multi-nutrientblocks
Treatment ofstraw with urea
Supplementationwith urea treated
straw and rice bran
Control ofTrypanosomosis
Perc
enta
ge c
hang
e in
abs
olut
e em
issi
ons
rela
tive
to
base
line
Rural mixedcrop-livestock
Pastoral andagro-pastoral
Small-scalecommercial dairy
Medium-scalecommercial dairy

SUPPORTING LOW EMISSIONS DEVELOPMENT IN THE ETHIOPIAN DAIRY CATTLE SECTOR
18
The strategies were not applied uniformly, but
selected for each production system, animal category,
and agro-ecological zone using evidence from mod-
elling and field studies and expert judgement of their
specific operating requirements and likely impact on
performance.
Quantitative summary of mitigation outcomes from the application of single interventionsThe mitigation outcomes by system from the single
interventions considered in this report are presented
in Figure 5.1. Overall, the analysis shows that there
is a high potential to reduce emission intensities; to-
tal emission intensity (Kg CO2 eq./kg FPCM) can be
reduced by 15% to 62%, depending on the inter-
vention and production system (Figure 5.1). Please
note that not all interventions were judged as being
suitable for all systems. Where no value is given in
Figure 5.1 for an intervention in a particular system
it signifies that this intervention was not tested in
that system.
The feed and nutrition related interventions (sup-
plementation with leguminous shrubs, use of urea
molasses multi-nutrient blocks, use of urea treated
crop residues, supplementation with high protein/
energy concentrate) results in a reduction in emission
intensities between 16% - 50%. The treatment of
crop residues with urea results in an emission inten-
sity reduction of 17% - 44% relative to the baseline.
Including rice bran in with urea treated straw to
the basal diet, results in a similar emission intensity
reduction potential: 16% - 50% of the baseline emis-
sions.
Supplementation of lactating cows with UMMB
results in a reduction of emission intensity between
Figure 5.1: GHG emission intensity reduction potential relative to baseline emission intensityfor single intervention
Source: GLEAM, 2016
- 61.
5
- 27.
6
- 20.
3
- 20.
3
-26
.7
- 27.
6
-43
.7
-26
.9
- 16.
7
43.6
-26
.6
- 15.
9
-
-
-
43.0
-25
.7
- 14.
7
30.2
- 31.
1
Rural mixed crop-livestock
Pastoral and agro-pastoral
Small-scale commercial dairy
Medium-scale commercial dairy
Pere
ntag
e ch
ange
in e
mis
sion
inte
nsit
y re
lati
ve to
bas
elin
e
Use of improved breeds Supplementation withLeguminous shrubs
Use of urea molasses multi-utrient blocks
Treatment of straw with ureaSupplementation withurea treated straw and rice bran
Supplementation withurea treated strawand concentrate
Control of Trypanosomosis
-70
-60
-50
-40
-30
-20
-10
0

SUPPORTING LOW EMISSIONS DEVELOPMENT IN THE ETHIOPIAN DAIRY CATTLE SECTOR
19
20% - 27%. The reduction in emission intensity is
a consequence of the improved feed digestibility,
increase animal feed intake and associated increases
in milk production.
The use of improved breeds with higher milk yield
potential results in 62% reduction in emission inten-
sity in the rural mixed crop livestock system (Figure
5.1). The impacts on emission intensity are achieved
through reductions in number of replacement breed-
ing animals, improvements in reproductive perfor-
mance of the herd (age at first calving) and through
increased milk production via a combination of high-
er milk yields per day and longer lactation periods).
In Ethiopia, trypanosomosis has substantial effects
on cattle health and the livelihoods of rural farm-
ers. Animal trypanosomosis reduces the offtake of
animal protein and decreases milk production. The
control of trypanosomosis in cattle was applied to
both the rural mixed crop-livestock and the pastoral
and Agro-pastoral system and resulted in a reduction
of emission intensity between 30% - 36% relative to
the baseline.
Quantitative summary of mitigation and productivity outcomes from the application of mitigation packages (combined technologies)Additional significant reductions in emissions can
be achieved through the combination of herd and
health management, nutrition and feeding man-
agement strategies, and genetics. The reality is that
farmers are likely to combine technologies and will
select the combination of technologies that will
maximize a number objectives. To test this concept
a combination of interventions aimed at improving
herd health (control of trypanosomosis), improving
Figure 5.2: Package of mitigation options (supplementation with leguminous shrubs, use ofurea treated crop residues, control of trypanosomosis, use of improved genetics)
Source: GLEAM, 2016
18.8
44.5
8.6
3.7
6.58
22.4
3.2
2.4
Emis
sion
inte
nsit
y k
g CO
2 eq.
/kg
FPCM
Baseline emission intensity Mitigation emission intensity Scenario
-65% -50%
-62% -36%
Rural mixedcrop-livestock
Pastoral andagro-pastoral
Small-scalecommercial dairy
Medium-scalecommercial dairy
0
5
10
15
20
25
30
35
40
45
50

SUPPORTING LOW EMISSIONS DEVELOPMENT IN THE ETHIOPIAN DAIRY CATTLE SECTOR
20
feed quality and availability (supplementation with
leguminous shrubs and urea treated straw) and use
of improved breeds was tested. This resulted in a re-
duction potential of 36%-62% in emission intensity
relative to the baseline emission intensity (Figure
5.2). With this intervention package, milk produc-
tion (expressed in FPCM terms) increases by 200%,
62%, 225% and 67% for the mixed crop-livestock sys-
tems, pastoral/agro-pastoral, the small-scale, medi-
um-scale commercial systems respectively, compared
to the baseline situation. This change in production
is achieved with the assumption that the number of
milking animals are kept constant.

21
Having identified and assessed the mitigation of
potential, the next step was to prioritize these tech-
nologies for wider dissemination and adoption. Pri-
oritization should not only consider enteric methane
mitigation potential but also the productivity bene-
fits, income advantages to farmers and other co-ben-
efits that are likely to provide additional incentives
for farmers to adopt mitigation interventions (Figure
6.1). A key incentive to farmers for adoption is in-
creased revenue and/or reduced costs costs of pro-
duction. To better understand the implications for
farmers, a cost benefit analysis was conducted to
assess the profitability of each intervention. The ben-
efit-cost ratio is the ratio between the present value
of the benefit stream and the present value of the
cost stream. It provides an indication of how much
the benefits of an intervention exceed its costs. Ob-
taining data was difficult for some of the interven-
tions tested meaning that the economic implications
of some of the interventions could not be assessed.
The prioritization processAll individual practices were ranked for their ability
to reduce enteric methane. They were then assessed
against two other criteria; productivity improve-
ment and economic benefits. For ease of interpre-
tation a ‘colored light’ system was developed for
assessing impact where red was ‘high, blue ‘medi-
um’ and yellow ‘low’. As the impact of an individual
practice varies by system, practices were prioritized
separately for each system. The values associated
with the high, medium and low classification system
are shown Table 6.1. It must be emphasized that this
system was developed as an aid to more easily iden-
tifying those practices with the highest potential
both within and between practices and systems. It
does not signal ‘‘no potential” since even practices
ranked ‘low’ against all three criteria reduced en-
teric methane emissions, increased output and re-
turned a net financial benefit.
CHAPTER 6
Prioritization of interventions to address enteric methane
Figure 6.1: Initial prioritization process of technical interventions
LONG LIST OFINTERVENTIONS
Abatement potentialGHG mitigation potential compared with baseline
Abatement potentialSelected interventions with abatement potential >10%
Impacts on productivityPotential to contribute to food security targets
Impact on profitabilityReturns to farmers
LIST OFPRIORITIZEDINTERVENTIONS
SUPPORTING LOW EMISSIONS DEVELOPMENT IN THE ETHIOPIAN DAIRY CATTLE SECTOR
22
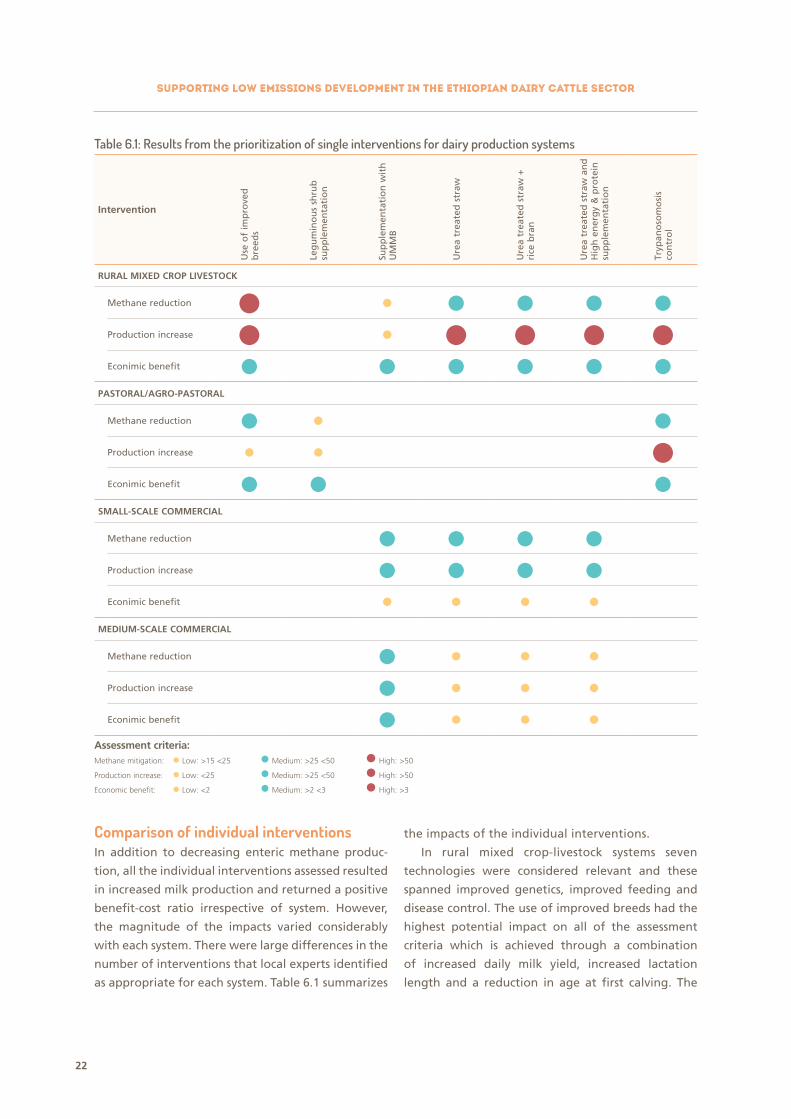
Comparison of individual interventionsIn addition to decreasing enteric methane produc-
tion, all the individual interventions assessed resulted
in increased milk production and returned a positive
benefit-cost ratio irrespective of system. However,
the magnitude of the impacts varied considerably
with each system. There were large differences in the
number of interventions that local experts identified
as appropriate for each system. Table 6.1 summarizes
the impacts of the individual interventions.
In rural mixed crop-livestock systems seven
technologies were considered relevant and these
spanned improved genetics, improved feeding and
disease control. The use of improved breeds had the
highest potential impact on all of the assessment
criteria which is achieved through a combination
of increased daily milk yield, increased lactation
length and a reduction in age at first calving. The
Table 6.1: Results from the prioritization of single interventions for dairy production systems
Intervention
Use
of
imp
rove
d
bre
eds
Leg
um
ino
us
shru
b
sup
ple
men
tati
on
Sup
ple
men
tati
on
wit
h
UM
MB
Ure
a tr
eate
d s
traw
Ure
a tr
eate
d s
traw
+
rice
bra
n
Ure
a tr
eate
d s
traw
an
d
Hig
h e
ner
gy
& p
rote
in
sup
ple
men
tati
on
Tryp
ano
som
osi
s co
ntr
ol
RURAL MIXED CROP LIVESTOCK
Methane reduction Production increase Econimic benefit
PASTORAL/AGRO-PASTORAL
Methane reduction Production increase Econimic benefit
SMALL-SCALE COMMERCIAL
Methane reduction Production increase Econimic benefit
MEDIUM-SCALE COMMERCIAL
Methane reduction
Production increase
Econimic benefit
Assessment criteria:Methane mitigation: Low: >15 <25 Medium: >25 <50 High: >50
Production increase: Low: <25 Medium: >25 <50 High: >50
Economic benefit: Low: <2 Medium: >2 <3 High: >3

SUPPORTING LOW EMISSIONS DEVELOPMENT IN THE ETHIOPIAN DAIRY CATTLE SECTOR
23
control of trypanosomosis and the feeding interven-
tions involving urea treated straw with or without
additional supplements gave similar benefits in
terms of methane reduction, milk yield increase and
financial returns. Leguminous shrub supplementa-
tion achieved similar reductions in enteric methane
to the feeding and disease intervention but had a
smaller impact on productivity. Supplementation
with UMMB had moderate effects on milk produc-
tion (<25%) although financial returns were similar
to other feeding approaches. The higher price of
milk received by these farmers explains the higher
returns; highlighting that even for very small chang-
es in emissions and production farmers can gain
financial given the right conditions and incentives.
Although the use of improved and higher yielding
cattle clearly stands out as an intervention that
should be prioritized, achieving that potential may
not in fact be easy. Exploiting superior genetics will
mean that other facets of the system will also need
to change, in particular improved diet (both quanti-
ty and quality), disease control, etc. The gains from
feeding interventions and disease control, although
ranked lower than improvements in genetics on
their potential, may well be easier to achieve in
practice.
Only two interventions were considered for pasto-
ral/agro-pastoral systems and of these the control of
trypanosomosis had a greater impact on all three cri-
teria compared to leguminous shrub supplementation.
However, despite the low impact on methane
emissions and production, supplementation with
leguminous shrub has a moderate impact on the
financial returns because of the low cost of the
intervention.
Four similar interventions were tested on small
and medium-scale commercial farms. All of these
interventions aimed at improving diet quantity
and quality. Low-quality feeds such as crop-resi-
dues and low-quality grasses are important basal
feeds in smallholder systems such as those in
Ethiopia. Dairy production in Ethiopia is faced with
seasonal feed constraints during which animals
rely solely on crop residues. The supplementation
with UMMB worked equally well in both systems
(ranked medium for all for two assessment criteria
(emissions and productivity) but gave contrasting
impacts on financial returns.
The urea-based feeding approaches gave con-
siderable lower financial returns to farmers in
both market oriented systems and this is explained
by the low price of milk. These farmers sell a larg-
er share (or all) of their milk to cooperatives that
offer lower prices compared to the informal mar-
ket. On the other hand, higher financial benefits
are achieved for the same intervention in the rural
mixed crop-livestock system largely because most
of the milk output is sold on the informal markets,
where milk prices are 40% above the price paid by
cooperatives.
Table 6.2: Prioritization results for the “package” intervention for dairy production systems
Common intervention ‘package’ Methane reduction Production increase Economic benefit
Rural mixed crop livestock Pastoral/agro-pastoral Small-scale commercial Medium-scale commercial
Assessment criteria:Methane mitigation: Low: >15 <25 Medium: >25 <50 High: >50
Production increase: Low: <25 Medium: >25 <50 High: >50
Economic benefit: Low: <2 Medium: >2 <3 High: >3
SUPPORTING LOW EMISSIONS DEVELOPMENT IN THE ETHIOPIAN DAIRY CATTLE SECTOR
24
Intervention packagesThe large number of possible intervention ‘packag-
es’ ruled out a comprehensive comparison and prior-
itization of alternative ‘packages’. Expert judgment
was therefore used to define what was deemed an
appropriate common intervention ‘package’ to com-
pare across the four dairy systems. Results of an as-
sessment of this package, which comprised interven-
tions aimed at improving herd health, nutritional
status and genetics, are shown in Table 6.2. There
is a clear benefit from introducing a package of in-
terventions since in all systems enteric methane re-
duction was increased while milk production was in-
creased in all the four systems (>50%). The financial
implications of the package of interventions were
moderate in smallholder systems and high in market
oriented systems.

25
This study reveals that pathways for enhancing pro-
ductivity and achieving emission reductions exist in
all systems. The greatest opportunities for mitigation
and productivity increases at scale lie in the small-
holder production systems; the rural mixed crop live-
stock systems and pastoral and agro-pastoral systems
for the following reasons:
• Rural mixed crop livestock systems and pastoral
and agro-pastoral systems account for 63% and
36% of the dairy cattle herd, respectively and
provide livelihood support to a large number of
smallholder farmers.
• The milk output is considerably less than it should
be; this is confirmed by the wide productivity gaps
in these systems.
• Approximately 99% of the enteric methane emis-
sions originate from these two systems.
• Emissions and emissions intensity are highest in
these a systems and improving productivity can
address the dual challenges of development and
climate change.
• Interventions to improve productivity will have
to be tailored to specific production system prac-
tices. These two systems operate within diverse
conditions and face different constraints and
therefore will require distinct set of interventions
and incentives.
This study didn’t consider changes in systems i.e.
from smallholder to commercial oriented produc-
tion, however, it is also possible to meet the increas-
ing demand for dairy products by expanding milk
production in the existing market-oriented systems
however such choices will have to be made taking
into account the implications for livelihoods and
poverty reduction.
The results presented in the preceding sections
indicate that there are significant opportunities for
growth on a low carbon path for the dairy sector
and that economically viable opportunities exist
across all production systems. Increasing individual
animal productivity as a consequence of better feed-
ing practices, health and herd management, also
results in a reduction of the herd. Reduction in ani-
mal numbers, particularly in subsistence production
systems, allows for the provision of adequate feed,
better health management leading to improvements
at both animal and herd levels. Methane emissions
will be reduced at both the total herd and per liter
of milk. However, these mitigation options might
be in conflict with the interests of smallholders who
generally tend to keep large herds for non-pro-
ductive functions such as traction, nutrient value
and risk management. This analysis shows that the
implementation of these interventions can have
important impacts on the revenue profile of these
dairy production systems (Table 7.1). If wider adop-
tion is to be pursued, such barriers will have to be
addressed through for example, incentives/measures
that support the replacement of such functions and
compensate farmers for loss of these functions.
The study also indicates that while there are
CHAPTER 7
Unlocking the potential of ‘no regrets’ opportunities
Table 7.1: Comparison of farm revenue profile in baseline and intervention scenarios in dairy systems in EthiopiaBaseline Scenario meat milk manure Intervention Scenario meat milk manure
Rural mixed crop-livestock Systems 65% 30% 5% Rural mixed crop-livestock
Systems 41% 56% 3%
Pastoral & Agro-pastoral Systems 75% 25% 0% Pastoral & Agro-pastoral
Systems 68% 32% 0%
Small-scale commercial dairy Systems 53% 44% 3% Small-scale commercial dairy
Systems 27% 72% 1%

SUPPORTING LOW EMISSIONS DEVELOPMENT IN THE ETHIOPIAN DAIRY CATTLE SECTOR
26
many potential interventions to reduce emissions
and improve productivity, the same intervention can
have contrasting impacts on emissions, production
and farmer revenues as Table 6.1 illustrates. This
reinforces the need to tailor interventions to local
conditions.
It is important to note that the costs and benefits
(and profitability) of the technology are only one
part of the picture: adoption also depends on policy
incentives, technical support, farmers’ capacity, and
other factors. Putting in place an enabling envi-
ronment with supportive policies and programs to
overcome the market, regulatory and institutional
barriers is essential for mitigation potential to be
realized. A better understanding of the barriers to
adoption is also required before designing interven-
tions are farm level and contributing to the design
of policies and programs that can support practice
change at scale.
Drawing clear conclusions from the prioritization
process around realized potential is challenging;
some options could prove to be a better option at
system level and may not work at farmer level where
other criteria may be important. Consequently, there
is a need to consider how these interventions behave
on the ground. In particular a better understand-
ing of the barriers to adoption at the farm level is
required. The most commonly cited barriers include
opportunity cost of labor, limited knowledge of
farmers, access to markets, inputs and services, and
environmental constraints. This information current-
ly does not exists for the individual interventions
assessed in this report. Developing an understand-
ing of why individual technologies are not being
adopted requires a much more intensive effort at
the local and system scale than has been possible in
this study. The assessment however provides a guide
to where subsequent efforts should be focused.


I682
1EN
/1/0
4.17