Embed Size (px)
Citation preview
Supporting Online Material for
Structure and functional role of dynein’s microtubule
binding domain
Andrew P. Carter*1, Joan E. Garbarino*2, Elizabeth M. Wilson-Kubalek3, Wesley E.
Shipley2, Carol Cho1, Ronald A. Milligan3, Ronald D. Vale1†, and I. R. Gibbons2
1Howard Hughes Medical Institute and Department of Cellular and Molecular
Pharmacology, University of California, San Francisco, California 941582Molecular and Cell Biology Department, University of California, Berkeley, California
94720 3Department of Cell Biology, The Scripps Research Institute, La Jolla, CA 92037
*These authors contributed equally to this work.†To whom correspondence should be addressed. E-mail: [email protected]
This PDF file includes:
Materials and Methods
Tables S1 to S3
Figs. S1 to S7
Movies S1 to S4
References
Materials and methods
Cloning, expression and binding studies of SRS-MTBD constructs.
Cloning, expression and binding studies on monomeric 3, 7, 12 and 14 heptad long SRS-
MTBD constructs (Table S1) were performed as described previously (S1). The binding of
the dimeric 3-heptad construct used for crystallization (SRS-MTBD-26:19) and of the
equivalent dimeric construct of SRS-MTBD-22:19 were assayed similarly, and the results
were calculated on the basis of microtubule binding being limited to a single site per dimer
by steric constraints.
Heat stability test
Ammonium sulfate was added to an aliquot of purified protein to a final concentration of
25% saturation. The tube was incubated on ice for 20 minutes then centrifuged at 4oC for
10 minutes at 14,000Xg to remove aggregated protein. The supernatant was then adjusted
to 40% ammonium sulfate, incubated on ice and centrifuged as above. The pellet was
resuspended to a protein concentration of 2 mg/ml (measured by A280) in buffer containing
50 mM Na-phosphate pH 8, 200 mM NaCl and 1 mM DTT. A 40 μl aliquot was headed in
a waterbath at 42oC for 30 minutes, before addition of ammonium sulfate to 25%
saturation, incubation for 20 minutes and centrifugation as above. The amount of protein in
the pellet and supernatant was measured using a colorimetric protein assay (Bio-Rad DC
Protein Assay) and reported as percentage of total protein in the pellet.
Cloning, expression and crystallization of 26/19 SRS-MTBD dimer
The SRS-MTBD used for crystallization was based on a previously reported weak binding
(+ registry) construct containing three heptads of stalk (SRS-MTBD-26:19) (S1). The
final construct differed from that previously reported in being a dimeric SRS and lacking
the myc tag at the carboxy terminus. In addition, two cysteine residues in the mouse
MTBD were mutated to alanine (GeneBankTM accession number FJ039900). The fusion
protein was cloned in the NdeI/XhoI sites of the pET42 vector, expressed in E.coli
BL21(DE3) cells and purified on nickel-nitrilotriacetate beads as previously described (S1).
Protein was exchanged into crystallization buffer (20 mM K-HEPES pH7.5, 10% w/v
glycerol, 0.2 mM PMSF, 1 mM DTT, 4 mM Mg-ATP, 0.01% Na-Azide) and concentrated
to 18 mg/ml. Crystallization was carried out by setting hanging drops containing 2 μl of
protein (diluted to 13.5mg/ml with 20mM K-Hepes pH 7.5, 10% glycerol), 0.3 μl 70%
glycerol and 1.8 ul of precipitant (20% PEG 4000, 200 mM Ammonium sulfate, 100 mM
Bis-Tris pH 5.5) over 500 μl of the same precipitant solution. Crystals appeared within one
day and were of dimensions up to 200 μm.
Crystal data collection and structure determination
Crystals were looped up from the drop and flash-frozen in liquid nitrogen after a 1-2 minute
delay to allow for dehydration. Diffraction data to 2.3 Å were collected at beamline 8.3.1 at
the Advanced Light Source (ALS), Lawrence Berkeley National Laboratory. Data were
processed using Denzo and Scalepack (S2) in space group R3 (a = 144.302, c=159.946).
Molecular replacement using PHASER (S3) and the dimer of (S4) seryl-tRNA synthetase
(1SRY), lacking the coiled-coil region, as a search model, followed by a round of
refinement using REFMAC5 produced an interpretable electron density map for one of the
MTBDs in the asymmetric unit. Multiple rounds of building and refinement using COOT
(S5) and REFMAC5 (S6) were required to complete the structure of both MTBDs. During
the refinement density for nucleotide (AMP) in the active site of the seryl-tRNA synthetase
appeared, despite not being used in the original search model. In the last rounds the TLS
refinement option was used in REFMAC5 giving a final Rwork/Rfree of 0.197/0.247 (Suppl.
Table 2). All figures were made using the program MOLMOL (S7).
Cryo-EM and image analysis
Microtubules were polymerized at 5 mg/ml in 80 mM Pipes, pH 6.8, 3 mM MgCl2,
16% (v/v) DMSO and 2 mM GTP at 34C for 30 minutes; 0.25 mM paclitaxel was
subsequently added and incubation was continued for 30 minutes. Microtubules were
diluted 4X with BRB80 before applying to plasma cleaned C-flat grids. A monomeric,
tight binding ( registry) SRS-MTBD construct containing 12 heptads of stalk (SRS-
MTBD-85:82, 0.5 mg/ml in 25 mM Tris, pH 8.0, 20 mM NaCl and 2 mM MgCl2) was
added to the microtubules on the grid, then vitrified in liquid ethane using a FEI Vitrobot
(FEI company). The data sets were collected using a GATAN cryoholder and a FEI
TecnaiF20 transmission electron microscope equipped with a Gatan Ultrascan 4000 X 4000
pixel CCD camera. Images of the decorated microtubules were recorded in low-dose
conditions (<10 e/Ų) at a magnification of ~ 29,000 and a nominal defocus range from 1.5
to 2.0 µm. For image analysis of the MTBD-microtubule complex 10 helical, 15-
protofilament microtubules were selected from CCD images. 3D maps were calculated
using Phoelix, essentially as described elsewhere (S8).
3D EM Map
Surface representations of side and top views of the 15-protofilament map shown in
Figure S4 were produced using the Chimera software package (S9). To verify the polarity
of the MTBD-microtubule complex, we overlapped the 3D EM structure of Ndc80-
microtubule complex, which has a defined relationship between complex binding geometry
and microtubule polarity (S10). To determine the relationship between the MTBD and the
microtubule, we docked a model of the high-resolution polymerized form of the tubulin
dimer (pdb 1TUB) into a single protofilament cut from the MTBD-microtubule EM density
map as described previously by Nogales et al. (S11). To interpret the densities close to the
microtubule surface, we manually docked the crystal structure of MTBD into the EM
density map using Chimera (9). The relative position of the and tubulins was assigned
based on the polarity of the reconstruction and the observation that dynein and kinesin
share a microtubule binding site (S12).
S. cerevisiae dynein construct preparation
Constructs were generated using homologous recombination to modify the genomic copy
of the Saccharomyces cerevisiae cytoplasmic dynein gene as described (S13). Specifically,
DNA fragments containing the stalk modifications were generated by stitching PCR and
transformed into a starting yeast strain in which the stalk region had been replaced by the
K. lactis Ura-3 gene. Selection for replacement of the Ura-3 cassette was carried out by
growing the transformed yeast overnight on YPD, then replica plating onto 5-fluoroorotic
acid (5-FOA). Strains were checked by a PCR reaction.
Changes in stalk length (Suppl. Fig. 6) were originally made in the background of a
truncated monomeric dynein motor domain tagged on its linker domain with GFP (GFP-
Dyn1331kD) (S13) and tested in microtubule gliding assays. In order to make the elongated
(+7) stalk, we chose to insert 7 heptads of coiled-coil from the Drosophila cytoplasmic
dynein stalk (clone kindly provided by Dr T. S. Hays) in order to retain normal
communication along the stalk. A construct which used an insertion of 7 heptads of coiled
coil from the protein colicin 1a showed very slow (<0.5 nm/s) minus-end directed motion
(data not shown). The stalk length constructs were remade in an artificially dimerized
dynein tagged at the C-terminus with the Promega HaloTag (GST-Dyn1331kD (S13)), in
order that they could be tested in a single molecule TIRF assay which requires a processive
motor. All constructs were expressed and purified as described previously (S13) and stored
until required at -80oC.
Microtubule stimulated ATPase assays
ATPase rates were measured using the EnzCheck phosphate assay kit (Invitrogen).
Reactions were carried out in 30 mM Hepes, 1 mM EGTA, 2 mM MgCl, 1 mM DTT, 10
μM paclitaxel. Reactions were started by addition of 1mM Mg-ATP and change in A360
was followed over time in a quartz 96-well plate using a Molecular Dynamics plate reader.
The concentration of the dynein constructs was determined by SDS-PAGE gels stained
with SYPRO Red (Sigma), using an actin standard. Basal (kbasal) and maximally stimulated
(kcat) ATPase rates were obtained by fitting the rate vs microtubule concentration curves to
the equation below as described (S14). Fitting was carried out using the Ezyfit toolbox in
Matlab.
basalbasalcatobs kMTKm
MTkkk
])[(
][)(
Single Molecule Assays
GST-Dyn1331kD based constructs were labelled by incubation with 10 μM Halo-TMR for 10
minutes followed by a microtubule bind and release to remove unbound dye. The final
supernatant was aliquoted in 3 μl aliquots and stored at -80oC. The single molecule
velocities of these labelled motors were measured as previously described (S13) in the same
buffer used in the ATPase assay supplemented with 1.25 mg/ml casein, 0.2% glucose, 1
μg/ml glucose oxidase, 0.2% catalase and 1% BME.
Directionality assays were carried out using a kinesin construct (K490 R367C) labelled
with Cy5-maleimide and conditions that were modified to allow kinesin motility to be
observed (12 mM PIPES pH 6.8, 1 mM MgCl2, 1 mM EGTA, 10 μM ATP, 1% pyruvate
kinase, 2 mM phosphoenolpyruvate, 1.25 mg/ml casein, 0.2% glucose, 1 μg/ml glucose
oxidase, 0.2% catalase and 1% BME).
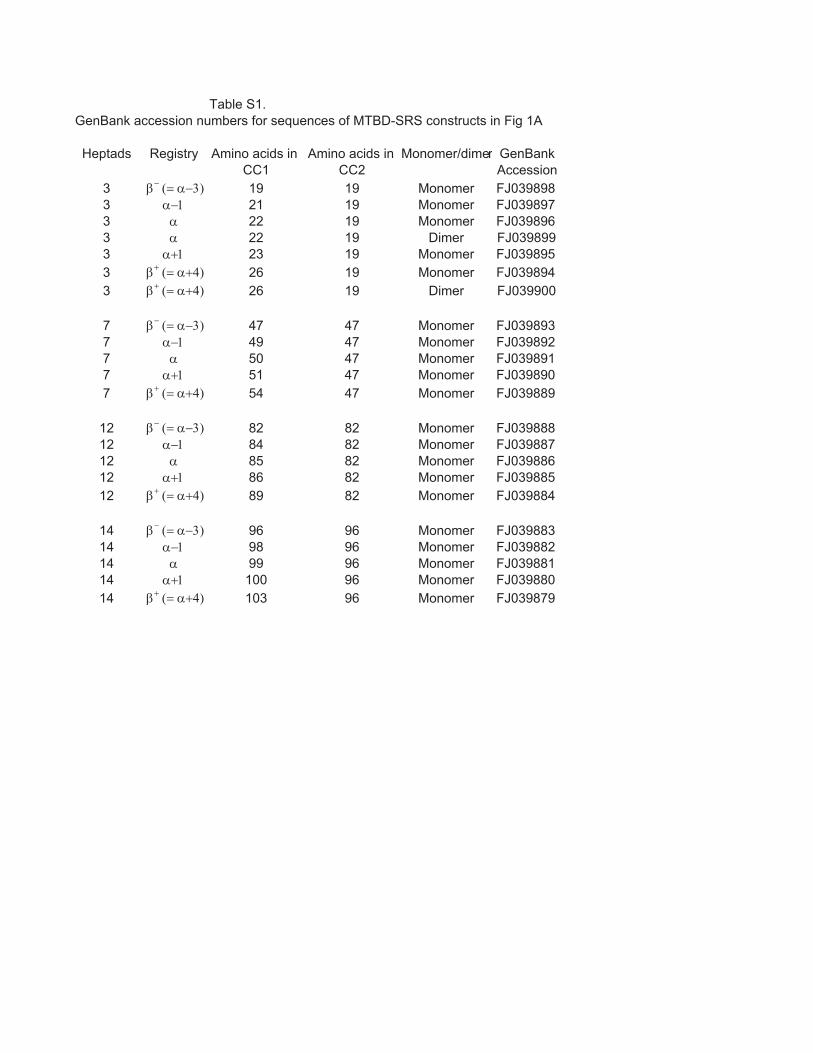
Table S1.
Heptads Registry Amino acids in Amino acids in Monomer/dimer GenBankCC1 CC2 Accession
3 β− (= α−3) 19 19 Monomer FJ0398983 α−1 21 19 Monomer FJ0398973 α 22 19 Monomer FJ0398963 α 22 19 Dimer FJ0398993 α+1 23 19 Monomer FJ0398953 β+ (= α+4) 26 19 Monomer FJ0398943 β+ (= α+4) 26 19 Dimer FJ039900
7 β− (= α−3) 47 47 Monomer FJ0398937 α−1 49 47 Monomer FJ0398927 α 50 47 Monomer FJ0398917 α+1 51 47 Monomer FJ0398907 β+ (= α+4) 54 47 Monomer FJ039889
12 β− (= α−3) 82 82 Monomer FJ03988812 α−1 84 82 Monomer FJ03988712 α 85 82 Monomer FJ03988612 α+1 86 82 Monomer FJ03988512 β+ (= α+4) 89 82 Monomer FJ039884
14 β− (= α−3) 96 96 Monomer FJ03988314 α−1 98 96 Monomer FJ03988214 α 99 96 Monomer FJ03988114 α+1 100 96 Monomer FJ03988014 β+ (= α+4) 103 96 Monomer FJ039879
GenBank accession numbers for sequences of MTBD-SRS constructs in Fig 1A
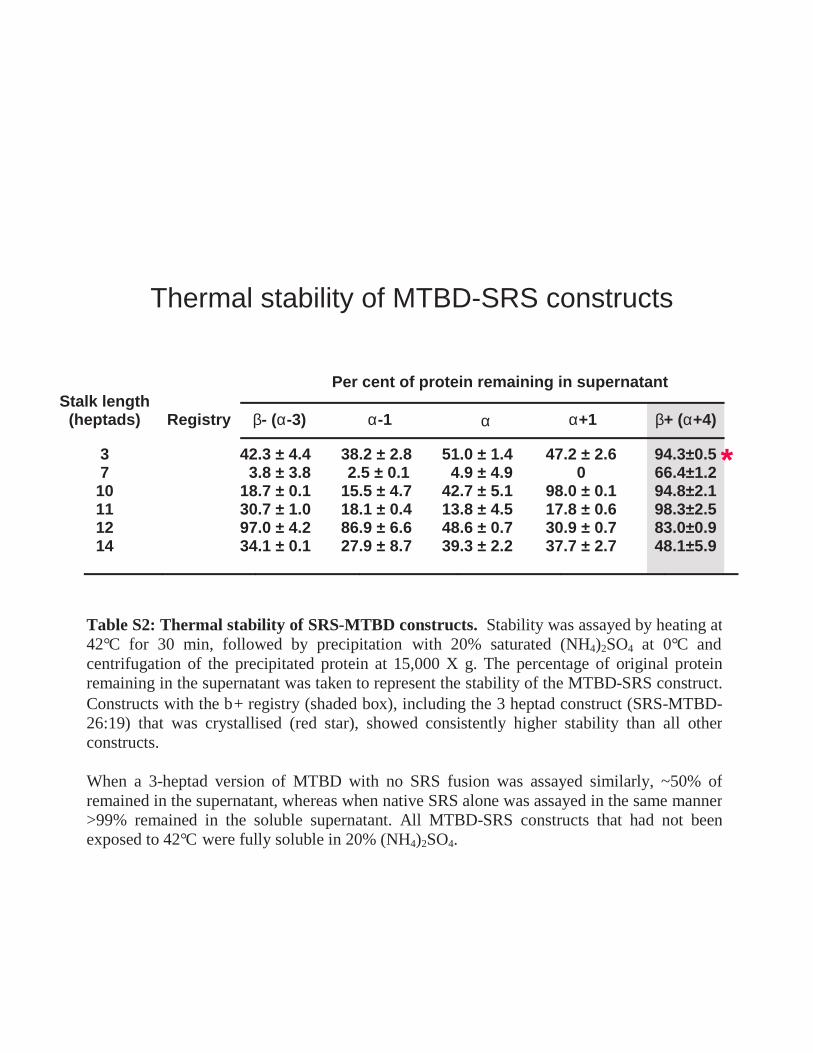
Per cent of protein remaining in supernatant
Stalk length (heptads)
Registry
3 42.3 *β- (α-3) α α+1 β+ (α+4)α-1
± 4.4 7 3.8 ± 3.8 10 18.7 ± 0.1 11 30.7 ± 1.0 12 97.0 ± 4.2 14 34.1 ± 0.1
38.2 ± 2.8 2.5 ± 0.1 15.5 ± 4.7 18.1 ± 0.4 86.9 ± 6.6 27.9 ± 8.7
51.0 ± 1.4 4.9 ± 4.9 42.7 ± 5.1 13.8 ± 4.5 48.6 ± 0.7 39.3 ± 2.2
47.2 ± 2.6 0
98.0 ± 0.1 17.8 ± 0.6 30.9 ± 0.7 37.7 ± 2.7
94.3±0.5 66.4±1.2 94.8±2.1 98.3±2.5 83.0±0.9 48.1±5.9
Thermal stability of MTBD-SRS constructs
Table S2: Thermal stability of SRS-MTBD constructs. Stability was assayed by heating at 42°C for 30 min, followed by precipitation with 20% saturated (NH4)2SO4 at 0°C and centrifugation of the precipitated protein at 15,000 X g. The percentage of original protein remaining in the supernatant was taken to represent the stability of the MTBD-SRS construct. Constructs with the b+ registry (shaded box), including the 3 heptad construct (SRS-MTBD-26:19) that was crystallised (red star), showed consistently higher stability than all other constructs. When a 3-heptad version of MTBD with no SRS fusion was assayed similarly, ~50% of remained in the supernatant, whereas when native SRS alone was assayed in the same manner >99% remained in the soluble supernatant. All MTBD-SRS constructs that had not been exposed to 42°C were fully soluble in 20% (NH4)2SO4.
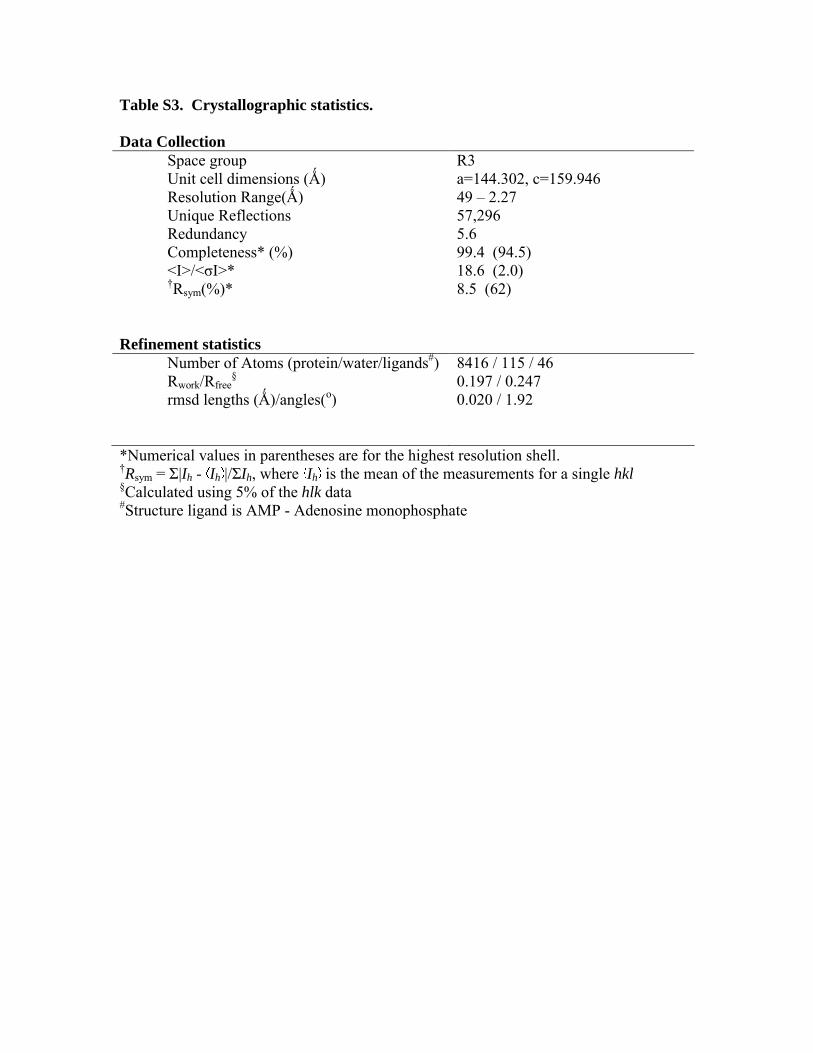
Table S3. Crystallographic statistics.
Data CollectionSpace group R3Unit cell dimensions (Ǻ) a=144.302, c=159.946Resolution Range(Ǻ) 49 – 2.27Unique Reflections 57,296Redundancy 5.6Completeness* (%) 99.4 (94.5)<I>/<σI>* 18.6 (2.0)†Rsym(%)* 8.5 (62)
Refinement statisticsNumber of Atoms (protein/water/ligands#) 8416 / 115 / 46Rwork/Rfree
§ 0.197 / 0.247 rmsd lengths (Ǻ)/angles(o) 0.020 / 1.92
*Numerical values in parentheses are for the highest resolution shell.†Rsym = Σ|Ih - Ih |/ΣIh, where Ih is the mean of the measurements for a single hkl§Calculated using 5% of the hlk data #Structure ligand is AMP - Adenosine monophosphate
LLALD EVQELKKRLQEVQTERNQVAKRVLAELRAEKERLAEELRKAEEGLAKGRAIL
PKAPPAEKEE
RN
C
Seryl tRNA synthetase (SRS)
3-heptad
3-heptad
α (22:19) α (50:47) α (85:82) α (99:96)
α registry (22:19) 3-heptad β- registry (19:19)
7-heptad 14-heptad 12-heptad
*
*
KQQEVIADKQMSVKEDLDKVE AVIEAQNAVLAELKQQNDKADDELKQLENRL EVRKLMDAYNLQALLAVD
N
C
..a..d...a..d...a..d...a..d...a
d...a..d...a..d...a..d...a..d...aP
3-heptad β+ registry (26:19)
LAELKQQNDKADDELKQLENRL EVRKLMDAYNLQAIAWKVMPLLAVD
N
C
..a..d...a..d...a..d...a...d...a....
d...a..d...a..d...a..d...a..d...a.......P
EKQQEVIADKQMSVKEDLDKV AVIEAQNAVPEQLH
P
N
C
..a..d...a..d...a..d...a..d...a..d...a..d...a..d...a..d...a..d...a
d...a..d...a..d...a..d...a..d...a.....a..d...a..d...a..d.
a..d...a..d.
a..d...a..d ..a..d...a..
KQQEVIADKQMSVKEDLDKVE AVIEAQNAVKQQNDKADDELKQLENRL EVRKLMDAYNLQA
..a..d...a..d...a..d...a..d...a
d...a..d...a..d...a..d...a..d...aP
P
LLAVDEVIADKQMSVKEDLDKVE AVIEAQNAVLAELKQQNDKADDELKQLENRL EVRKLMDAYNLQA
N
C
..a..d...a..d...a..d...a..d...a
d...a..d...a..d...a..d...a..d...a
PP
*
NLFHEKRSELEEQQMHLNV LRKIKETVDQVEELRRALRIKSQELEVKNAAANDKLKKMVKDQQEAEKKKVMSQEIQEQLH GWLLCDGAITSMQNKFTESTKE REREASLSKLLATSRNVKAEVAALDAKIAQAESILVAYEEKYRAISAELDRIMQEVENA
A)
B)
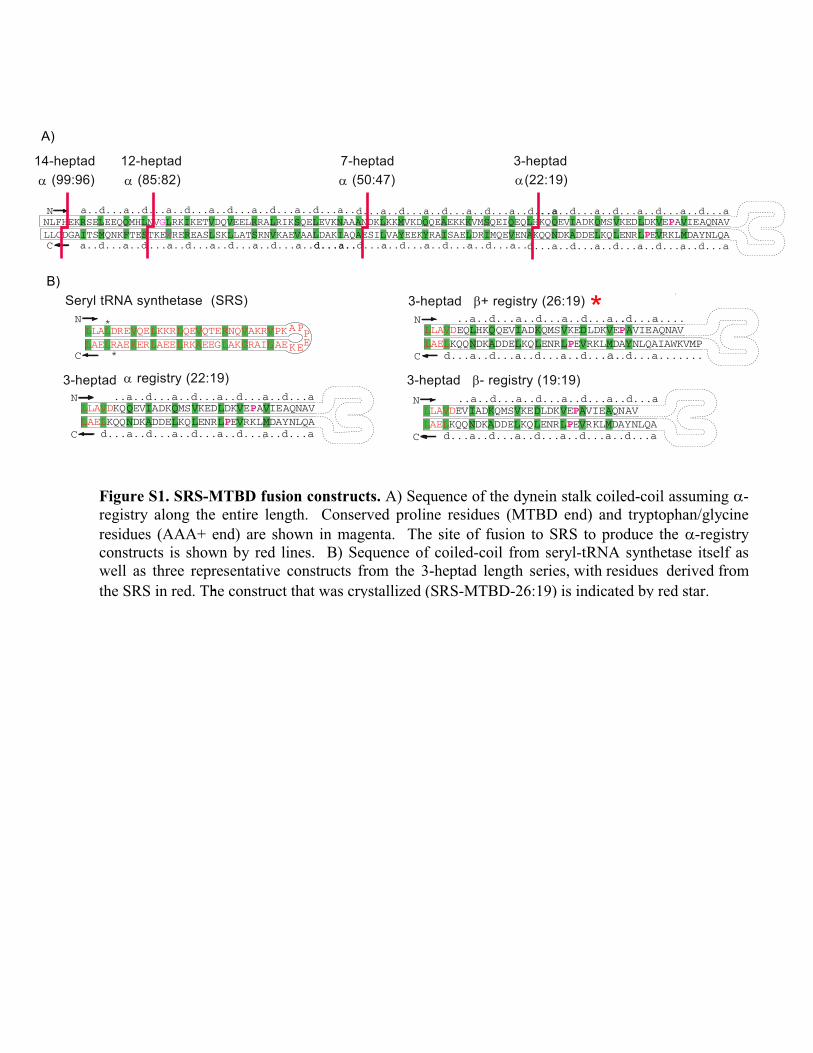
Figure S1. SRS-MTBD fusion constructs. A) Sequence of the dynein stalk coiled-coil assuming α-
registry along the entire length. Conserved proline residues (MTBD end) and tryptophan/glycine
residues (AAA+ end) are shown in magenta. The site of fusion to SRS to produce the α-registry
constructs is shown by red lines. B) Sequence of coiled-coil from seryl-tRNA synthetase itself as
well as three representative constructs from the 3-heptad length series, with residues derived from
the SRS in red. The construct that was crystallized (SRS-MTBD-26:19) is indicated by red star.-
CC1 H1 H2 H3
H4 H5 H6 CC2
P3285 P3311 W3334
P3409
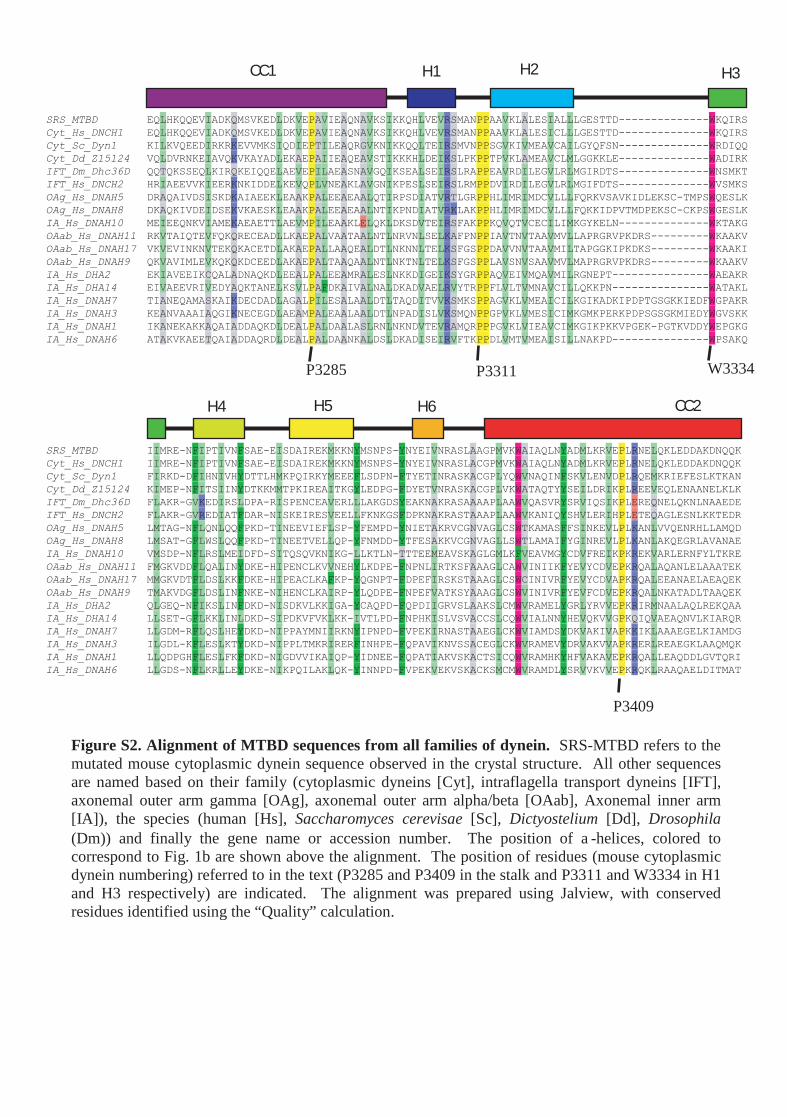
Figure S2. Alignment of MTBD sequences from all families of dynein. SRS-MTBD refers to the mutated mouse cytoplasmic dynein sequence observed in the crystal structure. All other sequences are named based on their family (cytoplasmic dyneins [Cyt], intraflagella transport dyneins [IFT], axonemal outer arm gamma [OAg], axonemal outer arm alpha/beta [OAab], Axonemal inner arm [IA]), the species (human [Hs], Saccharomyces cerevisae [Sc], Dictyostelium [Dd], Drosophila (Dm)) and finally the gene name or accession number. The position of a-helices, colored to correspond to Fig. 1b are shown above the alignment. The position of residues (mouse cytoplasmic dynein numbering) referred to in the text (P3285 and P3409 in the stalk and P3311 and W3334 in H1 and H3 respectively) are indicated. The alignment was prepared using Jalview, with conserved residues identified using the “Quality” calculation.
A
180o
C D
CC1 H1 H2 H3
H4 H5 H6 CC2
*
*
K3299 E3304R3306
R3337 S3338
R3382
B
E
10.4
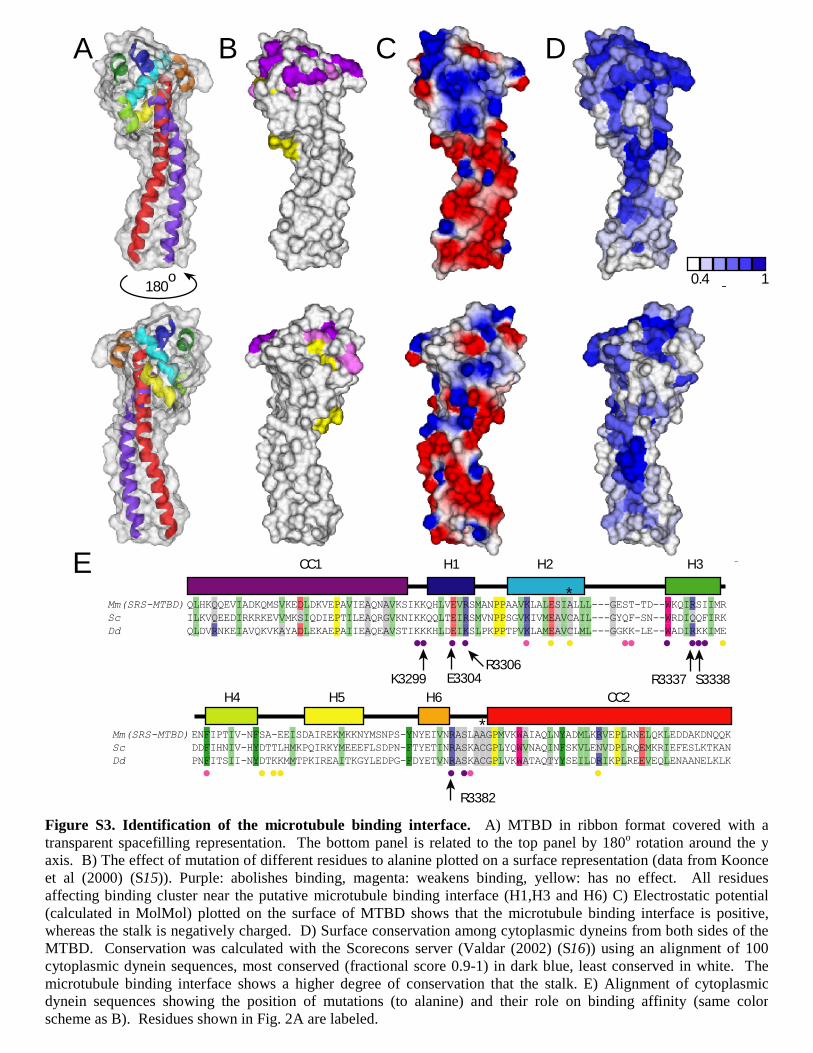
Figure S3. Identification of the microtubule binding interface. A) MTBD in ribbon format covered with a transparent spacefilling representation. The bottom panel is related to the top panel by 180o rotation around the y axis. B) The effect of mutation of different residues to alanine plotted on a surface representation (data from Koonce et al (2000) (S15)). Purple: abolishes binding, magenta: weakens binding, yellow: has no effect. All residues affecting binding cluster near the putative microtubule binding interface (H1,H3 and H6) C) Electrostatic potential (calculated in MolMol) plotted on the surface of MTBD shows that the microtubule binding interface is positive, whereas the stalk is negatively charged. D) Surface conservation among cytoplasmic dyneins from both sides of the MTBD. Conservation was calculated with the Scorecons server (Valdar (2002) (S16)) using an alignment of 100 cytoplasmic dynein sequences, most conserved (fractional score 0.9-1) in dark blue, least conserved in white. The microtubule binding interface shows a higher degree of conservation that the stalk. E) Alignment of cytoplasmic dynein sequences showing the position of mutations (to alanine) and their role on binding affinity (same color scheme as B). Residues shown in Fig. 2A are labeled.
B C+
Kinesin
Dynein MTBD
+ -
100nm
A
D
Helix 4
-
H1H3
β β αα
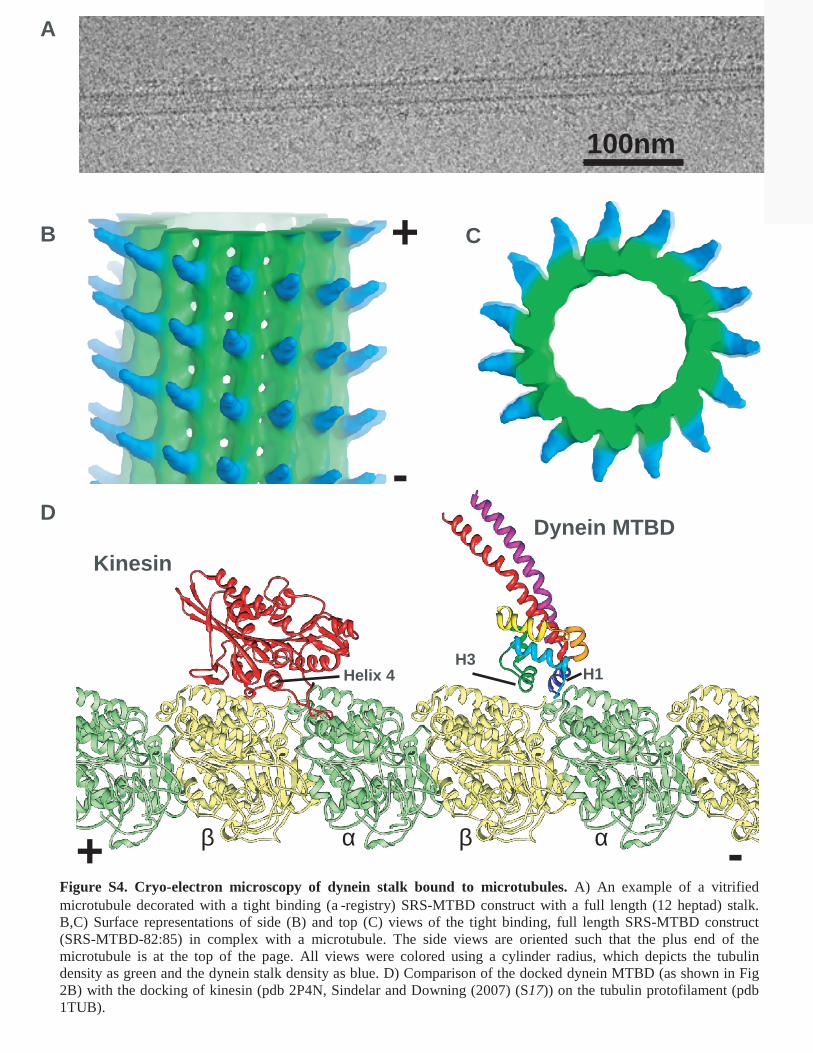
Figure S4. Cryo-electron microscopy of dynein stalk bound to microtubules. A) An example of a vitrified microtubule decorated with a tight binding (a-registry) SRS-MTBD construct with a full length (12 heptad) stalk. B,C) Surface representations of side (B) and top (C) views of the tight binding, full length SRS-MTBD construct (SRS-MTBD-82:85) in complex with a microtubule. The side views are oriented such that the plus end of the microtubule is at the top of the page. All views were colored using a cylinder radius, which depicts the tubulin density as green and the dynein stalk density as blue. D) Comparison of the docked dynein MTBD (as shown in Fig 2B) with the docking of kinesin (pdb 2P4N, Sindelar and Downing (2007) (S17)) on the tubulin protofilament (pdb 1TUB).
SRS
MTBD
Chain A Chain B
A) B) C) D)
180o
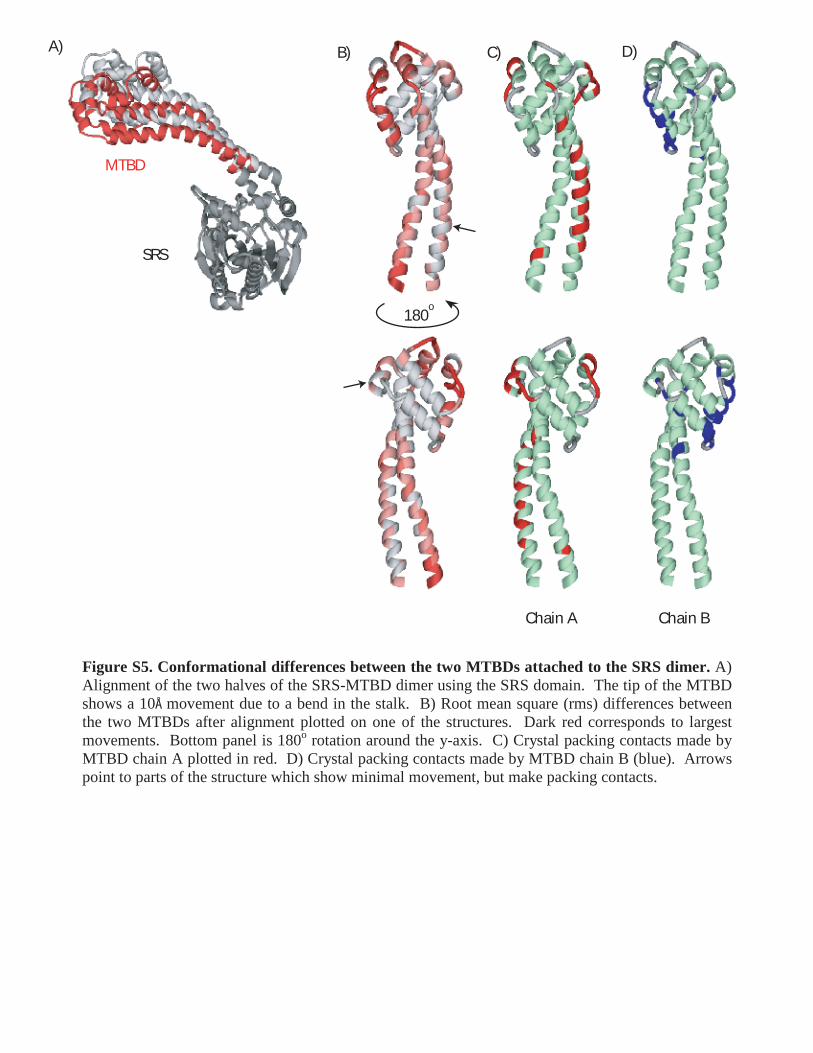
Figure S5. Conformational differences between the two MTBDs attached to the SRS dimer. A) Alignment of the two halves of the SRS-MTBD dimer using the SRS domain. The tip of the MTBD shows a 10Å movement due to a bend in the stalk. B) Root mean square (rms) differences between the two MTBDs after alignment plotted on one of the structures. Dark red corresponds to largest movements. Bottom panel is 180o rotation around the y-axis. C) Crystal packing contacts made by MTBD chain A plotted in red. D) Crystal packing contacts made by MTBD chain B (blue). Arrows point to parts of the structure which show minimal movement, but make packing contacts.
CC1
A)
B)
CC2
Native +7-7
NE
L:E
ED
LKT
:ISL
VQ
E:K
SL
DQ
T:E
DI S
LK:N
LAV
DR
:TK
A
N C
NC
Sc 3010 LQENQRFVNVGLEKLNESVLKVNELNKTLSKKSTELTEKEKEARSTLDKMLMEQNESERKQEATEEIKKILKVQEEDIRKRKEVVMKSIQDIEPTILE Mm 3192 LEEQQMHLNVGLRKIKETVDQVEELRRALRIKSQELEVKNAAANDKLKKMVKDQQEAEKKKVMSQEIQEQLHKQQEVIADKQMSVKEDLDKVEPAVIE Dm 3179 LEEQQLHLNVGLNKIAETVEQVEEMQKSLAVKKQELQAKNEAANAKLKQMFQDQQEAEKKKIQSQEIQIRLADQTVKIEEKRKYVMADLAQVEPAVID Dd 3273 LEEEQLHLNIGLKKLRDTEAQVKDLQVSLAQKNRELDVKNEQANQKLKQMVQDQQAAEIKQKDARELQVQLDVRNKEIAVQKVKAYADLEKAEPAIIE
Sc FQKTTNLWREKEFTLSKVLSISRDLNAQVNSMETKIAEVDRILLSYKRKSVEISAELDQTMEEAALLNAKTKLSEFEIRKMEQRLPDVNELVKSFNIQ 3216 Mm FTESTKEWREREASLSKLLATSRNVKAEVAALDAKIAQAESILVAYEEKYRAISAELDRIMQEVENAKQQNDKADDELKQLENRLPEVRKLMDAYNLQ 3397 Dm FTESTSEWREREINLSKLLAISRDVKAQVNELDTKIAQAQSILQAYEEKYAAISRELQEVLDKTEKASALNVDAQEELSRLEERLPEVRKLMDAYEIQ 3385 Dd FNESQQEWRGRESNLNDLLAISRDVKNKVKSSETKIQETERILTAYEEKYTAISKELATITAVIEDQKLKLENAANELQEVEERLPKIRDLIESYYTQ 3479
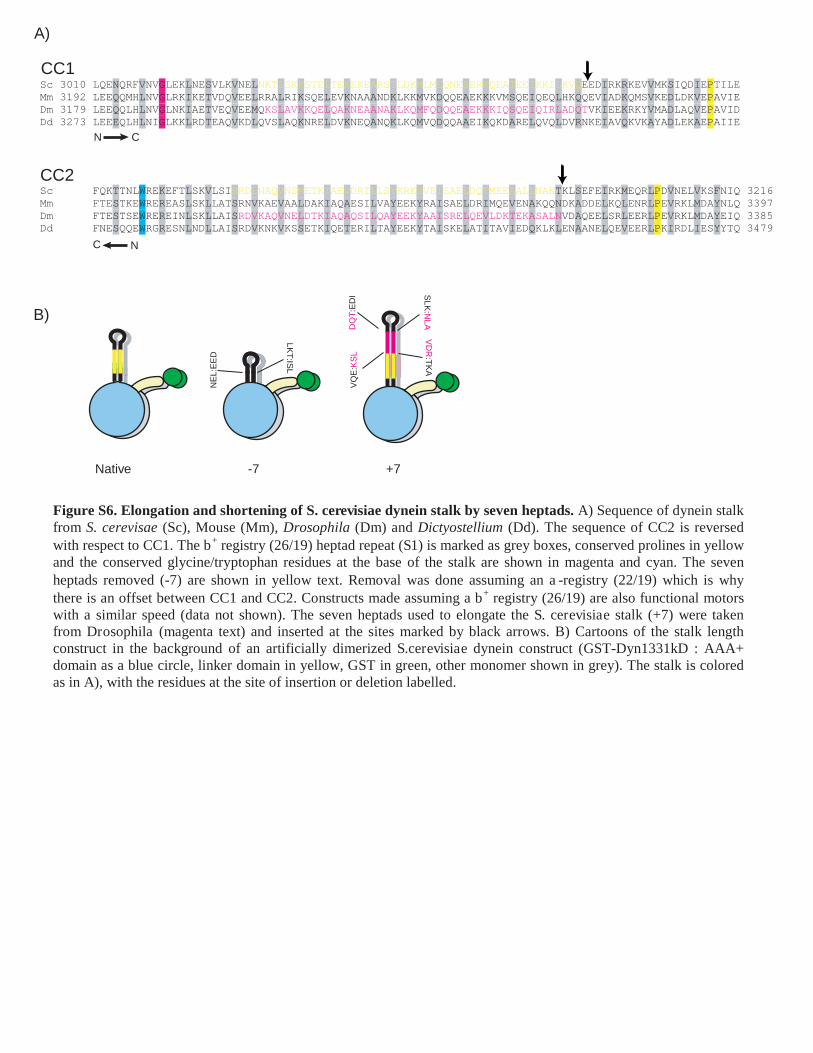
Figure S6. Elongation and shortening of S. cerevisiae dynein stalk by seven heptads. A) Sequence of dynein stalk from S. cerevisae (Sc), Mouse (Mm), Drosophila (Dm) and Dictyostellium (Dd). The sequence of CC2 is reversed with respect to CC1. The b+ registry (26/19) heptad repeat (S1) is marked as grey boxes, conserved prolines in yellow and the conserved glycine/tryptophan residues at the base of the stalk are shown in magenta and cyan. The seven heptads removed (-7) are shown in yellow text. Removal was done assuming an a-registry (22/19) which is why there is an offset between CC1 and CC2. Constructs made assuming a b+ registry (26/19) are also functional motors with a similar speed (data not shown). The seven heptads used to elongate the S. cerevisiae stalk (+7) were taken from Drosophila (magenta text) and inserted at the sites marked by black arrows. B) Cartoons of the stalk length construct in the background of an artificially dimerized S.cerevisiae dynein construct (GST-Dyn1331kD : AAA+ domain as a blue circle, linker domain in yellow, GST in green, other monomer shown in grey). The stalk is colored as in A), with the residues at the site of insertion or deletion labelled.
KQEQLH QEVIADKQMSVKE L DD VK E A VIEAQNAV
LAELKQQNDKADDELKQLENRL EVRKLMDAYNLQAIAWKVMP
LLAVDN
C P
P
I
V
L
L
N
Q
QA
A) B) C)
D)
L
Q
I
K
V
D
V
N
A
L
L
L
V
M
Y
CC1 CC2
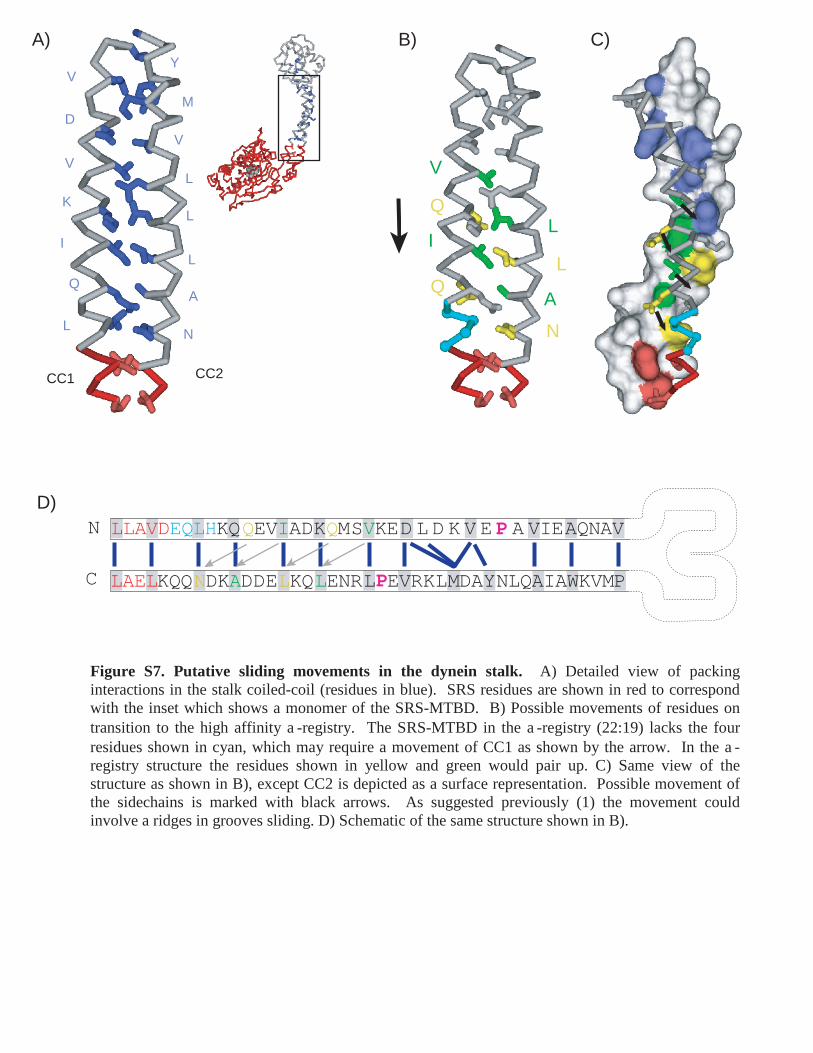
Figure S7. Putative sliding movements in the dynein stalk. A) Detailed view of packing interactions in the stalk coiled-coil (residues in blue). SRS residues are shown in red to correspond with the inset which shows a monomer of the SRS-MTBD. B) Possible movements of residues on transition to the high affinity a-registry. The SRS-MTBD in the a-registry (22:19) lacks the four residues shown in cyan, which may require a movement of CC1 as shown by the arrow. In the a-registry structure the residues shown in yellow and green would pair up. C) Same view of the structure as shown in B), except CC2 is depicted as a surface representation. Possible movement of the sidechains is marked with black arrows. As suggested previously (1) the movement could involve a ridges in grooves sliding. D) Schematic of the same structure shown in B).
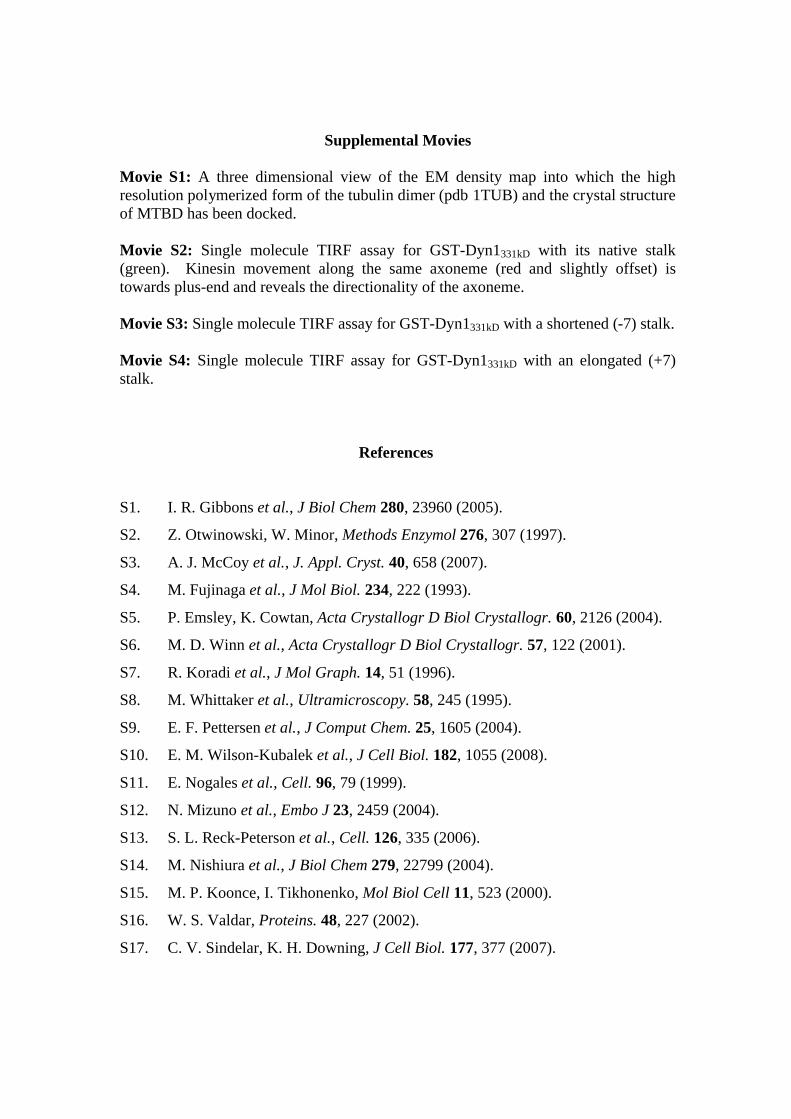
Supplemental Movies
Movie S1: A three dimensional view of the EM density map into which the high resolution polymerized form of the tubulin dimer (pdb 1TUB) and the crystal structure of MTBD has been docked.
Movie S2: Single molecule TIRF assay for GST-Dyn1331kD with its native stalk(green). Kinesin movement along the same axoneme (red and slightly offset) is towards plus-end and reveals the directionality of the axoneme.
Movie S3: Single molecule TIRF assay for GST-Dyn1331kD with a shortened (-7) stalk.
Movie S4: Single molecule TIRF assay for GST-Dyn1331kD with an elongated (+7) stalk.
References
S1. I. R. Gibbons et al., J Biol Chem 280, 23960 (2005).
S2. Z. Otwinowski, W. Minor, Methods Enzymol 276, 307 (1997).
S3. A. J. McCoy et al., J. Appl. Cryst. 40, 658 (2007).
S4. M. Fujinaga et al., J Mol Biol. 234, 222 (1993).
S5. P. Emsley, K. Cowtan, Acta Crystallogr D Biol Crystallogr. 60, 2126 (2004).
S6. M. D. Winn et al., Acta Crystallogr D Biol Crystallogr. 57, 122 (2001).
S7. R. Koradi et al., J Mol Graph. 14, 51 (1996).
S8. M. Whittaker et al., Ultramicroscopy. 58, 245 (1995).
S9. E. F. Pettersen et al., J Comput Chem. 25, 1605 (2004).
S10. E. M. Wilson-Kubalek et al., J Cell Biol. 182, 1055 (2008).
S11. E. Nogales et al., Cell. 96, 79 (1999).
S12. N. Mizuno et al., Embo J 23, 2459 (2004).
S13. S. L. Reck-Peterson et al., Cell. 126, 335 (2006).
S14. M. Nishiura et al., J Biol Chem 279, 22799 (2004).
S15. M. P. Koonce, I. Tikhonenko, Mol Biol Cell 11, 523 (2000).
S16. W. S. Valdar, Proteins. 48, 227 (2002).
S17. C. V. Sindelar, K. H. Downing, J Cell Biol. 177, 377 (2007).


![Supporting Online Material for - P[acman] Resources](https://img.pdfslide.net/doc/110x75/613d4dd5736caf36b75bbcd1/supporting-online-material-for-pacman-resources.jpg)

