Embed Size (px)
Citation preview
www.sciencemag.org/cgi/content/full/330/6002/353/DC1
Supporting Online Material for
Room-Temperature Detection of a Single Molecule's Absorption by Photothermal Contrast
A. Gaiduk, M. Yorulmaz, P. V. Ruijgrok, M. Orrit*
*To whom correspondence should be addressed. E-mail: [email protected]
Published 15 October 2010, Science 330, 353 (2005) DOI: 10.1126/science.1195475
This PDF file includes:
Materials and Methods Figs. S1 to S9 Table S1 References
1
Supporting Online Material for
Room-temperature detection of a single molecule's
absorption by photothermal contrast
A. Gaiduk, M. Yorulmaz, P. V. Ruijgrok, M. Orrit
Institute of Physics, Leiden University, P.O. Box 9504, 2300 RA Leiden,
The Netherlands
This PDF file includes: Supporting Online Material Figures S1-S9 Table S1 References
2
Supporting Online Material 1. Experimental Setup and signal-to-noise ratio
The experimental setup is based on an inverted optical microscope, Olympus
IX71, equipped with Olympus 60x oil immersion objectives (NA = 1.45). The
heating beam is provided by an Ar-ion laser (Coherent Innova 300) and passes
the acousto-optical modulator with a typical modulation frequency Ω = 740 kHz.
The probe beam at 800 nm is produced by a Ti:sapphire laser (S3900s, Spectra
Physics) pumped with the Ar-ion laser. Sets of spatial filters and telescopes
expand initial beams to ~ 20 mm to overfill the entrance pupil of the microscope
objective (~ 10 mm). The beams are overlapped at a dichroic mirror and sent
towards the objective. The photothermal signal is collected in the back-scattered
mode and detected by a Si photodiode with an adjustable gain (DHPCA-100-F,
Femto). The fluorescence collected by the same objective passes the dichroic
mirror (AHF z532/NIR) and a confocal pinhole (50 µm). It is filtered with a set of
bandpass filters (AHF 615/150 and Omega 595/100) and detected by an photon-
counting avalanche photodetector (SPCM-AQR-16). Optionally, a wide-field
fluorescence imaging with an intensified CCD (PentaMAX, Roper Scientific) is
possible. The experiment is controlled with a home-written LabView software,
and the data are collected by an acquisition card (ADWin Gold). The raster
scanning of the samples is performed with a 3-axis piezostage (MARS II, Physik
Instrumente).
An important point to consider when detecting weak signals are rapid fluctuations
of the laser intensity, called 'laser noise'. In the absence of laser noise, detection
would be limited by photon noise and detector noise. In this case, the
photothermal signal-to-noise ratio would not depend on the reflection coefficient
of the glass-liquid interface (S1). Real systems, however, present laser noise.
The backward scattered geometry used here offers the possibility to reduce laser
noise considerably, by matching the refraction indices of the substrate and of the
photothermal liquid. In the present work, we detected only 10-15 µW of the
3
incident probe beam (power about 100 mW), corresponding to a reflection of
about 10-4. Such a weak reflection was obtained by using glycerol as the
photothermal liquid ( . 1.47glycn = ) on top of a substrate of normal glass
( . 1.52subsn = ).
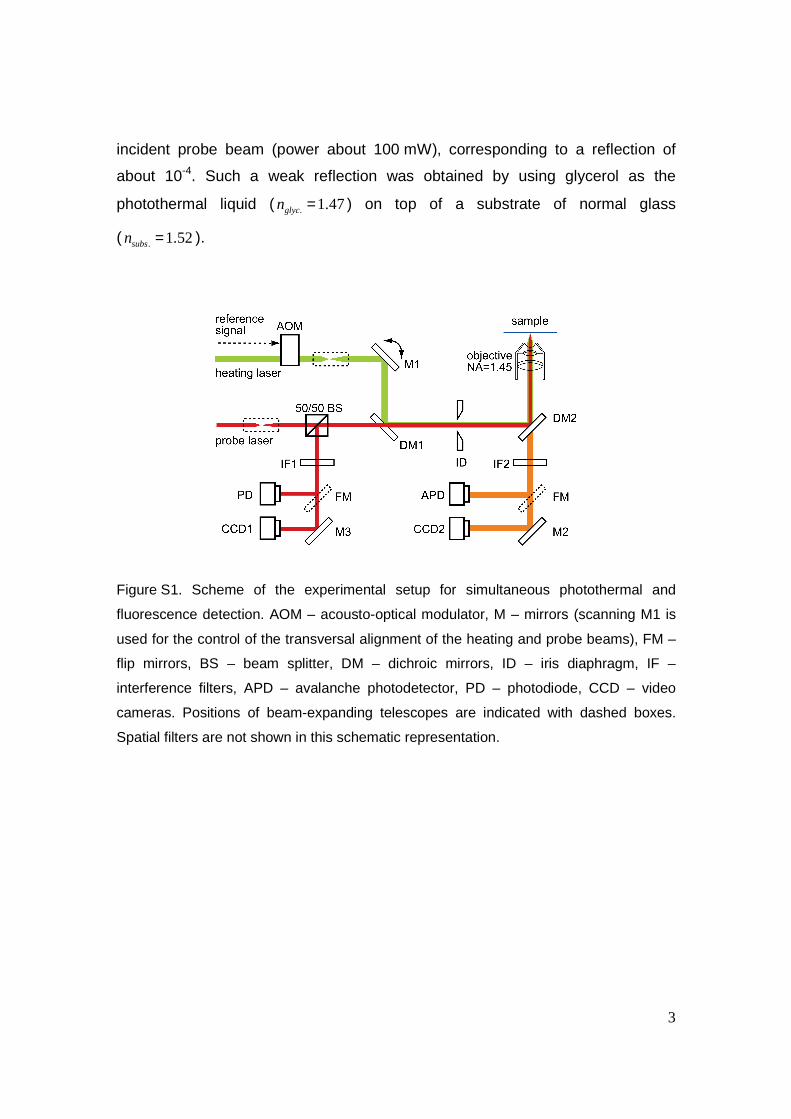
Figure S1. Scheme of the experimental setup for simultaneous photothermal and
fluorescence detection. AOM – acousto-optical modulator, M – mirrors (scanning M1 is
used for the control of the transversal alignment of the heating and probe beams), FM –
flip mirrors, BS – beam splitter, DM – dichroic mirrors, ID – iris diaphragm, IF –
interference filters, APD – avalanche photodetector, PD – photodiode, CCD – video
cameras. Positions of beam-expanding telescopes are indicated with dashed boxes.
Spatial filters are not shown in this schematic representation.
4
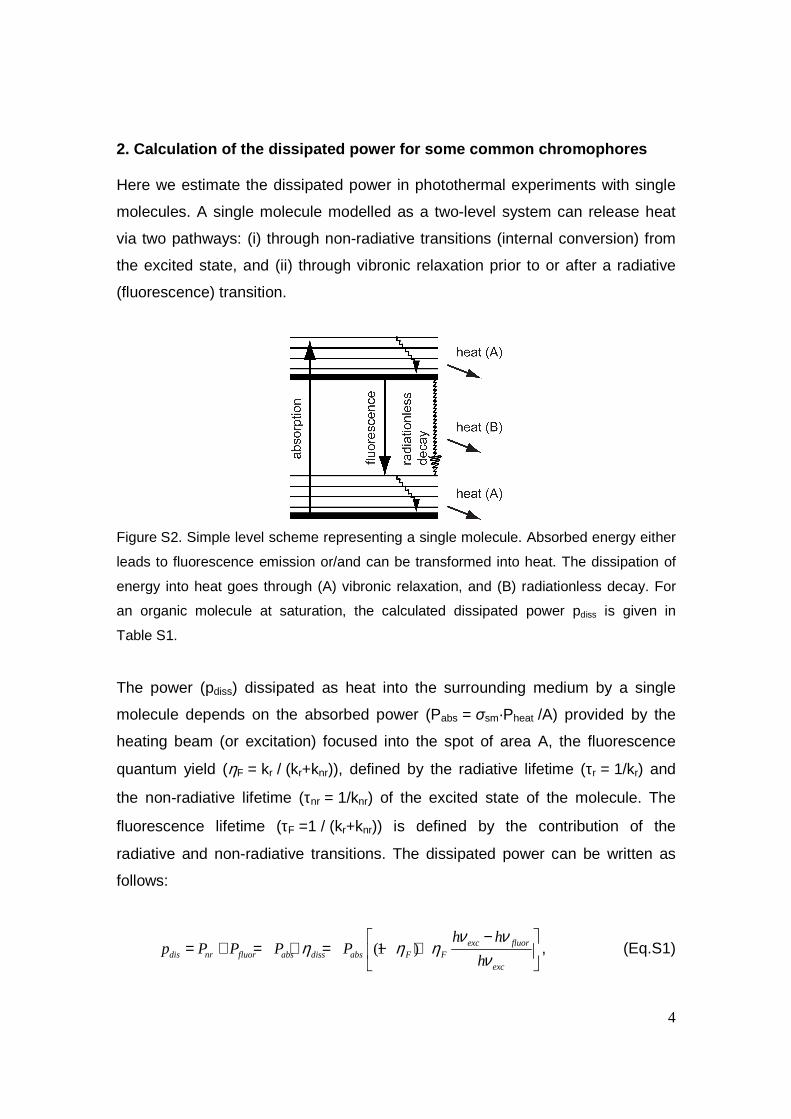
2. Calculation of the dissipated power for some com mon chromophores Here we estimate the dissipated power in photothermal experiments with single
molecules. A single molecule modelled as a two-level system can release heat
via two pathways: (i) through non-radiative transitions (internal conversion) from
the excited state, and (ii) through vibronic relaxation prior to or after a radiative
(fluorescence) transition.
Figure S2. Simple level scheme representing a single molecule. Absorbed energy either
leads to fluorescence emission or/and can be transformed into heat. The dissipation of
energy into heat goes through (A) vibronic relaxation, and (B) radiationless decay. For
an organic molecule at saturation, the calculated dissipated power pdiss is given in
Table S1.
The power (pdiss) dissipated as heat into the surrounding medium by a single
molecule depends on the absorbed power (Pabs = σsm·Pheat /A) provided by the
heating beam (or excitation) focused into the spot of area A, the fluorescence
quantum yield (ηF = kr / (kr+knr)), defined by the radiative lifetime (τr = 1/kr) and
the non-radiative lifetime (τnr = 1/knr) of the excited state of the molecule. The
fluorescence lifetime (τF =1 / (kr+knr)) is defined by the contribution of the
radiative and non-radiative transitions. The dissipated power can be written as
follows:
(1 ) exc fluordis nr fluor abs diss abs F F
exc
h hp P P P P
h
ν νη η η
ν−
= + = ⋅ = − +
, (Eq.S1)
5
where νexc and νfluor are frequencies of excitation and fluorescence, Pheat = Pexc is
the power of the heating laser (fluorescence excitation), ηdiss is the dissipation
yield.
In the approximation of a two-level system the heating laser power
required for absorption saturation ( satheatP ) is given by the following equation:
1satheat heat
F sm
AP hν
τ σ= (Eq.S2)
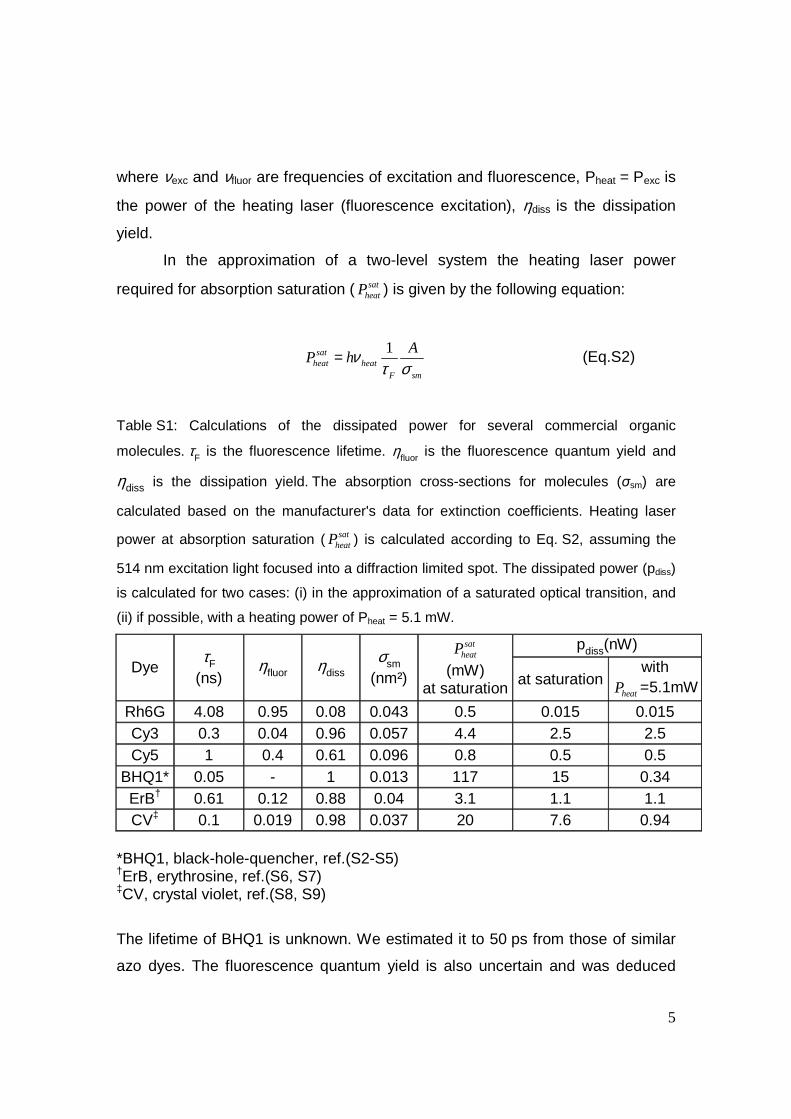
Table S1: Calculations of the dissipated power for several commercial organic
molecules. τF is the fluorescence lifetime. ηfluor is the fluorescence quantum yield and
ηdiss is the dissipation yield. The absorption cross-sections for molecules (σsm) are
calculated based on the manufacturer's data for extinction coefficients. Heating laser
power at absorption saturation ( satheatP ) is calculated according to Eq. S2, assuming the
514 nm excitation light focused into a diffraction limited spot. The dissipated power (pdiss)
is calculated for two cases: (i) in the approximation of a saturated optical transition, and
(ii) if possible, with a heating power of Pheat = 5.1 mW.
pdiss(nW)
Dye τF
(ns) ηfluor ηdiss
σsm (nm²)
satheatP
(mW) at saturation
at saturation with
heatP =5.1mW
Rh6G 4.08 0.95 0.08 0.043 0.5 0.015 0.015 Cy3 0.3 0.04 0.96 0.057 4.4 2.5 2.5 Cy5 1 0.4 0.61 0.096 0.8 0.5 0.5
BHQ1* 0.05 - 1 0.013 117 15 0.34 ErB† 0.61 0.12 0.88 0.04 3.1 1.1 1.1 CV‡ 0.1 0.019 0.98 0.037 20 7.6 0.94
*BHQ1, black-hole-quencher, ref.(S2-S5) †ErB, erythrosine, ref.(S6, S7) ‡CV, сrystal violet, ref.(S8, S9)
The lifetime of BHQ1 is unknown. We estimated it to 50 ps from those of similar
azo dyes. The fluorescence quantum yield is also uncertain and was deduced
6
from the lifetime. As we can see from the Table S1, the chromophore we
selected for our experiments, BHQ1, has the highest dissipated power in the
saturation limit (15 nW), and Rh6G – the lowest one (0.015 nW). The dissipated
powers for the experimental heating power of 5.1 mW focused into a diffraction-
limited spot are about 1 nW. These small dissipated powers can be detected in
photothermal experiments with an acceptable SNR, provided suitable integration
time and probe power are chosen. We note that the high heating powers required
in single-molecule photothermal microscopy also require a good photostability of
the absorbers. This is difficult to achieve with most of the weakly fluorescent dyes
(Cy3, CV, etc.).
7
3. Samples
Glass coverslides cleaning
Glass coverslides (Menzel, Germany) were cleaned in several successive
sonication steps of 20 min in each of the following liquids: 2 % Hellmanex water
solution, acetone, ethanol (AR grade), and Milli-Q water. Experiments were
performed in a fluid cell (approx. 50-150 µL volume) made from a rubber o-ring or
a top of plastic Eppendorf tube attached to the coverslip. Clean glycerol (>99.5%,
spectrophotometric grade) and hexane (AR grade) were used for experiments.
Gold nanoparticles
Samples of gold nanoparticles with diameters of 20, 10 and 5 nm (British
Biocell International, EM.GC20) were prepared by dilution in ultra-pure water at
volume ratios of 1:4, 1:20 and 1:25 respectively. Approximately 50 µL of the
suspension were deposited on the surface of cleaned glass immediately after the
filtration through a 450 nm porous membrane and spin coated at 2000 rpm for
5 s, followed by drying at 4000 rpm for 90 sec.
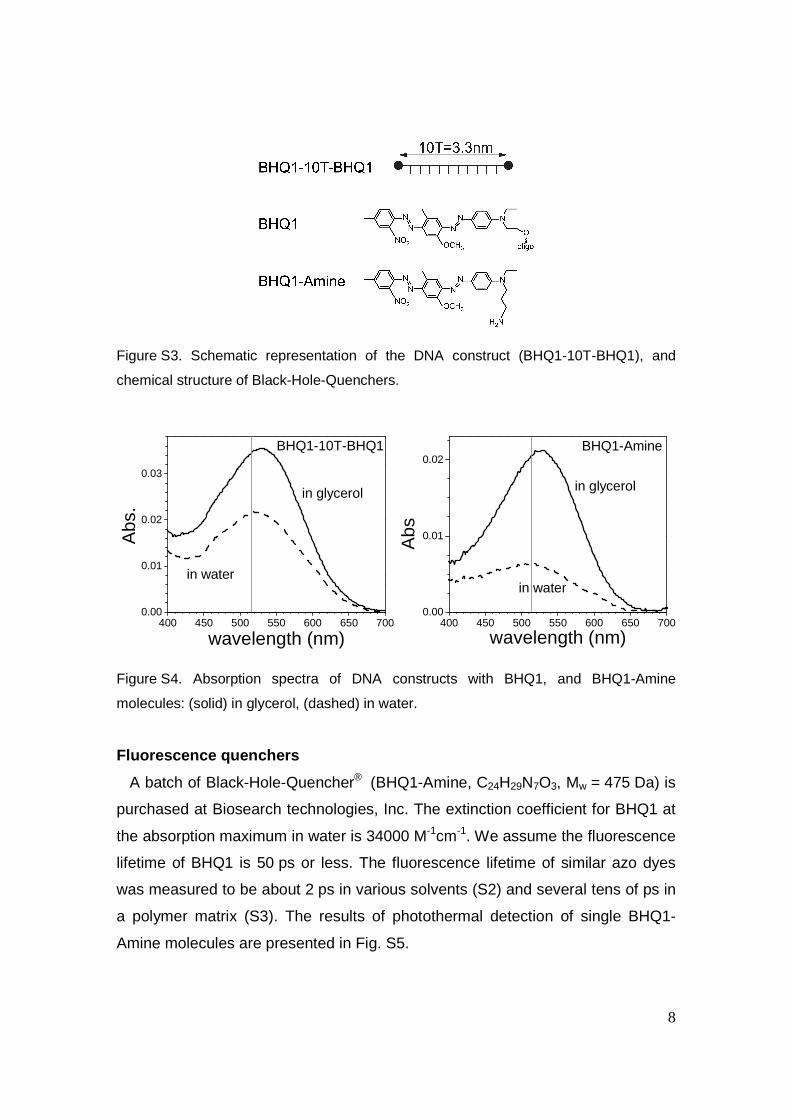
DNA constructs
Constructs of DNA with Black-Hole-Quenchers® (BHQ) were purchased from
Eurogentech. Two BHQ1 molecules (BHQ1-10T-BHQ1) are about 3-4 nm apart
as defined by the length of single-stranded DNA (ssDNA) primer (10T = 10
thymine nucleobases). The BHQ1-10T-BHQ1 construct shows maximum
absorption at 520 nm in water and at about 530 nm in glycerol (see Fig. S4). The
absorption of the construct at 514 nm is 1.6 times higher in glycerol as compared
to water.
Approximately 50 µL of the aqueous solution of DNA constructs are spin
coated at 2000 rpm for 5 s, followed by drying at 4000 rpm for 90 sec on the
surface of cleaned glass.
8
Figure S3. Schematic representation of the DNA construct (BHQ1-10T-BHQ1), and
chemical structure of Black-Hole-Quenchers.
400 450 500 550 600 650 7000.00
0.01
0.02
0.03
in glycerol
in water
Abs
.
wavelength (nm)
BHQ1-10T-BHQ1
400 450 500 550 600 650 7000.00
0.01
0.02BHQ1-Amine
in water
Abs
wavelength (nm)
in glycerol
Figure S4. Absorption spectra of DNA constructs with BHQ1, and BHQ1-Amine
molecules: (solid) in glycerol, (dashed) in water.
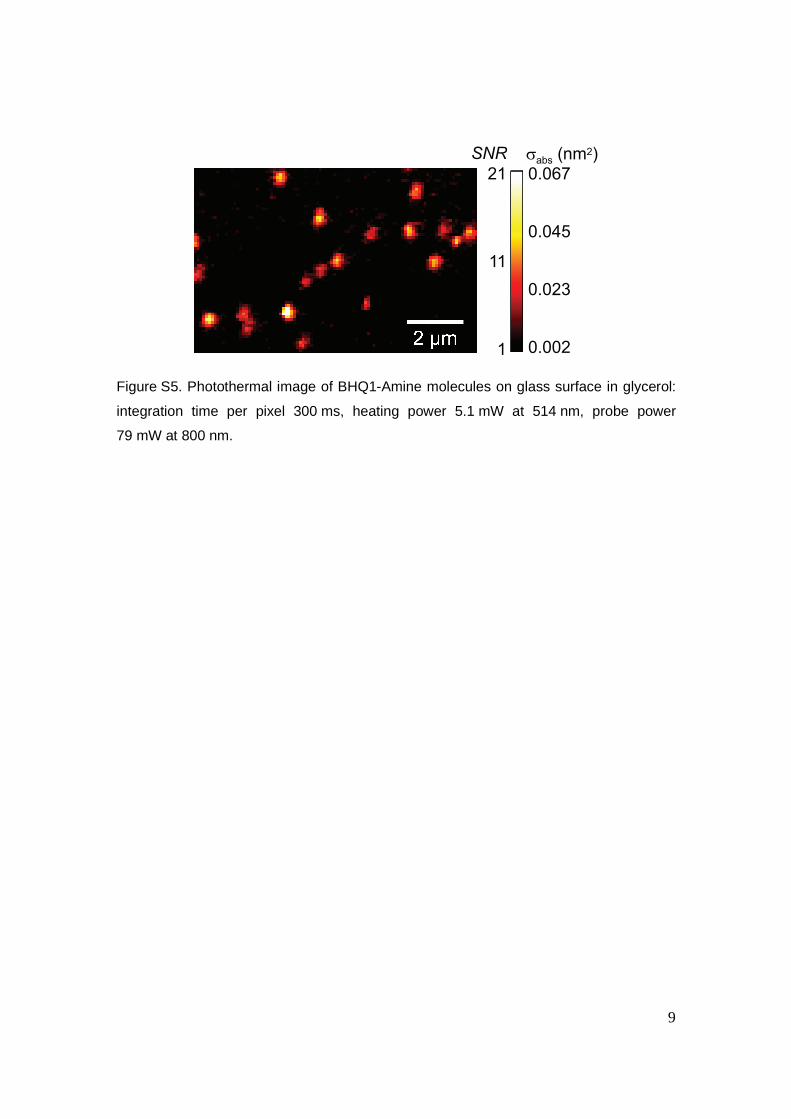
Fluorescence quenchers
A batch of Black-Hole-Quencher® (BHQ1-Amine, C24H29N7O3, Mw = 475 Da) is
purchased at Biosearch technologies, Inc. The extinction coefficient for BHQ1 at
the absorption maximum in water is 34000 M-1cm-1. We assume the fluorescence
lifetime of BHQ1 is 50 ps or less. The fluorescence lifetime of similar azo dyes
was measured to be about 2 ps in various solvents (S2) and several tens of ps in
a polymer matrix (S3). The results of photothermal detection of single BHQ1-
Amine molecules are presented in Fig. S5.
9
21
11
1
SNR σabs (nm2)
0.067
0.045
0.023
0.002 Figure S5. Photothermal image of BHQ1-Amine molecules on glass surface in glycerol:
integration time per pixel 300 ms, heating power 5.1 mW at 514 nm, probe power
79 mW at 800 nm.
10
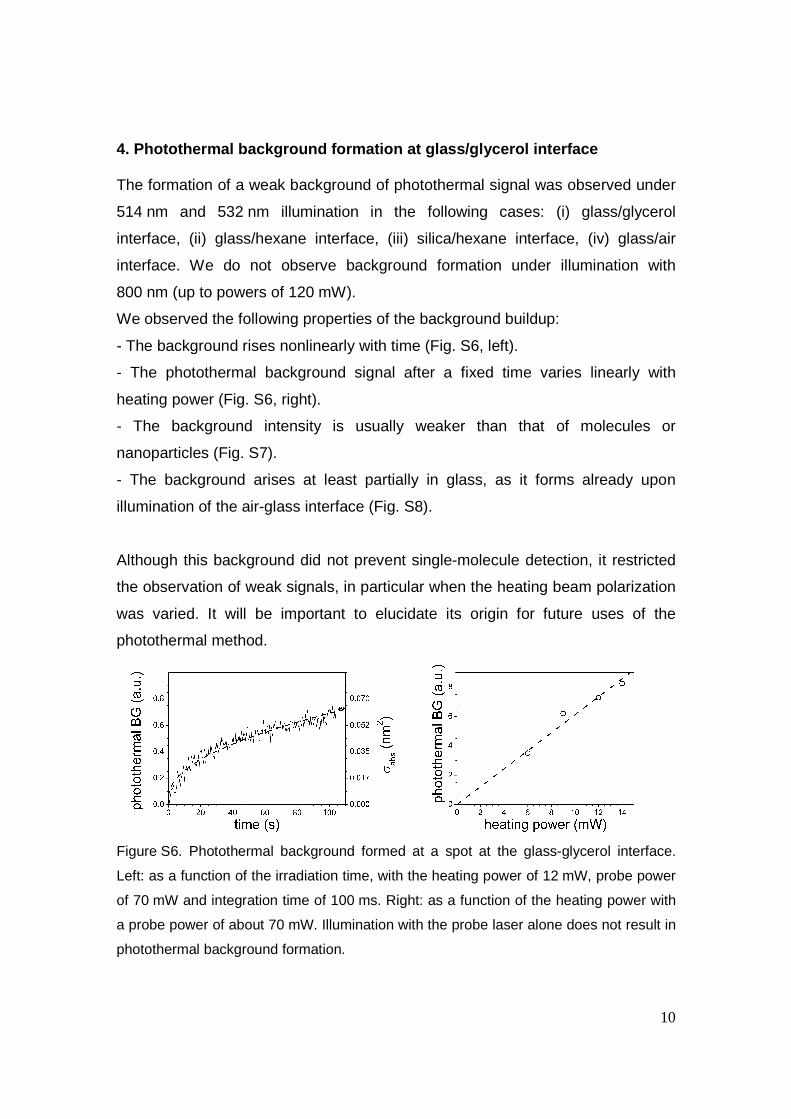
4. Photothermal background formation at glass/glyce rol interface The formation of a weak background of photothermal signal was observed under
514 nm and 532 nm illumination in the following cases: (i) glass/glycerol
interface, (ii) glass/hexane interface, (iii) silica/hexane interface, (iv) glass/air
interface. We do not observe background formation under illumination with
800 nm (up to powers of 120 mW).
We observed the following properties of the background buildup:
- The background rises nonlinearly with time (Fig. S6, left).
- The photothermal background signal after a fixed time varies linearly with
heating power (Fig. S6, right).
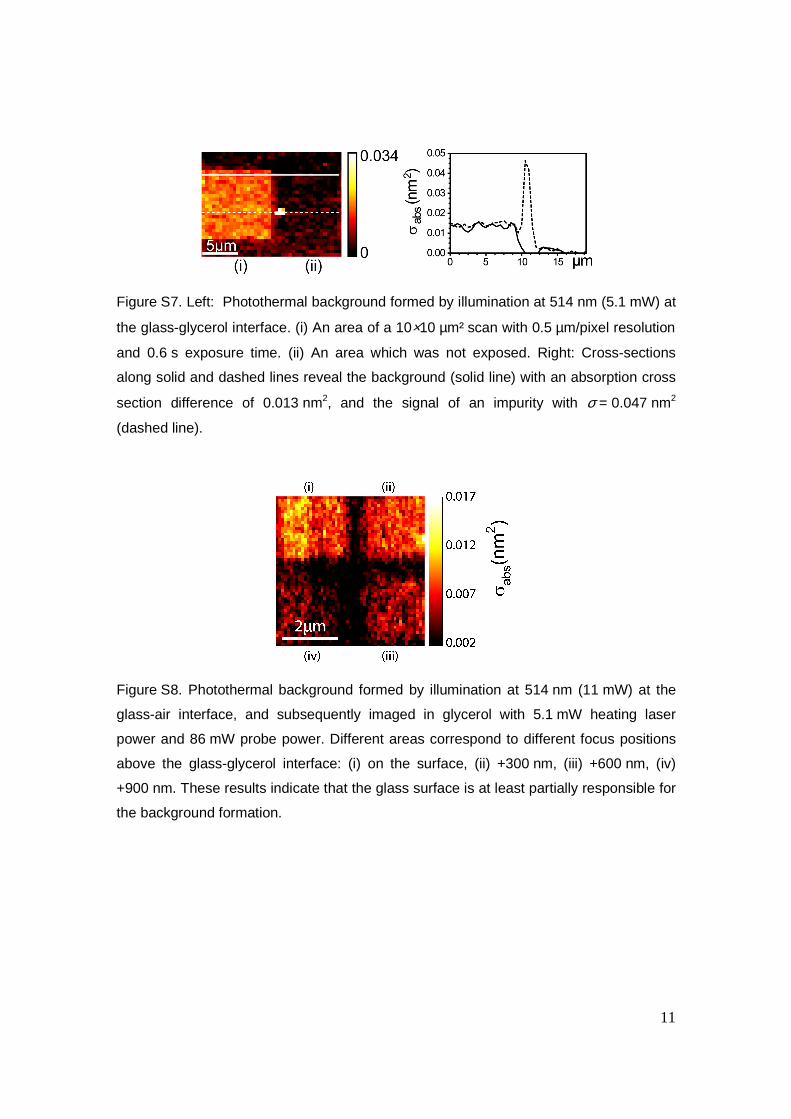
- The background intensity is usually weaker than that of molecules or
nanoparticles (Fig. S7).
- The background arises at least partially in glass, as it forms already upon
illumination of the air-glass interface (Fig. S8).
Although this background did not prevent single-molecule detection, it restricted
the observation of weak signals, in particular when the heating beam polarization
was varied. It will be important to elucidate its origin for future uses of the
photothermal method.
Figure S6. Photothermal background formed at a spot at the glass-glycerol interface.
Left: as a function of the irradiation time, with the heating power of 12 mW, probe power
of 70 mW and integration time of 100 ms. Right: as a function of the heating power with
a probe power of about 70 mW. Illumination with the probe laser alone does not result in
photothermal background formation.
11
Figure S7. Left: Photothermal background formed by illumination at 514 nm (5.1 mW) at
the glass-glycerol interface. (i) An area of a 10×10 µm² scan with 0.5 µm/pixel resolution
and 0.6 s exposure time. (ii) An area which was not exposed. Right: Cross-sections
along solid and dashed lines reveal the background (solid line) with an absorption cross
section difference of 0.013 nm2, and the signal of an impurity with σ = 0.047 nm2
(dashed line).
Figure S8. Photothermal background formed by illumination at 514 nm (11 mW) at the
glass-air interface, and subsequently imaged in glycerol with 5.1 mW heating laser
power and 86 mW probe power. Different areas correspond to different focus positions
above the glass-glycerol interface: (i) on the surface, (ii) +300 nm, (iii) +600 nm, (iv)
+900 nm. These results indicate that the glass surface is at least partially responsible for
the background formation.
12
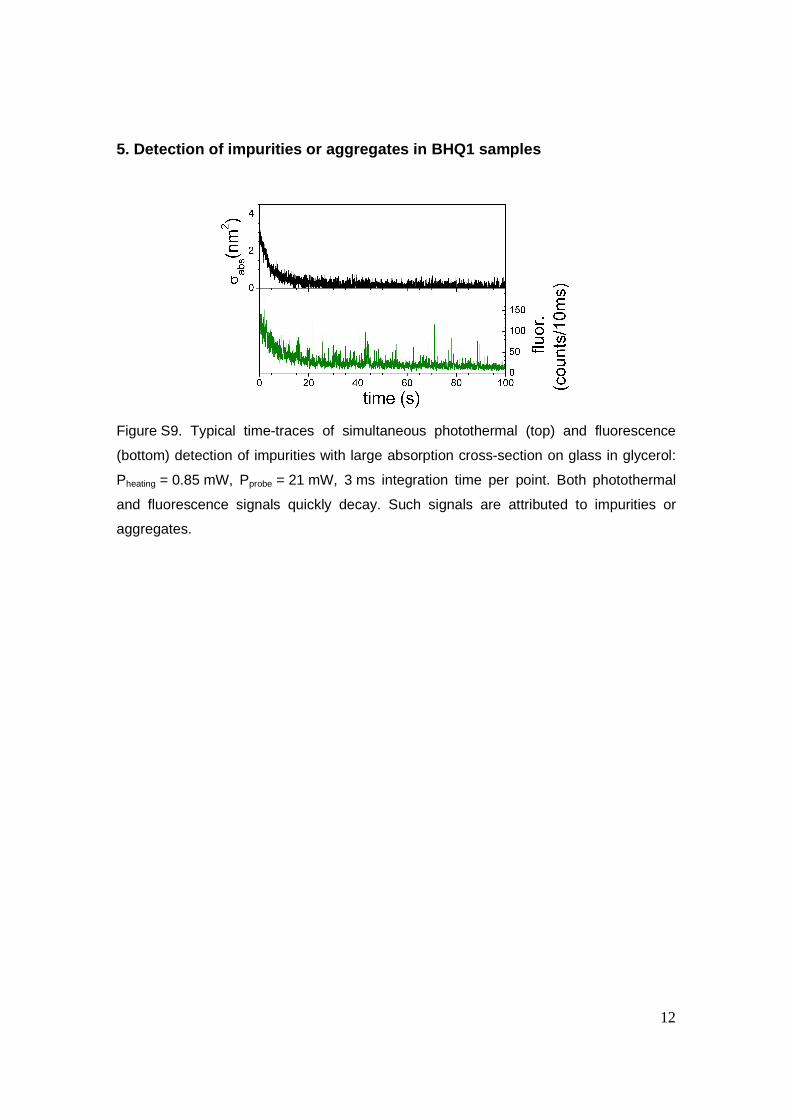
5. Detection of impurities or aggregates in BHQ1 sa mples
Figure S9. Typical time-traces of simultaneous photothermal (top) and fluorescence
(bottom) detection of impurities with large absorption cross-section on glass in glycerol:
Pheating = 0.85 mW, Pprobe = 21 mW, 3 ms integration time per point. Both photothermal
and fluorescence signals quickly decay. Such signals are attributed to impurities or
aggregates.
13
References:
S1. A. Gaiduk, P.V. Ruijgrok, M. Yorulmaz, M. Orrit, Detection limits in
photothermal microscopy, Chem. Sci., 1, 343 (2010).
S2. T. Susdorf et.al., Absorption and emission spectroscopic characterization
of some azo dyes and a diamino-maleonitrile dye, Chem. Phys. 333, 49 (2007).
S3. G. Wang et al., Spectroscopic investigations of a novel push-pull azo
compound embedded in rigid polymer, J. Phys. Chem. Solids. 63, 501 (2002).
S4. S.A.E. Marras, F.R. Kramer, S. Tyagi, Efficiencies of fluorescence
resonance energy transfer and contact-mediated quenching in oligonucleotide
probes, Nucleic Acids Research 30, e122 (2002).
S5. S.A.E. Marras, Selection of fluorophore and quencher pairs for fluorescent
nucleic acid hybridization probes, in Methods in Molecular Biology: fluorescent
energy transfer nucleic acid probes: designs and protocols, V.V. Didenko, Ed.,
Humana Press Inc. (2006).
S6. J.R. Lakowicz, Principles of fluorescence spectroscopy, Springer (2006).
S7. B. Kizel, Practical molecular spectroscopy, Moscow (1998).
S8. L.A. Brey, G.B. Schuster, H.G. Drickamer, High pressure studies of the
effect of viscosity on fluorescence efficiency in crystal violet and auramine O, J.
Chem. Phys. 67, 2648 (1977).
S9. H. Zollinger, Color Chemistry: Syntheses, Properties and Applications of
Organic Dyes and Pigments, VCH Verlagsgesellschaft (1987).