Embed Size (px)
Citation preview
www.sciencemag.org/cgi/content/full/1151120/DC1
Supporting Online Material for
Transgenic Inhibition of Synaptic Transmission Reveals Role of CA3 Output in Hippocampal Learning
Toshiaki Nakashiba, Jennie Z. Young, Thomas J. McHugh, Derek L. Buhl, Susumu Tonegawa*
*To whom correspondence should be addressed. E-mail: [email protected]
Published 24 January 2008 on Science Express DOI: 10.1126/science.1151120
This PDF file includes:
Materials and Methods SOM Text Figs. S1 to S8 Tables S1 and S2 References
1
SUPPORTING ON-LINE MATERIALS
1. Materials and Methods
Generation of αCamKII-loxP-STOP-loxP-tTA (Tg2), TetO-TeTX (Tg3-TeTX) and
TetO-GFP (Tg3-GFP) transgenic mice
For the Tg2 DNA construct, an Eco RI/Xba I fragment containing the tTA-coding
sequence from the ptTA2 plasmid (Clontech) was ligated to a Xba I/Ase I fragment
containing the β-globin polyadenylation (pA) signal isolated from the pBI plasmid
(Clontech). This Ase I site was replaced with a SaI I site via a Sal I linker ligation. The
loxP-STOP-loxP cassette was derived from a Not I/Eco RI fragment of the pBS302
plasmid (1). This cassette was modified by subcloning a 11.3 kb Xba I fragment isolated
from a BAC clone containing the mouse NR1 gene locus (BACPAC Resource Center)
into the Pst I site via linker ligation. This Eco RI/Not I (large) loxP-STOP-loxP fragment
was then ligated to the Eco RI/Sal I fragment of the tTA-pA sequence, and finally ligated
downstream of the Sal I/Not I fragment of the α-CamKII promoter from the pnn23
plasmid (2) to generate the final construct. For the Tg3-TeTX DNA construct, the TeTX
light chain-coding sequence was PCR-amplified along with a Mlu I and Not I linker from
the genomic sequence of Clostridium tetani (ATCC). The sequence coding for an N-
terminal EGFP fusion was PCR-amplified from the pEGFP-N1 plasmid (Clontech) with a
Sac II/Mlu I linker and the sequence for the C-terminal PEST sequence fusion was PCR-
amplified from the pd1EGFPN-1 plasmid (Clontech) with a Not I/Xba I linker, then
ligated to the TeTX light chain-coding sequence at the N- and C- terminus ends,
2
respectively. The resulting protein-coding sequence was subcloned into the Sac II and
Xba I sites of the pTre2 plasmid (Clontech). The 22 kb Sal I fragment for Tg2 and the 4.0
kb Xho I/Sap I fragment for Tg3-TeTX were purified and individually injected to the
pronuclei of fertilized eggs from C57BL/6 mice to generate transgenic offspring. For the
Tg3-GFP line, the DNA construct was generated from the pBI-EGFP plasmid (Clontech)
with minor modification. Each founder line was backcrossed with C57BL/6 mice and
maintained in this genetic background.
Mouse breeding
The generation and characterization of the KA1-Cre transgenic mouse (Tg1) were
previously described (3) and were maintained in C57BL/6 genetic background. After
characterizing several founder lines by crossing with the αCamKII-tTA transgenic line
(4) and immunostaining with a VAMP2 antibody, one of Tg3-TeTX lines was selected
and crossed with the Tg1 to generate double transgenic mice heterozygous for both
transgenes. In order to generate triple transgenic mice efficiently, heterozygous Tg1xTg3
(KA1-Cre/+, TetO-TeTX/+) mice were crossed each other to generate homozygous
double transgenic mice (KA1-Cre/KA1-Cre, TetO-TeTX/TetO-TeTX). The male
homozygous mice were then bred with female heterozygous Tg2 (αCamKII-loxP-STOP-
loxP-tTA /+). A half of the progeny would be heterozygous triple transgenic mice (KA1-
Cre/+, TetO-TeTX/+, αCamKII-loxP-STOP-loxP-tTA /+), which are referred to as CA3-
TeTX mice. The other half of the progeny would be heterozygous double transgenic mice
(KA1-Cre/ +, TetO-TeTX/ +, +/+), which would not express TeTX and therefore serve as
control mice. Tg1xTg2xTg3-GFP mice were also generated in a similar way by using
3
Tg3-GFP mice instead of Tg3-TeTX mice during the breeding procedure. Tail DNA from
all offsprings was genotyped by PCR to detect the presence of each transgene separately.
PCR primers used are follows; For Tg1, 5’-AAATGGTTTCCCGCAGAACC-3’ and 5’-
CTAAGTGCCTTCTCTACACC-3’. For Tg2, 5’-CGCTGTGGGGCATTTTACTTTAG-
3’ and 5’-GGGTCCATGGTGATACAAGG-3’. For Tg3-TeTX and Tg3-GFP, 5’-
GTGGCGGATCTTGAAGTTCACC-3’ and 5’-GACCCTGAAGTTCATCTGCACC-3’.
The same PCR conditions (94°C for 2 min.; 94°C for 5 sec., 58°C for 1 min., 72°C for 1
min. x35 cycles; 72°C for 7 min.) were used for all primer pairs. For the genotyping of
homozygous transgenic mice, a quantitative PCR was performed on tail DNA to
determine the transgene copy number using probe–primer sets specific for the transgene
(Tg1 or Tg3-TeTX) and SOD1 gene locus as internal control. PCR primers used were 5’-
GCCGCGCGAGATATGG-3’ and 5’-GCCACCAGCTTGCATGATC-3’ for Tg1; 5’-
CTGCTGCCCGACAACCA-3’ and 5’-TGTGATCGCGCTTCTCGTT-3’ for Tg3-TeTX;
5’-TTTTTTTGCGCGGTCCTTT-3’ and 5’-ACCAGAGAGAGCAAGACGAGAAG-3’
for SOD1. Probes used were 5’-CCAGCCAGCTATCAACTCGCGCC-3’ for Tg1; 5’-
CCCAGTCCGCCCTGAGCAAAGAC-3’ for Tg3-TeTX; 5’-
CTGCGGCGCCTTCCGTCC-3’ for SOD1. All procedures relating to animal care and
treatment conformed to the Institutional and NIH guidelines.
Doxycycline (Dox) treatment
The minimum Dox concentration required to repress gene expression was determined by
supplying drinking water with a varying dose of Dox to Tg1xTg2xTg3-GFP mice as well
as to CA3-TeTX mice starting with the conception and ending in adulthood. Ten μg/ml
4
Dox (Sigma) supplemented with 1% sucrose (Sigma) was sufficient to repress GFP
expression in Tg1xTg2xTg3-GFP mice as assessed by GFP antibody and TeTX
expression in CA3-TeTX mice as assessed by VAMP2 antibody. When food containing
10 mg Dox per kg (Bioserve) was used, similar results were obtained with respect to GFP
or TeTX expression. Therefore, we used Dox water (10 μg/ml) during the pregnancy and
fostering periods and Dox food (10 mg/kg) after weaning to adulthood to keep TeTX in
the repressed state. For a constitutive de-repression, the animals were kept on Dox-free
water and Dox-free diet throughout their life.
Immunohistology
Mice were transcardially perfused with 4% paraformaldehyde (PFA) in 0.1 M sodium
phosphate buffer (PB) and post-fixed by the same fixative overnight. For GFP and
Netrin-G1 staining, the brains were further processed in 30% sucrose, embedded in OCT
compound (SAKURA), and then frozen on the dry ice. Brain sections (50 μm thick) were
prepared on a cryostat and collected in phosphate buffered saline (PBS). Free floating
sections were first treated with 3% H2O2 in PBS for 10 minutes, followed by a treatment
with 3% normal goat serum in TNB (TSA System, PerkinElmer) for 30 minutes. The
sections were then incubated at 4°C overnight with primary antibodies diluted in same
blocking solution (rat anti-GFP, 1/500, Nacalai USA Inc.; rabbit anti-Netrin-G1, 1/4000,
ref. 5). After rinsing with TNT (100 mM Tris-HCl, 150 mM NaCl and 0.3 % Triton-
X100), the sections were incubated with secondary antibodies (Alexa 488 conjugated
anti-rat IgG, 1/200, Invitrogen; biotinylated anti-rabbit IgG, 1/500, Jackson
ImmunoResearch) for 2 hours at room temperature, and then with streptavidin-
5
biotin/horseradish peroxidase complex (ABC complex, Vector) for 30 min. Netrin-G1
immunoreactivity was visualized by 7-min treatment with Cy3-tyramide (PerkinElmer) at
room temperature. After rinsing with TNT, the sections were incubated with PBS
containing DAPI (Invitrogen) and mounted on a glass slide. For VAMP2
immunostaining, brains were post-fixed overnight as above and sections (50 μm thick)
were prepared by vibratome. Primary antibody used here was rabbit anti-VAMP2 (1/250,
Synaptic Systems) and VAMP2 immunoreactivity was visualized with Alexa 568-
conjugated anti-rabbit IgG (1/200, Invitrogen). For VGLUT1 staining, cryostat sections
(50 μm thick) were incubated with primary antibody (guinea pig anti-VGLUT1, 1/1000,
Chemicon) and then incubated with Alexa 488-conjugated anti-guinea pig IgG (1/200,
Invitrogen). For GluR 1 staining, the sections were incubated with rabbit anti-GluR1
(1/40, Chemicon), then incubated with biotinylated anti-rabbit IgG, 1/500, Jackson
ImmunoResearch). Signals were amplified with incubation with ABC complex (Vector),
followed by visualization with fluorescein isothiocyanate (FITC) tyramide
(PerkinElmer). For Tunel staining, the in situ cell death detection kit (Roche) was used
following the manufacturer’s instruction. As a positive control for DNA fragmentation,
sections were treated with 10 units/ml DNase I (Promega) for 1 hour prior to Tunel
staining. For the analysis of TA pathway projection, an anterograde tracer (Molecular
Probes) was injected into medial entorhinal cortex. For this purpose, mice were deeply
anesthetized with avertin and a 10% solution of biotinylated dextran amines (BDA-
10,000) was injected at AP -3.60 mm and ML 4.70 mm from Bregma, and DV 1.70 mm
to 2.40 mm from skull surface using a stereotaxic apparatus (0.3 µl per injection). Five
days after the injection, brains were fixed with 4% PFA in PB for 24 hours, then 50 µm
6
coronal sections were made on a cryostat in the manner previously described. BDA was
detected with FITC-tyramide following ABC complex incubation. Images were taken
with a SPOT camera (Nikon).
In vitro electrophysiology
The experiments were conducted with male mice between 15 and 27 weeks of age. All
the experiments were performed by operators blind to the genotypes and Dox treatments.
Animals were euthanized by rapid cervical dislocation followed by decapitation. Their
brains were quickly removed and immersed in ice-cold (4°C) artificial cerebral spinal
fluid (ACSF) bubbled with a “carbogen” mixture of 95% O2, 5% CO2. The ionic
composition of the ACSF was the same as in previous studies (6), consisting of (in mM):
119 NaCl, 2.5 KCl, 1.3 MgSO4•7H2O, 1.0 NaH2PO4•H2O, 26.2 NaHCO3, 2.5 CaCl2, and
11.0 D-glucose (Mallinckrodt Chemicals, Hazelwood, MO). Brains were cooled for a
brief (~2 min) period in ice-cold ACSF and then moved to a dissecting dish lined with
filter paper and filled with ice-cold ACSF. The brain was then divided into hemispheres
with sagittal cut down the midline. For each animal, transverse hippocampal slices for
electrophysiological recordings were prepared from one hemisphere (chosen pseudo-
randomly) while the remaining hemisphere was reserved for analysis of VAMP2
immunoreactivity. Hemispheres designated for immunohistology were placed in 4%
PFA in PBS. In the hemisphere designated for electrophysiology, the hippocampus was
dissected free and transverse slices (400 µm thickness) were cut on a manual tissue
chopper (Stoelting, Wood Dale, IL). Hippocampal slices were then transfered onto a
nylon mesh in an interface chamber used for recording (Fine Science Tools, Foster City,
7
CA) where they were maintained at 28°C and perfused with oxygenated ACSF (~1
ml/min). Investigation of the kinetics of Dox control over the blockade of synaptic
transmission was carried out in the intact hippocampal slice preparation (Fig. S2). For all
other experiments, clear isolation of the TA response required additional microdissection
of the slices to remove the dentate gyrus and CA3 (7). Slices were allowed to recover for
at least 45 min before microdissection, and given a total incubation time of 2.5 hr before
experiments commenced. Electrophysiological analysis of synaptic transmission at SC
and TA inputs was carried out concurrently in each hippocampal slice. Two bipolar
stimulating electrodes (CE2C55, FHC, Bowdoin, ME), one placed in striatum radiatum
(SR) and the other in striatum lacunosum-moleculare (SLM) of CA1 were used to
stimulate the SC and TA pathways, respectively. fEPSPs were measured with a glass
microelectrode (A-M Systems, Carlsborg, WA) filled with ACSF (electrical resistances:
4-7 M Ω) placed in SR of CA1. Evoked fEPSPs were amplified, digitized (Axoclamp-
2B, DigiData 1320A Interface, Molecular Devices, Sunnyvale, CA), and analyzed using
Axon Clampex 9.2 (Molecular Devices, Sunnyvale, CA). Stimuli were delivered to the
TA and SC inputs with a 500 ms interval between stimulation through the two electrodes;
TA stimulation evoked positive-going fields in SR while SC stimulation evoked
negative-going fields in SR (7). SC and TA inputs were characterized by applying
electrical stimulation (stimulus duration TA: 0.1 ms, SC: 0.08 ms) at a range of voltages
(0.1 to 1.3 mV). Test stimuli were delivered four times per minute to provide one mean
fEPSP measurement per minute. The initial slope of the fEPSP was plotted against the
stimulation intensity to give an input-output relationship of the SC and TA pathways.
Sample traces for SC and TA responses are representative of mean maximal fEPSP
8
slopes recorded at 1.3 mV. By the mid-way point of the range of stimulation intensities
we applied, SC stimulation often induced CA1 population spikes (pSpikes) that were
recorded as a positivity in the field potential (Table S1). As this phenomenon may be
missing in CA3-TeTX mice, we used additional stimulation intensities (up to 2.0 mV) in
looking for evidence of CA1 output. We also examined the efficacy of a high-
frequency stimulation protocol (1 s train of 100 Hz tetanus) that significantly lowers the
threshold for generating CA1 pSpikes (8) and reliably elicited pSpikes in control animals
(89.5%; n = 19, N = 6). At the conclusion of each experiment, area CA1 and general
slice viability was confirmed by antidromically eliciting CA1 pSpikes (recorded in
stratum pyramidale) with alvear stimulation (Table S1). The values on the graphs
represent mean fEPSP slopes ± standard error of the mean. "N" represents number of
animals; "n" indicates number of slices. Statistical analysis on input-output relations
between treatment groups was carried out using two-way repeated-measures ANOVA
(SPSS). Student’s t test or ANOVA was used to compare mean fEPSP slopes elicited at
the highest stimulation intensity if ANOVA analysis indicated a significant difference
between groups (p < 0.05). Levene’s test was done to determine equality of variances.
Morris water maze
The Morris water maze (MWM) task was conducted with male mice between 14 and 22
weeks of age, with minor modifications of the method described previously (9). All the
experiments were performed by operators who were blind to the genotypes of the mice
used and their Dox treatments. In brief, the mice were kept in a temperature-controlled
room on a constant 12-hour light/dark cycle. The multiple experiments were conducted at
9
approximately the same time of the day. The mice were transported from the colony to a
holding area where they sat undisturbed for 30 minutes prior to the experiment. The
facility was in a rectangular dim-lit room (340cm x 297 cm) and consisted of a circular
pool (160 cm diameter) filled with opaque water made with color paints (White 5130,
Berghause; Peach 2906, Pearl Tempera) at 19 °C. Four large illuminated objects were
hung as extramaze cues on each wall. A hidden circular platform (12 cm in diameter) was
placed 1 cm below the water surface and the mice were trained to find the platform four
trials per day for 10 days with an inter-trial interval of approximately 60 minutes. During
training, the mice were released from four pseudorandomly assigned start locations (N, S,
E, and W) and allowed to swim for 90 s. If a mouse did not find a platform within 90 s, it
was manually guided to the platform and allowed to rest on the platform for 15 s. Probe
trials were conducted on Day 6 and Day 11. The mice were released at the center of pool
and were allowed to swim for 60 seconds in the absence of the platform. Data from the
training session and probe trials were collected and analyzed with HVS Image Water
2020 software. An escape latency to the hidden platform was measured during training,
and the quadrant occupancy as well as the number of crossing at the phantom platform
location were measured during probe trials. These data were then averaged over mice of a
particular genotype. Average position heat maps of water maze activity were created
using Matlab (Mathworks Inc., Natick, MA). Position for each animal was broken down
into 3 cm2 bins and total time spent in those bins over a 60 second period was smoothed
with a Gaussian function of a width of 5 cm. Smoothed position maps were then averaged
across CA3-TeTX (n=10) and littermate controls (n=10). For visualization purposes,
10
maps were normalized to the maximum time spent out of all four maps combined (red:
maximum time spent; blue: no time spent).
Contextual (CFC) and tone (TFC) fear conditioning
Fear conditioning was performed with male mice between 14 and 27 weeks of age in the
animal facility during the light cycle with minor modifications of the method described
previously (9). All the experiments were performed by operators who were blind to the
genotypes and Dox treatments. Mice were transported from the colony to a holding room
adjacent to the behavioral suite containing the fear conditioning chambers where they sat
undisturbed for 30 minutes prior to the experiment. On Day 1, mice were brought into a
room lit with dim red light and containing four conditioning chambers. The chambers had
plexiglass fronts and backs and aluminum side walls with a curved plastic roof and
measured 30 x 25 x 21 cm. The chamber floors consisted of 19 stainless steel rods spaced
16 mm apart connected via a cable harness to a shock generator. The chambers were
cleaned prior to an introduction of an individual mouse into them with a quatricide and a
solution of 1% acetic acid was placed beneath the chambers during the experiment to
provide a dominant odor. Once placed in the chamber the mice were allowed to freely
explore for 3 minutes, then received a single 1.25-mA footshock (2 s in duration) which
co-terminated with a 30 seconds tone. Following the shock delivery, the mice remained
in the chamber for 30 seconds, and then were returned to the home cages and transported
back to the holding room. On Day 2, the mice were returned to the conditioning
chambers under the conditions identical to those on Day 1 for a five minutes test. On Day
3, the mice were transferred to the second conditioning room adjacent to the first one.
11
This second room contained direct overhead fluorescent lighting and distinct chambers,
measuring 30 x 25 x 21 cm, with plexiglass front and back walls, and aluminum side
walls but with a flat roof. In addition, the floors of these chambers were made up with
white plastic and the odor was provided with 0.25% benzaldehyde (in 100% ethanol).
These lighting, chamber materials and odor employed on Day 3 provided a context quite
distinct from that on Day 1. The mice were placed in this chamber for 3 minutes during
which freezing responses were measured. This response compared to the response to the
conditioning chamber on Day 2 gives a measure of the context specificity of contextual
conditioning. The mice were then given the same tone as the one given on Day 1, but this
time for 2 minutes and freezing responses were monitored. For Fig. 3G and H, a single
group of mice were subjected successively to two CFC experiments each in a distinct
chamber and under a distinct Dox condition (on-off or on-off-on). Under the on-off
condition, mice which underwent 3 weeks of Dox withdrawal followed by 1 week of Dox
re-administration were conditioned using the same protocol as that described above for
Day 1. A subset of the CA3-TeTX mice under this Dox condition were subjected to
immunohistology and slice physiology. They exhibited reductions in the VAMP2-IR
(Fig. S7A and B) and the SC-CA1 fEPSP max (Fig. 2C) that were similar to those
displayed by the CA3-TeTX mice which underwent 4 weeks of Dox withdrawal. The
remaining mice were returned to the colony and received an additional 5 weeks of Dox
diet (on-off-on condition). A subset of these mice were again sacrificed and subjected to
immunohistology and slice physiology. The results showed restorations of VAMP2-IR
and SC-CA1 fEPSP max (Fig. 2C). The remaining mice were placed in a second chamber
(similar to the Day 3 chamber described above, except that the white plastic floor over
12
the stainless steel rods was removed to allow the delivery of a footshock) and were
subjected to a second conditioning session using a protocol similar to that in the first
conditioning session, except that the tone was omitted. Compared to the on-off
experiment, in the on-off-on experiment, both genotypes demonstrated increased levels of
preshock freezing. This is likely due to a generalization effect of freezing (10) during the
5 week-long Dox diet treatment. To allow comparison of the results of the two
experiments, we subtracted this elevated pre-shock freezing from the freezing that
occurred during the test session of the second experiment for both genotypes (Fig. 3G
and H). For Fig. 3I and J, mice were first placed in the conditioning chamber for 3
consecutive days, 10 minutes per day. On Day 3, a single 1.25 mA footshock (2 s in
duration) was delivered at 568 sec after being placed in the chamber, and the mice were
allowed to stay in the chamber for an additional 30 s. On the next day, contextual
memory was tested in same manner described above. Animals’ activities in the chambers
were recorded using FreezeFrame software. Freezing responses were assessed from the
video images of the mice using FreezeView software, with a minimum bout time of 1
second. Freezing values were then averaged over mice of a particular genotype for each
testing session.
Pre-exposure mediated contextual fear conditioning (PECFC)
This behavioral paradigm allows a test of pattern completion-based memory recall in
CFC (11, 12). PECFC was conducted with male mice between 14 to 22 weeks of age in
the animal facility during the light cycle. All the experiments were performed by
operators who were blind to the genotypes of the mice used and their Dox treatments.
13
The mice were transported from the colony to a holding room where they sat undisturbed
for 30 minutes prior to the experiment. On Day 1, mice were brought into the
conditioning chamber which is same as the one described in the previous section, and
allowed to explore freely for 10 min, and then transported back to their home cages. On
Day 2, the mice were transported individually to the conditioning chamber and received a
single 1.25 mA footshock (2 s duration) 10 seconds after being placed in the chamber.
The mice remained in the chamber for a further 30 seconds, then were transported back to
their home cages. On Day 3, contextual fear was assessed by placing the mice in the
conditioning chamber for 5 minutes. For the Dox-on-off experiment shown in Fig. 3K,
the mice were given pre-exposure sessions for 5 consecutive days, 10 minutes per day,
and then Dox diet was replaced with the Dox-free diet. Four weeks later, the mice were
transported individually to the conditioning chamber, and then received a single 1.25mA
footshock (2 s duration) 10 seconds after being placed in the chamber. The mice
remained in the chamber for a further 30 seconds, then were transported back to their
home cages. On the next day, the mice were returned to the conditioning chambers for a
five minutes test. During all these sessions, the animals’ activity in the chamber was
recorded using FreezeFrame software. Freezing behavior was assessed from the video
image of the mouse using FreezeView software, with a minimum bout time of 1 second.
Freezing values were then averaged over mice of a particular genotype for each session.
In vivo recording
Male mice (CA3-TeTX mice (N=9) and littermate controls (N=9), 18-22 weeks of age)
were implanted with a microdrive array consisting of six independently adjustable
14
tetrodes (targeted to CA1: stereotaxic coordinates from bregma: 1.6 mm lateral; 1.8 mm
posterior) as previously described (13). All experiments were conducted and analyzed by
scientists blind to the genotypes of the animals. In the week following surgery the
tetrodes were slowly lowered into CA1 as the mice were sitting quietly in a small high-
walled enclosure (sleep box). Recordings began once stable unit recordings were
obtained. On all three days of recording, sessions consisted of a "RUN" epoch on the
track (10 laps) bracketed by 20 minute "SLEEP" sessions in which the animal rested
quietly in the sleep box adjacent to the behavioral environment. On the initial day of
recording (Day 1), the mice were placed at one end of a novel linear track (track
dimensions: 80 cm long, 6 cm wide). Taking advantage of the tendency of the mice to
spontaneously explore a novel space, animals were left free to run 10 laps on the track as
extracellular action potentials were recorded. Position and directionality was tracked
using a pair of infrared diodes placed 3 cm above the animals’ head and 3 cm front to
back. Diffuse room lighting was provided by low intensity spotlights focused onto four
salient visual cues located on each of the walls of the recording chamber. This protocol
was repeated twice, 24 hours (Day 2) and 48 hours (Day 3) following the initial exposure.
At the conclusion of the experiment mice were given a lethal dose of anesthetic and a
small electrical current (50μA) was run down each tetrode for 8 seconds to create a small
lesion at the tip of the probe. Animals were then transcardially perfused with 4% PFA in
PB and brains were removed. 50 μm coronal slices prepared using a Vibrotome,
mounted, and finally counterstained with Nuclear Fast Red to visualize electrode tracks
and lesion sites. Recording position of each tetrode was verified by examining the
location of the lesions under standard light microscopy.

15
Following data acquisition, action potentials were assigned to individual cells based on a
spike's relative amplitudes across the four recording wires of a tetrode (9, 13).
Additionally, cells were classified as pyramidal units and included in the analysis if the
following conditions were met: 1) a relatively broad waveforms ( > 350 μs) 2) a peak
firing rate greater than 5 Hz, and 3) a Complex Spike Index (a measure of bursting- see
below) of greater than 5%. To remove firing occurring during times of immobility on the
track, a velocity criterion of 2cm/sec was applied to limit analysis to period of motion. To
characterize the consequences of trisynaptic input to CA1 on the activity of the CA1
pyramidal cells, we measured several properties including: 1) the Complex Spike Index
(CSI)- defined as the percentage of spikes with first lag interspike intervals between 2 &
15 ms and whose second spike is smaller in amplitude than the first, 2) average and peak
firing rates, 3) spike width (peak to trough), 4) place field size, expressed as the percent
of sampled pixels in which the mean firing rate of the cell exceeded 0.5 Hz, and 5) spatial
information (bits/spike, see below).
Statistical analysis
Results are given as mean ± S.E.M. Where appropriate, statistical analyses were
performed with analysis of variance (ANOVA) test. Otherwise, comparisons between
groups were conducted using Student’s t test. The null hypothesis was rejected at the
P<0.05 level.
16
2. Supporting Text
The DICE-K Method
The DICE-K method employs three transgenic mouse lines, Tg1, Tg2 and Tg3-TeTX that
are crossed to heterozygocity for each transgene (Fig. 1B). In Tg1, the expression of Cre
recombinase is driven by a transcriptional promoter with a tissue- or cell-type specificity.
In Tg2, expression of the tetracycline transactivator (tTA), a transcriptional factor,
depends on Cre-loxP recombination as well as a second transcriptional promoter that also
exhibits a tissue- or cell-type specificity which overlaps with, but is different from, the
specificity of the Tg1 promoter. In a Tg1xTg2 double transgenic line, tTA expression
will take place only in the tissue or cell type in which both promoters are active (Fig. S1).
In Tg3-TeTX, the expression of TeTX is under the control of the Tet operator (Otet). In a
Tg1xTg2xTg3-TeTX triple transgenic mouse, TeTX will be expressed only in those cells
in which the tTA is expressed. The expression of TeTX can be blocked by a dietary
supplement of doxycycline (Dox) which prevents tTA from binding to the Otet. Thus,
when a mother pregnant with the triple transgenic mice is maintained on Dox diet during
the pregnancy and subsequent fostering period, and the weaned mice are kept on the
same diet until they grow to adulthood, TeTX expression will be repressed in these mice
and hence the synaptic transmission will remain normal throughout the entire period
(Dox-on or repressed state). When their diet is switched to one free of Dox, TeTX will be
expressed only in those cells in which tTA is synthesized and consequently, synaptic
transmission will be inhibited only at those synapses to which the tTA-positive cells
17
provide presynaptic terminals (Dox-on-off or de-repressed state). A subsequent switch
back to Dox diet should restore synaptic transmission (Dox-on-off-on or re-repressed
state).
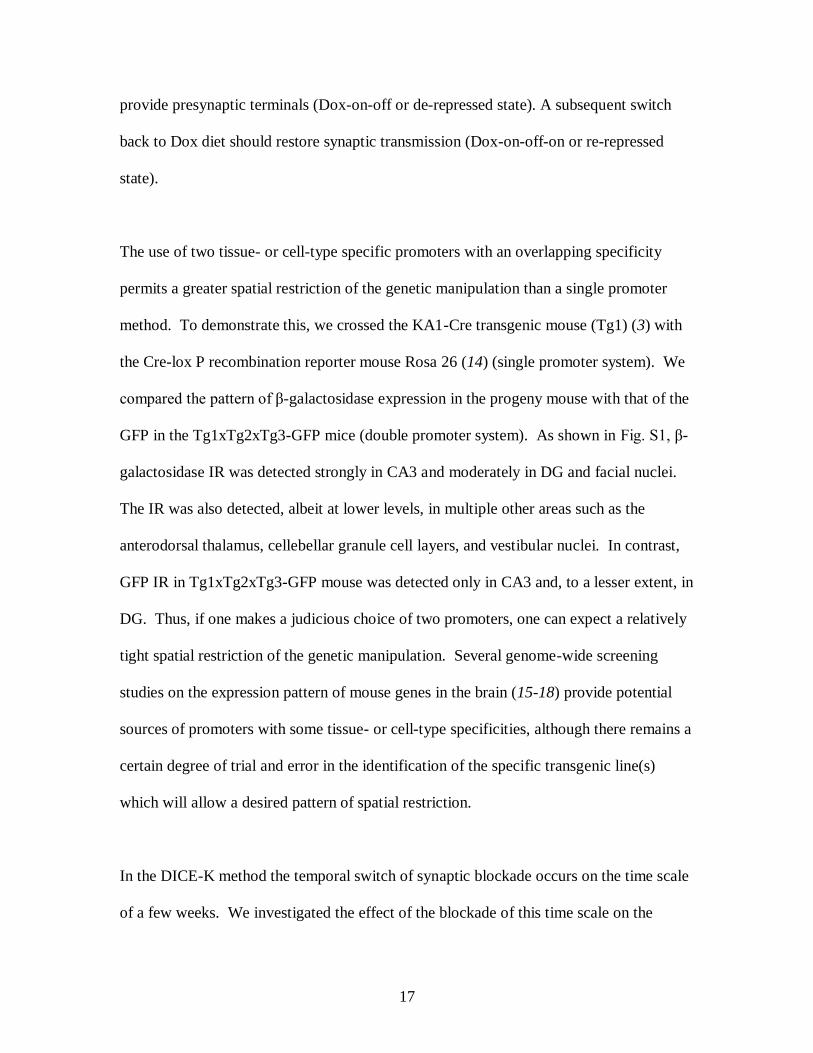
The use of two tissue- or cell-type specific promoters with an overlapping specificity
permits a greater spatial restriction of the genetic manipulation than a single promoter
method. To demonstrate this, we crossed the KA1-Cre transgenic mouse (Tg1) (3) with
the Cre-lox P recombination reporter mouse Rosa 26 (14) (single promoter system). We
compared the pattern of β-galactosidase expression in the progeny mouse with that of the
GFP in the Tg1xTg2xTg3-GFP mice (double promoter system). As shown in Fig. S1, β-
galactosidase IR was detected strongly in CA3 and moderately in DG and facial nuclei.
The IR was also detected, albeit at lower levels, in multiple other areas such as the
anterodorsal thalamus, cellebellar granule cell layers, and vestibular nuclei. In contrast,
GFP IR in Tg1xTg2xTg3-GFP mouse was detected only in CA3 and, to a lesser extent, in
DG. Thus, if one makes a judicious choice of two promoters, one can expect a relatively
tight spatial restriction of the genetic manipulation. Several genome-wide screening
studies on the expression pattern of mouse genes in the brain (15-18) provide potential
sources of promoters with some tissue- or cell-type specificities, although there remains a
certain degree of trial and error in the identification of the specific transgenic line(s)
which will allow a desired pattern of spatial restriction.
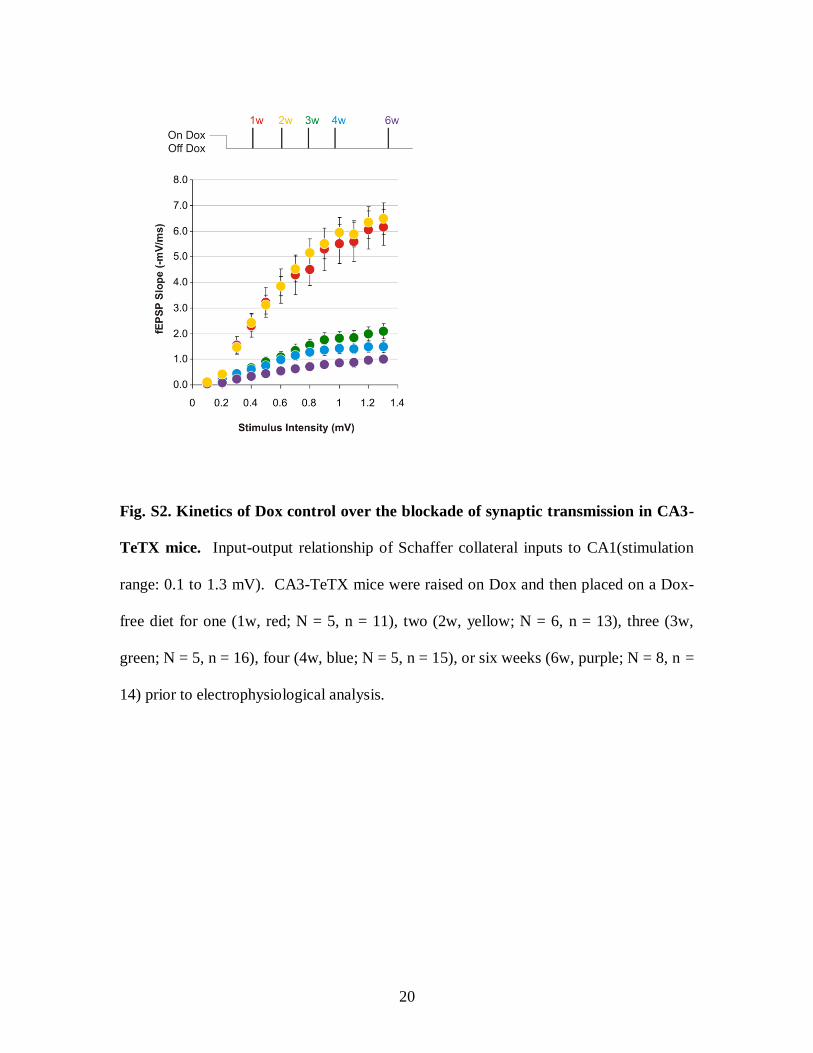
In the DICE-K method the temporal switch of synaptic blockade occurs on the time scale
of a few weeks. We investigated the effect of the blockade of this time scale on the
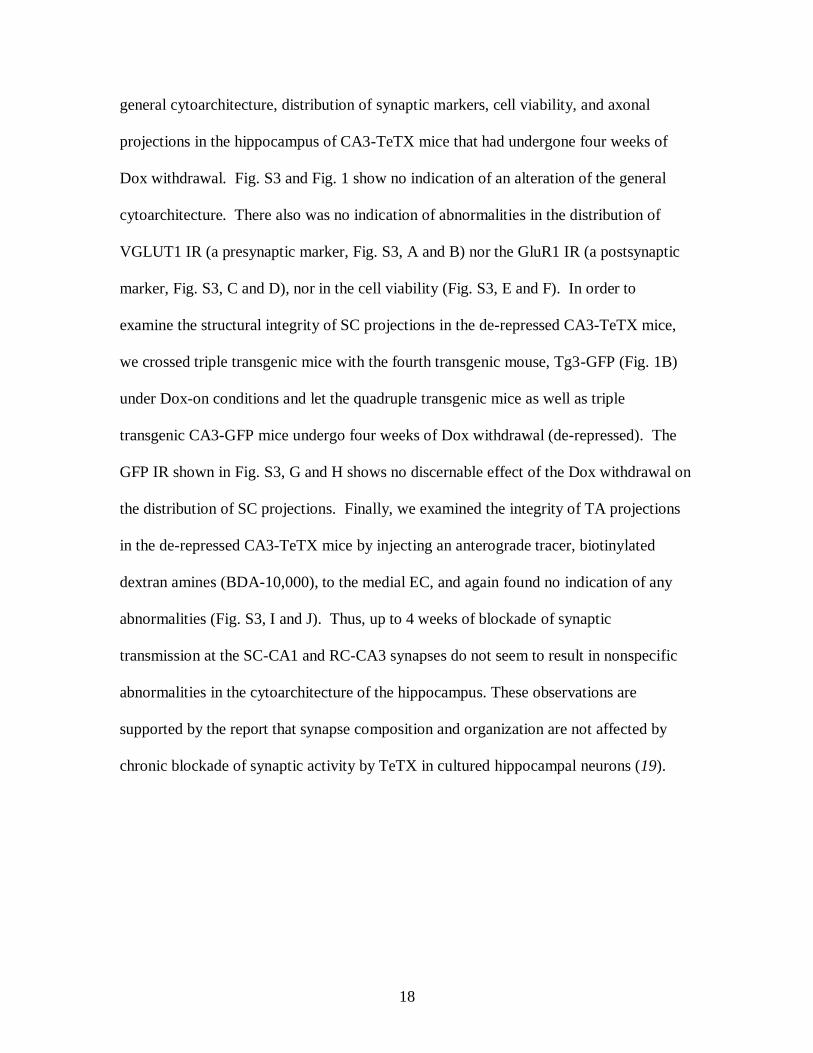
18
general cytoarchitecture, distribution of synaptic markers, cell viability, and axonal
projections in the hippocampus of CA3-TeTX mice that had undergone four weeks of
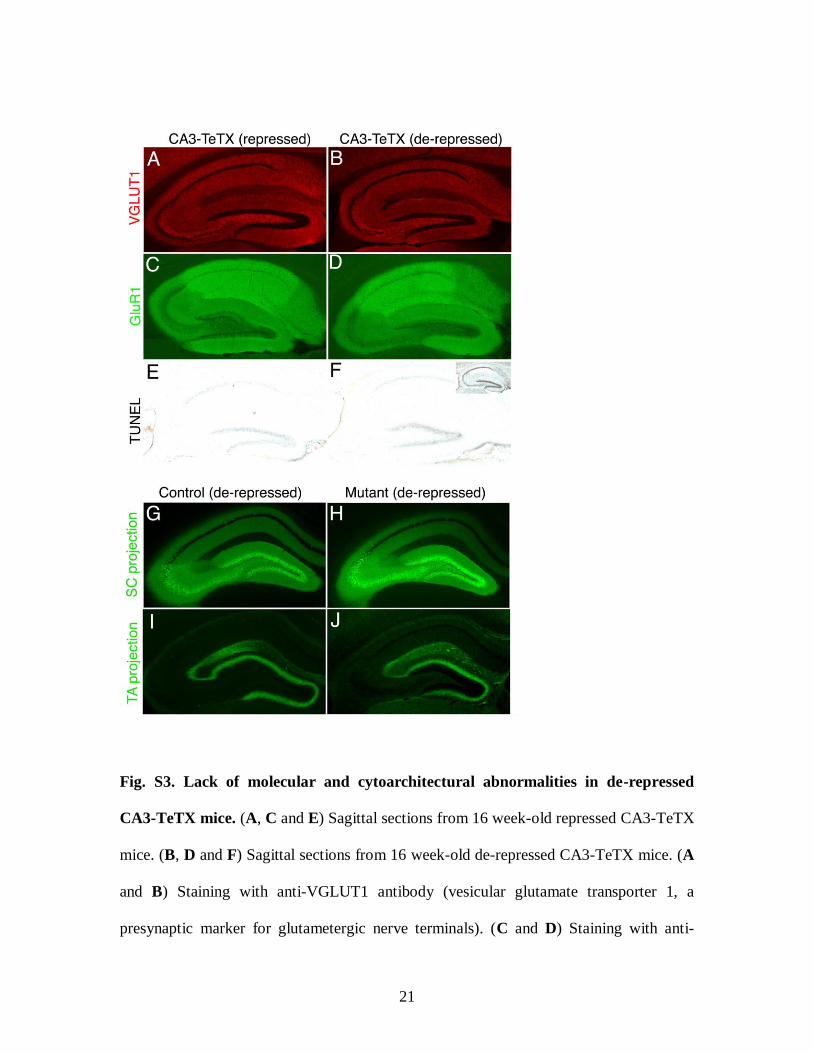
Dox withdrawal. Fig. S3 and Fig. 1 show no indication of an alteration of the general
cytoarchitecture. There also was no indication of abnormalities in the distribution of
VGLUT1 IR (a presynaptic marker, Fig. S3, A and B) nor the GluR1 IR (a postsynaptic
marker, Fig. S3, C and D), nor in the cell viability (Fig. S3, E and F). In order to
examine the structural integrity of SC projections in the de-repressed CA3-TeTX mice,
we crossed triple transgenic mice with the fourth transgenic mouse, Tg3-GFP (Fig. 1B)
under Dox-on conditions and let the quadruple transgenic mice as well as triple
transgenic CA3-GFP mice undergo four weeks of Dox withdrawal (de-repressed). The
GFP IR shown in Fig. S3, G and H shows no discernable effect of the Dox withdrawal on
the distribution of SC projections. Finally, we examined the integrity of TA projections
in the de-repressed CA3-TeTX mice by injecting an anterograde tracer, biotinylated
dextran amines (BDA-10,000), to the medial EC, and again found no indication of any
abnormalities (Fig. S3, I and J). Thus, up to 4 weeks of blockade of synaptic
transmission at the SC-CA1 and RC-CA3 synapses do not seem to result in nonspecific
abnormalities in the cytoarchitecture of the hippocampus. These observations are
supported by the report that synapse composition and organization are not affected by
chronic blockade of synaptic activity by TeTX in cultured hippocampal neurons (19).
19
3. Supporting Figures
Fig. S1. Double promoter system confers tighter spatial restriction. (A and B)
Immunofluorescence staining of coronal sections from a 12 week-old Tg1xROSA26
mouse (single promoter system) with antibodies specific for -galactosidase (green) and
cell nuclei marker, DAPI (blue). β-galactosidase is confined to cell somas. (C and D)
Immunofluorescence staining of coronal sections of a 12 week-old Tg1xTg2xTg3-GFP
mouse (double promoter system) with antibodies specific for GFP (green) and DAPI
(blue). GFP spreads from somas to axons and dendrites.
20
Fig. S2. Kinetics of Dox control over the blockade of synaptic transmission in CA3-
TeTX mice. Input-output relationship of Schaffer collateral inputs to CA1(stimulation
range: 0.1 to 1.3 mV). CA3-TeTX mice were raised on Dox and then placed on a Dox-
free diet for one (1w, red; N = 5, n = 11), two (2w, yellow; N = 6, n = 13), three (3w,
green; N = 5, n = 16), four (4w, blue; N = 5, n = 15), or six weeks (6w, purple; N = 8, n =
14) prior to electrophysiological analysis.
21
Fig. S3. Lack of molecular and cytoarchitectural abnormalities in de-repressed
CA3-TeTX mice. (A, C and E) Sagittal sections from 16 week-old repressed CA3-TeTX
mice. (B, D and F) Sagittal sections from 16 week-old de-repressed CA3-TeTX mice. (A
and B) Staining with anti-VGLUT1 antibody (vesicular glutamate transporter 1, a
presynaptic marker for glutametergic nerve terminals). (C and D) Staining with anti-
22
GluR1 antibody (AMPA-type glutamate receptor 1, a postsynaptic marker). (E and F)
TUNEL staining (marker for cell death). Insert in panel (F) is a positive control where the
section was treated with DNaseI prior to TUNEL staining. (G to J) Axonal trajectories of
SC and TA pathways. Immunofluorescence staining with an antibody specific for GFP
(green) of coronal sections of a 16 week-old de-repressed CA3-GFP mouse (G) and a de-
repressed quadruple Tg1xTg2xTg3-GFPxTg3-TeTX mouse (H). (I and J) Detection of
an anterograde tracer injected into the medial entorhinal cortex of a 16 week-old de-
repressed Tg1xTg3-TeTX control mouse (I) and de-repressed CA3-TeTX mouse (J).
23
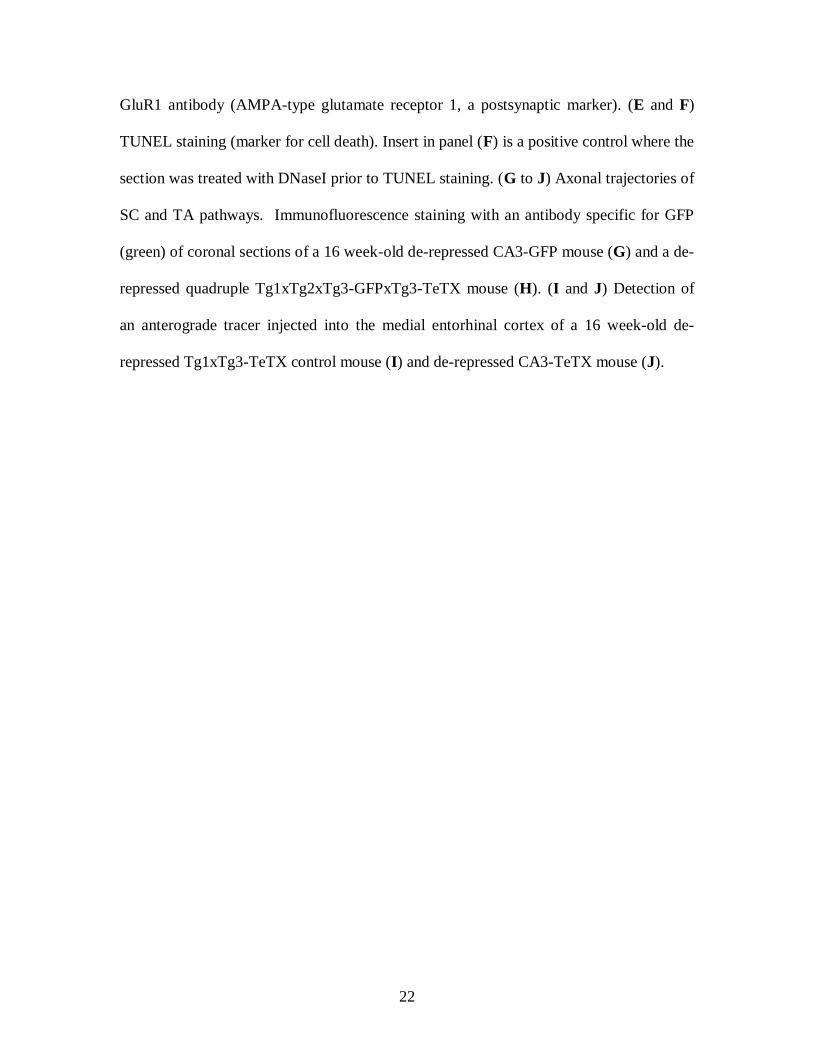
Fig. S4. CA3-TeTX mice exhibit no changes in the open field and light/dark
transition tests. (A and B) Performance in an open field test of CA3-TeTX (TG, N=14)
and their double transgenic control littermates (CT, N=12) that have undergone 4 weeks
of Dox withdrawal (14-22 weeks of age). Total distance traveled in a novel open field
chamber for a 30 minutes session is not significantly different between the two genotypes
(TG, 39.6m ± 2.8m; CT, 36.0m ± 4.4m; P > 0.05). (C to E) Performance in a light/dark
transition test for a 10 minute session of TG (N=13) and CT (N=13) that have undergone

24
4 weeks of Dox withdrawal (14-22 weeks of age). There was no significant difference
between the two genotypes in the distance traveled in each compartment (P > 0.05) (C),
the total time spent in each compartment (P > 0.05) (D) nor in the numbers of transition
between the light and dark compartments (P > 0.05) (E).
25
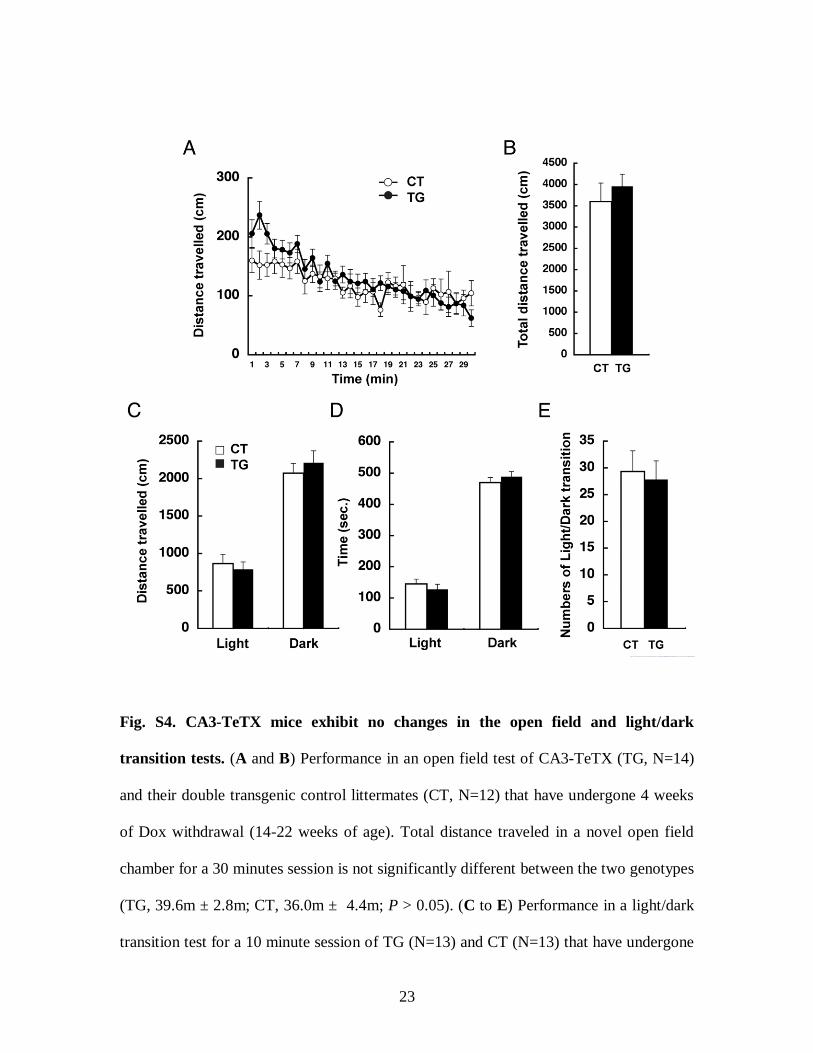
Fig. S5. CA3-TeTX mice exhibit no changes in elevated plus maze, rotarod and hot
plate test. (A to C) Performance in the elevated plus maze task of CA3-TeTX (TG,
N=12) and their double transgenic control littermates (CT, N=12) that have undergone 4
weeks of Dox withdrawal (14-22 weeks of age). There was no significant difference
between the two genotypes in numbers of entries into open arms or closed arms (P >
0.05) (A), percentages of time spent in each type of arms (P > 0.05) (B) nor in the total
distance traveled (P > 0.05) (C). (D) Performance in the rotarod test along six trials of

26
TG (N=17) and CT (N=13) that have undergone 4 weeks of Dox withdrawal (14-22
weeks of age). The performances of the two genotypes were not significantly different (2-
way ANOVA: Genotype x Time F(1,5) = 0.27, P = 0.93; Time F(1,5) = 42.42, P < 0.01;
Genotype F(1,5) = 0.12, P = 0.73). (E) Performance in a hot plate test of TG (N=12) and
CT (N=12) that have undergone 4 weeks of Dox withdrawal (14-22 weeks of age). There
was no significant difference on latency to lift their front paws (P > 0.05).
27
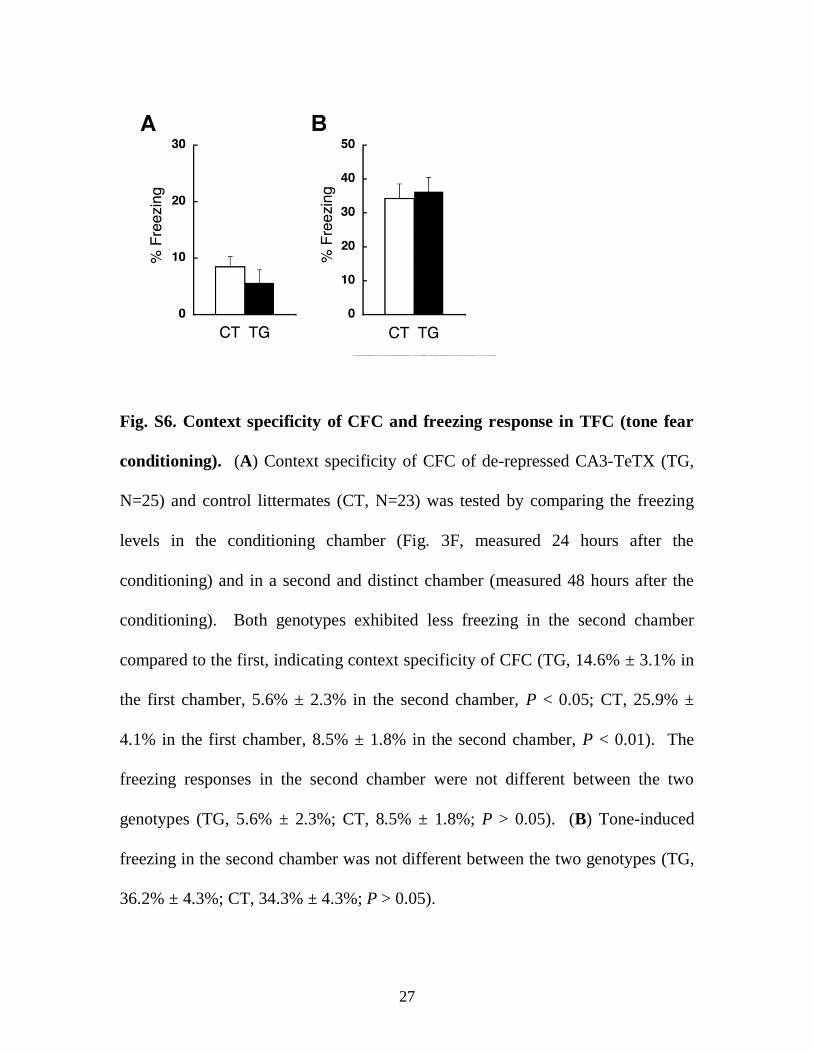
Fig. S6. Context specificity of CFC and freezing response in TFC (tone fear
conditioning). (A) Context specificity of CFC of de-repressed CA3-TeTX (TG,
N=25) and control littermates (CT, N=23) was tested by comparing the freezing
levels in the conditioning chamber (Fig. 3F, measured 24 hours after the
conditioning) and in a second and distinct chamber (measured 48 hours after the
conditioning). Both genotypes exhibited less freezing in the second chamber
compared to the first, indicating context specificity of CFC (TG, 14.6% ± 3.1% in
the first chamber, 5.6% ± 2.3% in the second chamber, P < 0.05; CT, 25.9% ±
4.1% in the first chamber, 8.5% ± 1.8% in the second chamber, P < 0.01). The
freezing responses in the second chamber were not different between the two
genotypes (TG, 5.6% ± 2.3%; CT, 8.5% ± 1.8%; P > 0.05). (B) Tone-induced
freezing in the second chamber was not different between the two genotypes (TG,
36.2% ± 4.3%; CT, 34.3% ± 4.3%; P > 0.05).
28
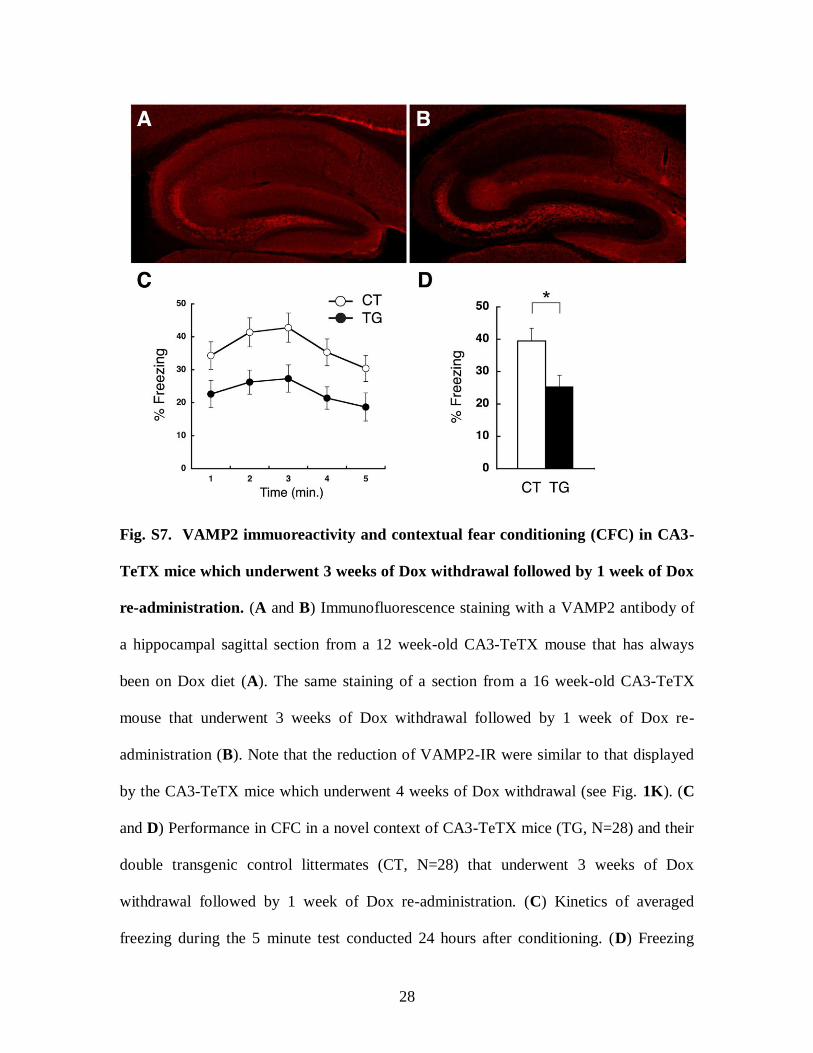
Fig. S7. VAMP2 immuoreactivity and contextual fear conditioning (CFC) in CA3-
TeTX mice which underwent 3 weeks of Dox withdrawal followed by 1 week of Dox
re-administration. (A and B) Immunofluorescence staining with a VAMP2 antibody of
a hippocampal sagittal section from a 12 week-old CA3-TeTX mouse that has always
been on Dox diet (A). The same staining of a section from a 16 week-old CA3-TeTX
mouse that underwent 3 weeks of Dox withdrawal followed by 1 week of Dox re-
administration (B). Note that the reduction of VAMP2-IR were similar to that displayed
by the CA3-TeTX mice which underwent 4 weeks of Dox withdrawal (see Fig. 1K). (C
and D) Performance in CFC in a novel context of CA3-TeTX mice (TG, N=28) and their
double transgenic control littermates (CT, N=28) that underwent 3 weeks of Dox
withdrawal followed by 1 week of Dox re-administration. (C) Kinetics of averaged
freezing during the 5 minute test conducted 24 hours after conditioning. (D) Freezing

29
averaged over the first 3 minute test session for each genotype. Freezing responses across
a 5 minute test in the conditioning chamber were significantly different between the two
genotypes (2-way ANOVA: Genotype x Time F(1,4) = 0.30, P = 0.88; Time F(1,4) =
6.66, P < 0.01; Genotype F(1,4) = 7.98, P = 0.007). Average freezing responses during
first three minutes in the conditioning chamber were significantly different between the
two genotypes (TG, 25.4% ± 3.5%; CT, 39.5% ± 3.9%; P < 0.05).
30
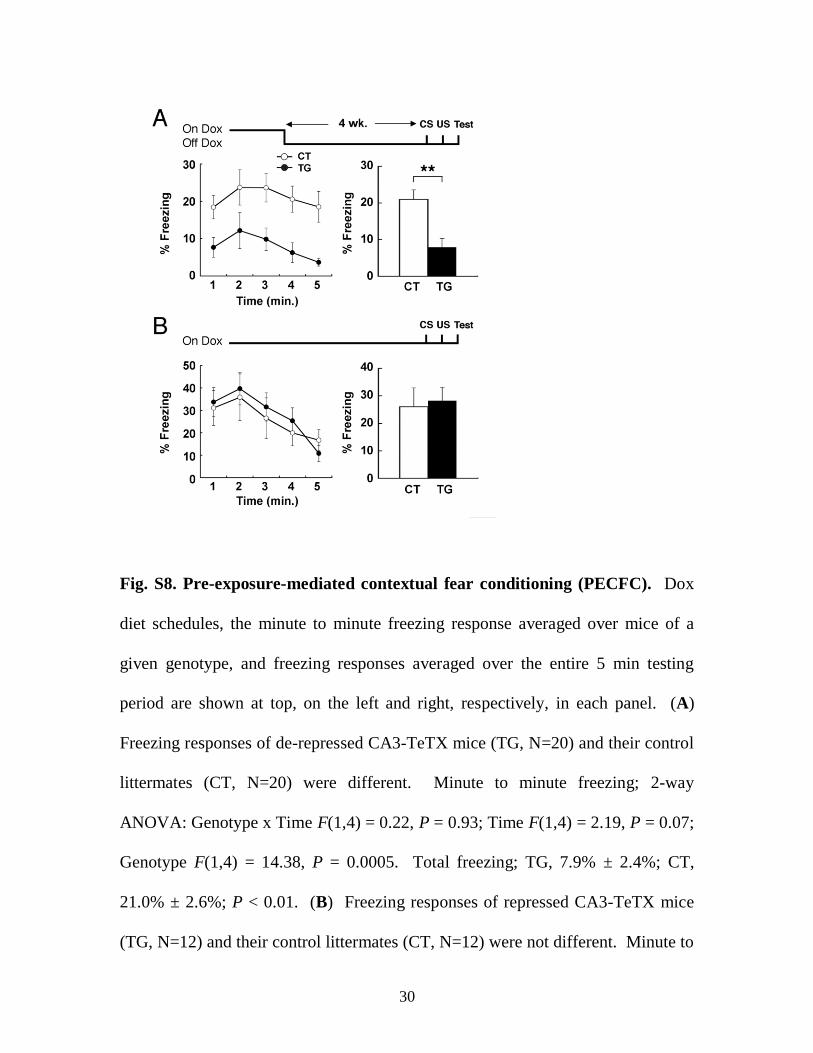
Fig. S8. Pre-exposure-mediated contextual fear conditioning (PECFC). Dox
diet schedules, the minute to minute freezing response averaged over mice of a
given genotype, and freezing responses averaged over the entire 5 min testing
period are shown at top, on the left and right, respectively, in each panel. (A)
Freezing responses of de-repressed CA3-TeTX mice (TG, N=20) and their control
littermates (CT, N=20) were different. Minute to minute freezing; 2-way
ANOVA: Genotype x Time F(1,4) = 0.22, P = 0.93; Time F(1,4) = 2.19, P = 0.07;
Genotype F(1,4) = 14.38, P = 0.0005. Total freezing; TG, 7.9% ± 2.4%; CT,
21.0% ± 2.6%; P < 0.01. (B) Freezing responses of repressed CA3-TeTX mice
(TG, N=12) and their control littermates (CT, N=12) were not different. Minute to

31
minute freezing; 2-way ANOVA: Genotype x Time F(1,4) = 0.71, P = 0.59; Time
F(1,4) = 11.16, P < 0.0001; Genotype F(1,4) = 0.08, P = 0.79. Total freezing; TG,
28.2% ± 4.9%; CT, 26.0% ± 6.9%; P > 0.05.
32
4. Supporting Tables
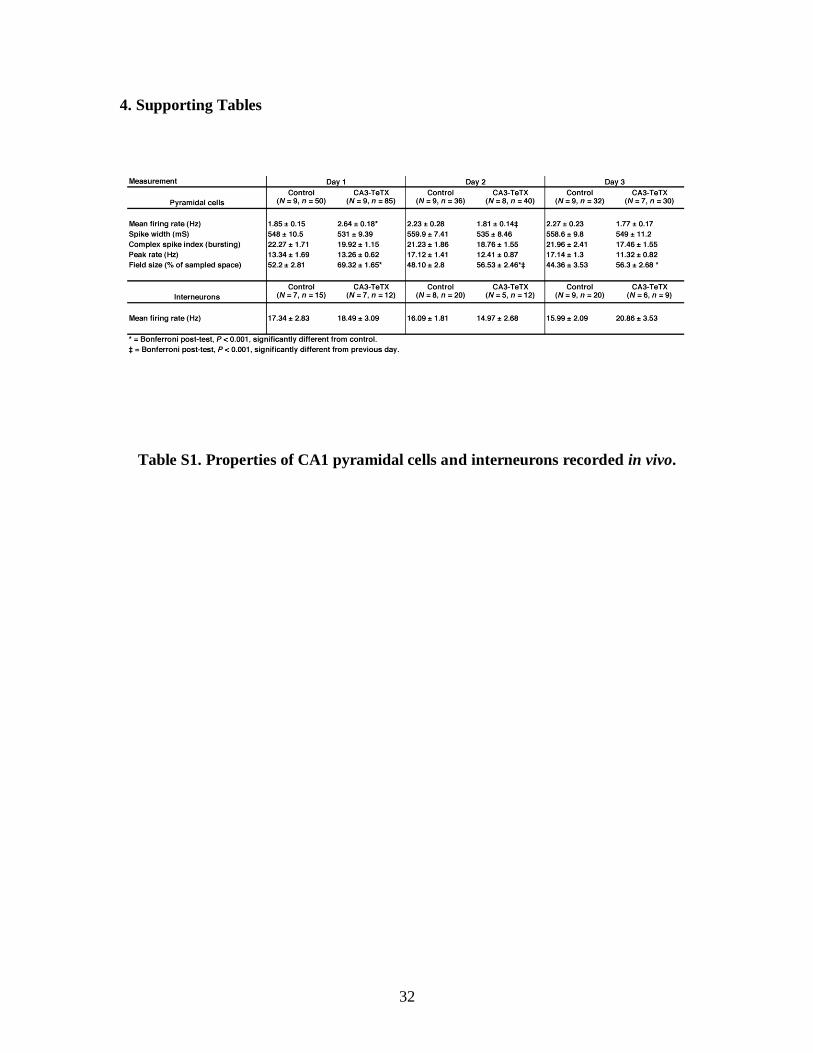
Table S1. Properties of CA1 pyramidal cells and interneurons recorded in vivo.
33
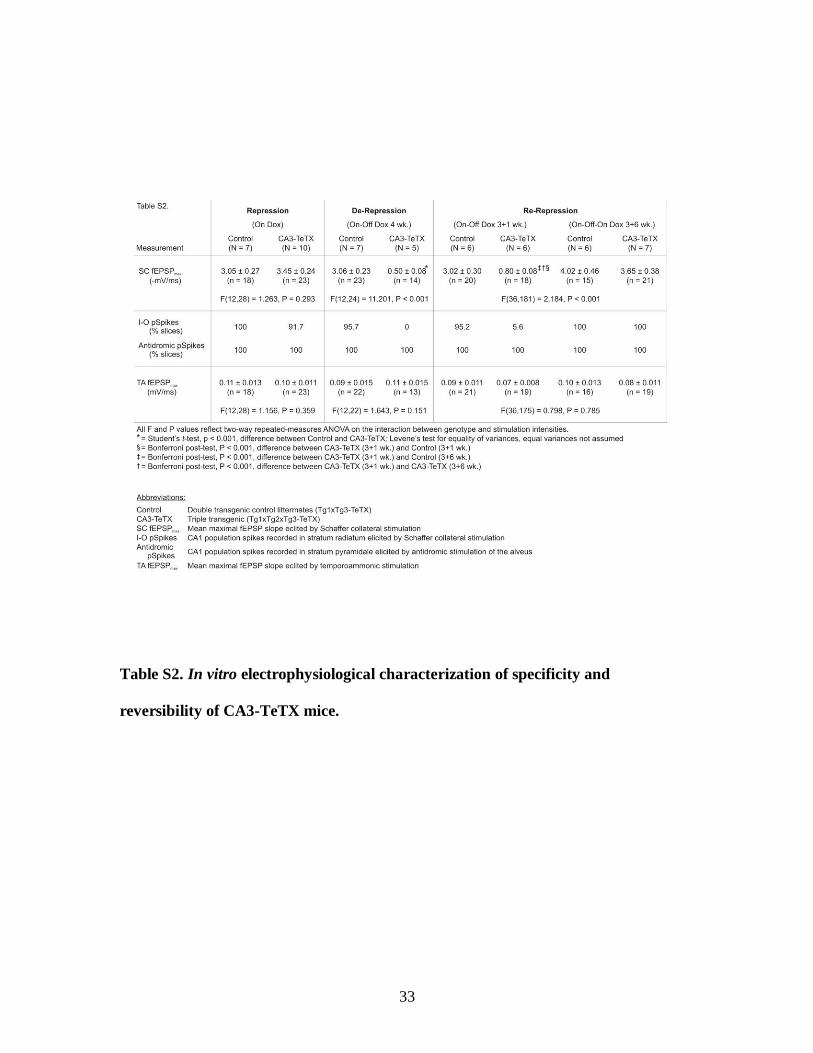
Table S2. In vitro electrophysiological characterization of specificity and
reversibility of CA3-TeTX mice.
34
5. Statistics and Sample Sizes
Fig. 2, A to C. Please refer to Table S2 for a summary of all statistics and sample sizes
relating to in vitro electrophysiology.
Fig. 3, A to D. Morris water maze task in the de-repressed CA3-TeTX (TG, N=10) and
their control littermates (CT, N=10) mice.
Fig. 3A. The average escape latencies to the hidden platform location between the two
genotypes were not significantly different (2-way ANOVA: Genotype x Day F(1,9) =
0.86, P = 0.56; Day F(1,9) = 27.29, P < 0.0001; Genotype F(1,9) = 0.48, P = 0.50).
Fig. 3B. Target quadrant occupancies were not significantly different between the two
genotypes (TG, 33.6% ± 4.3%; CT, 33.4% ± 5.2%; P > 0.05 on Day 6; TG, 41.7% ±
4.6%; CT, 47.5% ± 5.2%; P > 0.05 on Day 11). Occupancies between target (TA) and
opposite (OP) quadrants in TG were significantly different (TA, 33.6% ± 4.3%; OP,
20.3% ± 2.4%; P < 0.05 on Day 6; TA, 41.7% ± 4.6%; OP, 16.6% ± 2.9%; P < 0.01 on
Day 11). Occupancies between target (TA) and opposite (OP) quadrants in CT were
significantly different (TA, 33.4% ± 5.2%; OP, 19.6% ± 3.9%; P < 0.05 on Day 6; TA,
47.5% ± 5.2%; OP, 13.5% ± 2.9%; P < 0.01 on Day 11).
35
Fig. 3C. The number of platform crossings were not significantly different between the
two genotypes (TG, 3.30 ± 0.63; CT, 3.70 ± 0.90; P > 0.05 on Day 6; TG, 5.60 ± 0.74;
CT, 5.50 ± 0.72; P > 0.05 on Day 11).
Fig. 3, E and F. Contextual fear conditioning in a novel context of the de-repressed CA3-
TeTX (TG, N=25) and their double transgenic control littermates (CT, N=23) mice.
Fig. 3E. Freezing responses across a 5 min test in the conditioning chamber were
significantly different between the two genotypes (2-way ANOVA: Genotype x Time
F(1,4) = 0.39, P = 0.82; Time F(1,4) = 3.88, P < 0.01; Genotype F(1,4) = 4.36, P = 0.04).
Fig. 3F. Total freezing responses during first three minutes in the conditioning chamber
were significantly different between the two genotypes (TG, 14.6% ± 3.1%; CT, 25.9% ±
4.1%; P < 0.05).
Fig. 3, G and H. Contextual fear conditioning in a novel context of the CA3-TeTX (TG,
N=28) and their double transgenic control littermates (CT, N=28) mice that have
undergone 3 weeks of Dox withdrawal and subsequently 6 weeks of Dox reapplication.
Fig. 3G. Freezing responses across a five minutes test in the conditioning chamber were
not significantly different between the two genotypes (2-way ANOVA: Genotype x Time
F(1,4) = 1.48, P = 0.21; Time F(1,4) = 7.88, P < 0.01; Genotype F(1,4) = 0.26, P = 0.61).
36
Fig. 3H. Total freezing responses during first three minutes in the conditioning chamber
were not significantly different between the two genotypes (TG, 43.56% ± 3.1%; CT,
41.0% ± 3.5%; P > 0.05).
Fig. 3, I and J. Contextual fear conditioning after 3 days familiarization (10 minutes per
day) to a conditioning chamber of the de-repressed CA3-TeTX (TG, N=12) and their
double transgenic control littermates (CT, N=12) mice.
Fig. 3I. Freezing responses across a five minutes test in the conditioning chamber were
not significantly different between the two genotypes (2-way ANOVA: Genotype x Time
F(1,4) = 0.66, P = 0.62; Time F(1,4) = 1.54, P = 0.20; Genotype F(1,4) = 0.94, P = 0.34).
Fig. 3J. Total freezing responses during first three minutes in the conditioning chamber
were not significantly different between the two genotypes (TG, 24.9% ± 6.0%; CT,
34.9% ± 5.3%; P > 0.05).
Fig. 3K. Pre-exposure-mediated contextual fear conditioning (PECFC) task in the CA3-
TeTX (TG, N=17) and their double transgenic control littermates (CT, N=15) mice. The
mice were given pre-exposure sessions in the repressed state, and, four-weeks later,
received a footshock in the de-repressed state. Freezing responses across a five minute
test were significantly different between the two genotypes (2-way ANOVA: Genotype x
Time F(1,4) = 0.92, P = 0.46; Time F(1,4) = 3.47, P = 0.01; Genotype F(1,4) = 5.31, P =
37
0.03). Total freezing responses between the two genotypes were significantly different
(TG, 17.3% ± 3.4%; CT, 33.4% ± 6.7%; P < 0.05).
Fig. 4B. CA1 place field size, defined as percentage of space where the cell fires on the
track, was significantly increased in CA3-TeTX (TG) mice on all days analyzed (2-way
ANOVA: Genotype x Day F(1,2) = 1.635, P = 0.197; Genotype F(1,2) = 32.816, P <
0.001; Day F(1,2) = 10.216, P < 0.001). A significant decrease in place field size was
observed in TG between Day 1 and Day 2 (Bonferroni post-test, P < 0.001), but not in
their double transgenic control littermates. No significant changes were observed
between Day 2 and Day 3 for either genotype.
Fig. 4C. Average firing rate of CA1 place cells was significantly higher in CA3-TeTX
mice (TG) compared to their double transgenic control littermates (CT) on Day 1, but not
on subsequent days (2-way ANOVA: Genotype x Day F(1,2) = 6.96, P = 0.001;
Genotype F(1,2) = 0.056, P = 0.814; Day F(1,2) = 0.93, P = 0.395; Bonferroni post-test
for Day 1, P = 0.001). A significant decrease in average firing rate was observed in TG
between Day 1 and Day 2 (Bonferroni post-test, P = 0.001), but not in CT. No significant
changes were observed between Day 2 and Day 3 for either genotype.
Fig. 4D. Spatial information, defined as bits/spike (see below), was significantly lower in
CA3-TeTX (TG) mice on all days (2-way ANOVA: Genotype x Day F(1,2) = 0.874, P =
0.418; Genotype F(1,2) = 71.62, P < 0.001; Day F(1,2) = 14.035, P < 0.001). A
significant increase in spatial information was observed in TG between Day 1 and Day 2

38
(Bonferroni post-test, P < 0.001), but not in their double transgenic control littermates.
No significant changes were observed between Day 2 and Day 3 for either genotype.
Spatial information provided by each cell, was defined as:
where p(xi) is the probability of the animal being at location xi, f(xi) is the firing rate
observed at xi, and F is the overall firing rate of the cell (20). This equation yields
bits/sec, to acquire bits/spike the output of this equation is then divided by the average
firing rate F.
39
6. Supporting References
1. B. Sauer, Methods Enzymol 225, 890 (1993).
2. J. Z. Tsien et al., Cell 87, 1317 (1996).
3. K. Nakazawa et al., Science 297, 211 (2002).
4. M. Mayford et al., Science 274, 1678 (1996).
5. T. Nakashiba, S. Nishimura, T. Ikeda, S. Itohara, Mech Dev 111, 47 (2002).
6. H. Kang et al., Cell 106, 771 (2001).
7. C. M. Colbert, W. B. Levy, J Neurophysiol 68, 1 (1992).
8. K. G. Reymann et al., Brain Res Bull 15, 249 (1985).
9. T. J. McHugh et al., Science 317, 94 (2007).
10. B. J. Wiltgen, A. J. Silva, Learn Mem 14, 313 (2007).
11. M. S. Fanselow, Animal Learn Behav 18, 264 (1990).
12. J. W. Rudy, R. C. O'Reilly, Behav Neurosci 113, 867 (1999).
13. T. J. McHugh, K. I. Blum, J. Z. Tsien, S. Tonegawa, M. A. Wilson, Cell 87, 1339
(1996).
14. P. Soriano, Nat Genet 21, 70 (Jan, 1999).
15. S. Gong et al., Nature 425, 917 (2003).
16. A. Visel, C. Thaller, G. Eichele, Nucleic Acids Res 32, D552 (2004).
17. S. Magdaleno et al., PLoS Biol 4, e86 (2006).
18. E. S. Lein et al., Nature 445, 168 (2007)
19. K. J. Harms, A. M. Craig, J Comp Neurol 490, 72 (2005).
20. W. E. Skaggs, B. L. McNaughton, K. Gothard, E. Markus, in Advances in Neural
Information Processing Systems, S. Hanson, J. Cowan and C. Giles, Eds, (Morgan
Kaufmann, San Mateo, 1993), vol. 5, pp. 1030-1037.