Embed Size (px)
Citation preview
Biennial Energy Report Chapter 3 — Page 1
Oregon’s renewable electricity capacity has grown
over the years, thanks to some of the early
supporting policies, a growing voluntary demand for
cleaner electricity, substantial decreases in the costs
of renewable electricity technologies, and recent
policies like a strengthened Renewable Portfolio
Standard.
Oregon will face a number of challenges and
opportunities as we work toward a clean energy
future. CH
AP
TER
3:
REN
EWA
BLE
EN
ERG
Y
Biennial Energy Report Chapter 3 — Page 2
Introduction
Oregon’s renewable electricity capacity has grown over the years,
thanks to some of the early supporting policies, a growing voluntary
demand for cleaner electricity, substantial decreases in the costs of
renewable electricity technologies, and recent policies like a
strengthened Renewable Portfolio Standard. Oregon will face a number
of challenges and opportunities as it works toward a goal of 50 percent
renewable electricity consumption by 2040. Changes within the utility
industry itself, new technologies, and changing customer demands will
affect how Oregon reaches its RPS target.
While energy and electricity are not fully interchangeable terms, this
chapter uses the term energy when discussing electricity in Oregon.
Energy typically includes uses other than electricity, including
transportation, industrial processes, and home heating; these types of
energy are discussed in other chapters of this report.
Renewable Energy 101
Renewable energy is generally defined as energy from sources that are naturally replenishing on a relatively
short time horizon, including solar, wind, geothermal, hydropower, biomass, and marine energy.* Certain
renewable energy policies have a narrower definition for renewable energy that is used for compliance, such
as a renewable portfolio standard.
KEY
TA
KEA
WA
YS
• Installed capacity and consumption of renewable electricity in Oregon have grown over the
years, thanks to policies like the Renewable Portfolio Standard (RPS); federal and state
incentives; growing interest from consumers and businesses to purchase renewable energy
voluntarily; and significant decreases in the costs of renewable energy technology.
• To increase renewable energy in Oregon while maintaining reliability and low costs, the state
will need to understand and address a wide web of interrelated issues and make choices on
how to meet our state energy goals.
• To meet the challenge of efficiently and cost-effectively integrating increasing amounts of
variable renewable electricity onto the grid, Oregon should investigate how to leverage and
combine flexible electricity resources and technologies; flexible control over demand
through innovative new rate structures and demand response programs; and access to more
flexible markets, such as the Energy Imbalance Market.
*Marine energy is an emerging renewable resource, which includes wave, tidal, and current energy.

Biennial Energy Report Chapter 3 — Page 3
Oregon’s RPS outlines which sources are eligible and under what constraints. All of the sources listed above
are eligible for Oregon’s RPS. Some of the sources — such as the direct combustion of municipal solid waste,
certain categories of biomass, and hydropower — are limited in eligibility due to facility age or concerns
around particulate emissions, chemical preservatives, or land management. For more information on the
eligibility of various resources for the RPS, see ORS 469A.1
Renewable Electricity Installations in Oregon
Beginning in 1977 with the creation of the Residential Energy Tax Credit (RETC) program, the Oregon
legislature passed a series of bills promoting renewable energy resources, including the public purpose
charge, net metering, the RPS, funding for wave energy, zoning measures, and requirements for public
buildings. This legislative momentum, as well as the region’s hydropower, has helped place Oregon as one of
the leading states for renewable energy installations. As of 2016, Oregon was fourth in the nation for
cumulative renewable electricity installed capacity, and fifth in terms of per capita installed capacity.2
Figure 3.1: Top States for Cumulative Renewable Electricity Installed Capacity for 20162
With approximately 12,211 MW of installed renewable capacity in 2016, Oregon also ranked high for
installed capacity of both hydropower (third) and geothermal generation (fifth).2

Biennial Energy Report Chapter 3 — Page 4
Figure 3.2: States Leading Hydropower Electricity Installed Capacity in 20162
Renewable Energy Drivers in Oregon
Many factors have driven the increase in renewable energy generation and consumption in Oregon, such as
state and federal policies, increased customer demand, and sharply declining costs of technology. This
section will explore these drivers:
• Required Procurement: Policies requiring renewable procurement;
• Voluntary Procurement: Programs and market opportunities that meet consumers’ voluntary
renewable energy demand;
• Financial Incentives: Incentives for renewable energy; and
• Falling Costs: Falling costs associated with renewable energy technology and project development.
Required Procurement
Oregon has a number of policies that require entities to procure and consume renewable energy. While
there has been no comprehensive assessment of the impact of these policies on the development of
renewable energy, the three policies described below – PURPA, RPS, and the Green Energy Technology
program – have required utilities and public entities in Oregon to develop renewable energy.
PURPA
One of the original drivers of renewable energy development in Oregon was the federal Public Utility
Regulatory Policies Act of 1978, or PURPA,* which obligates utilities to buy output from qualifying small
*PURPA is codified in numerous sections of 16 U.S.C., including, § 796, § 824a-3 and §§ 2601, et seq.

Biennial Energy Report Chapter 3 — Page 5
renewable generators and cogeneration facilities (“qualifying facilities”) at the utility’s “avoided cost”* of
procuring that energy elsewhere. PURPA removed barriers to development of renewable generating
resources and created a fair and open market for independent (non-utility) electricity producers. PURPA has
been a major driver for renewable energy project development in the West, including Oregon, and analysts
expect it to be one of the main drivers for utility-scale solar development in the U.S. in 2018 and beyond.3
The Oregon Renewable Portfolio Standard
A renewable portfolio standard is a policy requiring retail electricity providers to meet a certain percentage
of their annual electricity sales with eligible renewable energy generating resources. Nationally, state RPS
policies have been responsible for approximately 50 percent of the growth in non-hydro renewable energy
generation since 2000. In the West, between 70 and 90 percent of renewable energy additions were built to
meet RPS requirements.4
Oregon established its RPS in 2007 with Senate Bill 838 (Oregon Laws 2007, Chapter 301), providing a
requirement for the largest utilities1 – Portland General Electric, PacifiCorp, and the Eugene Water & Electric
Board – to provide 25 percent of retail sales from eligible renewable sources by 2025, with interim goals
along the way. The state’s many smaller consumer-owned utilities (COUs) were given lower targets,
depending on the percent share of the state’s total retail electricity load supplied by the COU. Other than
EWEB, only Umatilla Electric Cooperative has had enough sales to trigger the large utility RPS threshold,
which is three percent or more of total statewide retail electricity sales in any three consecutive years.
Table 3.1: Annual Percent Share of Total Retail Electricity Sales in Oregon for the Largest Utilities for 2015-
20175,6,7
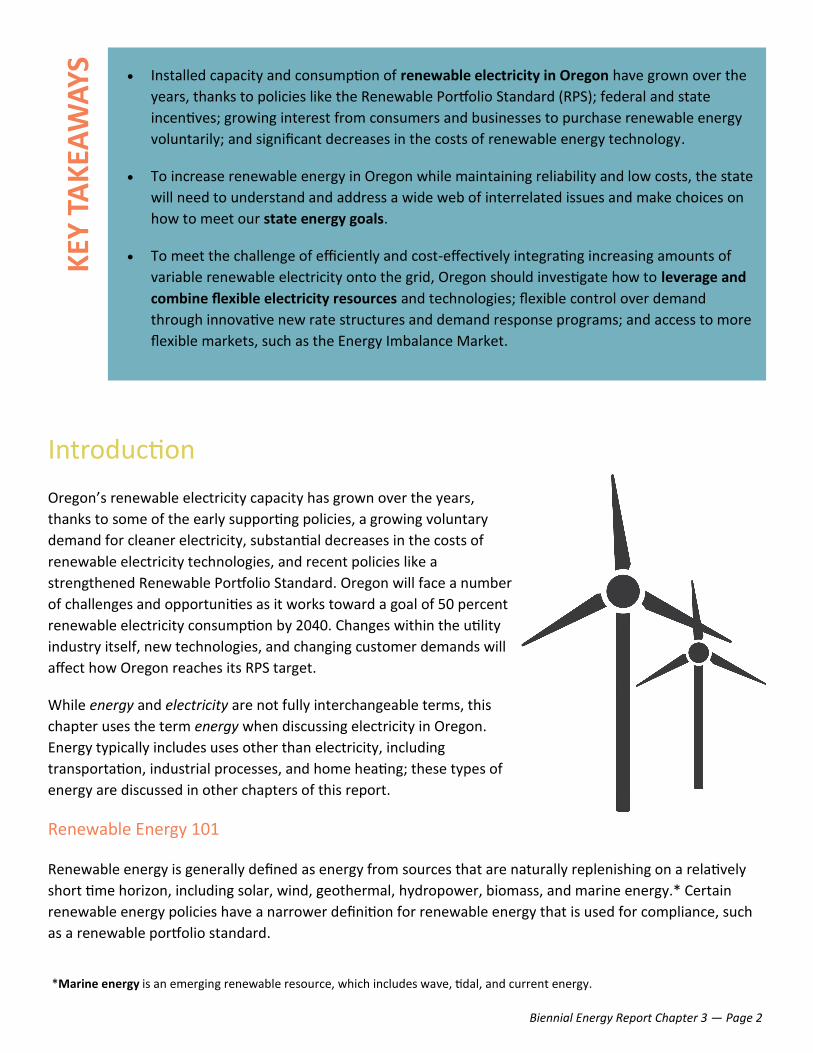
The Oregon Clean Electricity and Coal Transition Plan increased Oregon’s RPS target in 2016 through Senate
Bill 1547 (Oregon Laws 2016, Chapter 28).92 Also known as the “Coal to Clean” legislation, SB 1547 increased
the RPS from 25 percent by 2025 to 50 percent by 2040. This 50 percent target applies to the large investor-
owned utilities (IOUs) that provide three percent or more of total state retail electricity sales. COUs’
compliance is capped at 25 percent by 2025.
*In Oregon, utilities establish different avoided costs rates based on the technology. Learn more about avoided costs later in this chapter.
Entity Utility Type Percent Share of Oregon Retail Sales
2015 2016 2017
PGE Investor-owned 37.50 36.60 35.80
PacifiCorp Investor-owned 27.20 27.30 26.60
EWEB Municipal-owned 4.88 4.85 4.95
Umatilla Cooperative 3.35 3.80 4.29
Central Lincoln People’s Utility District 2.63 2.68 2.73
Clatskanie People’s Utility District 1.92 1.91 2.24
Springfield Municipal-owned 1.55 1.57 1.50
Biennial Energy Report Chapter 3 — Page 6
Figure 3.3: Original Oregon IOU RPS Targets and New Targets after 2025
Eligibility
Eligibility of resources for the Oregon RPS is based on
two factors: the source of the renewable energy and the
age of the generating facility (also referred to as the
commercial operation date). Generation sources eligible
for the Oregon RPS include solar, wind, geothermal,
certain biomass sources, some hydropower, and a
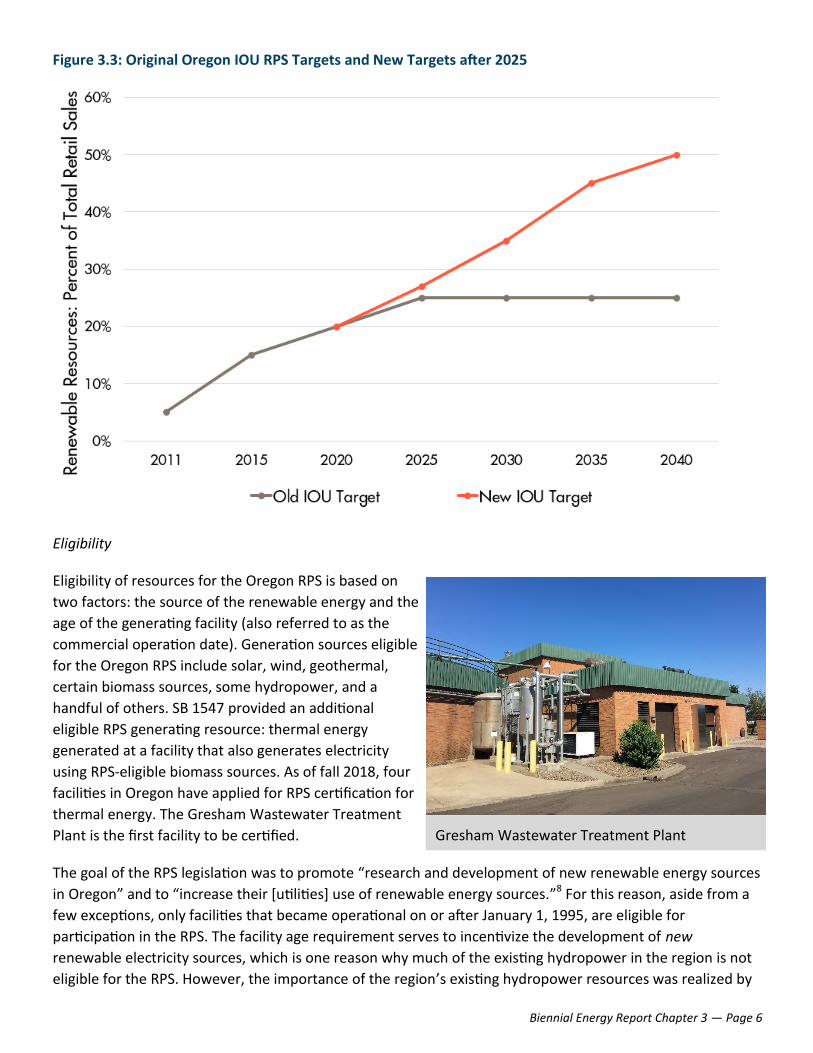
handful of others. SB 1547 provided an additional
eligible RPS generating resource: thermal energy
generated at a facility that also generates electricity
using RPS-eligible biomass sources. As of fall 2018, four
facilities in Oregon have applied for RPS certification for
thermal energy. The Gresham Wastewater Treatment
Plant is the first facility to be certified.
The goal of the RPS legislation was to promote “research and development of new renewable energy sources
in Oregon” and to “increase their [utilities] use of renewable energy sources.”8 For this reason, aside from a
few exceptions, only facilities that became operational on or after January 1, 1995, are eligible for
participation in the RPS. The facility age requirement serves to incentivize the development of new
renewable electricity sources, which is one reason why much of the existing hydropower in the region is not
eligible for the RPS. However, the importance of the region’s existing hydropower resources was realized by
Gresham Wastewater Treatment Plant

Biennial Energy Report Chapter 3 — Page 7
two exemptions for pre-1995 hydropower facilities: any incremental generation attributable to efficiency
upgrades made at existing hydropower facilities after 1995 would be eligible, as would generation from an
existing facility if it became certified as a low-impact hydroelectric facility* after 1995. Additionally, new
hydropower projects could qualify for the RPS if they are certified as low impact or if they are located outside
certain protected areas.
RPS Exemptions
Oregon’s RPS allows for four exemptions to a portion of a utility’s RPS compliance requirement, two of
which further acknowledge the value of zero-emissions hydropower:
• Cost cap: An entity is not required to comply with the RPS to the extent that the costs of compliance
exceeds four percent of the entity’s annual revenue requirement for the compliance year.
• Excess load: An entity need not comply to the extent that it would have to acquire electricity in excess
of its load requirement.
• BPA Tier 1 power: COUs are not required to comply with the RPS to a point where they would be
required to reduce their consumption of non-RPS eligible BPA Tier 1** hydropower.
• Older renewables: An entity is not required to comply to the extent that it would have to substitute
newer renewable electricity for electricity from older, non-RPS sources that are not fossil-fueled, such as
legacy hydropower.
RPS Tracking – Renewable Energy Certificates
As electrons from, for example, a natural gas plant become indistinguishable from those from a wind farm
once they stream onto the grid, renewable energy certificates, or RECs, are used to track renewable energy
and to determine where it is ultimately consumed. At the simplest level, a REC is a tradeable certificate that
represents the renewable attributes of one-megawatt hour (1 MWh) of qualifying renewable electricity
delivered to the grid.
A majority of jurisdictions define RECs to include environmental attributes associated with the renewable
energy generated, but there are some differences across jurisdictions in how those attributes are defined.
Oregon defines a REC as including the “environmental, economic, and social benefits” associated with
renewable energy.9 If the renewable electricity and its corresponding RECs are sold together to the same
customer, the RECs are considered to be “bundled” and to include all of the attributes of the renewable
generation. Simply put, bundled means that 1 MWh of renewable electricity and the REC created for that
*The Oregon RPS requires a certification from the Low Impact Hydropower Institute (LIHI) for a facility to be considered low im-pact. LIHI certification is awarded to facilities according to eight dimensions related to environmentally sound hydropower genera-tion, such as water quality, fish passage, watershed protection, endangered species protection, and avoidance of impacts on cultur-al and historic resources.89
**BPA has a two-tiered power rate design for public power customers. Tier 1 is the base rate for the agency’s low cost resources. Tier 2 represents incremental power BPA must purchase to meet the power needs of any BPA customers beyond what is covered by Tier 1 rates. The tiered approach is meant to not only provide an incentive for utilities to practice energy efficiency but also to provide a price signal should a public utility wish to build its own resources in place of purchasing Tier 2 power from BPA.

Biennial Energy Report Chapter 3 — Page 8
1 MWh are delivered
together to a single entity.
However, if the REC is
“unbundled” (i.e. sold
separately) from its
corresponding 1 MWh of
electricity generated, the
attributes of renewable
generation stay with the
REC and the remaining
electricity is no longer
counted as “renewable” –
sometimes referred to as
“system power.” Whoever
purchases the unbundled
REC may make a claim of
consuming renewable electricity while the buyer of the MWh of electricity – now without its corresponding
REC – cannot make any renewable claims about the consumption of that unit of electricity.
Oregon entities may comply with the RPS using bundled RECs, unbundled RECs, or Alternative Compliance
Payments (ACP). ACPs are a cost-containment mechanism to protect Oregon ratepayers. The Oregon Public
Utility Commission sets the ACP rate for IOUs and Electricity Service Suppliers (ESSes) each compliance year
at a level that is high enough to incentivize compliance using RECs rather than ACPs but that provides for a
compliance cost ceiling should the costs of procuring renewable energy rise considerably. So far, no Oregon
IOUs or ESSes have used ACPs to comply with the RPS. The 2018-2019 ACP rate for IOUs and ESSes is $90/
MWh.93 For COUs, individual COU boards sets the ACP rate.
Unbundled RECs may only be used for up to 20 percent of an IOU’s annual compliance obligation; COUs may
use up to 50 percent unbundled RECs for annual compliance. Starting in 2021, ESSes, entities that may sell
electricity services through the Direct Access program, may only use unbundled RECs for up to 20 percent of
their annual RPS compliance requirement. Learn more about Direct Access later in this chapter.
RPS Compliance
Oregon’s two biggest IOUs – PacifiCorp and PGE – report to the Oregon Public Utility Commission annually on
what resources they used to comply with the RPS and at what cost.
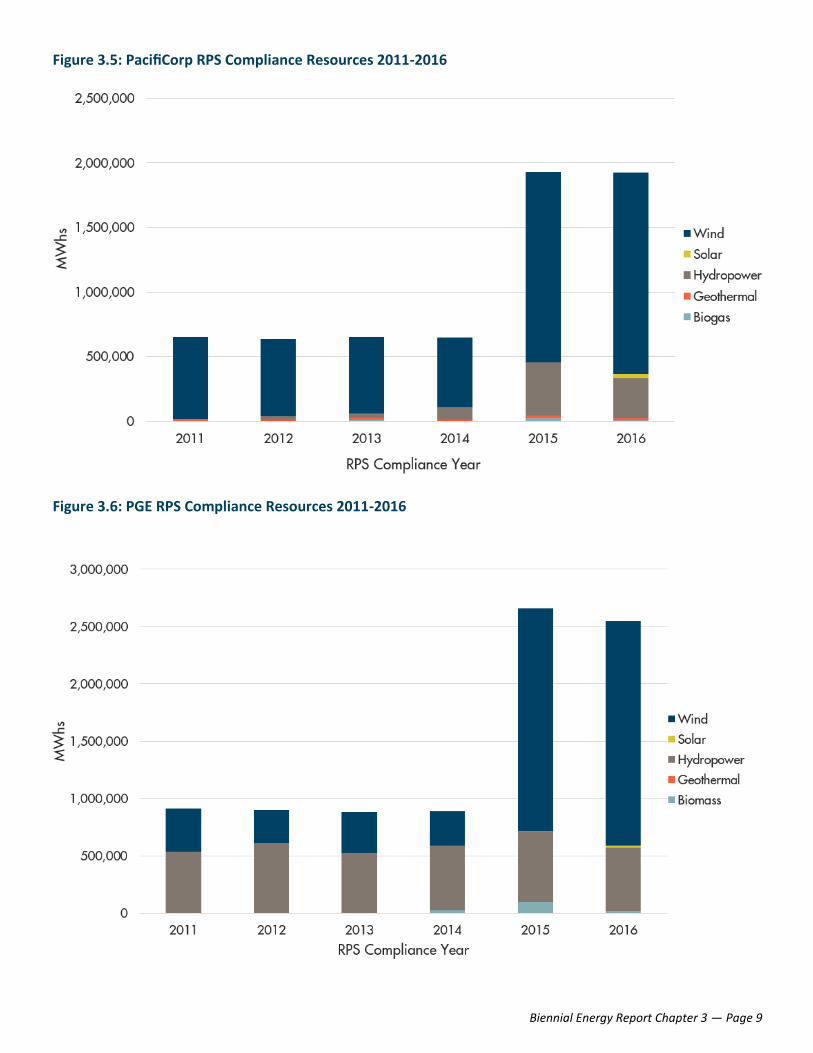
Both PGE and PacifiCorp have met their RPS requirements every year since the first compliance year of 2011
without exceeding the cost cap or using the ACP mechanism. While PacifiCorp has primarily met its RPS
compliance obligations with wind resources, especially in earlier RPS years, PGE has relied on both
hydropower and wind resources. Some of the hydropower PGE uses for compliance each year is from
generation attributable to efficiency upgrades at older hydropower facilities.
Both utilities’ compliance portfolios have also included some solar, geothermal, biogas, and biomass
resources. Solar resources did not provide much of the early RPS compliance for either utility, but both PGE
and PacifiCorp have been adding solar to their compliance portfolios.
Figure 3.4: Flow of Bundled and Unbundled RECs
Biennial Energy Report Chapter 3 — Page 9
Figure 3.5: PacifiCorp RPS Compliance Resources 2011-2016
Figure 3.6: PGE RPS Compliance Resources 2011-2016

Biennial Energy Report Chapter 3 — Page 10
In 2015, the RPS target took its first big jump from five to 15
percent, and both PGE and PacifiCorp met this higher interim target
with a mix of renewable resources located in Oregon and within the
region. The next RPS target increase is from 15 to 20 percent in
2020.
While IOUs must demonstrate RPS compliance to the OPUC, COUs
must report their compliance to their respective members or
customers, usually through the COU’s board. As noted above, EWEB
is the only COU that currently has an RPS requirement, and it
reports directly to its Board of Commissioners on its RPS compliance
each year. However, due to some of the RPS compliance exemptions
listed above, EWEB has not yet had an RPS compliance requirement
above zero. EWEB purchases a quantity of Tier 1 electricity from
BPA, and also meets a portion of its load with legacy hydropower
generation from non-BPA sources. For example, in 2017 EWEB had
total retail sales of 2,526,200 MWh, with a resultant 15 percent RPS requirement of 378,900 MWh. However,
because all of its retail sales were from exempt sources (BPA Tier 1 and legacy hydropower), EWEB was left
with a 2017 RPS compliance requirement of zero.10
The Small-Scale Community-Based Renewables Target
ORS 469A.21094 states “by the year 2025, at least eight percent of the aggregate electrical capacity of all
electric companies that make sales of electricity to 25,000 or more retail electricity consumers in this state
must be composed of electricity generated by one or both of the following sources:
a) Small-scale renewable energy projects with a generating capacity of 20 megawatts or less
that generate electricity utilizing a type of energy described in ORS 469A.025; or
b) Facilities that generate electricity using biomass that also generate thermal energy for a
secondary purpose.”
The law applies to PGE and PacifiCorp.
While the statute defines facility types that are eligible for the RPS as well as a clear target, there are a
number of terms and provisions within the statutory language that lack formal definitions. For example, the
term “aggregate electrical capacity” does not have a statutory definition. As a result, a facility database was
developed with analysis tools to consider different compliance scenarios. In addition, the term “community-
based renewable energy project” is also not defined in statute and does not have a broadly accepted
definition.
To understand different ways utilities might meet the eight percent target, ODOE staff developed a database
of renewable energy facilities serving PGE and PacifiCorp, along with scenario analysis tools to consider
different compliance options. For the purposes of the analysis, it was agreed that utility peak load could
serve as a proxy for aggregate electrical capacity.
Biennial Energy Report Chapter 3 — Page 11
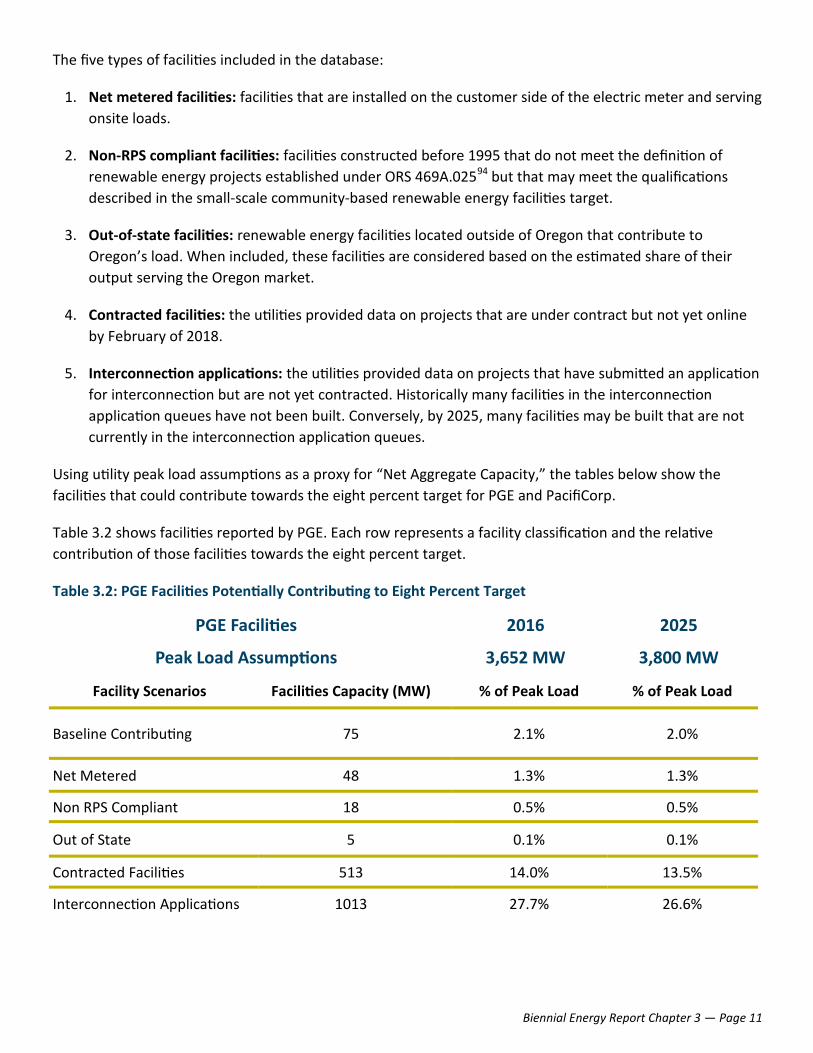
The five types of facilities included in the database:
1. Net metered facilities: facilities that are installed on the customer side of the electric meter and serving
onsite loads.
2. Non-RPS compliant facilities: facilities constructed before 1995 that do not meet the definition of
renewable energy projects established under ORS 469A.02594 but that may meet the qualifications
described in the small-scale community-based renewable energy facilities target.
3. Out-of-state facilities: renewable energy facilities located outside of Oregon that contribute to
Oregon’s load. When included, these facilities are considered based on the estimated share of their
output serving the Oregon market.
4. Contracted facilities: the utilities provided data on projects that are under contract but not yet online
by February of 2018.
5. Interconnection applications: the utilities provided data on projects that have submitted an application
for interconnection but are not yet contracted. Historically many facilities in the interconnection
application queues have not been built. Conversely, by 2025, many facilities may be built that are not
currently in the interconnection application queues.
Using utility peak load assumptions as a proxy for “Net Aggregate Capacity,” the tables below show the
facilities that could contribute towards the eight percent target for PGE and PacifiCorp.
Table 3.2 shows facilities reported by PGE. Each row represents a facility classification and the relative
contribution of those facilities towards the eight percent target.
Table 3.2: PGE Facilities Potentially Contributing to Eight Percent Target
PGE Facilities 2016 2025
3,652 MW 3,800 MW Peak Load Assumptions
Facility Scenarios Facilities Capacity (MW) % of Peak Load % of Peak Load
Baseline Contributing 75 2.1% 2.0%
Net Metered 48 1.3% 1.3%
Non RPS Compliant 18 0.5% 0.5%
Out of State 5 0.1% 0.1%
Contracted Facilities 513 14.0% 13.5%
Interconnection Applications 1013 27.7% 26.6%
Biennial Energy Report Chapter 3 — Page 12
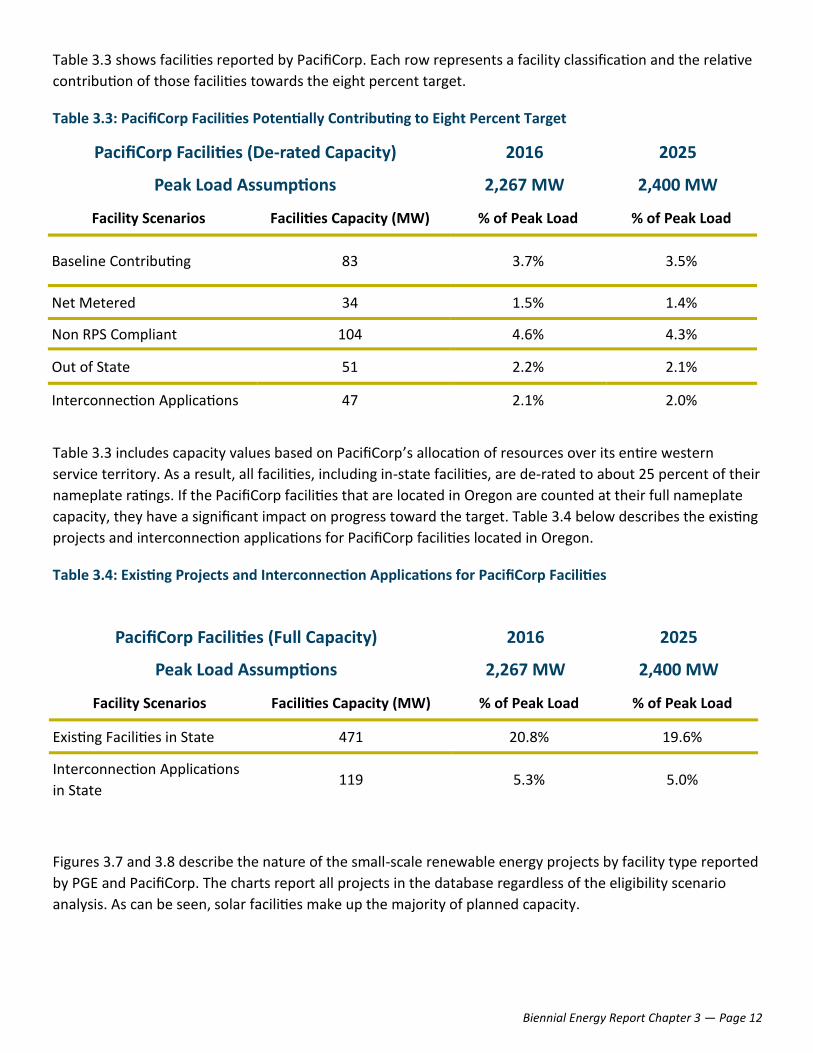
Table 3.3 shows facilities reported by PacifiCorp. Each row represents a facility classification and the relative
contribution of those facilities towards the eight percent target.
Table 3.3: PacifiCorp Facilities Potentially Contributing to Eight Percent Target
Table 3.3 includes capacity values based on PacifiCorp’s allocation of resources over its entire western
service territory. As a result, all facilities, including in-state facilities, are de-rated to about 25 percent of their
nameplate ratings. If the PacifiCorp facilities that are located in Oregon are counted at their full nameplate
capacity, they have a significant impact on progress toward the target. Table 3.4 below describes the existing
projects and interconnection applications for PacifiCorp facilities located in Oregon.
Table 3.4: Existing Projects and Interconnection Applications for PacifiCorp Facilities
Figures 3.7 and 3.8 describe the nature of the small-scale renewable energy projects by facility type reported
by PGE and PacifiCorp. The charts report all projects in the database regardless of the eligibility scenario
analysis. As can be seen, solar facilities make up the majority of planned capacity.
PacifiCorp Facilities (De-rated Capacity) 2016 2025
Peak Load Assumptions 2,267 MW 2,400 MW
Facility Scenarios Facilities Capacity (MW) % of Peak Load % of Peak Load
Baseline Contributing 83 3.7% 3.5%
Net Metered 34 1.5% 1.4%
Non RPS Compliant 104 4.6% 4.3%
Out of State 51 2.2% 2.1%
Interconnection Applications 47 2.1% 2.0%
PacifiCorp Facilities (Full Capacity) 2016 2025
Peak Load Assumptions 2,267 MW 2,400 MW
Facility Scenarios Facilities Capacity (MW) % of Peak Load % of Peak Load
Existing Facilities in State 471 20.8% 19.6%
Interconnection Applications
in State 119 5.3% 5.0%

Biennial Energy Report Chapter 3 — Page 13
Figure 3.7: Cumulative Capacity (MW) of Existing Facilities Reported in the Small Scale Renewable Energy
Facilities Database; Reported Online as of February 2018
Figure 3.8: Capacity (MW) of Planned Facilities Reported in the Small Scale Renewable Energy Facilities
Database; Reported as of February 2018
Biennial Energy Report Chapter 3 — Page 14
In 2018, the OPUC began a rulemaking (Docket AR 62295) to clarify terms and create implementation rules.
This docket is ongoing and tentatively scheduled to be completed by the end of 2018.
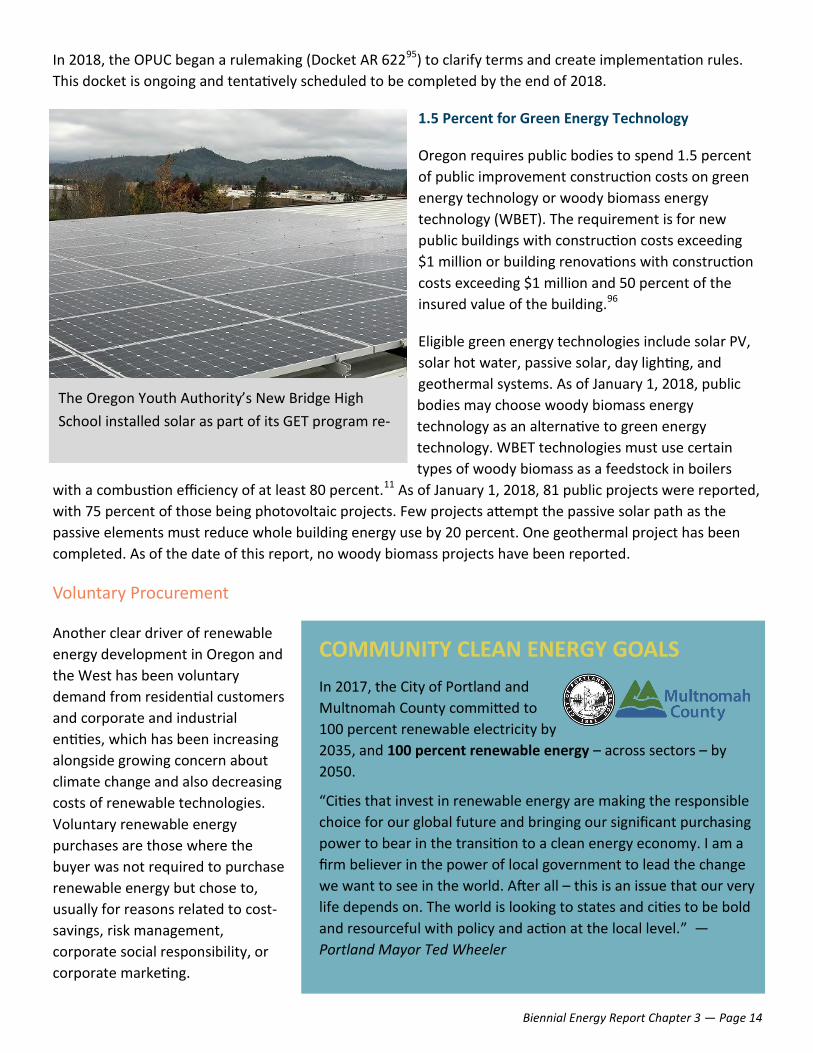
1.5 Percent for Green Energy Technology
Oregon requires public bodies to spend 1.5 percent
of public improvement construction costs on green
energy technology or woody biomass energy
technology (WBET). The requirement is for new
public buildings with construction costs exceeding
$1 million or building renovations with construction
costs exceeding $1 million and 50 percent of the
insured value of the building.96
Eligible green energy technologies include solar PV,
solar hot water, passive solar, day lighting, and
geothermal systems. As of January 1, 2018, public
bodies may choose woody biomass energy
technology as an alternative to green energy
technology. WBET technologies must use certain
types of woody biomass as a feedstock in boilers
with a combustion efficiency of at least 80 percent.11 As of January 1, 2018, 81 public projects were reported,
with 75 percent of those being photovoltaic projects. Few projects attempt the passive solar path as the
passive elements must reduce whole building energy use by 20 percent. One geothermal project has been
completed. As of the date of this report, no woody biomass projects have been reported.
Voluntary Procurement
Another clear driver of renewable
energy development in Oregon and
the West has been voluntary
demand from residential customers
and corporate and industrial
entities, which has been increasing
alongside growing concern about
climate change and also decreasing
costs of renewable technologies.
Voluntary renewable energy
purchases are those where the
buyer was not required to purchase
renewable energy but chose to,
usually for reasons related to cost-
savings, risk management,
corporate social responsibility, or
corporate marketing.
The Oregon Youth Authority’s New Bridge High
School installed solar as part of its GET program re-
COMMUNITY CLEAN ENERGY GOALS
In 2017, the City of Portland and
Multnomah County committed to
100 percent renewable electricity by
2035, and 100 percent renewable energy – across sectors – by
2050.
“Cities that invest in renewable energy are making the responsible
choice for our global future and bringing our significant purchasing
power to bear in the transition to a clean energy economy. I am a
firm believer in the power of local government to lead the change
we want to see in the world. After all – this is an issue that our very
life depends on. The world is looking to states and cities to be bold
and resourceful with policy and action at the local level.” —
Portland Mayor Ted Wheeler
Biennial Energy Report Chapter 3 — Page 15
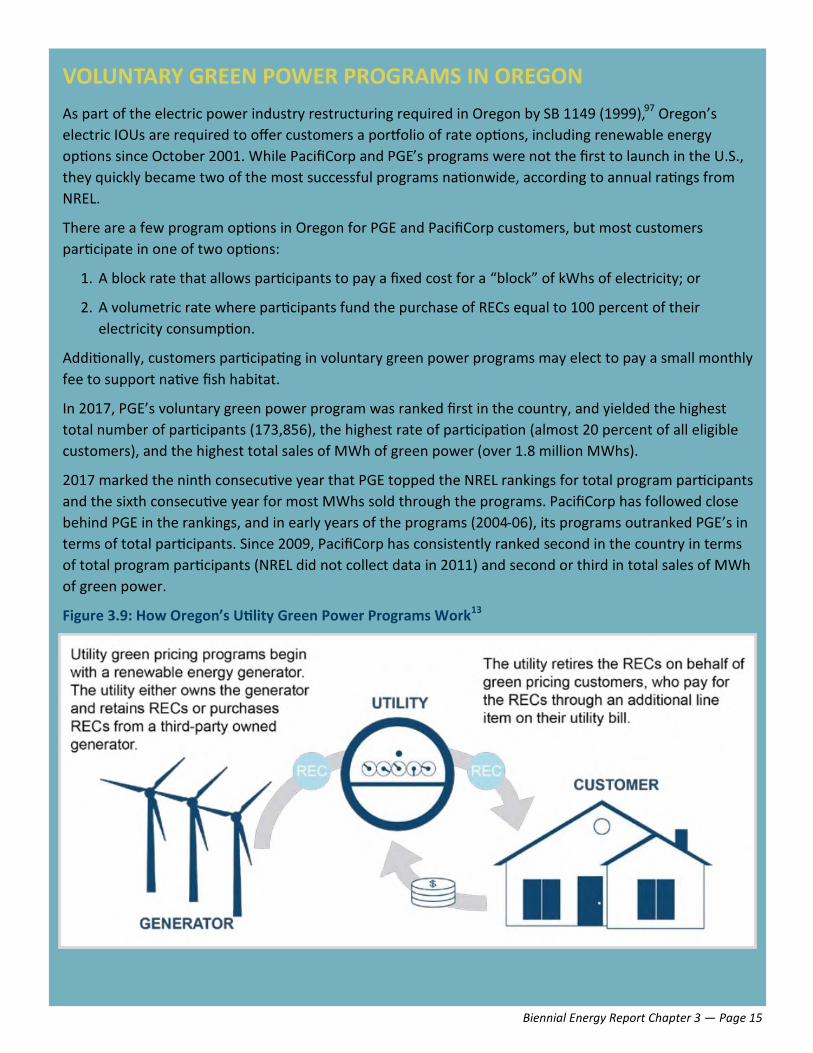
VOLUNTARY GREEN POWER PROGRAMS IN OREGON
As part of the electric power industry restructuring required in Oregon by SB 1149 (1999),97 Oregon’s
electric IOUs are required to offer customers a portfolio of rate options, including renewable energy
options since October 2001. While PacifiCorp and PGE’s programs were not the first to launch in the U.S.,
they quickly became two of the most successful programs nationwide, according to annual ratings from
NREL.
There are a few program options in Oregon for PGE and PacifiCorp customers, but most customers
participate in one of two options:
1. A block rate that allows participants to pay a fixed cost for a “block” of kWhs of electricity; or
2. A volumetric rate where participants fund the purchase of RECs equal to 100 percent of their
electricity consumption.
Additionally, customers participating in voluntary green power programs may elect to pay a small monthly
fee to support native fish habitat.
In 2017, PGE’s voluntary green power program was ranked first in the country, and yielded the highest
total number of participants (173,856), the highest rate of participation (almost 20 percent of all eligible
customers), and the highest total sales of MWh of green power (over 1.8 million MWhs).
2017 marked the ninth consecutive year that PGE topped the NREL rankings for total program participants
and the sixth consecutive year for most MWhs sold through the programs. PacifiCorp has followed close
behind PGE in the rankings, and in early years of the programs (2004-06), its programs outranked PGE’s in
terms of total participants. Since 2009, PacifiCorp has consistently ranked second in the country in terms
of total program participants (NREL did not collect data in 2011) and second or third in total sales of MWh
of green power.
Figure 3.9: How Oregon’s Utility Green Power Programs Work13
Biennial Energy Report Chapter 3 — Page 16
Green Power Programs – Residential and Small Commercial Customers
Oregon’s largest electric IOUs – PGE and PacifiCorp –
have two of the most successful voluntary green power
programs in the country, as tracked and ranked annually
by the National Renewable Energy Laboratory.12 In
Oregon in 2016, over 200,000 voluntary green power
program participants were responsible for purchasing
more than two million MWhs of green power.13
Voluntary green power programs allow residential and
small commercial consumers in Oregon to opt in and
pay a premium on their electricity bills for the purchase
of renewable energy certificates, and to contribute
toward the above-market costs of various renewable
energy projects in Oregon and in the West.
Though COUs predominantly get their electricity from
BPA hydropower and are not required to provide green power programs, some choose to offer such
programs to their customers. For example, EWEB’s Greenpower program allows customers who purchase
green electricity to support local incentives for residential and commercial solar projects, and grants for
renewable energy projects at local nonprofit, government, or academic organizations.
Large Customer Options
Large commercial and industrial customers are also driving renewable energy development in Oregon and in
the Northwest. Corporate social responsibility and sustainability-related targets at companies have driven
the quickly-growing trend of corporate renewable energy procurement, as have reductions in the costs of
renewable energy and new, easier ways of purchasing off-site renewable energy.14 The result has been
contracting for over 10 GW of off-site renewable energy development for corporate customers nationwide
since 2015.15 A number of companies with operations in Oregon have signed onto pledges such as the RE100
Pledge, a global campaign to get some of the largest companies in the world to commit to using 100 percent
renewable energy, including Apple, Facebook, Google, Nike, and Salesforce.16 Separately, Intel has
committed to powering all of its U.S. operations with 100 percent renewable energy,17 and a number of other
Oregon-based companies, including Adidas, Columbia Sportswear, Keen, and PGE, have committed to
reducing GHG emissions, which will include greater use of renewable energy sources.18
In Oregon, these large customers have had two primary pathways for procuring voluntary renewable energy:
1. The state’s Direct Access program; and
2. Utility green power programs for large customers.
A third option, a green tariff, has been discussed in Oregon, and in 2018 PGE filed with OPUC for approval of
its proposed green tariff option for large customers.98
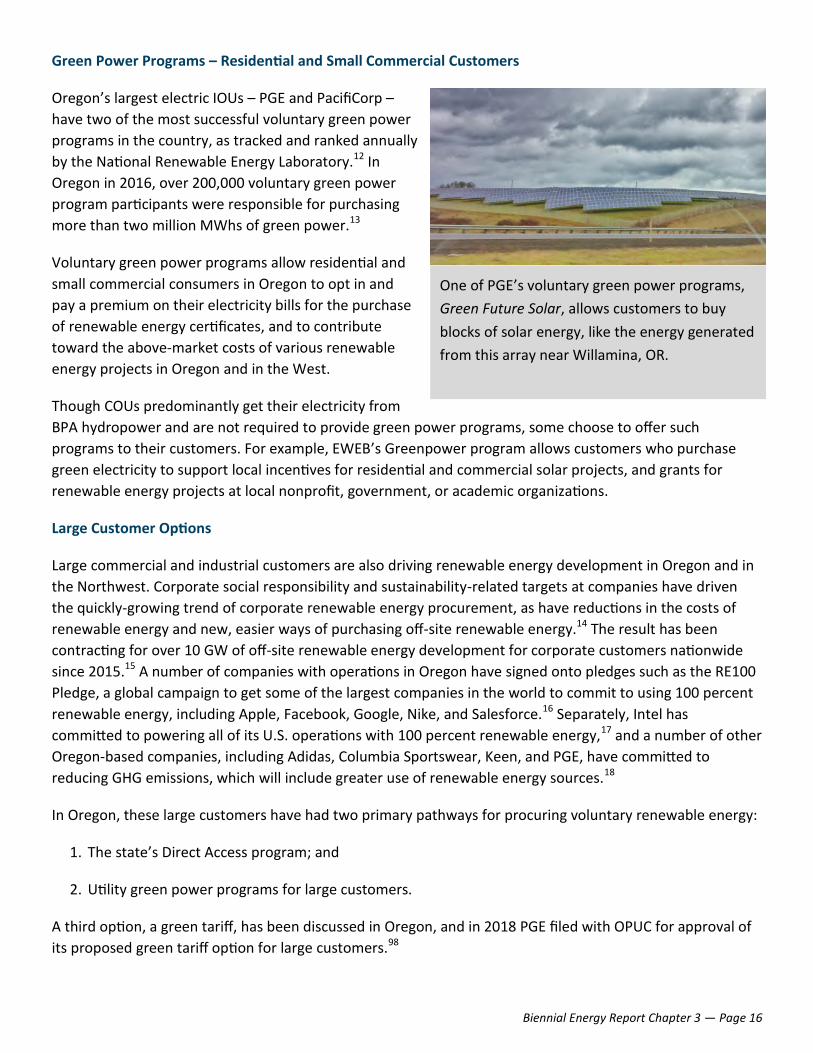
One of PGE’s voluntary green power programs,
Green Future Solar, allows customers to buy
blocks of solar energy, like the energy generated
from this array near Willamina, OR.

Biennial Energy Report Chapter 3 — Page 17
Through Direct Access, commercial and industrial entities that are customers of the state’s largest IOUs may
choose a retail provider of electricity other than their incumbent utility. This allows firms to seek out a new
electricity supplier that can address their needs related to price or generation source. Direct Access was
conceived as a way to allow for a more competitive electricity marketplace by allowing independent
providers of electricity, called Electricity Service Suppliers (ESSes), to compete directly with vertically-
integrated IOUs. ESSes have historically provided electricity from natural gas resources, but recently some
ESSes have added more renewable energy to their portfolio. Both PGE and PacifiCorp have experienced
recent growth in the percentage of their load attributable to the Direct Access program, with PGE at over 17
percent and PacifiCorp at almost five percent for 2017. While there is no indication that the majority of
Direct Access customers have historically chosen to procure renewable resources, there are a few
noteworthy new entrants to the program for whom sourcing renewable energy has been one of the main
motivations.
Apple Inc. is one company that has chosen to purchase electricity for its Prineville data centers through the
Direct Access program instead of from its incumbent utility, PacifiCorp. Apple has committed to powering its
CORPORATE RENEWABLE ENERGY PROCUREMENT
The number of data processing, hosting,
and related services, known here
collectively as data centers, grew nearly six
percent in the last year. Since 2013, the
segment as a whole grew just over eight
percent. These facilities house thousands
of computers in the form of servers and
are linked together via thousands of miles
of wiring.
The largest issue facing developers of data
centers? Cooling their facilities. For this
task, they require energy – and lots of it!
According to the Northwest Power and
Conservation Council, data centers could
become the region’s largest consumers of electricity since the aluminum industry of the 1980s.40 More
specifically, companies developing these facilities are in search of Oregon’s plethora of clean, low-carbon
and low-cost energy. Companies such as Facebook, Apple Inc., Google, Amazon, and others have
populated Central and Eastern Oregon with their facilities. With these facilities, many procure nearly 100
percent clean energy from separate energy projects or nearby utilities. Google recently opened a facility
in The Dalles without relying directly on fossil fuels, while Facebook will power its next Prineville facility
with 437 MW of solar power.40,41 The company already has three datacenters in Prineville with two more
on the way.41 Some companies cannot find enough renewable energy, such as Microsoft. After some
disagreement, the software giant reached a settlement with its electric utility, Puget Sound Energy, which
uses fossil fuels for nearly 60 percent of its generation, to create a new tariff for large industrial or
commercial customers if the customers opt-out of buying electricity from the utility.42
Figure 3.10: Growth of Data Center Industry in Oregon
(2013-2017)43

Biennial Energy Report Chapter 3 — Page 18
corporate facilities with renewable energy, and the company’s preference is to own the renewable energy
generation sources whenever feasible. Apple seeks to enter into long-term power purchase agreements for
renewable energy when ownership is not feasible.19 While Oregon customers do not currently have a
pathway long-term contracting of this sort, PGE is in the process of launching such a pathway with its green
tariff (see below).
To power its Prineville facilities, Apple entered into long-term agreements to purchase renewable electricity
from two Avangrid Renewables projects in Oregon: 200 MW from the Montague Wind Project in Gilliam
County and 56 MW from the Solar Star Oregon PV project in Prineville.19 The Montague wind project is
expected to ramp up construction in 2019 and the Solar Star project is operational.
The PUC is required to ensure that the provision of direct access service “not cause the unwarranted shifting
of costs”20 from direct access participants to the utility’s other customers. As a result, non-residential
customers accepting direct access service must pay transition charges (sometimes referred to as an “exit
fee”) for a period of time not to exceed 10 years. This charge is designed to compensate the utility for costs it
reasonably incurred in the past to serve that customer and that it must continue to reasonably incur to
maintain the capability to provide the customer with default electric service in the event that its direct access
arrangement fails for any reason.
Like residential customers who can take advantage of voluntary green power programs, large customers can
elect to pay more through green power programs, generally through the purchase of unbundled RECs. While
both PGE and PacifiCorp offer large commercial and industrial customers programs that are Green-e Energy
certified,* the way these programs are structured, customers typically cannot specify the projects from
which they will receive RECs. The utility picks the renewable projects and aggregates them into a single green
energy product.
PacifiCorp has offered its Schedule 272 to large non-residential customers as a way to purchase unbundled
RECs since 2004. Before 2016, under a Schedule 272 agreement, the customer pays the base rate for its
electricity consumption to PacifiCorp and then also pays the cost of unbundled RECs. However, the customer
would not necessarily know in advance the generation resource, location, or facility age associated with the
unbundled RECs. In 2016, PacifiCorp amended its existing Schedule 272 tariff to allow customers the ability to
purchase unbundled RECs from a specific facility or facilities, allowing customers greater control over how to
“green” their energy supply and addressing concerns over additionality.
In 2018, Facebook entered into an agreement under Schedule 272 to purchase unbundled RECs from
PacifiCorp. Under its agreement with PacifiCorp, Facebook will pay the base rate in addition to the cost of
unbundled RECs associated with specific new renewable projects. Because Facebook is purchasing RECs from
new projects, it can make a defensible claim that it is supporting new renewable energy development.
PacifiCorp will purchase the power and the RECs from generating facilities, which were identified as least-
cost, least-risk for customers and use the energy towards fulfilling its system capacity needs, then sell the
unbundled RECs to Facebook. The electricity purchases will not count toward PacifiCorp’s RPS requirements,
as Facebook will own the RECs and therefore the property right to the renewable attributes of the electricity.
*Green-e Energy is an independent consumer protection program providing certification and verification for renewable electricity
and renewable energy certificates (RECs) sold to households and organizations.

Biennial Energy Report Chapter 3 — Page 19
Utility green tariff programs differ from green power programs in that they allow commercial and industrial
customers to voluntarily purchase RECs bundled with the corresponding renewable energy from specified
projects within a utility’s service territory. In this way, large customers receive the financial benefits of
renewable energy and long-term contracting, as opposed to paying a premium for an unbundled REC as they
would in a voluntary green power program, or paying large exit fees to participate in the Direct Access
program. As of February 2018, 21 green tariffs in 15 states have been approved by their respective PUCs.21
A green tariff, commonly referred to as a voluntary renewable energy tariff, or VRET, is not currently an
option in Oregon. However, both PacifiCorp and PGE have worked with the OPUC to develop a program since
2014 and PGE has an open docket at the OPUC for a Green Tariff Program, where stakeholder discussions are
ongoing.
In 2014, the Oregon Legislature passed a law22 requiring the OPUC to investigate the potential for a VRET in
Oregon that would balance policy factors such as further development of renewable energy, effects on the
competitive retail market, and potential cost-shifting. After two years of evaluation and discussion amongst
stakeholders, a VRET was not adopted.23 In April 2018, PGE petitioned OPUC to reopen the process, citing
pledges the utility had made to continue action toward meeting the United States’ Paris Agreement
commitments and to support the climate and renewable energy goals of cities in its service territory,
including Portland, Milwaukie, Hillsboro, Salem, Gresham, and Beaverton.24
At the same time, PGE filed a VRET proposal whereby PGE would execute long-term PPAs of 10 or 20 years
with renewable energy generators, and then allow VRET customers to participate by paying, on top of their
cost of service, the energy and capacity costs associated with the power purchase agreement (PPA).*
Program participants would need to have an annual peak demand of at least 30 kW, though entities like
municipalities could aggregate smaller loads to meet the threshold, and commit to a contract length of 5, 10,
15, or 20 years. PGE’s proposal suggested that there would be no cost-shifting to non-participants, nor risk-
shifting.24 As mentioned above, OPUC has opened a new docket (UM 1953) to address PGE’s proposal to
offer a VRET and stakeholder discussions are ongoing.98
Financial Incentives for Renewable Energy Development
A number of state and federal incentive programs available over the years have supported renewable energy
development in Oregon. While these programs served to reduce the costs associated with development and
operation, it is not known to what extent development was driven by these incentives, especially since many
of them could be combined.
Oregon Incentives
Oregon’s Business Energy Tax Credit Program (BETC) began in 1979 and sunset on July 1, 2014. The program,
which grew and evolved over time, was used to help Oregon businesses, governments, nonprofits, and other
entities invest in energy conservation, renewable energy resources, rental weatherization, and cleaner
*“Customers receiving service under the VRET will pay the cost of service rate, plus the difference between the QF rate and the PPA cost. PGE shareholders will pay the VRET rate for the unsubscribed portion of the PPA. VRET customers may also pay a risk premi-um depending on the commitment length and PPA subscription rate.” Testimony from OPUC Staff. Staff/100 Response Testimony. OPUC Docket UM 1953 (July 18, 2018).
Biennial Energy Report Chapter 3 — Page 20
transportation fuels. In the 35 years of the program’s operation, ODOE certified 24,738 BETC projects that
helped save energy, displace conventional energy sources, or generate renewable energy. Of those, 1,724
renewable projects received over $653 million in tax credits. The program provided tax credits to qualifying
projects not to exceed 35 percent of the eligible project costs. In 2007, the Oregon Legislature (HB 3201)99
increased the incentive percentage for renewable projects from 35 percent to 50 percent through the sunset
of the program.
The Residential Energy Tax Credit Program (RETC) was also administered by ODOE until it sunset in 2017.
ODOE received the first RETC applications in 1978 and issued more than 630,000 tax credits totaling more
than $258 million to help residential consumers power their homes with renewable energy, charge
alternative fuel vehicles, and reduce the energy use of their homes through conservation measures and
energy efficient appliances. Eligible renewable energy devices under the RETC program included solar electric
(PV), geothermal energy, solar water heating, solar space heating, and wind. In 2017, the program’s final
year, ODOE issued 3,946 solar electric credits, 102 for geothermal devices, 128 for solar water heating, and
five for solar space heating. Over the lifetime of the program, more than 15,000 solar projects were
approved, with a production estimate of about 75 million kWh/year.
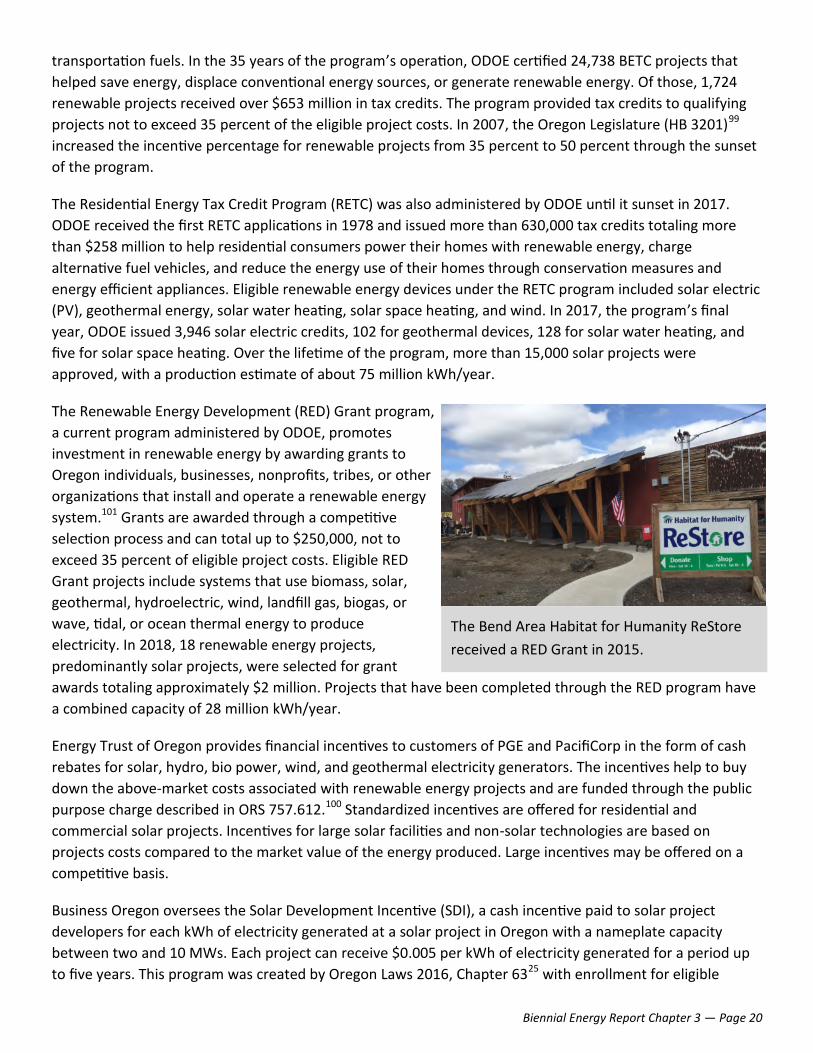
The Renewable Energy Development (RED) Grant program,
a current program administered by ODOE, promotes
investment in renewable energy by awarding grants to
Oregon individuals, businesses, nonprofits, tribes, or other
organizations that install and operate a renewable energy
system.101 Grants are awarded through a competitive
selection process and can total up to $250,000, not to
exceed 35 percent of eligible project costs. Eligible RED
Grant projects include systems that use biomass, solar,
geothermal, hydroelectric, wind, landfill gas, biogas, or
wave, tidal, or ocean thermal energy to produce
electricity. In 2018, 18 renewable energy projects,
predominantly solar projects, were selected for grant
awards totaling approximately $2 million. Projects that have been completed through the RED program have
a combined capacity of 28 million kWh/year.
Energy Trust of Oregon provides financial incentives to customers of PGE and PacifiCorp in the form of cash
rebates for solar, hydro, bio power, wind, and geothermal electricity generators. The incentives help to buy
down the above-market costs associated with renewable energy projects and are funded through the public
purpose charge described in ORS 757.612.100 Standardized incentives are offered for residential and
commercial solar projects. Incentives for large solar facilities and non-solar technologies are based on
projects costs compared to the market value of the energy produced. Large incentives may be offered on a
competitive basis.
Business Oregon oversees the Solar Development Incentive (SDI), a cash incentive paid to solar project
developers for each kWh of electricity generated at a solar project in Oregon with a nameplate capacity
between two and 10 MWs. Each project can receive $0.005 per kWh of electricity generated for a period up
to five years. This program was created by Oregon Laws 2016, Chapter 6325 with enrollment for eligible
The Bend Area Habitat for Humanity ReStore
received a RED Grant in 2015.
Biennial Energy Report Chapter 3 — Page 21
projects closing on January 2, 2017. Business Oregon selected 19 utility-scale solar projects to receive the SDI,
representing over 146.5 MWs of projects valued at upwards of $362 million and located primarily in central,
southern, and eastern Oregon.26
SOLAR DEVELOPMENT INCENTIVE PROGRAM
In 2016 the Oregon legislature passed HB 4037 creating a program to encourage the development of
utility-scale solar energy projects.25 The program, known as the Solar Development Incentive and
administered by Business Oregon, provides a cash incentive of a half a cent per kWh of electricity
generated for a period of five years. Business Oregon awarded the incentive to 19 projects totaling 146.5
MW and representing seven different facility owners in eight Oregon counties. To put this into
perspective 146.5MW is about twice as much capacity as the entire residential solar sector in Oregon and
nearly four times the solar capacity that was installed under the Oregon Business Energy Tax Credit
program.
The solar development incentive has provided valuable information regarding the economic impact and
geographical distribution of utility-scale solar projects in Oregon. Projects supported by the SDI program
are anticipated to bring at least $361 million in private investment to the state, as well as $115 million of
federal tax credits through the Solar Investment Tax Credit program. To date, these projects have resulted
in at least 1,514 construction jobs and more than 23 operations and maintenance jobs. More than 90
percent of the capacity in the program is located east of the Cascades, demonstrating the financial
benefits associated with the higher solar resources and lower valued land in central and eastern Oregon.
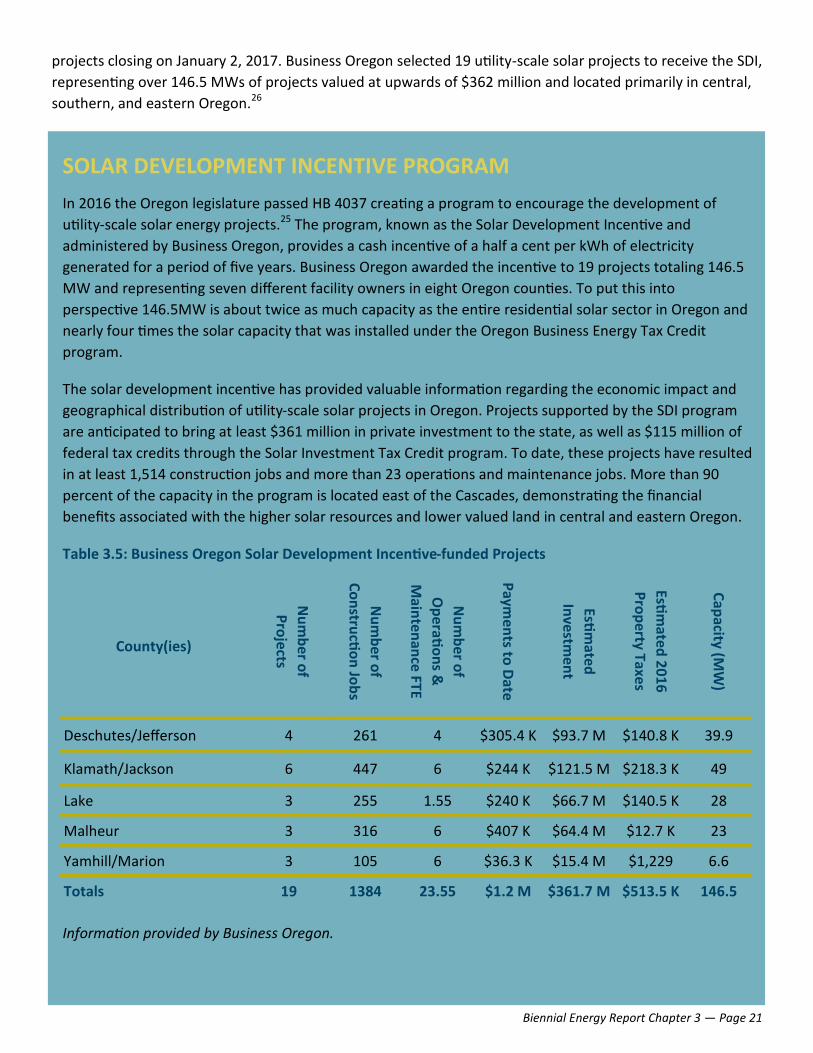
Table 3.5: Business Oregon Solar Development Incentive-funded Projects
Information provided by Business Oregon.
County(ies)
Nu
mb
er of
Pro
jects
Nu
mb
er o
f
Co
nstru
ctio
n Jo
bs
Nu
mb
er of
Op
eratio
ns &
Main
ten
ance
FTE
Paym
ents to
Date
Estim
ated
Investm
ent
Estim
ated
20
16
Pro
perty Taxe
s
Cap
acity (MW
)
Deschutes/Jefferson 4 261 4 $305.4 K $93.7 M $140.8 K 39.9
Klamath/Jackson 6 447 6 $244 K $121.5 M $218.3 K 49
Lake 3 255 1.55 $240 K $66.7 M $140.5 K 28
Malheur 3 316 6 $407 K $64.4 M $12.7 K 23
Yamhill/Marion 3 105 6 $36.3 K $15.4 M $1,229 6.6
Totals 19 1384 23.55 $1.2 M $361.7 M $513.5 K 146.5

Biennial Energy Report Chapter 3 — Page 22
The Strategic Investment Program in ORS 285C.600 – 635102 offered a 15-year property tax exemption on a
portion of certain large capital investments. The program was created in the 1990s to induce large, capital-
intensive facilities to locate in Oregon. More than 20 wind farms qualified for the program, resulting in
upwards of 2,117 MW of capacity and $4.27 billion in project investment by the end of the 2015.27
Federal Incentives
In addition to drops in the capital costs associated
with renewable electricity installations, numerous
federal incentives have also helped spur greater
renewable energy development. The two main federal
incentives have been the Investment Tax Credit and
the Renewable Energy Production Tax Credit. The ITC
provides a one-time tax credit based on the
investment costs to develop a new solar energy
project. It originally provided a tax credit of up to 30
percent of eligible project costs, but recent federal
legislation initiated a reduction of the ITC over time
for certain solar and geothermal technologies, and a phase-out for all other technologies. For residential and
commercial solar PV projects, the ITC stays at 30 percent for projects that have started construction by 2019,
and steps down to 26 percent for projects begun in 2020 and then to 22 percent for those begun in 2021.
The residential ITC sunsets after 2021 while the commercial ITC drops to 10 percent and continues at that
level.28
The PTC provides a tax credit for each kWh generated and sold in a year, though it too has been reduced and
sunset at the end of 2017 for all non-wind technologies, and sunsets for wind at the end of 2019. The PTC has
been a big driver for new wind power projects across the U.S., and the importance of it to project
development can be seen in the precipitous dip in new projects coming online every time there is uncertainty
about whether the tax credit will be renewed by Congress. This policy uncertainty, coupled with the long
ramp-up period needed to get a wind project moving forward, leads to a boom-and-bust cycle of wind power
development.
Falling Technology Costs
In the past eight years, the costs of renewable energy project development nationally have fallen
precipitously. Between 2010 and 2017, the costs associated with a utility-scale one-axis PV solar installation
in the U.S. dropped by 77 percent.29 About 71 percent of that drop in costs can be attributed to reductions in
the costs of hardware, with another 10 percent due to labor cost reductions and 19 percent due to lower soft
costs, such as legal fees and sales taxes (Figure 3.11).
Single-axis solar tracking systems have solar panels that can rotate on one access, which increases energy
output by 25 percent or more over fixed-tilt installations (where the panels are mounted at a fixed angle and
do not move to track the sun).30

Biennial Energy Report Chapter 3 — Page 23
Figure 3.11: NREL PV System Cost Benchmark Study (inflation adjusted) for 2010-201731
Between 2008 and 2017, the average levelized cost of wind energy dropped by 75 percent (See Figure 3.12).
A levelized cost of energy is an accepted way of comparing the costs of various technologies, and includes the
costs of building and operating a generation facility over its assumed financial life, expressed in a dollars per
megawatt hour (MWh) cost in discounted real dollars. While these costs fell, installed wind and solar PV
capacity in the U.S. surged, with wind representing over 40 percent of all new installed electricity capacity in
2015, and with the total installed capacity of utility-scale solar PV growing by 43 percent from 2014 to 2015.32
Costs are expected to continue to decline, especially as energy storage options become more technically
mature, which can reduce the intermittency of variable renewable energy resources. For example, in late
2017 Xcel Energy received what were then unprecedentedly low bids for renewable energy and storage
resources for Colorado: just over $18/MWh for wind ($0.018/kWh) and $21/MWh for wind plus battery
storage ($0.021/kWh).33 These prices are well below the unsubsidized levelized cost of energy range of $30
to $60/MWh for wind power as estimated by Lazard in 2017.34

Biennial Energy Report Chapter 3 — Page 24
Figure 3.12: Cost Reductions in Major Clean Energy Technologies35
While costs have dropped for renewable energy technologies, some traditional fossil fuel generating facilities
have not experienced the same reductions, like coal. These facilities’ costs are closely linked to the
commodity price of their input fuel (i.e. coal, natural gas, etc.) as well as the rising costs associated with
pollution mitigation. However, given the current low price for natural gas as an input fuel, the upcoming
reduction of federal incentives for renewable generation (the ITC and PTC), and other drivers related to the
integration of variable renewable energy, much of the aging electricity generation sources in the U.S. are
being replaced with natural gas generation and numerous studies predict that new natural gas plants will
replace a great deal of this aging electricity generation in the future as well.36,37 Whether aging and retiring
resources are replaced with natural gas resources or renewable resources will depend on factors such as the
commodity price for natural gas as a fuel and to what degree the costs of renewable generation and energy
storage continue to fall.
Biennial Energy Report Chapter 3 — Page 25
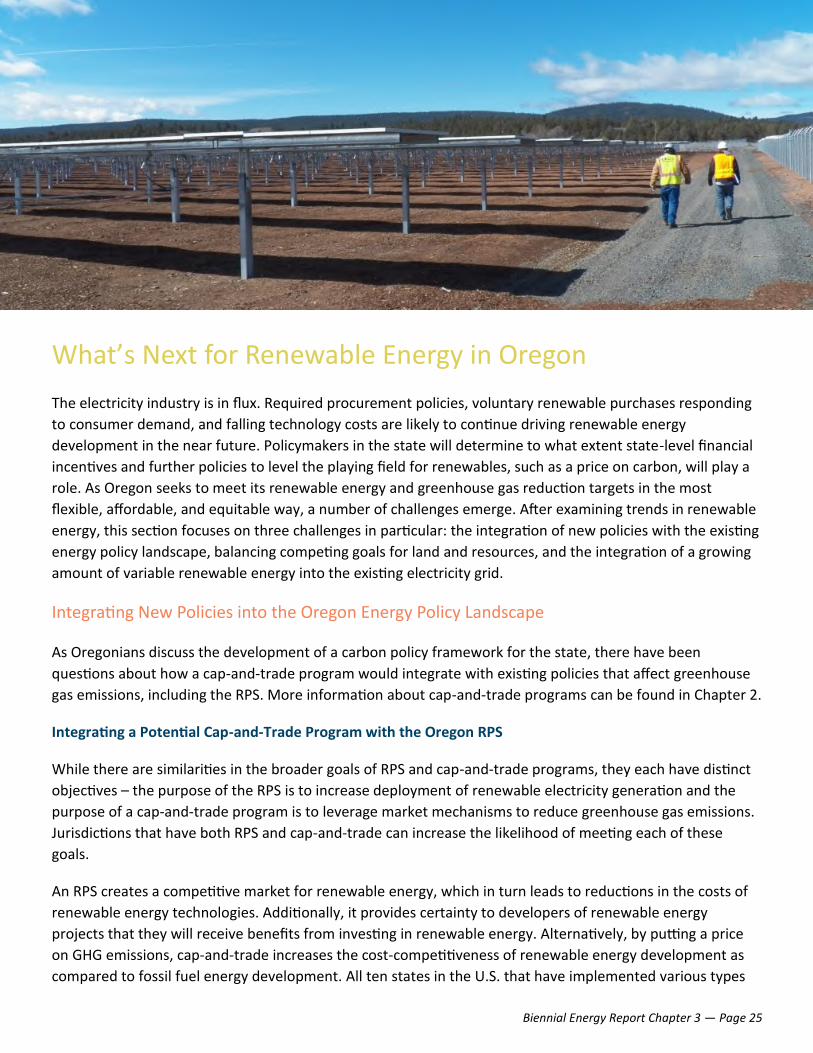
What’s Next for Renewable Energy in Oregon
The electricity industry is in flux. Required procurement policies, voluntary renewable purchases responding
to consumer demand, and falling technology costs are likely to continue driving renewable energy
development in the near future. Policymakers in the state will determine to what extent state-level financial
incentives and further policies to level the playing field for renewables, such as a price on carbon, will play a
role. As Oregon seeks to meet its renewable energy and greenhouse gas reduction targets in the most
flexible, affordable, and equitable way, a number of challenges emerge. After examining trends in renewable
energy, this section focuses on three challenges in particular: the integration of new policies with the existing
energy policy landscape, balancing competing goals for land and resources, and the integration of a growing
amount of variable renewable energy into the existing electricity grid.
Integrating New Policies into the Oregon Energy Policy Landscape
As Oregonians discuss the development of a carbon policy framework for the state, there have been
questions about how a cap-and-trade program would integrate with existing policies that affect greenhouse
gas emissions, including the RPS. More information about cap-and-trade programs can be found in Chapter 2.
Integrating a Potential Cap-and-Trade Program with the Oregon RPS
While there are similarities in the broader goals of RPS and cap-and-trade programs, they each have distinct
objectives – the purpose of the RPS is to increase deployment of renewable electricity generation and the
purpose of a cap-and-trade program is to leverage market mechanisms to reduce greenhouse gas emissions.
Jurisdictions that have both RPS and cap-and-trade can increase the likelihood of meeting each of these
goals.
An RPS creates a competitive market for renewable energy, which in turn leads to reductions in the costs of
renewable energy technologies. Additionally, it provides certainty to developers of renewable energy
projects that they will receive benefits from investing in renewable energy. Alternatively, by putting a price
on GHG emissions, cap-and-trade increases the cost-competitiveness of renewable energy development as
compared to fossil fuel energy development. All ten states in the U.S. that have implemented various types

Biennial Energy Report Chapter 3 — Page 26
of cap-and-trade programs have also kept existing RPS programs in place.
Table 3.6: Goals, Expected Outcomes, and Compliance Pathways for RPS Policies Compared to Cap-and-
Trade Policies
Separate Compliance Instruments
RECs, which Oregon uses to track RPS compliance, are used to track renewable energy and to determine
where it is ultimately consumed.
Allowances represent the authorization to emit a unit of GHGs measured in a common unit known as carbon
dioxide equivalent, or CO2e, and are the primary compliance instruments of a cap-and-trade program. Every
entity regulated under the cap-and-trade program would have to acquire and then surrender a set number of
allowances each compliance period as determined by the program to cover its emissions.
An offset represents a reduction in emissions equal to one metric ton of CO2e. Offsets are generated from
sectors of the economy not covered by a cap-and-trade program and can be used to meet a portion of a
regulated entity’s compliance with cap-and-trade.
Separate Programs
Integrating a cap-and-trade program with Oregon’s RPS would be relatively straightforward. The main area of
program overlap is how to account for renewable electricity imports from neighboring states. As discussions
on the design of potential cap-and trade legislation continue in Oregon, this will be an area needing further
clarification.
RPS Cap & Trade
Primary Goal
Increases the share of new
renewable electricity consumed in
a state. Oregon’s goal is 50 percent
by the year 2040.
Reduces a state’s annual GHG
emissions to reach a long-term target
level of emissions.
Primary Outcome
Leads to development of new
renewable energy projects and a
decrease in the carbon intensity of
the state’s resource mix, but not
for an exact quantity of emissions.
Produces a quantity of emissions
reductions but does not set sectoral
targets – encourages least-cost
reductions wherever they may be
found.
How to Comply Renewable energy certificates
(RECs).
Emissions reductions, allowances,
offsets.

Biennial Energy Report Chapter 3 — Page 27
Integrating a Potential Cap-and-Trade Program with Oregon’s Voluntary Renewable Energy Programs
Though not a part of the RPS, the voluntary renewable energy market would likewise be affected by cap-and-
trade legislation. To qualify for the voluntary market, renewable energy must be what is called “surplus to
regulation,” which means it was not generated to comply with any regulatory requirement, such as an RPS.
There are a handful of standards for voluntary RECs, one of the most stringent being Green-e, and many of
the REC tracking programs used for RPS compliance RECs are also used to track voluntary market RECs. Both
PGE and PacifiCorp’s voluntary green power programs are certified by Green-e, as was recommended by the
Portfolio Options Committee for purposes of quality control and consumer protection.38
Other jurisdictions with cap-and-trade programs have protected the voluntary market by setting aside
allowances and retiring them according to how much voluntary renewable energy is produced in a given
period. Such a set-aside effectively removes this renewable energy from being considered by the cap and it
can again be considered “surplus to regulation.” California and eight of the nine states (excluding Delaware)
currently in the Regional Greenhouse Gas Initiative (a cap-and-trade-program across nine states in the
Northeast and Mid-Atlantic) have included set-asides for voluntary renewable energy in their programs.39
Balancing State Land Use and Natural Resource Demands
Renewable energy development is one of many potential uses for Oregon’s landscape and natural resources.
The state has a number of energy, environmental, land use, and economic development policies, statutes,
and goals, which interact in complex ways and are sometimes in conflict. As renewable energy development
increases, these conflicts can be exacerbated and tradeoffs may be necessary. Two examples of the need for
balancing competing demands highlighted in this chapter are the intersection of renewable energy project
development and other uses of the land and the operation of the Federal Columbia River Power System
(FCRPS). Siting of solar facilities and the interactions with Oregon’s land use laws are covered further in the
case study on solar, below.
Renewable Energy Project Development and Land Use
Oregon’s goals and values are reflected in numerous ways within statute. When it comes to energy facility
siting, Oregon’s energy goals must be considered alongside a broad set of 19 statewide land use goals, which
cover a host of issues, from air and water quality to protection of natural resources and open spaces. The
land use goals include specific mandates related to citizen involvement, economic development,
transportation, recreation, and energy conservation.
These goals are designed to help implement the mission of the statewide land use planning program, which
is to conserve farm land, forest land, coastal resources, and other important natural resources; encourage
efficient development; coordinate the planning activities of local governments and state and federal
agencies; enhance the state's economy; and reduce the public costs that result from poorly planned
development.44 All city and county land use and development ordinances and comprehensive plan provisions
that are used to evaluate local jurisdictional energy projects must align with these state level land use goals.

Biennial Energy Report Chapter 3 — Page 28
Smaller scale renewable energy projects are
approved at the county level. Oregon’s Energy
Facility Siting Council (EFSC) is responsible for
overseeing the siting of most large-scale
energy facilities and infrastructure in Oregon.45
State-level oversight of energy facilities helps
ensure a comprehensive, coordinated review
that results in projects that are sited,
constructed, and operated consistent with the
protection of public health and safety, and that
are in compliance with energy policy and
environmental protection policies of the
state.46 (More information on EFSC can be
found on ODOE’s website.47)
State jurisdictional energy facilities must meet 14 general standards in order to receive approval for
construction, which includes Oregon’s land use goals. There are specific standards for non-generating
facilities and for wind. The general standards also cover a range of issues, such as fish and wildlife habitat,
historic and cultural resources, recreation, and scenic resources.
Energy facilities use land in different ways, depending primarily on the type of energy generation resource.
Fossil-fueled electricity generating facilities often have smaller land-use footprints than some renewable
energy generating facilities, but only if the calculations do not take into account the footprint needed for
resource extraction, processing, and transportation.48 For example, the Hermiston Generating Project, a
natural gas-fueled electric generating facility with a generating capacity of 474 MW, takes up approximately
10 acres. In contrast, a solar facility typically uses land at a rate of 6 to 10 acres per megawatt of capacity; the
recently approved Boardman Solar Energy Facility has a generating capacity of 75 MW and has a site
boundary of 798 acres. Additional land may be needed for transmission or preserving cultural or
environmental aspects of the site. Wind facilities may have a large project boundary, though much of the
land may still be used for farming or grazing, enabling multiple land uses to continue and thereby reducing
conflict.
Both Oregon’s land use laws and the siting process, established in the early 1970s, ensure that important
natural, historic, or cultural resources are not negatively affected, and that impacts are minimized if they
cannot be avoided. However, at times these programs come into conflict with the state’s efforts to increase
renewable energy development. For example, it can take significant time and resources for project
developers to demonstrate that their projects are consistent with the state’s goals and standards, and this
can have a dampening effect on development. In designing and implementing land use and energy policy,
state policymakers and regulators must balance competing demands of environmental protection and energy
development.

Biennial Energy Report Chapter 3 — Page 29
RENEWABLE ENERGY: COMMUNITY EFFECTS
The Economy
Like many places in Oregon, Sherman County is largely
defined by its geography and weather. For decades, the
county in north-central Oregon had its economic wagon
tied to dryland wheat and barley, and cattle. When the
rains came at the right time, times were good. But the rains
didn’t always come.
Much more dependable than rain on the Columbia Plateau
is the wind, which regularly blows between the Cascade
Mountains to the west and the rolling desert to the east.
The wind industry noticed this about 20 years ago and
came knocking on doors in Sherman, Gilliam, and Morrow
counties. At the time, Sherman County was second-to-last
in Oregon’s per capita personal income. Since that time, a
host of large and small wind farms have cropped up in
Sherman; the big ones sited through the state (Biglow
Canyon and Klondike III) and the smaller ones going
through the county (Biglow I & II, Pa’Tu, Hay Canyon and
Star Point).
Gary Thompson, Sherman County Judge for the past 18
years, saw it all coming and was convinced the nascent industry would help diversify the agriculture-
dominated region. It did, and Thompson looks back with great pride at what the industry and County put
together for the residents. “Since wind energy projects came to Sherman County, the County has received
more than $25 million in property taxes, over $14 million in community service fees, and in excess of $57
million in Strategic Investment Program fees,” he said.49
The taxes and fees have allowed the County to fund two dozen buildings or projects, including a new
school and library, a Residential Incentive Program, two scholarships, fiber for 911 emergency services, a
new weed district building, a courthouse addition and renovation, and the Rufus Industrial Park. The
Residential Incentive Program awards $590 each year to the head of a household that has proven a year’s
residency. Since the program began in 2009, it has distributed $3.66 million.49
Biennial Energy Report Chapter 3 — Page 30
RENEWABLE ENERGY: COMMUNITY EFFECTS
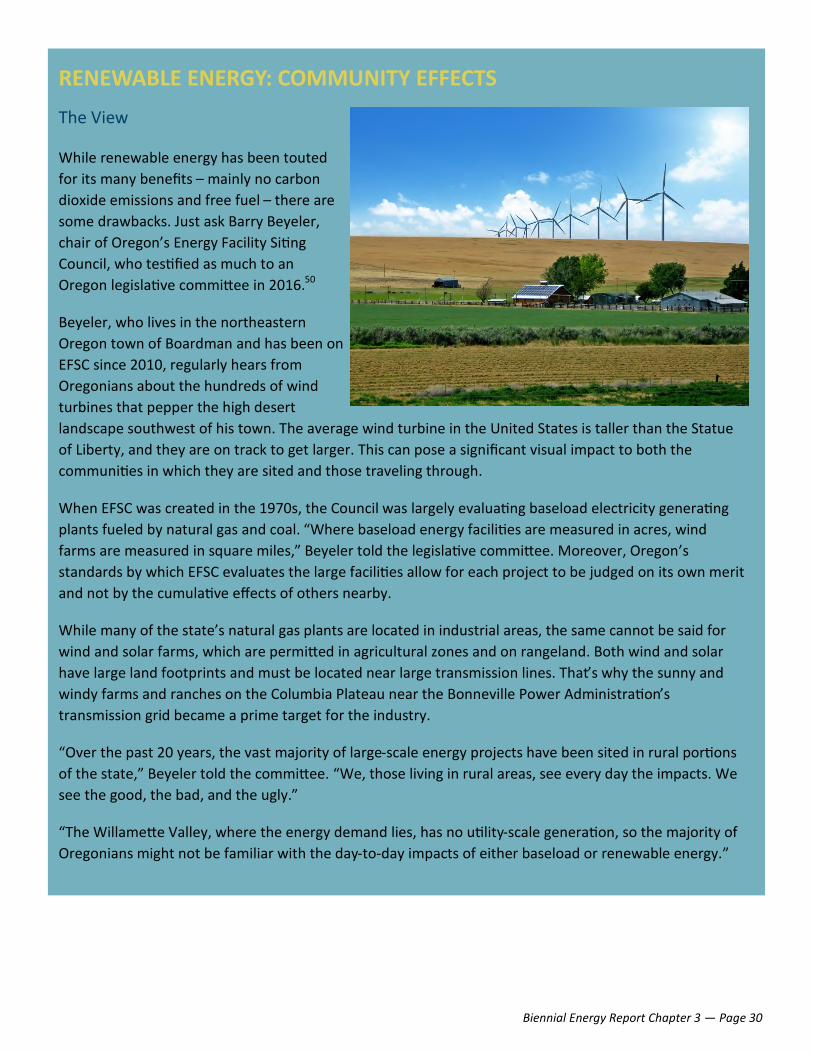
The View
While renewable energy has been touted
for its many benefits – mainly no carbon
dioxide emissions and free fuel – there are
some drawbacks. Just ask Barry Beyeler,
chair of Oregon’s Energy Facility Siting
Council, who testified as much to an
Oregon legislative committee in 2016.50
Beyeler, who lives in the northeastern
Oregon town of Boardman and has been on
EFSC since 2010, regularly hears from
Oregonians about the hundreds of wind
turbines that pepper the high desert
landscape southwest of his town. The average wind turbine in the United States is taller than the Statue
of Liberty, and they are on track to get larger. This can pose a significant visual impact to both the
communities in which they are sited and those traveling through.
When EFSC was created in the 1970s, the Council was largely evaluating baseload electricity generating
plants fueled by natural gas and coal. “Where baseload energy facilities are measured in acres, wind
farms are measured in square miles,” Beyeler told the legislative committee. Moreover, Oregon’s
standards by which EFSC evaluates the large facilities allow for each project to be judged on its own merit
and not by the cumulative effects of others nearby.
While many of the state’s natural gas plants are located in industrial areas, the same cannot be said for
wind and solar farms, which are permitted in agricultural zones and on rangeland. Both wind and solar
have large land footprints and must be located near large transmission lines. That’s why the sunny and
windy farms and ranches on the Columbia Plateau near the Bonneville Power Administration’s
transmission grid became a prime target for the industry.
“Over the past 20 years, the vast majority of large-scale energy projects have been sited in rural portions
of the state,” Beyeler told the committee. “We, those living in rural areas, see every day the impacts. We
see the good, the bad, and the ugly.”
“The Willamette Valley, where the energy demand lies, has no utility-scale generation, so the majority of
Oregonians might not be familiar with the day-to-day impacts of either baseload or renewable energy.”
Biennial Energy Report Chapter 3 — Page 31
Balancing Interests: the Many Uses of the Columbia River Basin
As noted in Chapter 1, hydroelectric power is the single largest source of electricity in Oregon, with the
majority of that power coming from the Federal Columbia River Power System (FCRPS).
The Columbia River existed long before construction of the first hydroelectric project, and the operation of
the FCRPS is still evolving today to accommodate its many uses. Important among historic uses are those of
the 13 Native American tribes whose ancestral homelands are located within the Columbia River Basin –
many of these uses continue to be protected today under tribal treaty rights. The Federal Action Agencies
(BPA, the Army Corps of Engineers, and the Bureau of Reclamation) have a trust responsibility established in
law that provides the foundation of their government-to-government relationship with these federally
recognized tribes.
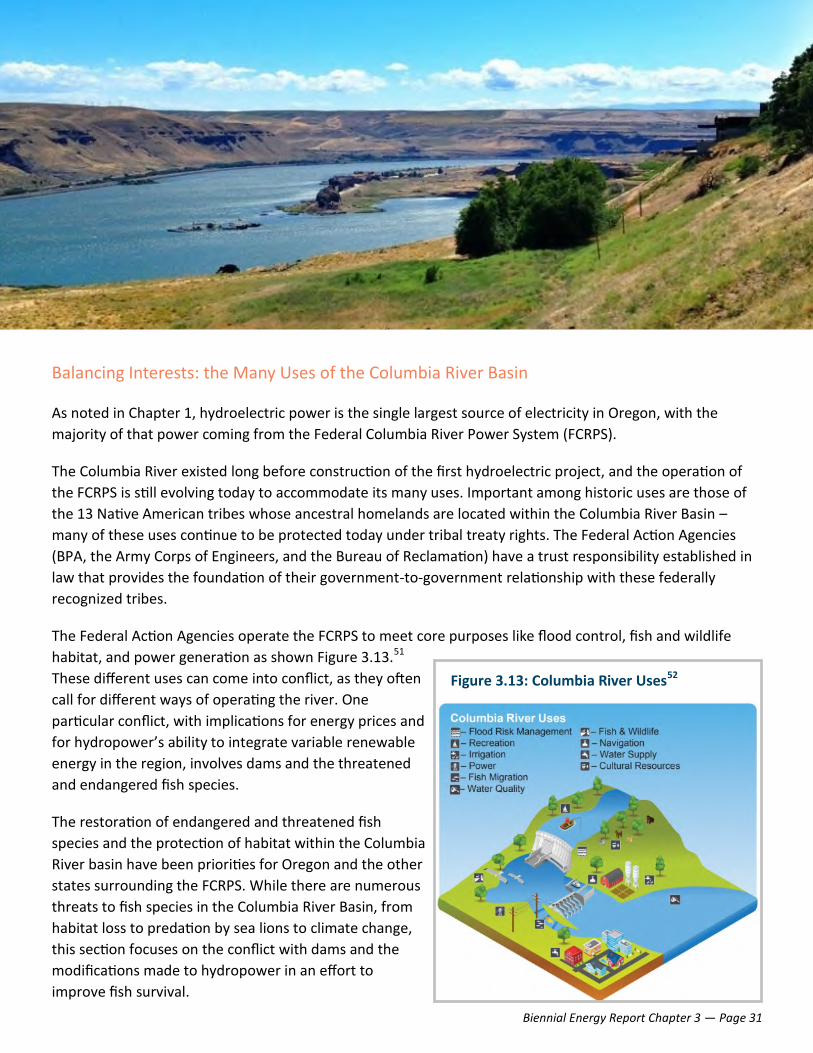
The Federal Action Agencies operate the FCRPS to meet core purposes like flood control, fish and wildlife
habitat, and power generation as shown Figure 3.13.51
These different uses can come into conflict, as they often
call for different ways of operating the river. One
particular conflict, with implications for energy prices and
for hydropower’s ability to integrate variable renewable
energy in the region, involves dams and the threatened
and endangered fish species.
The restoration of endangered and threatened fish
species and the protection of habitat within the Columbia
River basin have been priorities for Oregon and the other
states surrounding the FCRPS. While there are numerous
threats to fish species in the Columbia River Basin, from
habitat loss to predation by sea lions to climate change,
this section focuses on the conflict with dams and the
modifications made to hydropower in an effort to
improve fish survival.
Figure 3.13: Columbia River Uses52
Biennial Energy Report Chapter 3 — Page 32
A LITTLE MORE ABOUT FISH...
The interactions of native fish species and the FCRPS are
complex. The following provides a brief overview of
some key terms and concepts:53,54
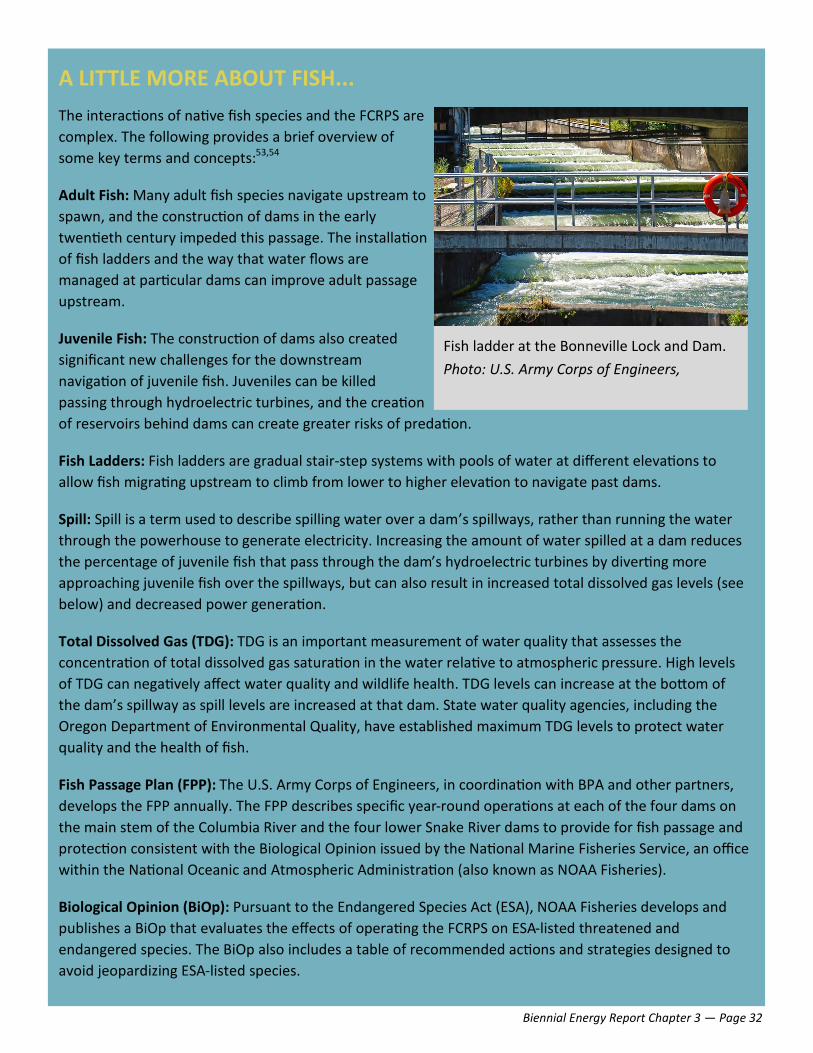
Adult Fish: Many adult fish species navigate upstream to
spawn, and the construction of dams in the early
twentieth century impeded this passage. The installation
of fish ladders and the way that water flows are
managed at particular dams can improve adult passage
upstream.
Juvenile Fish: The construction of dams also created
significant new challenges for the downstream
navigation of juvenile fish. Juveniles can be killed
passing through hydroelectric turbines, and the creation
of reservoirs behind dams can create greater risks of predation.
Fish Ladders: Fish ladders are gradual stair-step systems with pools of water at different elevations to
allow fish migrating upstream to climb from lower to higher elevation to navigate past dams.
Spill: Spill is a term used to describe spilling water over a dam’s spillways, rather than running the water
through the powerhouse to generate electricity. Increasing the amount of water spilled at a dam reduces
the percentage of juvenile fish that pass through the dam’s hydroelectric turbines by diverting more
approaching juvenile fish over the spillways, but can also result in increased total dissolved gas levels (see
below) and decreased power generation.
Total Dissolved Gas (TDG): TDG is an important measurement of water quality that assesses the
concentration of total dissolved gas saturation in the water relative to atmospheric pressure. High levels
of TDG can negatively affect water quality and wildlife health. TDG levels can increase at the bottom of
the dam’s spillway as spill levels are increased at that dam. State water quality agencies, including the
Oregon Department of Environmental Quality, have established maximum TDG levels to protect water
quality and the health of fish.
Fish Passage Plan (FPP): The U.S. Army Corps of Engineers, in coordination with BPA and other partners,
develops the FPP annually. The FPP describes specific year-round operations at each of the four dams on
the main stem of the Columbia River and the four lower Snake River dams to provide for fish passage and
protection consistent with the Biological Opinion issued by the National Marine Fisheries Service, an office
within the National Oceanic and Atmospheric Administration (also known as NOAA Fisheries).
Biological Opinion (BiOp): Pursuant to the Endangered Species Act (ESA), NOAA Fisheries develops and
publishes a BiOp that evaluates the effects of operating the FCRPS on ESA-listed threatened and
endangered species. The BiOp also includes a table of recommended actions and strategies designed to
avoid jeopardizing ESA-listed species.
Fish ladder at the Bonneville Lock and Dam.
Photo: U.S. Army Corps of Engineers,

Biennial Energy Report Chapter 3 — Page 33
In 1995, NOAA Fisheries released a biological opinion (1995 BiOp) describing new operations for the FCRPS
designed to improve fish passage. Over the next two decades, NOAA Fisheries developed several
supplements to the BiOp, along with entirely new BiOps in 2000 and 2008. Through these BiOps, actions
were taken to help support fish, including: habitat restoration; establishing additional hatcheries;
and articulating research, monitoring, and evaluation objectives. These BiOps also included new juvenile fish
passage objectives resulting in increased spill in spring and summer months to help juvenile salmon migrate
safely back to the ocean. More recently, new, safer fishways that align with the migratory paths of Columbia
River salmon have been constructed:55
• Spillway weirs that allow fish to pass smoothly over a dam in the surface water;
• A corner collector at the Bonneville Dam;
• A spillwall guide at The Dalles Dam that guides fish to the deepest, safest part of the river; and
• Fish screens and bypass systems to divert fish away from the hydroelectric turbines.
Despite these improvements, 13 fish species within the Columbia River Basin are listed as either threatened
or endangered under the Endangered Species Act.56 The State of Oregon, along with a number of
conservation organizations and the Nez Perce Tribe, have been engaged in litigation with the Federal Action
Agencies since 2001 over their management of the FCRPS and specifically over whether that management
has been sufficient to avoid jeopardizing the survival of the fish species listed pursuant to the ESA.56 The
Courts have ruled in the plaintiffs’ favor, finding that NOAA Fisheries violated the ESA when it concluded that
the operation of the FCRPS, described in the 2014 supplement to the 2008 BiOp, would not jeopardize the
fish species listed as threatened or endangered.
One mitigation effort called for by the plaintiffs has been to increase the level of water “spilled” over the
dams to increase the safe passage of juvenile fish species over the dams. In April 2017, the District Court
granted the plaintiffs’ request for more spill and ordered it to begin in the 2018 “spill season” – the time of
year that fish biologists have identified as being when the greatest number of fish migrate back to the ocean
through the FCRPS. To comply with the court order, the federal defendants were required to spill water up to
the maximum TDG levels (“gas caps”) allowable by state law at the dams on the main stem of the Columbia
River and the lower Snake River.
Looking to the Future: The Role of the FCRPS and a Low-Carbon Regional Grid
As the state and the region take more aggressive action to address climate change, the ability of the Federal
Action Agencies to flexibly operate the FCRPS’ 22,458 MW of carbon-free hydroelectric power will become
increasingly valuable.
Regionally, as more variable-output renewable sources of energy come online, more flexibility will be needed
in the electric sector—both in terms of demand for electricity that can shift to better align with the
availability of renewable output, and in terms of other sources of electricity supply that can be re-dispatched
to complement the variable output of renewables like solar and wind. While many fossil fuel power plants
have the ability to operate flexibly to complement and integrate renewables, hydroelectric power plants are
able to do the same without emitting greenhouse gasses.

Biennial Energy Report Chapter 3 — Page 34
Through the summer and into the fall of 2018, interested parties in the region have been exploring
opportunities to increase the flexibility that BPA has to dispatch the FCRPS, while also doing more to restore
threatened and endangered fish populations. Historically, BPA has relied upon selling a significant amount of
its surplus power to utilities across the West. The revenue from these so-called “secondary sales” has been
utilized by BPA to help maintain lower long-term power rates for their customers in Oregon and across the
Northwest. To the extent that a new paradigm can be developed that allows BPA to better monetize its
flexible, carbon-free surplus power, the more it will be able to continue to maintain low long-term power
rates for its customers in Oregon.
Integration Challenges: Adding More Variable Renewable Resources to the Grid
As Oregon and other states consider various GHG emissions
reduction programs and RPS targets, and as renewable energy
technologies become increasingly cost-competitive with
traditional resources, the conversation has turned to how to
integrate increasingly higher percentages of variable renewable
energy onto the grid at least cost and in a way that provides the
most value.
Historically, utilities have designed and built the electric system to
accommodate variability in customer demand by building
transmission and distribution systems capable of carrying enough
electricity from generators to customers to meet the highest level
of demand expected, even if that level of demand only occurs a
few hours of the year. This also required building out
complementary resources, such as natural gas peaking facilities,
that could deliver enough supply to meet variability in customer demand throughout the day and during
different times of the year.
While the deployment of renewables presents new challenges, they are not dissimilar from the types of
challenges faced by the industry in the past. The word often used when discussing solutions for integrating
renewables is flexibility. Unlike conventional generators that utilities could dispatch to match variability in
customer demand, the output of renewable generators is variable, requiring other electric generators to
operate with more flexibility to complement the variability of renewables. Technology advancements are
also making it increasingly possible to harness the variability of customer demand and better align that
demand with the availability of renewable output. Meanwhile, energy storage technologies can provide
flexibility of either supply or demand, as required, to complement the availability of renewable output.
Finally, participation in larger electricity markets (such as the Western Energy Imbalance Market (EIM))
provides flexibility to utilities by giving them access to more liquid markets to buy and sell electricity to
complement the variable output of renewables. Ultimately, the cost-effectiveness of any one of these
solutions will need to be evaluated against the others to determine the least-cost pathways to integrating
renewables. And with each potential solution, new policy mechanisms may be required to ensure that the
value of the integration benefits are being appropriately compensated with the right price signals.
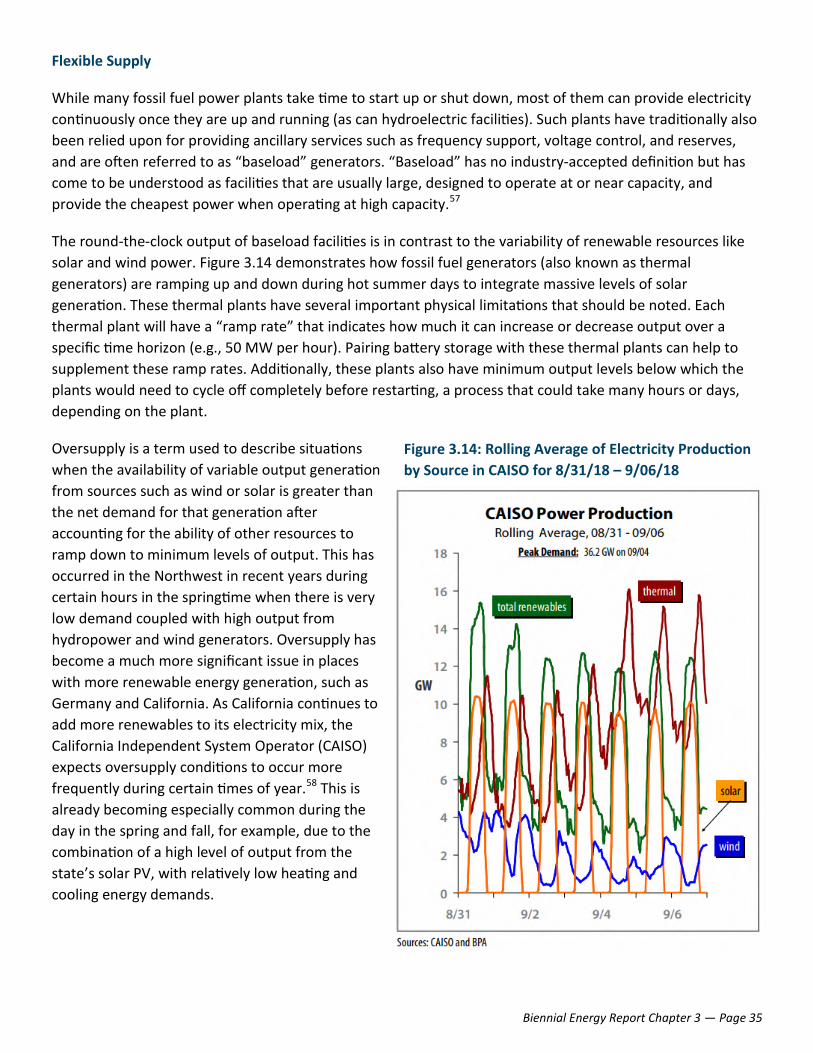
Biennial Energy Report Chapter 3 — Page 35
Flexible Supply
While many fossil fuel power plants take time to start up or shut down, most of them can provide electricity
continuously once they are up and running (as can hydroelectric facilities). Such plants have traditionally also
been relied upon for providing ancillary services such as frequency support, voltage control, and reserves,
and are often referred to as “baseload” generators. “Baseload” has no industry-accepted definition but has
come to be understood as facilities that are usually large, designed to operate at or near capacity, and
provide the cheapest power when operating at high capacity.57
The round-the-clock output of baseload facilities is in contrast to the variability of renewable resources like
solar and wind power. Figure 3.14 demonstrates how fossil fuel generators (also known as thermal
generators) are ramping up and down during hot summer days to integrate massive levels of solar
generation. These thermal plants have several important physical limitations that should be noted. Each
thermal plant will have a “ramp rate” that indicates how much it can increase or decrease output over a
specific time horizon (e.g., 50 MW per hour). Pairing battery storage with these thermal plants can help to
supplement these ramp rates. Additionally, these plants also have minimum output levels below which the
plants would need to cycle off completely before restarting, a process that could take many hours or days,
depending on the plant.
Oversupply is a term used to describe situations
when the availability of variable output generation
from sources such as wind or solar is greater than
the net demand for that generation after
accounting for the ability of other resources to
ramp down to minimum levels of output. This has
occurred in the Northwest in recent years during
certain hours in the springtime when there is very
low demand coupled with high output from
hydropower and wind generators. Oversupply has
become a much more significant issue in places
with more renewable energy generation, such as
Germany and California. As California continues to
add more renewables to its electricity mix, the
California Independent System Operator (CAISO)
expects oversupply conditions to occur more
frequently during certain times of year.58 This is
already becoming especially common during the
day in the spring and fall, for example, due to the
combination of a high level of output from the
state’s solar PV, with relatively low heating and
cooling energy demands.
Figure 3.14: Rolling Average of Electricity Production
by Source in CAISO for 8/31/18 – 9/06/18
Biennial Energy Report Chapter 3 — Page 36
The most commonly used strategy to address renewable oversupply has been curtailment, or temporarily
reducing the output of electricity from a generator from what it could have otherwise produced. While
California has curtailed significant amounts of solar generation, most often during the spring and fall, Oregon
does not yet have the same problem with solar. Most of the curtailment in Oregon occurs due to high wind
output during the spring in the overnight hours between midnight and 4 a.m. – the spring runoff leads to
more water in the hydropower system, winds are also strongest during overnight hours, and consumer
consumption is at its lowest at those times.59
There are alternatives to curtailment when addressing renewable oversupply. One alternative is to re-
dispatch other types of generation resources to complement the variability in output of renewables. For
example, having a dispatchable generator that can quickly ramp down output as renewables come online can
help to mitigate the need to curtail renewable oversupply. On the flipside, there will also be a commensurate
need to have that same generator (or another) able to just as quickly ramp up output as the renewables stop
generating. This type of quick-ramping capability has typically been provided by natural gas plants or
hydropower in the past. Increasingly, new technologies like battery storage, pumped hydro storage, or more
flexible renewables like geothermal, bioenergy, and wave energy can help provide this type of ramping
capability.
At this point, the development of more flexible renewable resources involves significant costs and
uncertainties to overcome technical, financial, legal, and regulatory barriers. Non-variable renewable
resources (e.g. geothermal power) and less variable/more predictable renewable resources (e.g. off-shore
wind and wave power) have fewer integration challenges than variable renewable resources but face
significant technical and financial hurdles to achieve commercial development. Additionally, established
variable renewable technologies (e.g. wind and solar) may be combined with emerging storage technologies,
demand response programs, and related demand-side management strategies to be able to more closely
resemble conventional, dispatchable resources.
Flexible Demand
Electricity demand has always been highly variable – the demand for electricity on a utility’s system can be
twice as large during the peak hour of demand in a day as it is during the lowest hour of demand on the very
same day. Similarly, the peak demand over an entire year can be several times greater than the lowest point
of demand in the same year. As noted above, the electric system has been designed, by and large, to meet
these types of large swings in demand for electricity over different hours of the day and times of the
year.
One method in the electric industry for minimizing the peaks is demand response. The Demand Response
Advisory Committee at the Northwest Power Council* defines demand response as “a non-persistent
intentional change in net electricity usage by end-use customers from normal consumptive patterns in
response to a request on behalf of, or by, a power and/or distribution/transmission system operator. This
change is driven by an agreement, potentially financial, or tariff between two or more participating
parties.”60 Ideally, demand response programs allow retail customers to know when system costs are high,
*The NWPCC formed the Demand Response Advisory Committee in 2016 to develop and implement the NWPCC’s recommenda-
tion in its 7th Power Plan to develop 600 MW of demand response in the region by the early 2020s.

Biennial Energy Report Chapter 3 — Page 37
typically due to high demand, and then shift their demand to lower-cost
times when demand is lower. Utility time-of-use (TOU) rates are one
example of a demand response mechanism that accomplishes this by
charging higher or lower rates at different times of the day or year
based on system conditions. Alternatively, customers may opt in to
allow a utility (or a third-party aggregator) to have direct control over
their demand for electricity from some processes or appliances,
especially those related to heating and cooling, based on market signals
or grid conditions. Demand response resources can be gathered at the
moment of need or scheduled ahead of time. By reducing the
magnitude of peak demands on the system, demand response assets
can postpone, reduce, or even eliminate the need for costly upgrades or even for new generating resources
to provide additional peak capacity. Flexible demand allows for the easier and more cost effective integration
of variable renewable resources – demand can be dynamically increased or decreased in alignment with the
availability of renewables. Increasingly, new technologies are creating opportunities for customers to
automate these types of demand response activities, including the use of so-called “smart” thermostats or
water heaters that can be optimized based on signals from the grid.
Many parts of the country already have significant amounts of demand response capacity deployed. For
example, the PJM Interconnection in the mid-Atlantic region of the U.S.—the largest regional transmission
organization in the country with peak summer loads near 150,000 MW—has more than 9,000 MW of
demand response deployed throughout its territory.61 In Oregon, the capacity provided by the region’s
hydroelectric system has historically dampened the need for demand response. A variety of factors working
in combination are beginning to change this, including continued (albeit slowed) regional load growth,
retirement of fossil fuel resources, increasing penetration of variable renewables, additional constraints on
the hydro system, and a growing summer peak load during a time of the year when output from the hydro
system is lower. As a result, utilities in Oregon and across the region have been actively evaluating and
deploying a variety of demand response pilot projects.
Many utilities across the region (including PGE, PacifiCorp, and BPA, among others) were participants in the
Pacific Northwest Smart Grid Demonstration Project, a five-year, $178 million project co-funded by the U.S.
Department of Energy through the American Recovery and Reinvestment Act of 2009.62 The project
concluded in 2015 and resulted in the deployment of dozens of innovative grid modernization and smart
grid pilot projects, many of which incorporated demand response and load control functions. More recently,
PGE has been actively developing a proposal, in response to guidance given in OPUC Order 17-386,90 to
develop a demand response test bed. The Smart Grid Test Bed, as envisioned, would result in PGE deploying
demand response assets at scale, downstream of three different substations across its service territory. The
goals of the project for PGE include: identify compelling and sustainable value propositions that demand
response can provide to customers; determine the maximum amount of demand response capacity
achievable; develop a plan to replicate demand response deployments beyond the test bed; and improve
internal understanding of operational control of demand response assets to meet utility needs.

Biennial Energy Report Chapter 3 — Page 38
In Between Supply and Demand: Energy Storage and DERs
Depending on the circumstances, energy storage and other distributed energy resources (DERs) may exhibit
the characteristics of either supply or demand. Learn more about DERs in Chapter 5.
Energy Storage. The electric grid must be kept in balance at all times with respect to supply and demand;
failure to maintain this balance can destabilize the grid and lead to brownouts, blackouts, and even safety
threats. Unlike other forms of energy, such as liquid fuels, natural gas, or coal, it can be difficult and costly to
store electricity in large quantities. That said, storage technologies are becoming more cost effective, and will
likely prove critical to integrating higher levels of variable renewable energy and addressing peak loads.63
The most common residential and commercial energy storage systems use batteries. Utility-scale facilities
may use batteries or other storage technologies, such as pumped hydro storage systems, mechanical systems
such as flywheels or compressed air, or thermal storage systems that store heated materials for winter
heating or ice for summer cooling. Storage systems may be designed to charge and discharge over a short-
term daily basis, or over the long-term to balance seasonal energy cycles or for use during emergencies or
outages.
In 2015, the Oregon Legislature established an energy storage mandate through HB 2193,91 requiring PGE
and PacifiCorp to procure a minimum of 5 MWh of energy storage by 2020, not to exceed battery capacity
equal to one percent of the utility’s peak load from 2014. With significant stakeholder engagement, the
utilities developed an evaluation of the potential to site energy storage on their systems, as well as proposals
for the procurement of energy storage projects consistent with the requirements of HB 2193.
In August 2018, the OPUC approved PGE’s proposal to develop up to 39 MW of energy storage. PGE’s
proposal includes five separate projects:
1. A 17 to 20 MW battery system located at one of its distribution substations;
2. A 2 MW battery system co-located with an existing solar project;
3. A 4 to 6 MW battery system interconnected to the transmission system and co-located at a utility-
scale natural gas plant;
4. Multiple microgrid projects at customer sites, including up to 12.5 MW of battery systems; and
5. Up to 500 behind-the-meter, but grid-connected, battery systems at residential customer sites.64
Meanwhile, in September 2018, the OPUC approved PacifiCorp’s proposal to develop two separate energy
storage projects: (1) a 2 MW / 6 MWh battery system located at a single customer site to evaluate energy
storage alongside a blend of renewable and conventional generation; and (2) provide financial and technical
assistance for the development of up to four energy storage projects intended to enhance community
resiliency.65
Biennial Energy Report Chapter 3 — Page 39
Energy Markets
Energy markets provide a fourth type of flexibility for integrating renewable energy. Electric utilities must
balance the availability of generating resources with loads on the electric grid. To do this, utilities commit
generating resources over a variety of time horizons to meet expected future demands. With dispatchable
resources, like fossil fuel plants, utilities can be assured of the level of generation output that the plant can
deliver at a specific point in time in the future. The variable nature of renewable output, however, makes it
more difficult for the utility to anticipate exactly how much output can be expected at a specific point in time
in the future.
If a utility is attempting to secure commitments from generators to meet expected demands the next day, it
may underestimate the output expected from variable renewable generators to avoid having insufficient
resources committed to meet load. For the same reason, that utility may also overcommit its dispatchable
resources because of the certainty of the output that those resources can deliver. Continual improvement in
the industry’s forecasting of the output of variable renewable generators helps utilities to be more accurate
when making these types of commitments in advance. But having the ability to re-dispatch renewable
generators over shorter time intervals provides another valuable tool for utilities to more efficiently utilize
the output of renewable generators when their output varies from the advanced forecast.
Participation in the Western Energy Imbalance Market (EIM) provides participants (including PGE and
PacifiCorp in Oregon) with access to real-time markets that can re-dispatch generators across a wide area of
the western United States over five-minute time intervals. Allowing for optimization over such near-term
time intervals allows participants to utilize more variable renewable output and lowers overall system costs.
CO
NC
LUSI
ON
S
While Oregon has a long history of supporting renewable energy, with
this history comes a need to update and align programs and
associated policies to meet the evolving energy needs of this state.
Meeting the new RPS requirements while also addressing increased
demand for voluntary renewable electricity means addressing a
number of interrelated challenges and opportunities, including efforts
to increase system flexibility, integration of variable renewable
resources, energy storage, demand response, smart grid technologies,
greenhouse gas mitigation policies, changing energy imbalance
markets, and nascent renewable energy technologies.
To address these challenges the Oregon Department of Energy recommends exploring new
strategies for energy planning, a review and analysis of the role of incentives to determine
whether phase outs will materially affect project development, and continued evaluation of
regional market opportunities.
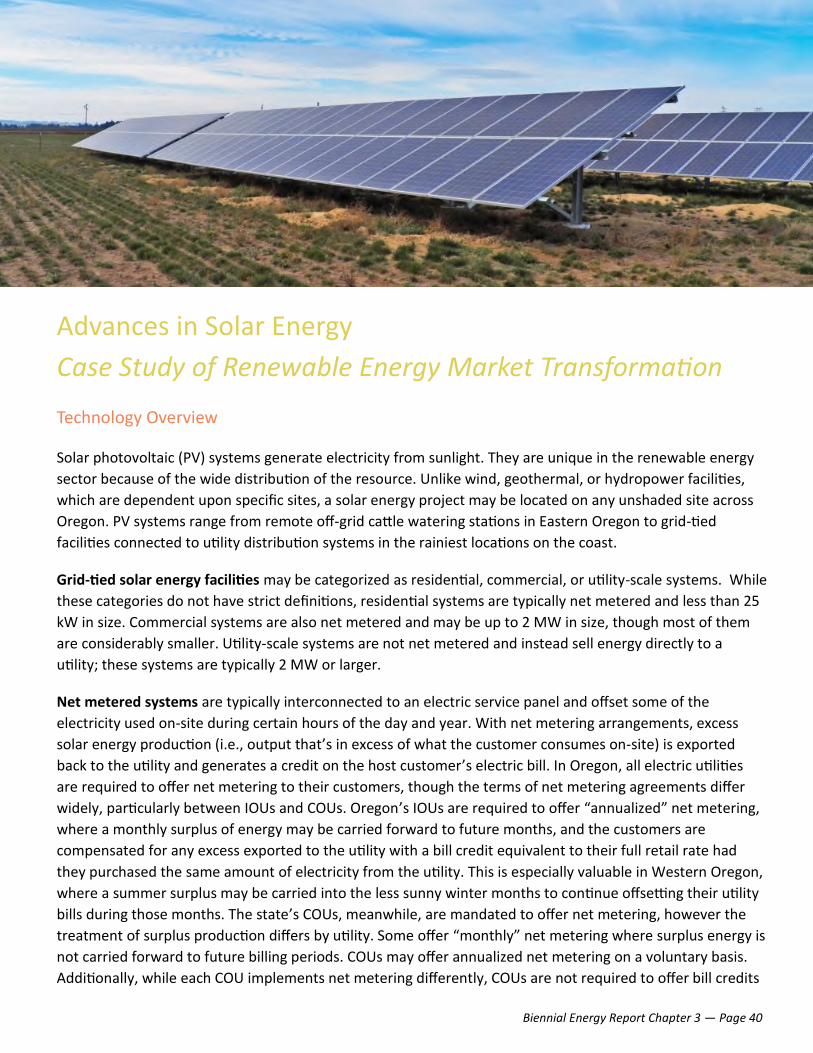
Biennial Energy Report Chapter 3 — Page 40
Advances in Solar Energy
Case Study of Renewable Energy Market Transformation
Technology Overview
Solar photovoltaic (PV) systems generate electricity from sunlight. They are unique in the renewable energy
sector because of the wide distribution of the resource. Unlike wind, geothermal, or hydropower facilities,
which are dependent upon specific sites, a solar energy project may be located on any unshaded site across
Oregon. PV systems range from remote off-grid cattle watering stations in Eastern Oregon to grid-tied
facilities connected to utility distribution systems in the rainiest locations on the coast.
Grid-tied solar energy facilities may be categorized as residential, commercial, or utility-scale systems. While
these categories do not have strict definitions, residential systems are typically net metered and less than 25
kW in size. Commercial systems are also net metered and may be up to 2 MW in size, though most of them
are considerably smaller. Utility-scale systems are not net metered and instead sell energy directly to a
utility; these systems are typically 2 MW or larger.
Net metered systems are typically interconnected to an electric service panel and offset some of the
electricity used on-site during certain hours of the day and year. With net metering arrangements, excess
solar energy production (i.e., output that’s in excess of what the customer consumes on-site) is exported
back to the utility and generates a credit on the host customer’s electric bill. In Oregon, all electric utilities
are required to offer net metering to their customers, though the terms of net metering agreements differ
widely, particularly between IOUs and COUs. Oregon’s IOUs are required to offer “annualized” net metering,
where a monthly surplus of energy may be carried forward to future months, and the customers are
compensated for any excess exported to the utility with a bill credit equivalent to their full retail rate had
they purchased the same amount of electricity from the utility. This is especially valuable in Western Oregon,
where a summer surplus may be carried into the less sunny winter months to continue offsetting their utility
bills during those months. The state’s COUs, meanwhile, are mandated to offer net metering, however the
treatment of surplus production differs by utility. Some offer “monthly” net metering where surplus energy is
not carried forward to future billing periods. COUs may offer annualized net metering on a voluntary basis.
Additionally, while each COU implements net metering differently, COUs are not required to offer bill credits
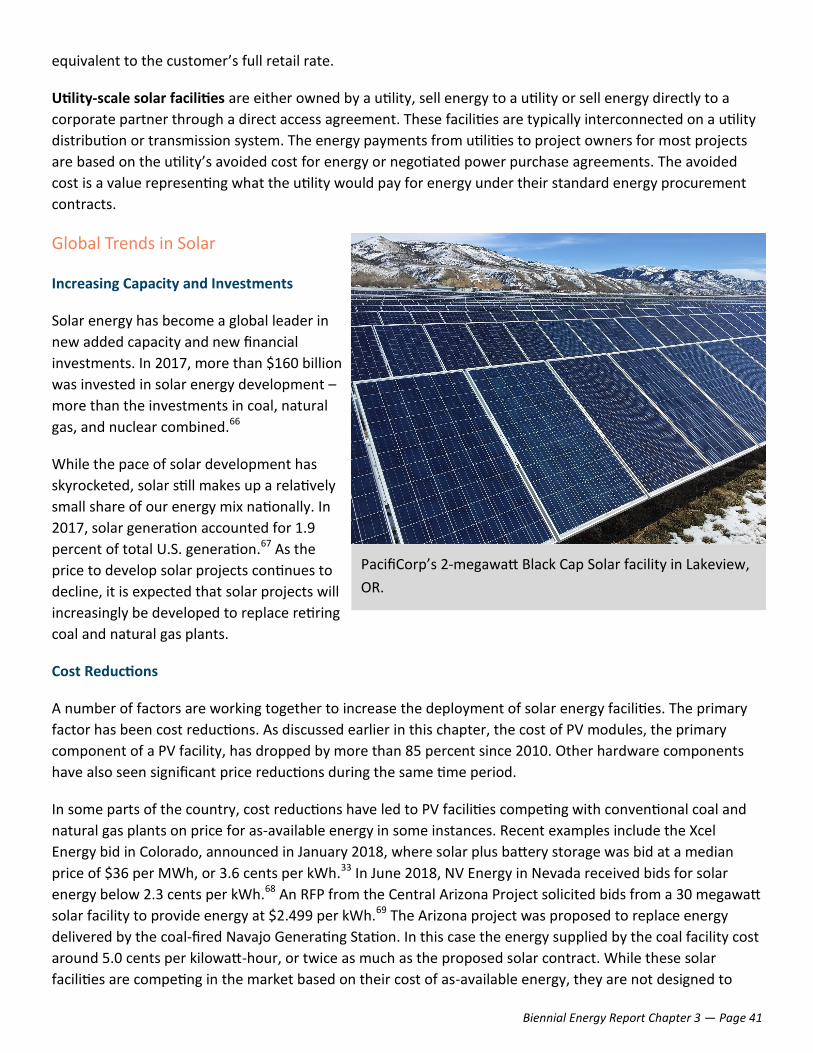
Biennial Energy Report Chapter 3 — Page 41
equivalent to the customer’s full retail rate.
Utility-scale solar facilities are either owned by a utility, sell energy to a utility or sell energy directly to a
corporate partner through a direct access agreement. These facilities are typically interconnected on a utility
distribution or transmission system. The energy payments from utilities to project owners for most projects
are based on the utility’s avoided cost for energy or negotiated power purchase agreements. The avoided
cost is a value representing what the utility would pay for energy under their standard energy procurement
contracts.
Global Trends in Solar
Increasing Capacity and Investments
Solar energy has become a global leader in
new added capacity and new financial
investments. In 2017, more than $160 billion
was invested in solar energy development –
more than the investments in coal, natural
gas, and nuclear combined.66
While the pace of solar development has
skyrocketed, solar still makes up a relatively
small share of our energy mix nationally. In
2017, solar generation accounted for 1.9
percent of total U.S. generation.67 As the
price to develop solar projects continues to
decline, it is expected that solar projects will
increasingly be developed to replace retiring
coal and natural gas plants.
Cost Reductions
A number of factors are working together to increase the deployment of solar energy facilities. The primary
factor has been cost reductions. As discussed earlier in this chapter, the cost of PV modules, the primary
component of a PV facility, has dropped by more than 85 percent since 2010. Other hardware components
have also seen significant price reductions during the same time period.
In some parts of the country, cost reductions have led to PV facilities competing with conventional coal and
natural gas plants on price for as-available energy in some instances. Recent examples include the Xcel
Energy bid in Colorado, announced in January 2018, where solar plus battery storage was bid at a median
price of $36 per MWh, or 3.6 cents per kWh.33 In June 2018, NV Energy in Nevada received bids for solar
energy below 2.3 cents per kWh.68 An RFP from the Central Arizona Project solicited bids from a 30 megawatt
solar facility to provide energy at $2.499 per kWh.69 The Arizona project was proposed to replace energy
delivered by the coal-fired Navajo Generating Station. In this case the energy supplied by the coal facility cost
around 5.0 cents per kilowatt-hour, or twice as much as the proposed solar contract. While these solar
facilities are competing in the market based on their cost of as-available energy, they are not designed to
PacifiCorp’s 2-megawatt Black Cap Solar facility in Lakeview,
OR.
Biennial Energy Report Chapter 3 — Page 42
completely replace thermal power plants which are still providing additional grid services and are capable of
operating at much higher capacity factors.
PV Module Efficiency
In addition to cost reductions, PV modules have also become more efficient over time. PV modules are
measured in Direct Current (DC) Watts based on their power output under standard test conditions. In 2010,
SolarWorld in Hillsboro, which was recently purchased by Sunpower, produced one of the most efficient PV
modules in the world, generating 220 to 235 watts of power. Today, the same-sized SolarWorld module will
generate 300 watts of power, representing an increase of more than 25 percent.70
Efficiency improvements affect several factors in deployment and pricing of PV projects:
1. Reduced system footprint / land use: As the efficiency of PV modules increases, the amount of roof
space or land necessary for a given system capacity decreases. Just as PV modules are measured in
DC Watts, PV facilities are measured in units of 1000 Watts (Kilowatt or kWdc). A 100 kWdc system
installed in 2010 would have required about 7,700 square feet of PV modules. The same 100 kWdc
system installed in 2018 will require about 6,000 square feet.
2. Reduced labor costs: The labor associated with handling and installing PV modules is a major
component of overall system pricing. Increased efficiencies results in fewer PV modules and a
reduction in labor costs for a project with the same generation capacity.
3. Reduction in balance of system equipment: Similar to labor reductions, increased module efficiency
reduces the balance of system equipment necessary to install a PV system. Balance of system
equipment refers to racking, mounting hardware, wires, and other materials but does not include the
PV modules or inverters.
Integration Challenges
Solar PV facilities are variable generators that only produce energy during daylight hours. Solar generation
ramps up quickly in the morning, provides peak generation during the middle of the day, and ramps down
quickly in the evening. This pattern has proven to be a challenge for grid operators to integrate with system
loads. As solar output is declining in the early evening, customer energy demand on the grid tends to be
increasing. Net load or net demand is a term used to describe system energy demand, less the demand that
is met by solar output on the grid. In areas with high solar penetration, the resulting net demand curve can
drop steeply in the morning as solar output increases rapidly, and then climb steeply in the evening as solar
output declines. When plotted over the hours of the day, the net demand curve resembles the profile of a
duck and so has been colloquially named “the duck curve.” The “belly” of the duck represents low net power
demand on the grid due to peak solar output on the grid. The “neck” of the duck represents the steep ramp
up of net power demand as people come home from work and turn on lights and appliances at the same
time the sun is going down and solar output declines. This neck of the duck requires a large amount of non-
solar capacity to be dispatched on the grid over a relatively short timeframe. This phenomenon occurs when

Biennial Energy Report Chapter 3 — Page 43
two factors are present: (1) significant solar output, and (2) comparatively low net load during mid-day hours.
As a result, to date the duck curve has occurred in markets with large amounts of solar, especially California
and Hawaii, during springtime months when mild weather results in low mid-day net loads.
Figure 3.15: The Duck Curve on California’s Grid
The challenges associated with solar integration can be mitigated with four primary and interactive
strategies:
1. Change the shape of the load profile: Late afternoon and evening loads are primarily attributed to
increasing residential demands that naturally occur at the end of the work day. Some of these loads, such
as water heating, dish washing, laundry, and air conditioning could be shifted to earlier or later in the day.
2. Change the shape of the solar production profile: While the output from PV modules will always
correspond with the amount of sunlight, the output of the overall PV facility may be changed with energy
storage. Adding batteries to a solar facility can shape the production profile to match the load profile.
3. Increase flexible capacity resources: Flexible capacity resources are able to ramp up and down to serve
the variable loads on the grid. Battery storage systems, natural gas “peaker” plants, pumped storage
hydro systems and the existing BPA hydro system are all able to provide flexible capacity in the
Northwest.
4. Export, curtail, or transform excess solar generation. Curtailment is currently being implemented in
California during periods of excess solar generation. Regional energy markets may be able to provide an
export option. Transforming excess generation could be accomplished by using solar energy to create
hydrogen or liquid fuels. This is also known as power-to-gas.

Biennial Energy Report Chapter 3 — Page 44
Where does Oregon Stand?
Despite being known for its rainy climate, Oregon has significant solar potential. For example, a residential PV
system installed in Astoria will generate only about six percent less energy than the same system in Portland.
The same system installed in Newport will generate three percent more energy than the Portland system.71
Despite the wide differences in resource potential around the state, nearly half of the residential PV capacity
in the state is installed in Multnomah, Clackamas, and Washington counties.72
Oregon’s coastal solar resource, in fact, outperforms much of Europe where a significant amount of solar
capacity has been installed. A PV system in Astoria will generate about 5 percent more energy than the same
system in Munich, Germany. Germany has installed more than 44 GW of solar, or about 100 times as much as
Oregon and Munich is located in the part of the country with the best solar resource.73
As of Q2 2018, there was at least 477 MW of total solar capacity installed in Oregon. More than 70 percent of
the total solar capacity in Oregon was installed since the beginning of 2017,74 and there has been an increase
in the size of projects. For example, the 56 MW Gala Solar project installed in Prineville in 2017 will generate
more energy in 2018 than all of the residential systems in the state combined.
According to the Solar Energy Industries Association (SEIA), Oregon ranks 20th in the U.S. for total installed
solar capacity.74 Figure 3.16 shows installed PV capacity in western states, as of Q2 2018. It is difficult to track
the exact cumulative capacity of solar installed in Oregon in real time, as many projects come online before
utility data reports are updated.
Figure 3.16: Installed Solar Capacity in the Western States75
Oregon’s solar capacity is divided between residential, commercial, and utility-scale projects. Approximately

Biennial Energy Report Chapter 3 — Page 45
85 percent of the residential capacity is west of the Cascades while about 90 percent of the utility-scale
projects are east of the Cascades.
Reduced costs for PV equipment have resulted in larger systems being installed. As figure 3.17 demonstrates,
in the Oregon residential market, the average PV system size has increased from 2.5 kWdc in 2007 to more
than 6 kWdc in 2017. Over the same period, the cost of these systems has decreased from over $9.00 per
watt to about $4.00 per watt. Over the same period the number of systems installed per year increased from
less than 250 in 2007 to more than 2,800 in 2017.
Figure 3.17: Average Cost and Size of Solar PV Projects in the RETC Program72
While the cost of residential solar energy projects in Oregon has declined, the rate of decline has not kept up
with the national average pricing of $2.80 per watt in 2017 demonstrated in the NREL 2017 benchmark
study,31 due in part to the relatively small solar market in Oregon compared to some other states. In 2017
there was a total of 20 MW of residential solar installed in Oregon, which makes up less than one percent of
the 2,227 MW installed nationwide.72,76
Oregon’s commercial PV sector has also seen significant cost reductions. The average cost for commercial PV
systems in the Energy Trust of Oregon incentive programs was about $8.00 per watt in 2008 compared to
about $3.00 per watt today. The sharp drop in projects seen in the figure below is a result of changes to the
Business Energy Tax Credit program.
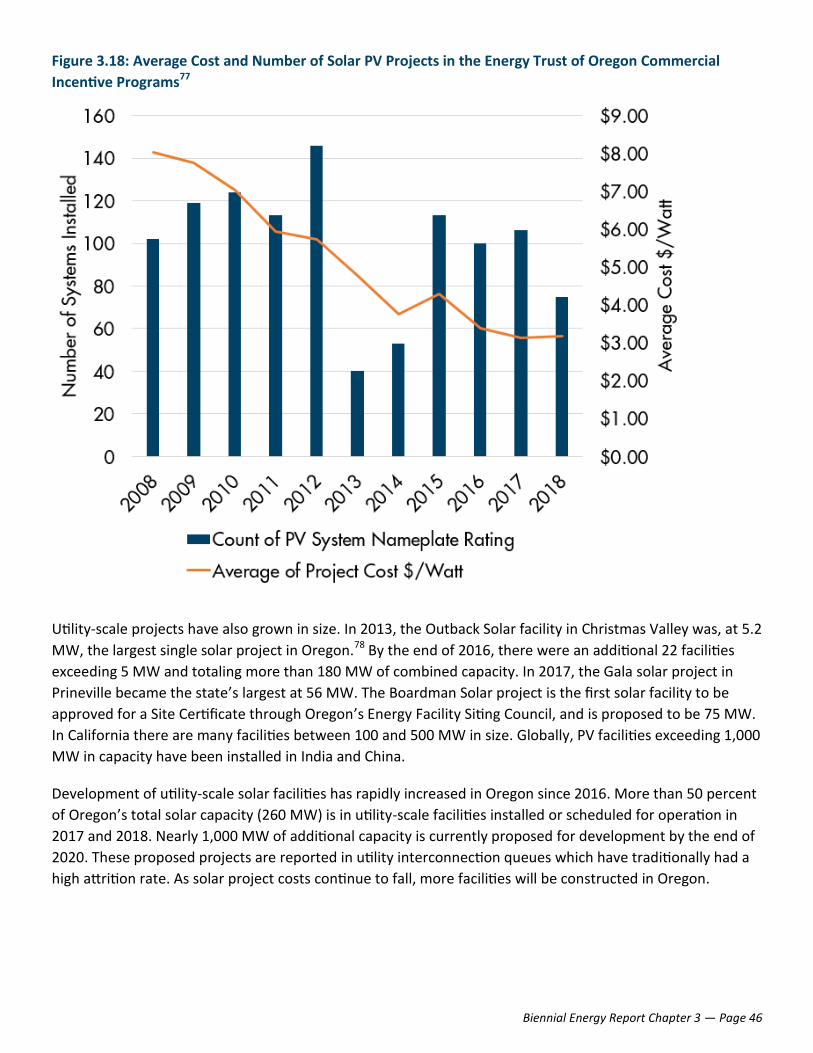
Biennial Energy Report Chapter 3 — Page 46
Figure 3.18: Average Cost and Number of Solar PV Projects in the Energy Trust of Oregon Commercial
Incentive Programs77
Utility-scale projects have also grown in size. In 2013, the Outback Solar facility in Christmas Valley was, at 5.2
MW, the largest single solar project in Oregon.78 By the end of 2016, there were an additional 22 facilities
exceeding 5 MW and totaling more than 180 MW of combined capacity. In 2017, the Gala solar project in
Prineville became the state’s largest at 56 MW. The Boardman Solar project is the first solar facility to be
approved for a Site Certificate through Oregon’s Energy Facility Siting Council, and is proposed to be 75 MW.
In California there are many facilities between 100 and 500 MW in size. Globally, PV facilities exceeding 1,000
MW in capacity have been installed in India and China.
Development of utility-scale solar facilities has rapidly increased in Oregon since 2016. More than 50 percent
of Oregon’s total solar capacity (260 MW) is in utility-scale facilities installed or scheduled for operation in
2017 and 2018. Nearly 1,000 MW of additional capacity is currently proposed for development by the end of
2020. These proposed projects are reported in utility interconnection queues which have traditionally had a
high attrition rate. As solar project costs continue to fall, more facilities will be constructed in Oregon.

Biennial Energy Report Chapter 3 — Page 47
Figure 3.19: Cumulative Existing Capacity and Interconnection Applications for Utility Scale Solar Capacity
Reported by PGE and PacifiCorp
Federal Tariffs
In January 2018, the Trump Administration established tariffs on imported solar modules. The tariff is initially
set at 30 percent, reducing 5 percent each year, and ending in 2022. As most of the solar modules used in
Oregon and the U.S. as a whole are imported, these tariffs could significantly increase the cost of solar
projects. In addition, tariffs on steel and aluminum products also threaten to reverse the downward cost
trends seen in the solar industry. Cypress Creek Renewables, a solar developer active in Oregon, announced
the cancellation of 1,500 MW of new solar projects across the country as a result of the tariffs.79 Nationally,
more than $2.5 billion in new solar investments have been cancelled.80 Some domestic manufacturers,
including Hillsboro’s Solar World, advocated for the tariffs in order to provide a boost for U.S. solar
manufacturers. The overall impact in Oregon from these tariffs is not yet known.
In June 2018, the IRS issued a ruling regarding treatment of the federal Solar Investment Tax Credit (ITC)
ramp-down. The ruling allows the 30 percent ITC to be taken by project owners who commit at least five
percent of the budget by the end of 2019. These projects then have until 2023 to complete construction. This
means that 2022 and 2023 will be years where projects can avoid tariffs and still claim the full 30 percent
ITC.

Biennial Energy Report Chapter 3 — Page 48
Policies Affecting Solar in Oregon
There are a number of new solar programs and policies under
development in Oregon that have the potential to significantly
alter local solar markets. The Oregon Legislature passed SB 154792
in 2016, which established the state’s first legislative mandate for
a community solar program and development of a resource value
of solar.
Community Solar
Community solar projects have been installed in 42 states, 19 of which have implemented community solar
programs. By Q1 of 2018, there were more than 1,000 MW of community solar projects nationwide.81 These
community solar projects typically differ from conventional solar facilities in a couple of ways. First,
ownership of community facilities may include a cooperative of participants, a utility, or private developers
and investors. Second, the output of a community solar project is typically allocated among participants. This
allocation may be accomplished with or without involvement from a utility partner. Projects installed with a
utility partner may utilize virtual net metering where the output from a central solar facility will be allocated
to each participant in the form of a credit on their existing utility bills.
Oregon Laws 2016, Chapter 28 (SB 1547)92 directs the OPUC to establish a program that enables owners and
subscribers of a community solar project to share in the costs and benefits of the project. The program
applies to customers of PGE, PacifiCorp, and Idaho Power, and enables subscribers to realize electric bill
savings associated with a share of a community solar facility. The program is still in development at OPUC
and has not yet resulted in any projects.
Community solar projects have been built in Oregon outside of the OPUC community solar program. In 2007,
the City of Ashland installed a 63 kW community solar system known as Solar Pioneer II at the City of Ashland
Service Center. Shares of the project were made available to any Ashland Utility customer. In 2016, Central
Electric Cooperative completed installation of the 200 kW Shared Solar community solar project in Bend.
Similarly, Emerald People’s Utility District launched their Sharing Sun community solar project in 2017.
Community solar projects present numerous opportunities for utilities, home owners, renters, low-income
communities, solar contractors, and program delivery contractors:
• Increased access to solar for Oregonians who cannot or have not installed individual solar facilities of
their own. A 2015 report from NREL indicates that 49 percent of American households and businesses
lack adequate solar resources for an onsite solar installation.82
• Increased solar market activity for Oregon solar contractors. Community solar projects may help to
offset market losses associated with the end of the RETC program in 2017, described in more detail
below.
• Utilities will be given the opportunity to provide additional services to their customers. While there may
also be an increase in utility administrative costs, this may be offset by increasing customer choice and
satisfaction among customers.
• Increased access to solar by low-income Oregonians. For many Oregonians, conventional solar
Biennial Energy Report Chapter 3 — Page 49
installations are not affordable, so community solar could provide options for participation with
minimal financial burden. Oregon’s community solar program has a provision to make 10 percent of the
program available to low-income communities. While implementation of the low-income provisions has
yet to be defined, it is expected to increase the equitable distribution of solar in Oregon.
• Centralized community solar projects are able to leverage economies of scale compared to an
equivalent capacity of distributed solar facilities.
• Centralized community solar projects are more likely to be optimized for annual solar energy
production. This may be accomplished through strategic site selection to minimize shading obstructions
and through the use of solar trackers for ground mounted systems.
There are also a number of challenges specific to community solar projects:
• Administrative burden for utilities to implement programs, including development of virtual net
metering protocols.
• Additional administrative costs associated with ownership and membership of the projects.
Administrative costs make up one component of “soft costs” associated with all solar projects.
Community solar projects may have additional costs associated with marketing to participants, legal
fees associated with ownership models, and ongoing bookkeeping costs associated with allocating
facility production among members.
Resource Value of Solar
Oregon Laws 2016, Chapter 2892 directs the OPUC to establish a resource value of solar (RVOS). The RVOS is
an analysis to determine the net costs and benefits that distributed solar facilities bring to the ratepayers of
Oregon’s investor-owned utilities. The OPUC currently has four dockets dedicated to examining the RVOS.
They are:
• UM 1716 (Investigation to Determine Resource Value of Solar)
• UM 1910 (PacifiCorp Resource Value of Solar)
• UM 1911 (Idaho Power Resource Value of Solar)
• UM 1912 (Portland General Electric Resource Value of Solar)83
UM 1716 determined the methodology for calculating the RVOS. The docket started with a scoping task to
determine which elements to include in the RVOS calculation. The OPUC determined that only elements
directly attributable to utility electric ratepayers should be included, and that any additional societal benefits
associated with distributed solar should not. Table 3.6 includes the 11 elements identified in UM 1716 to be
included in the RVOS. Positive values are described as a benefit while negative values are described as costs.
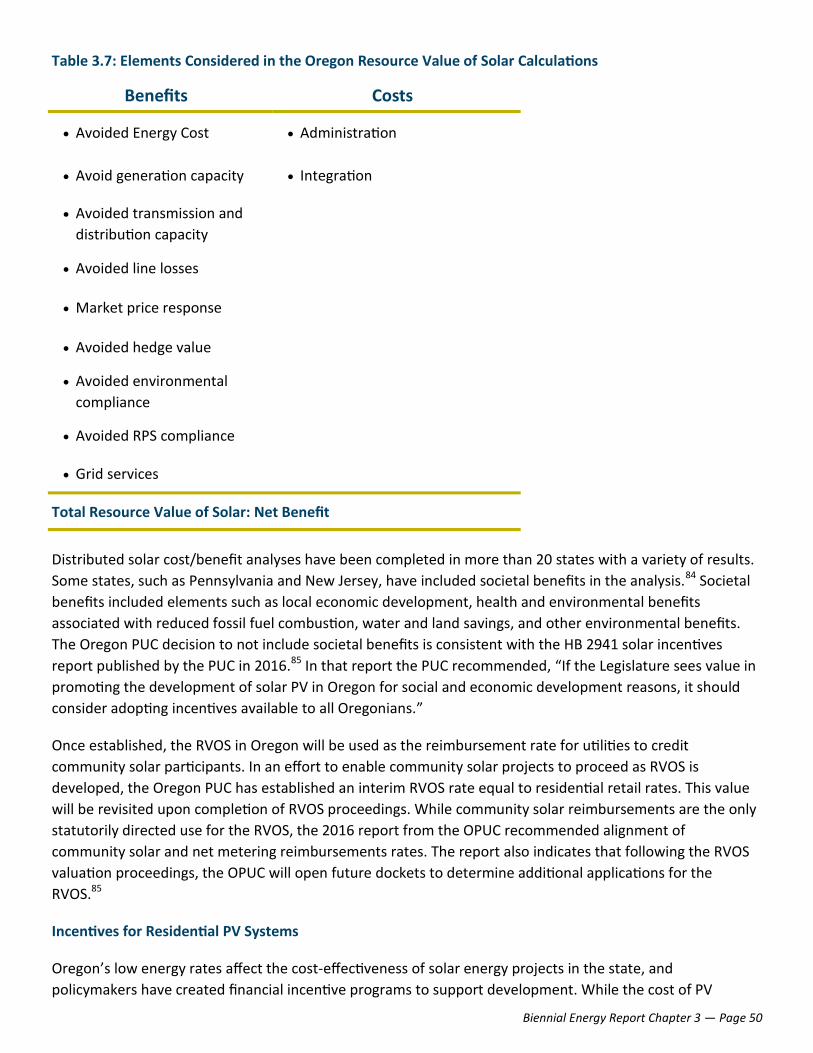
Biennial Energy Report Chapter 3 — Page 50
Table 3.7: Elements Considered in the Oregon Resource Value of Solar Calculations
Distributed solar cost/benefit analyses have been completed in more than 20 states with a variety of results.
Some states, such as Pennsylvania and New Jersey, have included societal benefits in the analysis.84 Societal
benefits included elements such as local economic development, health and environmental benefits
associated with reduced fossil fuel combustion, water and land savings, and other environmental benefits.
The Oregon PUC decision to not include societal benefits is consistent with the HB 2941 solar incentives
report published by the PUC in 2016.85 In that report the PUC recommended, “If the Legislature sees value in
promoting the development of solar PV in Oregon for social and economic development reasons, it should
consider adopting incentives available to all Oregonians.”
Once established, the RVOS in Oregon will be used as the reimbursement rate for utilities to credit
community solar participants. In an effort to enable community solar projects to proceed as RVOS is
developed, the Oregon PUC has established an interim RVOS rate equal to residential retail rates. This value
will be revisited upon completion of RVOS proceedings. While community solar reimbursements are the only
statutorily directed use for the RVOS, the 2016 report from the OPUC recommended alignment of
community solar and net metering reimbursements rates. The report also indicates that following the RVOS
valuation proceedings, the OPUC will open future dockets to determine additional applications for the
RVOS.85
Incentives for Residential PV Systems
Oregon’s low energy rates affect the cost-effectiveness of solar energy projects in the state, and
policymakers have created financial incentive programs to support development. While the cost of PV
Benefits Costs
• Avoided Energy Cost • Administration
• Avoid generation capacity • Integration
• Avoided transmission and
distribution capacity
• Avoided line losses
• Market price response
• Avoided hedge value
• Avoided environmental
compliance
• Avoided RPS compliance
• Grid services
Total Resource Value of Solar: Net Benefit

Biennial Energy Report Chapter 3 — Page 51
systems has decreased, residential and commercial PV projects still have considerable above-market costs in
Oregon. Above-market costs are the difference between the market value of a project’s energy production
compared to the actual costs to produce the energy. Figure 3.20 shows how much a residential PGE customer
could anticipate paying for a solar system in 2018 and how long it would take to pay off with estimated bill
savings. The analysis does not account for escalating energy prices or the time value of money.
Figure 3.20: Typical Solar Cost for PGE Residential Customer
The Oregon Legislature has created a variety of incentive programs through the years, including tax credits,
cash rebates, volumetric incentive rates, production payments, and property tax abatements. The Energy
Trust of Oregon offers incentives for solar installations for consumers in PGE and Pacific Power service
territories and some consumer-owned utilities offer incentives to their customers. While these incentives have
successfully supported the development of a solar industry in the state, they have also contributed to periods
of volatility, especially in the residential market. In 2012, about 1,500 residential solar projects were installed
in Oregon; one year later, less than 900 systems were installed. The decline was primarily attributed to
reductions in Energy Trust of Oregon incentives. During the 2017 tax year, ODOE’s Residential Energy Tax
Credit program processed applications for more than 2,800 systems. System installations are expected to drop
by nearly half in 2018, due to the sunset of the RETC program on December 31, 2017.
The RETC program provided up to $6,000 in tax credits taken over four years, and reduced the simple payback
period to around 10 years for the sample system in PGE territory described above. A reduction in residential
PV applications at Energy Trust of Oregon provides an indication of the impact associated with the sunset of
the RETC. Prior to 2018, participants in the Energy Trust of Oregon PV incentive program were also eligible for
the RETC. The RETC sunset resulted in increased program activity in 2017 followed by a decrease in activity in
2018. Figure 3.21 demonstrates the number of applications received by Energy Trust of Oregon in 2018
compared to 2017, following the sunset of the RETC program. In the first six months of 2017, Energy Trust
received 1,040 applications compared to 545 over the same period in 2018. The second half of 2017 saw a
spike in applications from homeowners racing to take advantage of the RETC. Energy Trust increased
System Size: 6 kWdc
Cost: $22,500 ($3.75/watt)
Energy Trust of Oregon
incentive: -$2,700
Federal Tax Credit -$5,940
Net Cost to Owner $13,860
Estimated Annual Energy
Production 7,200 kWh
Estimated Annual Bill Savings: $800 ($0.11/kWh)
Simple Payback: 17 years

Biennial Energy Report Chapter 3 — Page 52
residential solar financial incentives to correspond with the RETC sunset. The Energy Trust residential PV
incentive in December 2017 in PGE territory was $0.25 per watt, up to $1,500. In January 2018, the incentive
rate more than doubled to $0.60 per watt, and the incentive cap more than tripled to $4,800. Even with
Energy Trust’s higher incentive for residential PV, out-of-pocket costs for customers went up when RETC
ended.
Figure 3.21: Residential Solar Applications from PGE Customers Received by Energy Trust in 2017 and 2018
(Energy Trust of Oregon Solar Status Update 9/7/2018)103
Systems installed under the Energy Trust incentive program still receive a financial incentive and are easy to
track. In 2017, there were 2,800 residential PV systems that received a RETC. Of those, 500, or about 18
percent, were outside of Energy Trust territory, which only includes customers of PGE and PacifiCorp. The
effect of the loss of the RETC incentive is expected to be higher outside Energy Trust territory. Complete 2018
data from these markets is not yet available. Figure 3.22 demonstrates how projects have been distributed
across utility service territories in the RETC program.

Biennial Energy Report Chapter 3 — Page 53
Figure 3.22: RETC Project Distribution Across Utility Service Territories
As solar costs continue to come down, financial incentives will play a smaller role in market adoption.
Financial incentives aimed at solar market transformation are meant to serve as a bridge to a future market
where solar is cost-competitive or at parity with conventional grid electricity. This can be seen in the design
of the federal investment tax credit which begins a ramp down in 2020, and drops to zero in 2022. In a 2012
report, NREL determined that Oregon would be among the last states to reach grid parity due primarily to
low energy costs and lower solar resources than many other U.S. states.86 While many of the market
conditions have changed in the last six years, it is true that Oregon still has larger financial hurdles than many
other states.
Land Use
Solar land use laws in Oregon primarily affect
utility-scale systems, and vary by the system
size and the classification of soils on the site.
While the rise of utility-scale projects in
Oregon is relatively new, farmers have been
installing solar energy systems to support on-
site energy loads for years. Many of these
systems used barn roofs or uncultivated land
adjacent to irrigated fields, and were
interconnected to electrical services for farm
operations and irrigation pumps.
In 2012, Outback Solar, the state’s first utility-
scale project, was installed on 50 acres of
rangeland in Christmas Valley (right).

Biennial Energy Report Chapter 3 — Page 54
Permitting authority for utility-scale solar projects is dependent on the proposed size and location of the
projects. Smaller projects are subject to county (or city) jurisdiction, and larger projects are subject to EFSC
jurisdiction. The majority of these projects are proposed on farmland that is zoned as “Exclusive Farm Use.”
“Goal 3” of the Oregon statewide land use planning goals44 protects farmland, and the Land Conservation
and Development Commission has issued rules implementing Goal 3 protections. Projects that permanently
remove farmland from production over certain thresholds must receive a Goal exception as part of their
approval in order to construct these projects. Those thresholds are tied to agricultural productivity and
include the following:
• Facilities that occupy more than 12 acres of high-value farm land;
• Facilities that occupy more than 20 acres of arable lands; or
• Facilities that occupy more than 320 acres of non-arable lands.
Like all energy generation projects, for solar
projects to be as financially viable as possible,
they are sited near transmission lines to minimize
the cost of creating inter-tie transmission lines,
which are very expensive. This limits the locations
in Oregon where energy generation development,
including solar energy development, can occur.
There is a lot of variation in the size of utility-scale
solar facilities. The vast majority of these projects
are between 12 and 100 acres. However, there
are several larger projects of note. The largest
operating is the 320-acre Gala Solar project
located in Crook County. The largest approved
but not yet constructed project is the Boardman
Solar project in Morrow County, which is
proposed to be 545 acres when completed. Finally, the Oregon Department of Energy just received the
Obsidian Solar Center project application in north Lake County which is proposed to be 3,921 acres.
Locations in Oregon that can support such large-scale industrial development, and that are located in close
proximity to transmission lines with capacity, tend to be either farmland, rangeland, or undeveloped native
habitat. Effects from solar development on farmland or native habitat have caused considerable interest and
concern from many parties. As a response to solar development proposals on Willamette Valley farmland,
both Marion County and Yamhill County have passed ordinances restricting future solar development until
additional assessment, land use rules, and protection measures can be developed, and the effects of solar on
farmland can be further considered by the counties.
Similar opposition has come from other groups concerned about solar development on native habitat,
particularly in central, southern, and eastern Oregon’s high desert regions. Solar projects in these areas
functionally remove habitat from use by native species, and, at a very large scale, can disturb movement by
larger species, including big game. Solar projects under EFSC jurisdiction must comply with the EFSC Fish and
Future site of the approved Boardman Solar Facility.

Biennial Energy Report Chapter 3 — Page 55
Wildlife Habitat standard, which is connected to the ODFW Fish and Wildlife Mitigation Policy, and which
includes requirements to attempt to avoid and minimize effects, and provide compensatory mitigation
commensurate with the affected habitat in accordance with the policy. Solar projects under local jurisdiction,
however, do not have to meet the same requirement unless county governments enforce such a
requirement.
There are many areas in Oregon that are good locations to site a solar project – areas with minimal or no
effect on native habitat or farmland, and areas with access to transmission. To date, approximately 90
percent of utility-scale solar projects have been installed east of the Cascades due, in part, to better solar
resources and lower cost of land. As communities consider local energy resiliency initiatives, there may be
additional value recognized in developing more distributed energy facilities in close proximity to loads and
population centers.
Net Metering
ORS 757.300100 describes Oregon’s net metering laws, including the treatment of surplus generation and a
cap on aggregated net metering capacity. Figure 3.22 above demonstrates that 85 percent of the residential
solar capacity in Oregon has been installed in PGE or PacifiCorp territories.
The aggregate capacity cap described in ORS 757.300 establishes a limit of how much solar can be installed
within a utility service territory before the utility is no longer mandated to offer net metering. In Oregon the
cap is set at 0.5 percent of the utilities’ peak hourly load. Once the cumulative capacity of net metered
systems reach this cap, the utility is no longer required to offer net metering. PGE and Pacific Power have
exceeded the 0.5 percent cap but have so far continued to offer net metering on a voluntary basis. Other
western states have aggregate capacity limits ranging from 0.5 percent on the low end (Oregon and
Washington) to 20 percent on the high end (Utah). Many states do not specify a limit.
PURPA Contracts
As described earlier in this chapter, Oregon utilities must contract with renewable energy facilities to
purchase energy at the utilities’ scheduled avoided costs rates. In Oregon, utilities establish different avoided
costs rates based on the technology installed on their system. Solar facilities provide intermittent power
which is valued less than “baseload” facilities that provide constant, steady power. For example, PGE
developed Schedule 201, establishing different fixed avoided cost rates for baseload, wind, and solar
facilities. Under PGE’s Schedule 201,87 a baseload facility has an average monthly fixed price of $58.95 per
MWh for energy delivered during on-peak periods in 2025. A solar facility under the same time period would
get an average fixed price of $38.62, about 35 percent lower than the baseload facility. As battery storage
systems become more affordable, it will be possible for solar facilities to provide many of the services
currently provided by baseload facilities, and this may raise questions about whether the existing avoided
rate methodology is appropriate. The issue is already under discussion in Idaho, where Idaho Power and the
Idaho Public Utility Commission are in a dispute with a solar developer about whether two proposed solar
plus battery storage projects should be eligible for contract terms associated with “Other Projects,” which
are preferable to the contract terms associated with solar projects.88
Biennial Energy Report Chapter 3 — Page 56
Property Taxes
Local jurisdictions currently have two options for levying property taxes on utility-scale solar facilities. The
first is known as a centralized assessment, which aims to establish a property value in a manner similar to
other power plants in Oregon. The second option is to levy a fee in lieu of property taxes, currently valued at
$7,000 per megawatt of capacity per year. The fee in lieu of taxes was established in Section 1, Chapter 571,
Oregon Laws 2015104 as a simplified approach to property tax evaluation. As solar costs continue to decrease,
the value of future facilities will also decrease, which will decrease property taxes calculated under a
centralized assessment. This may result in the $7,000 per MW fee falling out of line with the market. Some
solar industry stakeholders may wish to revisit the $7,000 per megawatt value of the fee in future years.
CO
NC
LUSI
ON
S Solar energy has experienced significant technological advancements
and dramatic cost reductions in the past decade. The result is that solar
energy facilities now represent a significant share of new energy
acquisitions globally and in some markets are cost competitive with
conventional resources such as coal and natural gas.
Oregon has traditionally had a small share of the national solar market,
but has been a leader in solar energy policies. Some sectors still
struggle in Oregon to achieve consistent market growth. 2018 is
proving to be a challenging year in the residential sector with the sunset of the RETC program.
Commercial projects have seen similar volatility year over year. Oregon’s utility-scale solar sector
is poised for rapid growth based on the number of interconnection applications to Oregon
utilities however challenges such as low avoided cost rates and federal trade tariffs may
jeopardize many of those projects.

Biennial Energy Report Chapter 3 — Page 57
Cited References
1. ORS 469A. Renewable Portfolio Standards. https://www.oregonlegislature.gov/bills_laws/ors/ors469a.html
2. Beiter, Philipp, Michael Elchinger, and Tian Tian. 2016 Renewable Energy Data Book. No. DOE/GO-102016-4904. NREL, 2017. https://www.nrel.gov/docs/fy18osti/70231.pdf
3. Warren, Chris. “Once an Obscure Law, PURPA Now Drives Utility-Scale Solar. Regulatory Conflict Quickly Followed.” Greentech Media, February 23, 2017. https://www.greentechmedia.com/articles/read/purpa-is-causing-conflict-in-montana#gs.JWk2uDI
4. Barbose, Galen. U.S. Renewables Portfolio Standards: 2017 Annual Status Report. Berkeley, CA: Law-rence Berkeley National Laboratory, July 2017. Accessed August 7, 2018. http://eta-publications.lbl.gov/sites/default/files/2017-annual-rps-summary-report.pdf
5. Oregon Public Utility Commission. 2015 Oregon Utility Statistics. Salem, OR: Oregon Public Utility Com-mission. Accessed July 17, 2018. https://www.puc.state.or.us/docs/statbook2015.pdf
6. Oregon Public Utility Commission. 2016 Oregon Utility Statistics. Salem, OR: Oregon Public Utility Com-mission. Accessed July 17, 2018. https://www.puc.state.or.us/docs/statbook2016.pdf
7. Oregon Public Utility Commission. 2017 Oregon Utility Statistics. Salem, OR: Oregon Public Utility Com-mission. Accessed 10/8/2018. https://www.puc.state.or.us/docs/statbook2017.pdf
8. Oregon Laws 2007, Chapter 301 (Senate Bill 838 (2007)) 9. Oregon Administrative Rule 330-160-0015(17) 10. Eugene Water & Electric Board. “Oregon Renewable Portfolio Standard: 2017 Compliance Report.” June
1, 2018. http://www.eweb.org/Documents/about-us/renewable-portfolio-standard-compliance-report.pdf
11. Oregon Department of Energy. “1.5 Percent for Green Energy Technology in Public Buildings: Projects Reported Calendar Year 2017.” Salem, OR: Oregon Department of Energy, 2018. Accessed July 23, 2018. https://www.oregon.gov/energy/Data-and-Reports/Documents/2018-GET-Legislative-Report.pdf
12. National Renewable Energy Laboratory. “Top Ten Utility Green Pricing Programs.” Golden, CO: National Renewable Energy Laboratory. Accessed July 17, 2018. https://www.nrel.gov/analysis/assets/pdfs/utility-green-power-ranking.pdf
13. O’Shaughnessy, Eric J., Christina M. Volpi, Jenny S. Heeter, and Jeffrey J. Cook. Status and Trends in the U.S. Voluntary Green Power Market (2016 Data). No. NREL/TP-6A20-70174. National Renewable Energy Lab. (NREL), Golden, CO (United States), 2017.
14. Abbott, Stephen. “Renewables for Everyone: Moving Beyond the Fortune 500.” Boulder, CO: Rocky Mountain Institute’s Business Renewables Center, June 25, 2018. https://rmi.org/renewables-for-everyone-moving-beyond-the-fortune-500/
15. Business Renewables Center. “BRC Deal Tracker: 2013 – 2018 YTD.” Accessed August 7, 2018. http://businessrenewables.org/corporate-transactions/
16. RE100. “Companies.” Accessed August 7, 2018. http://there100.org/companies 17. Intel. Corporate Social Responsibility at Intel: 2017-2018 Report. Santa Clara, CA: Intel, 2018. Accessed
August 7, 2018. http://csrreportbuilder.intel.com/PDFfiles/CSR-2017_Full-Report.pdf 18. Danko, Pete. “Here are the Oregon Companies Defying Trump on the Paris Climate Agreement.” Port-
land Business Journal, June 6, 2017. Accessed August 7, 2018. https://www.bizjournals.com/portland/news/2017/06/06/here-are-the-oregon-companies-defying-trump-on-the.html
19. Apple Inc. Environmental Responsibility Report: 2017 Progress Report, Covering Fiscal Year 2016. Ac-cessed August 14, 2018. https://images.apple.com/environment/pdf/Apple_Environmental_Responsibility_Report_2017.pdf
Biennial Energy Report Chapter 3 — Page 58
20. ORS 757.607(1) 21. Tawney, Leitha, Priya Barua, and Celina Bonugli. Emerging Green Tariffs in U.S. Regulated Electricity
Markets. Washington, D.C.: World Resources Institute, February 2018. 22. Oregon Laws 2014, chapter 100, section 3 (House Bill 4126 (2014)) 23. Stavitsky, Ariel. Lessons and Strategies from Oregon’s Would-Be Voluntary Renewable Energy Tariff. Eu-
gene, OR: University of Oregon School of Law, August 2017. Accessed July 25, 2018. https://law.uoregon.edu/images/uploads/entries/Lessons_and_Strategies_from_Oregon%E2%80%99s_Would-be_Voluntary_Renewable_Energy_Tariff_-_AHS_11.08.17.pdf
24. Portland General Electric. Oregon Public Utility Commission Docket UM 1690 (April 13, 2018). https://apps.puc.state.or.us/edockets/docket.asp?DocketID=18956
25. Oregon Laws 2016, Chapter 63 (House Bill 4037 (2016)) 26. Business Oregon. "Solar Development Incentive." Business Oregon. Accessed July 23, 2018. http://
www.oregon4biz.com/Oregon-Business/Tax-Incentives/Solar-Incentive-Program/ 27. Data derived from Business Oregon “Oregon Strategic Investment Program (SIP) Projects based on 2018
Annual Employment and Payroll Reports” https://www.oregon4biz.com/assets/public-records/SIP/SIPsum2018.pdf and Renewable Northwest. “Renewable Energy Projects: Project List & Map.” Accessed October 15, 2018. https://renewablenw.org/project_map
28. Solar Energy Industries Association. “Solar Investment Tax Credit (ITC) 101: What is the solar Invest-ment Tax Credit?” SEIA, June 2018. Accessed October 1, 2018. https://www.seia.org/sites/default/files/inline-files/SEIA-ITC-101-Factsheet-2018-June.pdf
29. Fu, Ran, David J. Feldman, Robert M. Margolis, Michael A. Woodhouse, and Kristen B. Ardani. US solar photovoltaic system cost benchmark: Q1 2017. No. NREL/TP-6A20-68925. National Renewable Energy Lab. (NREL), Golden, CO, 2017.
30. Simon, Joe and Gail Mosey. Feasibility Study of Economics and Performance of Solar Photovoltaics at the Kerr McGee Site in Columbus, Mississippi. National Renewable Energy Lab. (NREL), January 2013. Accessed October 1, 2018. https://www.nrel.gov/docs/fy13osti/57251.pdf
31. Fu, Ran, David J. Feldman, Robert M. Margolis, Michael A. Woodhouse, and Kristen B. Ardani. US solar photovoltaic system cost benchmark: Q1 2017. No. NREL/TP-6A20-68925. National Renewable Energy Lab. (NREL), Golden, CO, 2017.
32. U.S. Department of Energy. Revolution… Now: The Future Arrives for Five Clean Energy Technologies – 2016 Update. Washington, D.C.: U.S. Department of Energy, September 2016. Accessed July 12, 2018. https://www.energy.gov/sites/prod/files/2016/09/f33/Revolutiona%CC%82%E2%82%ACNow%202016%20Report_2.pdf
33. Xcel Energy. “2016 Electric Resource Plan: 2017 All Source Solicitation 30-Day Report (Public Version).” Minneapolis, MN: Xcel Energy, December 28, 2017. Accessed August 7, 2018. https://assets.documentcloud.org/documents/4340162/Xcel-Solicitation-Report.pdf
34. Lazard. Lazard’s Levelized Cost of Energy Analysis – Version 11.0. Accessed August 7, 2018. https://www.lazard.com/media/450337/lazard-levelized-cost-of-energy-version-110.pdf
35. NRDC (National Resources Defense Council). Revolution Now. Accessed July 25, 2018. https://www.nrdc.org/revolution-now
36. Electric Power Research Institute. U.S. National Electrification Assessment. Electric Power Research In-stitute, April 2018.
37. U.S. Energy Information Administration. Annual Energy Outlook 2018: With Projections to 2050. U.S. EIA, February 2018. https://www.eia.gov/outlooks/aeo/pdf/AEO2018.pdf
38. Oregon Public Utility Commission Docket UM 1020. https://apps.puc.state.or.us/edockets/docket.asp?DocketID=8965

Biennial Energy Report Chapter 3 — Page 59
39. Jones, Todd and Noah Bucon. Corporate and Voluntary Renewable Energy in State Greenhouse Gas Poli-cy: An Air Regulator’s Guide. San Francisco, CA: Center for Resource Solutions, 2017.
40. Flatt, Courtney. “Google’s all-renewable energy plan to include data center in Oregon.” Oregon Public Broadcasting, December 6, 2016. https://www.opb.org/news/article/google-says-it-will-consume-only-renewable-energy/
41. Rogoway, Mike. “Massive solar projects will power Facebook’s Prineville data centers.” The Oregonian, July 18, 2018. https://www.oregonlive.com/silicon-forest/index.ssf/2018/07/massive_solar_projects_will_po.html
42. Bernton, Hal. “In quest for clean power, Microsoft wants to bypass Puget Sound Energy under new deal.” The Seattle Times, April 13, 2017. https://www.seattletimes.com/seattle-news/environment/microsoft-pse-reach-agreement-on-greener-energy/
43. State of Oregon Employment Department. Industry Profile Report for Data Processing, Hosting and Re-lated Services. 2018.
44. Oregon Department of Land Conservation and Development, Administrative Overview, December 2007. https://sos.oregon.gov/archives/Documents/recordsmgmt/sched/overview-land-conservation.pdf
45. Oregon Energy Facility Siting Council Jurisdiction. Specific size thresholds. https://www.oregon.gov/energy/facilities-safety/facilities/Pages/Council-Jurisdiction.aspx
46. ORS 469.310 47. Oregon Energy Facility Siting Public Guide. 2017. https://www.oregon.gov/energy/facilities-safety/
facilities/Documents/Fact-Sheets/EFSC-Public-Guide.pdf 48. Trainor, Anne M., Robert I. McDonald, and Joseph Fargione. "Energy sprawl is the largest driver of land
use change in United States." PloS one 11, no. 9 (2016): e0162269. 49. Thompson, Gary. Via email, Oct. 1, 2018. 50. Beyeler, Barry. Oral testimony to Joint Interim Committee on Department of Energy Oversight, May, 23,
2016. https://olis.leg.state.or.us/liz/2015I1/Committees/JCDEO/2016-05-26-08-00/RecordingLog 51. USBR (U.S. Bureau of Reclamation). “Federal Columbia River Power System Biological Opinion Hydrosys-
tem.” Accessed October 29, 2018. https://www.usbr.gov/pn/fcrps/hydro/index.html 52. USACE (U.S. Army Corps of Engineers). “Columbia River System Operations Overview: Managing a Com-
plex System.” Accessed October 29, 2018. http://www.crso.info/posters/Station_03-1_rev2%20-%20FINAL.pdf
53. U.S. Bureau of Reclamation, U.S. Army Corps of Engineers, and Bonneville Power Administration. (2001). The Columbia River System Inside Story. Second Edition. Portland, OR. Accessed October 29, 2018. https://www.bpa.gov/news/pubs/GeneralPublications/edu-The-Federal-Columbia-River-Power-System-Inside-Story.pdf
54. U.S. Army Corps of Engineers. Final 2018 Fish Passage Plan, Chapter 1 – Overview. Accessed October 29, 2018. http://pweb.crohms.org/tmt/documents/fpp/2018/
55. Bonneville Power Administration. (2010). Hydropower: How the Federal Columbia River Power System works for you. Portland, OR. Accessed October 29, 2018. https://www.bpa.gov/news/pubs/GeneralPublications/fcrps-Hydropower.pdf
56. National Wildlife Federation, et al. v. National Marine Fisheries Service, et al., Case No. 17-35462 (9th Cir. April 2, 2018). Accessed October 29, 2018. http://cdn.ca9.uscourts.gov/datastore/opinions/2018/04/02/17-35462.pdf
57. Chang, Judy W., Mariko Geronimo Aydin, Johannes Pfeifenberger, Kathleen Spees, and John Imon Pedtke. Advancing Past “Baseload” to a Flexible Grid: How Grid Planners and Power Markets are Better Defining System Needs to Achieve a Cost-Effective and Reliable Supply Mix. The Brattle Group, June 2017. https://www.eenews.net/assets/2017/06/26/document_gw_02.pdf
Biennial Energy Report Chapter 3 — Page 60
58. CAISO (California Independent System Operator). “Managing Oversupply.” Accessed September 10, 2018. http://www.caiso.com/informed/Pages/ManagingOversupply.aspx
59. Bonneville Power Administration. “Daily OMP Retrospective Report.” April-May, 2018. Accessed Sep-tember 10, 2018. https://www.bpa.gov/Projects/Initiatives/Oversupply/Pages/Retrospective-Reports-2018.aspx
60. Northwest Power and Conservation Council. “Demand Response Advisory Committee.” Accessed Sep-tember 18, 2018. https://nwcouncil.org/energy/energy-advisory-committees/demand-response-advisory-committee
61. PJM. Demand Response Fact Sheet. April 11, 2017. https://learn.pjm.com/three-priorities/buying-and-selling-energy/markets-faqs/~/media/BD49AF2D60314BECA9FAAB4026E12B1A.ashx (Accessed Sep-tember 18, 2018)
62. Pacific Northwest Smart Grid Demonstration Project. Technology Performance Report: Highlights. June 2015. Accessed September 18, 2018. https://www.pnwsmartgrid.org/docs/PNW_SGDP_AnnualReport.pdf
63. Bloomberg New Energy Finance. https://about.bnef.com/blog/lithium-ion-battery-costs-squeezed-margins-new-business-models/. July 10, 2017. Accessed September 18, 2018.
64. Oregon Public Utility Commission. “Portland General Electric Company Draft Storage Potential Evalua-tion.” Docket UM 1856. Order Number 18-290. August 13, 2018. https://apps.puc.state.or.us/orders/2018ords/18-290.pdf
65. Oregon Public Utility Commission. “PacifiCorp Draft Storage Potential Evaluation. Docket UM 1857. Or-der No. 18-327. September 4, 2018. https://apps.puc.state.or.us/orders/2018ords/18-327.pdf
66. Frankfurt School-UNEP, Bloomberg New Energy Finance. Global Trends in Renewable Energy Invest-ments 2018. https://europa.eu/capacity4dev/file/71900/download?token=57xpTJ4W
67. National Renewable Energy Laboratory. “Q4 2017/Q1/2018 Solar Industry Update.” May 2018. https://www.nrel.gov/docs/fy18osti/71493.pdf
68. Bade, Gavin. “NV Energy 2.3-cent solar contract could set new price record.” Utility Dive, June 13, 2018. https://www.utilitydive.com/news/nv-energy-23-cent-solar-contract-could-set-new-price-record/525610/
69. Foehringer Merchant, Emma . “Arizona Water Provider Approves Record-Low-Cost Solar PPA to Re-place Coal.” Greentech Media, June 8, 2018. https://www.greentechmedia.com/articles/read/arizona-water-provider-approves-lower-cost-solar-ppa-to-replace-coal#gs.FCi3gOo
70. ODOE, SolarWorld USA. Archived 2010 SolarWorld Sunmodule Plus Mono datasheet and SolarWorld Sunmodule Plus 290-300 mono cut sheet. Accessed August 23, 2018. http://www.solarworld-usa.com/technical-downloads/datasheets
71. NREL. PV Watts Online Calculator, default settings, Portland, Astoria and Newport weather files. Ac-cessed August 2, 2018. https://pvwatts.nrel.gov/
72. ODOE. Residential Energy Tax Credit Program Data 73. Fraunhofer Institute for Solar Energy Systems, Net installed electrical capacity in Germany. Accessed
August 2, 2018 https://www.energy-charts.de/power_inst.htm 74. Solar Energy Industries Association. Oregon Solar. Accessed October 12, 2018. https://www.seia.org/
state-solar-policy/oregon-solar 75. Solar Energy Industries Association. Solar State by State. Accessed October 12, 2018. https://
www.seia.org/states-map 76. US Solar Market Insight Full Report 2017 Year in Review; Wood Mackenzie https://
www.greentechmedia.com/research/report/us-solar-market-insight-2017-year-in-review#gs.KXtkGEk 77. Energy Trust of Oregon. Nonresidential program data. Provided on September, 13 2018 by Energy Trust
of Oregon.
Biennial Energy Report Chapter 3 — Page 61
78. ODOE. Small-Scale Community Based Renewables Database 2018 – data provided to ODOE by PGE and PacifiCorp in February, 2018.
79. Foehringer Merchant, Emma . “Cypress Creek Halts 1.5GW of Solar Development Due to Tariffs, Seeks Module Exemption”. Greentech Media, May 14, 2018. https://www.greentechmedia.com/articles/read/cypress-creek-halts-1-5-gw-solar-development-tariffs-exemption?mc_cid=d25bf43737&mc_eid=540ccc15ab#gs.KJEhp48
80. Groom, Nichola. “Billions in U.S. solar projects shelved after Trump panel tariff”. Reuters, June 6, 2018. https://www.reuters.com/article/us-trump-effect-solar-insight/billions-in-u-s-solar-projects-shelved-after-trump-panel-tariff-idUSKCN1J30CT
81. Solar Energy Industries Association. Community solar program information. https://www.seia.org/initiatives/community-solar. Accessed October 29, 2018.
82. Feldman, David, Brockway, Anna M., Ulrich, Elaine Ulrich, and Margolis, Robert. “Shared Solar: Current Landscape, Market Potential, and the Impact of Federal Securities Regulation.” Technical Report NREL/TP-6A20-63892, National Renewable Energy Laboratory, April 2015. https://www.nrel.gov/docs/fy15osti/63892.pdf
83. Oregon Public Utility Commission. “Investigation to Determine Resource Value of Solar. “ Docket UM 1716. https://apps.puc.state.or.us/edockets/docket.asp?DocketID=19362. Successor dockets for indi-vidual utilities: UM 1910 (PacifiCorp) https://apps.puc.state.or.us/edockets/docket.asp?DocketID=21118. UM 1911 (Idaho Power Company) https://apps.puc.state.or.us/edockets/docket.asp?DocketID=21120. UM 1912 (Portland General Electric) https://apps.puc.state.or.us/edockets/docket.asp?DocketID=21140
84. Perez, Richard, Norris, Benjamin L and Hoff, Thomas E. “The Value of Distributed Solar Electric Genera-tion to New Jersey and Pennsylvania”. Mid Atlantic Solar Energy Industries Association, November 2012. http://mseia.net/site/wp-content/uploads/2012/05/MSEIA-Final-Benefits-of-Solar-Report-2012-11-01.pdf
85. Oregon Public Utility Commission. “HB 2941 Solar Incentives: Report to the Legislative Assembly.” Octo-ber 28, 2016. https://www.puc.state.or.us/electric_gas/2016%20HB%202941%20Solar%20Incentives%20Report.pdf
86. Ong, Sean, Paul Denholm, and Nathan Clark. “Grid parity for residential photovoltaics in the United States: Key drivers and sensitivities.” Tech. Rep. NREL Report No. CP-6A20-54527, National Renewable Energy Laboratory, 2012. https://www.nrel.gov/docs/fy12osti/54527.pdf
87. Portland General Electric. “SCHEDULE 201 QUALIFYING FACILITY 10 MW or LESS AVOIDED COST POWER PURCHASE INFORMATION.” Accessed October 4, 2018. https://www.portlandgeneral.com/-/media/public/business/power-choices-pricing/documents/business-sched-201.pdf?la=en
88. Idaho Public Utilities Commission. FERC CIVIL COMPLAINT 1:18-CV-00236. http://www.puc.idaho.gov/fileroom/cases/summary/DISE1801.html
89. LIHI (Low Impact Hydropower Institute). “LIHI Fact Sheet.” February 2018. Accessed October 19, 2018. https://lowimpacthydro.org/wp-content/uploads/2018/05/2018LIHIFactSheet.pdf
90. Oregon Public Utility Commission, Order Number 17-386. October 9, 2017. https://apps.puc.state.or.us/orders/2017ords/17-386.pdf
91. Oregon Laws 2015, Chapter 312 (House Bill 2193 (2015)). https://olis.leg.state.or.us/liz/2015R1/Downloads/MeasureDocument/HB2193/Enrolled
92. Oregon Laws 2016, Chapter 28 (Senate Bill 1547 (2016)). https://olis.leg.state.or.us/liz/2016R1/Downloads/MeasureDocument/SB1547/Enrolled
93. Oregon Public Utility Commission. Staff Report, September 27, 2016 Public Meeting. https://edocs.puc.state.or.us/efdocs/HAU/um1432hau143246.pdf
94. ORS 469A.025 and 469A.210. https://www.oregonlegislature.gov/bills_laws/ors/ors469A.html

Biennial Energy Report Chapter 3 — Page 62
95. Oregon Public Utility Commission. “Small Scale Community Based Renewable Energy Projects.” Docket AR 622. https://apps.puc.state.or.us/edockets/docket.asp?DocketID=21555
96. ORS 279C.527-.528. https://www.oregonlegislature.gov/bills_laws/ors/ors279C.html 97. Oregon Laws 1999, Chapter 865 (Senate Bill 1149 (1999)) https://www.oregonlegislature.gov/bills_laws/
lawsstatutes/1999orLaw0865.html 98. Oregon Public Utility Commission. “Portland General Electric Green Tariff Filing.” Docket UM 1953.
https://apps.puc.state.or.us/edockets/docket.asp?DocketID=21421 99. Oregon Laws 2007, Chapter 843 (House Bill 3201 (2007)). https://olis.leg.state.or.us/liz/2007R1/
Measures/Overview/HB3201 100. ORS 757 https://www.oregonlegislature.gov/bills_laws/ors/ors757.html 101. Oregon Department of Energy. Renewable Energy Development Grant Program. https://
www.oregon.gov/energy/Incentives/Pages/Renewable-Energy-Grants.aspx. Accessed October 31, 2018. 102. ORS 285C.600-.635 https://www.oregonlegislature.gov/bills_laws/ors/ors285C.html 103. Energy Trust of Oregon. “Solar Status Update.” https://insider.energytrust.org/wp-content/uploads/
solar_status_report.pdf. Accessed October 31, 2018. 104. Oregon Laws 2015, Chapter 571 (House Bill 3492 (2015)). https://www.oregonlegislature.gov/
bills_laws/lawsstatutes/2015orLaw0571.pdf
Additional References
1. Homer, Juliet, Alan Cooke, Lisa Schwartz, Greg Leventis, Francisco Flores-Espino, and Michael Codding-ton. State Engagement in Electric Distribution System Planning. U.S. Department of Energy, December 2017. Accessed August 17, 2018: https://emp.lbl.gov/sites/default/files/state_engagement_in_dsp_final_rev2.pdf
2. Kihm, Steve, Ron Lehr, Sonia Aggarwal, and Edward Burgess. "You Get What You Pay For: Moving To-ward Value in Utility Compensation: Part One–Revenue and Profit." America’s Power Plan (2015).
3. Logan, Jeffrey S., Owen R. Zinaman, David Littell, Camille Kadoch, Phil Baker, Ranjit Bharvirkar, Max Dupuy et al. Next-Generation Performance-Based Regulation: Emphasizing Utility Performance to Un-leash Power Sector Innovation. No. NREL/TP-6A50-68512. National Renewable Energy Lab. (NREL), Golden, CO (United States), 2017.
4. NERC (North American Electric Reliability Corporation). Distributed Energy Resources: Connection Mod-eling and Reliability Considerations. February 2017. https://www.nerc.com/comm/Other/essntlrlbltysrvcstskfrcDL/Distributed_Energy_Resources_Report.pdf
5. NWPCC (Northwest Power and Conservation Council). Seventh Northwest Conservation and Electric Power Plan. Document 2016-02. February 25, 2016.
6. NYPSC (State of New York Public Service Commission). "Case 14-M-0101–Proceeding on Motion of the Commission in Regard to Reforming the Energy Vision." Order Adopting a Ratemaking and Utility Reve-nue Model Policy Framework (2016). Accessed August 13, 2018. file:///C:/Users/rsmith/Downloads/%7BD6EC8F0B-6141-4A82-A857-B79CF0A71BF0%7D.pdf
7. OPUC (Oregon Public Utility Commission). 2014 Oregon Utility Statistics. Salem, OR: Oregon Public Utili-ty Commission. Accessed July 17, 2018. https://www.puc.state.or.us/docs/statbook2014WEB.pdf
8. OPUC. Investigation into the Effectiveness of Solar Programs in Oregon. Salem, OR: Oregon Public Utility Commission. July 1, 2014. Accessed August 15, 2018. https://edocs.puc.state.or.us/efdocs/HAA/um1716haa101213.pdf
9. OPUC. Oregon Electric Industry Restructuring Status Report: Number of Participating Customers as of June 2016. Accessed August 14, 2018. https://www.puc.state.or.us/electric_restruc/statrpt/2016/

Biennial Energy Report Chapter 3 — Page 63
June_2016_Status_Report.pdf 10. OPUC. HB 2941 Solar Incentives Report: Report to the Legislative Assembly. October 28, 2016. Accessed
August 15, 2018. https://www.puc.state.or.us/electric_gas/2016%20HB%202941%20Solar%20Incentives%20Report.pdf
11. Pacific Power. “RE: SB 978 Process – Closing Comments.” Received by Public Utility Commission of Ore-gon, 10 July 2018, Salem, Oregon. Accessed August 13, 2018. https://www.puc.state.or.us/Renewable%20Energy/SB978-PAC-Comments.pdf
12. PGE (Portland General Electric). “RE: Senate Bill 978 - Closing Comments.” Received by Public Utility Commission of Oregon, 10 July 2018, Salem, Oregon. Accessed August 13, 2018. https://www.puc.state.or.us/Renewable%20Energy/SB978-PGE-Comments.pdf
13. Stanfield, Sky, Stephanie Safidi, and Sara Baldwin Auck. Optimizing the Grid: A Regulator’s Guide to Hosting Capacity Analyses for Distributed Energy Resources. International Renewable Energy Council, December 2017. Accessed August 17, 2018. https://irecusa.org/2017/12/tools-to-build-the-modern-grid/