Embed Size (px)
Citation preview

Supporting Syria and the region:
Post-Brussels conference
financial tracking
Report Three July 2017
SUPPORTING SYRIA AND THE REGION POST-BRUSSELS CONFERENCE FINANCIAL TRACKING: REPORT THREE
1. Overview 3
2. Progress by recipient 4
3. In focus: Contributions to Jordan, Lebanon, Turkey and Syria 7
4. Progress by donor 9
5. Contributions by sector 12
6. Contributions by channel of delivery 13
7. UN-coordinated appeals 14
8. Glossary 15
9. Data sources and methodology 17
10. Form used for data collection 18
Endnotes 20
ContentsOn 5 April 2017, representatives of over 70 countries, international organisations and Syrian civil society came together in Brussels for the Supporting the Future of Syria and the Region Conference (Brussels conference) to build on momentum from the previous year’s London conference and mobilise funding for responding to the needs of the people affected by the Syria crisis. The EU institutions, Germany, Kuwait, Norway, Qatar, the United Kingdom (UK) and the United Nations (UN) co-chaired this fifth pledging conference for Syria and the region. Multi-year pledges were made for the 2017–2020 period and amounted to almost US$10 billion in grants, including US$6 billion for 2017 alone. International financial institutions and donors also announced almost US$30 billion in loans.
This report summarises progress against pledges made by donors at the Brussels conference to respond to needs in Syria and in the neighbouring refugee-hosting countries – Jordan, Lebanon, Turkey, Iraq and Egypt. This is the third report in a series which tracks financial contributions against pledges made in 2016 and 2017 in response to the Syrian crisis.
This report presents an overview of the pledges made in April at the Brussels conference and a breakdown of grant and loan contributions to date. Information was gathered directly from donors, and supplemented by Brussels conference documentation and data from the UN Office for the Coordination of Humanitarian Affairs (OCHA)’s Financial Tracking Service (FTS). A glossary of the terms used throughout is given at the end of the report, as are details of the data sources and methodology employed.
2

SUPPORTING SYRIA AND THE REGION POST-BRUSSELS CONFERENCE FINANCIAL TRACKING: REPORT THREE
1. Overview
1. Overview
FIGURE 1.1: Funding contributed against funding pledged, a) grants 2017, b) grants 2018–2020, c) loans 2017–2020
US$2.5 billion. From data available, at least US$564 million of these contributions are concessional in nature. However, full details on the terms of concessionality of specific loans are not yet available.4
Donors pledged US$9.7 billion in grants at the Brussels conference for the four-year period 2017–2020: US$6.0 billion for 2017 and US$3.7 billion for the following three years.1 By mid-2017, almost 74% of the pledge total for the year had been met,2 with contributions of US$4.4 billion. Therefore, contributions remain US$1.5 billion short of the pledges made at the Brussels conference in April 2017. A further US$1.4 billion has been contributed for the upcoming three years, representing more than a third of those forward-looking pledges.
Combined, this means that three months on from the Brussels conference, 60% of grant pledges for the 2017–2020 period have been met, with contributions of US$5.8 billion.3 As some donor budget allocations are yet to be finalised and some may have different reporting cycles, further details on planned contributions for 2017 and beyond are yet to be made available.
In terms of loans, US$30 billion was pledged at the Brussels conference for the 2017–2020 period, of which US$2.3 billion is on concessional terms. The data available so far show that donors have made available 8% of the total loans pledged, amounting to
Source: Development Initiatives based on data provided bilaterally by donors in 2017, and the ‘Co-chair’s declaration annex: fundraising’ and UN OCHA’s FTS. Data downloaded 3 July 2017.
Note: Pledges represent those reported at the time of the Brussels conference and do not include subsequent revisions or additions. Total pledges may differ from the sum of pledges when disaggregated by recipient country. Where available, figures provided directly to Development Initiatives were used for calculating contributions; otherwise, FTS data has been used. The pledges reported in original currencies have been converted to US$ using the UN’s Operational Rates as of 1 April 2017. Contributions reported in original currencies have been converted to US$ using a 2017 average of the UN’s Operational Rates. Contributions refer to the sum of all funds reported as committed, contracted and disbursed – see glossary. Contributions for 2018–2020 are based on data provided by donors in 2017 on contributions known at that time. Data is partial and preliminary.
US$
BIL
LIO
NS
PledgedContributions
6.0 3.7
30.0
4.41.4
2.5
0
5
10
15
20
25
30
35
Grants 2017 Grants 2018−2020 Loans 2017−2020
3

SUPPORTING SYRIA AND THE REGION POST-BRUSSELS CONFERENCE FINANCIAL TRACKING: REPORT THREE
2. Progress by recipient country
2. Progress by recipient country
FIGURE 2.1: Grant contributions against pledges by recipient country, 2017
Source: Development Initiatives based on data provided bilaterally by donors in 2017 and UN OCHA FTS. Data downloaded 3 July 2017.
Notes: Data is partial and preliminary. ‘Not defined’ includes a portion of funding where data by recipient country was not specified bilaterally by donors. Where contributions to a country exceed original pledges, this may be because of a lack of country-specific pledges at the time of the conference or a lack of disaggregated pledge data reported as part of this exercise.
1,148
719
443
323219
12
482
87
2,528
793 386
329
212
95 72
21 5.4 245
228
188 135
107 6.3 41 29 5.8
139
514
306 278 183 21 16 18
39
1,178 1,128
823
626
385 33 142
43 57
0
500
1,000
1,500
2,000
2,500
3,000
Turkey Syria Lebanon Jordan Iraq Egypt Region Multi-country
Notdefined
US
$ M
ILLI
ON
S
See fig 2.3 Syria TWODisbursed, Contracted and Committed reversed as in Syria TWO?
PledgedCommittedContractedDisbursed
Grant contributions reported by donors in the first half of 2017 totalled US$4.4 billion. Nearly three-quarters (71%) of contributions were for Turkey, Syria and Lebanon combined. Over a quarter (27%) was directed to the response in Turkey alone (US$1.2 billion).
So far in 2017, Syria has received grants amounting to over US$1.1 billion, Lebanon has received US$823 million and Jordan
has received US$626 million. The remaining country-allocated contributions were delivered to Iraq (US$385 million) and Egypt (US$33 million). A further 5% of contributions (US$242 million) were not allocated by country, and of these US$142 million was directed towards the regional response.
4

SUPPORTING SYRIA AND THE REGION POST-BRUSSELS CONFERENCE FINANCIAL TRACKING: REPORT THREE
2. Progress by recipient country
0
500
1,000
1,500
2,000
2,500
US
$ M
ILLI
ON
S
760
275 169 148
81 75 25
2,191
44
266
52 117 66 65
51 5.8 16 126 107 174 16
265
3.8
60
391 160 291 82
330
51 10
Region Jordan Turkey Lebanon Iraq Syria Multi-country Not defined
PledgedCommittedContracted
FIGURE 2.2: Grant contributions against pledges by recipient country, 2018-2020
Sources: Development Initiatives based on data provided bilaterally by donors in 2017.
Notes: Data is partial and preliminary. ‘Not defined’ includes a portion of funding where data by recipient country was not specified bilaterally by donors.
So far, donors have contributed US$1.4 billion in grants for the 2018–2020 period.
Over a quarter (28%) of these forward-looking contributions have been directed towards the response in Jordan (US$391 million). Of this 2018–2020 total, 24% has been contributed to Syria (US$330 million); 21% to Lebanon (US$291 million); 12% to Turkey (US$160 million) and 6% to Iraq (US$82 million). A further 9% has been contributed but without specifying the
recipient (US$121 million), of which US$60 million was for the regional response.
Where contributions to a country exceed original pledges, this again may be due to a lack of disaggregated pledge data or the original pledge not specifying a destination country. While some donors may have made allocations specifically for 2018, the majority of funds are so far only confirmed for the 2018–2020 window with the year(s) not specified.
5

SUPPORTING SYRIA AND THE REGION POST-BRUSSELS CONFERENCE FINANCIAL TRACKING: REPORT THREE
2. Progress by recipient country
FIGURE 2.3: Loan contributions against pledges by recipient country, 2017-2020
Source: Development Initiatives based on data provided bilaterally by donors in 2017.
Note: Contributions refers to 2017 only, data is not yet available for the 2018–2020 period.
27 21
20,889
445 19 374 660 995
21
465
0
5,000
10,000
15,000
20,000
25,000
Region Jordan Lebanon Turkey Egypt Notdefined
9,023
US
$ M
ILLI
ON
S
PledgedCommittedContractedDisbursed
21 27
20,889
21 215 292 1 465 780 178 368
195
0
5,000
10,000
15,000
20,000
25,000
Egypt Turkey Lebanon Jordan Region Notdefined
US
$ M
ILLI
ON
S
9,023
PledgedConcessional contributionsNon-concessional contributionsUnspecified contributions
995 660374
A total of US$30 billion in loans to refugee-hosting countries in the region was pledged at the Brussels conference for the period 2017–2020. Most of these pledges (70%, US$20.9 billion) do not yet specify a country.
Donors have so far contributed US$2.5 billion in loans in 2017, of which Turkey was the largest recipient (US$995 million) receiving 40% of loan contributions, followed by Lebanon (US$660 million), Jordan (US$374 million) and Egypt (US$21 million). A further US$465 million has been made available by donors, but the recipients are yet to be defined. No loan contributions have been reported for Syria or Iraq.
According to available data, 22% of the loans contributed so far in 2017 were made on a concessional basis (US$564 million). A further 38% were made on non-concessional terms (US$958 million) and the terms and levels of concessionality of the remaining loans (US$994 million) are not yet specified.
FIGURE 2.4: Loan contributions by recipient, by loan concessionality, 2017-2020
Source: Development Initiatives based on data provided bilaterally by donors in 2017.
Note: Contributions refers to 2017 only, data is not yet available for the 2018–2020 period.
6

SUPPORTING SYRIA AND THE REGION POST-BRUSSELS CONFERENCE FINANCIAL TRACKING: REPORT THREE
3. In focus: Donors’ contributions to Jordan, Lebanon and Turkey
3. In focus: Donors’ contributions to Jordan, Lebanon and Turkey
Total contributions to Jordan so far in 2017 reached US$1.0 billion; US$626 million in grants (63%) and US$374 million in loans (37%). The loans were contributed by four donors, the European Bank for Reconstruction and Development (EBRD), Italy, the World Bank and the European Investment Bank (EIB).
Donor contributions to Lebanon amount to US$1.5 billion so far in 2017; of which the majority is in the form of grants (US$823 million, 55%), and US$660 million is in the form of loans (45%).
US$
MIL
LIO
NS
216
12 101
60
2.8 49 48
43 19
21 15
10 7.5
4.7 4.3
3.2 2.5
2.0 1.9
1.8 0.3 0.3
0.2 0.1
178
50
0.7 0
50
100
150
200
250GrantsLoans
Ger
man
y
EB
RD
Ital
y
US
UK
Wo
rld
Ban
k
EU
inst
itut
ions
Can
ada
Jap
an
Net
herl
and
s
No
rway
Aus
tral
ia
Swit
zerl
and
UA
E
Fran
ce
Bel
giu
m
Cze
ch R
epub
lic
Aus
tria
Spai
n
Irel
and
Den
mar
k
EIB
Slo
veni
a
Finl
and
Est
oni
a
Chi
na
145
Wo
rld
Ban
k
EIB
Ger
man
y
EU
inst
itut
ions UK
US
Ital
y
Can
ada
No
rway
Net
herl
and
s
Jap
an
Aus
tral
ia
Swit
zerl
and
Fran
ce
Bel
giu
m
Irel
and
Spai
n
Hun
gar
y
Chi
na
Den
mar
k
Finl
and
Cze
ch R
epub
lic
Icel
and
Est
oni
a
Slo
veni
a0
50
100
150
200
250
300
350
289
167
100 84
20 40 32
25 18
12 12
8.4 5.4
2.9 1.9
1.6 1.1
1.1 0.5
0.5 0.2
0.2 0.1
320 292
48
GrantsLoans
US$
MIL
LIO
NS
FIGURE 3.1: Grant and loan contributions to Jordan, by donor, 2017
FIGURE 3.2: Grant and loan contributions to Lebanon, by donor, 2017
Source: Development Initiatives based on data provided bilaterally by donors in 2017 and UN OCHA FTS. Data downloaded 3 July 2017.
Notes: UAE: United Arab Emirates; UK: United Kingdom; US: United States.
Source: Development Initiatives based on data provided bilaterally by donors in 2017 and UN OCHA FTS. Data downloaded 3 July 2017.
7

SUPPORTING SYRIA AND THE REGION POST-BRUSSELS CONFERENCE FINANCIAL TRACKING: REPORT THREE
Donors have provided US$2.2 billion to Turkey so far in 2017; most of this funding (54%) was provided in the form of grants (US$1.2 billion), with EU institutions providing almost half (US$573 million). Turkey has received a further US$995 million in loans so far in 2017, 69% of which came from the World Bank (US$683 million).
Donors have provided a combined total of US$1.1 billion in contributions to the response in Syria by mid-2017. Germany has provided the most, at US$319 million, representing over a quarter of total contributions (28%), followed by the US (US$169 million, 15%) and the UK (US$133 million, 12%). Based on available data, no loans have so far been pledged or reported to Syria for 2017 or for the upcoming 2018–2020 period.
US$
MIL
LIO
NS
GrantsLoans
153
573
156 120
90 22
18 13
12 7.8
2.8 2.5
2.5 1.9
1.7 0.8
0.6 0.4
0.2 0.1
683
215
97
0
100
200
300
400
500
600
700
800
900
Wo
rld
Ban
k
EU
inst
itut
ions EIB UK
Ger
man
y
EB
RD US
Aus
tria
Jap
an
Finl
and
Den
mar
k
Bel
giu
m
Bul
gar
ia
Hun
gar
y
Lith
uani
a
Can
ada
Fran
ce
Slo
veni
a
Swit
zerl
and
Irel
and
Chi
na
Est
oni
a
US$
MIL
LIO
NS
Ger
man
y
US
UK
EU
inst
itut
ions
No
rway
Jap
an
Can
ada
Swed
en
Swit
zerl
and
Net
herl
and
s
Qat
ar
Aus
tral
ia
Ital
y
Bel
giu
m
Fran
ce
Hun
gar
y
Finl
and
Kuw
ait
Spai
n
Aus
tria
Den
mar
k
Cze
ch R
epub
lic
Chi
na
Irel
and
Icel
and
Latv
ia
Bul
gar
ia
Mal
ta
Est
oni
a
Slo
veni
a
Lith
uani
a
319
169 133
103 79
77 50
45 32
25 23
11 10
9.8 7.7 7.5
7.3 6.0
4.3 3.4
2.8 1.2
0.5 0.4
0.3 0.1
0.1 0.1
0.1 0.04
0.02 0
50
100
150
200
250
300
350
FIGURE 3.3: Grant and loan contributions to Turkey, by donor, 2017
Source: Development Initiatives based on data provided bilaterally by donors in 2017 and UN OCHA FTS. Data downloaded 3 July 2017.
Source: Development Initiatives based on data provided bilaterally by donors in 2017 and UN OCHA FTS. Data downloaded 3 July 2017.
FIGURE 3.4: Grant contributions to Syria, by donor, 2017
3. In focus: Donors’ contributions to Jordan, Lebanon and Turkey
8

SUPPORTING SYRIA AND THE REGION POST-BRUSSELS CONFERENCE FINANCIAL TRACKING: REPORT THREE
4. Progress by donor
4. Progress by donor
FIGURE 4.1: Grant contributions against pledges by donor, 2017
Germany
EU institutions
UK
US
Canada
Norway
Japan
Netherlands
World Bank
Kuwait
Qatar
France
Sweden
UAE
Switzerland
Denmark
Italy
Australia
Belgium
Finland
China
EBRD
Ireland
Austria
Portugal
Korea
Hungary
Luxembourg
Spain
Poland
Slovakia
Bulgaria
Lithuania
Estonia
Iceland
Liechtenstein
Croatia
Romania
Latvia
Malta
Cyprus
Slovenia
NGO Consortium
Czech Republic
1,394
1,369
626
566
274
269
260
171
150
100
100
81
73
68
66
62
50
40
38
38
29
27
26
18
14
10
8.1
8.3
8.0
5.4
3.0
794
646
147
6.7
159
2.5
38
50
3.1
24
28
0.4
24
12
3.8
4.6
6.9
367
143
364
33
38
1.3
0.3
1.9
1.9
4.3
2.8
101
69
566
183
266
58
25
23
26
45
7.6
29
25
36
12
4.0
12
5.9
3.6
1.6
0 200 400 600 800 1,000 1,200 1,400 1,600US$ MILLIONS
2.8
2.5
2.2
2.2
0.1
0.4
0.2
0.2
0.1 0.1
0.2
0.01
0.1 0.1
0.1
0.03 0.3 0.3
1.2
1.4
1.7
2.5
0.6
0.6
0.9 1.0
Sources: Development Initiatives based on data provided bilaterally by donors in 2017, the ‘Co-chair’s declaration annex: fundraising’ and UN OCHA FTS. Data downloaded 3 July 2017.
Notes: Contributions from Switzerland include all planned disbursements for 2017. Contributions from Denmark5 include a US$7 million disbursement due to be disbursed in July 2017. The World Bank and the EBRD did not pledge any grants at the Brussels conference but are included in this chart as they subsequently made grant contributions. Where data was unavailable from donors, the FTS voluntary reporting mechanism was used. FTS data primarily captures humanitarian funding and more funding may have been contributed to the region that is not recorded on FTS. FTS data is used for China, France, Kuwait, Malta, Qatar and UAE. Australia has met its 2017 pledge; this is not visible in the chart due to exchange rate conversion to US$.
PledgedCommittedContractedDisbursed
9
SUPPORTING SYRIA AND THE REGION POST-BRUSSELS CONFERENCE FINANCIAL TRACKING: REPORT THREE
4. Progress by donor
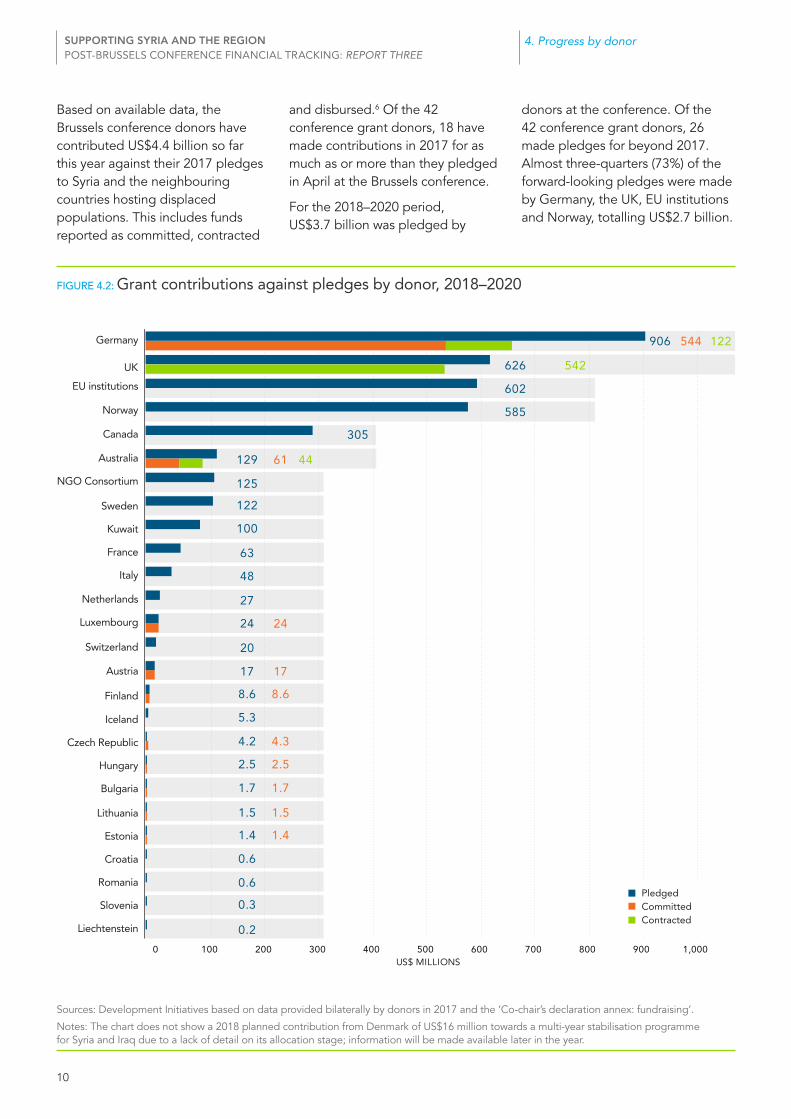
FIGURE 4.2: Grant contributions against pledges by donor, 2018–2020
Sources: Development Initiatives based on data provided bilaterally by donors in 2017 and the ‘Co-chair’s declaration annex: fundraising’.
Notes: The chart does not show a 2018 planned contribution from Denmark of US$16 million towards a multi-year stabilisation programme for Syria and Iraq due to a lack of detail on its allocation stage; information will be made available later in the year.
US$ MILLIONS
906
626
602
585
305
129
125
122
100
63
48
27
24
20
17
8.6
5.3
4.2
2.5
1.7
1.5
1.4
0.6
0.6
0.3
0.2
544
61
24
17
8.6
4.3
2.5
1.7
1.5
1.4
122
542
44
0 100 200 300 400 500 600 700 800 900 1,000
Germany
UK
EU institutions
Norway
Canada
Australia
NGO Consortium
Sweden
Kuwait
France
Italy
Netherlands
Luxembourg
Switzerland
Austria
Finland
Iceland
Czech Republic
Hungary
Bulgaria
Lithuania
Estonia
Croatia
Romania
Slovenia
Liechtenstein
Based on available data, the Brussels conference donors have contributed US$4.4 billion so far this year against their 2017 pledges to Syria and the neighbouring countries hosting displaced populations. This includes funds reported as committed, contracted
and disbursed.6 Of the 42 conference grant donors, 18 have made contributions in 2017 for as much as or more than they pledged in April at the Brussels conference.
For the 2018–2020 period, US$3.7 billion was pledged by
donors at the conference. Of the 42 conference grant donors, 26 made pledges for beyond 2017. Almost three-quarters (73%) of the forward-looking pledges were made by Germany, the UK, EU institutions and Norway, totalling US$2.7 billion.
PledgedCommitted Contracted
10

SUPPORTING SYRIA AND THE REGION POST-BRUSSELS CONFERENCE FINANCIAL TRACKING: REPORT THREE
4. Progress by donor
Of the loan contributions so far, 92% (US$2.3 billion) have been reported by multilateral development banks. The remaining 8% was reported by Italy.
The World Bank has contributed the largest volume of loans so far for the period, providing US$1.1 billion (42% of total contributions). It is possible that more loans have been contributed, but not yet reported.
Of the US$30.0 billion in loans pledged at the Brussels conference, US$2.3 billion was pledged on concessional terms. Full details of pledged and contributed loans from the multilateral development banks, including their degree of concessionality and timeframes, are still to be finalised.
Based on data available so far on contributions, the World Bank has provided the largest volume of concessional loans; committing US$370 million, followed by Italy, who has committed US$194 million in concessional loans.
529
276
1,053
194
19
14,501
8,056
875
248
0 2,000 4,000 6,000 8,000 10,000 12,000 14,000 16,000
EIB
EBRD
WorldBank
Italy
US$ MILLIONS
445
PledgedCommittedContractedDisbursed
14,501
8,056
875
248
994
276
683 370
194
0 2,000 4,000 6,000 8,000 10,000 12,000 14,000 16,000
EIB
EBRD
WorldBank
Italy
PledgedConcessional contributionsNon-concessional contributionsUnspecified contributions
US$ MILLIONS
Sources: Development Initiatives based on data provided bilaterally by donors in 2017 and the ‘Co-chair’s declaration annex: fundraising’
Notes: Pledge data is taken from the conference annex. Some Brussels conference loan pledges may include a portion of those made at the London conference. Contributions refer to 2017 only; no contributions data is yet available for the 2018–2020 period. Contributions from the World Bank only capture commitments made in 2017.7 The pledged amounts for EBRD refer to countries of operation that have experienced refugee influx; committed amounts refer directly to EBRD Refugee Response. The chart only includes donors that have reported contributions and does not include all donors who have made loan pledges at the Brussels conference.
FIGURE 4.3: Loan contributions against pledges by donor, 2017-2020
FIGURE 4.4: Loan contributions against pledges by donor, by loan concessionality, 2017–2020
Source: Development Initiatives based on data provided bilaterally by donors in 2017 and the ‘Co-chair’s declaration annex: fundraising’.
Notes: Pledge data is taken from the conference annex. Some Brussels conference loan pledges may include a portion of those made at the London conference. Contributions refer to 2017 only; no contributions data is yet available for the 2018–2020 period. Contributions from the World Bank only capture commitments made in 2017.8 The pledged amounts for EBRD refer to countries of operation that have experienced refugee influx; committed amounts refer directly to EBRD Refugee Response. The chart only includes donors that have reported contributions and does not include all donors who have made loan pledges at the Brussels conference.
11

SUPPORTING SYRIA AND THE REGION POST-BRUSSELS CONFERENCE FINANCIAL TRACKING: REPORT THREE
5. Contributions by sector
5. Contributions by sector
Economic recovery and infrastructure (including agriculture, mine action and livelihoods) 3%
36% Macro and fiscal management
23% Social, urban, rural and resilience
11% Finance and markets Energy and extractives 9%
Health 7%
Not yet specified 3%
Transport and information and communication technologies 7%
Economic recovery and infrastructure (including agriculture, mine action and livelihoods) 3%
36% Macro and fiscal management
23% Social, urban, rural
and resilience
11% Finance and markets Energy and extractives 9%
Health 7%
Not yet specified 3%
Transport and information and communication technologies 7%
FIGURE 5.1: Grant contributions by sector, 2017
Source: Development Initiatives based on data provided bilaterally by donors in 2017 and UN OCHA FTS data. Data downloaded 3 July 2017.
Notes: ‘Remaining sectors under US$100m’ includes the following: unearmarked (US$87 million), water and sanitation (US$78 million), coordination and support services (US$53 million), other contributions that do not fall under the given sector categories (US$44 million), governance and civil society (US$40 million) and general budget support (US$1.3 million).
Close to a quarter of grant contributions (US$716 million) from donors towards the Syria crisis in 2017 has been given towards the economic recovery and infrastructure sector, which includes agriculture, mine action and livelihoods. A further 19% (US$566 million) has been directed to education. The health sector has received US$243 million, approximately 8% of total grants.
There is no sectoral detail available for close to a quarter of grant contributions. About half of these funds (US$340 million) are recorded under multi-sector, 38% (US$262 million) are not yet allocated by sector and the remaining 13% (US$87 million) represent unearmarked funding.
Of the loans to the region for which a sector breakdown is available, more than a third (US$1 billion) has been directed towards macro and fiscal management. A further 23% (US$633 million) has targeted the social, urban, rural and resilience sector and 11% (US$300 million) has been directed to finance and markets.
US$716m
US$566m
US$340m
US$262m
US$243mUS$171m
US$143m
US$115m
US$100m
US$304m
Remaining sectors under US$100m
Economic recovery and infrastructure (including agriculture, mine action and livelihoods)
Education
Multi-sector
Not yet specified
HealthFood
Shelter and non-food items
Social and cultural infrastructure
Protection/human rights/rule of law
US$716m
US$566m
US$340m
US$262m
US$243mUS$171m
US$143m
US$115m
US$100m
US$304m
Remaining sectors under US$100m
Economic recovery and infrastructure (including agriculture,
mine action and livelihoods)
Education
Multi-sector
Not yet specified
HealthFood
Shelter and non-food items
Social and cultural infrastructure
Protection/human rights/rule of law
FIGURE 5.2: Loan contributions by sector, 2017
Source: Development Initiatives based on data received bilaterally by donors in 2017.
Notes: Data is partial and preliminary as full details on sector disaggregation are not available.
12

SUPPORTING SYRIA AND THE REGION POST-BRUSSELS CONFERENCE FINANCIAL TRACKING: REPORT THREE
6. Contributions by channel of delivery
6. Contributions by channel of delivery
1% Private sector
13% NGOs
29% Other channels of delivery
1% Government institutions
3% RCRC
UN agencies 53%
More than half of grant contributions in the first half of 2017 with channel information record UN agencies as first-level recipients (53%, US$2.2 billion). NGOs directly received 13% (US$523 million) of the reported total, followed by the International Red Cross and Red Crescent Movement (2.9%, US$119 million), government institutions (1.3%, US$53 million) and the private
sector (1.0%, US$39 million). The remaining US$1.2 billion (29%) has been channelled through other delivery mechanisms and includes contributions to the Facility for Refugees in Turkey as well as other financial institutions, funds and organisations for which no detail is available.
FIGURE 6.1: Grant contributions by channel of delivery to Syria, Jordan, Lebanon, Turkey, Iraq and Egypt, 2017
Source: Development Initiatives based on data provided bilaterally by donors in 2017 and UN OCHA FTS data. Data downloaded 3 July 2017.
Notes: RCRC: International Red Cross and Red Crescent Movement. ‘Other channels of delivery’ also includes funds for which the funding channel is yet to be determined.
13

SUPPORTING SYRIA AND THE REGION POST-BRUSSELS CONFERENCE FINANCIAL TRACKING: REPORT THREE
7. UN-coordinated appeals
7. UN-coordinated appealsUN-coordinated appeals present in aggregate the requested international humanitarian assistance by local, national and international organisations to respond to humanitarian crises. Both of the appeals for the Syria crisis, the Syria Humanitarian Response Plan (HRP) and the Syria Regional Refugee and Resilience Plan (3RP) remained active in 2017.
The total requirements for both came to US$8 billion for 2017, 4% higher than in the previous year; US$3.4 billion of this was requested for the Syria HRP, and US$4.6 billion for the 3RP (Figure 7.1). At the start of July 2017, the 3RP was 23% funded with US$1.0 billion in commitments/contributions from donors, leaving a funding gap of US$3.6 billion. The proportion of requirements met for the Syria HRP is 29%, with US$991 million committed/contributed to date, leaving a funding gap of US$2.4 billion. In aggregate, a quarter of requested funds have been made available in 2017, resulting in a shortfall of US$6.0 billion to be met over the rest of the year.
According to UN OCHA’s FTS, to date in 2017 US$620 million has been committed or contributed outside these UN appeals towards the Syria response (Figure 7.2). Of these funds, 43% has been directed to Syria (US$266 million). Contributions to Syria amount to US$1.2 billion, representing nearly a half (47%) of the total reported inside and outside appeals.10 Lebanon and Jordan are the second- and third-largest country recipients of the total at 13% (US$357 million) and 11% (US$295 million) respectively. Of total humanitarian funding for the Syria response, 14% has a regional focus or is yet to be allocated to a specific country.
FIGURE 7.1: Requirements and contributions for Syria-related UN-coordinated appeals, 2017
Sources: Development Initiatives based on UN High Commissioner for Refugees (UNHCR) ‘3RP Interagency Funding snapshot as of 1 July 2017’9 and UN OCHA FTS data. Data downloaded 3 July 2017.
Notes: The US$4.6 billion requirement is is the original 3RP requirements figure. This figure does not include US$943 million in multi-year funds. Further details on contributions for the US$943 million figure are not currently available. For more information see UNHCR’s Regional Overview.
US$
MIL
LIO
NS
Syria HRP 2017
Syria 3RP 2017
29% 23%
% of requirements metUnmet requirementsRequirements met
991 1,044
2,417
3,589
3,408
4,633
0
500
1,000
1,500
2,000
2,500
3,000
3,500
4,000
4,500
5,000
Source: Development Initiatives based on UNHCR ‘3RP Interagency Funding snapshot as of 1 July 2017’11 and UN OCHA FTS data. Data downloaded 3 July 2017.
Notes: Contribution figures may not match data provided bilaterally by donors. Regional funding includes contributions that have not yet been allocated to a specific country. The US$4.6 billion requirement is the original 3RP requirements figure. This figure does not include US$943 million in multi-year funds. Further details on contributions for the US$943 million figure are not currently available. For more information see UNHCR’s Regional Overview.
FIGURE 7.2: Funding inside and outside the Syria-related UN-coordinated appeals, by country, 2017
US$
MIL
LIO
NS
Inside appeals0
500
1,000
1,500
2,000
2,500
991
220
47
244
262
224
70 24
2,035 EgyptIraqJordanLebanonRegion
TurkeySyria
Outside appeals47
95 125
266
71 13 3.0
620
US$
MIL
LIO
NS
Inside appeals0
500
1,000
1,500
2,000
2,500
991
220
47
244
262
224
70 24 2,035
EgyptIraq
Jordan
LebanonRegion
Turkey
Syria
Outside appeals
95 125
266
71
13 3.0
620
14

SUPPORTING SYRIA AND THE REGION POST-BRUSSELS CONFERENCE FINANCIAL TRACKING: REPORT THREE
8. Glossary
A number of different terms are used by different donors and financial reporting systems to describe aid flows. This glossary includes the key technical terms and how they are used for the purposes of this London conference tracking exercise. Definitions come from a number of sources including OCHA FTS, OECD, IATI and specific donors, institutions and agencies – where these differ, a common definition fit for the purposes of the tracking exercise is given.
TERM DEFINITION
Commitment A firm plan expressed in writing and backed by the necessary funds, carried out by an official donor to provide specified assistance to a recipient country government, organisation or implementing agency. In this report, commitments refer to funds that have been committed but not yet contracted or disbursed.
Contract A binding agreement signed between a donor and a recipient implementing institution, organisation or agency to implement an action. Funds can then be disbursed on this basis. In the context of this report, contracted funding refers to those funds which have been contracted but not yet disbursed.
Contributions For the purpose of this report, contributions is used as a general term to refer to the sum of all funds reported as committed, contracted and disbursed.
Disbursement Outgoing funds that are transferred to a recipient institution, organisation or agency, following a commitment and/ or a contract. In this report, disbursements refer to funds disbursed from the donor to the first level recipient, not to the funds which are ultimately spent at the project level.
Grant Funding for which no repayment is required.
Loans Funding for which the recipient incurs a legal debt.
Loan concessionality level The concessionality level of a loan reflects the benefit to the borrower compared with a loan at market rate.
Loans – concessional Concessional loans’ benefits can include a lower interest rate, a longer period in which the loan has to be repaid or a delay to when the repayment has to begin.
The World Bank’s concessional loans typically meet International Development Association equivalent lending terms, which carry no or low interest rates. If a loan is highly concessional, it will typically have a grant element of at least 35% with a discount rate of 5%.
Loans – non-concessional The World Bank’s non-concessional loans will typically be based on the International Bank for Reconstruction And Development (IBRD)’s market-based rates.
Multi-country Pledges and funding labelled as ‘multi-country’ in this report refer to instances where funding is directed (or will be directed) to two or more (but not all) specified countries in the Syria region. This differs from pledges and funding labelled as going to the ‘region’, which is specified as funding for the regional response by donors and may go to all countries in the region; as well as ‘not defined’, which refers to pledges and funding where no country or regional detail has been provided.
8. Glossary
15

SUPPORTING SYRIA AND THE REGION POST-BRUSSELS CONFERENCE FINANCIAL TRACKING: REPORT THREE
TERM DEFINITION
Multi-sector In the context of sectoral disaggregation of grants and for the purposes of this report, multi-sector refers primarily to projects and activities with no one dominant sector, and often applies to assistance for refugees provided and/or coordinated by the UN High Commissioner for Refugees (UNHCR). This definition is in line with the Inter-Agency Standing Committee’s (IASC) sectoral definitions.
Multilateral development banks Multilateral development banks (MDBs) are supranational institutions established by a group of countries with the common task of fostering economic and social progress in developing countries by financing projects (in the form of loans or grants), supporting investment, generating capital and providing technical expertise.
Pledge A non-binding announcement of an intended contribution or allocation by donors. Here, pledges refer to those made at the London Conference.
Recipient country The report includes analysis of pledges and funding by recipient country. This includes direct funding to the governments of recipient countries, as well as funding channelled through organisations working in the country, such as the UN, non-governmental organisations (NGOs), the International Red Cross and Red Crescent Movement (RCRC) and the private sector.
Region In the context of the London Conference, this refers to Egypt, Iraq, Jordan, Lebanon and Turkey.
Unearmarked In this report, unearmarked refers to funding that is deliberately not directed to any particular sector by the donor. This differs from ‘sector not specified’ where details of sector-specific allocation are not available from the reports provided by the donors.
UN-coordinated appeals Humanitarian response plans and appeals, usually coordinated by UNOCHA or UNHCR, through which national, regional and international relief systems mobilise to respond to selected major or complex emergencies that require a system-wide response to humanitarian crises. Not all international humanitarian organisations take part in UN-coordinated appeal processes, notably ICRC and Médecins Sans Frontières do not.
8. Glossary
16

SUPPORTING SYRIA AND THE REGION POST-BRUSSELS CONFERENCE FINANCIAL TRACKING: REPORT THREE
9. Data sources and methodology
9. Data sources and methodologyInformation on pledges by donor has been taken from the ‘Co-chair’s declaration - annex: fundraising’. Supporting the future of Syria and the region (Brussels, 5 April 2017)’.12 Subsequent pledges, or significant revisions to the volume or distribution of pledges made after the Brussels conference have not been included in this analysis. Additional disaggregated data on pledges and contributions by recipient country, by year, by sector or by channel of delivery was gathered directly from donors in 2017 using an online form (shown on the next page).
Breakdowns of current levels of contributed funding are provided using data shared directly by donors via the same form wherever possible. Where data was unavailable from donors, data reported to UN OCHA’s FTS voluntary reporting mechanism was used. The allocation of contributions by year for the 2018–2020 period is likely to change as further data becomes available. The data presented in the report is in current prices.
The pledges reported in original currencies have been converted to US$ using the UN’s Operational Rates as of 1st April 2017. Where figures in US$ were available in the Conference Annex, these were used as such. Contributions reported in original currencies have been converted to US$ using a 2017 average of the UN’s Operational Rates.
UN appeal information is taken from UNHCR funding snapshots for the Syria Regional Refugee and Resilience Plan 2017 and from UN OCHA’s FTS for the Syria Humanitarian Response Plan 2017.
Pledges and contributions to the Facility for Refugees in Turkey are included in figures for Turkey and
not shown separately as in previous reports. These funds are recorded under multi-sector and ‘other channels of delivery’.
Analysis of grant sectors in the report uses sector classifications that are specific to this tracking project. The classification of sectors is informed by the OECD Development Assistance Committee sectors and purpose codes, the IASC13 standard sectors, and sector classifications used by specific government and multilateral donors. The sector classification seeks to align different sector classifications to the fullest extent possible under the following headings:
• Education
• Health
• Water and sanitation
• Governance and civil society
• Social and cultural infrastructure
• Economic recovery and infrastructure (including agriculture, mine action and livelihoods)
• General budget support
• Food
• Coordination and support services
• Protection/human rights/rule of law
• Shelter and non-food items
• Multi-sector
• Unearmarked
• Not yet specified.
Volumes of funding that do not fall under any of these sector categories are combined into ‘other’.
In addition, sectoral classifications of loans include the World Bank sectors macro and fiscal management, transport and information and communication technologies, energy and extractives, social, urban, rural resilience and finance and markets.
17

10. Form used for data collectionSUPPORTING SYRIA AND THE REGION POST-BRUSSELS CONFERENCE FINANCIAL TRACKING: REPORT THREE
GRANTS
Syria Jordan Lebanon Turkey Iraq Egypt Region Multi-country Not defined
Pledged
Committed
Contracted
Disbursed
LOANS – CONCESSIONAL
Syria Jordan Lebanon Turkey Iraq Egypt Region Multi-country Not defined
Pledged
Committed
Contracted
Disbursed
LOANS – NON-CONCESSIONAL
Syria Jordan Lebanon Turkey Iraq Egypt Region Multi-country Not defined
Pledged
Committed
Contracted
Disbursed
INSTRUCTIONS TO FILL IN THE FORM
Information sought via this form tracks pledges made at the time of the London conference and included on the ‘Co-hosts statement annex: fundraising’.
Complete all fields on contributions (comprised of commitments, contracted funding and disbursements). If no commitment/contracted funding/disbursement was made please write ‘0’. If information is not yet available please leave blank.
Data is organised by calendar year (January to December), not fiscal year.
In the first section under grants to Turkey, please include within your figures any contributions to the Facility for Refugees in Turkey which relate to pledges made at the London conference. In the later section, please input contributions to the Facility which relate to the conference pledge and those outside the pledge in the respective boxes.
Pledges and funding labelled as ‘multi-country’ refer to instances where funding is directed (or will be directed) to two or more (but not all) specified
Transactions for [organisation] in 2017
Instructions to fill in the form (show/hide)
Change year:
Currency: EUR
Go20172018-20
countries in the Syria region. This differs from pledges and funding labelled as going to the ‘region’, which is specified as funding for the regional response by donors and may go to all countries in the region; as well as ‘not defined’, which refers to pledges and funding where no country or regional detail has been provided.
NB: Any subsequent users or revisions to the data will overwrite previously recorded information.
To select the year and the currency, please choose the relevant option in the drop-down. To fill in information regarding the Facility for Refugees in Turkey for 2017, please select ‘2017–2020’.
Use the comment box to add further information about data you have filled in and processes that need clarifying to ensure an accurate reflection of your contributions.
To save and submit your data, press ‘Save’ at the bottom of the page. In order to check your data, press ‘Export previously saved data’.
18
10. Form used for data collection

10. Form used for data collectionSUPPORTING SYRIA AND THE REGION POST-BRUSSELS CONFERENCE FINANCIAL TRACKING: REPORT THREE
SECTOR CONTRIBUTIONS – GRANTS
Sectors Syria Jordan Lebanon Iraq Egypt Turkey Region Multi-country Not defined
Education
Health
Water and sanitation
Governance and civil society
Social and cultural infrastructure
Economic recovery and infrastructure (including agriculture, mine action and livelihoods)
General budget support
Food
Shelter and non-food items
Coordination and support services
Protection/Human rights/Rule of law
Multi-sector
Not specified
Unearmarked
SECTOR CONTRIBUTIONS – LOANS
Sectors classification specific to MDB Syria Jordan Lebanon Iraq Egypt Turkey Region Multi-country Not defined
CHANNEL OF DELIVERY CONTRIBUTIONS – GRANTS
Syria Jordan Lebanon Iraq Egypt Turkey Region Multi-country Not defined
UN agencies
NGOs
RCRC
Government institutions
Private sector
Other channel of delivery
19

SUPPORTING SYRIA AND THE REGION POST-BRUSSELS CONFERENCE FINANCIAL TRACKING: REPORT THREE
Endnotes
Endnotes1 All figures in this report are in US$.
2 Grants total for 2017 includes US$187 million in contributions from the World Bank and the European Bank for Reconstruction and Development combined; neither of these donors made grant pledges at the Brussels conference.
3 See note 2.
4 Loan terms are generally negotiated on a case-by-case basis and so consessionality details are specific to each contract.
5 Figures do not include a US$25 million contribution from Denmark towards a multi-year stabilisation programme for Syria and Iraq due to a lack of detail on its allocation stage. Denmark’s planned October contribution to the Turkey Refugee Facility is not included to ensure consistency with data reported by all donors.
6 Please see the glossary for a definition of these terms.
7 The World Bank has disbursed US$1.5 billion in 2017. The data is not captured in the chart to align the Bank’s reporting to the methodology employed in this report and ensure consistency with other donors’ reporting.
8 See note 7.
9 http://reporting.unhcr.org/sites/default/files/3RP%20Interagency%20Funding%20Snapshot-2017%20Syria%203RP%201%20July%202017.pdf
10 Contributions inside the 3RP appeal is sourced from UNHCR data. Contributions inside the Syria HRP and outside appeals are sourced from FTS.
11 See note 9.
12 http://www.consilium.europa.eu/en/press/press-releases/2017/04/pdf/SyriaConf2017-Pledging-Statement_pdf/
13 The IASC is the primary mechanism for inter-agency coordination of humanitarian assistance, involving key UN and non-UN humanitarian partners.
20