Embed Size (px)
Citation preview
1
F A C U L T Y O F S C I E N C E
U N I V E R S I T Y O F C O P E N H A G E N
Department of Biology, Copenhagen University
Supervisor: Professor Anders-Løner-Olesen
PhD thesis
Louise Bjørn
Suppressors of hyperinitiation in Escherichia
coli couple DNA replication to precursor
biosynthesis and energy metabolism

2
3
Abstract
The Hda protein plays an essential role in inactivation of the initiator protein DnaA from its active,
ATP bound form to the inactive DnaA-ADP in E. coli. Cells deficient in Hda suffer from
overinitiation, asynchronous initiation and cell death as a consequence of an increased DnaA-
ATP/DnaA-ADP ratio . E. coli can suppress the growth defects caused by Hda deficiency by
several different mechanisms. The focus of this Ph.d. thesis is to understand the mechanisms that
underlie suppression of Hda deficiency in E. coli. These approaches are described in two
manuscripts and one published paper.
Over expression of Ribonucleotide reductase encoded by either nrdAB or nrdEF has been shown to
suppress Hda deficiency. The nrdAB promoter contains four consensus binding sequences for DnaA
and a 45bp inverted repeat important for cell cycle regulation of nrdAB transcription. In manuscript
1 we show that deletions of the DnaA-boxes or the 45bp inverted are likely to lead to a decreased
transcription of nrdAB and that these mutants are synthetic lethal in combination with loss of the
hda gene. Furthtermore we show that suppression of Hda deficiency is dependent on the degree of
nrdAB overexpression.
Deletion of the hda gene causes cells to accumulate suppressor mutants (hsm). In manuscript 2, we
characterize the two strains iscUC63F and fre∆68 that contain mutations in the iscU gene encoding
an iron sulfur cluster scaffold enzyme and in the fre gene encoding flavin reductase respectively.
We find that suppression of Hda deficiency is a consequence reduced gene function in iscUC63F
and loss of gene function in fre∆68. We suggest that the mechanism of Hda suppression is based on
a mimicked anaerobic growth in both strains.
Lastly we show in paper I that the otherwise lethal overinitation of replication in Hda deficient cells
can be tolerated under anaerobic conditions so that a ∆hda strain can maintain growth without
accumulating any further mutations in the chromosome. We also show that deletion of mutM that is
a part of to GO repair system and is responsible for repair of DNA damages caused by reactive
oxygen species, suppresses the growth deficiencys in a ∆hda strain.

4
5
Resumé
DnaA , som er aktivatorprotein for initiering af replikation i E. coli eksisterer i en aktiv, ATP-
bundet form og en inaktiv ADP-bundet form. Proteinet Hda er en essentiel del af en proces hvor
DnaA-ATP inaktiveres til DnaA-ADP. Niveauet af DnaA-ATP/DnaA-ADP er højt i Hda defekte
celler hvilket fører til overinitiering, asynkron initiering og celledød. E. coli kan modvirke disse
defekter ved hjælp af flere forskellige mekanismer. Formålet med dette Ph.D. studie er at forstå de
mekanismer der ligger til grund for supression af de defekter som er forårsaget af manglende Hda
funktion.
Overekspression af ribonukleotid reduktase udtrykt enten fra nrdAB eller nrdEF operonet
supresserer Hda defekter. Promotoren for nrdAB indeholder blandt andet nogle DnaA-bindende
sekvenser og en 45bp lang inverteret repeat sekvens. I manuskript I viser vi at deletion af alle de
DnaA-bindende sekvenser eller den inverterede gentaglesessekvens fører til en reduceret
transkription af hda. Vi viser desuden at supression af Hda defekter afhænger af graden af nrdAB
overekspression.
I manuscript 2 karakteriserer vi de to hda supressorer iscUC63F og fre∆68. fre∆68 har en mutation i
genet iscU som koder for et iron sulfur cluster scaffold enzym. fre∆68har en mutation i genet fre
som koder for flavin reduktase. Vi viser at supression af Hda defekter er en konsekvens af reduceret
funktion af iscU tab af funktion af fre i henholdsvis iscUC63F og fre∆68. Dette kan forklares ved at
skift i metabolisme til betingelser der svarer til anaerobe forhold.
I paper 1 viser vi at defekter der under aerobe forhold fører til fatale skader i cellerne kan tolereres
under anaerobe forhold således at en stamme hvori hda er deleteret kan opretholde vækst uden at
kromosomet tager yderligere skade. Derudover viser vi at deletion af mutM som er en del af GO
systemet som reparerer skader på DNA forårsaget af reaktiv ilt fører til at Hda defekte celler kan
opretholde vækst under aerobe forhold.

6
7
Contents
ABSTRACT ......................................................................................................................... 3
RESUMÉ ............................................................................................................................. 5
CONTENTS ......................................................................................................................... 7
ACKNOWLEDGEMENTS ................................................................................................... 9
INTRODUCTION ............................................................................................................... 11
Cell cycle of E. coli .......................................................................................................... 11
Initiation of replication .................................................................................................... 12
Control of initiation of replication .................................................................................... 14
DARS ............................................................................................................................. 15
RIDA ............................................................................................................................... 15
Suppression of Hda deficiency ....................................................................................... 17
Ribonucleotide reductase ............................................................................................... 18
Iron sulfur clusters .......................................................................................................... 19
Flavin reductase Fre ........................................................................................................ 22
Respiration in E. coli ....................................................................................................... 23
Quinones ........................................................................................................................ 24
Dehydrogenases ............................................................................................................ 25
Terminal oxidases .......................................................................................................... 27
Oxidative stress ............................................................................................................... 27
Adaption to anaerobic and microaerobic conditions ................................................... 28
The ArcB/ArcA two component system .......................................................................... 29
8
REFERENCES .................................................................................................................. 31
MANUSCRIPT 1 ................................................................................................................ 65
MANUSCRIPT 2 ................................................................................................................ 65
PAPER 1…………………………………………………………………………………………101
SUPPLEMENTARY DATA…………………...…….………………………………………….115

9
Acknowledgements
I would like to thank my supervisor Anders Løbner-Olesen for excellent help and advice.
Also a big thanks to Post. Doc. Godefroid Charbon for comprehensive help, advice and
collaboration in the lab.
Thanks to Jakob Frimodt-Møller, Thomas Thyge Thomsen, Susanne Kjeldstrup, Henrik Jakobsen,
Ole Skovgaard, Christa Persson, Michaela Lederer, Mette Kongstad and everyone else in the lab at
Roskilde and Copenhagen university for help and advice.
Thanks to my brother, Jakob, for help with the figures for my thesis and my husband Morten for
help with the lay out.
Lastly I would like to thank Martin G. Marinus and Phyllis Spatric (UMASS medical school) for
help with micro array experiments and a special thanks to Martin G. Marinus and his wife Isabell
for letting me stay in their home during my stay in Worchester.

10
11
Introduction
Initiation of replication in E. coli is a tightly regulated process that is controlled so that cells initiate
replication once and only once per cell cycle, simultaneously in all origins (Boye et al., 2000). One
of the important regulatory mechanisms that is essential for the correct timing of initiation of
replication is inactiviation of the initiator protein DnaA so that the active form of DnaA, DnaA-ATP
is hydrolysed to inactive form DnaA-ADP in a process called RIDA (Regulatory Inactivation of
DnaA) (Katayama et al., 1998; Kato & Katayama, 2001). The protein Hda is essential for this
process and cells lacking the hda gene encoding Hda, suffer from servere growth defects and cell
death. These cells quickly accumulate mutations that suppress the growth defects caused by the
consequences of loss of hda (Kato & Katayama, 2001; Riber et al., 2006).
The aim of this Ph.D. study is to understand the mechanisms of suppression of Hda deficiency with
focus on ribonucleotide reductase, which has been shown to suppress Hda deficiency when
overexpressed (Gon et al., 2006), two Hda suppressor mutants (hsm) previously isolated (Charbon
et al., 2011) and the effect of anaerobic growth. The two hsm strains investigated are called hsm5
and hsm6 and contain a point mutation in the iscU gene encoding an iron sulfur cluster scaffold
protein and a deletion of a part of the fre gene encoding flavin reductase catalyzing the production
of reduced flavins. Both iron sulfur clusters and reduced flavins serve as cofactors in a broad variety
of processes in E. coli including electron transport in the respiratory chain of the cell.
In the introduction the cell cycle of E. coli is described with focus on the initiation of replication
and the mechanism that prevent of premature reinitiation of replication. This is followed by a
description of the functions of ribonucleotide reductase, iron sulfur clusters and flavin reductase.
The functions of iron sulfur clusters and flavin reductase are related respiration, metabolism during
anaerobic or micro aerobic conditions and oxidative stress. Because these conditions and processes
seem important for the suppression of Hda, they are also described in the introduction.
Cell cycle of E. coli
The initiation of replication is the main regulatory event during cell cycle in E. coli. Once
replication is initiated, DNA synthesis proceeds until the entire genome is replicated, cell mass
increases and the cell divides into two identical daughter cells.
12
The genome of E. coli consists of a single chromosome of approximately 4,6mbp. Initiation occurs
in the origin of replication, oriC and proceeds bidirectionally until the two replication forks reaches
the terC region located uppersit of oriC on the chromosome.
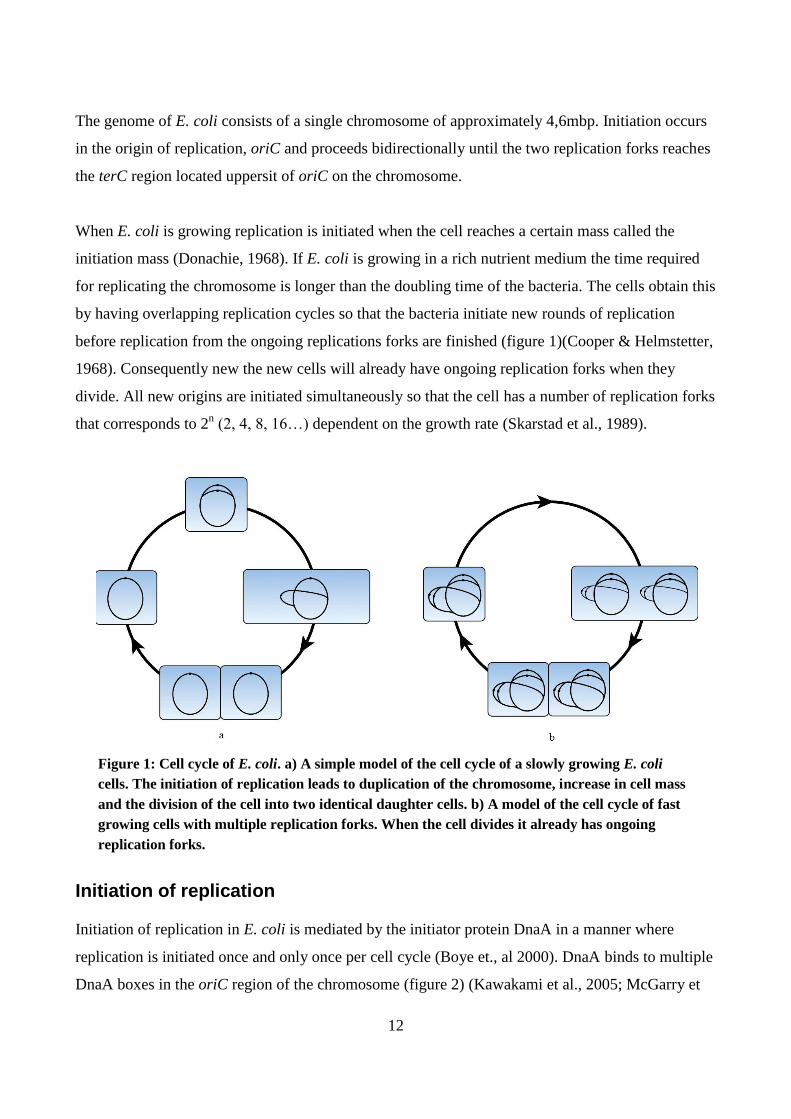
When E. coli is growing replication is initiated when the cell reaches a certain mass called the
initiation mass (Donachie, 1968). If E. coli is growing in a rich nutrient medium the time required
for replicating the chromosome is longer than the doubling time of the bacteria. The cells obtain this
by having overlapping replication cycles so that the bacteria initiate new rounds of replication
before replication from the ongoing replications forks are finished (figure 1)(Cooper & Helmstetter,
1968). Consequently new the new cells will already have ongoing replication forks when they
divide. All new origins are initiated simultaneously so that the cell has a number of replication forks
that corresponds to 2n (2, 4, 8, 16…) dependent on the growth rate (Skarstad et al., 1989).
Figure 1: Cell cycle of E. coli. a) A simple model of the cell cycle of a slowly growing E. coli
cells. The initiation of replication leads to duplication of the chromosome, increase in cell mass
and the division of the cell into two identical daughter cells. b) A model of the cell cycle of fast
growing cells with multiple replication forks. When the cell divides it already has ongoing
replication forks.
Initiation of replication
Initiation of replication in E. coli is mediated by the initiator protein DnaA in a manner where
replication is initiated once and only once per cell cycle (Boye et., al 2000). DnaA binds to multiple
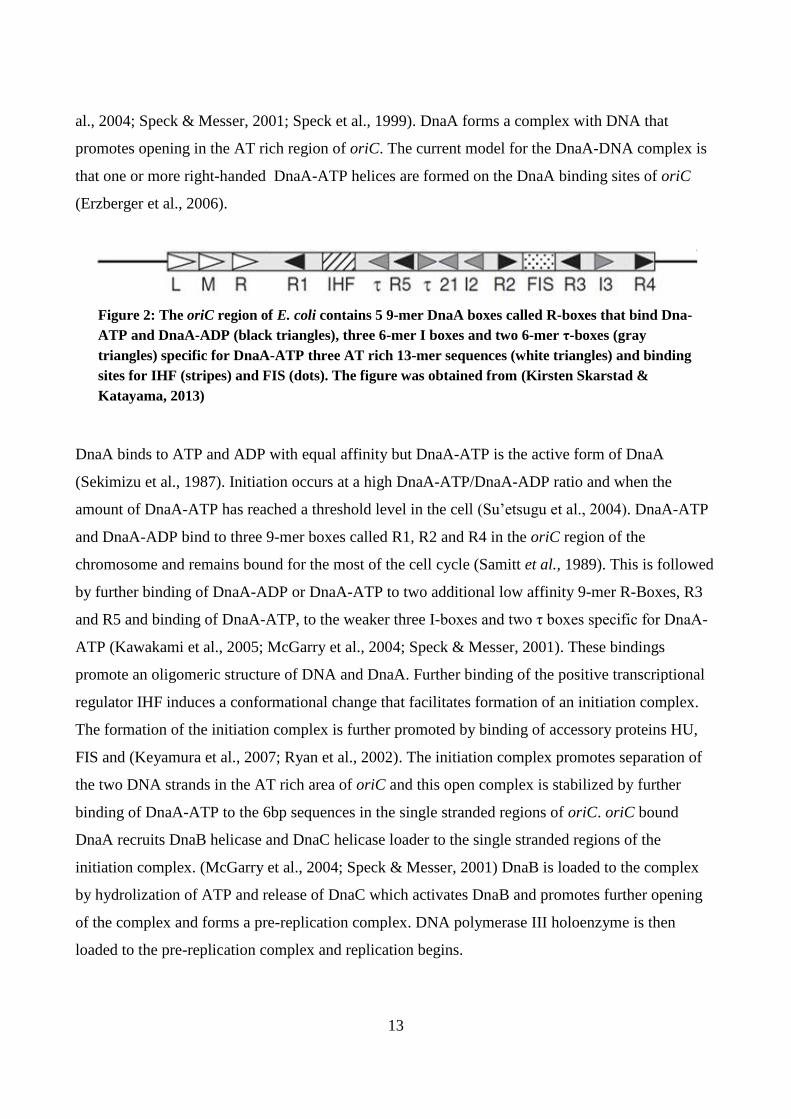
DnaA boxes in the oriC region of the chromosome (figure 2) (Kawakami et al., 2005; McGarry et
13
al., 2004; Speck & Messer, 2001; Speck et al., 1999). DnaA forms a complex with DNA that
promotes opening in the AT rich region of oriC. The current model for the DnaA-DNA complex is
that one or more right-handed DnaA-ATP helices are formed on the DnaA binding sites of oriC
(Erzberger et al., 2006).
Figure 2: The oriC region of E. coli contains 5 9-mer DnaA boxes called R-boxes that bind Dna-
ATP and DnaA-ADP (black triangles), three 6-mer I boxes and two 6-mer τ-boxes (gray
triangles) specific for DnaA-ATP three AT rich 13-mer sequences (white triangles) and binding
sites for IHF (stripes) and FIS (dots). The figure was obtained from (Kirsten Skarstad &
Katayama, 2013)
DnaA binds to ATP and ADP with equal affinity but DnaA-ATP is the active form of DnaA
(Sekimizu et al., 1987). Initiation occurs at a high DnaA-ATP/DnaA-ADP ratio and when the
amount of DnaA-ATP has reached a threshold level in the cell (Su’etsugu et al., 2004). DnaA-ATP
and DnaA-ADP bind to three 9-mer boxes called R1, R2 and R4 in the oriC region of the
chromosome and remains bound for the most of the cell cycle (Samitt et al., 1989). This is followed
by further binding of DnaA-ADP or DnaA-ATP to two additional low affinity 9-mer R-Boxes, R3
and R5 and binding of DnaA-ATP, to the weaker three I-boxes and two τ boxes specific for DnaA-
ATP (Kawakami et al., 2005; McGarry et al., 2004; Speck & Messer, 2001). These bindings
promote an oligomeric structure of DNA and DnaA. Further binding of the positive transcriptional
regulator IHF induces a conformational change that facilitates formation of an initiation complex.
The formation of the initiation complex is further promoted by binding of accessory proteins HU,
FIS and (Keyamura et al., 2007; Ryan et al., 2002). The initiation complex promotes separation of
the two DNA strands in the AT rich area of oriC and this open complex is stabilized by further
binding of DnaA-ATP to the 6bp sequences in the single stranded regions of oriC. oriC bound
DnaA recruits DnaB helicase and DnaC helicase loader to the single stranded regions of the
initiation complex. (McGarry et al., 2004; Speck & Messer, 2001) DnaB is loaded to the complex
by hydrolization of ATP and release of DnaC which activates DnaB and promotes further opening
of the complex and forms a pre-replication complex. DNA polymerase III holoenzyme is then
loaded to the pre-replication complex and replication begins.
14
Control of initiation of replication
Once initiation has occurred there presumably is still a high level of DnaA-ATP in the cell
sufficient for initiating new rounds of replication. In order to ensure a once per cell cycle initiation
of replication in E. coli the cell has several ways to prevent premature reinitiation of replication.
Right after initiation of replication the newly initiated origins are blocked by binding of a protein
called SeqA in a process called sequestration (Lu et al., 1994). oriC contains 11 GATC sites that is
methylated on the adenine residue by the enzyme Dam methyltransferase. Right after initiation of
replication the newly synthesized DNA strand is unmethylated while the old DNA strand is
methylated (Boye & Løbner-Olesen, 1990). The hemimethylated GATC sequences of oriC are
recognized and bound by SeqA immediately after initiation of replication and remain bound for
approximately one third of a generation (Campbell & Kleckner 1990). During sequestration the
origin in inaccessible for DnaA and consequently provide the cell a time period to reduce the
amount and activity of DnaA to a level below the threshold level of initiation (Boye et al., 1996).
During sequestration the amount and activity of free DnaA is reduced in by repression of de novo
synthesis, titration to DnaA binding sequences in the datA locus and inactivation of the DnaA
protein.
Similarly to oriC, the dnaA gene is sequestered by SeqA so that the transcription of DnaA is
regulated as a function of cell cycle by sequestration of the hemimethylated dnaA gene right after
initiation of replication. The dnaA gene is located close to the origin and sequestration lasts for
approximately for one third of a generation similar to the sequestration of the origin (Campbell &
Keckner 1990). During this period the de novo synthesis of DnaA is consequently inhibited.
The amount of DnaA is also controlled by autoregulation of the dnaA gene so that high levels of
DnaA lead to repression of transcription of dnaA and low levels lead to derepression and activation
of transcription of dnaA (Speck et al., 1999).
The amount of free DnaA is reduced by binding to high and low DnaA affinity sites in the
chromosome (Hansen et al., 1991). The most important site for titration of DnaA is the datA locus
located close to oriC that can bind a high number of DnaA molecules (Kitagawa et al., 1998). The
datA locus is located close to the origin of replication and has a size of approximately 1kb. It
15
contains five high affinity binding sites for DnaA and 25 low affinity binding sites and is believed
to bind approximately 60 dnaA molecules (Hansen et al., 2007). The datA region has also shown to
form a complex with the protein IHF that promotes hydrolysation of DnaA-ATP to DnaA-ADP in a
process called DDAH (datA dependent DnaA-ATP hydrolysis) (Kasho & Katayama, 2013)
DARS
E. coli contains two sequences that promote the reactivation of DnaA-ADP to DnaA-ATP called
DARS1 and DARS2 (DnaA reactivating sequence 1 and 2). DARS1 and DARS2 are located
approximately halfway from the oriC region to the terC region on each side of the chromosome. It
has been shown that oversupply of DARS led to an increase in the level of DnaA-ATP and
overinitiation of replication. In contrast deletion of DARS led to a decrease in DnaA-ATP level and
underinitiation of replication (Fujimitsu et al., 2009).
RIDA
In addition to DDAH, the activity of the DnaA protein is also reduced in a process called RIDA
(Regulatory Inactivation of DnaA). Even though both DnaA-ATP and DnaA-ADP participates in
the initiation of replication it is only DnaA-ATP that participates in forming the prereplication
complex that promotes opening of the DNA helix and initiation of replication (Sekimizu et al.,
1987). RIDA is mediated by a complex consisting of the DNA loaded β-subunit of DNA
polymerase III holoenzyme and the protein the Hda which is essential for RIDA (figure 3) (Kato &
Katayama, 2001). The Hda protein consists of two monomers with a short N – terminal domain and
an AAA+ domain with a high homology to domain III of the DnaA protein (Katayama et al., 1998;
Su’etsugu et al., 2005)
16
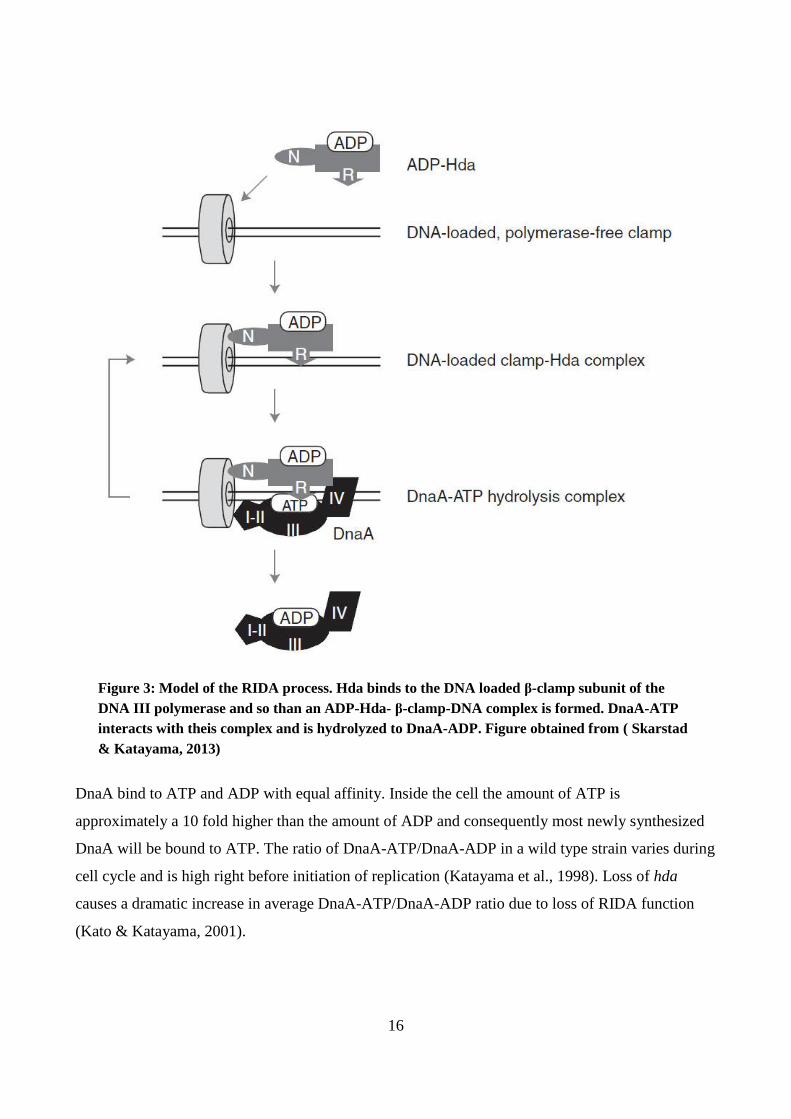
Figure 3: Model of the RIDA process. Hda binds to the DNA loaded β-clamp subunit of the
DNA III polymerase and so than an ADP-Hda- β-clamp-DNA complex is formed. DnaA-ATP
interacts with theis complex and is hydrolyzed to DnaA-ADP. Figure obtained from ( Skarstad
& Katayama, 2013)
DnaA bind to ATP and ADP with equal affinity. Inside the cell the amount of ATP is
approximately a 10 fold higher than the amount of ADP and consequently most newly synthesized
DnaA will be bound to ATP. The ratio of DnaA-ATP/DnaA-ADP in a wild type strain varies during
cell cycle and is high right before initiation of replication (Katayama et al., 1998). Loss of hda
causes a dramatic increase in average DnaA-ATP/DnaA-ADP ratio due to loss of RIDA function
(Kato & Katayama, 2001).
17
Cells that are deficient in Hda function suffer from over initiation, asynchronous initiation and cell
death as a consequence of the elevated level of DnaA-ATP (Kato & Katayama, 2001; Riber et al.,
2006).
Suppression of Hda deficiency
Because of the servere consequences of Hda deficiency it has not been possible to maintain a ∆hda
strain without accumulation of suppresser mutations. When deleting the hda gene by a P1-phage
transduction in a wild type strain the cells form both small colonies indicating poor growth of the
cells and big colonies indicating that the cells have gained additional mutations that suppress
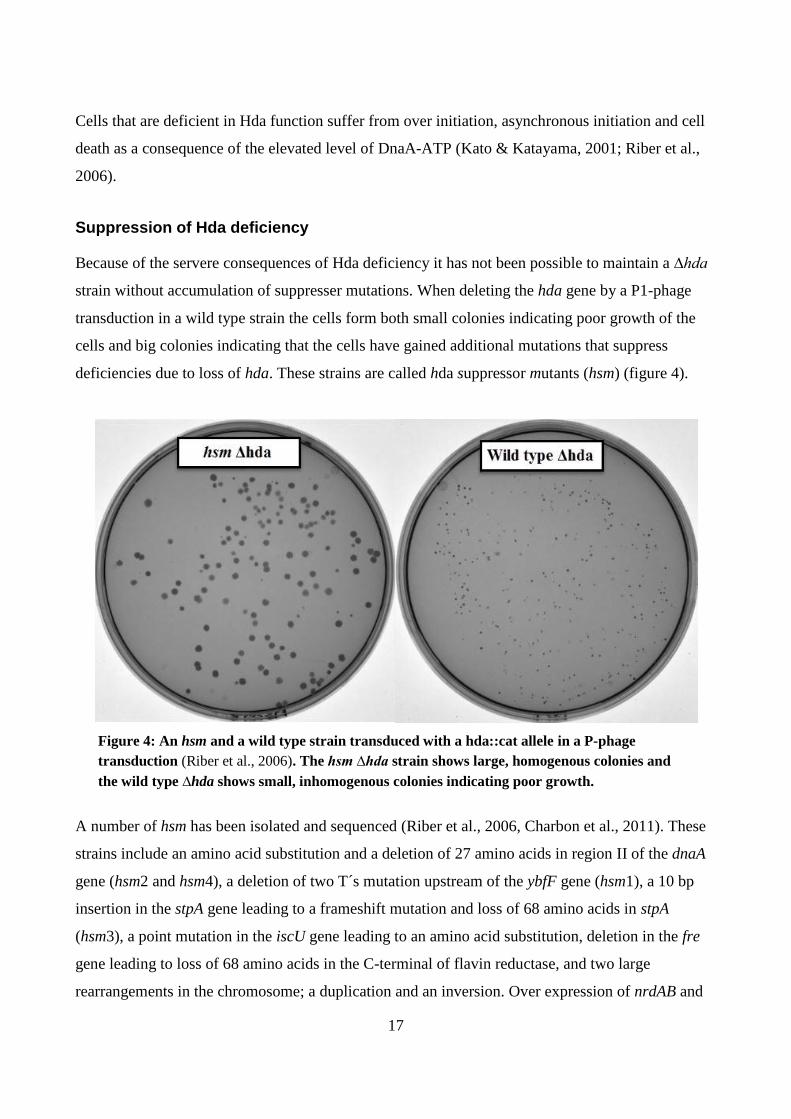
deficiencies due to loss of hda. These strains are called hda suppressor mutants (hsm) (figure 4).
Figure 4: An hsm and a wild type strain transduced with a hda::cat allele in a P-phage
transduction (Riber et al., 2006). The hsm ∆hda strain shows large, homogenous colonies and
the wild type ∆hda shows small, inhomogenous colonies indicating poor growth.
A number of hsm has been isolated and sequenced (Riber et al., 2006, Charbon et al., 2011). These
strains include an amino acid substitution and a deletion of 27 amino acids in region II of the dnaA
gene (hsm2 and hsm4), a deletion of two T´s mutation upstream of the ybfF gene (hsm1), a 10 bp
insertion in the stpA gene leading to a frameshift mutation and loss of 68 amino acids in stpA
(hsm3), a point mutation in the iscU gene leading to an amino acid substitution, deletion in the fre
gene leading to loss of 68 amino acids in the C-terminal of flavin reductase, and two large
rearrangements in the chromosome; a duplication and an inversion. Over expression of nrdAB and
18
nrdEF encoding ribonucleotide reductases 1a and 1b under aerobic conditions and iron limited
conditions respectively have also been shown to suppress Hda deficiency (Fujimitsu et al., 2008;
Gon et al., 2006).
Ribonucleotide reductase
DNA synthesis is dependent on dNTP´s that serves as building blocks for new DNA. The reduction
of NTP to dNTP is mediated by the enzyme Ribonucleotide reductase. Ribonucleotide reductases
are found in all cellular organisms and are essential for the synthesis of precursors for DNA. All
Ribonucleotide reductases use a free radical in the reduction of NTP to dNTP and the various types
of Ribonucleotide reductases are divided into three classes based on how they generate their radical,
oxygen dependency and which cofactors they use (Herrick & Sclavi, 2007; Nordlund & Reichard,
2006). In E. coli there are three types of ribonucleotide reductases. The most important
Ribonucleotide reductasein E. coli is a class 1a Ribonucleotide reductaseencoded by the nrdAB
operon. It is the only Ribonucleotide reductase that functions under under normal, aerobic
conditions (Jordan et al., 1996). During iron limitation and anaerobis a class Ib Ribonucleotide
reductase encoded by nrdEF is and the class III nrdD is used respectively.
The class Ia RNR of E. coli contains the two nonidentical subunits R1 (α) encoded by nrdA and R2
(β) encoded by nrdB. The R1 subunit contains the catalytic site and two allosteric sites; the activity
site regulating the overall activity of the enzyme and the specificity site coordinating the balance of
the four dNTPs. The R2 subunit contains a tyrosyl radical essential for reduction of NTP to dNTP
(Herrick & Sclavi, 2007; Nordlund & Reichard, 2006).
The activity and amount Ribonucleotide reductase 1a is tightly regulated by allosteric regulation of
the enzyme and by transcriptional regulation of the nrdAB operon to ensure a balanced pool of the
four dNTP´s for DNA synthesis. Imbalances in the dNTP pool have been shown to be mutagenic
for the cells (Stubbe 2000 Wheeler et al 2005, Gon et al 2006).
The nrdAB promoter contains two R-type DnaA binding sequences, two boxes specific to DnaA-
ATP, a binding site for the transcriptional repressor NrdR, binding sites for the IciA and Fis
proteins and a 45 bp inverted repeat. The transcription of nrdAB is regulated as a function of cell
cycle in response to stresses in the replication machinery or in response to oxygen content or
19
oxidative stress. Expression of nrdAB is synchronized with cell cycle so that synthesis of RNR
increases rapidly from zero to a maximum level when replication is initialized (Sun & Fuchs, 1992).
The 45bp inverted repeat is required for cell cycle regulation of nrdAB. It has previously been
shown that mutants in the pnrdAB promoter either lacking the entire 45bp inverted repeat or part of
it have a decreased expression when fused to lacZ in a β-gal assay (Jacobson & Fuchs, 1998a).
The DnaA boxes were shown to have a positive effect on nrdAB expression (Augustin et al 1994).
In vivo expression assays of DnaA-box mutated nrdAB promoter region fragments fuzed to a lacZ
gene on single copy plasmids showed a reduction of expression by a factor 2-3 compared to the
wild type. This indicates a positive effect of DnaA binding to the nrdAB promoter on expression
(Jacobson & Fuchs, 1998b).
Another study has proposed that the nucleotide bound state of DnaA is determining for the
regulation of nrdAB in a way where DnaA-ATP repress expression and DnaA-ADP activates
expression of nrdAB. They found that overexpression of nrdAB supresses growth deficiencies of a
∆hda strain and propose that the hydrolysis of DnaA-ATP to DnaA-ADP after initiation of
replication leads to activation of nrdAB (Gon et al., 2006). It has also been suggested that it is the
ratio of DnaA-ATP/DnaA-ADP and not the absolute level of DnaA-ATP that control the expression
of nrdAB so that a low DnaA-ATP/DnaA-ADP ratio stimulates transcription of nrdAB while a high
DnaA-ATP/DnaA-ADP represses transcription (Olliver et al., 2010).
Iron sulfur clusters
Iron sulfur clusters are ancient cofactors that are found in a broad variety of organisms such as
plants, bacteria and mammals. They play important roles in various processes in E. coli such as
enzyme catalysis, electron transport and envorinmental sensing and DNA repair (Fontecave, 2006;
Kiley & Beinert, 2003). The most common form of iron sulfur clusters are the rhombic [2Fe-2S],
clusters and the cubic [3Fe-4S] and [4Fe-4S] clusters containing either Fe2+
or Fe3+
called ferrous
and ferric iron respectively. The iron ions in most of the clusters are coordinated by cysteine
residues.
The most important function of iron-sulfur clusters is as electron donors or acceptors in processes
involving electron transport such as the respiratory chains. The function of iron-sulfur clusters to
participate in electron transfer is based on the ability of iron to switch redox state between Fe2+
and
20
Fe3+
(Beinert, 1997). Furthermore the redox potential of the iron sulfur clusters has a larger range
than other simple redox cofactors and can be fine tuned by coordination of the electronic
environment in the protein they are located in.
Iron sulfur clusters are also involved in gene regulation as sensors of environmental and
intracellular conditions such as oxidative stress. Transcription factors FNR, IscR and SoxR sense
O2, O2- and NO respectively by the presence or absence or of the redox state of iron sulfur cluster
cofactors (Imlay, 2008).
Iron sulfur clusters function in enzyme catalysis as essential cofactors in enzymes such as aconitase,
biotin synthase, lipoate synthase and ATP dependent DNA helicase involved in nucleotide excision
repair (Booker et al., 2007; Lill, 2009).
E. coli contains two systems for biosynthesis of iron sulfur cluster proteins; the ISC system that is
active under normal conditions and the SUF system that are active under iron limited and oxidative
stress conditions (Takahashi & Tokumoto, 2002; Zheng et al., 1998).
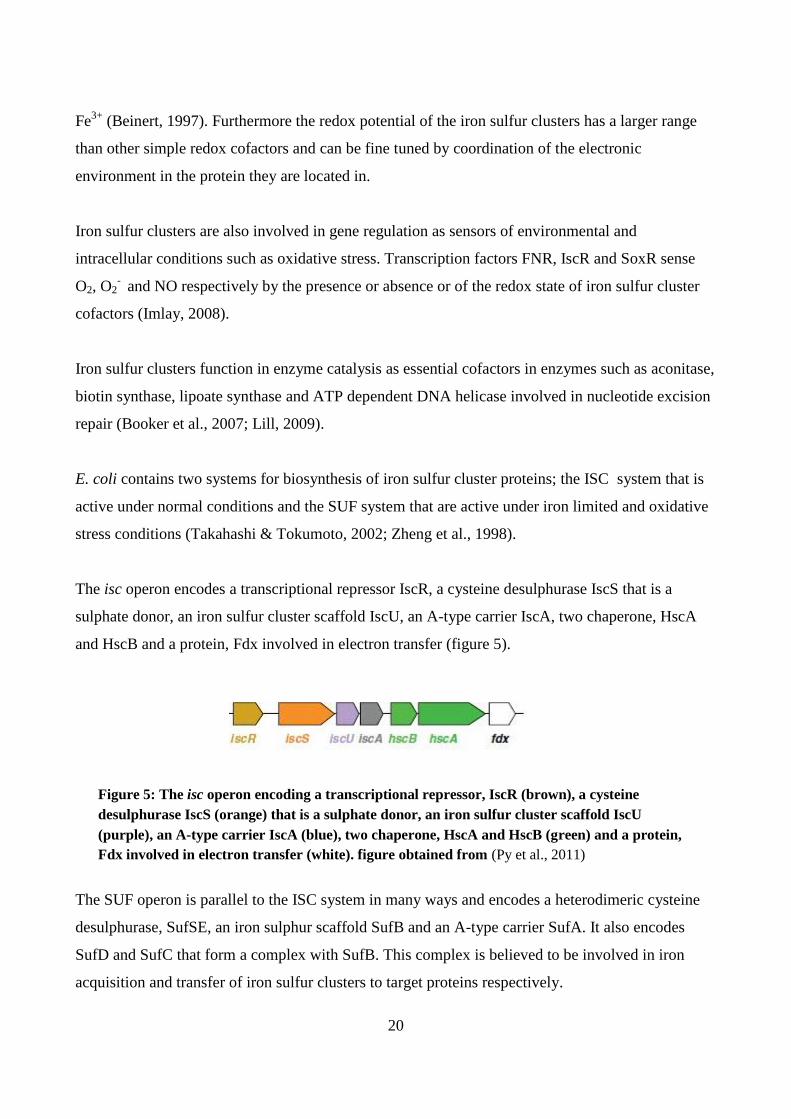
The isc operon encodes a transcriptional repressor IscR, a cysteine desulphurase IscS that is a
sulphate donor, an iron sulfur cluster scaffold IscU, an A-type carrier IscA, two chaperone, HscA
and HscB and a protein, Fdx involved in electron transfer (figure 5).
Figure 5: The isc operon encoding a transcriptional repressor, IscR (brown), a cysteine
desulphurase IscS (orange) that is a sulphate donor, an iron sulfur cluster scaffold IscU
(purple), an A-type carrier IscA (blue), two chaperone, HscA and HscB (green) and a protein,
Fdx involved in electron transfer (white). figure obtained from (Py et al., 2011)
The SUF operon is parallel to the ISC system in many ways and encodes a heterodimeric cysteine
desulphurase, SufSE, an iron sulphur scaffold SufB and an A-type carrier SufA. It also encodes
SufD and SufC that form a complex with SufB. This complex is believed to be involved in iron
acquisition and transfer of iron sulfur clusters to target proteins respectively.
21
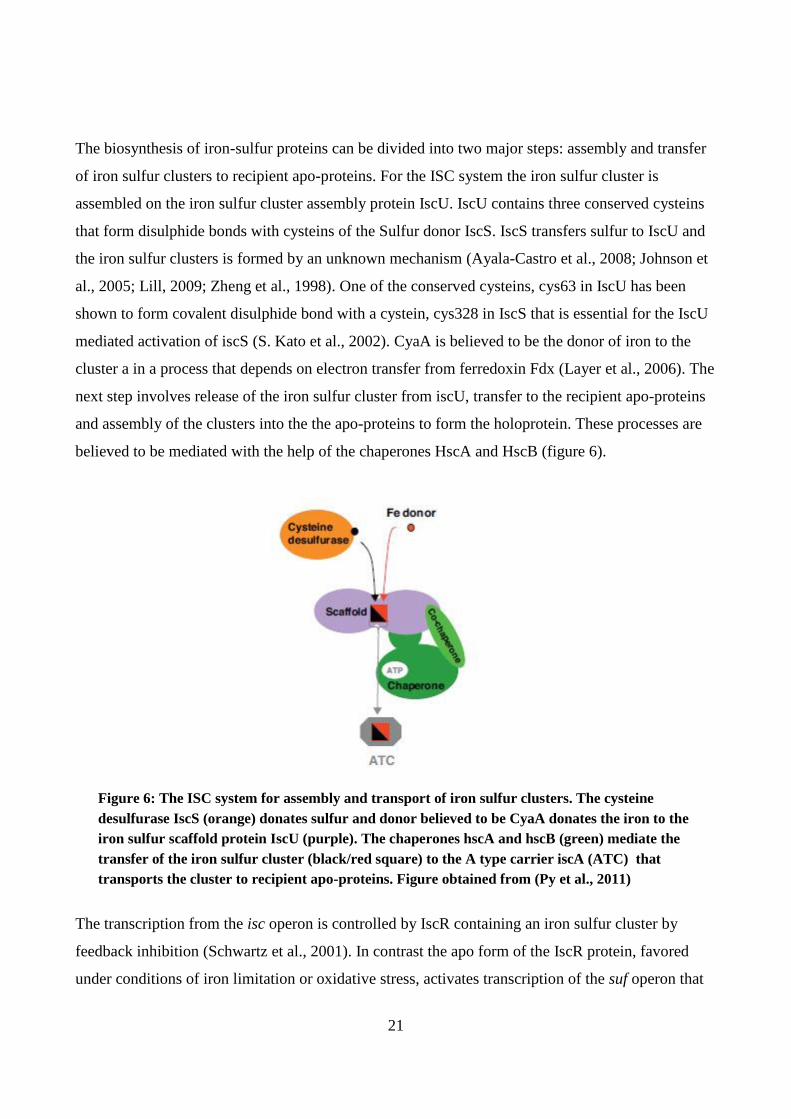
The biosynthesis of iron-sulfur proteins can be divided into two major steps: assembly and transfer
of iron sulfur clusters to recipient apo-proteins. For the ISC system the iron sulfur cluster is
assembled on the iron sulfur cluster assembly protein IscU. IscU contains three conserved cysteins
that form disulphide bonds with cysteins of the Sulfur donor IscS. IscS transfers sulfur to IscU and
the iron sulfur clusters is formed by an unknown mechanism (Ayala-Castro et al., 2008; Johnson et
al., 2005; Lill, 2009; Zheng et al., 1998). One of the conserved cysteins, cys63 in IscU has been
shown to form covalent disulphide bond with a cystein, cys328 in IscS that is essential for the IscU
mediated activation of iscS (S. Kato et al., 2002). CyaA is believed to be the donor of iron to the
cluster a in a process that depends on electron transfer from ferredoxin Fdx (Layer et al., 2006). The
next step involves release of the iron sulfur cluster from iscU, transfer to the recipient apo-proteins
and assembly of the clusters into the the apo-proteins to form the holoprotein. These processes are
believed to be mediated with the help of the chaperones HscA and HscB (figure 6).
Figure 6: The ISC system for assembly and transport of iron sulfur clusters. The cysteine
desulfurase IscS (orange) donates sulfur and donor believed to be CyaA donates the iron to the
iron sulfur scaffold protein IscU (purple). The chaperones hscA and hscB (green) mediate the
transfer of the iron sulfur cluster (black/red square) to the A type carrier iscA (ATC) that
transports the cluster to recipient apo-proteins. Figure obtained from (Py et al., 2011)
The transcription from the isc operon is controlled by IscR containing an iron sulfur cluster by
feedback inhibition (Schwartz et al., 2001). In contrast the apo form of the IscR protein, favored
under conditions of iron limitation or oxidative stress, activates transcription of the suf operon that
22
is not active under normal conditions. In this way IscR senses the environmental condition through
its iron sulfur cluster so that the SUF system is activated under conditions of iron starvation or
oxidative stress and the ISC system is derepressed (Giel et al., 2006; Yeo et al., 2006).
The SUF system is also subject to regulation by the iron sensing regulator Fur that represses
transcription of the suf system by binding to its promoter and oxyR that is an activator or suf under
oxidative stress (McHugh et al., 2003; Patzer & Hantke, 1999).
Flavin reductase Fre
Fre encodes a flavin reductase which is the general NAD(P)H flavin oxidoreductase of E. coli that
catalyse the reduction of free flavin. It constists of a 26,2 kDa monomer and has riboflavin, Flavin
Adenenine Dinucleotid (FMN) and Flavin Mononucleotide (FMN) as substrates using NADPH or
NADH as electron donors in the following reaction (Fontecave et al., 1987; Tu, 2001),
F + NAD(P)H + H → FH2 +NAD(P)+
F stands for the flavin substrates and FH2 is the reduced flavin products. Fre reduces riboflavin with
an equal affinity for NADH and NADPH. During reduction of FMN or FAD the Fre protein prefers
NADH as an electron donor (Tu, 2001).
NAD(P)H flavin oxidoreductase in E. coli plays important roles as electron transfer mediators in
activations of ribonucleotide reductases, iron metabolism and bioluminescence (Fontecave,
Gräslund, et al., 1987). Furthermore it has been shown that Fre incubated with flavins under aerobic
condition generates superoxide radicals (Gaudu et al., 1994).
The main known function of fre is activation of ribonucleotide reductase (Fontecave, Eliasson et al.,
1987). In its active form Ribonucleotide reductase contains a stable radical. Fre reduces an Fe(III)
center of the inactive ribonucleotide reductase subunit R2 to Fe(II). (Fontecave et al 1989), this is
followed by regeneration of the Fe(III) center by oxygen in a process were a tyrosine residue is
oxidated to form a stable radical and activation of ribonucleotide reductase (Fontecave et al., 1989;
Fontecave, Eliasson, et al., 1987; Fontecave, Gräslund, et al., 1987). It has been shown that E. coli
23
lacking the fre gene is less resistant to HU which is a known repressor of ribonucleotide reductase
(Coves & Fontecave, 1993).
Many of the dehydrogenases of the respiratory chain in E. coli contain flavin cofactors that are
reduced during electron transfer from organic substrates to iron sulfur clusters or quinones these are
a source for reactive oxygen species (ROS) described in the chapter about oxidative stress.
Reduced flavins also transfer electrons to ferric complexes. Flavin oxidoreductase catalyse the
reduction of ferric citrate (Fontecave, Eliasson, et al., 1987). The reduced flavins mobilize iron from
sidorophores which are iron chelating agents that function to solubilize iron. The iron is then
transferred to iron requiring apoproteins. This process is inhibited by oxygen and stimulated by the
iron free form of Ribonucleotide reductase and ferrozine (Coves & Fontecave, 1993).
Fre does not belong to the flavoprotein family, but it has both structural and functional similarities
with ferredozin NADP+ reductase (FNR) which belongs to a flavoprotein family. Both fre and FNR
have a four residue motif that is critical to flavin binding and catalytic activity (Nivière et al., 1996).
Respiration in E. coli
The respiratory system in E. coli consists of branched electron transport chains located in the
cytoplasmic membrane that all function by changing the redox state of quinones. The transport of
electrons and protons across the cell membrane leads to an electrochemical proton gradient that is
used in ATP formation. In addition to quinones the respiratory chains include electron transporting
flavoproteins, irons-sulfur proteins and cytochromes. The activity of the different electron transport
chains is dependent on the growth phase and availability of electron acceptors such as oxygen.
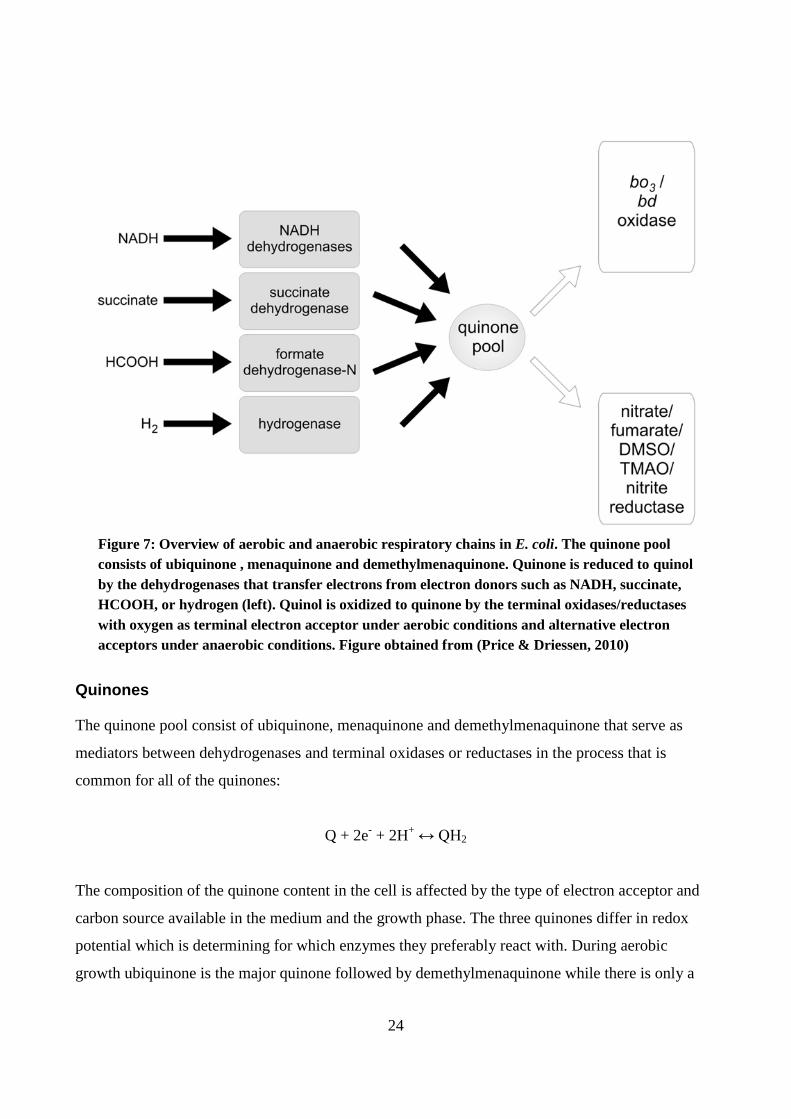
The redox state of the quinone pool can be altered by primary and terminal reductases or oxidases.
Quinone can be reduced to quinol by dehydrogenases or hydrogenase and quinol can be oxidized to
quinone by terminal oxidases or reductases. The dehydrogenases reduce quinones by transferring
electrons from electron donors like NADH, succinate, HCOOH or H2 to the quinones. Most of them
have Flavin and iron-sulfur cluster cofactors that are essential for the electron transport. The
terminal oxidases or reductates transfer electrons from quinol to terminal electron acceptors. The
preferred electron acceptor in E. coli is oxygen. When oxygen is not present electrons are
transferred to acceptors like nitrate, fumarate, dimethylsulfoxide (DMSO), and trimethylamine N-
oxide (TMAO) (figure 7)(Price & Driessen, 2010; Unden et al., 2008).
24
Figure 7: Overview of aerobic and anaerobic respiratory chains in E. coli. The quinone pool
consists of ubiquinone , menaquinone and demethylmenaquinone. Quinone is reduced to quinol
by the dehydrogenases that transfer electrons from electron donors such as NADH, succinate,
HCOOH, or hydrogen (left). Quinol is oxidized to quinone by the terminal oxidases/reductases
with oxygen as terminal electron acceptor under aerobic conditions and alternative electron
acceptors under anaerobic conditions. Figure obtained from (Price & Driessen, 2010)
Quinones
The quinone pool consist of ubiquinone, menaquinone and demethylmenaquinone that serve as
mediators between dehydrogenases and terminal oxidases or reductases in the process that is
common for all of the quinones:
Q + 2e- + 2H
+ ↔ QH2
The composition of the quinone content in the cell is affected by the type of electron acceptor and
carbon source available in the medium and the growth phase. The three quinones differ in redox
potential which is determining for which enzymes they preferably react with. During aerobic
growth ubiquinone is the major quinone followed by demethylmenaquinone while there is only a
25
very small amount of menaquinone. In contrast menaquinone is the major quinone during anaerobic
fumarate or DMSO respiration followed by demethylmenaquinone and a vere small amount of
ubiquinone. During nitrate respiration there is a large amount of all the quinones with
demethylmenaquinone as the major quinone.
Dehydrogenases
The respiratory dehydrogenases have different structural, topological and functional properties.
Some of them form a proton potential across the membrane either by redox driven proton pumps or
as a consequence of substrate oxidation on the positive side of the membrane leading to quinone
reduction and consumption of two protons on the negative side of the membrane in a so called
redox loop.
Redox loop enzymes have a binding site for their substrates on the positive side of the membrane.
The substrate donates two electrons to quinone that is located on the negative side of the membrane
with the consumptions of two protons from the negative side of the membrane. The reduced
quinone crosses the membrane and releases the two protons on the positive side by oxidation.
Thereby two protons are transferred from the negative to the positive side of the membrane so that
the redox energy is conserved (Unden & Bongaerts, 1997; Unden et al., 2008).
NADH dehydrogase I also called NADH:ubiquinone oxidoreductase is the only dehydrogenase in
the E. coli respiratory chain that is known to generate a proton potential by pumping
protons across the membrane (Brandt et al., 2003; Takao Yagi & Matsuno-Yagi, 2003). It is
homologue to complex I of the respiratory chain in mitochondria. and is active in both aerobic and
anaerobic respiration (Leif et al., 1993). It is the preferred NADH dehydrogenase under anaerobic
conditions (Tran et al., 1997) and is a large enzyme consisting of 13 subunits encoded by nuoA-N. It
contains a six subunit peripheral arm with a bound FMN cofactor and nine ligand sites for iron-
sulfur clusters that transfer electrons from NADH to the membrane part of NADH dehydrogenase
(Friedrich et al., 1998; Yagi et al., 1998; Yagi & Matsuno-Yagi, 2003). The membrane part of
NADH dehydrogenase I consists of 7 subunits and contains a site for quinone reduction and plays
an important role in proton translocation.
26
NADH dehydrogenase II is the preferred NADH dehydrogenase under aerobic conditions and does
not seem to function under anaerobic conditions (Spiro et al., 1989; Tran et al., 1997). It is a single
subunit enzyme encoded by the ndh gene that contains a noncovalently bound FAD cofactor
mediating the transfer of electrons from NADH to the quinones (Björklöf et al., 2000; Jaworowski
et al., 1981).
E. coli contains the two respiratory formate dehydrogenases; formate dehydrogenase O encoded by
fdoGHI expressed under aerobic conditions and formate dehydrogenase N encoded by fdnGHI that
is expressed under anaerobic conditions in the presence of nitrate (Abaibou et al., 1995; Berg et al.,
1991; G Unden & Bongaerts, 1997). The formate dehydrogenase N is a three subunit enzyme that
contains two peripheral membrane subunits and an integral membrane subunit. Formate
dehydrogenase N and possibly also formate dehydrogenase O generate a proton potential across the
membrane by redox loops. Formate provided either from the medium or from mixed/formic acid
fermentation transfers two electrons from formate to quinone in a reaction were two protons is
consumed from the cytosol and released on the periplasmic side of the membrane. One of the
peripheral subunits of formate dehydrogenase N contains four iron-sulfur clusters that mediate the
transfer of electrons (Jormakka et al., 2002). The formate dehydrogenase O is not well
characterized, but is believed to have similar structure and function as formate dehydrogenase N
(Benoit et al., 1998).
E. coli contains the hydrogenases; hydrogenase 1, encoded by hyaABCDEF, hydrogenase 2
encoded by hybOABCDEFG and hydrogenase 3 encoded by hycABCDEFGHI (Böhm et al., 1990;
Menon et al., 1994; Sargent et al., 1998). They are all expressed under anaerobic conditions and
contain Ni-Fe cofactors. Hydrogenase 1 and hydrogenase 2 link the oxidation of H2 to reduction of
quinone. Hydrogenase 3 is part of the formate-hydrogen-lyase complexes FHL (Böhm et al., 1990;
Menon et al., 1994; Sargent et al., 1998).
Succinate dehydrogenase is encoded by sdhAB and is expressed under aerobic conditions. It couples
the oxidation of succinate to the reduction of ubiquinone and is thus both a part of the citric acid
cycle and the respiratory chain in E. coli. Succinate dehydrogenase contains a covalently bound
FAD cofactor and four iron sulfur clusters. During succinate reduction, FAD is reduced to FADH2
and the electrons from FADH2 are transported via iron sulfur clusters in FdhB and utilized for
reduction of ubiquinone. Succinate dehydrogenase both consumes and releases protons on the same
27
side of the membrane during quinone reduction. Because the process does not involve transfer of
protons across the membrane it does not contribute to generation of a proton potential
(Yankovskaya et al., 2003).
Terminal oxidases
E. coli contains three terminal oxidases that oxidize quinol to quinone with oxygen as electron
acceptor.
Cytochrome o oxidase encoded by the cyoABCDE operon with oxygen as a terminal electron
acceptor is essential for oxidation of quinol to quinone under aerobic conditions. It is also termed
cytochrome bo3 oxidase and contains a heme-Cu cofactor and couples the oxidation of heme-Cu to
H+ pumping across the membrane and generation of a proton potential (Miller & Gennis, 1985).
Under micro aerobic conditions the cytochrome bd oxidase encoded by cydAB is the preferred
terminal reductase (Green et al., 1984).
Cyd or Cyo receives electrons from conversion of protoporphyrinogen IX to protoporphyrin IX.
This process is mediated by the FMN enzyme protoporphytinogen IX oxidase (PPO). PPO transfers
six electrons to cytochrome bd (Cyd) or Cyo. Cyd or Cyo create a proton potential via the
membrane by reduction of O2 to form H2O (Möbius et al., 2010).
The third terminal oxidase is encoded by appC and is a bd oxidase like Cyd, it is believed to
function under micro aerobic conditions, but is not well characterized (Borisov et al., 2011).
During anaerobic conditions nitrate is the preferred terminal electron acceptor. E. coli contains three
nitrate reductases encoded by narGHI, narZYWV, napABC that catalyze the reduction of nitrate to
nitrite under anaerobic conditions.
Oxidative stress
When bacteria are growing aerobically they produce reactive oxidative species (ROS) as a
consequence of accidental collision of oxygen with redox enzymes. These species can damage the
cells in various ways, thus bacteria have scavenging enzymes and repair systems that can prevent
the damaging effect of ROS.
Superoxide O2- and hydrogen peroxide H2O2 is generated when oxygen accidently accept electrons
from redox enzymes designated for electron transfer to various processes in the cell (Imlay, 2003).
28
The production of ROS is thus an inevitable consequence of aerobic metabolism and E. coli has
scavenging enzymes and repair systems to prevent the damages of ROS. Superoxide dismutase
(SOD) that degrades superoxide and catalase and peroxidase that degrade hydrogen peroxide are
example of enzymes that scavenge ROS. Cells lacking these enzymes grow like wild type strains
under anaerobic conditions but show poor growth under aerobic conditions (Carlioz & Touati,
1986; Seaver & Imlay, 2001).
In order for oxygen to accept electrons from redox enzymes, they must be capable of univalent
electron transfer. Reduced flavins and iron sulfur clusters are enzymes in the respiratory chain that
meet this criterion. The rate of formation of O2- and H2O2 in the cells is dependendent on the
frequency of collision of reduced flavins and oxygen. There is a large amount of enzymes in the
respiratory chains that have this ability. The respiratory dehydrogenases in E. coli contain flavin
cofactors. The reduced flavins normally transfer electrons to quinones or to iron-sulfur clusters but
can be oxidized if they collide with oxygen to produce O2- or H2O2. A large quantity of the O2
- and
H2O2 that is formed in the cells is a result of collision of electron transporting enzymes in the
respiratory dehydrogenases with oxygen (Kussmaul & Hirst, 2006; Messner & Imlay, 1999).
O2- stress causes growth defects to cells as a consequence to damage of various biomolecules in the
cells. The molecules that are damaged by O2- include iron-sulfur clusters, aromatic and sulfur
containing amino acids and short chain sugars.
Adaption to anaerobic and microaerobic conditions
Respiration in E. coli respond to altered oxygen conditions by switching to respiratory enzymes that
match the environmental conditions. There are different mechanisms to sense the oxygen tensions
in E. coli. The regulatory protein Fumarate and Nitrate reductase FNR senses the oxygen tension
via its iron sulfur cluster (Trageser & Unden, 1989). Fnr belongs to the Crp (cyclic AMP receptor
protein) transcription factor superfamily of proteins (Shaw et al., 1983). It is present in equal
amount during aerobic and anaerobic growth, but is only active under anaerobic conditions (Becker
et al., 1996; Gunsalus, 1992). FNR positively regulates genes involved in anaerobic metabolism
such as enzymes in anaerobic respiration that mediate reduction of other terminal electron acceptors
than oxygen (Lin and Iuchi 1991) and represses genes involved in aerobic metabolism. During
29
aerobic conditions the apo-form of FNR is facilitated resulting in inactivation of the transcription
factor (Green et al., 1996)
The ArcB/ArcA two component system
The two component system Aerobic Respiration Control ArcA/ArcB regulates the transcription of a
large number of genes in response to respiratory growth conditions. It consists of the membrane
anchored sensor kinase ArcB and the cytosolic response regulator ArcA (Iuchi & Lin, 1988; Iuchi et
al., 1990). It is activated by the transition from aerobic to microaerobic conditions and remains
active under anaerobic conditions. The ArcA/ArcB system does not sense oxygen tension directly
but senses the redox state and composition of the quinone/quinole pool (Bekker et al., 2010;
Malpica et al., 2004, 2006).
Under reducing conditions ArcB autophosphorylates and activates ArcA by transphosphorylation
(Georgellis et al., 1999). ArcA negatively regulates genes involved in the citric acid circle,
glyoxylase shunt and respiratory genes including those encoding NADH dehydrogenase, succinate
dehydrogenase, cytochrome o oxidase. It also negatively regulates genes involved in amino acid
metabolism, iron metabolism and carbon source transport. ArcA positively regulates the terminal
oxidase cytochrome bd oxidase , genes involved in fermentation, the ferrous iron transporter
feoABC, and the transcriptional activator AppY that is involved in anaerobic gene regulation (Atlung
& Brøndsted, 1994; Lin & Iuchi, 1991; Lynch & Lin, 1996; Unden et al., 1995). ArcB has been
shown to be repressed by ubiquinone, however recent studies have shown that activation of
ArcB/ArcA is not only dependent on the ubiquinone/ubiquinol pool but also is activated by the
menaquinone/menaquinol pool and fermentative products like D-lactate, acetate and pyruvate
(Alvarez et al., 2013; Bekker et al., 2010; Iuchi, 1993; Rolfe et al., 2011).
It has been shown that ArcA is active in strains lacking the cyd or cyo genes under aerobic
conditions and that a strain were both cydAB, cyoABCD and appC had been deleted reduced oxygen
uptake by 85% under aerobic conditions and led to activation of ArcA under aerobic conditions
(Iuchi et al., 1990; Portnoy et al., 2010). The reduction of oxygen uptake was explained by that the
deletion of all the aerobic terminal oxidases would lead to a shift in the qionone pool from
ubiqionone/ubiquinone to menaquinone/menaquinol and that this shift in the quinone pool resulted
30
in activation of the ArcB/ArcA system. This assumption was confirmed by a group who showed
that menaquinols are required for ArcB activation (Alvarez et al., 2013).
Iron sulfur clusters can be both targets and sources of ROS.It has been shown that irons-sulfur
cluster containing dehydratases which include enzymes in branched chain aminoacid and citric acid
cycle pathways like aconitase B and fumarate dehydratase A and B can be oxidized by O2- or H2O2
so that the catalytic iron atom is lost and the enzyme becomes inactive (Flint et al., 1993; Gardner &
Fridovich, 1991; Liochev & Fridovich, 1993) and the citric acid cycle to lose function under
oxidative stress. This reaction also results in the release of a free iron atom from the damaged
cluster that can damage aromatic and sulfur containing amino acids.
Free iron released from iron-sulfur clusters damaged by O2- or H2O2 can react with H2O2 to form
hydroxyl radicals HO∙ which are very mutagenic to DNA in a process where the ferrous iron Fe2+
donates an electron to H2O2 and form Fe3+
and HO∙. This reaction is called the Fenton reaction
(Imlay, 2003). The iron is called “free iron” because it is not bound to any enzyme and can also
originate from spontaneous demetallation of major aconitases or has escaped from iron trafficking
processes in the cell. DNA damages due to HO∙ are blocked by iron chelators and increased by
upregulation of genes involved in iron import (Imlay et al., 1988; Touati et al., 1995). Furthermore
elevated levels of reduced flavin, FADH2 and cysteine increase DNA damages due to their ability to
reduce free iron and thereby causing oxidative damage (Park & Imlay, 2003; Woodmansee &
Imlay, 2002).
31
References
Abaibou, H., Pommier, J., Benoit, S., Giordano, G., & Mandrand-Berthelot, M. A. (1995).
Expression and characterization of the Escherichia coli fdo locus and a possible physiological role
for aerobic formate dehydrogenase. Journal of Bacteriology, 177(24), 7141–9.
Alvarez, A. F., Rodriguez, C., & Georgellis, D. (2013). Ubiquinone and menaquinone electron
carriers represent the yin and yang in the redox regulation of the ArcB sensor kinase. Journal of
Bacteriology, 195(13), 3054–61.
Atlung, T., & Brøndsted, L. (1994). Role of the transcriptional activator AppY in regulation of the
cyx appA operon of Escherichia coli by anaerobiosis, phosphate starvation, and growth phase.
Journal of Bacteriology, 176(17), 5414–22.
Ayala-Castro, C., Saini, A., & Outten, F. W. (2008). Fe-S cluster assembly pathways in bacteria.
Microbiology and Molecular Biology Reviews : MMBR, 72(1), 110–25, table of contents.
Becker, S., Holighaus, G., Gabrielczyk, T., & Unden, G. (1996). O2 as the regulatory signal for
FNR-dependent gene regulation in Escherichia coli. Journal of Bacteriology, 178(15), 4515–21.
Beinert, H. (1997). Iron-Sulfur Clusters: Nature’s Modular, Multipurpose Structures. Science,
277(5326), 653–659.
Bekker, M., Alexeeva, S., Laan, W., Sawers, G., Teixeira de Mattos, J., & Hellingwerf, K. (2010).
The ArcBA two-component system of Escherichia coli is regulated by the redox state of both the
ubiquinone and the menaquinone pool. Journal of Bacteriology, 192(3), 746–754.
Benoit, S., Abaibou, H., & Mandrand-Berthelot, M. A. (1998). Topological analysis of the aerobic
membrane-bound formate dehydrogenase of Escherichia coli. Journal of Bacteriology, 180(24),
6625–34.
32
Berg, B. L., Li, J., Heider, J., & Stewart, V. (1991). Nitrate-inducible formate dehydrogenase in
Escherichia coli K-12. I. Nucleotide sequence of the fdnGHI operon and evidence that opal (UGA)
encodes selenocysteine. The Journal of Biological Chemistry, 266(33), 22380–5.
Björklöf, K., Zickermann, V., & Finel, M. (2000). Purification of the 45 kDa, membrane bound
NADH dehydrogenase of Escherichia coli (NDH-2) and analysis of its interaction with ubiquinone
analogues. FEBS Letters, 467(1), 105–10.
Booker, S. J., Cicchillo, R. M., & Grove, T. L. (2007). Self-sacrifice in radical S-
adenosylmethionine proteins. Current Opinion in Chemical Biology, 11(5), 543–52.
Borisov, V. B., Gennis, R. B., Hemp, J., & Verkhovsky, M. I. (2011). The cytochrome bd
respiratory oxygen reductases. Biochimica et Biophysica Acta, 1807(11), 1398–413.
Boye, E., Løbner-Olesen, A., & Skarstad, K. (2000). Limiting DNA replication to once and only
once. EMBO Reports, 1(6), 479–83.
Boye, E., Stokke, T., Kleckner, N., & Skarstad, K. (1996). Coordinating DNA replication initiation
with cell growth: differential roles for DnaA and SeqA proteins. Proceedings of the National
Academy of Sciences of the United States of America, 93(22), 12206–11.
Brandt, U., Kerscher, S., Dröse, S., Zwicker, K., & Zickermann, V. (2003). Proton pumping by
NADH:ubiquinone oxidoreductase. A redox driven conformational change mechanism? FEBS
Letters, 545(1), 9–17.
Böhm, R., Sauter, M., & Böck, A. (1990). Nucleotide sequence and expression of an operon in
Escherichia coli coding for formate hydrogenlyase components. Molecular Microbiology, 4(2),
231–43.
Boye, E., Løbner-Olesen, A. (1990) The role of dam metyltransferase in the control of DNA
replication in E. coli. Cell 62(5):981-9
33
Campbell, J. L., & Kleckner, N. (1990). E. coli oriC and the dnaA gene promoter are sequestered
from dam methyltransferase following the passage of the chromosomal replication fork. Cell, 62(5),
967–79.
Carlioz, A., & Touati, D. (1986). Isolation of superoxide dismutase mutants in Escherichia coli: is
superoxide dismutase necessary for aerobic life? The EMBO Journal, 5(3), 623–30.
Charbon, G., Riber, L., Cohen, M., Skovgaard, O., Fujimitsu, K., Katayama, T., & Løbner-Olesen,
A. (2011). Suppressors of DnaA(ATP) imposed overinitiation in Escherichia coli. Molecular
Microbiology, 79(4), 914–28.
Cooper, S., & Helmstetter, C. E. (1968). Chromosome replication and the division cycle of
Escherichia coli B/r. Journal of Molecular Biology, 31(3), 519–40.
Coves, J., & Fontecave, M. (1993). Reduction and mobilization of iron by a NAD(P)H:flavin
oxidoreductase from Escherichia coli. European Journal of Biochemistry / FEBS, 211(3), 635–641.
Donachie, W. D. (1968). Relationship between cell size and time of initiation of DNA replication.
Nature, 219(5158), 1077–9.
Erzberger, J. P., Mott, M. L., & Berger, J. M. (2006). Structural basis for ATP-dependent DnaA
assembly and replication-origin remodeling. Nature Structural & Molecular Biology, 13(8), 676–
83.
Flint, D. H., Tuminello, J. F., & Emptage, M. H. (1993). The inactivation of Fe-S cluster containing
hydro-lyases by superoxide. The Journal of Biological Chemistry, 268(30), 22369–76.
Fontecave, M. (2006). Iron-sulfur clusters: ever-expanding roles. Nature Chemical Biology, 2(4),
171–4.
Fontecave, M., Eliasson, R., & Reichard, P. (1987). NAD(P)H:flavin oxidoreductase of Escherichia
coli. A ferric iron reductase participating in the generation of the free radical of ribonucleotide
reductase. The Journal of Biological Chemistry, 262(25), 12325–31.
34
Fontecave, M., Eliasson, R., & Reichard, P. (1989). Enzymatic regulation of the radical content of
the small subunit of Escherichia coli ribonucleotide reductase involving reduction of its redox
centers. The Journal of Biological Chemistry, 264(16), 9164–70.
Fontecave, M., Gräslund, a, & Reichard, P. (1987). The function of superoxide dismutase during the
enzymatic formation of the free radical of ribonucleotide reductase. The Journal of Biological
Chemistry, 262(25), 12332–6.
Friedrich, T., Abelmann, A., Brors, B., Guénebaut, V., Kintscher, L., Leonard, K., … Weiss, H.
(1998). Redox components and structure of the respiratory NADH:ubiquinone oxidoreductase
(complex I). Biochimica et Biophysica Acta, 1365(1-2), 215–9.
Fujimitsu, K., Senriuchi, T., & Katayama, T. (2009). Specific genomic sequences of E. coli promote
replicational initiation by directly reactivating ADP-DnaA. Genes & Development, 23(10), 1221–
33.
Fujimitsu, K., Su’etsugu, M., Yamaguchi, Y., Mazda, K., Fu, N., Kawakami, H., & Katayama, T.
(2008). Modes of overinitiation, dnaA gene expression, and inhibition of cell division in a novel
cold-sensitive hda mutant of Escherichia coli. Journal of Bacteriology, 190(15), 5368–5381.
Gardner, P. R., & Fridovich, I. (1991). Superoxide sensitivity of the Escherichia coli aconitase. The
Journal of Biological Chemistry, 266(29), 19328–33.
Gaudu, P., Touati, D., Nivière, V., & Fontecave, M. (1994). The NAD(P)H:flavin oxidoreductase
from Escherichia coli as a source of superoxide radicals. The Journal of Biological Chemistry,
269(11), 8182–8188.
Georgellis, D., Kwon, O., & Lin, E. C. (1999). Amplification of signaling activity of the arc two-
component system of Escherichia coli by anaerobic metabolites. An in vitro study with different
protein modules. The Journal of Biological Chemistry, 274(50), 35950–4.
35
Giel, J. L., Rodionov, D., Liu, M., Blattner, F. R., & Kiley, P. J. (2006). IscR-dependent gene
expression links iron-sulphur cluster assembly to the control of O2-regulated genes in Escherichia
coli. Molecular Microbiology, 60(4), 1058–75.
Gon, S., Camara, J. E., Klungsøyr, H. K., Crooke, E., Skarstad, K., & Beckwith, J. (2006). A novel
regulatory mechanism couples deoxyribonucleotide synthesis and DNA replication in Escherichia
coli. The EMBO Journal, 25(5), 1137–47.
Green, G. N., Kranz, J. E., & Gennis, R. B. (1984). Cloning the cyd gene locus coding for the
cytochrome d complex of Escherichia coli. Gene, 32(1-2), 99–106.
Green, J., Bennett, B., Jordan, P., Ralph, E. T., Thomson, A. J., & Guest, J. R. (1996).
Reconstitution of the [4Fe-4S] cluster in FNR and demonstration of the aerobic-anaerobic
transcription switch in vitro. The Biochemical Journal, 316 ( Pt 3, 887–92.
Gunsalus, R. P. (1992). Control of electron flow in Escherichia coli: coordinated transcription of
respiratory pathway genes. Journal of Bacteriology, 174(22), 7069–74.
Hansen, F.G., Christensen, B.B., Atlung, T. (1991) The initiator titration model: computer
simulation of chromosome and minichromosome control. Res Microbiol 142(2-3): 161-7
Hansen, F. G., Christensen, B. B., & Atlung, T. (2007). Sequence characteristics required for
cooperative binding and efficient in vivo titration of the replication initiator protein DnaA in E. coli.
Journal of Molecular Biology, 367(4), 942–52.
Herrick, J., & Sclavi, B. (2007). Ribonucleotide reductase and the regulation of DNA replication: an
old story and an ancient heritage. Molecular Microbiology, 63(1), 22–34.
Imlay, J. a. (2003). Pathways of oxidative damage. Annual Review of Microbiology, 57, 395–418.
Imlay, J. A. (2008). Cellular defenses against superoxide and hydrogen peroxide. Annual Review of
Biochemistry, 77, 755–76.
36
Imlay, J. A., Chin, S. M., & Linn, S. (1988). Toxic DNA damage by hydrogen peroxide through the
Fenton reaction in vivo and in vitro. Science (New York, N.Y.), 240(4852), 640–2.
Iuchi, S. (1993). Phosphorylation/dephosphorylation of the receiver module at the conserved
aspartate residue controls transphosphorylation activity of histidine kinase in sensor protein ArcB of
Escherichia coli. The Journal of Biological Chemistry, 268(32), 23972–80.
Iuchi, S., & Lin, E. C. (1988). arcA (dye), a global regulatory gene in Escherichia coli mediating
repression of enzymes in aerobic pathways. Proceedings of the National Academy of Sciences of the
United States of America, 85(6), 1888–92.
Iuchi, S., Matsuda, Z., Fujiwara, T., & Lin, E. C. (1990). The arcB gene of Escherichia coli encodes
a sensor-regulator protein for anaerobic repression of the arc modulon. Molecular Microbiology,
4(5), 715–27.
Jacobson, B. A., & Fuchs, J. A. (1998a). A 45 bp inverted repeat is required for cell cycle regulation
of the Escherichia coli nrd operon. Molecular Microbiology, 28(6), 1307–14.
Jacobson, B. A., & Fuchs, J. A. (1998b). Multiple cis-acting sites positively regulate Escherichia
coli nrd expression. Molecular Microbiology, 28(6), 1315–22.
Jaworowski, A., Campbell, H. D., Poulis, M. I., & Young, I. G. (1981). Genetic identification and
purification of the respiratory NADH dehydrogenase of Escherichia coli. Biochemistry, 20(7),
2041–7.
Johnson, D. C., Dean, D. R., Smith, A. D., & Johnson, M. K. (2005). Structure, function, and
formation of biological iron-sulfur clusters. Annual Review of Biochemistry, 74, 247–81.
Jordan, A., Aragall, E., Gibert, I., & Barbe, J. (1996). Promoter identification and expression
analysis of Salmonella typhimurium and Escherichia coli nrdEF operons encoding one of two class
I ribonucleotide reductases present in both bacteria. Molecular Microbiology, 19(4), 777–90.
37
Jormakka, M., Törnroth, S., Byrne, B., & Iwata, S. (2002). Molecular basis of proton motive force
generation: structure of formate dehydrogenase-N. Science (New York, N.Y.), 295(5561), 1863–8.
Kasho, K., & Katayama, T. (2013). DnaA binding locus datA promotes DnaA-ATP hydrolysis to
enable cell cycle-coordinated replication initiation. Proceedings of the National Academy of
Sciences of the United States of America, 110(3), 936–41.
Katayama, T., Kubota, T., Kurokawa, K., Crooke, E., & Sekimizu, K. (1998). The initiator function
of DnaA protein is negatively regulated by the sliding clamp of the E. coli chromosomal replicase.
Cell, 94(1), 61–71.
Kato, J., & Katayama, T. (2001). Hda, a novel DnaA-related protein, regulates the replication cycle
in Escherichia coli. The EMBO Journal, 20(15), 4253–62.
Kato, S., Mihara, H., Kurihara, T., Takahashi, Y., Tokumoto, U., Yoshimura, T., & Esaki, N.
(2002). Cys-328 of IscS and Cys-63 of IscU are the sites of disulfide bridge formation in a
covalently bound IscS/IscU complex: implications for the mechanism of iron-sulfur cluster
assembly. Proceedings of the National Academy of Sciences of the United States of America, 99(9),
5948–52.
Kawakami, H., Keyamura, K., & Katayama, T. (2005). Formation of an ATP-DnaA-specific
initiation complex requires DnaA Arginine 285, a conserved motif in the AAA+ protein family. The
Journal of Biological Chemistry, 280(29), 27420–30.
Keyamura, K., Fujikawa, N., Ishida, T., Ozaki, S., Su’etsugu, M., Fujimitsu, K., … Katayama, T.
(2007). The interaction of DiaA and DnaA regulates the replication cycle in E. coli by directly
promoting ATP DnaA-specific initiation complexes. Genes & Development, 21(16), 2083–99.
Kiley, P. J., & Beinert, H. (2003). The role of Fe-S proteins in sensing and regulation in bacteria.
Current Opinion in Microbiology, 6(2), 181–5.
38
Kitagawa, R., Ozaki, T., Moriya, S., & Ogawa, T. (1998). Negative control of replication initiation
by a novel chromosomal locus exhibiting exceptional affinity for Escherichia coli DnaA protein.
Genes & Development, 12(19), 3032–43.
Kussmaul, L., & Hirst, J. (2006). The mechanism of superoxide production by NADH:ubiquinone
oxidoreductase (complex I) from bovine heart mitochondria. Proceedings of the National Academy
of Sciences of the United States of America, 103(20), 7607–12.
Layer, G., Ollagnier-de Choudens, S., Sanakis, Y., & Fontecave, M. (2006). Iron-sulfur cluster
biosynthesis: characterization of Escherichia coli CYaY as an iron donor for the assembly of [2Fe-
2S] clusters in the scaffold IscU. The Journal of Biological Chemistry, 281(24), 16256–63.
Leif, H., Weidner, U., Berger, A., Spehr, V., Braun, M., van Heek, P., … Weiss, H. (1993).
Escherichia coli NADH dehydrogenase I, a minimal form of the mitochondrial complex I.
Biochemical Society Transactions, 21(4), 998–1001.
Lill, R. (2009). Function and biogenesis of iron-sulphur proteins. Nature, 460(7257), 831–838.
Lin, E. C., & Iuchi, S. (1991). Regulation of gene expression in fermentative and respiratory
systems in Escherichia coli and related bacteria. Annual Review of Genetics, 25, 361–87.
Liochev, S. I., & Fridovich, I. (1993). Modulation of the fumarases of Escherichia coli in response
to oxidative stress. Archives of Biochemistry and Biophysics, 301(2), 379–84.
Lu, M., Campbell, J. L., Boye, E., & Kleckner, N. (1994). SeqA: a negative modulator of
replication initiation in E. coli. Cell, 77(3), 413–26.
Lynch, A. S., & Lin, E. C. (1996). Transcriptional control mediated by the ArcA two-component
response regulator protein of Escherichia coli : characterization of DNA binding at target promoters.
J. Bact 178(21), 6238-49
39
Malpica, R., Franco, B., Rodriguez, C., Kwon, O., & Georgellis, D. (2004). Identification of a
quinone-sensitive redox switch in the ArcB sensor kinase. Proceedings of the National Academy of
Sciences of the United States of America, 101(36), 13318–23.
Malpica, R., Sandoval, G. R. P., Rodríguez, C., Franco, B., & Georgellis, D. (2006). Signaling by
the Arc Two-Component System Provides a Link Between the Redox State of the Quinone Pool
and Gene Expression, 8.
Margulies, C., & Kaguni, J. M. (1996). Ordered and sequential binding of DnaA protein to oriC, the
chromosomal origin of Escherichia coli. The Journal of Biological Chemistry, 271(29), 17035–40.
McGarry, K. C., Ryan, V. T., Grimwade, J. E., & Leonard, A. C. (2004). Two discriminatory
binding sites in the Escherichia coli replication origin are required for DNA strand opening by
initiator DnaA-ATP. Proceedings of the National Academy of Sciences of the United States of
America, 101(9), 2811–6.
McHugh, J. P., Rodríguez-Quinoñes, F., Abdul-Tehrani, H., Svistunenko, D. A., Poole, R. K.,
Cooper, C. E., & Andrews, S. C. (2003). Global iron-dependent gene regulation in Escherichia coli.
A new mechanism for iron homeostasis. The Journal of Biological Chemistry, 278(32), 29478–86.
Menon, N. K., Chatelus, C. Y., Dervartanian, M., Wendt, J. C., Shanmugam, K. T., Peck, H. D., &
Przybyla, A. E. (1994). Cloning, sequencing, and mutational analysis of the hyb operon encoding
Escherichia coli hydrogenase 2. Journal of Bacteriology, 176(14), 4416–23.
Messner, K. R., & Imlay, J. A. (1999). The identification of primary sites of superoxide and
hydrogen peroxide formation in the aerobic respiratory chain and sulfite reductase complex of
Escherichia coli. The Journal of Biological Chemistry, 274(15), 10119–28.
Miller, M. J., & Gennis, R. B. (1985). The cytochrome d complex is a coupling site in the aerobic
respiratory chain of Escherichia coli. The Journal of Biological Chemistry, 260(26), 14003–8.
40
Möbius, K., Arias-Cartin, R., Breckau, D., Hännig, A.-L., Riedmann, K., Biedendieck, R., … Jahn,
D. (2010). Heme biosynthesis is coupled to electron transport chains for energy generation.
Proceedings of the National Academy of Sciences of the United States of America, 107(23), 10436–
10441.
Nivière, V., Fieschi, F., Décout, J. L., & Fontecave, M. (1996). Is the NAD(P)H:flavin
oxidoreductase from Escherichia coli a member of the ferredoxin-NADP+ reductase family?.
Evidence for the catalytic role of serine 49 residue. The Journal of Biological Chemistry, 271(28),
16656–61.
Nordlund, P., & Reichard, P. (2006). Ribonucleotide reductases. Annual Review of Biochemistry,
75, 681–706.
Olliver, A., Saggioro, C., Herrick, J., & Sclavi, B. (2010). DnaA-ATP acts as a molecular switch to
control levels of ribonucleotide reductase expression in Escherichia coli. Molecular Microbiology,
76(6), 1555–71.
Park, S., & Imlay, J. A. (2003). High levels of intracellular cysteine promote oxidative DNA
damage by driving the fenton reaction. Journal of Bacteriology, 185(6), 1942–50.
Patzer, S. I., & Hantke, K. (1999). SufS is a NifS-like protein, and SufD is necessary for stability of
the [2Fe-2S] FhuF protein in Escherichia coli. Journal of Bacteriology, 181(10), 3307–9.
Portnoy, V. a, Scott, D. a, Lewis, N. E., Tarasova, Y., Osterman, A. L., & Palsson, B. Ø. (2010).
Deletion of genes encoding cytochrome oxidases and quinol monooxygenase blocks the aerobic-
anaerobic shift in Escherichia coli K-12 MG1655. Applied and Environmental Microbiology,
76(19), 6529–6540.
Price, C. E., & Driessen, A. J. M. (2010). Biogenesis of membrane bound respiratory complexes in
Escherichia coli. Biochimica et Biophysica Acta, 1803(6), 748–766.
41
Py, B., Moreau, P. L., & Barras, F. (2011). Fe-S clusters, fragile sentinels of the cell. Current
Opinion in Microbiology, 14(2), 218–23.
Riber, L., Olsson, J. A., Jensen, R. B., Skovgaard, O., Dasgupta, S., Marinus, M. G., & Løbner-
Olesen, A. (2006). Hda-mediated inactivation of the DnaA protein and dnaA gene autoregulation
act in concert to ensure homeostatic maintenance of the Escherichia coli chromosome. Genes &
Development, 20(15), 2121–34.
Rolfe, M. D., Ter Beek, A., Graham, A. I., Trotter, E. W., Asif, H. M. S., Sanguinetti, G., … Green,
J. (2011). Transcript profiling and inference of Escherichia coli K-12 ArcA activity across the range
of physiologically relevant oxygen concentrations. The Journal of Biological Chemistry, 286(12),
10147–10154.
Ryan, V. T., Grimwade, J. E., Nievera, C. J., & Leonard, A. C. (2002). IHF and HU stimulate
assembly of pre-replication complexes at Escherichia coli oriC by two different mechanisms.
Molecular Microbiology, 46(1), 113–24.
Samitt, C.E., Hansen, F.G., Miller, J.F., Scaechter, M. (1989) In vivo studies of DnaA binding to
the origin of replication of Escherichia coli. EMBO J Mar8(3): 989-93.
Sargent, F., Ballantine, S. P., Rugman, P. A., Palmer, T., & Boxer, D. H. (1998). Reassignment of
the gene encoding the Escherichia coli hydrogenase 2 small subunit--identification of a soluble
precursor of the small subunit in a hypB mutant. European Journal of Biochemistry / FEBS, 255(3),
746–54.
Schwartz, C. J., Giel, J. L., Patschkowski, T., Luther, C., Ruzicka, F. J., Beinert, H., & Kiley, P. J.
(2001). IscR, an Fe-S cluster-containing transcription factor, represses expression of Escherichia
coli genes encoding Fe-S cluster assembly proteins. Proceedings of the National Academy of
Sciences of the United States of America, 98(26), 14895–900.
Seaver, L. C., & Imlay, J. A. (2001). Alkyl hydroperoxide reductase is the primary scavenger of
endogenous hydrogen peroxide in Escherichia coli. Journal of Bacteriology, 183(24), 7173–81.
42
Sekimizu, K., Bramhill, D., & Kornberg, A. (1987). ATP activates dnaA protein in initiating
replication of plasmids bearing the origin of the E. coli chromosome. Cell, 50(2), 259–65.
Shaw, D. J., Rice, D. W., & Guest, J. R. (1983). Homology between CAP and Fnr, a regulator of
anaerobic respiration in Escherichia coli. Journal of Molecular Biology, 166(2), 241–7.
Skarstad, K., & Katayama, T. (2013). Regulating DNA replication in bacteria. Cold Spring Harbor
Perspectives in Biology, 5(4), a012922.
Skarstad, K., Løbner-Olesen, A., Atlung, T., von Meyenburg, K., & Boye, E. (1989). Initiation of
DNA replication in Escherichia coli after overproduction of the DnaA protein. Molecular &
General Genetics : MGG, 218(1), 50–6.
Speck, C., & Messer, W. (2001). Mechanism of origin unwinding: sequential binding of DnaA to
double- and single-stranded DNA. The EMBO Journal, 20(6), 1469–76.
Speck, C., Weigel, C., & Messer, W. (1999). ATP- and ADP-dnaA protein, a molecular switch in
gene regulation. The EMBO Journal, 18(21), 6169–76.
Spiro, S., Roberts, R. E., & Guest, J. R. (1989). FNR-dependent repression of the ndh gene of
Escherichia coli and metal ion requirement for FNR-regulated gene expression. Molecular
Microbiology, 3(5), 601–8.
Su’etsugu, M., Shimuta, T.-R., Ishida, T., Kawakami, H., & Katayama, T. (2005). Protein
associations in DnaA-ATP hydrolysis mediated by the Hda-replicase clamp complex. The Journal
of Biological Chemistry, 280(8), 6528–36.
Su’etsugu, M., Takata, M., Kubota, T., Matsuda, Y., & Katayama, T. (2004). Molecular mechanism
of DNA replication-coupled inactivation of the initiator protein in Escherichia coli: interaction of
DnaA with the sliding clamp-loaded DNA and the sliding clamp-Hda complex. Genes to Cells :
Devoted to Molecular & Cellular Mechanisms, 9(6), 509–22.
43
Sun, L., & Fuchs, J. A. (1992). Escherichia coli ribonucleotide reductase expression is cell cycle
regulated. Molecular Biology of the Cell, 3(10), 1095–105.
Takahashi, Y., & Tokumoto, U. (2002). A third bacterial system for the assembly of iron-sulfur
clusters with homologs in archaea and plastids. The Journal of Biological Chemistry, 277(32),
28380–3.
Touati, D., Jacques, M., Tardat, B., Bouchard, L., & Despied, S. (1995). Lethal oxidative damage
and mutagenesis are generated by iron in delta fur mutants of Escherichia coli: protective role of
superoxide dismutase. Journal of Bacteriology, 177(9), 2305–14.
Trageser, M., & Unden, G. (1989). Role of cysteine residues and of metal ions in the regulatory
functioning of FNR, the transcriptional regulator of anaerobic respiration in Escherichia coli.
Molecular Microbiology, 3(5), 593–9.
Tran, Q. H., Bongaerts, J., Vlad, D., & Unden, G. (1997). Requirement for the proton-pumping
NADH dehydrogenase I of Escherichia coli in respiration of NADH to fumarate and its bioenergetic
implications. European Journal of Biochemistry / FEBS, 244(1), 155–60.
Tu, S. C. (2001). Reduced flavin: donor and acceptor enzymes and mechanisms of channeling.
Antioxidants & Redox Signaling, 3(5), 881–897.
Unden, G., Becker, S., Bongaerts, J., Holighaus, G., Schirawski, J., & Six, S. (1995). O2-sensing
and O2-dependent gene regulation in facultatively anaerobic bacteria. Archives of Microbiology,
164(2), 81–90.
Unden, G., & Bongaerts, J. (1997). Alternative respiratory pathways of Escherichia coli: energetics
and transcriptional regulation in response to electron acceptors. Biochimica et Biophysica Acta,
1320(3), 217–234.
Unden, G., Unnwald, P. I. A. D., Editor, S., & Stewart, V. (2008). The Aerobic and Anaerobic
Respiratory Chain of Escherichia coli and Salmonella enterica : Enzymes and Energetics (pp. 1–
41).
44
Von Freiesleben, U., Krekling, M. A., Hansen, F. G., & Løbner-Olesen, A. (2000). The eclipse
period of Escherichia coli. The EMBO Journal, 19(22), 6240–8.
Woodmansee, A. N., & Imlay, J. A. (2002). Reduced flavins promote oxidative DNA damage in
non-respiring Escherichia coli by delivering electrons to intracellular free iron. The Journal of
Biological Chemistry, 277(37), 34055–66.
Yagi, T., & Matsuno-Yagi, A. (2003). The proton-translocating NADH-quinone oxidoreductase in
the respiratory chain: the secret unlocked. Biochemistry, 42(8), 2266–74.
Yagi, T., Yano, T., Di Bernardo, S., & Matsuno-Yagi, A. (1998). Procaryotic complex I (NDH-1),
an overview. Biochimica et Biophysica Acta, 1364(2), 125–33.
Yankovskaya, V., Horsefield, R., Törnroth, S., Luna-Chavez, C., Miyoshi, H., Léger, C., … Iwata,
S. (2003). Architecture of succinate dehydrogenase and reactive oxygen species generation. Science
(New York, N.Y.), 299(5607), 700–4.
Yeo, W.-S., Lee, J.-H., Lee, K.-C., & Roe, J.-H. (2006). IscR acts as an activator in response to
oxidative stress for the suf operon encoding Fe-S assembly proteins. Molecular Microbiology,
61(1), 206–18.
Zheng, L., Cash, V. L., Flint, D. H., & Dean, D. R. (1998). Assembly of iron-sulfur clusters.
Identification of an iscSUA-hscBA-fdx gene cluster from Azotobacter vinelandii. The Journal of
Biological Chemistry, 273(21), 13264–72.
45
Two mutations in the nrdAB promoter, nrdAB∆45IR and
nrdAB∆dnaA-box, lead to invaibility of Hda deficient
cells under aerobic conditions in Escherichia coli
Louise Bjørn1, Godefroid Charbon
1 and Anders Løbner-Olesen
1*
1 University of Copenhagen, Dept of Biology, Ole Maaløes Vej 5, DK2200 Copenhagen N,
Denmark.
2 * Corresponding author [email protected], +45 3532 2068
46
Abstract
The principal ribonucleotide reductase (RNR) of E. coli is encoded by the nrdAB operon.
Transcription of nrdAB is regulated in a cell cycle dependent manner so that initiation of replication
coincides with a burst in dNTP synthesis. Overexpression of nrdAB has been shown to suppress
growth deficiencies of an hda mutant that causes an elevated level of the initiator protein DnaA
bound to ATP in cells. The promoter region of nrdAB contains a 45bp inverted repeat important for
cell cycle control and consensus sequences for DnaA binding providing a possible link between
initiation of replication and dNTP synthesis in E. coli. Here we investigate deletion mutants of the
45bp inverted repeat and the DnaA-boxes in the nrdAB promoter. We find that these mutants are
compromised in growth due to decrease in nrdAB transcription and that the strains are synthetic
lethal in combination with deletion of hda under aerobic conditions. Furthermore we find that a
modest over expression of nrdAB in the two mutants reverts the synthetic lethality with ∆hda and
that suppression of Hda deficiency is dependent on the degree of nrdAB over expression.
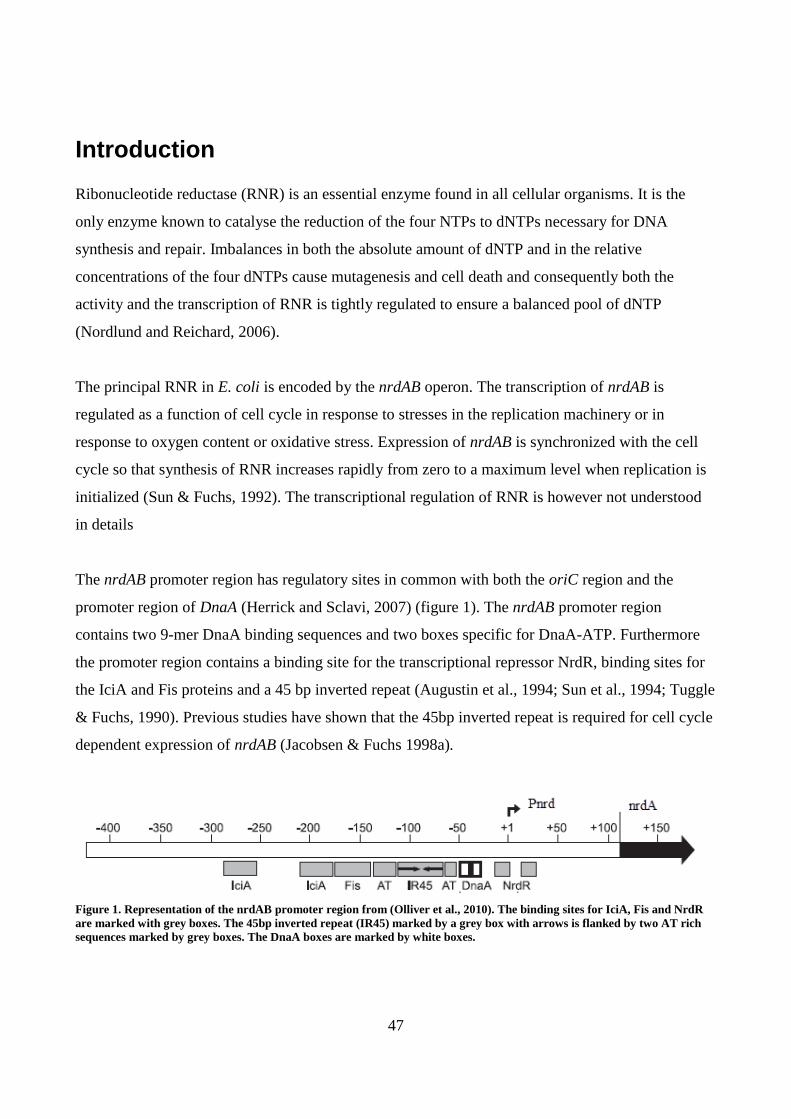
47
Introduction
Ribonucleotide reductase (RNR) is an essential enzyme found in all cellular organisms. It is the
only enzyme known to catalyse the reduction of the four NTPs to dNTPs necessary for DNA
synthesis and repair. Imbalances in both the absolute amount of dNTP and in the relative
concentrations of the four dNTPs cause mutagenesis and cell death and consequently both the
activity and the transcription of RNR is tightly regulated to ensure a balanced pool of dNTP
(Nordlund and Reichard, 2006).
The principal RNR in E. coli is encoded by the nrdAB operon. The transcription of nrdAB is
regulated as a function of cell cycle in response to stresses in the replication machinery or in
response to oxygen content or oxidative stress. Expression of nrdAB is synchronized with the cell
cycle so that synthesis of RNR increases rapidly from zero to a maximum level when replication is
initialized (Sun & Fuchs, 1992). The transcriptional regulation of RNR is however not understood
in details
The nrdAB promoter region has regulatory sites in common with both the oriC region and the
promoter region of DnaA (Herrick and Sclavi, 2007) (figure 1). The nrdAB promoter region
contains two 9-mer DnaA binding sequences and two boxes specific for DnaA-ATP. Furthermore
the promoter region contains a binding site for the transcriptional repressor NrdR, binding sites for
the IciA and Fis proteins and a 45 bp inverted repeat (Augustin et al., 1994; Sun et al., 1994; Tuggle
& Fuchs, 1990). Previous studies have shown that the 45bp inverted repeat is required for cell cycle
dependent expression of nrdAB (Jacobsen & Fuchs 1998a).
Figure 1. Representation of the nrdAB promoter region from (Olliver et al., 2010). The binding sites for IciA, Fis and NrdR
are marked with grey boxes. The 45bp inverted repeat (IR45) marked by a grey box with arrows is flanked by two AT rich
sequences marked by grey boxes. The DnaA boxes are marked by white boxes.
48
DnaA acts as a transcription factor several genes but is best known for its essential role as initiator
protein during initiation of DNA replication where it binds to the oriC region of the chromosome.
DnaA binds to ATP and ADP with equal affinity, but it is only DnaA-ATP that promotes strand
opening of the DNA, thus the ATP bound form of DnaA is called the active form (Sekimizu et al.,
1987). Initaition of replication occurs when DnaA-ADP and DnaA-ATP bind to high and low
affinity sites in the oriC region of the chromosome. Only DnaA-ATP is capable of binding to the
low affinity sites and this induces strand opening and loading of DnaB helicase and DNA
polymerase III holenzyme, enabling replication of the chromosome (Kawakami et al., 2005;
McGarry et al., 2004; Speck & Messer, 2001). After initiation of replication DnaA-ATP is
hydrolyzed to DnaA-ADP in a process called RIDA (Regulatory Inactivation of DnaA) involving
the β-subunit sliding clamp of polymerase III (DnaN) and a protein called Hda (Katayama et al.,
1998). Cells deficient in Hda suffer from overinitiation, asynchronous initiation and cell death due
to the elevated level of active DnaA (Kato & Katayama, 2001; Riber et al., 2006)
Binding of DnaA to the two 9-mer sequences of the nrdAB promoter was first shown activate
transcription of nrdAB (Augustin et al., 1994). It was found that DnaA fine tunes the expression of
nrdAB after induction of expression by gene factors other than DnaA but does not regulate the cell
cycle dependent expression of nrdAB (Sun et al., 1994). Later studies suggested that the nucleotide
bound form of DnaA couples the nrdAB expression to initiation of replication in a way where
DnaA-ATP repress transcription of nrdAB and the Hda dependent switch from DnaA-ATP to
DnaA-ADP derepresses nrdAB expression (Gon et al., 2006). This led to the suggestion that high
concentrations of DnaA-ATP repress transcription and low concentrations of DnaA-ATP activates
transcription of nrdAB (Herrick and Sclavi, 2007). This regulation of nrdAB by DnaA-ATP was, in
agreement with the previous studies, shown not to significantly influence the timing of the nrdAB
expression (Augustin et al., 1994, Olliver et al., 2010).
The aim of this work is to elucidate the cell cycle regulation of nrdAB expression and the coupling
of dNTP synthesis to initiation of DNA replication. We evaluate the consequences of removal of the
DnaA binding and the 45bp inverted repeat regulatory sites from the nrdAB promoter region on cell
cycle and find that the 45bp inverted repeat and binding of DnaA have a positive effect on nrdAB
expression. We further show that deletion of the hda gene lead to synthetic lethal mutants in
combination with either of these two mutants.
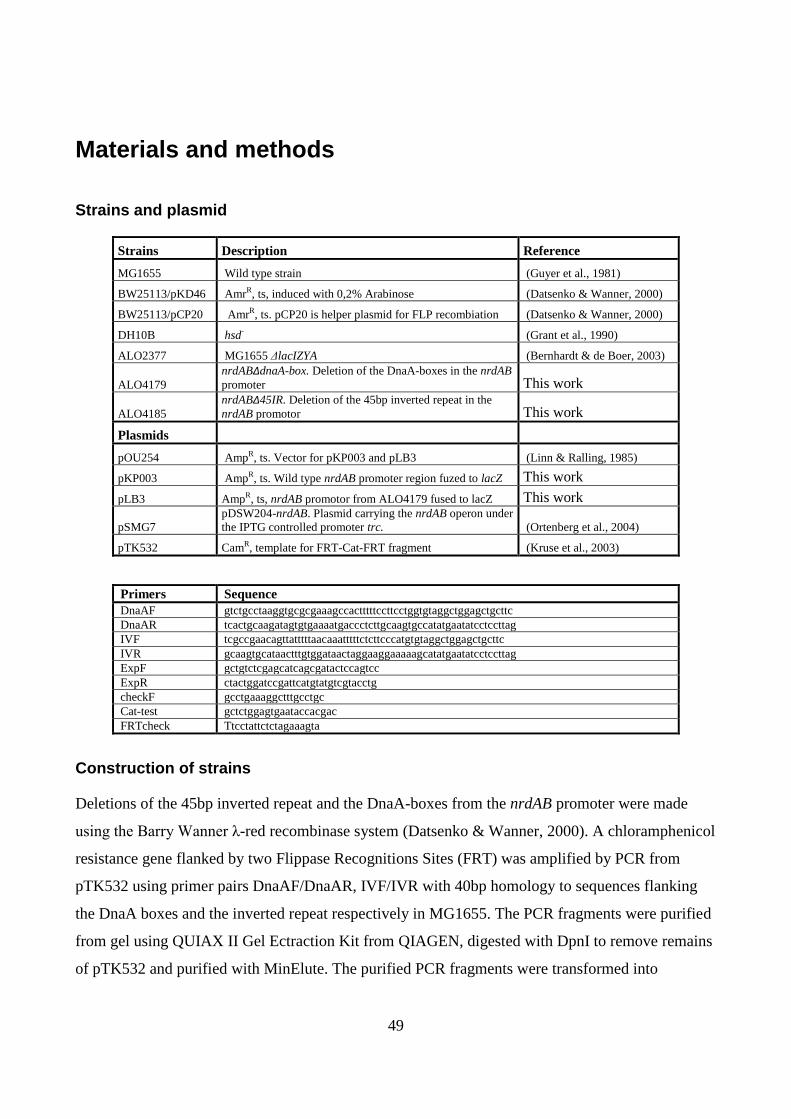
49
Materials and methods
Strains and plasmid
Strains Description Reference
MG1655 Wild type strain (Guyer et al., 1981)
BW25113/pKD46 AmrR, ts, induced with 0,2% Arabinose (Datsenko & Wanner, 2000)
BW25113/pCP20 AmrR, ts. pCP20 is helper plasmid for FLP recombiation (Datsenko & Wanner, 2000)
DH10B hsd- (Grant et al., 1990)
ALO2377 MG1655 ΔlacIZYA (Bernhardt & de Boer, 2003)
ALO4179 nrdAB∆dnaA-box. Deletion of the DnaA-boxes in the nrdAB
promoter This work
ALO4185 nrdAB∆45IR. Deletion of the 45bp inverted repeat in the
nrdAB promotor This work
Plasmids
pOU254 AmpR, ts. Vector for pKP003 and pLB3 (Linn & Ralling, 1985)
pKP003 AmpR, ts. Wild type nrdAB promoter region fuzed to lacZ This work
pLB3 AmpR, ts, nrdAB promotor from ALO4179 fused to lacZ This work
pSMG7 pDSW204-nrdAB. Plasmid carrying the nrdAB operon under
the IPTG controlled promoter trc. (Ortenberg et al., 2004)
pTK532 CamR, template for FRT-Cat-FRT fragment (Kruse et al., 2003)
Primers Sequence
DnaAF gtctgcctaaggtgcgcgaaagccactttttccttcctggtgtaggctggagctgcttc
DnaAR tcactgcaagatagtgtgaaaatgaccctcttgcaagtgccatatgaatatcctccttag
IVF tcgccgaacagttatttttaacaaatttttctcttcccatgtgtaggctggagctgcttc
IVR gcaagtgcataactttgtggataactaggaaggaaaaagcatatgaatatcctccttag
ExpF gctgtctcgagcatcagcgatactccagtcc
ExpR ctactggatccgattcatgtatgtcgtacctg
checkF gcctgaaaggctttgcctgc
Cat-test gctctggagtgaataccacgac
FRTcheck Ttcctattctctagaaagta
Construction of strains
Deletions of the 45bp inverted repeat and the DnaA-boxes from the nrdAB promoter were made
using the Barry Wanner λ-red recombinase system (Datsenko & Wanner, 2000). A chloramphenicol
resistance gene flanked by two Flippase Recognitions Sites (FRT) was amplified by PCR from
pTK532 using primer pairs DnaAF/DnaAR, IVF/IVR with 40bp homology to sequences flanking
the DnaA boxes and the inverted repeat respectively in MG1655. The PCR fragments were purified
from gel using QUIAX II Gel Ectraction Kit from QIAGEN, digested with DpnI to remove remains
of pTK532 and purified with MinElute. The purified PCR fragments were transformed into
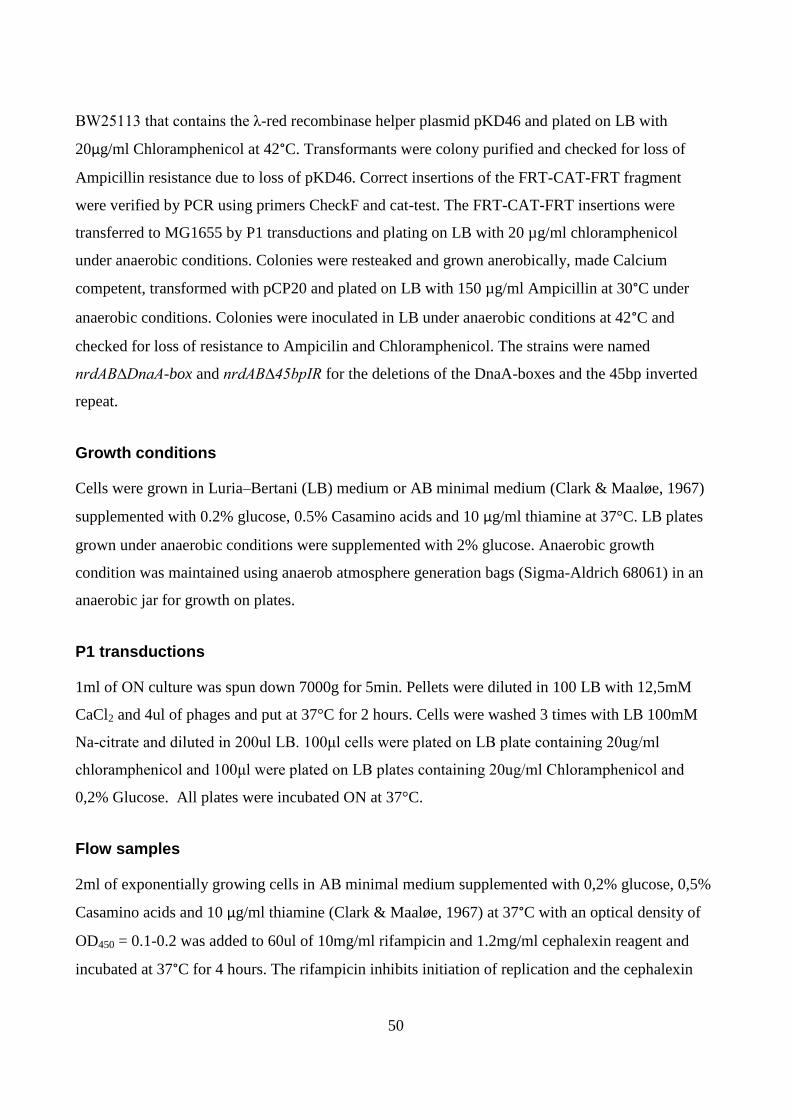
50
BW25113 that contains the λ-red recombinase helper plasmid pKD46 and plated on LB with
20μg/ml Chloramphenicol at 42°C. Transformants were colony purified and checked for loss of
Ampicillin resistance due to loss of pKD46. Correct insertions of the FRT-CAT-FRT fragment
were verified by PCR using primers CheckF and cat-test. The FRT-CAT-FRT insertions were
transferred to MG1655 by P1 transductions and plating on LB with 20 µg/ml chloramphenicol
under anaerobic conditions. Colonies were resteaked and grown anerobically, made Calcium
competent, transformed with pCP20 and plated on LB with 150 µg/ml Ampicillin at 30°C under
anaerobic conditions. Colonies were inoculated in LB under anaerobic conditions at 42°C and
checked for loss of resistance to Ampicilin and Chloramphenicol. The strains were named
nrdAB∆DnaA-box and nrdAB∆45bpIR for the deletions of the DnaA-boxes and the 45bp inverted
repeat.
Growth conditions
Cells were grown in Luria–Bertani (LB) medium or AB minimal medium (Clark & Maaløe, 1967)
supplemented with 0.2% glucose, 0.5% Casamino acids and 10 μg/ml thiamine at 37°C. LB plates
grown under anaerobic conditions were supplemented with 2% glucose. Anaerobic growth
condition was maintained using anaerob atmosphere generation bags (Sigma-Aldrich 68061) in an
anaerobic jar for growth on plates.
P1 transductions
1ml of ON culture was spun down 7000g for 5min. Pellets were diluted in 100 LB with 12,5mM
CaCl2 and 4ul of phages and put at 37°C for 2 hours. Cells were washed 3 times with LB 100mM
Na-citrate and diluted in 200ul LB. 100μl cells were plated on LB plate containing 20ug/ml
chloramphenicol and 100μl were plated on LB plates containing 20ug/ml Chloramphenicol and
0,2% Glucose. All plates were incubated ON at 37°C.
Flow samples
2ml of exponentially growing cells in AB minimal medium supplemented with 0,2% glucose, 0,5%
Casamino acids and 10 μg/ml thiamine (Clark & Maaløe, 1967) at 37°C with an optical density of
OD450 = 0.1-0.2 was added to 60ul of 10mg/ml rifampicin and 1.2mg/ml cephalexin reagent and
incubated at 37°C for 4 hours. The rifampicin inhibits initiation of replication and the cephalexin
51
inhibits cell division (Boye & Løbner-Olesen, 1991). For the exponential samples 1ml of
exponentially growing culture of OD450 = 0.1-0.2. Cells were fixated and permeabilized by
centrifugation for 5min at 15000g, resuspension in 100μl tris pH = 7.5 and addition of 900ml of
77% ethanol. 200ul of the fixed and permeabilized cells were stained by centrifugation at 15,000g
for 10min and resuspension in 150ul mithramycin/ethidium bromide stining solution (2.5mg
mithramycin in 27.7ml 10mM Tris/10mM MgCl2, pH = 7.5 with 10mg/ml Ethidium Bromide).
Numbers of origins per cell and relative cell mass were determined as described previously
(Løbner-Olesen, 1999).
β-galactosidase assay
1ml of exponentially growing cells in AB minimal medium supplemented with 0.2% glucose, 0.5%
Casamino acids and 10 μg/ml thiamine (Clark & Maaløe, 1967) OD450=0.1-0.4 was mixed in 2
minutes with 50μl toluene by vortexing. 5x200μl cell lysate was transferred to 1ml 0,8mg/ml
ONPG in Z bugger and placed at 30°C. When the color of the solution turned yellow, the reaction
was stopped with 500μl 1M Na2CO3 and OD420 absorbance was measured. The specific activities
were calculated using the formula (1000 x OD420) / (v x 450450 x time(min)) where v is the volume
of the sample.
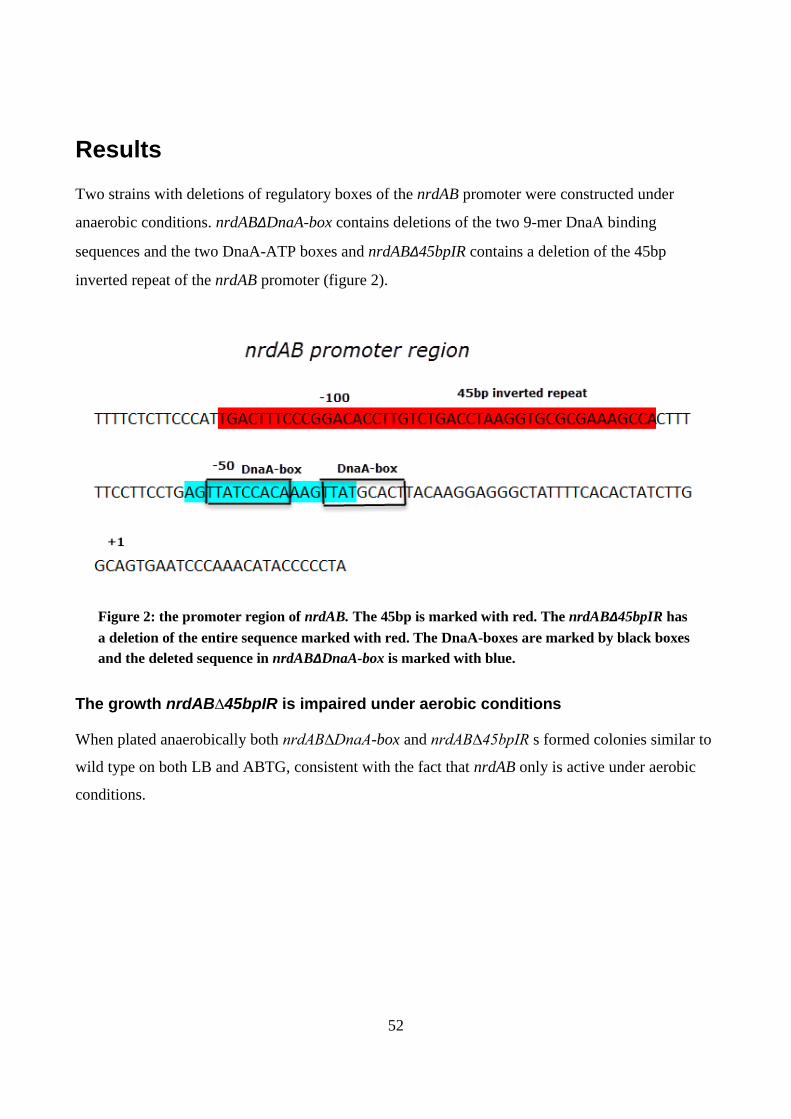
52
Results
Two strains with deletions of regulatory boxes of the nrdAB promoter were constructed under
anaerobic conditions. nrdAB∆DnaA-box contains deletions of the two 9-mer DnaA binding
sequences and the two DnaA-ATP boxes and nrdAB∆45bpIR contains a deletion of the 45bp
inverted repeat of the nrdAB promoter (figure 2).
Figure 2: the promoter region of nrdAB. The 45bp is marked with red. The nrdAB∆45bpIR has
a deletion of the entire sequence marked with red. The DnaA-boxes are marked by black boxes
and the deleted sequence in nrdAB∆DnaA-box is marked with blue.
The growth nrdAB∆45bpIR is impaired under aerobic conditions
When plated anaerobically both nrdAB∆DnaA-box and nrdAB∆45bpIR s formed colonies similar to
wild type on both LB and ABTG, consistent with the fact that nrdAB only is active under aerobic
conditions.
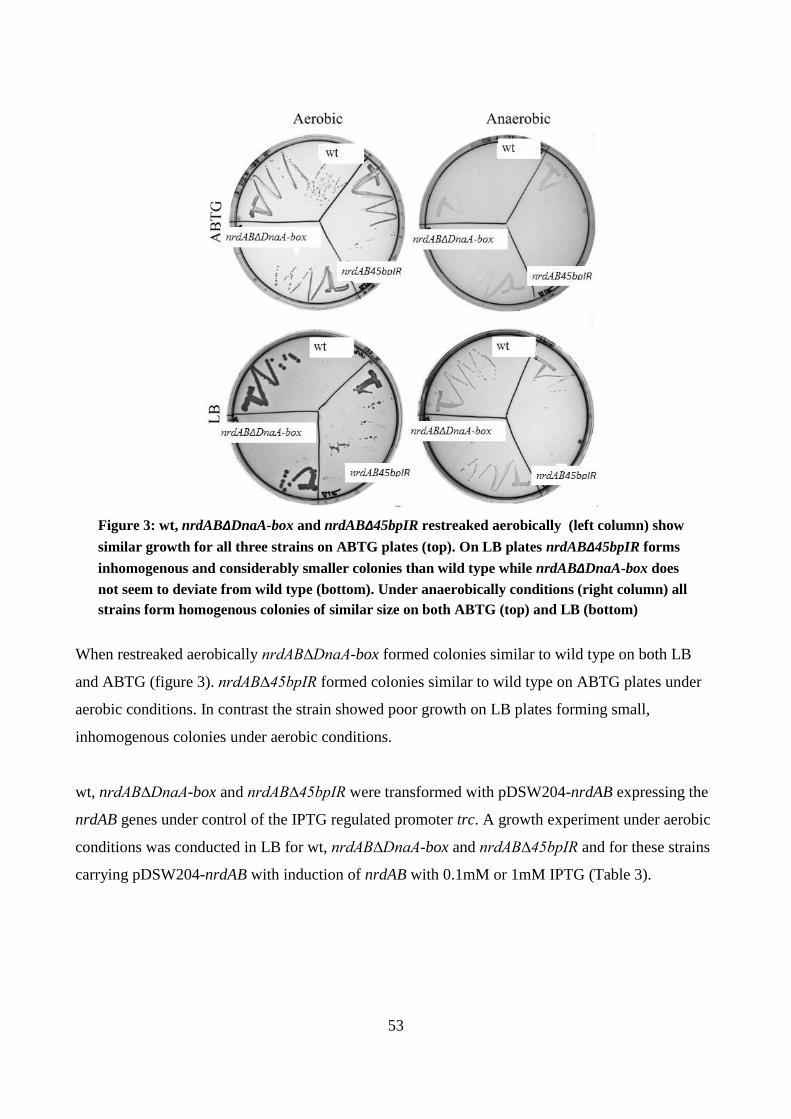
53
Figure 3: wt, nrdAB∆DnaA-box and nrdAB∆45bpIR restreaked aerobically (left column) show
similar growth for all three strains on ABTG plates (top). On LB plates nrdAB∆45bpIR forms
inhomogenous and considerably smaller colonies than wild type while nrdAB∆DnaA-box does
not seem to deviate from wild type (bottom). Under anaerobically conditions (right column) all
strains form homogenous colonies of similar size on both ABTG (top) and LB (bottom)
When restreaked aerobically nrdAB∆DnaA-box formed colonies similar to wild type on both LB
and ABTG (figure 3). nrdAB∆45bpIR formed colonies similar to wild type on ABTG plates under
aerobic conditions. In contrast the strain showed poor growth on LB plates forming small,
inhomogenous colonies under aerobic conditions.
wt, nrdAB∆DnaA-box and nrdAB∆45bpIR were transformed with pDSW204-nrdAB expressing the
nrdAB genes under control of the IPTG regulated promoter trc. A growth experiment under aerobic
conditions was conducted in LB for wt, nrdAB∆DnaA-box and nrdAB∆45bpIR and for these strains
carrying pDSW204-nrdAB with induction of nrdAB with 0.1mM or 1mM IPTG (Table 3).
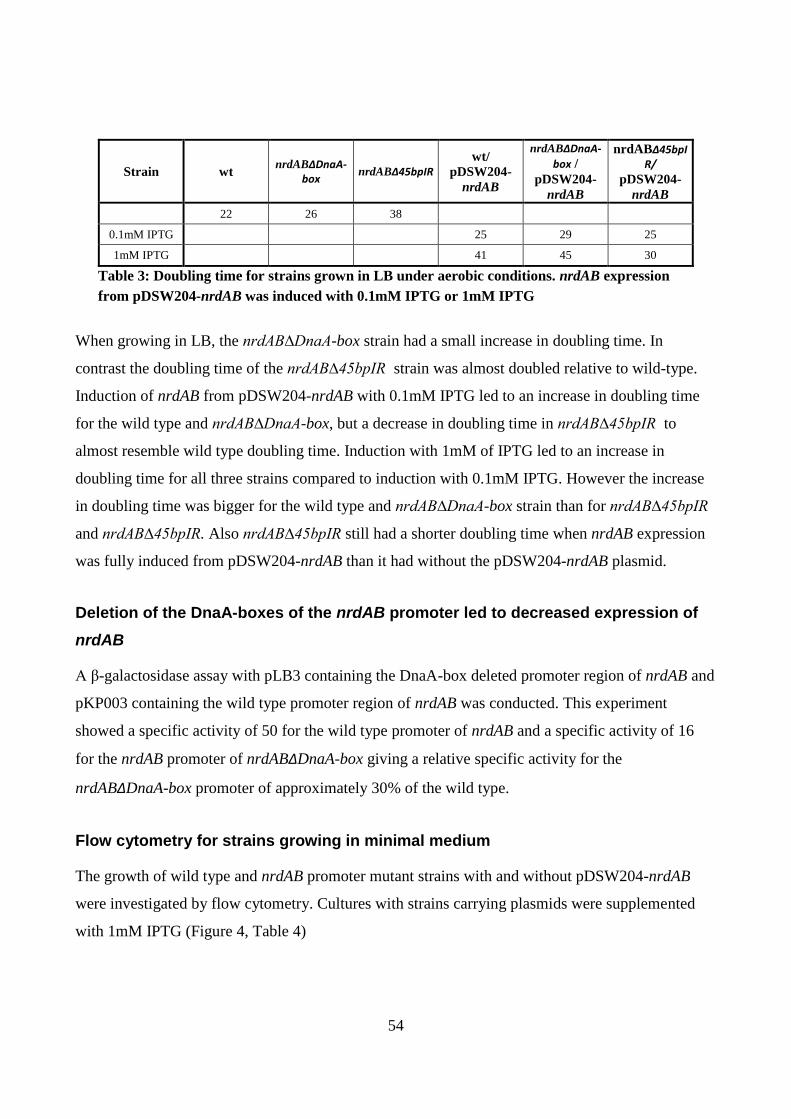
54
Strain wt nrdAB∆DnaA-
box nrdAB∆45bpIR
wt/
pDSW204-
nrdAB
nrdAB∆DnaA-
box /
pDSW204-
nrdAB
nrdAB∆45bpIR/
pDSW204-
nrdAB
22 26 38
0.1mM IPTG
25 29 25
1mM IPTG
41 45 30
Table 3: Doubling time for strains grown in LB under aerobic conditions. nrdAB expression
from pDSW204-nrdAB was induced with 0.1mM IPTG or 1mM IPTG
When growing in LB, the nrdAB∆DnaA-box strain had a small increase in doubling time. In
contrast the doubling time of the nrdAB∆45bpIR strain was almost doubled relative to wild-type.
Induction of nrdAB from pDSW204-nrdAB with 0.1mM IPTG led to an increase in doubling time
for the wild type and nrdAB∆DnaA-box, but a decrease in doubling time in nrdAB∆45bpIR to
almost resemble wild type doubling time. Induction with 1mM of IPTG led to an increase in
doubling time for all three strains compared to induction with 0.1mM IPTG. However the increase
in doubling time was bigger for the wild type and nrdAB∆DnaA-box strain than for nrdAB∆45bpIR
and nrdAB∆45bpIR. Also nrdAB∆45bpIR still had a shorter doubling time when nrdAB expression
was fully induced from pDSW204-nrdAB than it had without the pDSW204-nrdAB plasmid.
Deletion of the DnaA-boxes of the nrdAB promoter led to decreased expression of
nrdAB
A β-galactosidase assay with pLB3 containing the DnaA-box deleted promoter region of nrdAB and
pKP003 containing the wild type promoter region of nrdAB was conducted. This experiment
showed a specific activity of 50 for the wild type promoter of nrdAB and a specific activity of 16
for the nrdAB promoter of nrdAB∆DnaA-box giving a relative specific activity for the
nrdAB∆DnaA-box promoter of approximately 30% of the wild type.
Flow cytometry for strains growing in minimal medium
The growth of wild type and nrdAB promoter mutant strains with and without pDSW204-nrdAB
were investigated by flow cytometry. Cultures with strains carrying plasmids were supplemented
with 1mM IPTG (Figure 4, Table 4)
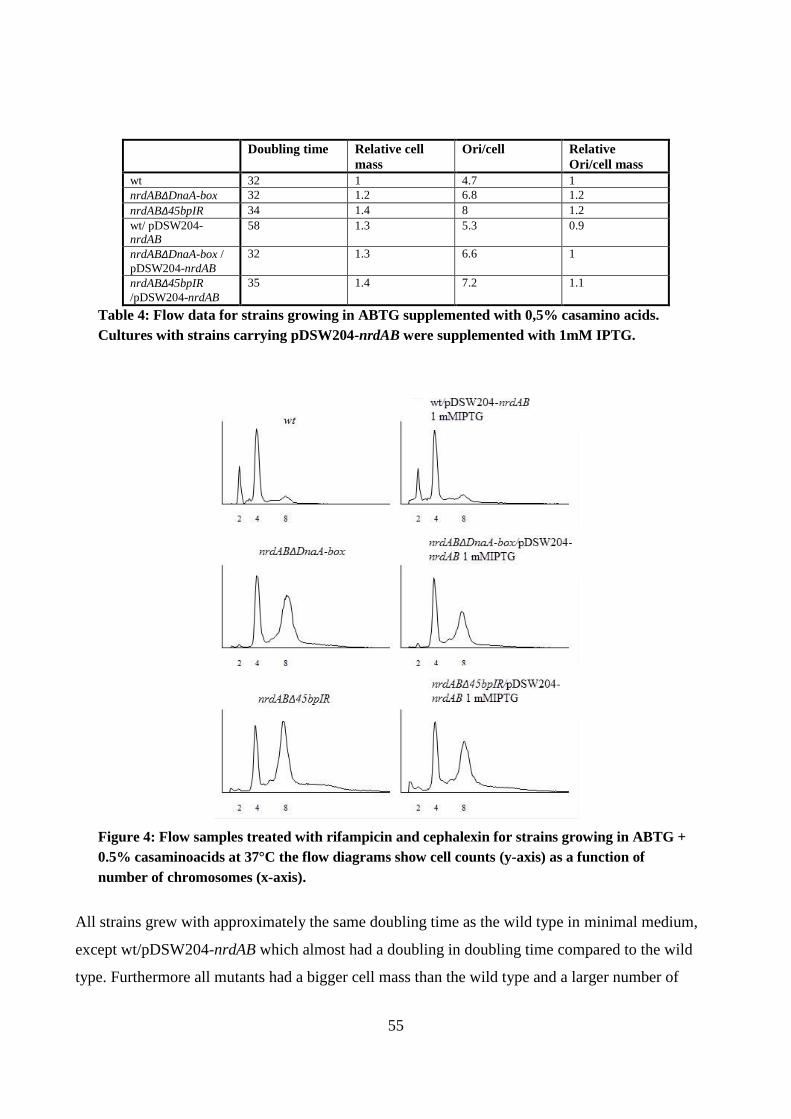
55
Doubling time Relative cell
mass
Ori/cell Relative
Ori/cell mass
wt 32 1 4.7 1
nrdAB∆DnaA-box 32 1.2 6.8 1.2
nrdAB∆45bpIR 34 1.4 8 1.2
wt/ pDSW204-
nrdAB
58 1.3 5.3 0.9
nrdAB∆DnaA-box /
pDSW204-nrdAB
32 1.3 6.6 1
nrdAB∆45bpIR
/pDSW204-nrdAB
35 1.4 7.2 1.1
Table 4: Flow data for strains growing in ABTG supplemented with 0,5% casamino acids.
Cultures with strains carrying pDSW204-nrdAB were supplemented with 1mM IPTG.
Figure 4: Flow samples treated with rifampicin and cephalexin for strains growing in ABTG +
0.5% casaminoacids at 37°C the flow diagrams show cell counts (y-axis) as a function of
number of chromosomes (x-axis).
All strains grew with approximately the same doubling time as the wild type in minimal medium,
except wt/pDSW204-nrdAB which almost had a doubling in doubling time compared to the wild
type. Furthermore all mutants had a bigger cell mass than the wild type and a larger number of
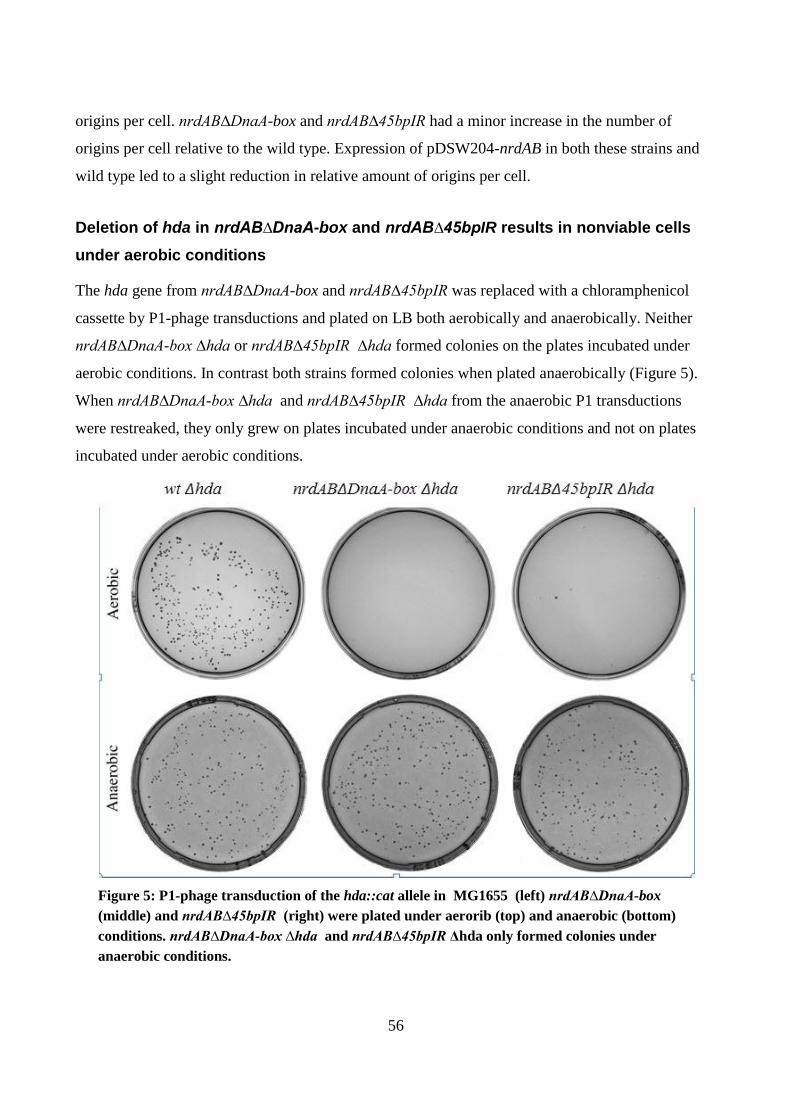
56
origins per cell. nrdAB∆DnaA-box and nrdAB∆45bpIR had a minor increase in the number of
origins per cell relative to the wild type. Expression of pDSW204-nrdAB in both these strains and
wild type led to a slight reduction in relative amount of origins per cell.
Deletion of hda in nrdAB∆DnaA-box and nrdAB∆45bpIR results in nonviable cells
under aerobic conditions
The hda gene from nrdAB∆DnaA-box and nrdAB∆45bpIR was replaced with a chloramphenicol
cassette by P1-phage transductions and plated on LB both aerobically and anaerobically. Neither
nrdAB∆DnaA-box ∆hda or nrdAB∆45bpIR ∆hda formed colonies on the plates incubated under
aerobic conditions. In contrast both strains formed colonies when plated anaerobically (Figure 5).
When nrdAB∆DnaA-box ∆hda and nrdAB∆45bpIR ∆hda from the anaerobic P1 transductions
were restreaked, they only grew on plates incubated under anaerobic conditions and not on plates
incubated under aerobic conditions.
Figure 5: P1-phage transduction of the hda::cat allele in MG1655 (left) nrdAB∆DnaA-box
(middle) and nrdAB∆45bpIR (right) were plated under aerorib (top) and anaerobic (bottom)
conditions. nrdAB∆DnaA-box ∆hda and nrdAB∆45bpIR Δhda only formed colonies under
anaerobic conditions.
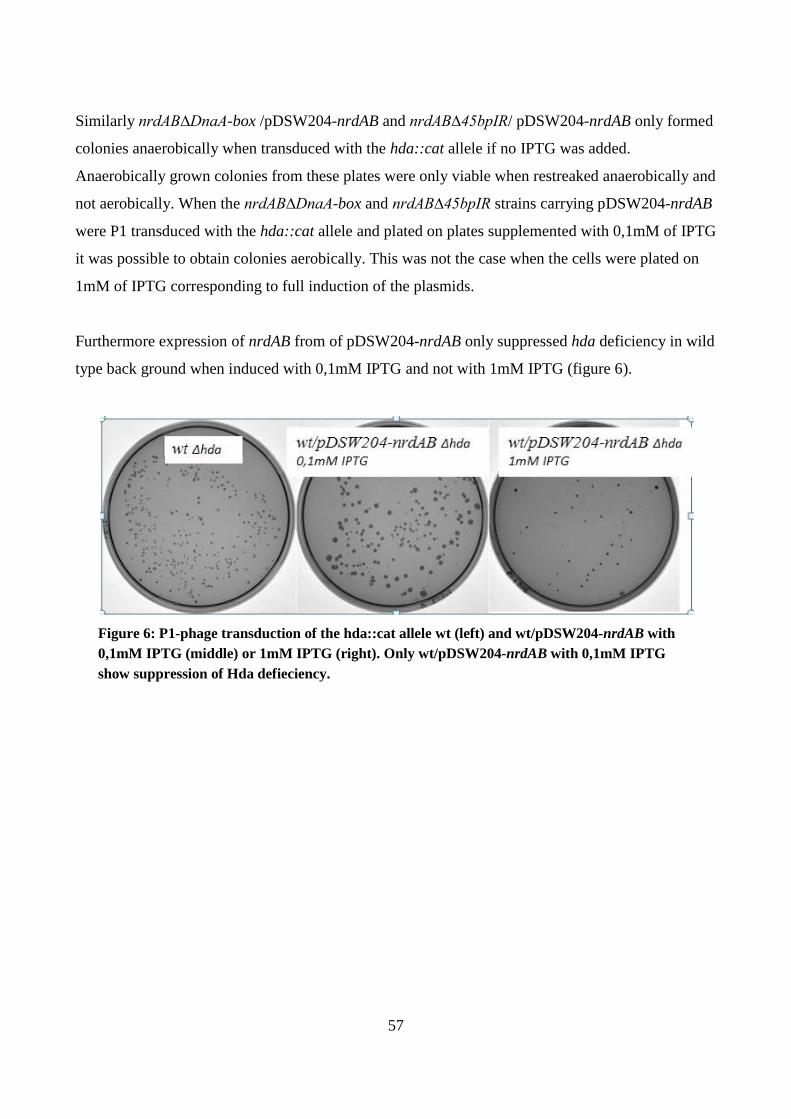
57
Similarly nrdAB∆DnaA-box /pDSW204-nrdAB and nrdAB∆45bpIR/ pDSW204-nrdAB only formed
colonies anaerobically when transduced with the hda::cat allele if no IPTG was added.
Anaerobically grown colonies from these plates were only viable when restreaked anaerobically and
not aerobically. When the nrdAB∆DnaA-box and nrdAB∆45bpIR strains carrying pDSW204-nrdAB
were P1 transduced with the hda::cat allele and plated on plates supplemented with 0,1mM of IPTG
it was possible to obtain colonies aerobically. This was not the case when the cells were plated on
1mM of IPTG corresponding to full induction of the plasmids.
Furthermore expression of nrdAB from of pDSW204-nrdAB only suppressed hda deficiency in wild
type back ground when induced with 0,1mM IPTG and not with 1mM IPTG (figure 6).
Figure 6: P1-phage transduction of the hda::cat allele wt (left) and wt/pDSW204-nrdAB with
0,1mM IPTG (middle) or 1mM IPTG (right). Only wt/pDSW204-nrdAB with 0,1mM IPTG
show suppression of Hda defieciency.
58
Discussion
Altered growth of nrdAB∆DnaA-box and nrdAB∆45bpIR under aerobic conditions is
a consequence of decreased nrdAB expression
We have investigated the growth of nrdAB∆DnaA-box and nrdAB∆45bpIR by plating assays,
growth experiments and flow cytometry. The results show that nrdAB∆45bpIR have a compromised
growth in LB under aerobic condition with slowly growing cells and inhomogenous colonies on
plate indicating that the strain suffer from growth defects and quickly accumulate second site
suppressor mutatations. Consistent with the fact that NrdAB is only active under aerobic conditions,
we do not observe any altered phenotype of nrdAB∆DnaA-box and nrdAB∆45bpIR when growing
on plate under anaerobic conditions.
The flow cytometry experiments show that both nrdAB∆DnaA-box and nrdAB∆45bpIR form
bigger cells than the wild type that overinitiate chromosome replication with approximately 20%
when growing in minimal medium. The cells have approximately the same doubling time as the
wild, so the overinitiation of replication can possibly be explained by a longer C period. It has
previously been shown that if the activity of RNR is inhibited with Hydroxy urea the cells
increased their cell mass and that the C period increased proportionally to the reduction in dNTP
level (Odsbu et al., 2009). The β-galactosidase assay showed a reduction of nrdAB expression of
nrdAB∆DnaA-box, while previous studies also have shown a decrease in nrdAB expression of cells
lacking the 45bp repeat in a β-galactosidase assay (Jacobson & Fuchs, 1998a). We therefore
conclude that the altered growth of the two strains probably is a consequence of a decreased nrdAB
expression.
The reason why the growth seemed to be more compromised for nrdAB∆45bpIR when growing in
LB than in minimal medium could be that the cells are more likely to cope with the reduced level of
dNTP in a medium promoting slow growth because the need for dNTPs is not as pronounced as in
the rich medium.
59
Reduced expression of nrdAB in combination with Δhda is synthetic lethal under
aerobic conditions
The P1-phage transductions of the hda::cat allele in nrdAB∆DnaA-box and nrdAB∆45bpIR showed
that the double mutants were only viable when plated anaerobically. The colonies obtained under
anaerobic conditions grew similar to wild type cells under anaerobic conditions but could not be
restreaked aerobically. This confirms that it is the presence of oxygen in combination with the
double mutants that causes the cells to die. A possible explanation to the synthetic lethality under
aerobic conditions could be that dNTP starvation in combination with overinitiation of replication
cause the replication forks to collaps. This hypothesis is confirmed by the fact that nrdAB∆DnaA-
box Δhda and nrdAB∆45bpIR Δhda is able to form colonies when supplemented with a pDSW204-
nrdAB expressing nrdAB induced with 0.1mM IPTG.
A fine tuned expression of nrdAB is important for suppression of Hda deficiency
and viability of double mutants
During growth in LB the wild type and nrdAB∆DnaA-box had an increase in doubling time when
supplemented with pDSW204-nrdAB under full induction of nrdAB indicating that an increased
level of dNTP inhibits growth in these strains. nrdAB∆45bpIR grew with almost a twice as long
doubling time relative to wild-type when grown in LB. The long doubling time was almost reverted
to resemble wild type when nrdAB expression from pDSW204-nrdAB was induced with 0.1mM
IPTG. This indicates that the compromised growth of nrdAB∆45bpIR to some degree is rescued
during a moderate expression of nrdAB. When nrdAB expression from pDSW204-nrdAB was fully
induced, nrdAB∆45bpIR had a decrease in doubling time compared to the moderate induction,
indicating that the reversion of doubling time to resemble wild type is dependent on the level of
nrdAB expression.
It has previously been shown that overexpression of nrdAB suppressed Hda deficiency (Gon et al.,
2006). I the experiment leading to this result, nrdAB was expressed from pDSW204-nrdAB
followed by induction with 0.1 mM IPTG. Here we show that if nrdAB is overexpressed too much
the suppression of Hda deficiency is lost. The observations that expression of nrdAB only
suppressed Hda deficiency when induced with 0,1mM IPTG and not 1mM IPTG and that double
mutants in the nrdAB promoter lacking the hda gene were only able to grow aerobically with
60
expression of nrdAB with 0.1 mM IPTG and not 1mM IPTG suggest that both a too low and a too
high expression of nrdAB compromise growth in Hda deficient cells. It has been shown that an
increased level of dNTP is mutagenic for E. coli (Gon et al., 2006; Mathews, 2006; Stubbe, 2000;
Wheeler et al., 2005). Our results indicate that is important that the elevated level of dNTP match
the increased need for dTNP caused by the mutations in the nrdAB promoter so that too much dNTP
is as toxic for the cell in combination with Hda deficiency as too little. Another explanation could
be that a drastically elevated level of dNTP leads to allosteric regulation of ribonucleotide reductase
activity so that the level of dNTP with fully induced nrdAB expression from plasmid pDSW204-
nrdAB is actually lower than for cells with a moderate induction of nrdAB.
In this study we only investigated a strain where all the DnaA-boxes from the nrdAB promoter had
been deleted. It has previously been suggested that low levels of DnaA-ATP stimulate transcription
of nrdAB while high levels repress transcription (Herrick & Sclavi, 2007). Our results indicate that
DnaA has a general positive effect on nrdAB expression. This could be explained by the model
where binding of DnaA-ATP and DnaA-ATP to the 9-mere DnaA-boxes activate expression of
nrdAB while further binding of DnaA-ATP reduce this stimulation of expression so that it is the
ratio of DnaA-ATP/DnaA-ATP that is determining for the degree of stimulation of nrdAB
expression. In Hda deficient cells, where the DnaA-ATP/DnaA-ADP ratio is high, the expression
of nrdAB will thus not be as high as in wild type strains. In combination with the increased need for
dNTPs due to the elevated level of replication forks, this might cause the cells to suffer from dNTP
starvation causing poor growth of the cells. In order to further investigate this hypothesis it will be
necessary to conduct dNTP pool measurements to determine if nrdAB∆DnaA-box and
nrdAB∆45bpIR do in fact suffer from dNTP starvation. Also the effect of various degree of
expresseion from pDSW204-nrdAB on the dNTP pool could be evaluated.
Both nrdAB∆DnaA-box and nrdAB∆45bpIR showed synchronous initiation of replication indicating
that neither deletion of the DnaA-boxes or the 45bp inverted repeat affects the timing of initiation of
DNA replication but rather the elongation of replication. Consequently regulation of nrdAB
expression from these two regulatory sites seem to occur downstream of the initiation of replication
so that nrdAB expression does not play any regulatory role of initiation of replication.
61
References
Augustin, L. B., Jacobson, B. A., & Fuchs, J. A. (1994). Escherichia coli Fis and DnaA proteins
bind specifically to the nrd promoter region and affect expression of an nrd-lac fusion. Journal of
Bacteriology, 176(2), 378–87.
Bernhardt, T. G., & de Boer, P. A. J. (2003). The Escherichia coli amidase AmiC is a periplasmic
septal ring component exported via the twin-arginine transport pathway. Molecular Microbiology,
48(5), 1171–82.
Boye, E., & Løbner-Olesen, A. (1991). Bacterial growth control studied by flow cytometry.
Research in Microbiology, 142(2-3), 131–5.
Clark, D. J., & Maaløe, O. (1967). DNA Replication and the Division Cycle in Escherichia coli. J.
Mol. Biol., 23, 99–112.
Datsenko, K. A., & Wanner, B. L. (2000). One-step inactivation of chromosomal genes in
Escherichia coli K-12 using PCR products. Proceedings of the National Academy of Sciences of the
United States of America, 97(12), 6640–5.
Fujimitsu, K., Su’etsugu, M., Yamaguchi, Y., Mazda, K., Fu, N., Kawakami, H., & Katayama, T.
(2008). Modes of overinitiation, dnaA gene expression, and inhibition of cell division in a novel
cold-sensitive hda mutant of Escherichia coli. Journal of Bacteriology, 190(15), 5368–5381.
Gon, S., Camara, J. E., Klungsøyr, H. K., Crooke, E., Skarstad, K., & Beckwith, J. (2006). A novel
regulatory mechanism couples deoxyribonucleotide synthesis and DNA replication in Escherichia
coli. The EMBO Journal, 25(5), 1137–47.
Grant, S. G., Jessee, J., Bloom, F. R., & Hanahan, D. (1990). Differential plasmid rescue from
transgenic mouse DNAs into Escherichia coli methylation-restriction mutants. Proceedings of the
National Academy of Sciences of the United States of America, 87(12), 4645–9.
62
Guyer, M. S., Reed, R.R., Steitz, J.A., & Low, K.B. (1981) Identification of a sex-factor-affinity
site in E. coli as gamma delta. Cold Spring Harb. Symp Quant. Biol., 45, 135-140
Herrick, J., & Sclavi, B. (2007). Ribonucleotide reductase and the regulation of DNA replication: an
old story and an ancient heritage. Molecular Microbiology, 63(1), 22–34.
Jacobson, B. A., & Fuchs, J. A. (1998a). A 45 bp inverted repeat is required for cell cycle regulation
of the Escherichia coli nrd operon. Molecular Microbiology, 28(6), 1307–14.
Jacobson, B. A., & Fuchs, J. A. (1998b). Multiple cis-acting sites positively regulate Escherichia
coli nrd expression. Molecular Microbiology, 28(6), 1315–22.
Jordan, A., Aragall, E., Gibert, I., & Barbe, J. (1996). Promoter identification and expression
analysis of Salmonella typhimurium and Escherichia coli nrdEF operons encoding one of two class
I ribonucleotide reductases present in both bacteria. Molecular Microbiology, 19(4), 777–90.
Jordan, A., & Reichard, P. (1998). Ribonucleotide reductases. Annual Review of Biochemistry, 67,
71–98.
Katayama, T., Kubota, T., Kurokawa, K., Crooke, E., & Sekimizu, K. (1998). The initiator function
of DnaA protein is negatively regulated by the sliding clamp of the E. coli chromosomal replicase.
Cell, 94(1), 61–71.
Kato, J., & Katayama, T. (2001). Hda, a novel DnaA-related protein, regulates the replication cycle
in Escherichia coli. The EMBO Journal, 20(15), 4253–62.
Kawakami, H., Keyamura, K., & Katayama, T. (2005). Formation of an ATP-DnaA-specific
initiation complex requires DnaA Arginine 285, a conserved motif in the AAA+ protein family. The
Journal of Biological Chemistry, 280(29), 27420–30.
Kruse, T., Møller-Jensen, J., Løbner-Olesen, A., & Gerdes, K. (2003). Dysfunctional MreB inhibits
chromosome segregation in Escherichia coli. The EMBO Journal, 22(19), 5283–92.
63
Linn, T., & Ralling, G. (1985). A versatile multiple- and single-copy vector system for the in vitro
construction of transcriptional fusions to lacZ. Plasmid, 14(2), 134–42.
Løbner-Olesen, A. (1999). Distribution of minichromosomes in individual Escherichia coli cells:
implications for replication control. The EMBO Journal, 18(6), 1712–21.
Mathews, C. K. (2006). DNA precursor metabolism and genomic stability. FASEB Journal :
Official Publication of the Federation of American Societies for Experimental Biology, 20(9),
1300–14.
McGarry, K. C., Ryan, V. T., Grimwade, J. E., & Leonard, A. C. (2004). Two discriminatory
binding sites in the Escherichia coli replication origin are required for DNA strand opening by
initiator DnaA-ATP. Proceedings of the National Academy of Sciences of the United States of
America, 101(9), 2811–6.
Messer, W. (2002). The bacterial replication initiator DnaA. DnaA and oriC, the bacterial mode to
initiate DNA replication. FEMS Microbiology Reviews, 26(4), 355–74.
Nordlund, P., & Reichard, P. (2006). Ribonucleotide reductases. Annual Review of Biochemistry,
75, 681–706.
Odsbu, I., Morigen, & Skarstad, K. (2009). A reduction in ribonucleotide reductase activity slows
down the chromosome replication fork but does not change its localization. PloS One, 4(10), e7617.
Ortenberg, R., Gon, S., Porat, A., & Beckwith, J. (2004). Interactions of glutaredoxins,
ribonucleotide reductase, and components of the DNA replication system of Escherichia coli.
Proceedings of the National Academy of Sciences of the United States of America, 101(19), 7439–
44.
Riber, L., Olsson, J. A., Jensen, R. B., Skovgaard, O., Dasgupta, S., Marinus, M. G., & Løbner-
Olesen, A. (2006). Hda-mediated inactivation of the DnaA protein and dnaA gene autoregulation
64
act in concert to ensure homeostatic maintenance of the Escherichia coli chromosome. Genes &
Development, 20(15), 2121–34.
Sekimizu, K., Bramhill, D., & Kornberg, A. (1987). ATP activates dnaA protein in initiating
replication of plasmids bearing the origin of the E. coli chromosome. Cell, 50(2), 259–65.
Speck, C., & Messer, W. (2001). Mechanism of origin unwinding: sequential binding of DnaA to
double- and single-stranded DNA. The EMBO Journal, 20(6), 1469–76.
Stubbe, J. (2000). Ribonucleotide reductases: the link between an RNA and a DNA world? Current
Opinion in Structural Biology, 10(6), 731–6.
Sun, L., & Fuchs, J. A. (1992). Escherichia coli ribonucleotide reductase expression is cell cycle
regulated. Molecular Biology of the Cell, 3(10), 1095–105.
Sun, L., Jacobson, B. A., Dien, B. S., Srienc, F., & Fuchs, J. A. (1994). Cell cycle regulation of the
Escherichia coli nrd operon: requirement for a cis-acting upstream AT-rich sequence. Journal of
Bacteriology, 176(8), 2415–26.
Thelander, L., & Reichard, P. (1979). Reduction of ribonucleotides. Annual Review of
Biochemistry, 48, 133–58.
Tuggle, C. K., & Fuchs, J. A. (1990). Regulation of the operon encoding ribonucleotide reductase:
role of the negative sites in nrd repression. Journal of Bacteriology, 172(4), 1711–8.
Wheeler, L. J., Rajagopal, I., & Mathews, C. K. (2005). Stimulation of mutagenesis by proportional
deoxyribonucleoside triphosphate accumulation in Escherichia coli. DNA Repair, 4(12), 1450–6.
65
Manuscript 2
Growth defects are suppressed by a switch to
anaerobic metabolism in Escherichia coli deficient in
RIDA (Regulatory Inactivation of DnaA)
Louise Bjørn1, Godefroid Charbon
1, Martin G. Marinus
2 , and Anders Løbner-Olesen
1*
1 University of Copenhagen, Dept of Biology, Ole Maaløes Vej 5, DK2200 Copenhagen N,
Denmark.
2 UMASS University, Worchester
3 * Corresponding author [email protected], +45 3532 2068
66
Abstract
Initiation of replication In E. coli is a tightly regulated process that is triggered by the formation of a
complex of the initiator protein DnaA and DNA. The activity of DnaA is reduced after initiation of
replication in a process involving the protein Hda. Cells lacking the hda gene have an elevated level
of active DnaA and suffer severe growth defects and quickly accumulate suppressor mutations that
compensate for the Hda deficiency. A number of Hda supressor mutants (hsm) has previously been
isolated and sequenced. Here we characterize two hsm strains: a point mutation in the iscU gene
(iscUC63F) causing an amino acid substitution and a deletion of the C-terminal part of the fre gene
(fre∆68). We show that the suppression of Hda deficiency in the strains occurs a consequence
reduced or lost of function of the iscU an fre gene respectively. Furthermore we propose that the
two suppressors function by mimicking anaerobic growth.
67
Introduction
In E. coli the replication cycle is controlled so that initiation occurs once and only once per cell
cycle simultaneously at all origins (Boye, 2000). Initiation of replication is the main regulatory
event and is triggered by the binding of the initiator protein DnaA to the origin of replication, oriC
(McGarry et al., 2004; Speck & Messer, 2001). DnaA bind ATP and ADP with equal affinity, but
only DnaA-ATP, that is active form of DnaA, promotes initiation of replication (Sekimizu et al.,
1987). Initiation of replication takes place when the DnaA-ATP/DnaA-ADP ratio is high (Su’etsugu
et al., 2004). After initiation of replication the active DnaA-ATP is hydrolyzed to the inactive
DnaA-ADP in a process called Regulatory Inactivation of DnaA (RIDA) which involves the β-
clamp subunit of the polymerase III and the protein Hda (Katayama et al., 1998; Kato & Katayama,
2001). The Hda protein is essential for RIDA. Loss of Hda results in an elevated DnaA-ATP/DnaA-
ADP level that leads to hyper initiation and severe growth retardation and consequently the cells
quickly accumulate suppressor mutations. Eight hda suppressor mutants (hsm) has previously been
isolated and sequenced; a mutation upstream of ybfF, two mutations in the dnaA gene, a mutation in
the stpA gene, a mutation in the iscU gene, a deletion of a part of the fre gene, an inversion and a
duplication (Charbon et al., 2011; Riber et al., 2006). Growth defects due to RIDA deficiency is
also suppressed by over expression of genes encoding ribonucleotide reductase, that is an essential
enzyme for the production of dNTPs used for building blocks for DNA synthesis (Fujimitsu et al.,
2008; Gon et al., 2006). Recently we have shown that a ∆hda strain can grow without accumulating
further mutations when it is maintained under anaerobic conditions. We found that the inviability of
the ∆hda strain was a consequence of ROS inflicted damage and that Hda deficiency could be
tolerated when ROS formation was reduced or the GO repair system was obstructed by deletion of
the mutM gene (Charbon et al, 2014).
The protein Fre is the general NAD(P)H flavin oxidoreductase of E. coli that catalyse the reduction
of free flavins using NADPH or NADH as electron donors. NAD(P)H flavin oxidoreductase in E.
coli plays important roles in iron metabolism and bioluminescence but is best known for its role as
activatior of ribonucleotide reductase. In addition NAD(P)H flavin oxidoreductase is known to
generate superoxide radicals from NAD(P)H and flavins under aerobic conditions (Gaudu et al.,
1994).
68
Iron sulfur clusters are parts of proteins involved in a wide variety of processes such as respiration,
gene regulation, DNA repair and replication (Johnson et al., 2005a; Lill, 2009; Roche et al., 2013).
The most common function of the iron sulfur clusters is electron transfer were the iron sulfur
clusters serve as electron donors or acceptors. This function is mediated by changes in the oxidative
state of iron between Fe2+ and Fe3
+ (Beinert, 1997). In E. coli there are two systems generating iron
sulfur clusters: the ISC and SUF systems. The ISC assembly system is involved in generation and
housekeeping of iron sulfur clusters under normal condition. During iron limitation or oxidative
stress the SUF system is activated (Takahashi & Tokumoto, 2002; Zheng et al., 1998). During
assembly of the Fe-S clusters the cysteine desulferase IscS binds to the iron sulfur cluster scaffold
protein IscU. IscS transfers Sulfur from cysteine to IscU by conversion of cysteine to alanine. The
IscU protein contains three conserved cysteines that coordinate the assembly of iron sulfur clusters.
Once bound to IscU, the IscS protein forms and transfers sulfur to one of the conserved cysteins that
mediate the binding to IscS (Johnson et al., 2005b; Smith et al., 2005). None of the three conserved
cysteins in IscU are essential for the sulfur transfer but alteration of any of the three cystein will
reduce the amount of S atoms transferred from IscS to IscU. If two of the cysteines are altered the
transfer of sulfur does not occur (Smith et al 2005).
The respiratory system in E. coli uses oxygen as the preferred terminal electron accepter. During
aerobic growth the presence of oxygen however results in production of Reactive Oxygen Species
(ROS) when oxygen accidently collide with redox enzymes like reduced flavins and iron sulfur
clusters (Halliwell, 1999; Imlay 2003). These species can damage the DNA by a variety of base
modifications (Bjelland & Seeberg, 2003, Cooke et al., 2003, Wallace, 2002). A large quantity of
ROS in E. coli is hydrogen peroxide and superoxide produced by collision of enzymes involved in
the respiratory chain with oxygen (Kussmaul & Hirst, 2006; Messner & Imlay, 2006).
The Aerobic Respiration Control system ArcA/ArcB senses oxidative stress through the
composition of the quinone/quinole pool and the concentration of fermentative products like D-
lactate, acetate and NADH (Bekker et al, 2010, Iuchi, 1993, Malpica et al., 2004, 2006). The
ArcA/ArcB system is activated during transition from aerobic to micro aerobic conditions and
remains active under anaerobic conditions. It regulates a large number of genes including genes
involved in respiration, citric acid cycle and iron metabolism (Lin & Iuchi, 1991, Lynch & Lin,
1996).
69
Here we characterize two hsm strains. iscUC63F that has a point mutation in the iscU gene
encoding the iron sulfur cluster scaffold protein IscU. The mutation in iscUC63F causes the
substitution of a cysteine to phenyl alanine at position 63. fre∆68 is a deletion in the fre gene
encoding flavin reductase leading to loss of 68 amino acids in the C-terminal end of flavin reductase
(Charbon et al., 2011). We investigated whether the suppression of Hda deficiency from these two
mutants were due to loss of function or altered gene expression of the iscU and fre gene
respectively. This was done by investigating strain either lacking or over expression the wild type
and the mutant iscU and fre genes. We found that the iscUC63F strain suppressed Hda deficiency
due to a reduced function of the iscU gene and that the fre∆68 strain suppressed Hda deficiency due
to a loss of function of the fre gene. Because both IscU and Fre are necessary for a variety of
processes in cell metabolism the link of iscUC63F and fre∆68 to initiation of replication was not
obvious. In order to investigate the effect of these two mutants on regulation of DnaA-ATP/DnaA-
ADP we conducted a microarray for the iscUC63F and fre∆68 in an hda+ back ground. We found
that the suppression is probably a consequence of compromised aerobic respiration and citric acid
cycle processes. We propose that the compromised respiration leads to a mimicked anaerobic
growth and consequently the cells will produce less ROS so that the cells can tolerate Hda
deficiency.
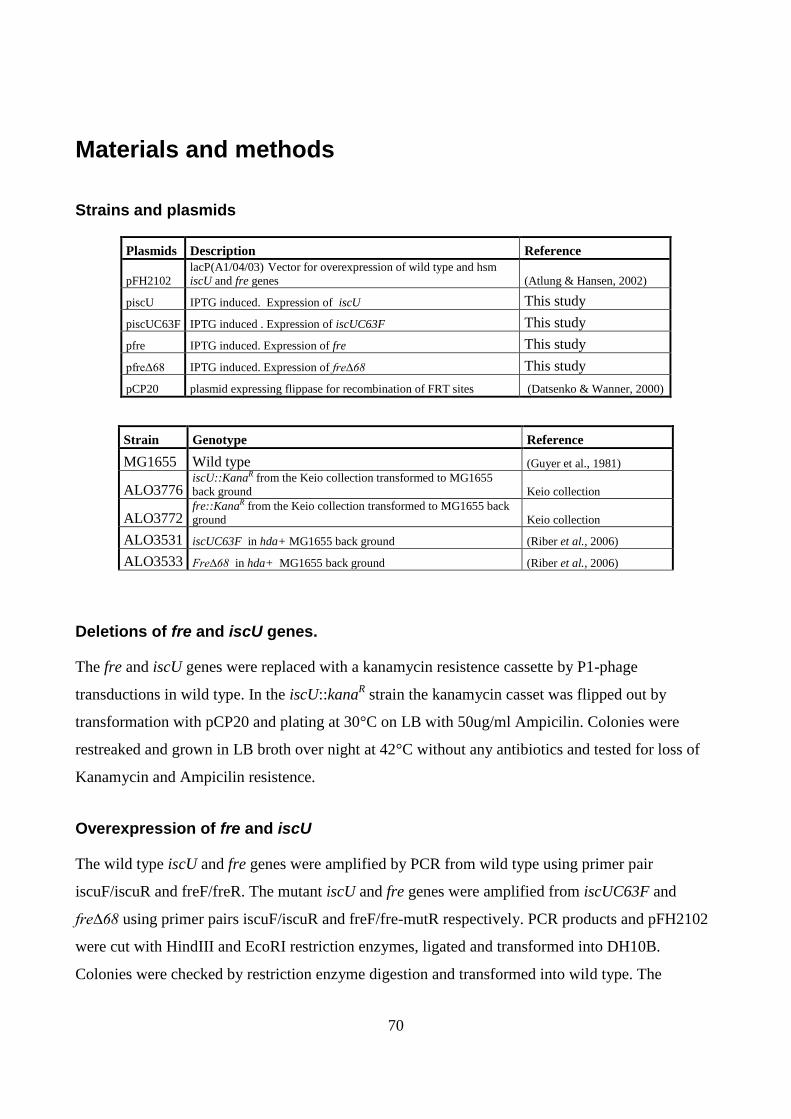
70
Materials and methods
Strains and plasmids
Plasmids Description Reference
pFH2102 lacP(A1/04/03) Vector for overexpression of wild type and hsm
iscU and fre genes (Atlung & Hansen, 2002)
piscU IPTG induced. Expression of iscU This study
piscUC63F IPTG induced . Expression of iscUC63F This study
pfre IPTG induced. Expression of fre This study
pfreΔ68 IPTG induced. Expression of fre∆68 This study
pCP20 plasmid expressing flippase for recombination of FRT sites (Datsenko & Wanner, 2000)
Strain Genotype Reference
MG1655 Wild type (Guyer et al., 1981)
ALO3776 iscU::KanaR from the Keio collection transformed to MG1655
back ground Keio collection
ALO3772 fre::KanaR from the Keio collection transformed to MG1655 back
ground Keio collection
ALO3531 iscUC63F in hda+ MG1655 back ground (Riber et al., 2006)
ALO3533 Fre∆68 in hda+ MG1655 back ground (Riber et al., 2006)
Deletions of fre and iscU genes.
The fre and iscU genes were replaced with a kanamycin resistence cassette by P1-phage
transductions in wild type. In the iscU::kanaR strain the kanamycin casset was flipped out by
transformation with pCP20 and plating at 30°C on LB with 50ug/ml Ampicilin. Colonies were
restreaked and grown in LB broth over night at 42°C without any antibiotics and tested for loss of
Kanamycin and Ampicilin resistence.
Overexpression of fre and iscU
The wild type iscU and fre genes were amplified by PCR from wild type using primer pair
iscuF/iscuR and freF/freR. The mutant iscU and fre genes were amplified from iscUC63F and
fre∆68 using primer pairs iscuF/iscuR and freF/fre-mutR respectively. PCR products and pFH2102
were cut with HindIII and EcoRI restriction enzymes, ligated and transformed into DH10B.
Colonies were checked by restriction enzyme digestion and transformed into wild type. The
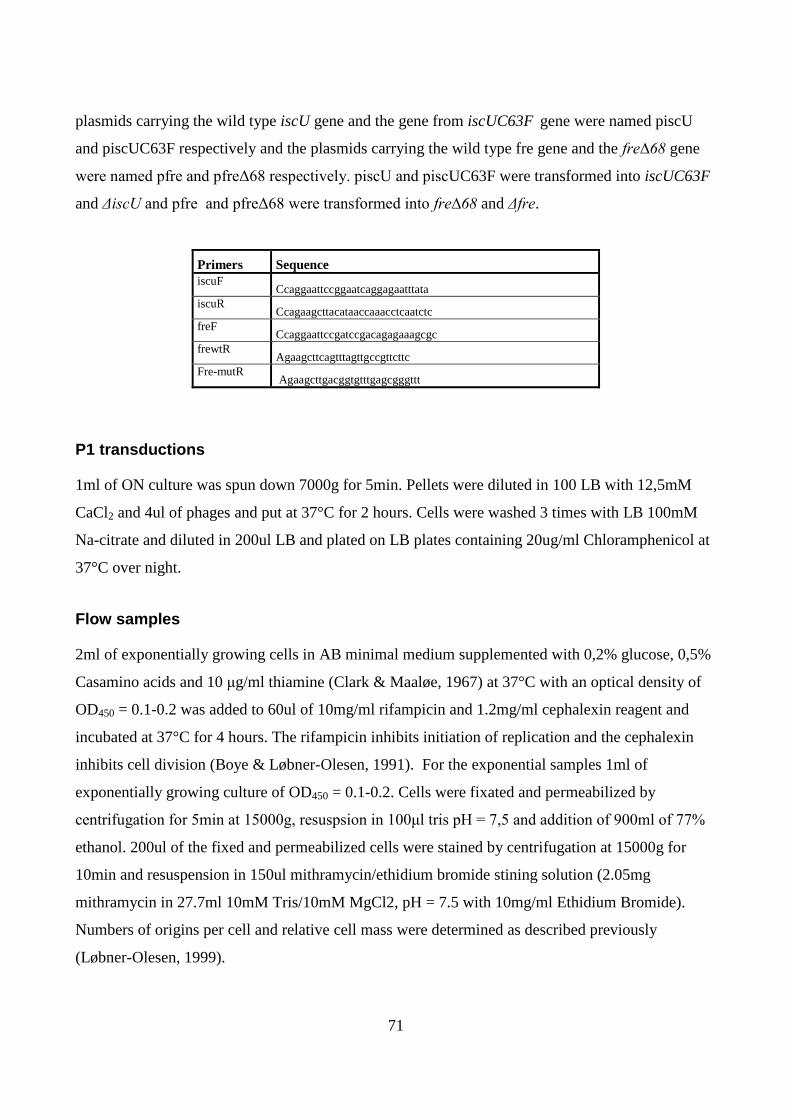
71
plasmids carrying the wild type iscU gene and the gene from iscUC63F gene were named piscU
and piscUC63F respectively and the plasmids carrying the wild type fre gene and the fre∆68 gene
were named pfre and pfreΔ68 respectively. piscU and piscUC63F were transformed into iscUC63F
and ΔiscU and pfre and pfreΔ68 were transformed into fre∆68 and Δfre.
Primers Sequence iscuF
Ccaggaattccggaatcaggagaatttata iscuR
Ccagaagcttacataaccaaacctcaatctc freF
Ccaggaattccgatccgacagagaaagcgc frewtR
Agaagcttcagtttagttgccgttcttc Fre-mutR
Agaagcttgacggtgtttgagcgggttt
P1 transductions
1ml of ON culture was spun down 7000g for 5min. Pellets were diluted in 100 LB with 12,5mM
CaCl2 and 4ul of phages and put at 37°C for 2 hours. Cells were washed 3 times with LB 100mM
Na-citrate and diluted in 200ul LB and plated on LB plates containing 20ug/ml Chloramphenicol at
37°C over night.
Flow samples
2ml of exponentially growing cells in AB minimal medium supplemented with 0,2% glucose, 0,5%
Casamino acids and 10 μg/ml thiamine (Clark & Maaløe, 1967) at 37°C with an optical density of
OD450 = 0.1-0.2 was added to 60ul of 10mg/ml rifampicin and 1.2mg/ml cephalexin reagent and
incubated at 37°C for 4 hours. The rifampicin inhibits initiation of replication and the cephalexin
inhibits cell division (Boye & Løbner-Olesen, 1991). For the exponential samples 1ml of
exponentially growing culture of OD450 = 0.1-0.2. Cells were fixated and permeabilized by
centrifugation for 5min at 15000g, resuspsion in 100μl tris pH = 7,5 and addition of 900ml of 77%
ethanol. 200ul of the fixed and permeabilized cells were stained by centrifugation at 15000g for
10min and resuspension in 150ul mithramycin/ethidium bromide stining solution (2.05mg
mithramycin in 27.7ml 10mM Tris/10mM MgCl2, pH = 7.5 with 10mg/ml Ethidium Bromide).
Numbers of origins per cell and relative cell mass were determined as described previously
(Løbner-Olesen, 1999).
72
Isolation of RNA
Strains were grown in ABTG with 0.5% casamino acids to OD450 = 0.3 (0.2-0.4). 35 ml of culture
was transferred to a cold tube and centrifugated at 4°C at 10000g for 5min. Pellets were
resuspended in 0,5ml ice cold TE-Buffer 1M, transferred to an Eppendorph tube containing 250ul
lysis buffer (2% SDS, 16mM EDTA and 200mM NaCl) and 750ul Phenol, whirl mixed and placed
on 65°C for 10min with whirl mixing every 3-4 min. Tubes were centrifugated at 15000g for 10min
and the upper phase was carefully transferred to 750ul phenol, whirl mixed and centrifugated at
15000g for 2min. The upper phase was transferred to 750ul chloroform, whirl mixed and
centrifugated at 15000g for 30s twice. The second time the upper phase was transferred to 1ml 96%
ethanol, whirl mixed and placed at -20°C for at least one hour. The pellet was washed with 70%
ethanol, dried on the bench and resuspended in 30ul H2O. The RNA was cut with Dnase I from
fermentas for one hour and an RNA clean up was made using the RNeasy Mini Spin Column kit
from QUIAGEN.
cDNA synthesis
cDNA was synthesized using the Revert Aid H Minus first strand synthesis Kit from Thermo
Scientific. Remains of RNA was removed by treatment with 20ul 1M NaOH for 30 min followed
by addition of 20ul 1M HCl and 240ul H2O and precipitation with 20ul 3M Na-Acetate and 1ml
96% ethanol at maximum acceleration for 1 hour. Pellets were washed with 70% ethanol, dried and
resuspended in 25ul H2O.
Microarray
The cDNA was fragmented with DNAse I in One-Phor-All buffer (Amersham Biosciences) and
end-labeled with Biotin using the Enzo BioArray Terminal Labeling Kit. The fluorescent labeled
cDNA was hybridized to an Affymetrix chip and scanned as described in the Affymetrix
UserGuide (www.affymetrix.com) and analyzed using GeneChip Analysis Suite software. Raw data
were exported as text files and imported into Microsoft Excel for further sorting. In the analysis we
used an altered gene expression of a factor two compared to wild type as cut off. If several genes in
an operon had either increased or decreased expression by less than a factor two, these were also
considered.
73
Results
Deletions of hda by P1 phage transductions
wt, iscUC63F, fre∆68, ΔiscU, Δfre and these strains supplemented with piscU, piscUC63F, pfre
and pfreΔ68 was P1 transduced with the hda::cat allele (Riber et al., 2006) in order to investigate
whether suppression of Hda deficiency in iscUC63F and fre∆68 was a consequence of an altered
gene expression or loss of function of the iscU and fre gene respectively. wt /pFH2102 was
included as a control. Cultures with strains carrying plasmids were supplemented with 1mM IPTG.
We used the iscUC63F and fre∆68 mutations in an hda+ back ground (Riber et al., 2006) and
performed P1 transductions simultaneously in all strains in order to compare the transductions in
each strain.
For both iscUC63F and fre∆68 expression of piscU and pfre respectively seemed to cause loss of
suppression of Hda deficiency. In neither of the strains this seemed to be the case for induction of
piscUC63F and pfreΔ68. This observation indicated that the suppression of Hda was due to reduced
or lost of function of the iscU or the fre gene and that the suppression of Hda deficiency was lost
during expression of these genes from a plasmid in an hsm back ground (Figure 1).
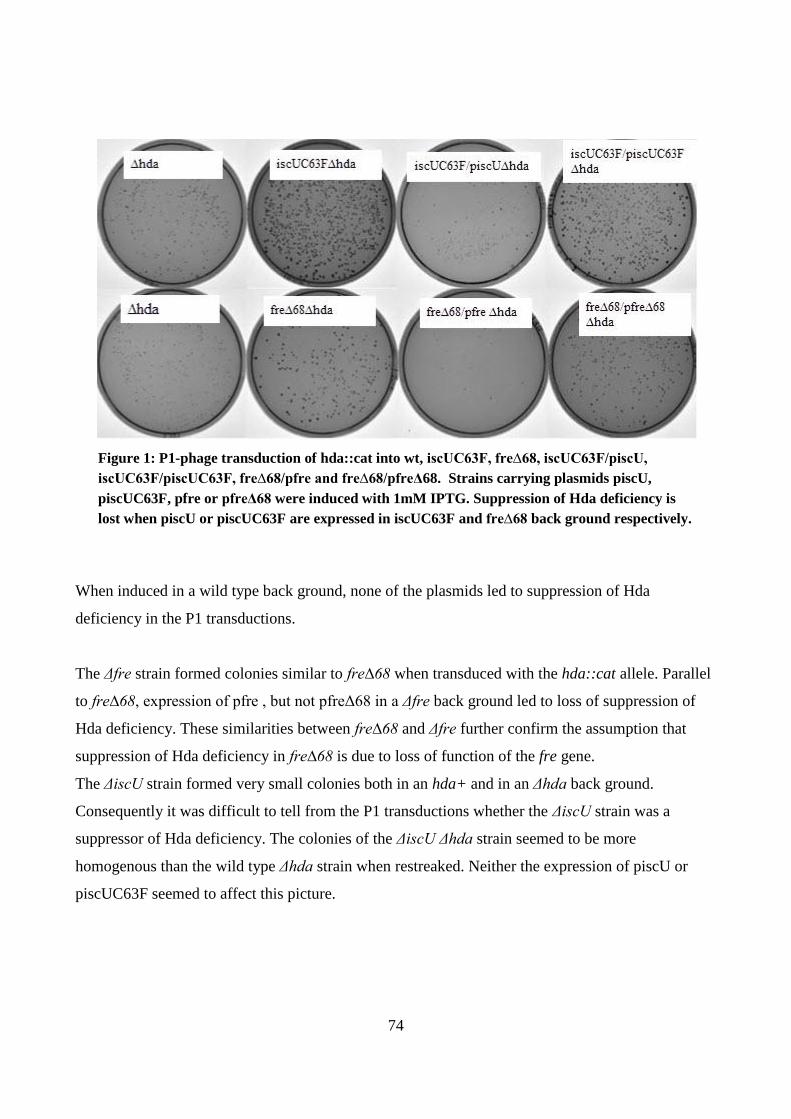
74
Figure 1: P1-phage transduction of hda::cat into wt, iscUC63F, fre∆68, iscUC63F/piscU,
iscUC63F/piscUC63F, fre∆68/pfre and fre∆68/pfreΔ68. Strains carrying plasmids piscU,
piscUC63F, pfre or pfreΔ68 were induced with 1mM IPTG. Suppression of Hda deficiency is
lost when piscU or piscUC63F are expressed in iscUC63F and fre∆68 back ground respectively.
When induced in a wild type back ground, none of the plasmids led to suppression of Hda
deficiency in the P1 transductions.
The Δfre strain formed colonies similar to fre∆68 when transduced with the hda::cat allele. Parallel
to fre∆68, expression of pfre , but not pfreΔ68 in a Δfre back ground led to loss of suppression of
Hda deficiency. These similarities between fre∆68 and Δfre further confirm the assumption that
suppression of Hda deficiency in fre∆68 is due to loss of function of the fre gene.
The ΔiscU strain formed very small colonies both in an hda+ and in an Δhda back ground.
Consequently it was difficult to tell from the P1 transductions whether the ΔiscU strain was a
suppressor of Hda deficiency. The colonies of the ΔiscU Δhda strain seemed to be more
homogenous than the wild type Δhda strain when restreaked. Neither the expression of piscU or
piscUC63F seemed to affect this picture.
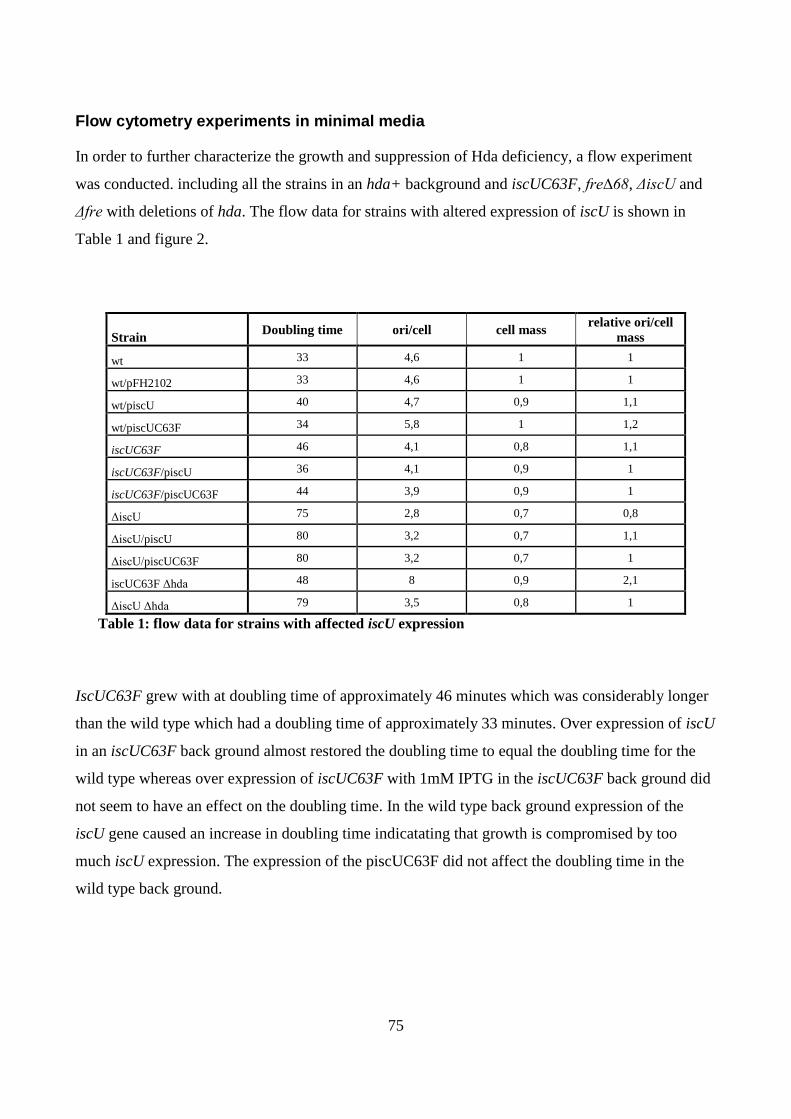
75
Flow cytometry experiments in minimal media
In order to further characterize the growth and suppression of Hda deficiency, a flow experiment
was conducted. including all the strains in an hda+ background and iscUC63F, fre∆68, ΔiscU and
Δfre with deletions of hda. The flow data for strains with altered expression of iscU is shown in
Table 1 and figure 2.
Strain Doubling time ori/cell cell mass
relative ori/cell
mass
wt 33 4,6 1 1
wt/pFH2102 33 4,6 1 1
wt/piscU 40 4,7 0,9 1,1
wt/piscUC63F 34 5,8 1 1,2
iscUC63F 46 4,1 0,8 1,1
iscUC63F/piscU 36 4,1 0,9 1
iscUC63F/piscUC63F 44 3,9 0,9 1
ΔiscU 75 2,8 0,7 0,8
ΔiscU/piscU 80 3,2 0,7 1,1
ΔiscU/piscUC63F 80 3,2 0,7 1
iscUC63F Δhda 48 8 0,9 2,1
ΔiscU Δhda 79 3,5 0,8 1
Table 1: flow data for strains with affected iscU expression
IscUC63F grew with at doubling time of approximately 46 minutes which was considerably longer
than the wild type which had a doubling time of approximately 33 minutes. Over expression of iscU
in an iscUC63F back ground almost restored the doubling time to equal the doubling time for the
wild type whereas over expression of iscUC63F with 1mM IPTG in the iscUC63F back ground did
not seem to have an effect on the doubling time. In the wild type back ground expression of the
iscU gene caused an increase in doubling time indicatating that growth is compromised by too
much iscU expression. The expression of the piscUC63F did not affect the doubling time in the
wild type back ground.
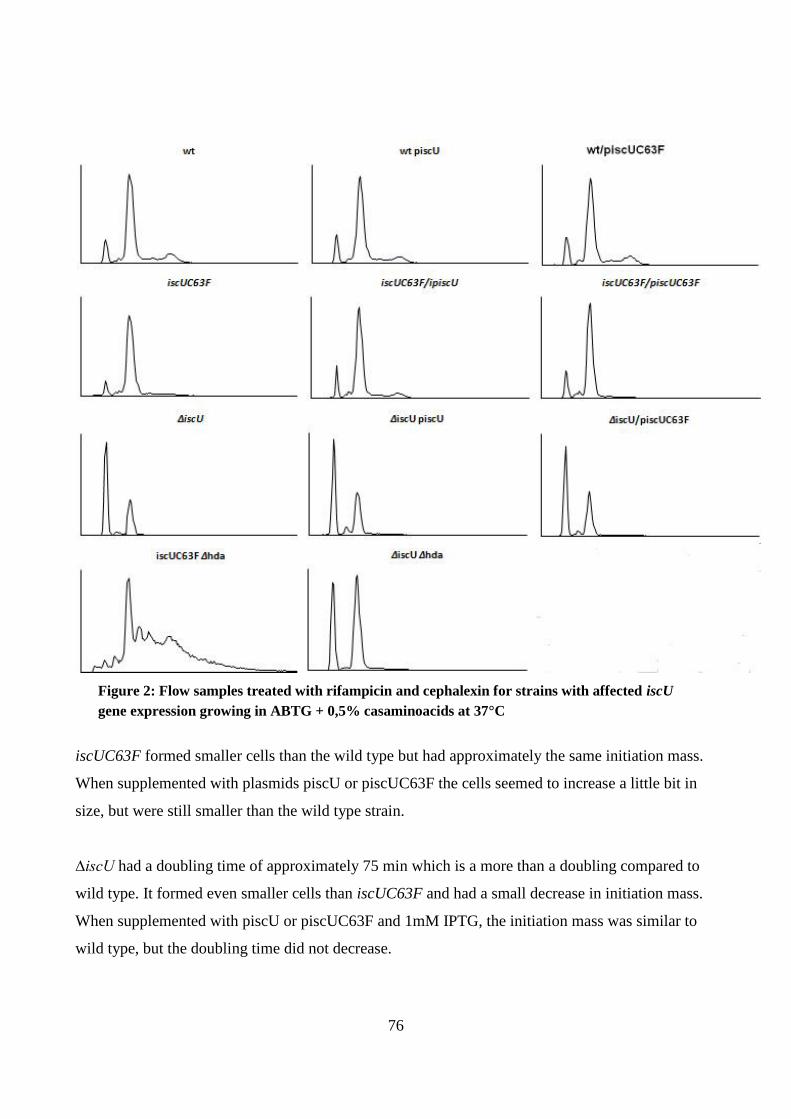
76
Figure 2: Flow samples treated with rifampicin and cephalexin for strains with affected iscU
gene expression growing in ABTG + 0,5% casaminoacids at 37°C
iscUC63F formed smaller cells than the wild type but had approximately the same initiation mass.
When supplemented with plasmids piscU or piscUC63F the cells seemed to increase a little bit in
size, but were still smaller than the wild type strain.
∆iscU had a doubling time of approximately 75 min which is a more than a doubling compared to
wild type. It formed even smaller cells than iscUC63F and had a small decrease in initiation mass.
When supplemented with piscU or piscUC63F and 1mM IPTG, the initiation mass was similar to
wild type, but the doubling time did not decrease.
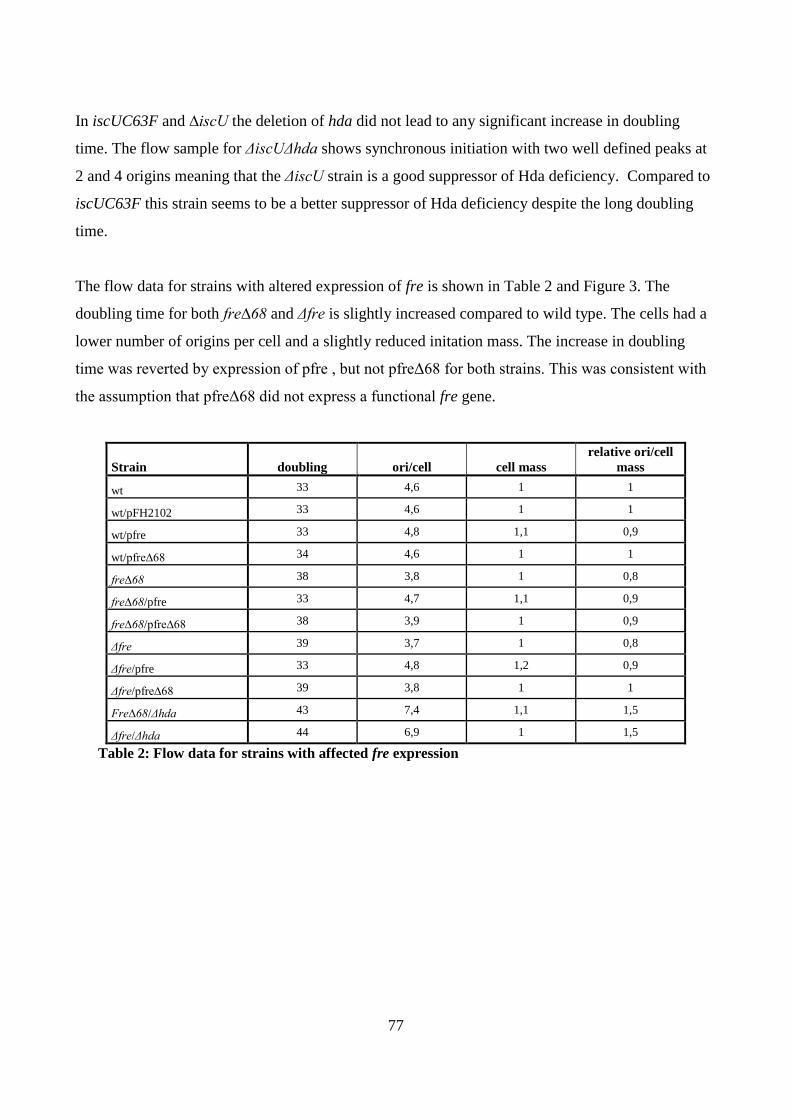
77
In iscUC63F and ∆iscU the deletion of hda did not lead to any significant increase in doubling
time. The flow sample for ΔiscUΔhda shows synchronous initiation with two well defined peaks at
2 and 4 origins meaning that the ΔiscU strain is a good suppressor of Hda deficiency. Compared to
iscUC63F this strain seems to be a better suppressor of Hda deficiency despite the long doubling
time.
The flow data for strains with altered expression of fre is shown in Table 2 and Figure 3. The
doubling time for both fre∆68 and Δfre is slightly increased compared to wild type. The cells had a
lower number of origins per cell and a slightly reduced initation mass. The increase in doubling
time was reverted by expression of pfre , but not pfreΔ68 for both strains. This was consistent with
the assumption that pfreΔ68 did not express a functional fre gene.
Strain doubling ori/cell cell mass relative ori/cell
mass
wt 33 4,6 1 1
wt/pFH2102 33 4,6 1 1
wt/pfre 33 4,8 1,1 0,9
wt/pfre∆68 34 4,6 1 1
fre∆68 38 3,8 1 0,8
fre∆68/pfre 33 4,7 1,1 0,9
fre∆68/pfre∆68 38 3,9 1 0,9
Δfre 39 3,7 1 0,8
Δfre/pfre 33 4,8 1,2 0,9
Δfre/pfre∆68 39 3,8 1 1
Fre∆68/Δhda 43 7,4 1,1 1,5
Δfre/Δhda 44 6,9 1 1,5
Table 2: Flow data for strains with affected fre expression
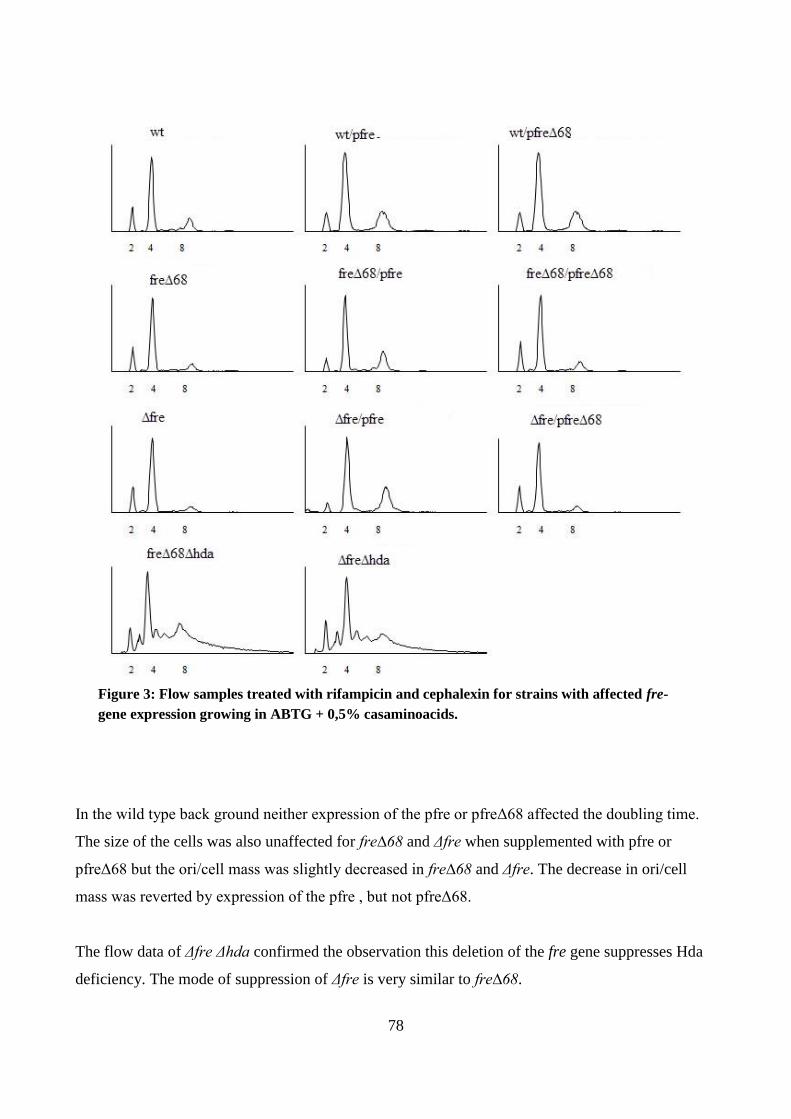
78
Figure 3: Flow samples treated with rifampicin and cephalexin for strains with affected fre-
gene expression growing in ABTG + 0,5% casaminoacids.
In the wild type back ground neither expression of the pfre or pfreΔ68 affected the doubling time.
The size of the cells was also unaffected for fre∆68 and Δfre when supplemented with pfre or
pfreΔ68 but the ori/cell mass was slightly decreased in fre∆68 and Δfre. The decrease in ori/cell
mass was reverted by expression of the pfre , but not pfreΔ68.
The flow data of Δfre Δhda confirmed the observation this deletion of the fre gene suppresses Hda
deficiency. The mode of suppression of Δfre is very similar to fre∆68.
79
Altered gene expression in iscUC63F, fre∆68, ∆fre and wt/pfre investigated by micro
array
In order to characterize the suppression of Hda deficiency by iscUC63F and fre∆68 a microarray
experiment was conducted. The expression of the genes in iscUC63F, fre∆68, Δfre and wt/piscU
was compared to the expression of genes in wild type by isolation of RNA and synthesis of cDNA.
All micro array data are shown in supplementary data. The general pattern for fre∆68, Δfre and
wt/pfre was that the microarray data for fre∆68 and Δfre were very similar. In contrast there are few
similarities between fre∆68 and wt/pfre (supplementary data). This supports the assumption that the
suppression of Hda deficiency from fre∆68 is due to a loss of function of the fre gene. In fre∆68
and Δfre the genes that showed an altered expression in the micro array included genes involved in
iron metabolism, hydrogen peroxide resistance and DNA repair. Also between iscUC63F, fre∆68
and Δfre there was a high degree of similarity in gene expression. In the three strains genes involved
in the respiratory chain, citric acid cycle, carbon metabolism, amino acid metabolism, acid
resistance, cell wall metabolism and motility showed an altered gene expression compared to wild
type. This indicated that the strains might have similar mechanisms for suppression of Hda
deficiency. In addition genes encoding ribonucleotide reductase and iron sulfur cluster systems
showed an altered gene expression in iscUC63F and genes involved in nucleotide synthesis, DNA
replication and repair and iron metabolism showed an altered expression in fre∆68 and Δfre.
iscUC63F and fre∆68 result in altered expression of genes involved in respiration
For both iscUC63F, fre∆68 and Δfre the respiratory dehydrogenases succinate dehydrogenase
encoded by sdhCDAB, NADH dehydrogenase – I encoded by nuoA-N and formate dehydrogenase
encoded by fdoGHI downregulated. In contrast NADH dehydrogenase-II encoded by the ndh gene
was upregulated (Figure 4).
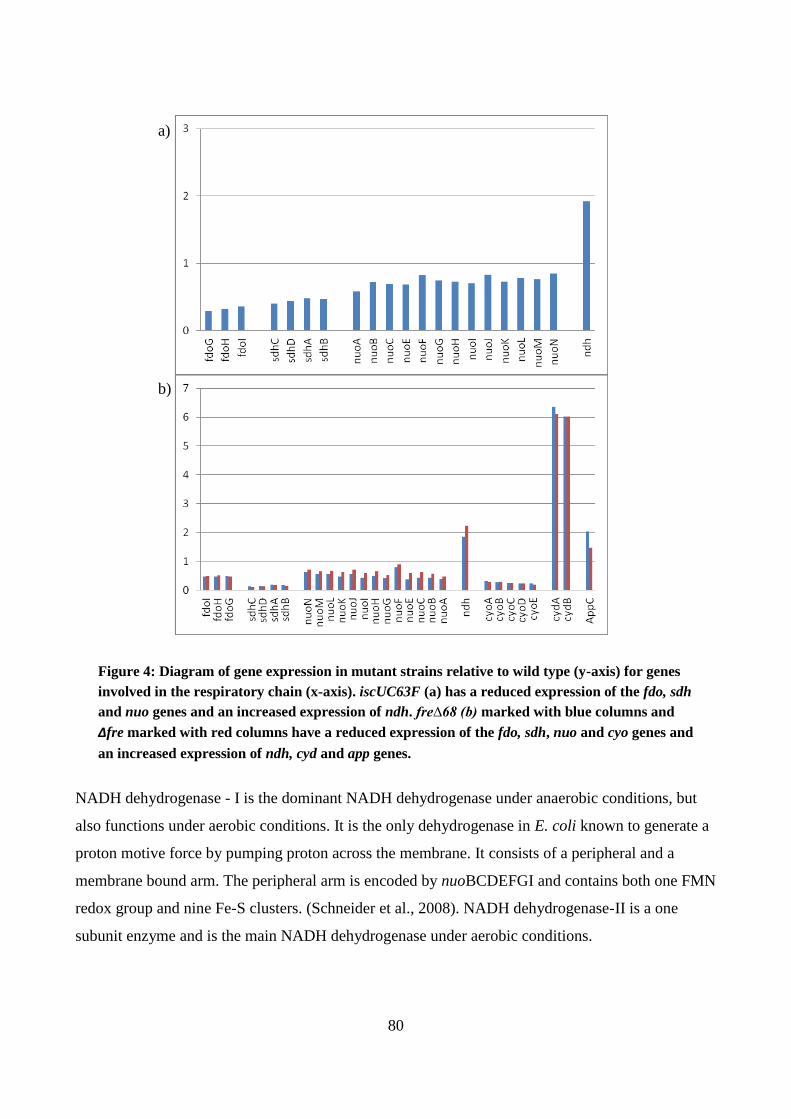
80
Figure 4: Diagram of gene expression in mutant strains relative to wild type (y-axis) for genes
involved in the respiratory chain (x-axis). iscUC63F (a) has a reduced expression of the fdo, sdh
and nuo genes and an increased expression of ndh. fre∆68 (b) marked with blue columns and
∆fre marked with red columns have a reduced expression of the fdo, sdh, nuo and cyo genes and
an increased expression of ndh, cyd and app genes.
NADH dehydrogenase - I is the dominant NADH dehydrogenase under anaerobic conditions, but
also functions under aerobic conditions. It is the only dehydrogenase in E. coli known to generate a
proton motive force by pumping proton across the membrane. It consists of a peripheral and a
membrane bound arm. The peripheral arm is encoded by nuoBCDEFGI and contains both one FMN
redox group and nine Fe-S clusters. (Schneider et al., 2008). NADH dehydrogenase-II is a one
subunit enzyme and is the main NADH dehydrogenase under aerobic conditions.
b)
a)
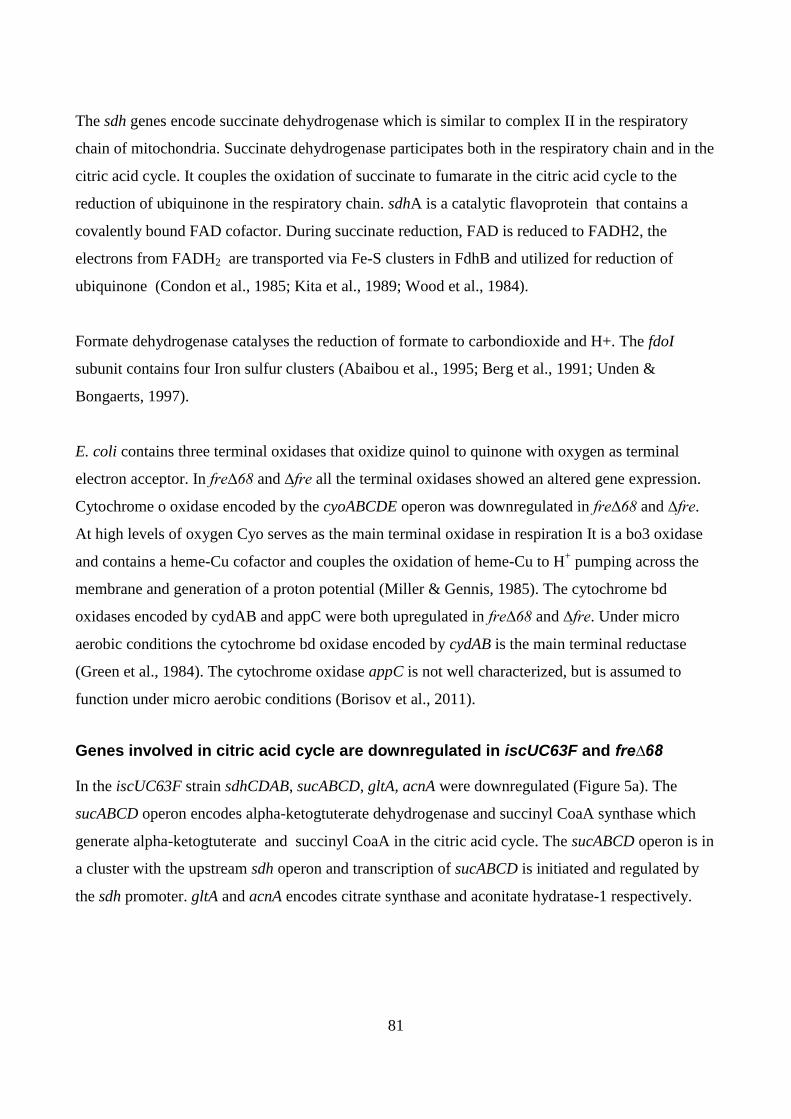
81
The sdh genes encode succinate dehydrogenase which is similar to complex II in the respiratory
chain of mitochondria. Succinate dehydrogenase participates both in the respiratory chain and in the
citric acid cycle. It couples the oxidation of succinate to fumarate in the citric acid cycle to the
reduction of ubiquinone in the respiratory chain. sdhA is a catalytic flavoprotein that contains a
covalently bound FAD cofactor. During succinate reduction, FAD is reduced to FADH2, the
electrons from FADH2 are transported via Fe-S clusters in FdhB and utilized for reduction of
ubiquinone (Condon et al., 1985; Kita et al., 1989; Wood et al., 1984).
Formate dehydrogenase catalyses the reduction of formate to carbondioxide and H+. The fdoI
subunit contains four Iron sulfur clusters (Abaibou et al., 1995; Berg et al., 1991; Unden &
Bongaerts, 1997).
E. coli contains three terminal oxidases that oxidize quinol to quinone with oxygen as terminal
electron acceptor. In fre∆68 and ∆fre all the terminal oxidases showed an altered gene expression.
Cytochrome o oxidase encoded by the cyoABCDE operon was downregulated in fre∆68 and ∆fre.
At high levels of oxygen Cyo serves as the main terminal oxidase in respiration It is a bo3 oxidase
and contains a heme-Cu cofactor and couples the oxidation of heme-Cu to H+ pumping across the
membrane and generation of a proton potential (Miller & Gennis, 1985). The cytochrome bd
oxidases encoded by cydAB and appC were both upregulated in fre∆68 and ∆fre. Under micro
aerobic conditions the cytochrome bd oxidase encoded by cydAB is the main terminal reductase
(Green et al., 1984). The cytochrome oxidase appC is not well characterized, but is assumed to
function under micro aerobic conditions (Borisov et al., 2011).
Genes involved in citric acid cycle are downregulated in iscUC63F and fre∆68
In the iscUC63F strain sdhCDAB, sucABCD, gltA, acnA were downregulated (Figure 5a). The
sucABCD operon encodes alpha-ketogtuterate dehydrogenase and succinyl CoaA synthase which
generate alpha-ketogtuterate and succinyl CoaA in the citric acid cycle. The sucABCD operon is in
a cluster with the upstream sdh operon and transcription of sucABCD is initiated and regulated by
the sdh promoter. gltA and acnA encodes citrate synthase and aconitate hydratase-1 respectively.
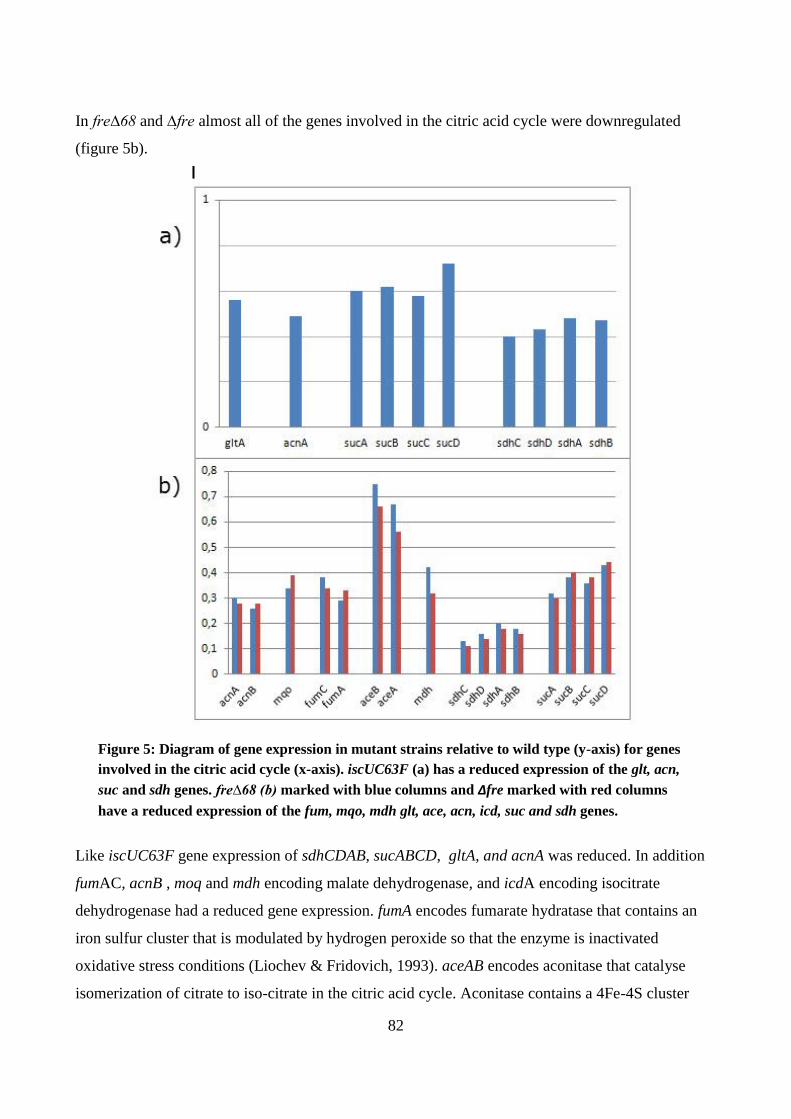
82
In fre∆68 and ∆fre almost all of the genes involved in the citric acid cycle were downregulated
(figure 5b).
Figure 5: Diagram of gene expression in mutant strains relative to wild type (y-axis) for genes
involved in the citric acid cycle (x-axis). iscUC63F (a) has a reduced expression of the glt, acn,
suc and sdh genes. fre∆68 (b) marked with blue columns and ∆fre marked with red columns
have a reduced expression of the fum, mqo, mdh glt, ace, acn, icd, suc and sdh genes.
Like iscUC63F gene expression of sdhCDAB, sucABCD, gltA, and acnA was reduced. In addition
fumAC, acnB , moq and mdh encoding malate dehydrogenase, and icdA encoding isocitrate
dehydrogenase had a reduced gene expression. fumA encodes fumarate hydratase that contains an
iron sulfur cluster that is modulated by hydrogen peroxide so that the enzyme is inactivated
oxidative stress conditions (Liochev & Fridovich, 1993). aceAB encodes aconitase that catalyse
isomerization of citrate to iso-citrate in the citric acid cycle. Aconitase contains a 4Fe-4S cluster
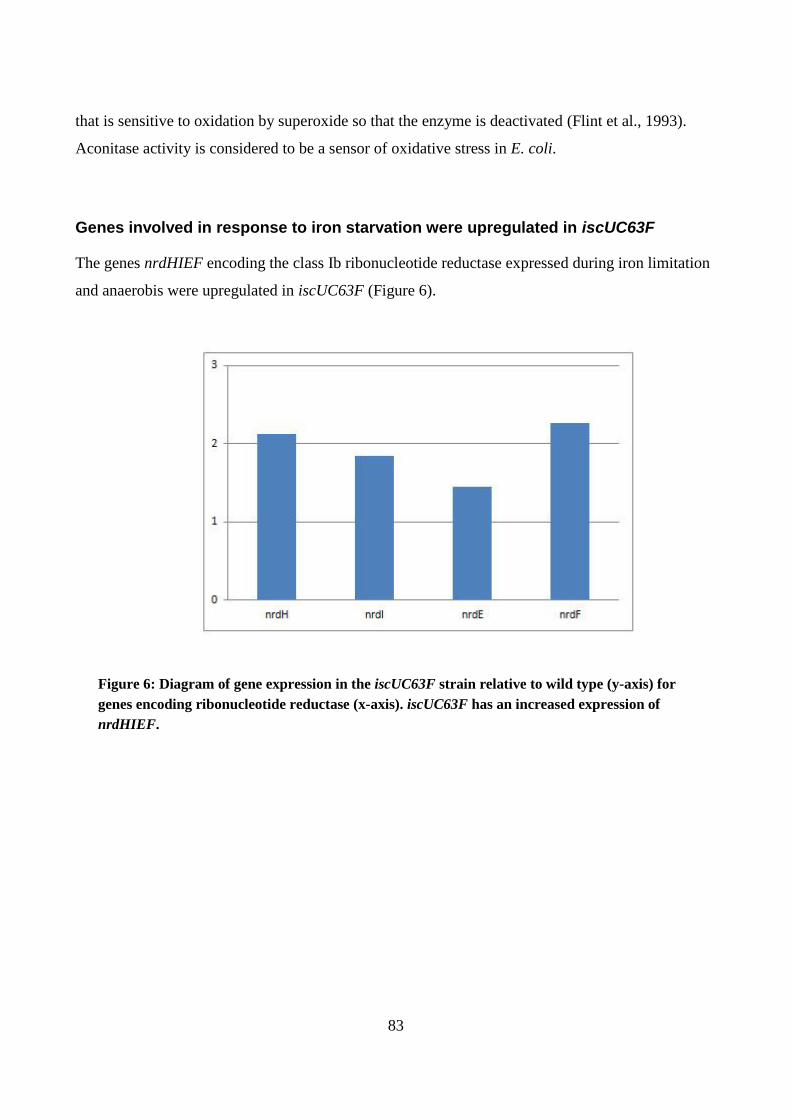
83
that is sensitive to oxidation by superoxide so that the enzyme is deactivated (Flint et al., 1993).
Aconitase activity is considered to be a sensor of oxidative stress in E. coli.
Genes involved in response to iron starvation were upregulated in iscUC63F
The genes nrdHIEF encoding the class Ib ribonucleotide reductase expressed during iron limitation
and anaerobis were upregulated in iscUC63F (Figure 6).
Figure 6: Diagram of gene expression in the iscUC63F strain relative to wild type (y-axis) for
genes encoding ribonucleotide reductase (x-axis). iscUC63F has an increased expression of
nrdHIEF.
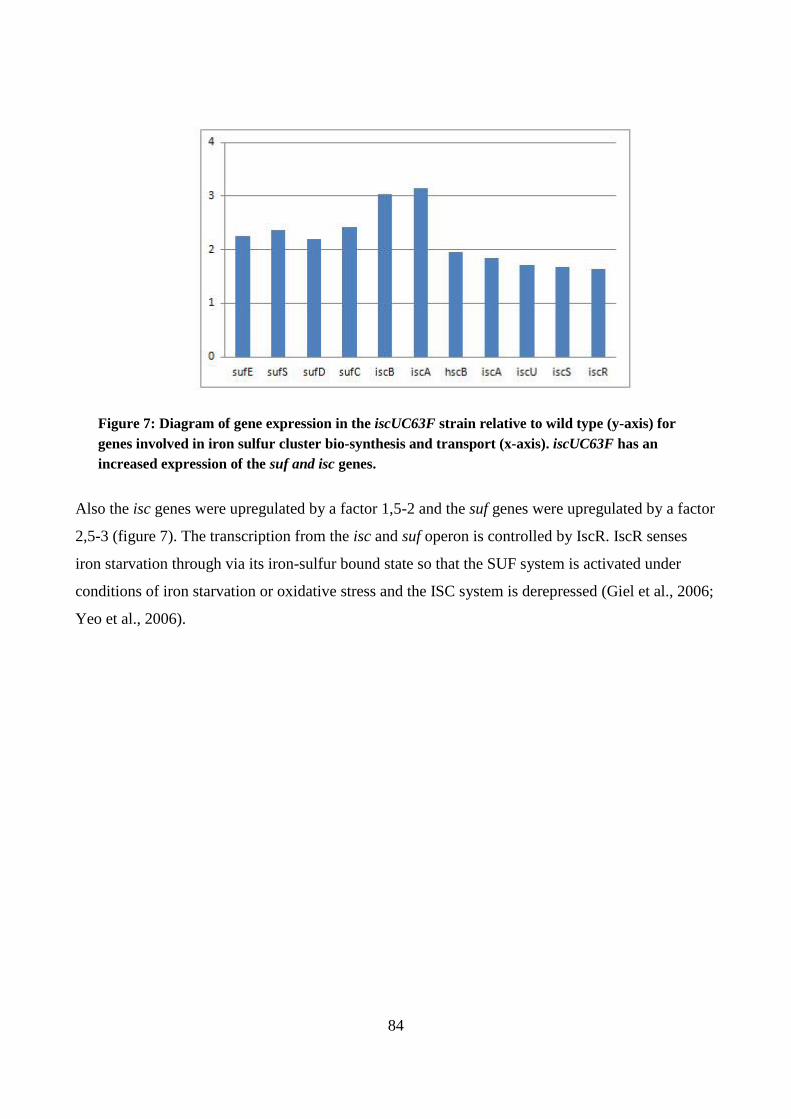
84
Figure 7: Diagram of gene expression in the iscUC63F strain relative to wild type (y-axis) for
genes involved in iron sulfur cluster bio-synthesis and transport (x-axis). iscUC63F has an
increased expression of the suf and isc genes.
Also the isc genes were upregulated by a factor 1,5-2 and the suf genes were upregulated by a factor
2,5-3 (figure 7). The transcription from the isc and suf operon is controlled by IscR. IscR senses
iron starvation through via its iron-sulfur bound state so that the SUF system is activated under
conditions of iron starvation or oxidative stress and the ISC system is derepressed (Giel et al., 2006;
Yeo et al., 2006).
85
Discussion
Suppression of Hda deficiency by loss of function of fre or iscU genes
For both iscUC63F and fre∆68 we found that suppression of Hda defiency is due to loss of function
of the iscU and fre gene respectively. The deletion of the genes led to more homogenous and bigger
colonies in P1-phage transduction with the hda::cat allele. Furthermore the suppression of Hda
deficiency was lost when iscU or fre was expressed from a plasmid in the two hsm strains (figure
1).
Investigation of ∆iscU ∆hda and ∆fre ∆hda by flow cytometry also showed that these strains were
suppressors of Hda deficiency. The ∆iscU strain showed a better suppression than iscUC63F
indicating that the function of iscU in iscUC63F is only partially reduced or that the deletion of
iscU results in a polar effect with either iscA or iscS located downstream and upstream of the iscU
gene respectively. It has previously been shown that alteration of one of the three conserved
cysteines in IscU decreases the transfer of Sulfur from IscS to IscU (Smith et al., 2005). The
mutation in iscUC63F alters the conserved cysteine at position 63 to alanine in IscU. The mutation
in iscUC63F may therefore very well result in a reduced function of the iscU gene and lead to a
decreased level of iron sulfur assembly followed by a less efficient Fe-S cluster transfer to recipient
apoproteins. Because iron sulfur enzymes play a major role in electron transfer in the respiratory
chains, a less efficient transfer of iron sulfur clusters to enzymes in the electron transport chain
might lead to reduced aerobic respiration. In fre∆68 the loss of function of the fre gene would lead
unfunctional flavoproteins including enzymes involved in respiratory chains.
In a wild type back ground over expression of iscU resulted in slower growth indicating that an
elevated level of IscU can compromise growth. In contrast the mutant expression from a plasmid of
the mutant iscU gene from iscUC63F did not change the growth which indicated that the
iscUC63F-IscU gene had a decreased function. Over expression of piscU but not piscUC63F in an
iscUC63F background showed growth similar to wild type indicating that overexpression of the
wild iscU gene reverts the altered growth of iscUC63F to normal and confirming that the
iscUC63F-iscU gene has a reduced function. In the ΔiscU back ground neither overexpression of
86
piscU or piscUC63F had any significant effect, confirming the assumption that the deletion of iscU
results in a polar effect.
fre∆68 and Δfre both had an increased doubling time and showed similar results in the flow
experiments. Expression of pfre , but not pfreΔ68 reverted the altered growth of fre∆68 and Δfre to
a pattern similar to wild type. This confirmed the assumption that fre∆68 had an altered growth due
to loss of function of fre gene.
Suppression of Hda deficiency in iscUC63F might be a consequence of response to
oxidative stress or iron starvation
For iscUC63F a possible explanation for the suppression of Hda deficiency could be that the cells
respond to iron limitiation or oxidative stress because of the decrease in iron sulfur cluster function.
The increase in the suf and isc genes encoding iron sulfur cluster can be explained by altered
activity or the regulator IscR. IscR exists both with a bound iron sulfur cluster favoured under
normal conditions and in an apo-form favoured under iron limited or oxidative stress conditions.
The iron sulfur cluster bound form of iscR repress transcription of the isc operon while the apo-
form stimulates expression of the suf operon under iron limitation or oxidative stress (Giel et al.,
2006; Yeo et al., 2006). Consequently a shift from the iron sulfur bound form of IscR to the
apoform due to a decreased function of the iron sulfur cluster transfer in iscUC63F would result in
derepression of the isc operon and activation of the suf operon.
A previous study has shown that during oxidative stress E. coli repressed genes involved in the
citric acid cycle (gltA, sucA, sucC, sdh, fumA). Furthermore the ackA gene encoding acetate kinase
responsible for acetic acid producing reactions was increased by a factor 2. The cells were
suggested to switch to a “suppressed aerobiosis” metabolism possibly to reduce damages caused by
ROS. (Ojima et al., 2008). In our results we saw a similar reduced expression of citric acid cycle
genes and also ackA was also upregulated in boths iscUC63F, fre∆68 and Δfre.
The ribonucleotide reductase encoded by nrdEF that is somewhat upregulated in iscUC63F is also
activated under iron limitation. Expression of both nrdEF and nrdAB from a plasmid is known to
suppress Hda deficiency (Fujimitsu et al., 2008; Gon et al., 2006). NrdEF however requires
manganese in combination with iron starvation in order to function, thus the suppression of Hda
87
deficiency in this work cannot be explained by nrdEF expression because cells were grown without
manganese.
Suppression of Hda deficiency in iscUC63F and fre∆68 might be a consequence of
reduced ROS production in these strains
The microarray data showed a similar expression pattern for iscUC63F and fre∆68 in respect to
genes involved in the respiratory system, citric acid circle, amino acid synthesis, carbon metabolism
and acid resistance. This led to the assumption that the suppression of Hda deficiency from these
two strains might be due to similar effects of the two mutations.
Both iron sulfur clusters and flavin groups play important roles in the aerobic respiratory chains of
E. coli. Therefore it seems likely that the reduced or lost function of IscU or Fre would compromise
the aerobic respiration in the cell both iscUC63F and fre∆68. Respiration in E. coli includes several
different electron transfer chains. They all function by changing the redox state of quinone and can
be divided into primary dehydrogenases that reduce quinone and terminal reductases or oxidases
that oxidize quinol. During respiration the dehydrogenases produce ROS when the reduced flavins
of these enzymes accidently pass electrons to oxygen and mutants with an obstructed respiratory
chain have been shown to drastically lower the formation of O2- in the cells (Imlay, 2003). It is
possible that reduced function of the dehydrogenases as a result of lost or reduced function of IscU
or Fre lead to reduced ROS production in the cells and that this gives rise to suppression of Hda
deficiency by allowing Hda deficient cells to grow with less damages to their DNA.
The reduced function of the dehydrogenases does however not explain the altered gene expression
observed in iscUC63F and fre∆68 the micro array. It has been shown that both reduced flavins and
the overproduction of iron sulfur clusters generate ROS which consequently would indicate that
cells deficient in generating these substances were subject to a lower level of oxidative stress.
It is possible that the cells sense the compromised aerobic respiration as a result of oxygen
limitation and respond by adaptating to anaerobic or micro aerobic metabolism.
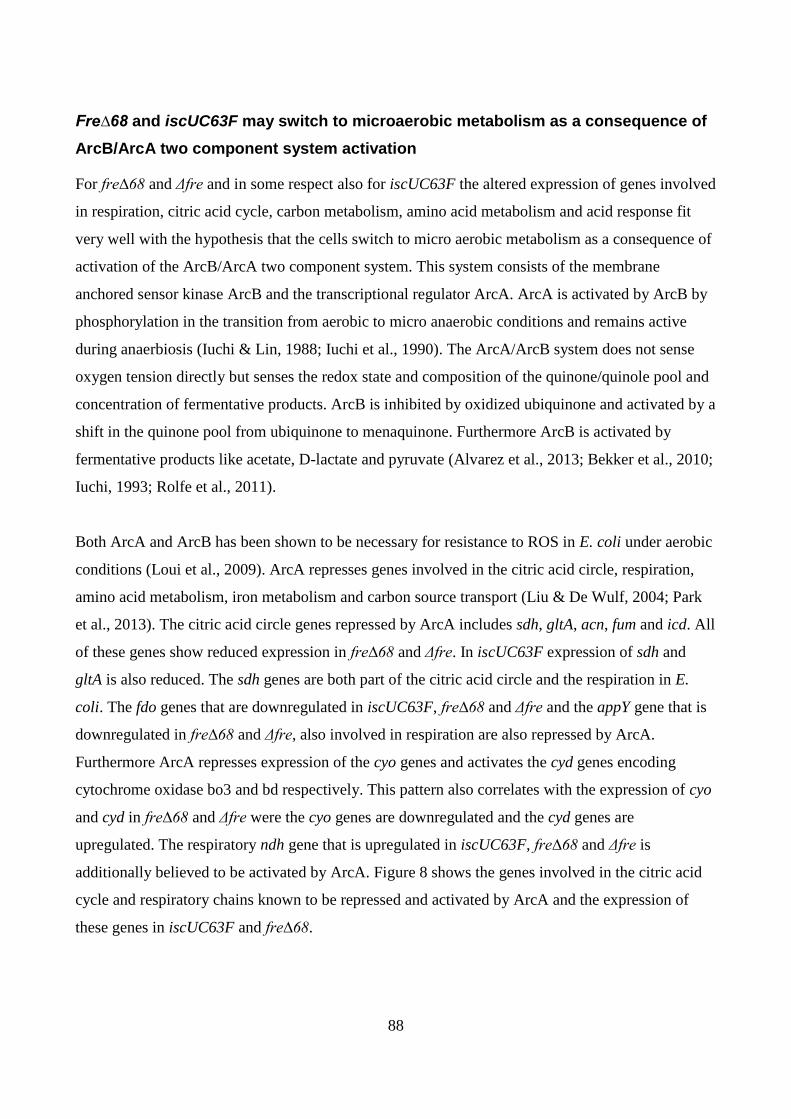
88
Fre∆68 and iscUC63F may switch to microaerobic metabolism as a consequence of
ArcB/ArcA two component system activation
For fre∆68 and Δfre and in some respect also for iscUC63F the altered expression of genes involved
in respiration, citric acid cycle, carbon metabolism, amino acid metabolism and acid response fit
very well with the hypothesis that the cells switch to micro aerobic metabolism as a consequence of
activation of the ArcB/ArcA two component system. This system consists of the membrane
anchored sensor kinase ArcB and the transcriptional regulator ArcA. ArcA is activated by ArcB by
phosphorylation in the transition from aerobic to micro anaerobic conditions and remains active
during anaerbiosis (Iuchi & Lin, 1988; Iuchi et al., 1990). The ArcA/ArcB system does not sense
oxygen tension directly but senses the redox state and composition of the quinone/quinole pool and
concentration of fermentative products. ArcB is inhibited by oxidized ubiquinone and activated by a
shift in the quinone pool from ubiquinone to menaquinone. Furthermore ArcB is activated by
fermentative products like acetate, D-lactate and pyruvate (Alvarez et al., 2013; Bekker et al., 2010;
Iuchi, 1993; Rolfe et al., 2011).
Both ArcA and ArcB has been shown to be necessary for resistance to ROS in E. coli under aerobic
conditions (Loui et al., 2009). ArcA represses genes involved in the citric acid circle, respiration,
amino acid metabolism, iron metabolism and carbon source transport (Liu & De Wulf, 2004; Park
et al., 2013). The citric acid circle genes repressed by ArcA includes sdh, gltA, acn, fum and icd. All
of these genes show reduced expression in fre∆68 and Δfre. In iscUC63F expression of sdh and
gltA is also reduced. The sdh genes are both part of the citric acid circle and the respiration in E.
coli. The fdo genes that are downregulated in iscUC63F, fre∆68 and Δfre and the appY gene that is
downregulated in fre∆68 and Δfre, also involved in respiration are also repressed by ArcA.
Furthermore ArcA represses expression of the cyo genes and activates the cyd genes encoding
cytochrome oxidase bo3 and bd respectively. This pattern also correlates with the expression of cyo
and cyd in fre∆68 and Δfre were the cyo genes are downregulated and the cyd genes are
upregulated. The respiratory ndh gene that is upregulated in iscUC63F, fre∆68 and Δfre is
additionally believed to be activated by ArcA. Figure 8 shows the genes involved in the citric acid
cycle and respiratory chains known to be repressed and activated by ArcA and the expression of
these genes in iscUC63F and fre∆68.
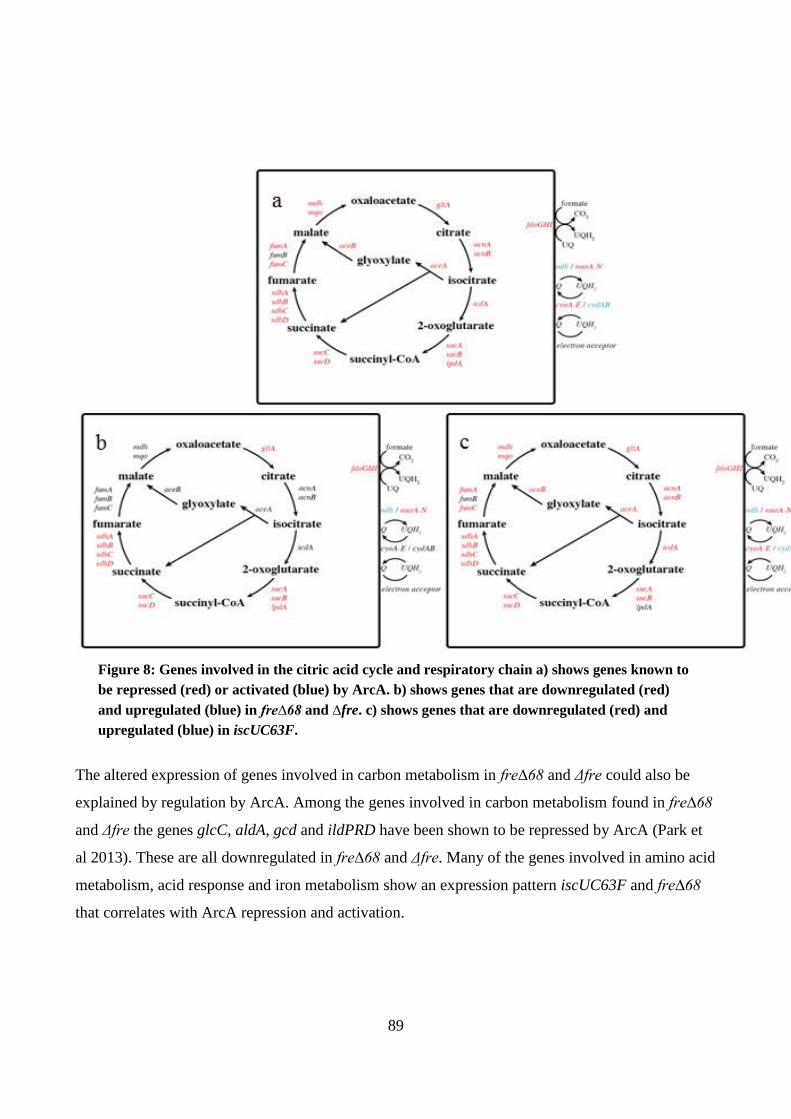
89
Figure 8: Genes involved in the citric acid cycle and respiratory chain a) shows genes known to
be repressed (red) or activated (blue) by ArcA. b) shows genes that are downregulated (red)
and upregulated (blue) in fre∆68 and ∆fre. c) shows genes that are downregulated (red) and
upregulated (blue) in iscUC63F.
The altered expression of genes involved in carbon metabolism in fre∆68 and Δfre could also be
explained by regulation by ArcA. Among the genes involved in carbon metabolism found in fre∆68
and Δfre the genes glcC, aldA, gcd and ildPRD have been shown to be repressed by ArcA (Park et
al 2013). These are all downregulated in fre∆68 and Δfre. Many of the genes involved in amino acid
metabolism, acid response and iron metabolism show an expression pattern iscUC63F and fre∆68
that correlates with ArcA repression and activation.
90
Reduced function of the cytochrome oxidases might cause activation of ArcB/ArcA
The activation of ArcB/A could be explained by a reduced function of the cytochrome oxidases of
the respiratory system that are dependent of the flavoenzyme HemG that contains an FMN cofactor
for the transfer of electrons from its ubiquinone (Möbius et al., 2010). The cytochrome oxidases are
also dependent on cytochrome heme, that possibly could be affected both by deficiency in IscU or
Fre. If either the flavoprotein or the heme group have a decreased function, the cytochrome
oxidases will be deficient in oxidizing ubiquinol to ubiquinone. It has previously been shown that
deletion of all of the cytochrome oxidases in E. coli led a strongly reduced oxygen uptake and that
the deletion of one or all of the cytochrome oxidases led to activation of ArcA due to a shift in the
quinone pool from ubiquinone to menaquinone (Alvarez et al., 2013; Bekker et al., 2010).
Ubiquinone is the dominant quinone under aerobic conditions whereas menaquinone is dominant
under anaerobic conditions. A shift in the quinone pool from ubiquinone to menaquinone could also
simply be a result of reduced aerobic respiration due to the reduced function of the aerobic
dehydrogenases.
The assumption that iscUC63F and fre∆68 switch to micro aerobic metabolism and that this is the
cause of the Hda deficiency suppression is supported by the fact that Fre is responsible for
production of superoxide in E. coli (Gaudu et al., 1994). The loss of function of fre would lead to
reduced ROS which could also explain the reduction in expression of genes involved in hydrogen
peroxide resistance and DNA repair in fre∆68 and Δfre.
Hda deficiency can be suppressed by multiple mechanisms
The lethal overinitiation in Hda deficient E. coli is a result of an elevated level of DnaA-ATP. One
category of suppressors of Hda deficiency act to lower the activity of the DnaA protein to
counteract overinitiation (Charbon et al., 2011, Gon et al., 2006). A second category of suppressors
reduces the ability of oriC to initiate DNA replication either as a consequence of mutations in oriC
itself or as a consequence of mutations leading to reduced availability of oriC (Charbon et al., 2011,
Katayma et al., 1997, Riber et al., 2009).
91
Recently we have shown that E. coli has a third mechanism for suppression of Hda deficiency. The
cells can tolerate the otherwise lethal overinitiation if anaerobic growth conditions are maintained
so that damages due to ROS is reduced (Charbon et al., 2014). If the suppression of Hda deficiency
caused by iscUC63F and fre∆68 is a result of ArcAB regulation these mutants fall into this third
category of suppressors.
The possible role of the ArcB/ArcA two component systems remains however to be elucidated. The
phosphorylation and thus the activity of ArcA can be studied by using an ArcA-P dependent
reporter that solely responds to the phosphorylated form of ArcA (Bekker et al., 2010). To
determine whether iscUC63F and fre∆68 do in fact switch to micro aerobic metabolism through
ArcAB regulation the next step would be to use this reporter to test the activity of ArcA.
92
References
Abaibou, H., Pommier, J., Benoit, S., Giordano, G., & Mandrand-Berthelot, M. A. (1995). ression
and characterization of the Escherichia coli fdo locus and a possible physiological role for aerobic
formate dehydrogenase. Journal of Bacteriology, 177(24), 7141–9.
Alvarez, A. F., Rodriguez, C., & Georgellis, D. (2013). Ubiquinone and menaquinone electron
carriers represent the yin and yang in the redox regulation of the ArcB sensor kinase. Journal of
Bacteriology, 195(13), 3054–61.
Atlung, T., & Hansen, F. G. (2002). Effect of different concentrations of H-NS protein on
chromosome replication and the cell cycle in Escherichia coli. Journal of Bacteriology, 184(7),
1843–50.
Beinert, H. (1997). Iron-Sulfur Clusters: Nature’s Modular, Multipurpose Structures. Science,
277(5326), 653–659.
Bekker, M., Alexeeva, S., Laan, W., Sawers, G., Teixeira de Mattos, J., & Hellingwerf, K. (2010).
The ArcBA two-component system of Escherichia coli is regulated by the redox state of both the
ubiquinone and the menaquinone pool. Journal of Bacteriology, 192(3), 746–754.
Berg, B. L., Li, J., Heider, J., & Stewart, V. (1991). Nitrate-inducible formate dehydrogenase in
Escherichia coli K-12. I. Nucleotide sequence of the fdnGHI operon and evidence that opal (UGA)
encodes selenocysteine. The Journal of Biological Chemistry, 266(33), 22380–5.
Bjelland, S., & Seeberg, E. (2003). Mutagenicity, toxicity and repair of DNA base damage induced
by oxidation. Mutation Research, 531(1-2), 37–80.
Borisov, V. B., Gennis, R. B., Hemp, J., & Verkhovsky, M. I. (2011). The cytochrome bd
respiratory oxygen reductases. Biochimica et Biophysica Acta, 1807(11), 1398–413.
Boye, E. (1991). A turnstile for initiation of DNA replication. Trends in Cell Biology, 1(5), 107–9.
93
Boye, E., & Løbner-Olesen, A. (1991). Bacterial growth control studied by flow cytometry.
Research in Microbiology, 142(2-3), 131–5.
Boye, E., Løbner-Olesen, A., & Skarstad, K. (2000). Limiting DNA replication to once and only
once. EMBO Reports, 1(6), 479–83.
Charbon, G., Bjørn, L., Mendoza-Chamizo, B., Frimodt-Møller, J., & Løbner-Olesen A. (2014)
Oxidative DNA damage is instrumental in hyperreplication stress-induced inviability of Escherichia
coli. Nucleic acid research. 42, 13228-13241
Charbon, G., Riber, L., Cohen, M., Skovgaard, O., Fujimitsu, K., Katayama, T., & Løbner-Olesen,
A. (2011). Suppressors of DnaA(ATP) imposed overinitiation in Escherichia coli. Molecular
Microbiology, 79(4), 914–28.
Clark, D. J., & Maaløe, O. (1967). DNA Replication and the Division Cycle in Escherichia coli. J.
Mol. Biol., 23, 99–112.
Condon, C., Cammack, R., Patil, D. S., & Owen, P. (1985). The succinate dehydrogenase of
Escherichia coli. Immunochemical resolution and biophysical characterization of a 4-subunit
enzyme complex. The Journal of Biological Chemistry, 260(16), 9427–34.
Cooke, M. S., Evans, M. D., Dizdaroglu, M., & Lunec, J. (2003). Oxidative DNA damage:
mechanisms, mutation, and disease. FASEB Journal : Official Publication of the Federation of
American Societies for Experimental Biology, 17(10), 1195–214.
Flint, D. H., Tuminello, J. F., & Emptage, M. H. (1993). The inactivation of Fe-S cluster containing
hydro-lyases by superoxide. The Journal of Biological Chemistry, 268(30), 22369–76.
Fujimitsu, K., Su’etsugu, M., Yamaguchi, Y., Mazda, K., Fu, N., Kawakami, H., & Katayama, T.
(2008). Modes of overinitiation, dnaA gene expression, and inhibition of cell division in a novel
cold-sensitive hda mutant of Escherichia coli. Journal of Bacteriology, 190(15), 5368–5381.
94
Gaudu, P., Touati, D., Nivière, V., & Fontecave, M. (1994). The NAD(P)H:flavin oxidoreductase
from Escherichia coli as a source of superoxide radicals. The Journal of Biological Chemistry,
269(11), 8182–8188.
Giel, J. L., Rodionov, D., Liu, M., Blattner, F. R., & Kiley, P. J. (2006). IscR-dependent gene
expression links iron-sulphur cluster assembly to the control of O2-regulated genes in Escherichia
coli. Molecular Microbiology, 60(4), 1058–75.
Gon, S., Camara, J. E., Klungsøyr, H. K., Crooke, E., Skarstad, K., & Beckwith, J. (2006). A novel
regulatory mechanism couples deoxyribonucleotide synthesis and DNA replication in Escherichia
coli. The EMBO Journal, 25(5), 1137–47.
Green, G. N., Kranz, J. E., & Gennis, R. B. (1984). Cloning the cyd gene locus coding for the
cytochrome d complex of Escherichia coli. Gene, 32(1-2), 99–106. Retrieved from
Guyer, M. S., Reed, R.R., Steitz, J.A., & Low, K.B. (1981) Identification of a sex-factor-affinity
site in E. coli as gamma delta. Cold Spring Harb. Symp Quant. Biol., 45, 135-140
Halliwell, B. (1999). Oxygen and nitrogen are pro-carcinogens. Damage to DNA by reactive
oxygen, chlorine and nitrogen species: measurement, mechanism and the effects of nutrition.
Mutation Research, 443(1-2), 37–52.
Imlay, J. a. (2003). Pathways of oxidative damage. Annual Review of Microbiology, 57, 395–418.
Iuchi, S. (1993). Phosphorylation/dephosphorylation of the receiver module at the conserved
aspartate residue controls transphosphorylation activity of histidine kinase in sensor protein ArcB of
Escherichia coli. The Journal of Biological Chemistry, 268(32), 23972–80.
Iuchi, S., & Lin, E. C. (1988). arcA (dye), a global regulatory gene in Escherichia coli mediating
repression of enzymes in aerobic pathways. Proceedings of the National Academy of Sciences of the
United States of America, 85(6), 1888–92. Retrieved from
95
Iuchi, S., Matsuda, Z., Fujiwara, T., & Lin, E. C. (1990). The arcB gene of Escherichia coli encodes
a sensor-regulator protein for anaerobic repression of the arc modulon. Molecular Microbiology,
4(5), 715–27.
Johnson, D. C., Dean, D. R., Smith, A. D., & Johnson, M. K. (2005a). Structure, function, and
formation of biological iron-sulfur clusters. Annual Review of Biochemistry, 74, 247–81.
Johnson, D. C., Dean, D. R., Smith, A. D., & Johnson, M. K. (2005b). Structure, function, and
formation of biological iron-sulfur clusters. Annual Review of Biochemistry, 74, 247–81.
Katayama, T., Kubota, T., Kurokawa, K., Crooke, E., & Sekimizu, K. (1998). The initiator function
of DnaA protein is negatively regulated by the sliding clamp of the E. coli chromosomal replicase.
Cell, 94(1), 61–71.
Kato, J., & Katayama, T. (2001). Hda, a novel DnaA-related protein, regulates the replication cycle
in Escherichia coli. The EMBO Journal, 20(15), 4253–62.
Kita, K., Vibat, C. R., Meinhardt, S., Guest, J. R., & Gennis, R. B. (1989). One-step purification
from Escherichia coli of complex II (succinate: ubiquinone oxidoreductase) associated with
succinate-reducible cytochrome b556. The Journal of Biological Chemistry, 264(5), 2672–7.
Kussmaul, L., & Hirst, J. (2006). The mechanism of superoxide production by NADH:ubiquinone
oxidoreductase (complex I) from bovine heart mitochondria. Proceedings of the National Academy
of Sciences of the United States of America, 103(20), 7607–12.
Lill, R. (2009). Function and biogenesis of iron-sulphur proteins. Nature, 460(7257), 831–838.
Lin, E. C., & Iuchi, S. (1991). Regulation of gene expression in fermentative and respiratory
systems in Escherichia coli and related bacteria. Annual Review of Genetics, 25, 361–87.
Liochev, S. I., & Fridovich, I. (1993). Modulation of the fumarases of Escherichia coli in response
to oxidative stress. Archives of Biochemistry and Biophysics, 301(2), 379–84.
96
Liu, X., & De Wulf, P. (2004). Probing the ArcA-P modulon of Escherichia coli by whole genome
transcriptional analysis and sequence recognition profiling. The Journal of Biological Chemistry,
279(13), 12588–12597.
Loui, C., Chang, A. C., & Lu, S. (2009). Role of the ArcAB two-component system in the
resistance of Escherichia coli to reactive oxygen stress. BMC Microbiology, 9, 183.
Lynch, A. S., & Lin, E. C. (1996). Transcriptional control mediated by the ArcA two-component
response regulator protein of Escherichia coli : characterization of DNA binding at target promoters.
J. Bact 178(21), 6238-49
Løbner-Olesen, A. (1999). Distribution of minichromosomes in individual Escherichia coli cells:
implications for replication control. The EMBO Journal, 18(6), 1712–21.
Malpica, R., Franco, B., Rodriguez, C., Kwon, O., & Georgellis, D. (2004). Identification of a
quinone-sensitive redox switch in the ArcB sensor kinase. Proceedings of the National Academy of
Sciences of the United States of America, 101(36), 13318–23.
Malpica, R., Sandoval, G. R. P., Rodríguez, C., Franco, B., & Georgellis, D. (2006). Signaling by
the Arc Two-Component System Provides a Link Between the Redox State of the Quinone Pool
and Gene Expression, 8.
McGarry, K. C., Ryan, V. T., Grimwade, J. E., & Leonard, A. C. (2004). Two discriminatory
binding sites in the Escherichia coli replication origin are required for DNA strand opening by
initiator DnaA-ATP. Proceedings of the National Academy of Sciences of the United States of
America, 101(9), 2811–6.
Messner, K. R., & Imlay, J. A. (1999). The identification of primary sites of superoxide and
hydrogen peroxide formation in the aerobic respiratory chain and sulfite reductase complex of
Escherichia coli. The Journal of Biological Chemistry, 274(15), 10119–28.
97
Miller, M. J., & Gennis, R. B. (1985). The cytochrome d complex is a coupling site in the aerobic
respiratory chain of Escherichia coli. The Journal of Biological Chemistry, 260(26), 14003–8.
Möbius, K., Arias-Cartin, R., Breckau, D., Hännig, A.-L., Riedmann, K., Biedendieck, R., … Jahn,
D. (2010). Heme biosynthesis is coupled to electron transport chains for energy generation.
Proceedings of the National Academy of Sciences of the United States of America, 107(23), 10436–
10441.
Ojima, Y., Nishioka, M., & Taya, M. (2008). Metabolic alternations in SOD-deficient Escherichia
coli cells when cultivated under oxidative stress from photoexcited titanium dioxide. Biotechnology
Letters, 30(6), 1107–1113.
Park, D. M., Akhtar, M. S., Ansari, A. Z., Landick, R., & Kiley, P. J. (2013). The Bacterial
Response Regulator ArcA Uses a Diverse Binding Site Architecture to Regulate Carbon Oxidation
Globally. PLoS Genetics, 9(10), e1003839.
Riber, L., Olsson, J. A., Jensen, R. B., Skovgaard, O., Dasgupta, S., Marinus, M. G., & Løbner-
Olesen, A. (2006). Hda-mediated inactivation of the DnaA protein and dnaA gene autoregulation
act in concert to ensure homeostatic maintenance of the Escherichia coli chromosome. Genes &
Development, 20(15), 2121–34.
Riber,L., Fujimitsu, K., Katayama, T., & Løbner-Olesen, A. (2009) Loss of Hda activity stimulates
replication initiation from I-box, but not R4 mutant origins in Escherichia coli. Mol Microbiol., 71,
107-122
Roche, B., Aussel, L., Ezraty, B., Mandin, P., Py, B., & Barras, F. (2013). Iron/sulfur proteins
biogenesis in prokaryotes: formation, regulation and diversity. Biochimica et Biophysica Acta,
1827(3), 455–69.
98
Rolfe, M. D., Ter Beek, A., Graham, A. I., Trotter, E. W., Asif, H. M. S., Sanguinetti, G., … Green,
J. (2011). Transcript profiling and inference of Escherichia coli K-12 ArcA activity across the range
of physiologically relevant oxygen concentrations. The Journal of Biological Chemistry, 286(12),
10147–10154.
Scheinder, D., Pohl, T., Walter, J., Dorner, K., Kohlstadt, M., Berger, A., Spehr, S., Friedrich, T.,
(2008) Assembly of Eschericia coli NADH:ubiqionone oxidoreductase (complex I). Biochimica et
Biophysica Acta 1777 (2008) 735–739
Sekimizu, K., Bramhill, D., & Kornberg, A. (1987). ATP activates dnaA protein in initiating
replication of plasmids bearing the origin of the E. coli chromosome. Cell, 50(2), 259–65.
Smith, A. D., Frazzon, J., Dean, D. R., & Johnson, M. K. (2005). Role of conserved cysteines in
mediating sulfur transfer from IscS to IscU. FEBS Letters, 579(23), 5236–40.
Speck, C., & Messer, W. (2001). Mechanism of origin unwinding: sequential binding of DnaA to
double- and single-stranded DNA. The EMBO Journal, 20(6), 1469–76.
Su’etsugu, M., Takata, M., Kubota, T., Matsuda, Y., & Katayama, T. (2004). Molecular mechanism
of DNA replication-coupled inactivation of the initiator protein in Escherichia coli: interaction of
DnaA with the sliding clamp-loaded DNA and the sliding clamp-Hda complex. Genes to Cells :
Devoted to Molecular & Cellular Mechanisms, 9(6), 509–22.
Takahashi, Y., & Tokumoto, U. (2002). A third bacterial system for the assembly of iron-sulfur
clusters with homologs in archaea and plastids. The Journal of Biological Chemistry, 277(32),
28380–3.
Unden, G., & Bongaerts, J. (1997). Alternative respiratory pathways of Escherichia coli: energetics
and transcriptional regulation in response to electron acceptors. Biochimica et Biophysica Acta,
1320(3), 217–234.
99
Wallace, S. S. (2002). Biological consequences of free radical-damaged DNA bases. Free Radical
Biology & Medicine, 33(1), 1–14.
Wood, D., Darlison, M. G., Wilde, R. J., & Guest, J. R. (1984). Nucleotide sequence encoding the
flavoprotein and hydrophobic subunits of the succinate dehydrogenase of Escherichia coli. The
Biochemical Journal, 222(2), 519–34.
Yeo, W.-S., Lee, J.-H., Lee, K.-C., & Roe, J.-H. (2006). IscR acts as an activator in response to
oxidative stress for the suf operon encoding Fe-S assembly proteins. Molecular Microbiology,
61(1), 206–18.
Zheng, L., Cash, V. L., Flint, D. H., & Dean, D. R. (1998). Assembly of iron-sulfur clusters.
Identification of an iscSUA-hscBA-fdx gene cluster from Azotobacter vinelandii. The Journal of
Biological Chemistry, 273(21), 13264–72.

100
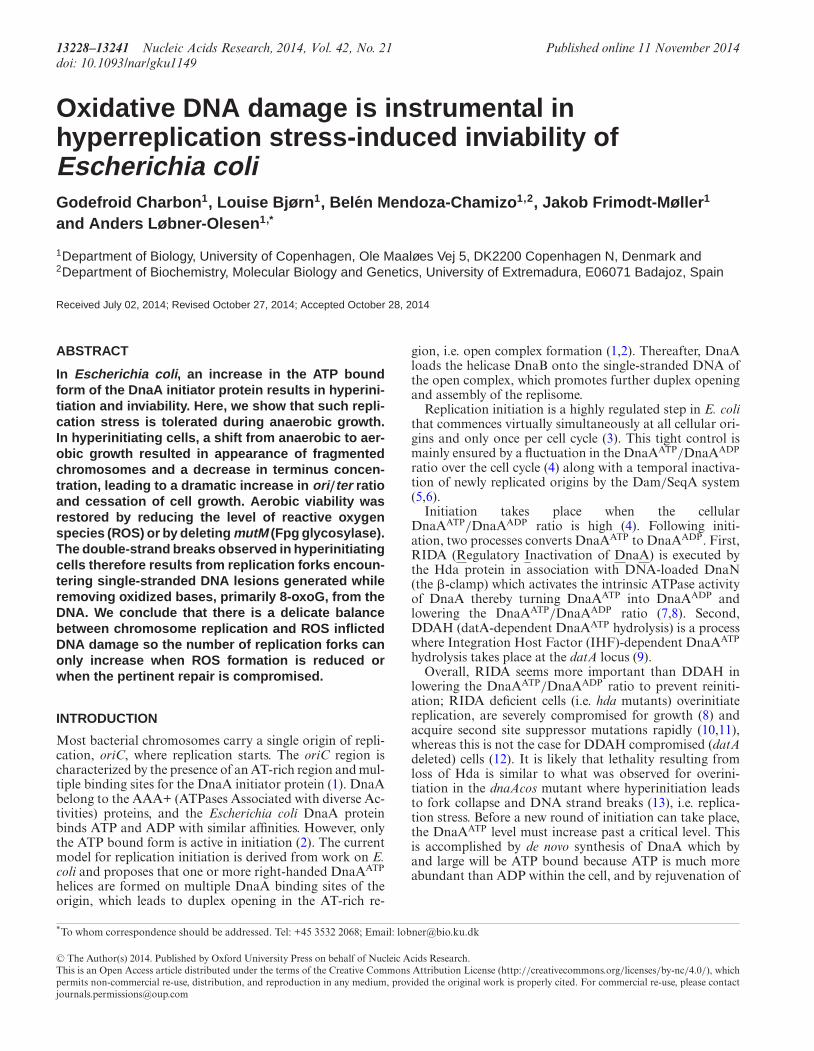
13228–13241 Nucleic Acids Research, 2014, Vol. 42, No. 21 Published online 11 November 2014doi: 10.1093/nar/gku1149
Oxidative DNA damage is instrumental inhyperreplication stress-induced inviability ofEscherichia coliGodefroid Charbon1, Louise Bjørn1, Belen Mendoza-Chamizo1,2, Jakob Frimodt-Møller1
and Anders Løbner-Olesen1,*
1Department of Biology, University of Copenhagen, Ole Maaløes Vej 5, DK2200 Copenhagen N, Denmark and2Department of Biochemistry, Molecular Biology and Genetics, University of Extremadura, E06071 Badajoz, Spain
Received July 02, 2014; Revised October 27, 2014; Accepted October 28, 2014
ABSTRACT
In Escherichia coli, an increase in the ATP boundform of the DnaA initiator protein results in hyperini-tiation and inviability. Here, we show that such repli-cation stress is tolerated during anaerobic growth.In hyperinitiating cells, a shift from anaerobic to aer-obic growth resulted in appearance of fragmentedchromosomes and a decrease in terminus concen-tration, leading to a dramatic increase in ori/ter ratioand cessation of cell growth. Aerobic viability wasrestored by reducing the level of reactive oxygenspecies (ROS) or by deleting mutM (Fpg glycosylase).The double-strand breaks observed in hyperinitiatingcells therefore results from replication forks encoun-tering single-stranded DNA lesions generated whileremoving oxidized bases, primarily 8-oxoG, from theDNA. We conclude that there is a delicate balancebetween chromosome replication and ROS inflictedDNA damage so the number of replication forks canonly increase when ROS formation is reduced orwhen the pertinent repair is compromised.
INTRODUCTION
Most bacterial chromosomes carry a single origin of repli-cation, oriC, where replication starts. The oriC region ischaracterized by the presence of an AT-rich region and mul-tiple binding sites for the DnaA initiator protein (1). DnaAbelong to the AAA+ (ATPases Associated with diverse Ac-tivities) proteins, and the Escherichia coli DnaA proteinbinds ATP and ADP with similar affinities. However, onlythe ATP bound form is active in initiation (2). The currentmodel for replication initiation is derived from work on E.coli and proposes that one or more right-handed DnaAATP
helices are formed on multiple DnaA binding sites of theorigin, which leads to duplex opening in the AT-rich re-
gion, i.e. open complex formation (1,2). Thereafter, DnaAloads the helicase DnaB onto the single-stranded DNA ofthe open complex, which promotes further duplex openingand assembly of the replisome.
Replication initiation is a highly regulated step in E. colithat commences virtually simultaneously at all cellular ori-gins and only once per cell cycle (3). This tight control ismainly ensured by a fluctuation in the DnaAATP/DnaAADP
ratio over the cell cycle (4) along with a temporal inactiva-tion of newly replicated origins by the Dam/SeqA system(5,6).
Initiation takes place when the cellularDnaAATP/DnaAADP ratio is high (4). Following initi-ation, two processes converts DnaAATP to DnaAADP. First,RIDA (Regulatory Inactivation of DnaA) is executed bythe Hda protein in association with DNA-loaded DnaN(the �-clamp) which activates the intrinsic ATPase activityof DnaA thereby turning DnaAATP into DnaAADP andlowering the DnaAATP/DnaAADP ratio (7,8). Second,DDAH (datA-dependent DnaAATP hydrolysis) is a processwhere Integration Host Factor (IHF)-dependent DnaAATP
hydrolysis takes place at the datA locus (9).Overall, RIDA seems more important than DDAH in
lowering the DnaAATP/DnaAADP ratio to prevent reiniti-ation; RIDA deficient cells (i.e. hda mutants) overinitiatereplication, are severely compromised for growth (8) andacquire second site suppressor mutations rapidly (10,11),whereas this is not the case for DDAH compromised (datAdeleted) cells (12). It is likely that lethality resulting fromloss of Hda is similar to what was observed for overini-tiation in the dnaAcos mutant where hyperinitiation leadsto fork collapse and DNA strand breaks (13), i.e. replica-tion stress. Before a new round of initiation can take place,the DnaAATP level must increase past a critical level. Thisis accomplished by de novo synthesis of DnaA which byand large will be ATP bound because ATP is much moreabundant than ADP within the cell, and by rejuvenation of
*To whom correspondence should be addressed. Tel: +45 3532 2068; Email: [email protected]
C© The Author(s) 2014. Published by Oxford University Press on behalf of Nucleic Acids Research.This is an Open Access article distributed under the terms of the Creative Commons Attribution License (http://creativecommons.org/licenses/by-nc/4.0/), whichpermits non-commercial re-use, distribution, and reproduction in any medium, provided the original work is properly cited. For commercial re-use, please [email protected]
Nucleic Acids Research, 2014, Vol. 42, No. 21 13229
DnaAADP into DnaAATP at DARS loci (14) and possibly atthe interface of the cellular membrane and cytosol (15).
When growing aerobically, E. coli cells use oxygen as theterminal electron acceptor. This allows for a more efficientenergy production in comparison to anaerobic respirationand fermentation. However, reactive oxygen species (ROS)are derived from the metabolism of molecular oxygen andthe major sources of endogenous ROS are hydrogen perox-ide (H2O2) and superoxide anion (O2
−), which are formedwhen flavoenzymes accidentally pass electrons to oxygen(16). ROS can react with DNA to generate a number ofbase modifications (17). Relative to other nucleobases, ox-idation of guanine to 8-oxo-7,8 dihydroguanine (8-oxoG(GO)) appears most readily because of its low redox poten-tial (18). When incorporated into DNA, 8-oxoG can basepair with adenine leading to G to T transversions. In E.coli three enzymes named MutT, MutM and MutY protectthe cell from the mutagenic action of 8-oxoG (19). MutTis a nucleotide sanitizer which hydrolyzes 8-oxo-dGTP to8-oxodeoxyguanosine monophosphate (dGMP) to preventincorporation into DNA (19). When present in the DNA,8-oxoG is primarily excised by the formamidopyrimidineDNA glycosylase (Fpg) which is the product of the mutMgene of the GO system (18), and Fpg is the primary enzymethat removes not only oxidized purines but also pyrimidinesin vivo (20), thereby reducing the accumulation of muta-tions. MutY is a glycosylase that removes adenines incor-porated opposite 8-oxoG, i.e. the product of replication past8-oxoG (19). This allows for insertion of a C opposite the le-sion which is subsequently subject to Fpg-dependent repair.Repair of 8-oxoG lesions may result in double-strand DNAbreaks if these are closely spaced, or if they are encounteredby a replication fork while being repaired.
In this work, we demonstrate that otherwise lethaloverinitiation is tolerated under anaerobic conditions andwe report that cells deficient in Hda can be maintainedthat way without selection for suppressor mutations. Wealso show that aerobic survival of Hda-deficient cells can bepromoted by neutralizing ROS or by deletion of mutM ofthe GO system. These data suggest that overinitiating cellslose their fitness when grown aerobically because of an in-creasing number of replication forks encountering a single-stranded repair intermediary generated during the removalof oxidized bases form the DNA. Such encounters will leadto double-strand breaks (DSB) which, when frequent, canresult in cell death.
MATERIALS AND METHODS
Growth conditions
Cells were grown in Luria–Bertani (LB) medium (or ABminimal medium (21)) supplemented with 0.2% glucose or0.4% glycerol, 0.5% casamino acids and 10 �g/ml thiamine.When indicated for anaerobic growth purposes, LB mediumwas supplemented with 0.2% glucose and buffered with A-salts. AB minimal medium used for anaerobic growth wassupplemented with 1% glucose and 1% casamino acids. Un-less specified, all cells were cultured at 37◦C. When nec-essary, antibiotic selection was maintained at the follow-ing concentrations: kanamycin 50 �g/ml; chloramphenicol,
20 �g/ml; ampicillin, 150 �g/ml; tetracycline, 10 �g/ml.Anaerobic growth condition was maintained using anaer-obic atmosphere generation bags (Sigma-Aldrich 68061) inan anaerobic jar for growth on plates. For liquid cultures,the growth medium was de-gazed under vacuum prior tocell inoculation, and placed with anaerobic atmosphere gen-erating bags in a container. The container was placed on anorbital shaker at 37◦C. Cells were inoculated and serially di-luted in order to obtain cultures at OD450 ∼0.1 about 24 hafter inoculation in anaerobic conditions. When indicated,glutathione (Sigma-Aldrich G4251) was supplemented at afinal concentration of 10 mM.
Bacterial strains and plasmids
All strains used for analysis are derivatives of MG1655.Strains are listed in Supplementary Table S1. Constructionof strains and plasmids is described in Supplementary Ma-terial.
Whole-genome sequencing
Whole-genome sequencing was performed at theSNP&SEQ Technology Platform of Uppsala Univer-sity on a HiSeq2000 (Illumina) platform. A total of 8.7million paired-end reads were generated, with an averageread length of 100 nucleotides.
Flow cytometry
Flow cytometry was performed as described previously (22)using an Apogee A40 instrument. For each sample, 40 000–200 000 cells were analysed. Numbers of origins per cell andrelative cell mass were determined as described previously(22).
Determination of ROS using hydroxyphenyl fluorescein(HPF) was by adding 5 �M HPF to the cell culture 1 h be-fore analysis by flow cytometry using an Apogee A40 in-strument with excitation wavelength set at 488 nm and flu-orescence collected between 515 and 545 nm. Samples wereanalysed either with or without washing once in growthmedium. Determination using dihydrorhodamine was doneaccording to (23).
Pulsed field gel electrophoresis
Sample preparation was performed essentially as describedin (24). Cells were pelleted washed twice in SE buffer(75 mM NaCl, 25 mM ethylenediaminetetraacetic acid(EDTA), pH 7.4) and resuspended in CSB buffer (100 mMTris, 100 mM EDTA, pH 7.5). Plugs were prepared by mix-ing an equal volume cells and low-melting agarose 2% (Bio-Rad 161–3100). Plugs were first incubated for 2 h at 37◦Cin a buffer containing lysozyme and RNAse (lysozyme 0.1mg/ml, RNAse 30 �g/ml, Sarcosyl 1%, EDTA 100 mMpH 9.0). The plugs were then incubated in a proteinase Kbuffer (proteinase K 1 mg/ml, Sarcosyl 1%, EDTA 500 mMpH 9.0) overnight at 56◦C. The plugs were finally washedthree times in CSB buffer and stored at 4◦C prior to load-ing. 1% agarose gels were run for 24 h at 6 V/cm in 0.5 ×TBE at 14◦C: initial switching time 60 s and final switch-ing time 120 s. The gels were stained using SybrGold for 1
13230 Nucleic Acids Research, 2014, Vol. 42, No. 21
h prior to imaging. Plugs containing the chromosomes ofthe yeast Saccharomyces cerevisiae were used as molecularweight standards (Bio-Rad 170-3605).
Microscopy
All samples for microscopy were kept on ice for 4–8 h withfrequent whirly mixing prior to visualization. This was donein order to ‘oxygenate’ the samples allowing for folding ofthe Green Fluorescent Protein (GFP) and mCherry chro-mophores in anaerobic grown cells. Cells were then de-posited on a 1% AB medium agarose pad. Microscope anal-yses were done using an AxioImager Z1 microscope (CarlZeiss MicroImaging, Inc). The microscope pictures wereprocessed and analysed with Volocity (PerkinElmer), Im-ageJ and Adobe Illustrator software.
Quantitative polymerase chain reaction (qPCR)
Samples were prepared by spinning down 1 ml of culture for5 min at 15 000 × g. Cells were re-suspended in 100 ul 10mM tris pH 7,4 and kept at −20◦C and diluted 50 times inDNA/RNA free water prior to analysis. The qPCR was per-formed as previously reported (10) using Takara SYBR Pre-mix Ex Taq II (RR820A) in a BioRAD CFX96 (95◦C 30 s,39 × (95◦C 5 s + 60◦C 30 s), 95◦C 15 s, 60◦C 60 s). All ori/terratios were normalized to the ori/ter ratio of MG1655 inlate phase corresponding to an ori/ter of one. Primers arelisted in Supplementary Material.
RESULTS
Hda-deficient cells are viable in the absence of oxygen
Cells deficient in Hda were previously shown to be eitherinviable or severely compromised for growth (8,10). There-fore, introduction of an hda deletion into wild-type (wt)cells results in a delayed appearance of small, heterogeneouscolonies (10) (Figure 1A). However, with time the accumu-lation of suppressor mutations (termed hsm; hda suppressormutation) arise resulting in colonies which remain homoge-neous upon re-streaking and which are often large. Severalhsm mutations have been identified, including hsm-2 whichis a mutation in dnaA resulting in replacement of phenylala-nine with valine at position 349 of the DnaA protein (11).As expected the introduction of an hda deletion into hsm-2cells immediately resulted in big colonies of homogeneoussize (10) (Figure 1A).
When an hda deletion was introduced into wild-type andhsm-2 cells by bacteriophage P1, and transductants incu-bated under anaerobic conditions the resultant colonieswere homogeneous and similar in size for both recipientssuggesting that the loss of Hda is not lethal under these con-ditions (Figure 1A). We determined the genome sequencefor one �hda transductant in otherwise wild-type cells, andfound no mutations or genomic rearrangement except forthe introduced �hda::cat mutation. We can therefore con-clude that hda mutant cells are viable and not severelygrowth compromised in absence of oxygen.
Hyperinitiation caused by the dnaAcos mutation or extraDARS2 copies is also tolerated in the absence of oxygen
It was reported that the Hda protein may have functionsother than in RIDA, which results in cold sensitivity (25).It is therefore possible that the inviability of hda mutantcells during aerobic growth is related to processes differentfrom DNA replication. We therefore determined the viabil-ity of other mutations/conditions resulting in a dramaticand lethal overinitiation of replication in the absence of oxy-gen. The dnaAcos mutant results in cold sensitivity due tohyperactivity of the DnaA protein at non-permissive tem-perature. As expected, the dnaAcos mutant grows at 42◦Cbut not at 30◦C under aerobic conditions (Figure 1B). Incontrast, the dnaAcos mutant was viable when incubatedanaerobically at 30◦C; the otherwise non-permissive tem-perature (Figure 1B).
The DARS2 sequence is instrumental in regenerationof DnaAATP from DnaAADP. When present on a multi-copy plasmid, DARS2 results in an elevated DnaAATP level,overinitiation from oriC and inviability (14). We clonedthe DARS2 sequence in the high copy number plasmidpBR322, using a host strain that initiate replication inde-pendent of dnaA and oriC (i.e. carrying the dnaA::cat, rnhA-373 mutations). When the resultant plasmid, pBR322-DARS2, was transformed into wild-type cells, colonies ob-tained under aerobic conditions were mostly small and het-erogeneous, whereas those obtained without oxygen wereuniform. Transformation of pBR322-DARS2 into hsm-2cells resulted in homogeneous colonies both in the presenceand absence of oxygen (not shown). When re-streaked, wild-type cells containing pBR322-DARS2 formed colonies un-der anaerobic but not aerobic conditions, whereas hsm-2cells containing the same plasmid formed colonies in thepresence and absence of oxygen (Figure 1C). Altogether,these data suggest that inviability resulting from replica-tion overinitiation can be alleviated in the absence of oxy-gen. The data also suggest that the DnaAF349V protein, re-sulting from the hsm-2 mutation affect the ability of DnaAto bind and/or hydrolyse ATP, in a manner similar to thenearby dnaAA345S mutation which also suppresses the lossof Hda (26).
Chromosome replication during anaerobic growth
Wild-type cells were grown exponentially in minimalmedium supplemented with glucose and casamino acids un-der aerobic and anaerobic conditions. The doubling timesof the cultures were 33 and 49 min, respectively (Table 1).Replication initiation took place in synchrony in aerobic aswell as anaerobic cells (Figure 2B). However, cells grown inthe absence of oxygen were slightly smaller than aerobicallygrown cells and contained fewer origins (Table 1; Figure 2B)as would be expected due to their slow growth. The ori-gin concentration (ori/mass) was the same for aerobic andanaerobic grown cells, indicating that the accumulation ofactive DnaA protein which ensures replication initiation ata specific cell mass per chromosomal origin is mostly un-affected by the absence of oxygen. Because the DnaA con-centration was found to be the same during anaerobic andaerobic growth (Supplementary Figure S1), it seems likely
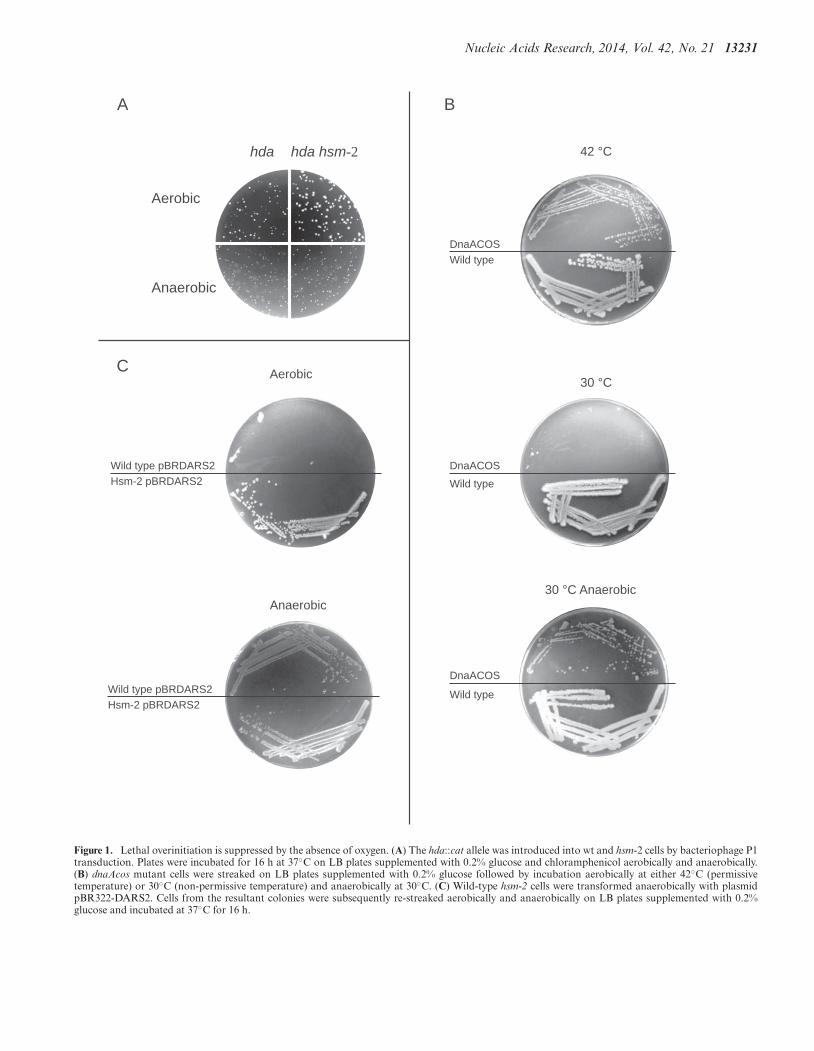
Nucleic Acids Research, 2014, Vol. 42, No. 21 13231
DnaACOS
DnaACOS
DnaACOSWild type
Wild type
Wild type
30 °C
30 °C Anaerobic
42 °C
Wild type pBRDARS2Hsm-2 pBRDARS2
Anaerobic
Aerobic
Wild type pBRDARS2Hsm-2 pBRDARS2
A B
hda hda hsm-2
Aerobic
Anaerobic
C
Figure 1. Lethal overinitiation is suppressed by the absence of oxygen. (A) The hda::cat allele was introduced into wt and hsm-2 cells by bacteriophage P1transduction. Plates were incubated for 16 h at 37◦C on LB plates supplemented with 0.2% glucose and chloramphenicol aerobically and anaerobically.(B) dnaAcos mutant cells were streaked on LB plates supplemented with 0.2% glucose followed by incubation aerobically at either 42◦C (permissivetemperature) or 30◦C (non-permissive temperature) and anaerobically at 30◦C. (C) Wild-type hsm-2 cells were transformed anaerobically with plasmidpBR322-DARS2. Cells from the resultant colonies were subsequently re-streaked aerobically and anaerobically on LB plates supplemented with 0.2%glucose and incubated at 37◦C for 16 h.
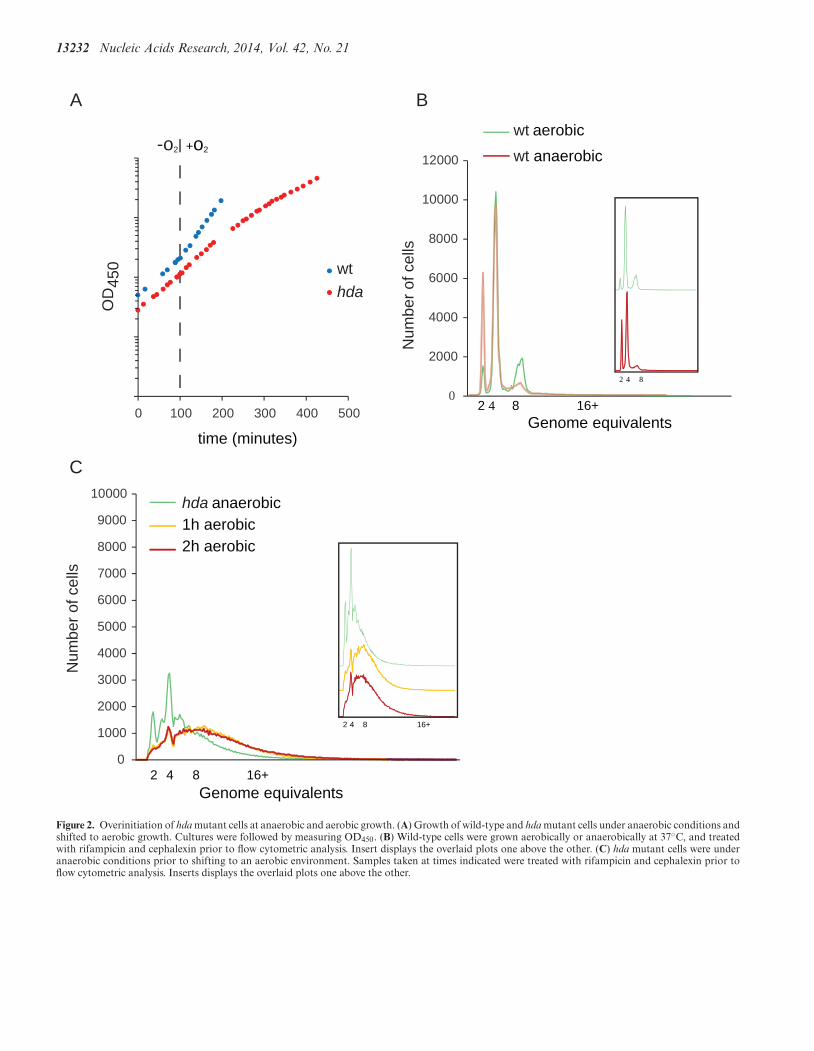
13232 Nucleic Acids Research, 2014, Vol. 42, No. 21
Genome equivalents82 16+4
0
1000
2000
3000
4000
5000
6000
7000
8000
9000
10000 hda anaerobic
2h aerobic1h aerobic
82 16+4
Num
ber o
f cel
ls
C
-o2 +o2
OD
450
time (minutes)
wt hda
A
0 100 200 300 400 500N
umbe
r of c
ells
82Genome equivalents
16+4 0
2000
4000
6000
8000
10000
12000
wt aerobicwt anaerobic
B
82 4
Figure 2. Overinitiation of hda mutant cells at anaerobic and aerobic growth. (A) Growth of wild-type and hda mutant cells under anaerobic conditions andshifted to aerobic growth. Cultures were followed by measuring OD450. (B) Wild-type cells were grown aerobically or anaerobically at 37◦C, and treatedwith rifampicin and cephalexin prior to flow cytometric analysis. Insert displays the overlaid plots one above the other. (C) hda mutant cells were underanaerobic conditions prior to shifting to an aerobic environment. Samples taken at times indicated were treated with rifampicin and cephalexin prior toflow cytometric analysis. Inserts displays the overlaid plots one above the other.
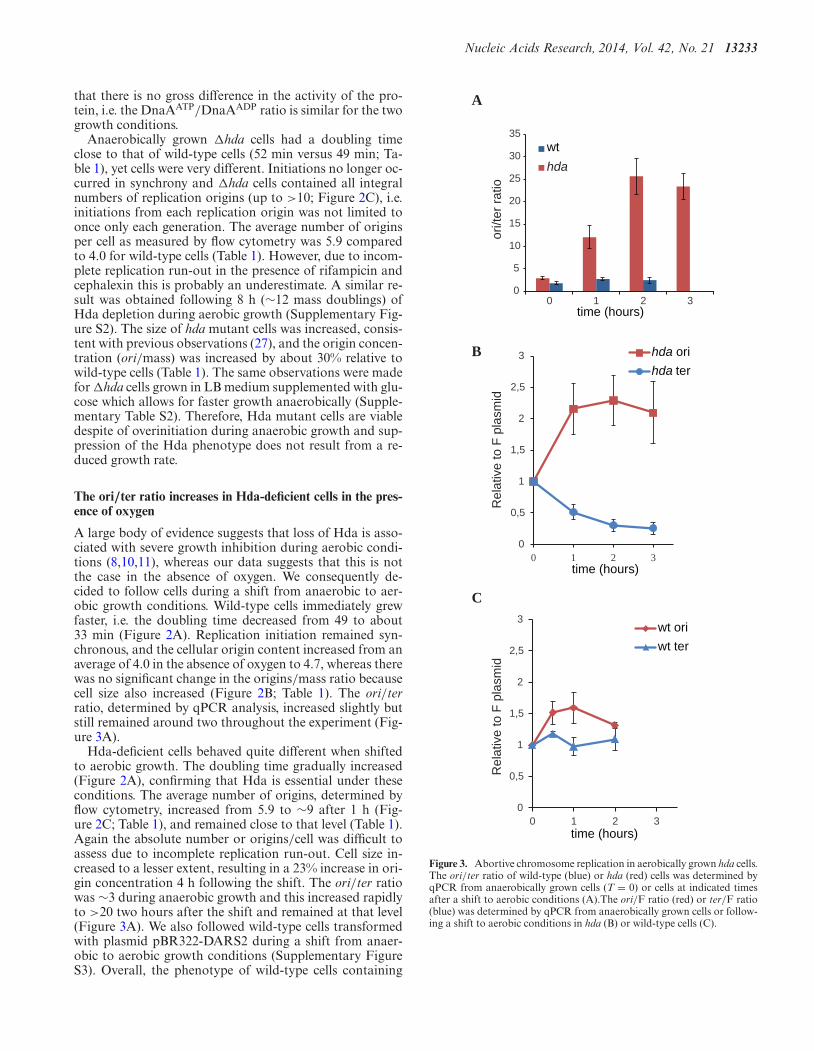
Nucleic Acids Research, 2014, Vol. 42, No. 21 13233
that there is no gross difference in the activity of the pro-tein, i.e. the DnaAATP/DnaAADP ratio is similar for the twogrowth conditions.
Anaerobically grown �hda cells had a doubling timeclose to that of wild-type cells (52 min versus 49 min; Ta-ble 1), yet cells were very different. Initiations no longer oc-curred in synchrony and �hda cells contained all integralnumbers of replication origins (up to >10; Figure 2C), i.e.initiations from each replication origin was not limited toonce only each generation. The average number of originsper cell as measured by flow cytometry was 5.9 comparedto 4.0 for wild-type cells (Table 1). However, due to incom-plete replication run-out in the presence of rifampicin andcephalexin this is probably an underestimate. A similar re-sult was obtained following 8 h (∼12 mass doublings) ofHda depletion during aerobic growth (Supplementary Fig-ure S2). The size of hda mutant cells was increased, consis-tent with previous observations (27), and the origin concen-tration (ori/mass) was increased by about 30% relative towild-type cells (Table 1). The same observations were madefor �hda cells grown in LB medium supplemented with glu-cose which allows for faster growth anaerobically (Supple-mentary Table S2). Therefore, Hda mutant cells are viabledespite of overinitiation during anaerobic growth and sup-pression of the Hda phenotype does not result from a re-duced growth rate.
The ori/ter ratio increases in Hda-deficient cells in the pres-ence of oxygen
A large body of evidence suggests that loss of Hda is asso-ciated with severe growth inhibition during aerobic condi-tions (8,10,11), whereas our data suggests that this is notthe case in the absence of oxygen. We consequently de-cided to follow cells during a shift from anaerobic to aer-obic growth conditions. Wild-type cells immediately grewfaster, i.e. the doubling time decreased from 49 to about33 min (Figure 2A). Replication initiation remained syn-chronous, and the cellular origin content increased from anaverage of 4.0 in the absence of oxygen to 4.7, whereas therewas no significant change in the origins/mass ratio becausecell size also increased (Figure 2B; Table 1). The ori/terratio, determined by qPCR analysis, increased slightly butstill remained around two throughout the experiment (Fig-ure 3A).
Hda-deficient cells behaved quite different when shiftedto aerobic growth. The doubling time gradually increased(Figure 2A), confirming that Hda is essential under theseconditions. The average number of origins, determined byflow cytometry, increased from 5.9 to ∼9 after 1 h (Fig-ure 2C; Table 1), and remained close to that level (Table 1).Again the absolute number or origins/cell was difficult toassess due to incomplete replication run-out. Cell size in-creased to a lesser extent, resulting in a 23% increase in ori-gin concentration 4 h following the shift. The ori/ter ratiowas ∼3 during anaerobic growth and this increased rapidlyto >20 two hours after the shift and remained at that level(Figure 3A). We also followed wild-type cells transformedwith plasmid pBR322-DARS2 during a shift from anaer-obic to aerobic growth conditions (Supplementary FigureS3). Overall, the phenotype of wild-type cells containing
A
B hda orihda ter
wt oriwt ter
time (hours)
time (hours)
0
0,5
1
1,5
2
2,5
3
0 1 2 3
Rel
ativ
e to
F p
lasm
id
0
0,5
1
1,5
2
2,5
3
0 1 2 3
Rel
ativ
e to
F p
lasm
id
time (hours)
hda
wt
0
5
10
15
20
25
30
35
0 1 2 3
ori/t
er ra
tio
C
Figure 3. Abortive chromosome replication in aerobically grown hda cells.The ori/ter ratio of wild-type (blue) or hda (red) cells was determined byqPCR from anaerobically grown cells (T = 0) or cells at indicated timesafter a shift to aerobic conditions (A).The ori/F ratio (red) or ter/F ratio(blue) was determined by qPCR from anaerobically grown cells or follow-ing a shift to aerobic conditions in hda (B) or wild-type cells (C).
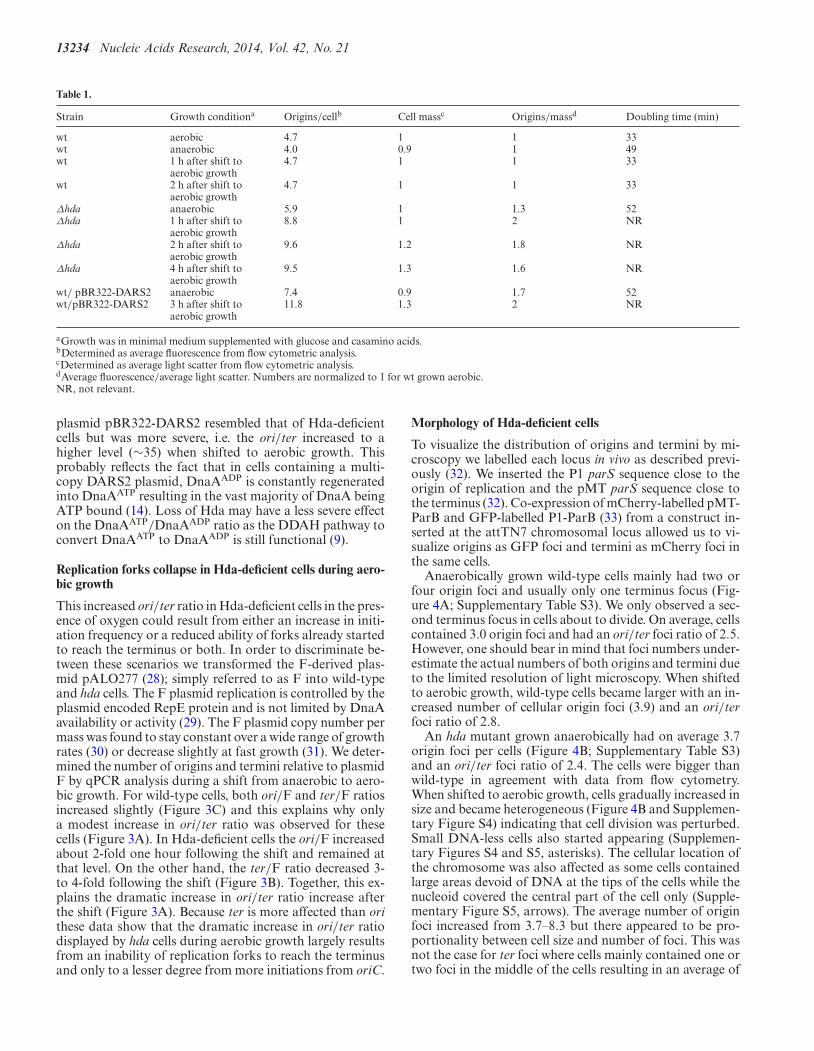
13234 Nucleic Acids Research, 2014, Vol. 42, No. 21
Table 1.
Strain Growth conditiona Origins/cellb Cell massc Origins/massd Doubling time (min)
wt aerobic 4.7 1 1 33wt anaerobic 4.0 0.9 1 49wt 1 h after shift to
aerobic growth4.7 1 1 33
wt 2 h after shift toaerobic growth
4.7 1 1 33
Δhda anaerobic 5.9 1 1.3 52Δhda 1 h after shift to
aerobic growth8.8 1 2 NR
Δhda 2 h after shift toaerobic growth
9.6 1.2 1.8 NR
Δhda 4 h after shift toaerobic growth
9.5 1.3 1.6 NR
wt/ pBR322-DARS2 anaerobic 7.4 0.9 1.7 52wt/pBR322-DARS2 3 h after shift to
aerobic growth11.8 1.3 2 NR
aGrowth was in minimal medium supplemented with glucose and casamino acids.bDetermined as average fluorescence from flow cytometric analysis.cDetermined as average light scatter from flow cytometric analysis.dAverage fluorescence/average light scatter. Numbers are normalized to 1 for wt grown aerobic.NR, not relevant.
plasmid pBR322-DARS2 resembled that of Hda-deficientcells but was more severe, i.e. the ori/ter increased to ahigher level (∼35) when shifted to aerobic growth. Thisprobably reflects the fact that in cells containing a multi-copy DARS2 plasmid, DnaAADP is constantly regeneratedinto DnaAATP resulting in the vast majority of DnaA beingATP bound (14). Loss of Hda may have a less severe effecton the DnaAATP/DnaAADP ratio as the DDAH pathway toconvert DnaAATP to DnaAADP is still functional (9).
Replication forks collapse in Hda-deficient cells during aero-bic growth
This increased ori/ter ratio in Hda-deficient cells in the pres-ence of oxygen could result from either an increase in initi-ation frequency or a reduced ability of forks already startedto reach the terminus or both. In order to discriminate be-tween these scenarios we transformed the F-derived plas-mid pALO277 (28); simply referred to as F into wild-typeand hda cells. The F plasmid replication is controlled by theplasmid encoded RepE protein and is not limited by DnaAavailability or activity (29). The F plasmid copy number permass was found to stay constant over a wide range of growthrates (30) or decrease slightly at fast growth (31). We deter-mined the number of origins and termini relative to plasmidF by qPCR analysis during a shift from anaerobic to aero-bic growth. For wild-type cells, both ori/F and ter/F ratiosincreased slightly (Figure 3C) and this explains why onlya modest increase in ori/ter ratio was observed for thesecells (Figure 3A). In Hda-deficient cells the ori/F increasedabout 2-fold one hour following the shift and remained atthat level. On the other hand, the ter/F ratio decreased 3-to 4-fold following the shift (Figure 3B). Together, this ex-plains the dramatic increase in ori/ter ratio increase afterthe shift (Figure 3A). Because ter is more affected than orithese data show that the dramatic increase in ori/ter ratiodisplayed by hda cells during aerobic growth largely resultsfrom an inability of replication forks to reach the terminusand only to a lesser degree from more initiations from oriC.
Morphology of Hda-deficient cells
To visualize the distribution of origins and termini by mi-croscopy we labelled each locus in vivo as described previ-ously (32). We inserted the P1 parS sequence close to theorigin of replication and the pMT parS sequence close tothe terminus (32). Co-expression of mCherry-labelled pMT-ParB and GFP-labelled P1-ParB (33) from a construct in-serted at the attTN7 chromosomal locus allowed us to vi-sualize origins as GFP foci and termini as mCherry foci inthe same cells.
Anaerobically grown wild-type cells mainly had two orfour origin foci and usually only one terminus focus (Fig-ure 4A; Supplementary Table S3). We only observed a sec-ond terminus focus in cells about to divide. On average, cellscontained 3.0 origin foci and had an ori/ter foci ratio of 2.5.However, one should bear in mind that foci numbers under-estimate the actual numbers of both origins and termini dueto the limited resolution of light microscopy. When shiftedto aerobic growth, wild-type cells became larger with an in-creased number of cellular origin foci (3.9) and an ori/terfoci ratio of 2.8.
An hda mutant grown anaerobically had on average 3.7origin foci per cells (Figure 4B; Supplementary Table S3)and an ori/ter foci ratio of 2.4. The cells were bigger thanwild-type in agreement with data from flow cytometry.When shifted to aerobic growth, cells gradually increased insize and became heterogeneous (Figure 4B and Supplemen-tary Figure S4) indicating that cell division was perturbed.Small DNA-less cells also started appearing (Supplemen-tary Figures S4 and S5, asterisks). The cellular location ofthe chromosome was also affected as some cells containedlarge areas devoid of DNA at the tips of the cells while thenucleoid covered the central part of the cell only (Supple-mentary Figure S5, arrows). The average number of originfoci increased from 3.7–8.3 but there appeared to be pro-portionality between cell size and number of foci. This wasnot the case for ter foci where cells mainly contained one ortwo foci in the middle of the cells resulting in an average of
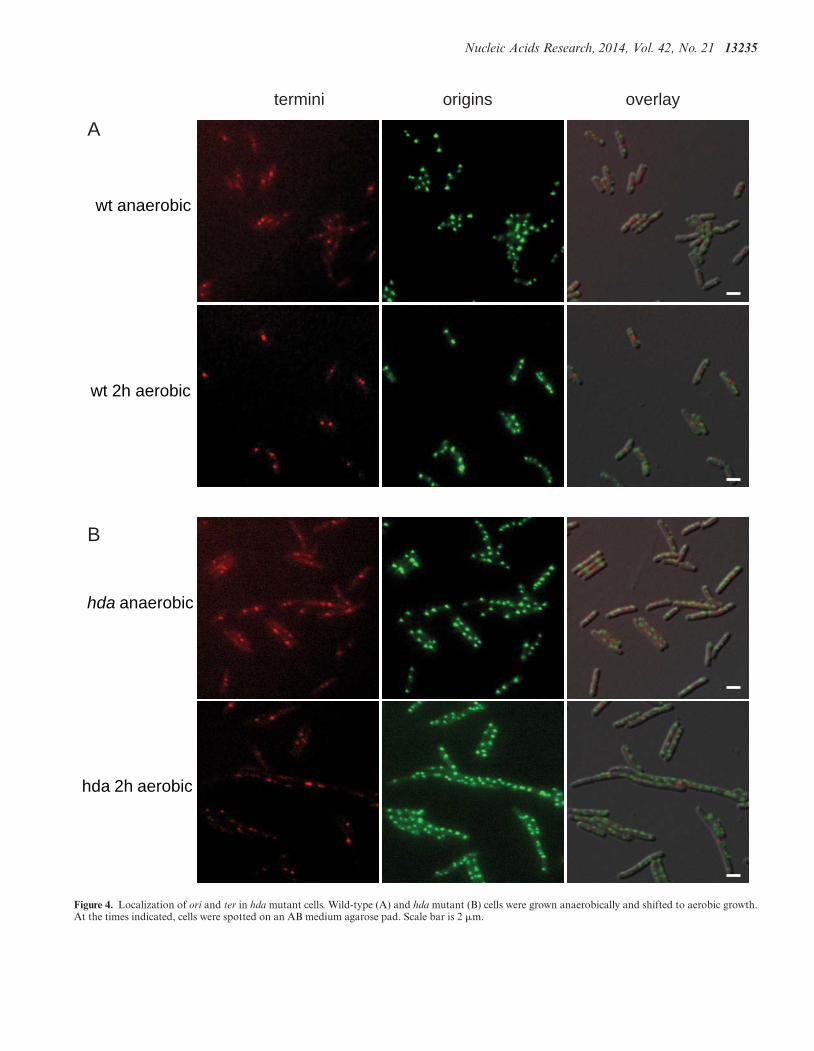
Nucleic Acids Research, 2014, Vol. 42, No. 21 13235
hda anaerobic
hda 2h aerobic
wt anaerobic
wt 2h aerobic
termini origins overlay
A
B
Figure 4. Localization of ori and ter in hda mutant cells. Wild-type (A) and hda mutant (B) cells were grown anaerobically and shifted to aerobic growth.At the times indicated, cells were spotted on an AB medium agarose pad. Scale bar is 2 �m.
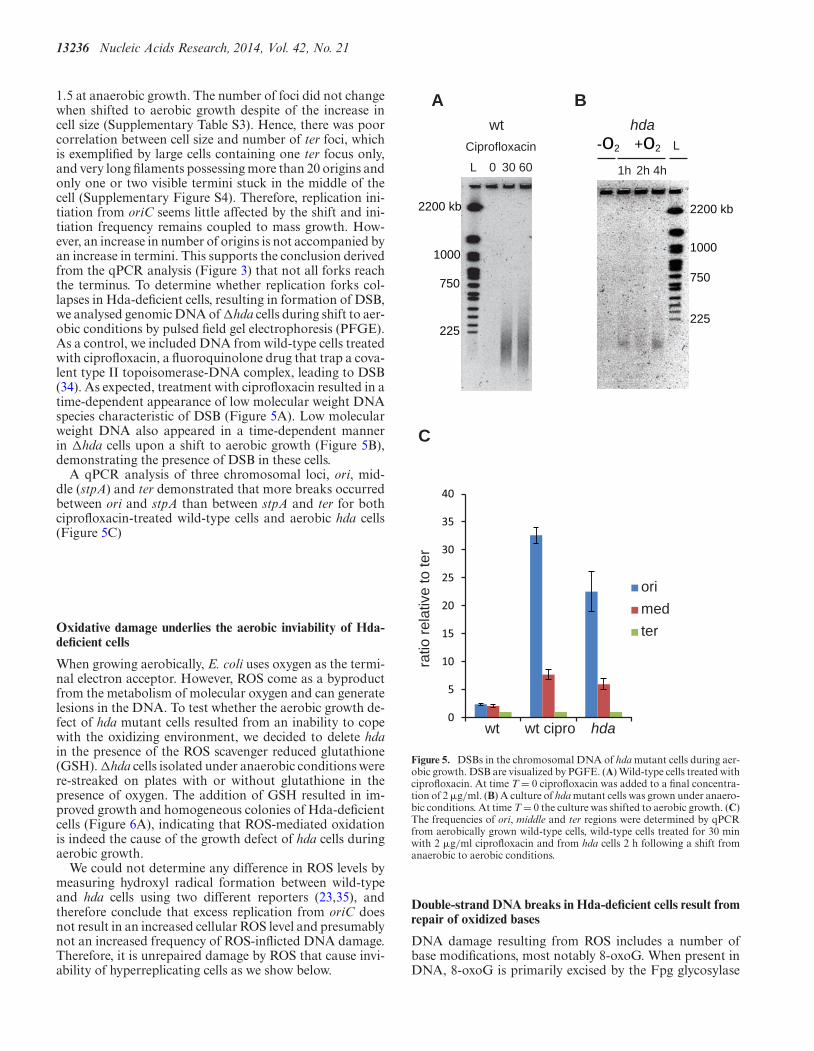
13236 Nucleic Acids Research, 2014, Vol. 42, No. 21
1.5 at anaerobic growth. The number of foci did not changewhen shifted to aerobic growth despite of the increase incell size (Supplementary Table S3). Hence, there was poorcorrelation between cell size and number of ter foci, whichis exemplified by large cells containing one ter focus only,and very long filaments possessing more than 20 origins andonly one or two visible termini stuck in the middle of thecell (Supplementary Figure S4). Therefore, replication ini-tiation from oriC seems little affected by the shift and ini-tiation frequency remains coupled to mass growth. How-ever, an increase in number of origins is not accompanied byan increase in termini. This supports the conclusion derivedfrom the qPCR analysis (Figure 3) that not all forks reachthe terminus. To determine whether replication forks col-lapses in Hda-deficient cells, resulting in formation of DSB,we analysed genomic DNA of �hda cells during shift to aer-obic conditions by pulsed field gel electrophoresis (PFGE).As a control, we included DNA from wild-type cells treatedwith ciprofloxacin, a fluoroquinolone drug that trap a cova-lent type II topoisomerase-DNA complex, leading to DSB(34). As expected, treatment with ciprofloxacin resulted in atime-dependent appearance of low molecular weight DNAspecies characteristic of DSB (Figure 5A). Low molecularweight DNA also appeared in a time-dependent mannerin �hda cells upon a shift to aerobic growth (Figure 5B),demonstrating the presence of DSB in these cells.
A qPCR analysis of three chromosomal loci, ori, mid-dle (stpA) and ter demonstrated that more breaks occurredbetween ori and stpA than between stpA and ter for bothciprofloxacin-treated wild-type cells and aerobic hda cells(Figure 5C)
Oxidative damage underlies the aerobic inviability of Hda-deficient cells
When growing aerobically, E. coli uses oxygen as the termi-nal electron acceptor. However, ROS come as a byproductfrom the metabolism of molecular oxygen and can generatelesions in the DNA. To test whether the aerobic growth de-fect of hda mutant cells resulted from an inability to copewith the oxidizing environment, we decided to delete hdain the presence of the ROS scavenger reduced glutathione(GSH). �hda cells isolated under anaerobic conditions werere-streaked on plates with or without glutathione in thepresence of oxygen. The addition of GSH resulted in im-proved growth and homogeneous colonies of Hda-deficientcells (Figure 6A), indicating that ROS-mediated oxidationis indeed the cause of the growth defect of hda cells duringaerobic growth.
We could not determine any difference in ROS levels bymeasuring hydroxyl radical formation between wild-typeand hda cells using two different reporters (23,35), andtherefore conclude that excess replication from oriC doesnot result in an increased cellular ROS level and presumablynot an increased frequency of ROS-inflicted DNA damage.Therefore, it is unrepaired damage by ROS that cause invi-ability of hyperreplicating cells as we show below.
1h 2h 4h
2200 kb
1000
750
225
-o2
hda+o2Ciprofloxacin
0 30 60
BA
2200 kb
1000
750
225
L
L
wt
C
wt wt cipro hda
orimedter
ratio
rela
tive
to te
r
0
5
10
15
20
25
30
35
40
Figure 5. DSBs in the chromosomal DNA of hda mutant cells during aer-obic growth. DSB are visualized by PGFE. (A) Wild-type cells treated withciprofloxacin. At time T = 0 ciprofloxacin was added to a final concentra-tion of 2 �g/ml. (B) A culture of hda mutant cells was grown under anaero-bic conditions. At time T = 0 the culture was shifted to aerobic growth. (C)The frequencies of ori, middle and ter regions were determined by qPCRfrom aerobically grown wild-type cells, wild-type cells treated for 30 minwith 2 �g/ml ciprofloxacin and from hda cells 2 h following a shift fromanaerobic to aerobic conditions.
Double-strand DNA breaks in Hda-deficient cells result fromrepair of oxidized bases
DNA damage resulting from ROS includes a number ofbase modifications, most notably 8-oxoG. When present inDNA, 8-oxoG is primarily excised by the Fpg glycosylase
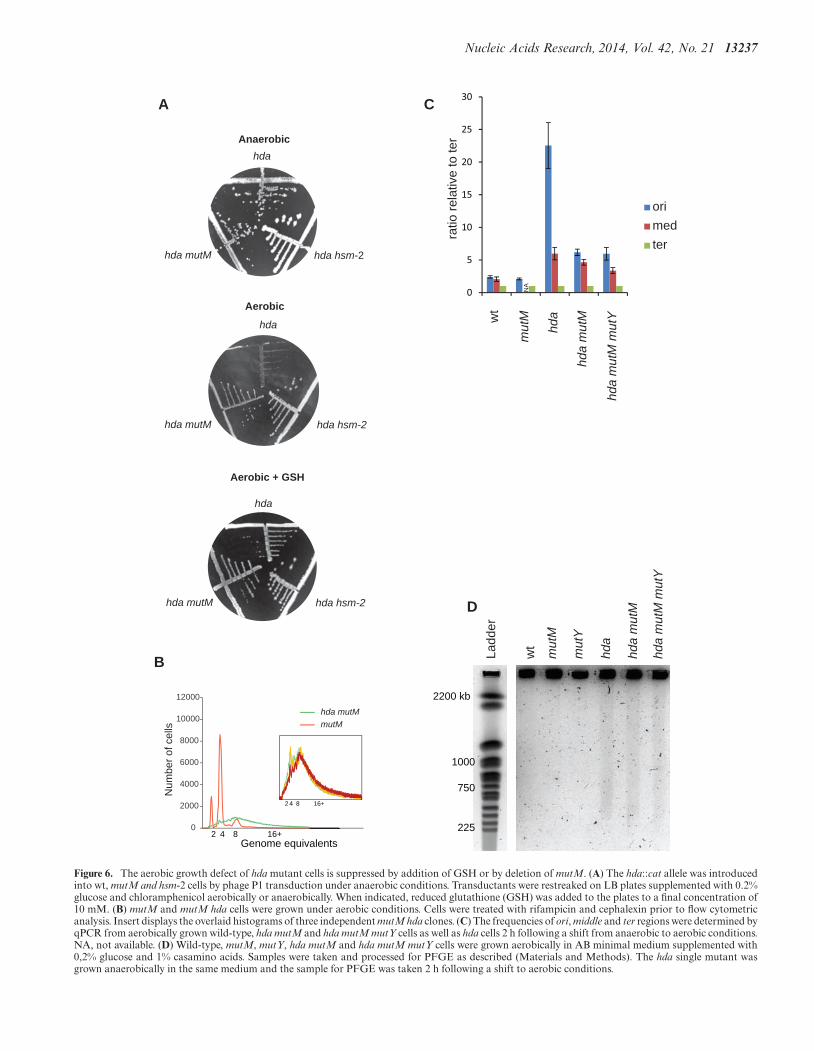
Nucleic Acids Research, 2014, Vol. 42, No. 21 13237
Anaerobic
Aerobic
Aerobic + GSH
hda
hda hsm-2hda mutM
hda
hda hsm-2hda mutM
hda
hda hsm-2hda mutM
Genome equivalents0
2000
4000
6000
8000
10000
12000
8 2
Num
ber o
f cel
ls
16+4
hda mutMmutM
8 2 16+4
A
B
D
C
wt
hda
mut
M
hda
mut
M
hda
mut
M m
utY
0
5
10
15
20
25
30
orimedter
NA
wt
hda
mut
M
hda
mut
M
hda
mut
M m
utY
mut
Y
Ladd
er
2200 kb
1000
750
225
ratio
rela
tive
to te
r
Figure 6. The aerobic growth defect of hda mutant cells is suppressed by addition of GSH or by deletion of mutM. (A) The hda::cat allele was introducedinto wt, mutM and hsm-2 cells by phage P1 transduction under anaerobic conditions. Transductants were restreaked on LB plates supplemented with 0.2%glucose and chloramphenicol aerobically or anaerobically. When indicated, reduced glutathione (GSH) was added to the plates to a final concentration of10 mM. (B) mutM and mutM hda cells were grown under aerobic conditions. Cells were treated with rifampicin and cephalexin prior to flow cytometricanalysis. Insert displays the overlaid histograms of three independent mutM hda clones. (C) The frequencies of ori, middle and ter regions were determined byqPCR from aerobically grown wild-type, hda mutM and hda mutM mutY cells as well as hda cells 2 h following a shift from anaerobic to aerobic conditions.NA, not available. (D) Wild-type, mutM, mutY, hda mutM and hda mutM mutY cells were grown aerobically in AB minimal medium supplemented with0,2% glucose and 1% casamino acids. Samples were taken and processed for PFGE as described (Materials and Methods). The hda single mutant wasgrown anaerobically in the same medium and the sample for PFGE was taken 2 h following a shift to aerobic conditions.
13238 Nucleic Acids Research, 2014, Vol. 42, No. 21
(mutM gene product) of the GO system (19). Cells defi-cient in both Hda and Fpg formed small but homogeneouscolonies under aerobic conditions demonstrating that lossof Fpg suppressed the growth defect of Δhda cells (Fig-ure 6A). We subjected several �hda �mutM clones to aflow cytometric analysis. These cells grew slower than wild-type (52 min versus 33 min). They all had similar profilesafter treatment with rifampicin and cephalexin with an in-creased number of cellular origins and poor run-out profilecompared to wild-type cell (Figure 6B; Supplementary Ta-ble S4), resembling the profile obtained for Hda-deficientcells grown aerobically (Figure 2). Loss of MutM is there-fore not likely to suppress Hda deficiency by reducing initia-tions from oriC and in agreement with this we found mutMcells to have a similar origin concentration (origins/mass)as wild-type cells (Supplementary Table S4).
A qPCR analysis of the ori, middle (stpA) and ter lociindicated that the ori/ter ratio of �hda �mutM was signif-icantly lowered (∼6) compared to that of aerobically grow-ing �hda cells (>20; Figure 6C). Therefore, loss of Fpg mustallow more replication forks to proceed to the terminus. Afurther deletion of mutY (�hda �mutM �mutY) did notlower the ori/ter ratio further (Figure 6C), demonstratingthat the residual DSBs in �hda �mutM cells are not causedby the action of MutY. A knockout of mutY of the GO sys-tem was not found to suppress �hda cells (SupplementaryFigure S6). This is in agreement with the MutY glycosylaseplaying a secondary role to Fpg in the repair of 8-oxoG le-sions (18).
Some DSB persist in the absence of MutM in Hda-deficientcells
Genomic DNA from wild-type, hda, �mutM, �mutY and�hda �mutM and �hda �mutM �mutY cells was sub-jected to pulse field gel electrophoresis. This revealed thepresence of DNA breaks in Δhda, �hda �mutM and �hda�mutM �mutY mutant cells (Figure 6D). Although hardto quantify, the amount of DSB in �hda single mutant cellsseemed somewhat higher than for double or triple mutantcells (Figure 6D). This is in agreement with the observa-tions that deletion of mutM or mutM and mutY only partlyrestores the ori/ter ratio of Hda-deficient cells in compar-ison to anaerobic grown cells (Figure 6C). The persistenceof DSB in �hda �mutM cells is also consistent with theflow cytometry analysis (Figure 6B), and is expected be-cause ROS-dependent DNA damage is not limited to le-sions repaired by Fpg (17). However, loss of Fpg may reducethe amount of DSB to a level which allows survival despiteof overinitiation from oriC.
DISCUSSION
In E. coli severe overinitiation is observed when the activityof the DnaA protein is increased. This results in replicationstress and cell death. Such an increase in DnaA activity canresult from mutations in dnaA itself (13,36), from mutationsin Hda which is instrumental for RIDA-dependent conver-sion of DnaAATP to DnaAADP (8) or from increasing thedosage of the DARS sequences that promote rejuvenationof DnaAADP to DnaAATP (14). Inviability caused by hyper-initiation is known to be associated with a reduced rate of
replication and DSB (13,22,37). It has been proposed thatstalled forks are being caught by other forks ‘coming frombehind’ and the collision results in DSB (13).
Here, we present the first mechanistic evidence as to howhyperinitiation results in formation of DSB. Our results in-dicate that DNA breaks are caused by replication forks en-countering lesions generated by enzymes removing oxidizedbases from the DNA duplex. These lesions are normally re-paired in timely fashion but when the interval between repli-cation forks is diminished, the probability of a fork meetinga lesion is increased.
Hyperinitiation is tolerated during anaerobic growth
Loss of the Hda protein results in inviability or severegrowth inhibition (8,10,11), and consequently suppressormutations arise with high frequency. In vivo studies of repli-cation initiation in the absence of Hda have therefore previ-ously been carried out using a temperature-sensitive alleleof hda (27) or in cells that contain additional compensatorymutations (10,11). In other cases it is not clear whether sup-pressor mutations were present or not (38). Deletion of hdawas tolerated in the absence of oxygen as whole-genomesequencing revealed that suppressor mutations were notpresent. Similarly, the dnaAcos mutation or increased copiesof DARS2 was tolerated during anaerobic growth.
We found no evidences for timing of initiation being dif-ferent in the presence or absence of oxygen in wild-typecells. The levels of DnaA was similar, suggesting that theoverall level of ATP bound DnaA may also be quite simi-lar between these growth conditions. This agrees well withobservations that neither the cellular ATP level nor theATP/ADP ratio is decreased during anaerobic relative toaerobic growth (39,40) but poorly with an older study show-ing a reduced ATP level and ATP/ADP ratio under anaero-bic growth (41). Anaerobic condition is therefore not likelyto restore viability of hyperinitiating cells by lowering thefrequency at which DNA replication starts to a tolerablelevel.
Chromosome breakage during aerobic growth
Inviability associated with replication stress was only ob-served during aerobic growth, and coincided with a dra-matic increase in ori/ter ratio. The increase primarily re-sulted from a decrease in terminus concentration, whereasoriC was less affected. Therefore, replication forks started atoriC frequently collapse before reaching the terminus andthis explains the appearance of double-strand DNA breaksin these cells. We propose that these DNA breaks are thereason for inviability associated with hyperinitiation.
Aerobic growth of hda mutants could be restored by addi-tion of the ROS scavenger GSH, indicating that a significantfraction of the strand breaks observed resulted from repli-cation forks encountering oxidative lesions in the DNA. Adeletion of mutM also suppressed loss of Hda under aerobicconditions indicating that the action of the Fpg glycosylaseis instrumental in DSB formation.
ROS is formed as a result of aerobic respiration, and ox-idative damage to DNA is quite frequent and the steady-state frequency of 8-oxoG was estimated to be 2.5 lesions
Nucleic Acids Research, 2014, Vol. 42, No. 21 13239
per 105 dG residues during exponential growth (42) corre-sponding to one lesion per 160 kb of genomic DNA; about100-fold higher than observed for eukaryotic cells (43). Aseparate study reports a somewhat lower density of lesions,in this case less than 1 per 170 kb of DNA (44). Given that 8-oxoG lesions are efficiently repaired by the GO system (19),these steady-state levels suggest that the lesions form fre-quently in the bacterial DNA. The Fpg glycosylase (MutM)excises a number of oxidized bases from DNA but its pri-mary activity is against 8-oxoG, the most common lesionderived from ROS. The Fpg enzyme possesses both a DNAglycosylase activity, that excises oxidized base lesions, andan intrinsic lyase activity, cleaving the DNA (�� elimina-tion) at the AP site to produce both 5′ and 3′ ends con-taining phosphomonoesther nucleotides (45). As this strandbreak cannot be immediately processed by PolI it may per-sist for some time. If encountered by a replication fork whileundergoing repair, the result will be a DSB. In E. coli a sin-gle DSB is pontentally lethal (46).
Because we did not observe any increase in ROS levelsbetween wild-type and hda mutant cells we consider thefrequency of oxidative lesions the same. We suggest thatan increased initiation frequency results in more ongoingreplication forks, which raises the likelyhood of forks en-countering Fpg repair intermediaries leading to DSB for-mation. The generation of DSB by replication forks encoun-tering base-excision nicks have been described previously(47). All replication forks originate at oriC, and will col-lapse at the first lesion encountered irrespective of this be-ing generated by repair of 8-oxoG, ultraviolet irradiation ora genotoxic agent, such as ciprofloxacin. If multiple lesionsof either type are present and evenly distributed along thechromosome, the net result will be that replication forks pre-dominantly collapse in oriC proximal regions, such as ob-served here and previously (13,37,47,48). Although we as-sume an unchanged level of oxidative damage between wild-type and Hda-deficient cells, we cannot rule out that hyper-initiation indirectly (altered gene regulation, suppression ofrepair processes or altered energy metabolism), may resultin an increased frequency of oxidative damage in generalor primarily in newly replicated DNA, i.e. near oriC, andthat this contributes to an increased ori/ter ratio and in-viability. The generation of DSBs by overinitiation also ex-plains why cells that only overinitiate replication slightly be-come dependent on homologous recombination for survival(49). Certain hda mutants are viable despite the presenceof a functional RIDA system. It was suggested that Hdaalso plays a role in stabilizing PolIII at the replication forkand controlling access of the trans-lesion polymerases PolIIand Pol IV to the �-clamp (25). It is tempting to speculatethat these Hda mutant proteins may assist trans-lesion poly-merases in replicating across oxidative lesions in the DNA.In the absence of Fpg, the MutY glycosylase will excise theA that is normally incorporated opposite of 8-oxoG. MutYis a monofunctional glycosylase (50) whose action resultsin an AP site that is processed directly by AP endonucle-ases Nfo and XthA encoding Exonuclease III and endonu-clease IV, respectively (51), and finally Polymerase I (PolI)and DNA ligase. We speculate that in the MutY repair pro-cess the nicked DNA strand persists shorter than one pro-
moted by Fpg and that this could explain why loss of MutYdid not suppress Hda deficiency during aerobic growth. Wealso observed DSB in cells deficient in both Hda and Fpg,albeit at a lower level. There could be several reasons forthis. First, oxidative damage results in a large number oflesions to the DNA and only a subset of these are subjectto Fpg repair. Repair of other oxidized bases may thereforecontribute to the DSB observed. It has also been reportedthat the bifunctional DNA glycosylases nth (endonucleaseIII), nei (endonuclease VIII) or KsgA may process some ofthe 8-oxoG lesions in the absence of Fpg (52,53) and DSBcould be generated in the repair process. Finally, a replica-tion fork encountering an 8-oxoG may stall or pause for awhile, which could result in collision from behind by an-other replication fork (13).
Interestingly, repair of 8-oxoG lesions by the GO sys-tem has also been implicated in sensitizing bacteria tofluoroquinolone-induced replication stress. Strains deficientin both MutM and MutY survive norfloxacin exposure bet-ter than wild-type cells (54). This suggests an additive ef-fect of 8-oxoG repair to the DSB-induced death by fluoro-quinolone exposure. Fluoroquinolone resistant clinical iso-lates of E. coli frequently carry mutations in mutM (55).
Heterogeneity of Hda-deficient cells
Hda mutant cells became heterogeneous following a shiftto aerobic growth, with both filament and minicell forma-tion. Because DNA replication stopped or stalled beforereaching the terminus, cell division was likely to be blocked,whereas cell mass continued to increase. In E. coli there areno mechanisms (checkpoints) that block replication initia-tion due to fork stalling and/or DNA damage. Therefore,new rounds of replication takes place concurrent with theincrease in cell mass, and the result is large, near-polyploidcells with a centrally located nucleoid containing multiplecopies of oriC and only one or two copies of the terminus(Figure 4). Cell filamentation was independent of SOS in-duction as we saw no significant increase in sulA expres-sion (not shown). This is in agreement with earlier datademonstrating that cells overinitiating DNA replication dueto the cold sensitive mutations hdaCs or dnaAcos fails to di-vide in an SOS-independent manner when grown at non-permissive temperature (27,56). Midcell trapping of the nu-cleoid inactivates the cell division protein FtsZ, indepen-dently of SOS induction or SlmA (57) and results in fre-quent division near the termini of filaments, i.e. minicell for-mation (Figure 4, Supplementary Figures S4 and S5).
Multiple ways to counteract lethal overinitiation in bacteria
Suppressor mutations that counteract lethal overinitiationin bacteria have previously been isolated in many labora-tories and fallen into two groups. The first group of sup-pressors affects the DnaA initiator protein itself and in-cludes mutations in dnaA to lower the activity of the re-sultant DnaA protein (11,26) or as recently discovered forC. crescentus second site mutations that lower the amountof DnaA protein by accelerating its degradation (58). Thesecond group of suppressors affects the oriC region and in-cludes mutations in oriC itself that lowers its ability to initi-ate replication (59) and mutations affecting the dam/seqA
13240 Nucleic Acids Research, 2014, Vol. 42, No. 21
system to increase sequestration of oriC and thereby re-stricting initiations (11,60). Common to overinitiation sup-pressors affecting oriC or DnaA is that they reduce initia-tion frequency from oriC, thereby fully or partly restoringorigin concentration and origin/terminus ratio of the sup-pressed cells to near wild-type levels.
Here, we demonstrate a third way E. coli can cope withreplication stress resulting from hyperinitiation. Lethalityis normally caused from an elevated number of replicationforks encountering intermediates in the repair of oxidizedbases, primarily 8-oxoG and thereby causing DSB. Remov-ing the cause of oxidative damage, i.e. anaerobic growth oraddition of an antioxidant (GSH), or loss of mutM encod-ing Fpg, the main player in repair of oxidative lesions, re-stores viability of hyperinitiating cells without reducing ini-tiations from oriC. This also implies that DNA replicationis not normally limited by the availability of precursors orprecursor synthesis.
SUPPLEMENTARY DATA
Supplementary Data are available at NAR Online.
ACKNOWLEDGEMENTS
Strain MS5 and MS158 were generously provided by Math-ieu Stouf. Plasmid pRN010 was obtained from D. Chat-toraj. We thank Leif Kirsebom, Uppsala University for helpwith the whole genome sequencing and Martin Marinusproviding strains and for helpful discussions.
FUNDING
European Union [PIRG05-GA-2009-247241]; Danish Re-search Council for Natural sciences [09-064250/FNU];Lundbeck Foundation; Novo Nordisk Foundation. Fund-ing for open access charge: University of Copenhagen.Conflict of interest statement. None declared.
REFERENCES1. Leonard,A.C. and Mechali,M. (2013) DNA replication origins. Cold
Spring Harb. Perspect. Biol., 5, a010116.2. Skarstad,K. and Katayama,T. (2013) Regulating DNA replication in
bacteria. Cold Spring Harb. Perspect. Biol., 5, a012922.3. Boye,E., Løbner-Olesen,A. and Skarstad,K. (2000) Limiting DNA
replication to once and only once. EMBO Rep., 1, 384–974.4. Kurokawa,K., Nishida,S., Emoto,A., Sekimizu,K. and Katayama,T.
(1999) Replication cycle-coordinated change of the adeninenucleotide-bound forms of DnaA protein in Escherichia coli. EMBOJ., 18, 6642–6652.
5. Boye,E. and Løbner-Olesen,A. (1990) The role of Dammethyltransferase in the control of DNA replication in E. coli. Cell,62, 981–989.
6. Lu,M., Campbell,J.L., Boye,E. and Kleckner,N. (1994) SeqA: anegative modulator of replication initiation in E. coli. Cell, 77,413–426.
7. Katayama,T., Kubota,T., Kurokawa,K., Crooke,E. and Sekimizu,K.(1998) The initiator function of DnaA protein is negatively regulatedby the sliding clamp of the E. coli chromosomal replicase. Cell, 94,61–71.
8. Kato,J. and Katayama,T. (2001) Hda, a novel DnaA-related protein,regulates the replication cycle in Escherichia coli. EMBO J., 20,4253–4262.
9. Kasho,K. and Katayama,T. (2013) DnaA binding locus datApromotes DnaA-ATP hydrolysis to enable cell cycle-coordinatedreplication initiation. Proc. Natl. Acad. Sci. U.S.A., 110, 936–941.
10. Riber,L., Olsson,J.A., Jensen,R.B., Skovgaard,O., Dasgupta,S.,Marinus,M.G. and Lobner-Olesen,A. (2006) Hda-mediatedinactivation of the DnaA protein and dnaA gene autoregulation actin concert to ensure homeostatic maintenance of the Escherichia colichromosome. Genes Dev., 20, 2121–2134.
11. Charbon,G., Riber,L., Cohen,M., Skovgaard,O., Fujimitsu,K.,Katayama,T. and Lobner-Olesen,A. (2011) Suppressors ofDnaA(ATP) imposed overinitiation in Escherichia coli. Mol.Microbiol., 79, 914–928.
12. Kitagawa,R., Ozaki,T., Moriya,S. and Ogawa,T. (1998) Negativecontrol of replication initiation by a novel chromosomal locusexhibiting exceptional affinity for Escherichia coli DnaA protein.Genes Dev., 12, 3032–3043.
13. Simmons,L.A., Breier,A.M., Cozzarelli,N.R. and Kaguni,J.M. (2004)Hyperinitiation of DNA replication in Escherichia coli leads toreplication fork collapse and inviability. Mol. Microbiol., 51, 349–358.
14. Fujimitsu,K., Senriuchi,T. and Katayama,T. (2009) Specific genomicsequences of E. coli promote replicational initiation by directlyreactivating ADP-DnaA. Genes Dev., 23, 1221–1233.
15. Zheng,W., Li,Z., Skarstad,K. and Crooke,E. (2001) Mutations inDnaA protein suppress the growth arrest of acidicphospholipid-deficient Escherichia coli cells. EMBO J., 20,1164–1172.
16. Imlay,J.A. (2003) Pathways of oxidative damage. Annu. Rev.Microbiol., 57, 395–418.
17. Bjelland,S. and Seeberg,E. (2003) Mutagenicity, toxicity and repair ofDNA base damage induced by oxidation. Mutat. Res., 531, 37–80.
18. Neeley,W.L. and Essigmann,J.M. (2006) Mechanisms of formation,genotoxicity, and mutation of guanine oxidation products. Chem.Res. Toxicol., 19, 491–505.
19. Michaels,M.L. and Miller,J.H. (1992) The GO system protectsorganisms from the mutagenic effect of the spontaneous lesion8-hydroxyguanine (7, 8-dihydro-8-oxoguanine). J. Bacteriol., 174,6321–6325.
20. Schalow,B.J., Courcelle,C.T. and Courcelle,J. (2011) Escherichia coliFpg glycosylase is nonrendundant and required for the rapid globalrepair of oxidized purine and pyrimidine damage in vivo. J. Mol.Biol., 410, 183–193.
21. Clark,D.J. and Maaløe,O. (1967) DNA replication and the divisioncycle in Escherichia coli. J. Mol. Biol., 23, 99–112.
22. Løbner-Olesen,A., Skarstad,K., Hansen,F.G., von Meyenburg,K.and Boye,E. (1989) The DnaA protein determines the initiation massof Escherichia coli K- 12. Cell, 57, 881–889.
23. Guelfo,J.R., Rodriguez-Rojas,A., Matic,I. and Blazquez,J. (2010) AMATE-family efflux pump rescues the Escherichia coli8-oxoguanine-repair-deficient mutator phenotype and protectsagainst H(2)O(2) killing. PLoS. Genet., 6, e1000931.
24. Nowosielska,A. and Marinus,M.G. (2008) DNA mismatchrepair-induced double-strand breaks. DNA Repair, 7, 48–56.
25. Baxter,J.C. and Sutton,M.D. (2012) Evidence for roles of theEscherichia coli Hda protein beyond regulatory inactivation ofDnaA. Mol. Microbiol., 85, 648–668.
26. Gon,S., Camara,J.E., Klungsoyr,H.K., Crooke,E., Skarstad,K. andBeckwith,J. (2006) A novel regulatory mechanism couplesdeoxyribonucleotide synthesis and DNA replication in Escherichiacoli. EMBO J., 25, 1137–1147.
27. Fujimitsu,K., Su’etsugu,M., Yamaguchi,Y., Mazda,K., Fu,N.,Kawakami,H. and Katayama,T. (2008) Modes of overinitiation,dnaA gene expression, and inhibition of cell division in a novelcold-sensitive hda mutant of Escherichia coli. J. Bacteriol., 190,5368–5381.
28. Løbner-Olesen,A. (1999) Distribution of minichromosomes inindividual Escherichia coli cells: implications for replication control.EMBO J., 18, 1712–1721.
29. Kline,B.C., Kogoma,T., Tam,J.E. and Shields,M.S. (1986)Requirement of the Escherichia coli dnaA gene product for plasmid Fmaintenance. J. Bacteriol., 168, 440–443.
30. Keasling,J.D., Palsson,B.O. and Cooper,S. (1991) Cell-cycle-specific Fplasmid replication: regulation by cell size control of initiation. J.Bacteriol., 173, 2673–2680.
Nucleic Acids Research, 2014, Vol. 42, No. 21 13241
31. Collins,J. and Pritchard,R.H. (1973) Relationship betweenchromosome replication and F’lac episome replication in Escherichiacoli. J. Mol. Biol., 78, 143–155.
32. Stouf,M., Meile,J.C. and Cornet,F. (2013) FtsK actively segregatessister chromosomes in Escherichia coli. Proc. Natl. Acad. Sci. U.S.A.,110, 11157–11162.
33. Kadoya,R. and Chattoraj,D.K. (2012) Insensitivity of chromosome Iand the cell cycle to blockage of replication and segregation of Vibriocholerae chromosome II. MBio., 3, doi:10.1128/mBio.00067-12.
34. Drlica,K. and Zhao,X. (1997) DNA gyrase, topoisomerase IV, andthe 4-quinolones. Microbiol. Mol. Biol. Rev., 61, 377–392.
35. Setsukinai,K., Urano,Y., Kakinuma,K., Majima,H.J. and Nagano,T.(2003) Development of novel fluorescence probes that can reliablydetect reactive oxygen species and distinguish specific species. J. Biol.Chem., 278, 3170–3175.
36. Kellenberger-Gujer,G., Podhajska,A.J. and Caro,L. (1978) A coldsensitive dnaA mutant of E. coli which overinitiates chromosomereplication at low temperature. Mol. Gen. Genet., 162, 9–16.
37. Atlung,T., Løbner-Olesen,A. and Hansen,F.G. (1987)Overproduction of DnaA protein stimulates initiation ofchromosome and minichromosome replication in Escherichia coli.Mol. Gen. Genet., 206, 51–59.
38. Camara,J.E., Skarstad,K. and Crooke,E. (2003) Controlled initiationof chromosomal replication in Escherichia coli requires functionalHda protein. J. Bacteriol., 185, 3244–3248.
39. Hsieh,L.-S., Rouviere-Yaniv,J. and Drlica,K. (1991) Bacterial DNAsupercoiling and [ATP]/[ADP] ratio: changes associated with saltshock. J. Bacteriol., 173, 3914–3917.
40. Tran,Q.H. and Unden,G. (1998) Changes in the proton potential andthe cellular energetics of Escherichia coli during growth by aerobicand anaerobic respiration or by fermentation. Eur. J. Biochem., 251,538–543.
41. Kashket,E.R. (1983) Stoichiometry of the H+-ATPase of Escherichiacoli cells during anaerobic growth. FEBS Lett., 154, 343–346.
42. Alhama,J., Ruiz-Laguna,J., Rodriguez-Ariza,A., Toribio,F.,Lopez-Barea,J. and Pueyo,C. (1998) Formation of 8-oxoguanine incellular DNA of Escherichia coli strains defective in differentantioxidant defences. Mutagenesis, 13, 589–594.
43. Gedik,C.M. and Collins,A. (2005) Establishing the background levelof base oxidation in human lymphocyte DNA: results of aninterlaboratory validation study. FASEB J., 19, 82–84.
44. Rotman,E. and Kuzminov,A. (2007) The mutT defect does notelevate chromosomal fragmentation in Escherichia coli because of thesurprisingly low levels of MutM/MutY-recognized DNAmodifications. J. Bacteriol., 189, 6976–6988.
45. O’Connor,T.R. and Laval,J. (1989) Physical association of the 2,6-diamino-4-hydroxy-5N-formamidopyrimidine-DNA glycosylase ofEscherichia coli and an activity nicking DNA atapurinic/apyrimidinic sites. Proc. Natl. Acad. Sci. U.S.A., 86,5222–5226.
46. Bonura,T., Town,C.D., Smith,K.C. and Kaplan,H.S. (1975) Theinfluence of oxygen on the yield of DNA double-strand breaks inx-irradiated Escherichia coli K-12. Radiat. Res., 63, 567–577.
47. Kouzminova,E.A. and Kuzminov,A. (2006) Fragmentation ofreplicating chromosomes triggered by uracil in DNA. J. Mol. Biol.,355, 20–33.
48. Rudolph,C.J., Upton,A.L. and Lloyd,R.G. (2007) Replication forkstalling and cell cycle arrest in UV-irradiated Escherichia coli. GenesDev., 21, 668–681.
49. Felczak,M.M. and Kaguni,J.M. (2012) The rcbA gene productreduces spontaneous and induced chromosome breaks in Escherichiacoli. J. Bacteriol., 194, 2152–2164.
50. Williams,S.D. and David,S.S. (1998) Evidence that MutY is amonofunctional glycosylase capable of forming a covalent Schiff baseintermediate with substrate DNA. Nucleic Acids Res., 26, 5123–5133.
51. Doetsch,P.W. and Cunningham,R.P. (1990) The enzymology ofapurinic/apyrimidinic endonucleases. Mutat. Res., 236, 173–201.
52. Blaisdell,J.O., Hatahet,Z. and Wallace,S.S. (1999) A novel role forEscherichia coli endonuclease VIII in prevention of spontaneousG–>T transversions. J. Bacteriol., 181, 6396–6402.
53. Zhang-Akiyama,Q.M., Morinaga,H., Kikuchi,M., Yonekura,S.,Sugiyama,H., Yamamoto,K. and Yonei,S. (2009) KsgA, a 16S rRNAadenine methyltransferase, has a novel DNA glycosylase/AP lyaseactivity to prevent mutations in Escherichia coli. Nucleic Acids Res.,37, 2116–2125.
54. Foti,J.J., Devadoss,B., Winkler,J.A., Collins,J.J. and Walker,G.C.(2012) Oxidation of the guanine nucleotide pool underlies cell deathby bactericidal antibiotics. Science, 336, 315–319.
55. Swick,M.C., Evangelista,M.A., Bodine,T.J., Easton-Marks,J.R.,Barth,P., Shah,M.J., Chung,C.A., Stanley,S., McLaughlin,S.F.,Lee,C.C. et al. (2013) Novel conserved genotypes correspond toantibiotic resistance phenotypes of clinical isolates. PLoS ONE., 8,e65961.
56. Katayama,T., Takata,M. and Sekimizu,K. (1997) CedA is a novelEscherichia coli protein that activates the cell division inhibited bychromosomal DNA over-replication. Mol. Microbiol., 26, 687–697.
57. Cambridge,J., Blinkova,A., Magnan,D., Bates,D. and Walker,J.R.(2014) A replication-inhibited unsegregated nucleoid at mid-cellblocks Z-ring formation and cell division independently of SOS andthe SlmA nucleoid occlusion protein in Escherichia coli. J. Bacteriol.,196, 36–49.
58. Jonas,K., Liu,J., Chien,P. and Laub,M.T. (2013) Proteotoxic stressinduces a cell-cycle arrest by stimulating lon to degrade thereplication initiator DnaA. Cell, 154, 623–636.
59. Riber,L., Fujimitsu,K., Katayama,T. and Lobner-Olesen,A. (2009)Loss of Hda activity stimulates replication initiation from I-box, butnot R4 mutant origins in Escherichia coli. Mol. Microbiol., 71,107–122.
60. Katayama,T., Akimitsu,N., Mizushima,T., Miki,T. and Sekimizu,K.(1997) Overinitiation of chromosome replication in the Escherichiacoli dnaAcos mutant depends on activation of oriC function by thedam gene product. Mol. Microbiol., 25, 661–670.
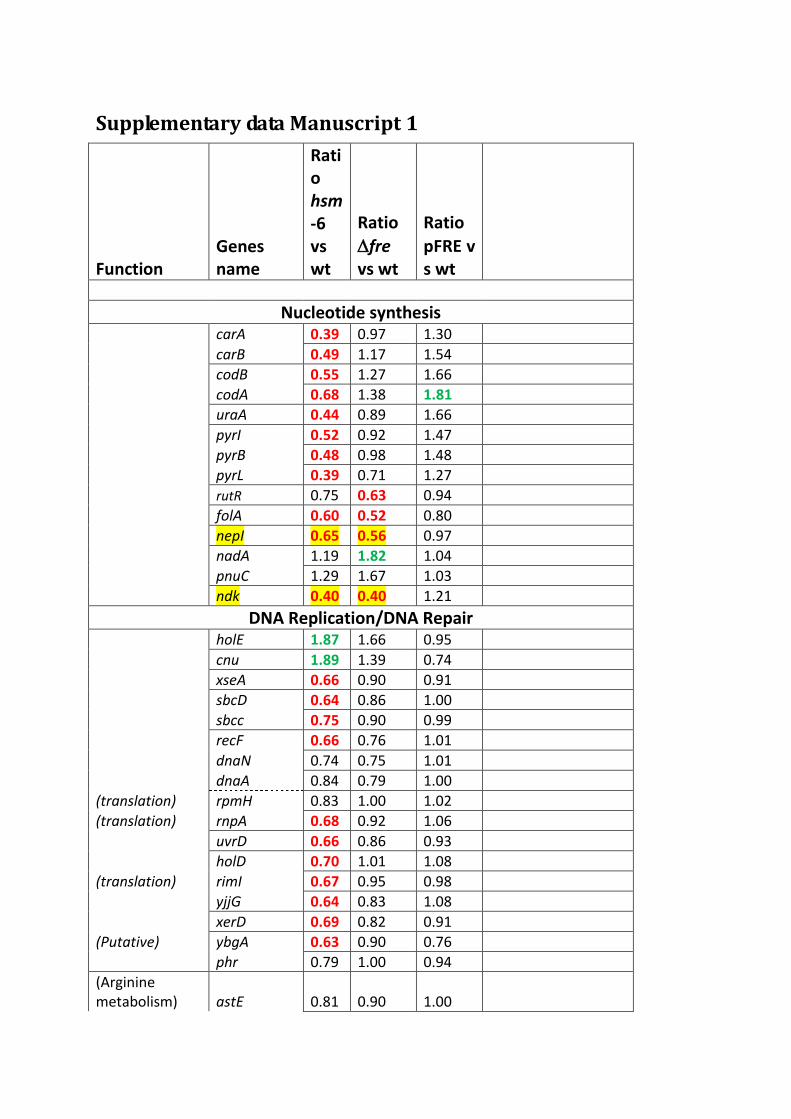
Supplementary data Manuscript 1
Function
Genes name
Ratio hsm-6 vs wt
Ratio
fre vs wt
Ratio
pFREvs wt
Nucleotide synthesis
carA 0.39 0.97 1.30
carB 0.49 1.17 1.54
codB 0.55 1.27 1.66
codA 0.68 1.38 1.81
uraA 0.44 0.89 1.66
pyrI 0.52 0.92 1.47
pyrB 0.48 0.98 1.48
pyrL 0.39 0.71 1.27
rutR 0.75 0.63 0.94
folA 0.60 0.52 0.80
nepI 0.65 0.56 0.97
nadA 1.19 1.82 1.04
pnuC 1.29 1.67 1.03
ndk 0.40 0.40 1.21
DNA Replication/DNA Repair holE 1.87 1.66 0.95
cnu 1.89 1.39 0.74
xseA 0.66 0.90 0.91
sbcD 0.64 0.86 1.00
sbcc 0.75 0.90 0.99
recF 0.66 0.76 1.01
dnaN 0.74 0.75 1.01
dnaA 0.84 0.79 1.00
(translation) rpmH 0.83 1.00 1.02
(translation) rnpA 0.68 0.92 1.06
uvrD 0.66 0.86 0.93
holD 0.70 1.01 1.08
(translation) rimI 0.67 0.95 0.98
yjjG 0.64 0.83 1.08
xerD 0.69 0.82 0.91
(Putative) ybgA 0.63 0.90 0.76
phr 0.79 1.00 0.94
(Arginine metabolism) astE 0.81 0.90 1.00
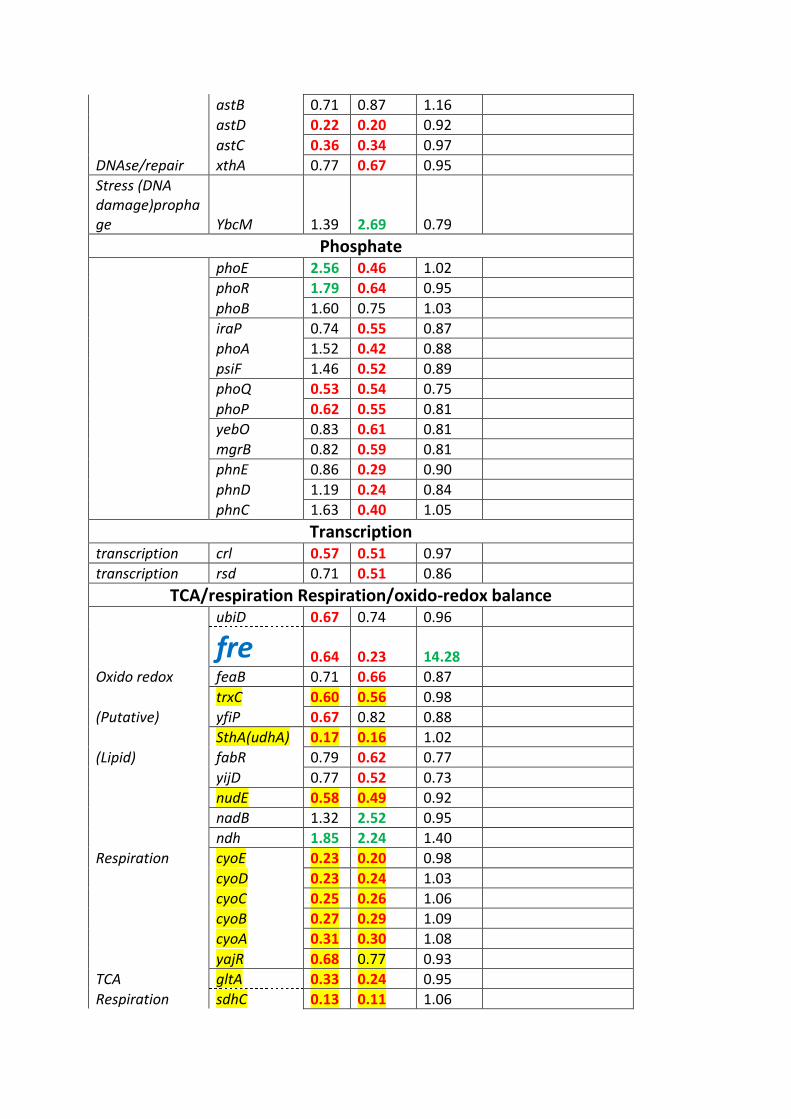
astB 0.71 0.87 1.16
astD 0.22 0.20 0.92
astC 0.36 0.34 0.97
DNAse/repair xthA 0.77 0.67 0.95
Stress (DNA damage)prophage YbcM 1.39 2.69 0.79
Phosphate phoE 2.56 0.46 1.02
phoR 1.79 0.64 0.95
phoB 1.60 0.75 1.03
iraP 0.74 0.55 0.87
phoA 1.52 0.42 0.88
psiF 1.46 0.52 0.89
phoQ 0.53 0.54 0.75
phoP 0.62 0.55 0.81
yebO 0.83 0.61 0.81
mgrB 0.82 0.59 0.81
phnE 0.86 0.29 0.90
phnD 1.19 0.24 0.84
phnC 1.63 0.40 1.05
Transcription transcription crl 0.57 0.51 0.97
transcription rsd 0.71 0.51 0.86
TCA/respiration Respiration/oxido-redox balance ubiD 0.67 0.74 0.96
fre 0.64 0.23 14.28
Oxido redox feaB 0.71 0.66 0.87
trxC 0.60 0.56 0.98
(Putative) yfiP 0.67 0.82 0.88
SthA(udhA) 0.17 0.16 1.02
(Lipid) fabR 0.79 0.62 0.77
yijD 0.77 0.52 0.73
nudE 0.58 0.49 0.92
nadB 1.32 2.52 0.95
ndh 1.85 2.24 1.40
Respiration cyoE 0.23 0.20 0.98
cyoD 0.23 0.24 1.03
cyoC 0.25 0.26 1.06
cyoB 0.27 0.29 1.09
cyoA 0.31 0.30 1.08
yajR 0.68 0.77 0.93
TCA gltA 0.33 0.24 0.95
Respiration sdhC 0.13 0.11 1.06
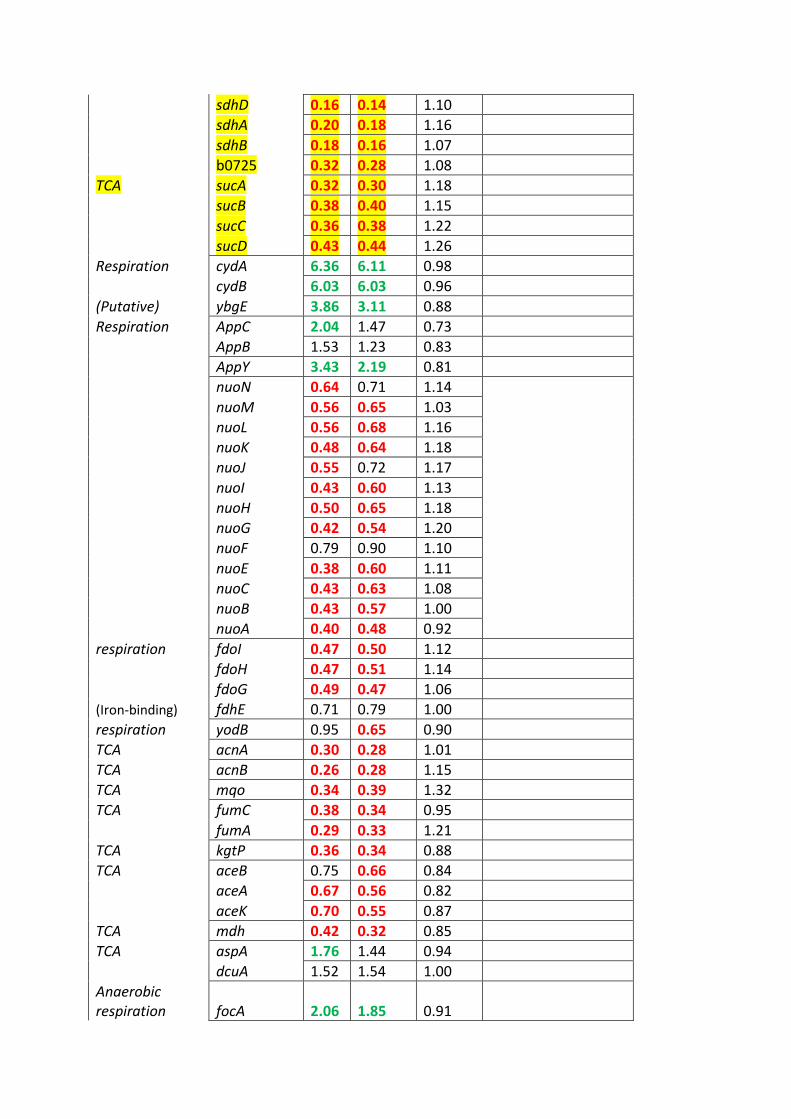
sdhD 0.16 0.14 1.10
sdhA 0.20 0.18 1.16
sdhB 0.18 0.16 1.07
b0725 0.32 0.28 1.08
TCA sucA 0.32 0.30 1.18
sucB 0.38 0.40 1.15
sucC 0.36 0.38 1.22
sucD 0.43 0.44 1.26
Respiration cydA 6.36 6.11 0.98
cydB 6.03 6.03 0.96
(Putative) ybgE 3.86 3.11 0.88
Respiration AppC 2.04 1.47 0.73
AppB 1.53 1.23 0.83
AppY 3.43 2.19 0.81
nuoN 0.64 0.71 1.14
nuoM 0.56 0.65 1.03
nuoL 0.56 0.68 1.16
nuoK 0.48 0.64 1.18
nuoJ 0.55 0.72 1.17
nuoI 0.43 0.60 1.13
nuoH 0.50 0.65 1.18
nuoG 0.42 0.54 1.20
nuoF 0.79 0.90 1.10
nuoE 0.38 0.60 1.11
nuoC 0.43 0.63 1.08
nuoB 0.43 0.57 1.00
nuoA 0.40 0.48 0.92
respiration fdoI 0.47 0.50 1.12
fdoH 0.47 0.51 1.14
fdoG 0.49 0.47 1.06
(Iron-binding) fdhE 0.71 0.79 1.00
respiration yodB 0.95 0.65 0.90
TCA acnA 0.30 0.28 1.01
TCA acnB 0.26 0.28 1.15
TCA mqo 0.34 0.39 1.32
TCA fumC 0.38 0.34 0.95
fumA 0.29 0.33 1.21
TCA kgtP 0.36 0.34 0.88
TCA aceB 0.75 0.66 0.84
aceA 0.67 0.56 0.82
aceK 0.70 0.55 0.87
TCA mdh 0.42 0.32 0.85
TCA aspA 1.76 1.44 0.94
dcuA 1.52 1.54 1.00
Anaerobic respiration focA 2.06 1.85 0.91
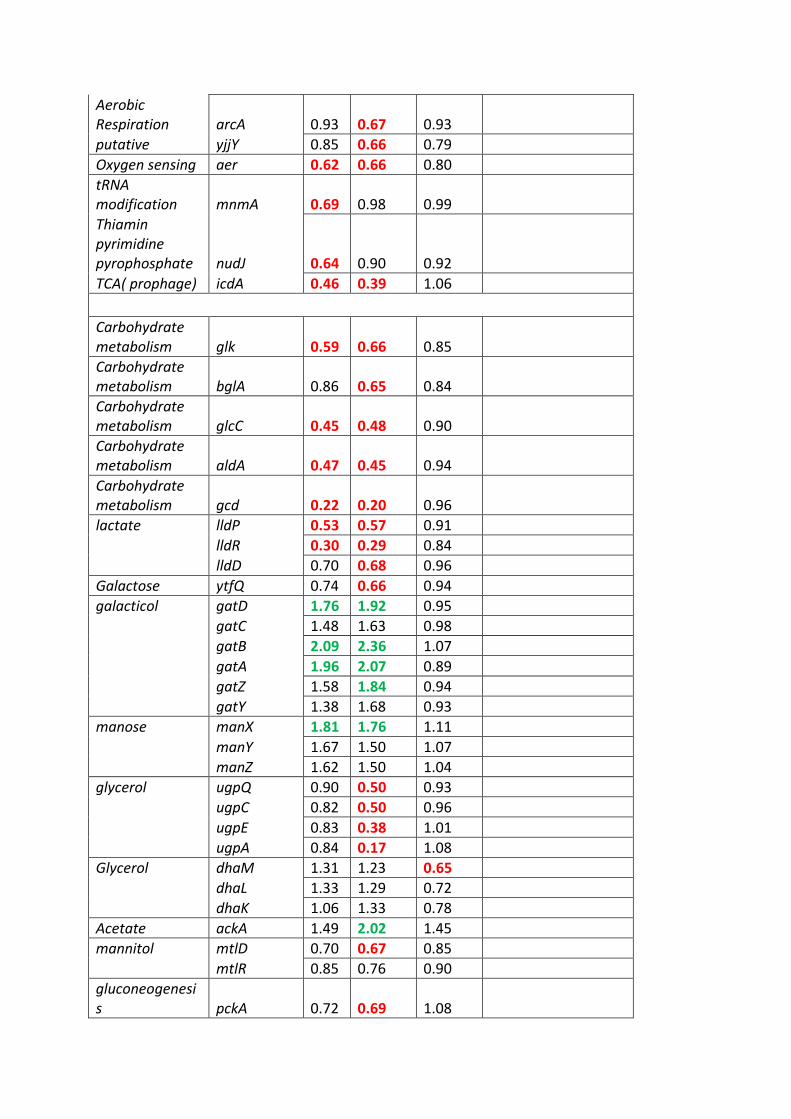
Aerobic Respiration arcA 0.93 0.67 0.93
putative yjjY 0.85 0.66 0.79
Oxygen sensing aer 0.62 0.66 0.80
tRNA modification mnmA 0.69 0.98 0.99
Thiamin pyrimidine pyrophosphate nudJ 0.64 0.90 0.92
TCA( prophage) icdA 0.46 0.39 1.06
Carbohydrate metabolism glk 0.59 0.66 0.85
Carbohydrate metabolism bglA 0.86 0.65 0.84
Carbohydrate metabolism glcC 0.45 0.48 0.90
Carbohydrate metabolism aldA 0.47 0.45 0.94
Carbohydrate metabolism gcd 0.22 0.20 0.96
lactate lldP 0.53 0.57 0.91
lldR 0.30 0.29 0.84
lldD 0.70 0.68 0.96
Galactose ytfQ 0.74 0.66 0.94
galacticol gatD 1.76 1.92 0.95
gatC 1.48 1.63 0.98
gatB 2.09 2.36 1.07
gatA 1.96 2.07 0.89
gatZ 1.58 1.84 0.94
gatY 1.38 1.68 0.93
manose manX 1.81 1.76 1.11
manY 1.67 1.50 1.07
manZ 1.62 1.50 1.04
glycerol ugpQ 0.90 0.50 0.93
ugpC 0.82 0.50 0.96
ugpE 0.83 0.38 1.01
ugpA 0.84 0.17 1.08
Glycerol dhaM 1.31 1.23 0.65
dhaL 1.33 1.29 0.72
dhaK 1.06 1.33 0.78
Acetate ackA 1.49 2.02 1.45
mannitol mtlD 0.70 0.67 0.85
mtlR 0.85 0.76 0.90
gluconeogenesis pckA 0.72 0.69 1.08
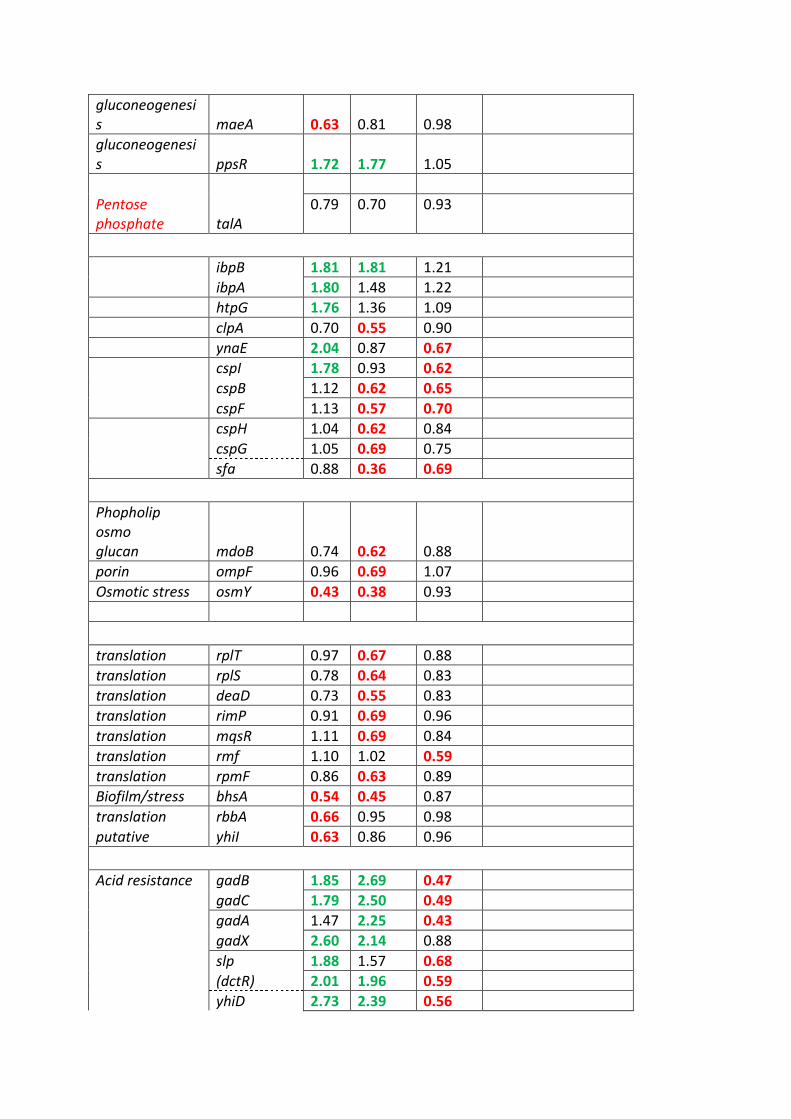
gluconeogenesis maeA 0.63 0.81 0.98
gluconeogenesis ppsR 1.72 1.77 1.05
Pentose phosphate talA
0.79 0.70 0.93
ibpB 1.81 1.81 1.21
ibpA 1.80 1.48 1.22
htpG 1.76 1.36 1.09
clpA 0.70 0.55 0.90
ynaE 2.04 0.87 0.67
cspI 1.78 0.93 0.62
cspB 1.12 0.62 0.65
cspF 1.13 0.57 0.70
cspH 1.04 0.62 0.84
cspG 1.05 0.69 0.75
sfa 0.88 0.36 0.69
Phopholip osmo glucan mdoB 0.74 0.62 0.88
porin ompF 0.96 0.69 1.07
Osmotic stress osmY 0.43 0.38 0.93
translation rplT 0.97 0.67 0.88
translation rplS 0.78 0.64 0.83
translation deaD 0.73 0.55 0.83
translation rimP 0.91 0.69 0.96
translation mqsR 1.11 0.69 0.84
translation rmf 1.10 1.02 0.59
translation rpmF 0.86 0.63 0.89
Biofilm/stress bhsA 0.54 0.45 0.87
translation rbbA 0.66 0.95 0.98
putative yhiI 0.63 0.86 0.96
Acid resistance gadB 1.85 2.69 0.47
gadC 1.79 2.50 0.49
gadA 1.47 2.25 0.43
gadX 2.60 2.14 0.88
slp 1.88 1.57 0.68
(dctR) 2.01 1.96 0.59
yhiD 2.73 2.39 0.56
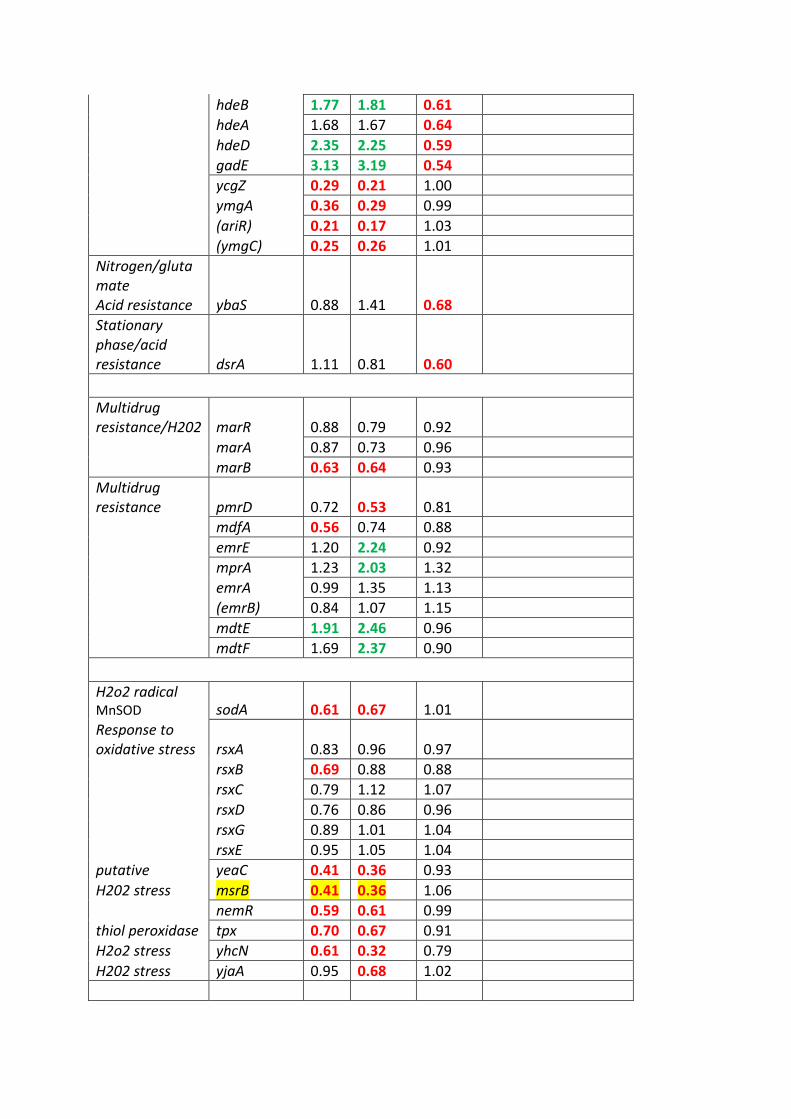
hdeB 1.77 1.81 0.61
hdeA 1.68 1.67 0.64
hdeD 2.35 2.25 0.59
gadE 3.13 3.19 0.54
ycgZ 0.29 0.21 1.00
ymgA 0.36 0.29 0.99
(ariR) 0.21 0.17 1.03
(ymgC) 0.25 0.26 1.01
Nitrogen/glutamate Acid resistance ybaS 0.88 1.41 0.68
Stationary phase/acid resistance dsrA 1.11 0.81 0.60
Multidrug resistance/H202 marR 0.88 0.79 0.92
marA 0.87 0.73 0.96
marB 0.63 0.64 0.93
Multidrug resistance pmrD 0.72 0.53 0.81
mdfA 0.56 0.74 0.88
emrE 1.20 2.24 0.92
mprA 1.23 2.03 1.32
emrA 0.99 1.35 1.13
(emrB) 0.84 1.07 1.15
mdtE 1.91 2.46 0.96
mdtF 1.69 2.37 0.90
H2o2 radical MnSOD sodA 0.61 0.67 1.01
Response to oxidative stress rsxA 0.83 0.96 0.97
rsxB 0.69 0.88 0.88
rsxC 0.79 1.12 1.07
rsxD 0.76 0.86 0.96
rsxG 0.89 1.01 1.04
rsxE 0.95 1.05 1.04
putative yeaC 0.41 0.36 0.93
H202 stress msrB 0.41 0.36 1.06
nemR 0.59 0.61 0.99
thiol peroxidase tpx 0.70 0.67 0.91
H2o2 stress yhcN 0.61 0.32 0.79
H202 stress yjaA 0.95 0.68 1.02
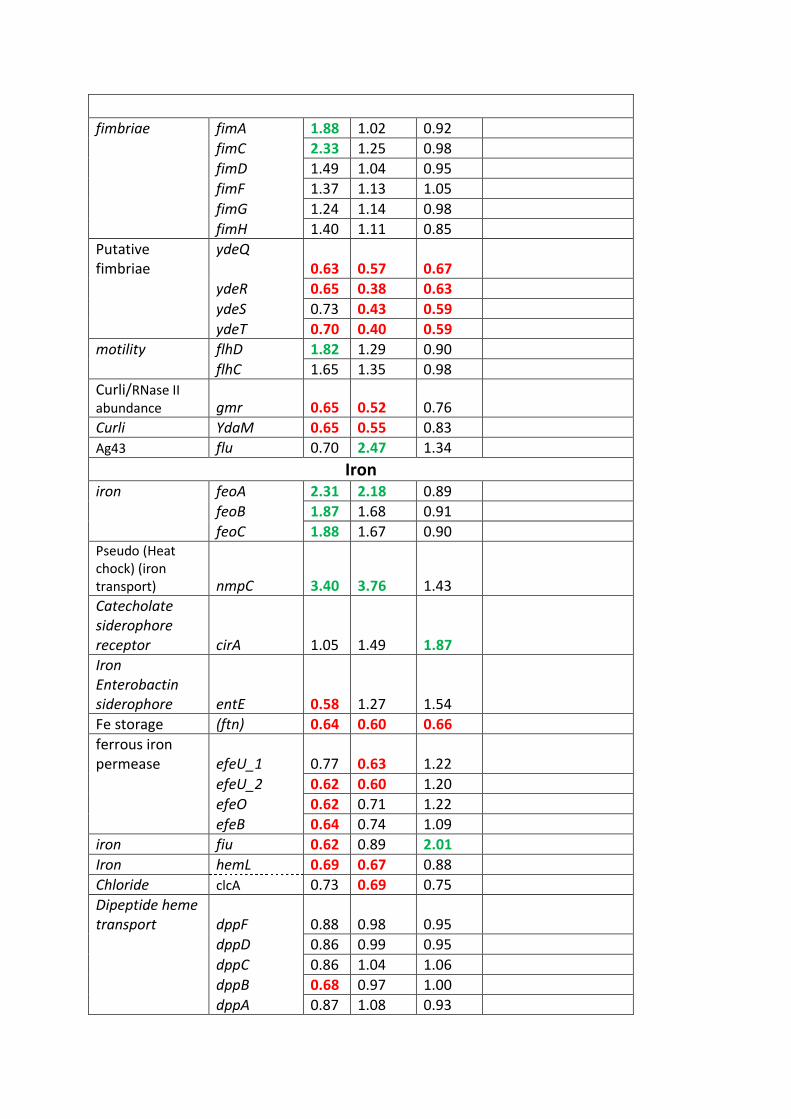
fimbriae fimA 1.88 1.02 0.92
fimC 2.33 1.25 0.98
fimD 1.49 1.04 0.95
fimF 1.37 1.13 1.05
fimG 1.24 1.14 0.98
fimH 1.40 1.11 0.85
Putative fimbriae
ydeQ 0.63 0.57 0.67
ydeR 0.65 0.38 0.63
ydeS 0.73 0.43 0.59
ydeT 0.70 0.40 0.59
motility flhD 1.82 1.29 0.90
flhC 1.65 1.35 0.98
Curli/RNase II abundance gmr 0.65 0.52 0.76
Curli YdaM 0.65 0.55 0.83
Ag43 flu 0.70 2.47 1.34
Iron iron feoA 2.31 2.18 0.89
feoB 1.87 1.68 0.91
feoC 1.88 1.67 0.90
Pseudo (Heat chock) (iron transport) nmpC 3.40 3.76 1.43
Catecholate siderophore receptor cirA 1.05 1.49 1.87
Iron Enterobactin siderophore entE 0.58 1.27 1.54
Fe storage (ftn) 0.64 0.60 0.66
ferrous iron permease efeU_1 0.77 0.63 1.22
efeU_2 0.62 0.60 1.20
efeO 0.62 0.71 1.22
efeB 0.64 0.74 1.09
iron fiu 0.62 0.89 2.01
Iron hemL 0.69 0.67 0.88
Chloride clcA 0.73 0.69 0.75
Dipeptide heme transport dppF 0.88 0.98 0.95
dppD 0.86 0.99 0.95
dppC 0.86 1.04 1.06
dppB 0.68 0.97 1.00
dppA 0.87 1.08 0.93
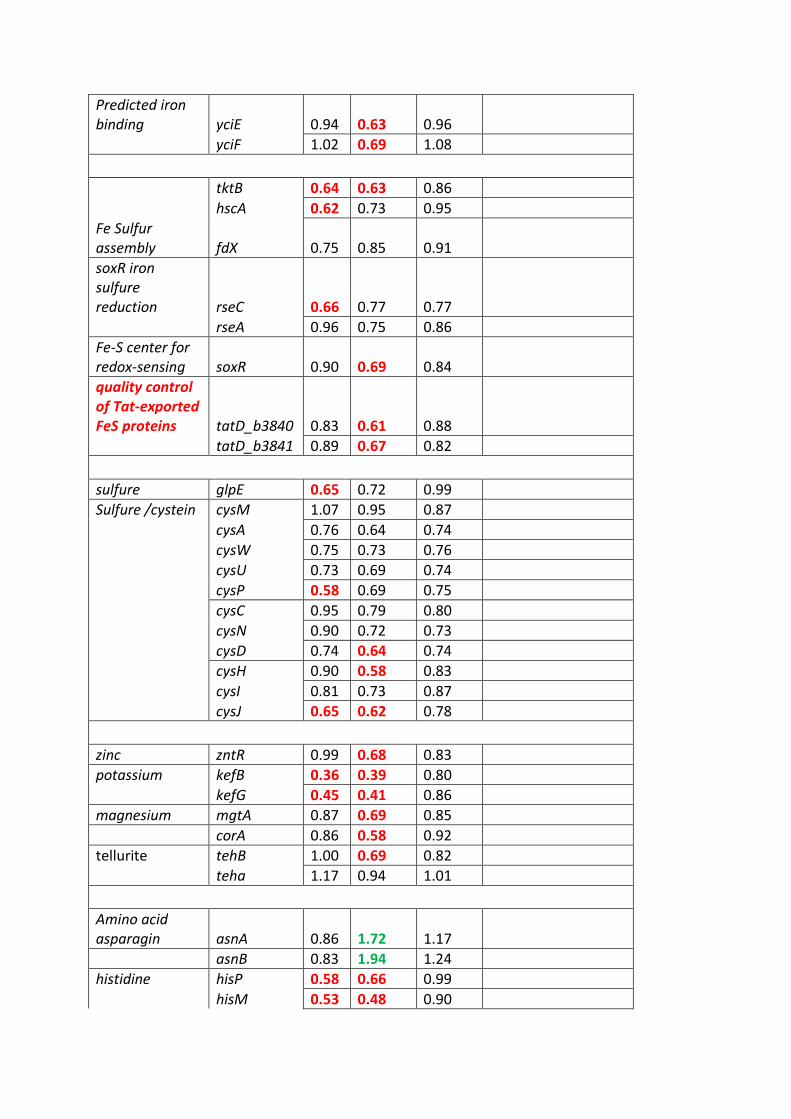
Predicted iron binding yciE 0.94 0.63 0.96
yciF 1.02 0.69 1.08
tktB 0.64 0.63 0.86
hscA 0.62 0.73 0.95
Fe Sulfur assembly fdX 0.75 0.85 0.91
soxR iron sulfure reduction rseC 0.66 0.77 0.77
rseA 0.96 0.75 0.86
Fe-S center for redox-sensing soxR 0.90 0.69 0.84
quality control of Tat-exported FeS proteins tatD_b3840 0.83 0.61 0.88
tatD_b3841 0.89 0.67 0.82
sulfure glpE 0.65 0.72 0.99
Sulfure /cystein cysM 1.07 0.95 0.87
cysA 0.76 0.64 0.74
cysW 0.75 0.73 0.76
cysU 0.73 0.69 0.74
cysP 0.58 0.69 0.75
cysC 0.95 0.79 0.80
cysN 0.90 0.72 0.73
cysD 0.74 0.64 0.74
cysH 0.90 0.58 0.83
cysI 0.81 0.73 0.87
cysJ 0.65 0.62 0.78
zinc zntR 0.99 0.68 0.83
potassium kefB 0.36 0.39 0.80
kefG 0.45 0.41 0.86
magnesium mgtA 0.87 0.69 0.85
corA 0.86 0.58 0.92
tellurite tehB 1.00 0.69 0.82
teha 1.17 0.94 1.01
Amino acid asparagin asnA 0.86 1.72 1.17
asnB 0.83 1.94 1.24
histidine hisP 0.58 0.66 0.99
hisM 0.53 0.48 0.90
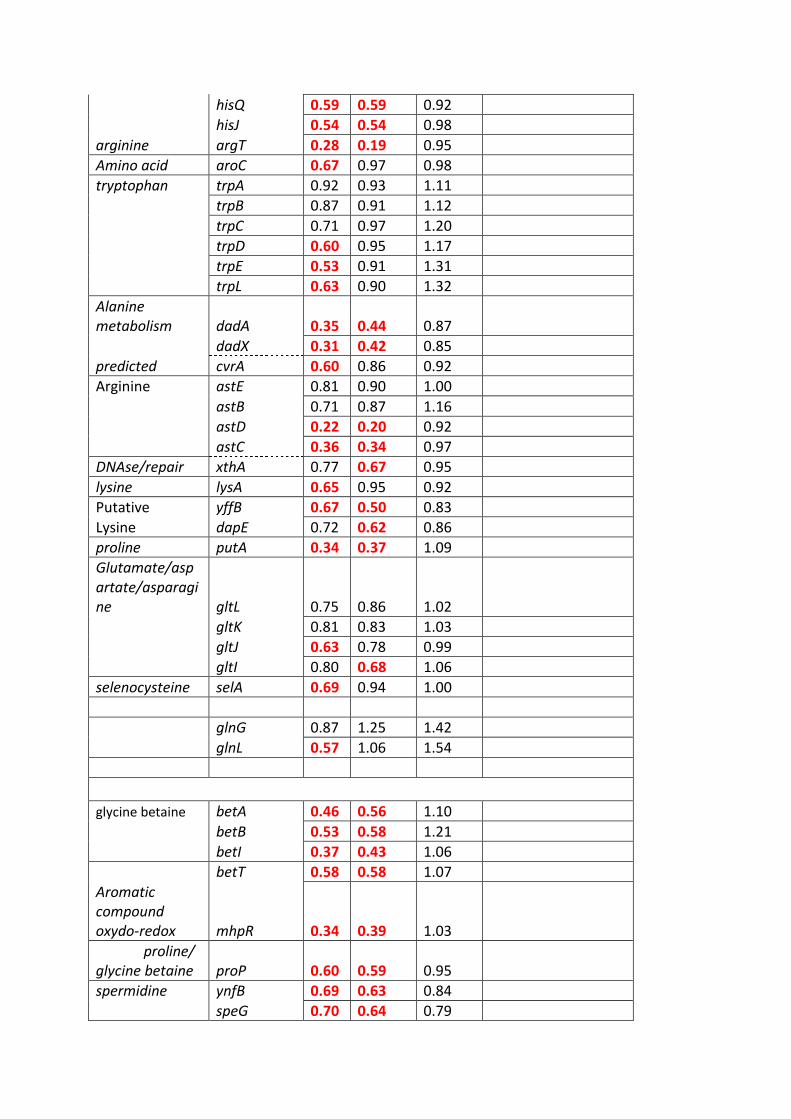
hisQ 0.59 0.59 0.92
hisJ 0.54 0.54 0.98
arginine argT 0.28 0.19 0.95
Amino acid aroC 0.67 0.97 0.98
tryptophan trpA 0.92 0.93 1.11
trpB 0.87 0.91 1.12
trpC 0.71 0.97 1.20
trpD 0.60 0.95 1.17
trpE 0.53 0.91 1.31
trpL 0.63 0.90 1.32
Alanine metabolism dadA 0.35 0.44 0.87
dadX 0.31 0.42 0.85
predicted cvrA 0.60 0.86 0.92
Arginine astE 0.81 0.90 1.00
astB 0.71 0.87 1.16
astD 0.22 0.20 0.92
astC 0.36 0.34 0.97
DNAse/repair xthA 0.77 0.67 0.95
lysine lysA 0.65 0.95 0.92
Putative yffB 0.67 0.50 0.83
Lysine dapE 0.72 0.62 0.86
proline putA 0.34 0.37 1.09
Glutamate/aspartate/asparagine gltL 0.75 0.86 1.02
gltK 0.81 0.83 1.03
gltJ 0.63 0.78 0.99
gltI 0.80 0.68 1.06
selenocysteine selA 0.69 0.94 1.00
glnG 0.87 1.25 1.42
glnL 0.57 1.06 1.54
glycine betaine betA 0.46 0.56 1.10
betB 0.53 0.58 1.21
betI 0.37 0.43 1.06
betT 0.58 0.58 1.07
Aromatic compound oxydo-redox mhpR 0.34 0.39 1.03
proline/glycine betaine proP 0.60 0.59 0.95
spermidine ynfB 0.69 0.63 0.84
speG 0.70 0.64 0.79
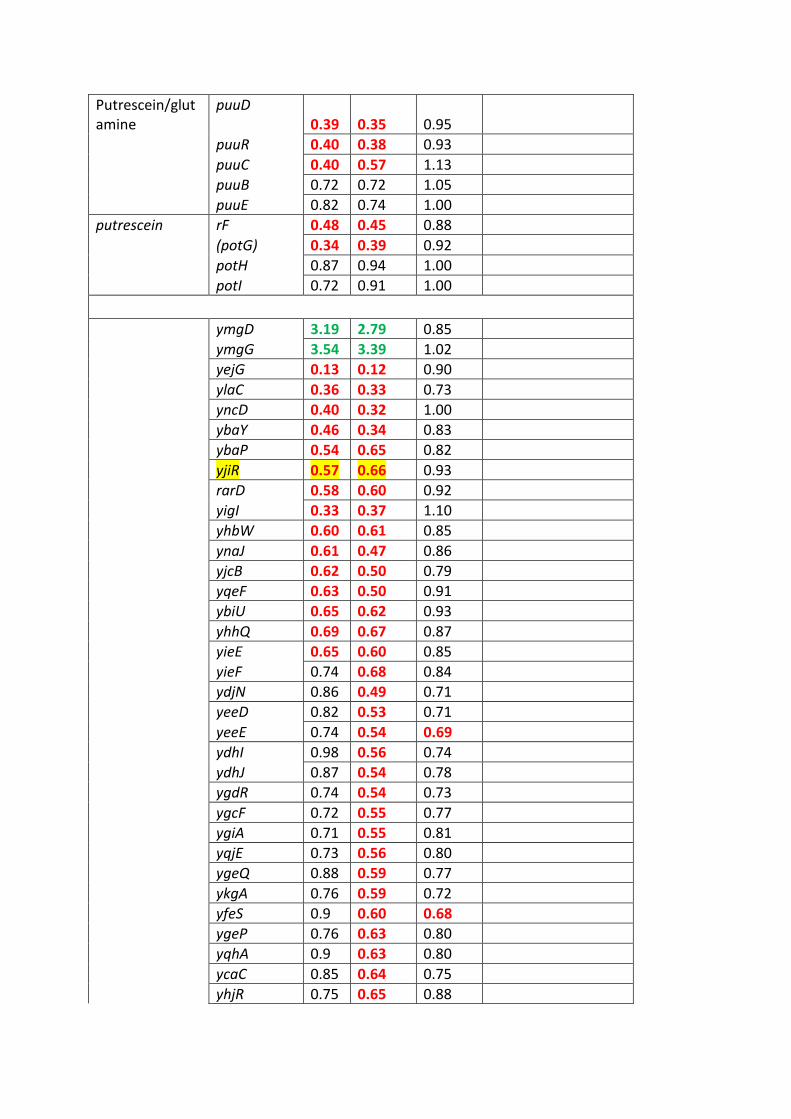
Putrescein/glutamine
puuD 0.39 0.35 0.95
puuR 0.40 0.38 0.93
puuC 0.40 0.57 1.13
puuB 0.72 0.72 1.05
puuE 0.82 0.74 1.00
putrescein rF 0.48 0.45 0.88
(potG) 0.34 0.39 0.92
potH 0.87 0.94 1.00
potI 0.72 0.91 1.00
ymgD 3.19 2.79 0.85
ymgG 3.54 3.39 1.02
yejG 0.13 0.12 0.90
ylaC 0.36 0.33 0.73
yncD 0.40 0.32 1.00
ybaY 0.46 0.34 0.83
ybaP 0.54 0.65 0.82
yjiR 0.57 0.66 0.93
rarD 0.58 0.60 0.92
yigI 0.33 0.37 1.10
yhbW 0.60 0.61 0.85
ynaJ 0.61 0.47 0.86
yjcB 0.62 0.50 0.79
yqeF 0.63 0.50 0.91
ybiU 0.65 0.62 0.93
yhhQ 0.69 0.67 0.87
yieE 0.65 0.60 0.85
yieF 0.74 0.68 0.84
ydjN 0.86 0.49 0.71
yeeD 0.82 0.53 0.71
yeeE 0.74 0.54 0.69
ydhI 0.98 0.56 0.74
ydhJ 0.87 0.54 0.78
ygdR 0.74 0.54 0.73
ygcF 0.72 0.55 0.77
ygiA 0.71 0.55 0.81
yqjE 0.73 0.56 0.80
ygeQ 0.88 0.59 0.77
ykgA 0.76 0.59 0.72
yfeS 0.9 0.60 0.68
ygeP 0.76 0.63 0.80
yqhA 0.9 0.63 0.80
ycaC 0.85 0.64 0.75
yhjR 0.75 0.65 0.88
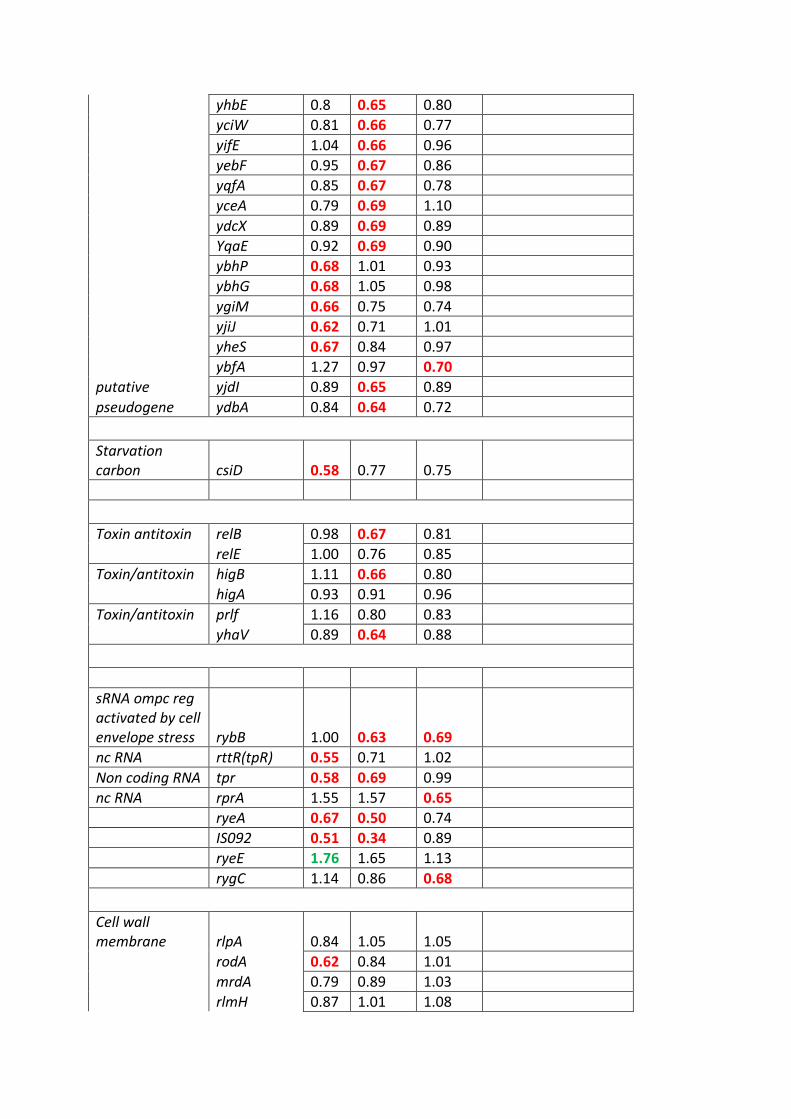
yhbE 0.8 0.65 0.80
yciW 0.81 0.66 0.77
yifE 1.04 0.66 0.96
yebF 0.95 0.67 0.86
yqfA 0.85 0.67 0.78
yceA 0.79 0.69 1.10
ydcX 0.89 0.69 0.89
YqaE 0.92 0.69 0.90
ybhP 0.68 1.01 0.93
ybhG 0.68 1.05 0.98
ygiM 0.66 0.75 0.74
yjiJ 0.62 0.71 1.01
yheS 0.67 0.84 0.97
ybfA 1.27 0.97 0.70
putative yjdI 0.89 0.65 0.89
pseudogene ydbA 0.84 0.64 0.72
Starvation carbon csiD 0.58 0.77 0.75
Toxin antitoxin relB 0.98 0.67 0.81
relE 1.00 0.76 0.85
Toxin/antitoxin higB 1.11 0.66 0.80
higA 0.93 0.91 0.96
Toxin/antitoxin prlf 1.16 0.80 0.83
yhaV 0.89 0.64 0.88
sRNA ompc reg
activated by cell envelope stress rybB 1.00 0.63 0.69
nc RNA rttR(tpR) 0.55 0.71 1.02
Non coding RNA tpr 0.58 0.69 0.99
nc RNA rprA 1.55 1.57 0.65
ryeA 0.67 0.50 0.74
IS092 0.51 0.34 0.89
ryeE 1.76 1.65 1.13
rygC 1.14 0.86 0.68
Cell wall membrane rlpA 0.84 1.05 1.05
rodA 0.62 0.84 1.01
mrdA 0.79 0.89 1.03
rlmH 0.87 1.01 1.08
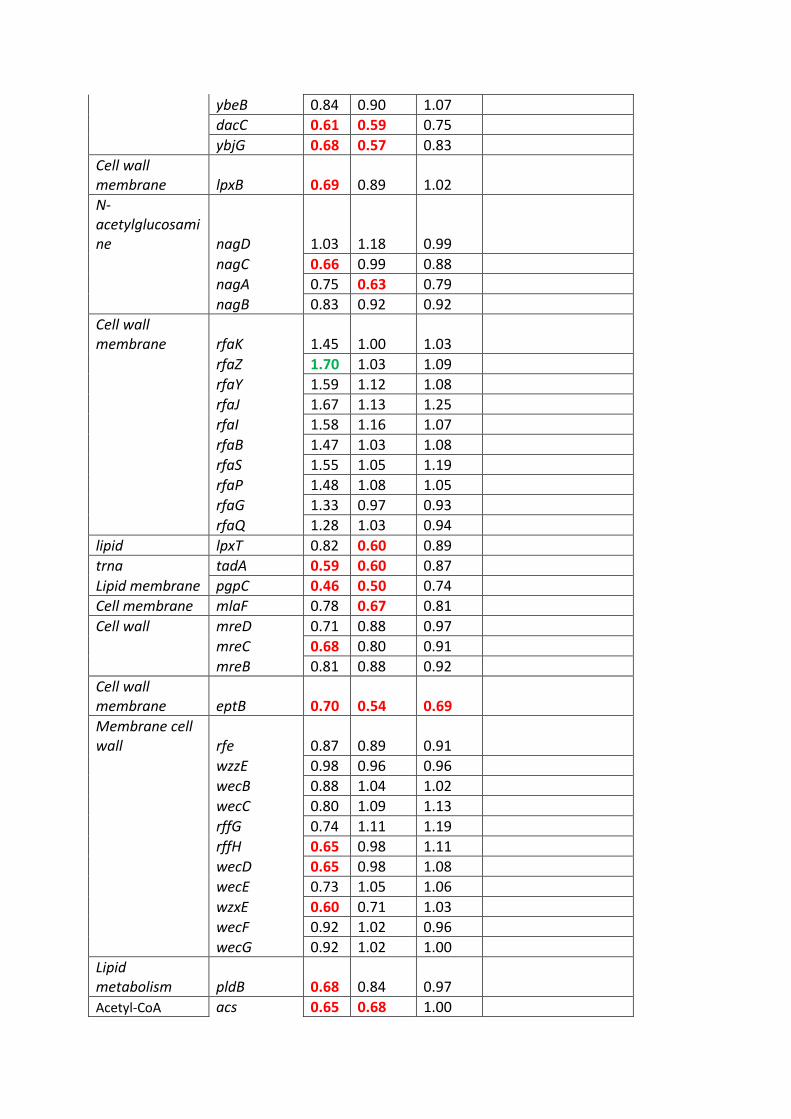
ybeB 0.84 0.90 1.07
dacC 0.61 0.59 0.75
ybjG 0.68 0.57 0.83
Cell wall membrane lpxB 0.69 0.89 1.02
N-acetylglucosamine nagD 1.03 1.18 0.99
nagC 0.66 0.99 0.88
nagA 0.75 0.63 0.79
nagB 0.83 0.92 0.92
Cell wall membrane rfaK 1.45 1.00 1.03
rfaZ 1.70 1.03 1.09
rfaY 1.59 1.12 1.08
rfaJ 1.67 1.13 1.25
rfaI 1.58 1.16 1.07
rfaB 1.47 1.03 1.08
rfaS 1.55 1.05 1.19
rfaP 1.48 1.08 1.05
rfaG 1.33 0.97 0.93
rfaQ 1.28 1.03 0.94
lipid lpxT 0.82 0.60 0.89
trna tadA 0.59 0.60 0.87
Lipid membrane pgpC 0.46 0.50 0.74
Cell membrane mlaF 0.78 0.67 0.81
Cell wall mreD 0.71 0.88 0.97
mreC 0.68 0.80 0.91
mreB 0.81 0.88 0.92
Cell wall membrane eptB 0.70 0.54 0.69
Membrane cell wall rfe 0.87 0.89 0.91
wzzE 0.98 0.96 0.96
wecB 0.88 1.04 1.02
wecC 0.80 1.09 1.13
rffG 0.74 1.11 1.19
rffH 0.65 0.98 1.11
wecD 0.65 0.98 1.08
wecE 0.73 1.05 1.06
wzxE 0.60 0.71 1.03
wecF 0.92 1.02 0.96
wecG 0.92 1.02 1.00
Lipid metabolism pldB 0.68 0.84 0.97
Acetyl-CoA acs 0.65 0.68 1.00

synthetase putative (yjcH) 0.69 0.70 1.01
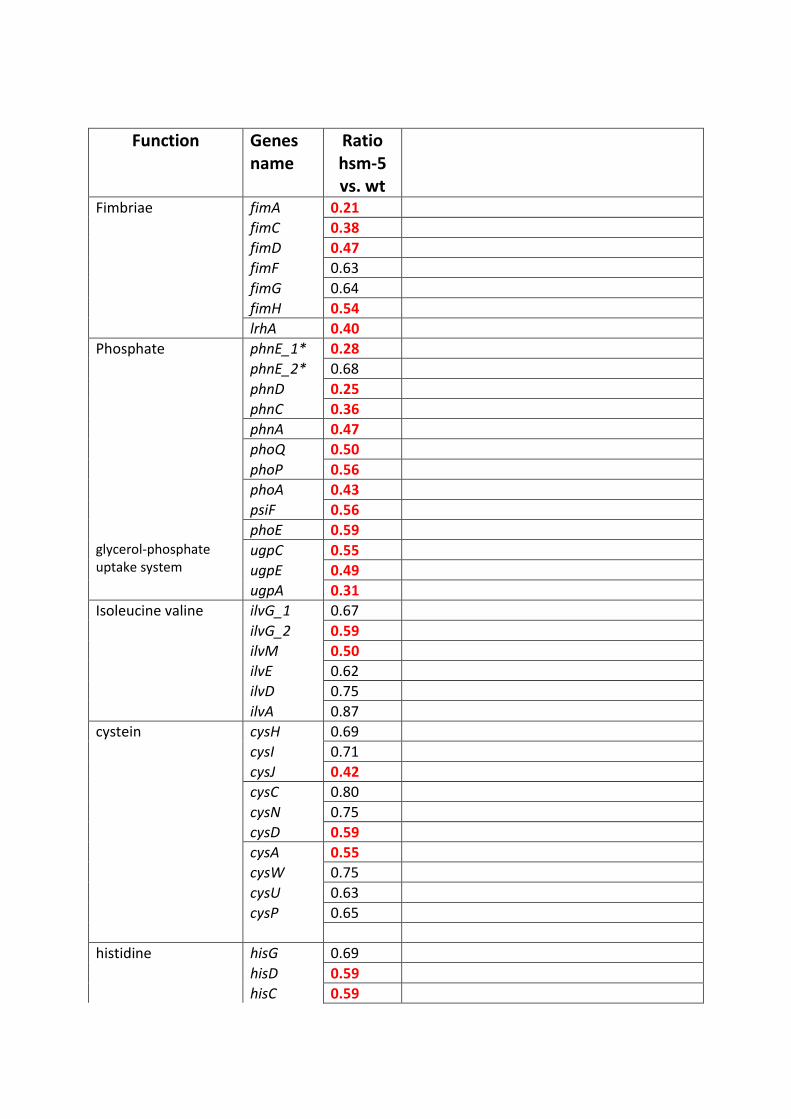
Function Genes name
Ratio hsm-5 vs. wt
Fimbriae fimA 0.21
fimC 0.38
fimD 0.47
fimF 0.63
fimG 0.64
fimH 0.54
lrhA 0.40
Phosphate phnE_1* 0.28
phnE_2* 0.68
phnD 0.25
phnC 0.36
phnA 0.47
phoQ 0.50
phoP 0.56
phoA 0.43
psiF 0.56
phoE 0.59
glycerol-phosphate uptake system
ugpC 0.55
ugpE 0.49
ugpA 0.31
Isoleucine valine ilvG_1 0.67
ilvG_2 0.59
ilvM 0.50
ilvE 0.62
ilvD 0.75
ilvA 0.87
cystein cysH 0.69
cysI 0.71
cysJ 0.42
cysC 0.80
cysN 0.75
cysD 0.59
cysA 0.55
cysW 0.75
cysU 0.63
cysP 0.65
histidine hisG 0.69
hisD 0.59
hisC 0.59
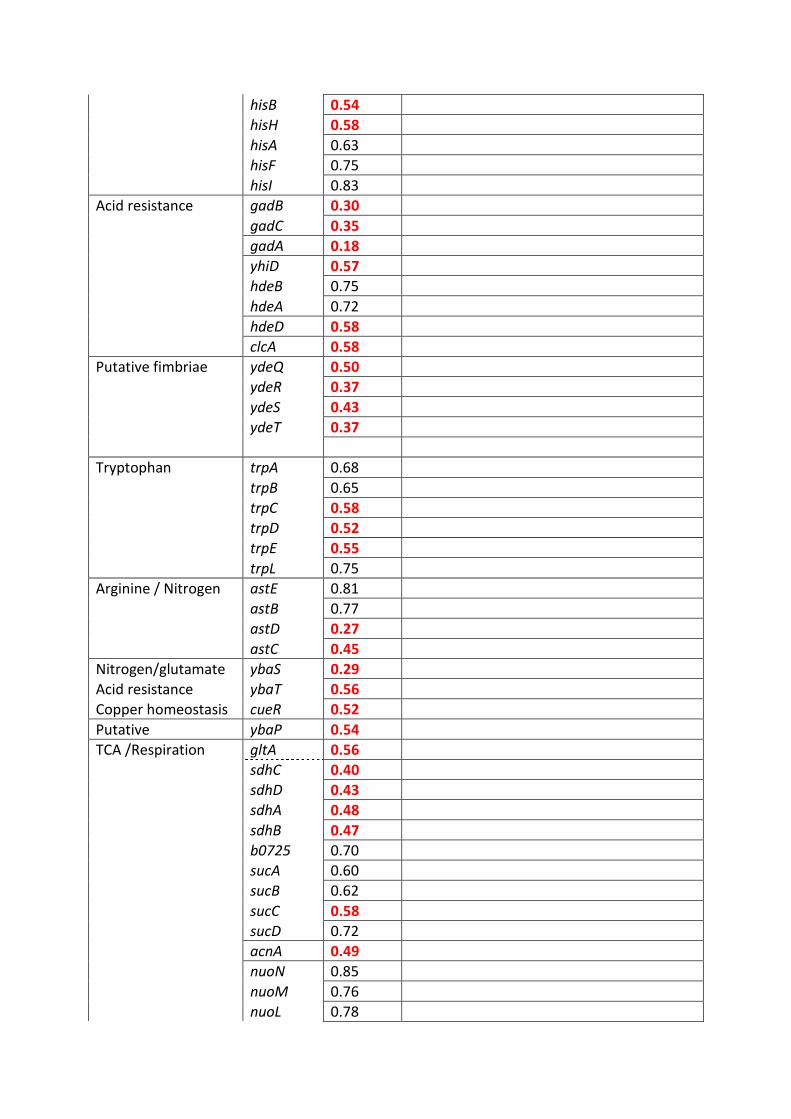
hisB 0.54
hisH 0.58
hisA 0.63
hisF 0.75
hisI 0.83
Acid resistance gadB 0.30
gadC 0.35
gadA 0.18
yhiD 0.57 hdeB 0.75
hdeA 0.72
hdeD 0.58
clcA 0.58
Putative fimbriae ydeQ 0.50
ydeR 0.37
ydeS 0.43
ydeT 0.37
Tryptophan trpA 0.68
trpB 0.65
trpC 0.58
trpD 0.52
trpE 0.55
trpL 0.75
Arginine / Nitrogen astE 0.81
astB 0.77
astD 0.27
astC 0.45
Nitrogen/glutamate ybaS 0.29
Acid resistance ybaT 0.56
Copper homeostasis cueR 0.52
Putative ybaP 0.54
TCA /Respiration gltA 0.56
sdhC 0.40
sdhD 0.43
sdhA 0.48
sdhB 0.47
b0725 0.70
sucA 0.60
sucB 0.62
sucC 0.58
sucD 0.72
acnA 0.49
nuoN 0.85
nuoM 0.76
nuoL 0.78
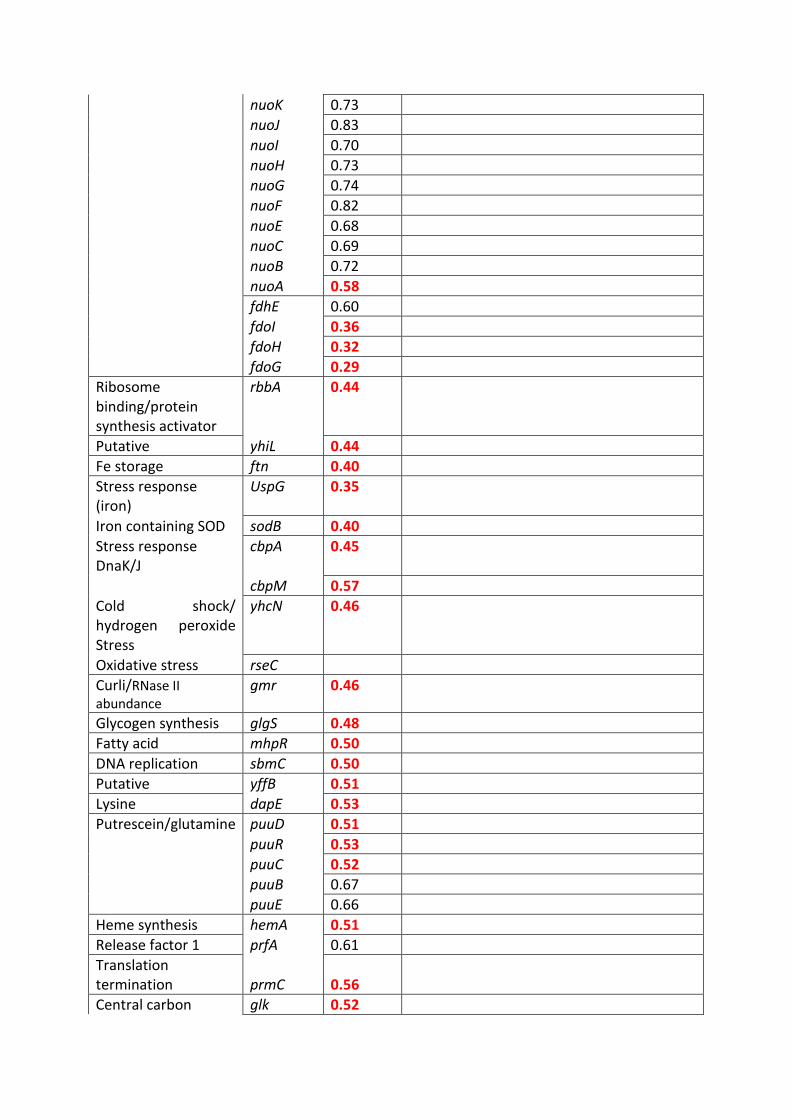
nuoK 0.73
nuoJ 0.83
nuoI 0.70
nuoH 0.73
nuoG 0.74
nuoF 0.82
nuoE 0.68
nuoC 0.69
nuoB 0.72
nuoA 0.58
fdhE 0.60
fdoI 0.36
fdoH 0.32
fdoG 0.29
Ribosome binding/protein synthesis activator
rbbA 0.44
Putative yhiL 0.44
Fe storage ftn 0.40
Stress response (iron)
UspG 0.35
Iron containing SOD sodB 0.40
Stress response DnaK/J
cbpA 0.45
cbpM 0.57
Cold shock/ hydrogen peroxide Stress
yhcN 0.46
Oxidative stress rseC
Curli/RNase II abundance
gmr 0.46
Glycogen synthesis glgS 0.48
Fatty acid mhpR 0.50
DNA replication sbmC 0.50
Putative yffB 0.51
Lysine dapE 0.53
Putrescein/glutamine puuD 0.51
puuR 0.53
puuC 0.52
puuB 0.67
puuE 0.66
Heme synthesis hemA 0.51
Release factor 1 prfA 0.61
Translation termination prmC 0.56
Central carbon glk 0.52
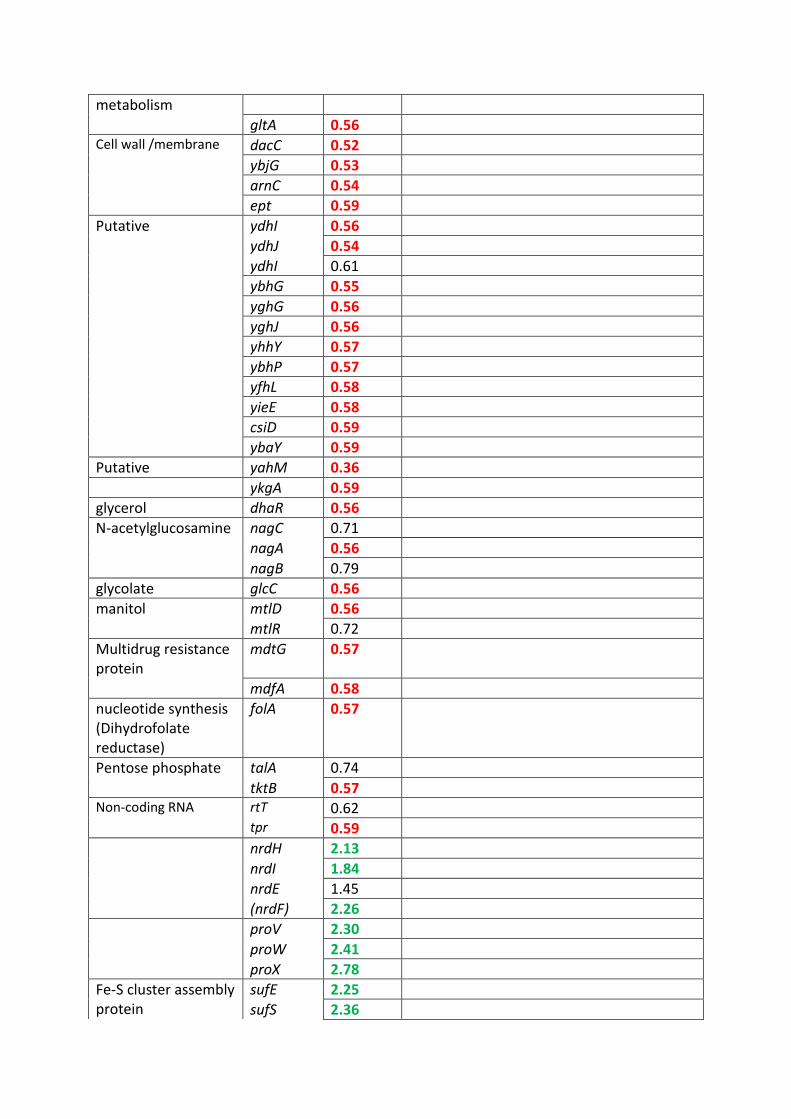
metabolism
gltA 0.56
Cell wall /membrane dacC 0.52
ybjG 0.53
arnC 0.54
ept 0.59
Putative ydhI 0.56
ydhJ 0.54
ydhI 0.61
ybhG 0.55
yghG 0.56
yghJ 0.56
yhhY 0.57
ybhP 0.57
yfhL 0.58
yieE 0.58
csiD 0.59
ybaY 0.59
Putative yahM 0.36
ykgA 0.59
glycerol dhaR 0.56
N-acetylglucosamine nagC 0.71
nagA 0.56
nagB 0.79
glycolate glcC 0.56
manitol mtlD 0.56
mtlR 0.72
Multidrug resistance protein
mdtG 0.57
mdfA 0.58
nucleotide synthesis (Dihydrofolate reductase)
folA 0.57
Pentose phosphate talA 0.74
tktB 0.57
Non-coding RNA rtT 0.62
tpr 0.59
nrdH 2.13
nrdI 1.84
nrdE 1.45
(nrdF) 2.26
proV 2.30
proW 2.41
proX 2.78
Fe-S cluster assembly protein
sufE 2.25
sufS 2.36
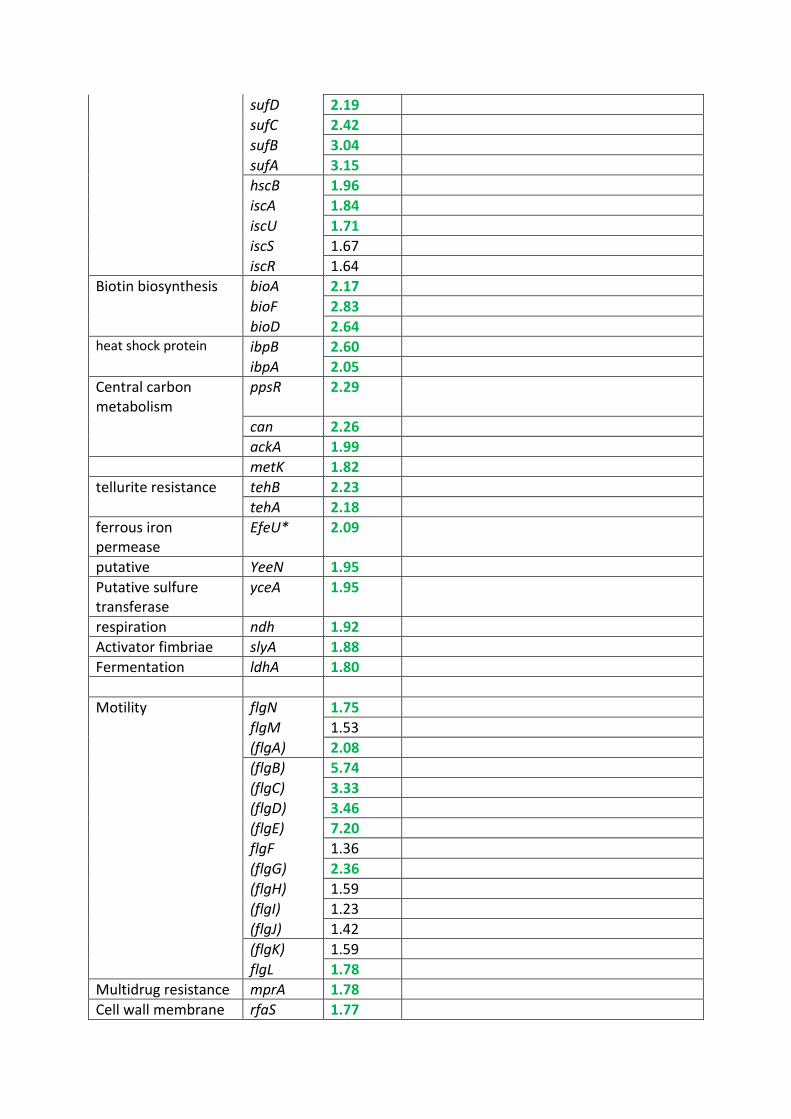
sufD 2.19
sufC 2.42
sufB 3.04
sufA 3.15
hscB 1.96
iscA 1.84
iscU 1.71
iscS 1.67
iscR 1.64
Biotin biosynthesis bioA 2.17
bioF 2.83
bioD 2.64
heat shock protein ibpB 2.60
ibpA 2.05
Central carbon metabolism
ppsR 2.29
can 2.26
ackA 1.99
metK 1.82
tellurite resistance tehB 2.23
tehA 2.18
ferrous iron permease
EfeU* 2.09
putative YeeN 1.95
Putative sulfure transferase
yceA 1.95
respiration ndh 1.92
Activator fimbriae slyA 1.88
Fermentation ldhA 1.80
Motility flgN 1.75
flgM 1.53
(flgA) 2.08
(flgB) 5.74
(flgC) 3.33
(flgD) 3.46
(flgE) 7.20
flgF 1.36
(flgG) 2.36
(flgH) 1.59
(flgI) 1.23
(flgJ) 1.42
(flgK) 1.59
flgL 1.78
Multidrug resistance mprA 1.78
Cell wall membrane rfaS 1.77
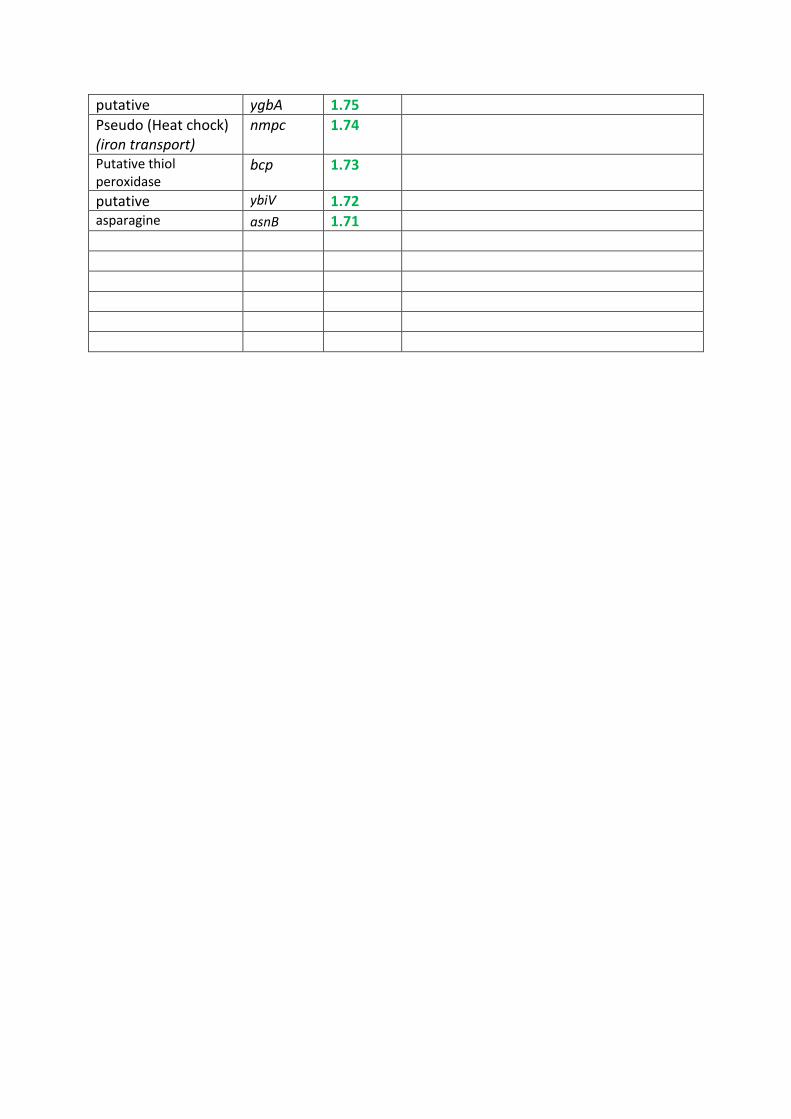
putative ygbA 1.75
Pseudo (Heat chock) (iron transport)
nmpc 1.74
Putative thiol peroxidase
bcp 1.73
putative ybiV 1.72
asparagine asnB 1.71

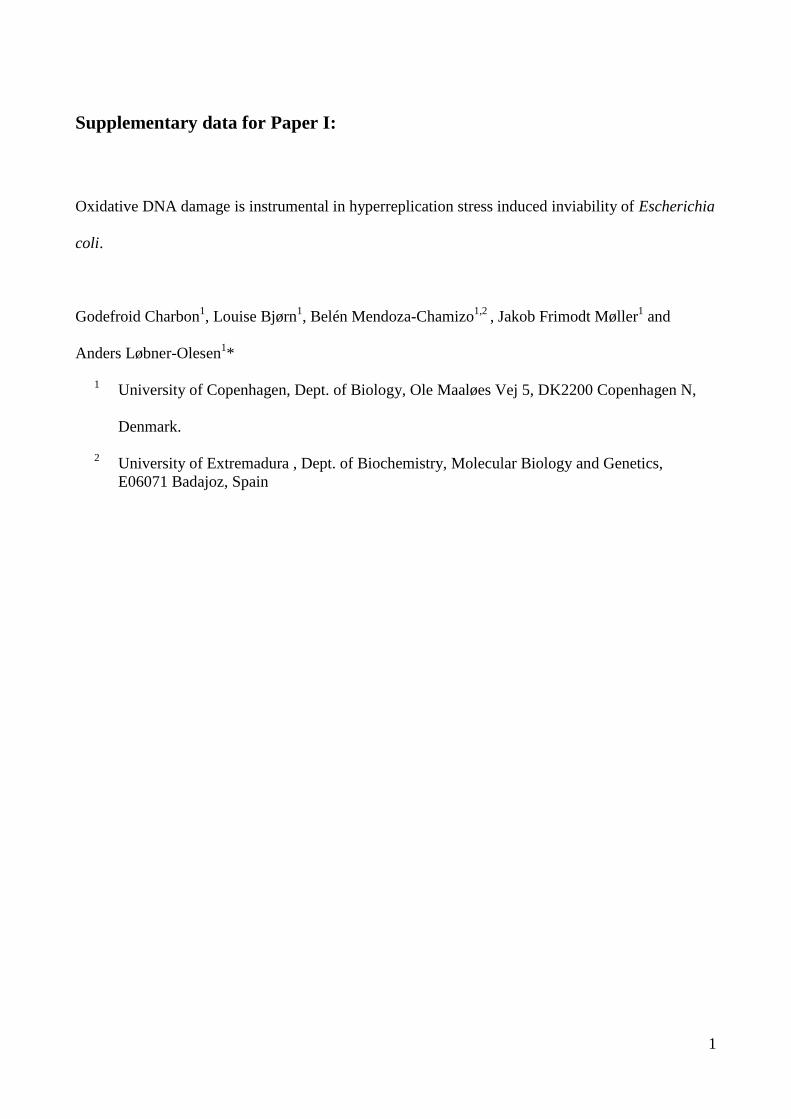
1
Supplementary data for Paper I:
Oxidative DNA damage is instrumental in hyperreplication stress induced inviability of Escherichia
coli.
Godefroid Charbon1, Louise Bjørn
1, Belén Mendoza-Chamizo
1,2 , Jakob Frimodt Møller
1 and
Anders Løbner-Olesen1*
1 University of Copenhagen, Dept. of Biology, Ole Maaløes Vej 5, DK2200 Copenhagen N,
Denmark.
2 University of Extremadura , Dept. of Biochemistry, Molecular Biology and Genetics,
E06071 Badajoz, Spain
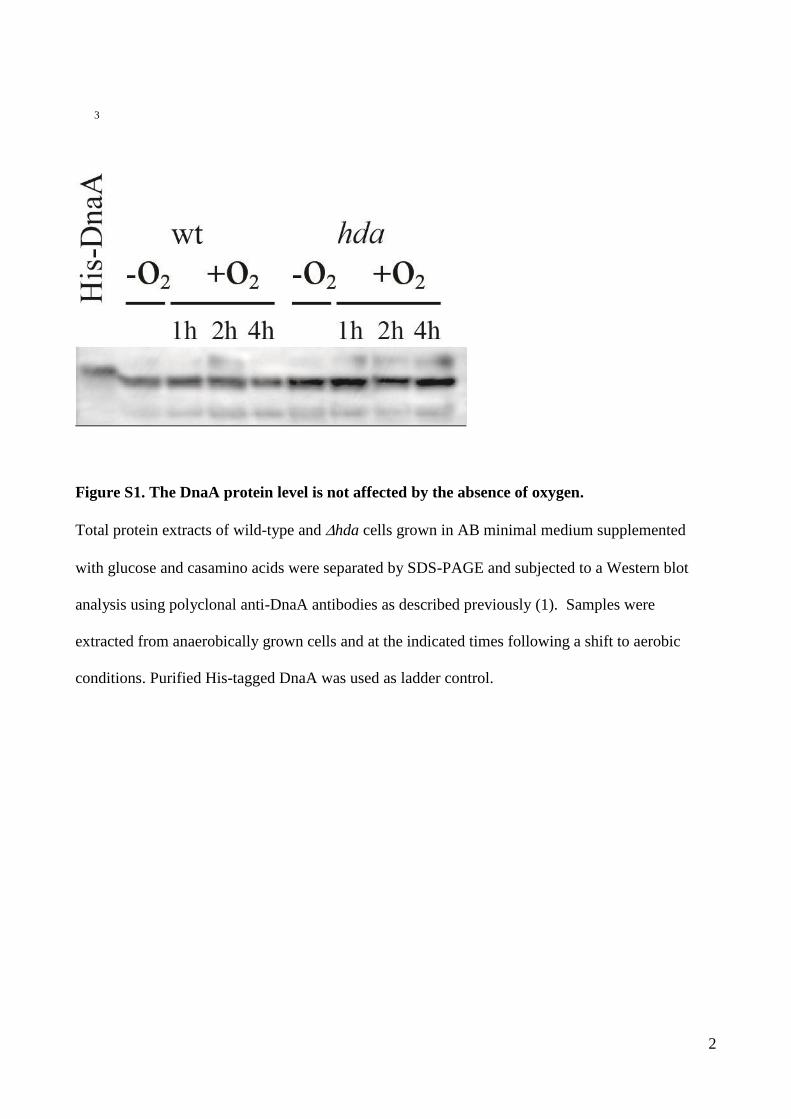
2
3
Figure S1. The DnaA protein level is not affected by the absence of oxygen.
Total protein extracts of wild-type and hda cells grown in AB minimal medium supplemented
with glucose and casamino acids were separated by SDS-PAGE and subjected to a Western blot
analysis using polyclonal anti-DnaA antibodies as described previously (1). Samples were
extracted from anaerobically grown cells and at the indicated times following a shift to aerobic
conditions. Purified His-tagged DnaA was used as ladder control.
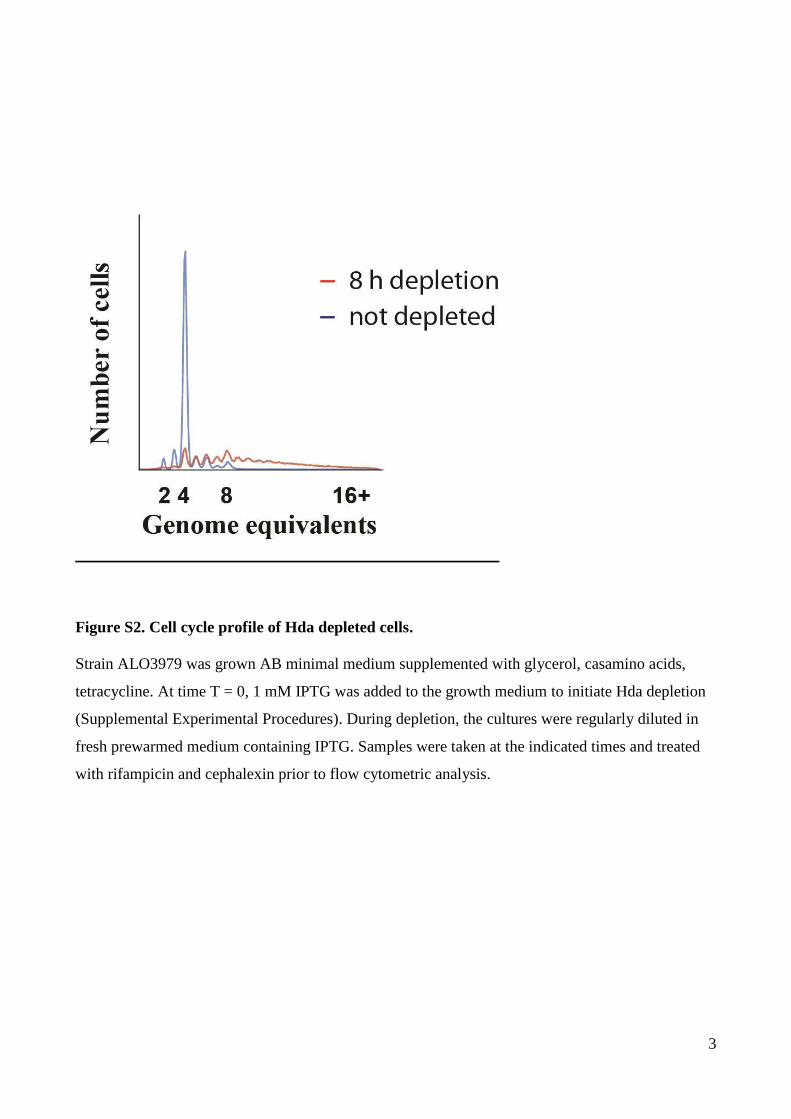
3
Figure S2. Cell cycle profile of Hda depleted cells.
Strain ALO3979 was grown AB minimal medium supplemented with glycerol, casamino acids,
tetracycline. At time T = 0, 1 mM IPTG was added to the growth medium to initiate Hda depletion
(Supplemental Experimental Procedures). During depletion, the cultures were regularly diluted in
fresh prewarmed medium containing IPTG. Samples were taken at the indicated times and treated
with rifampicin and cephalexin prior to flow cytometric analysis.
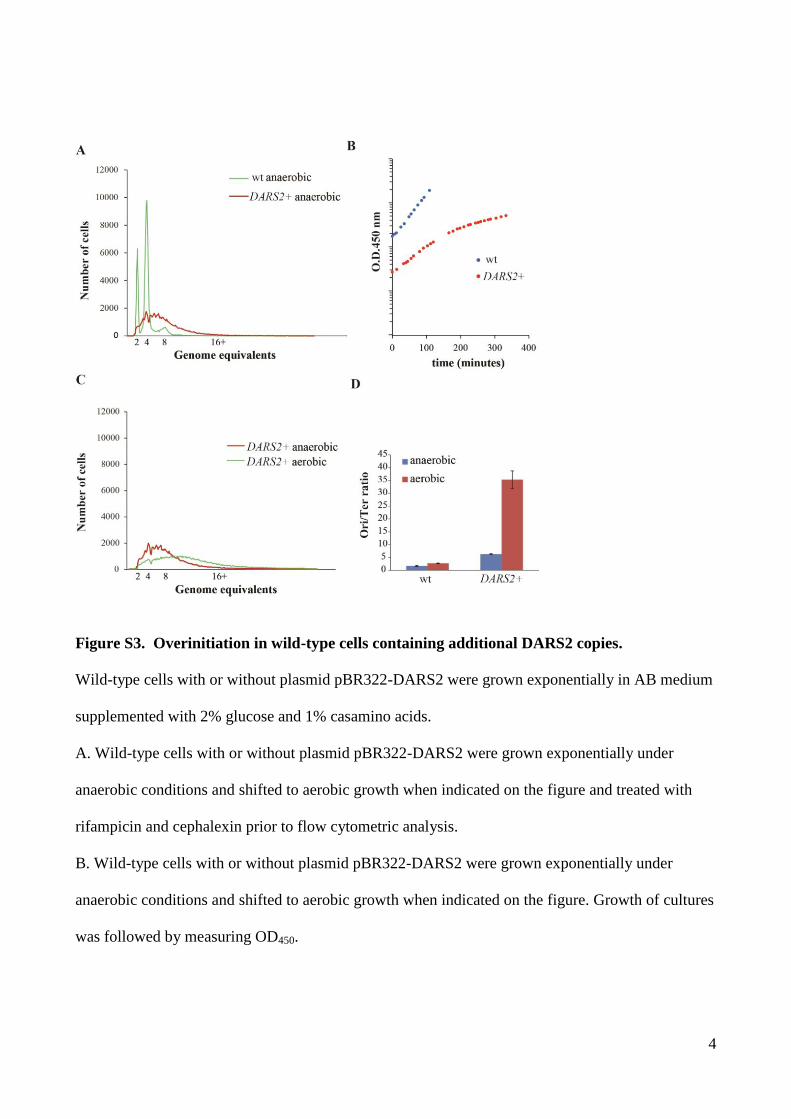
4
Figure S3. Overinitiation in wild-type cells containing additional DARS2 copies.
Wild-type cells with or without plasmid pBR322-DARS2 were grown exponentially in AB medium
supplemented with 2% glucose and 1% casamino acids.
A. Wild-type cells with or without plasmid pBR322-DARS2 were grown exponentially under
anaerobic conditions and shifted to aerobic growth when indicated on the figure and treated with
rifampicin and cephalexin prior to flow cytometric analysis.
B. Wild-type cells with or without plasmid pBR322-DARS2 were grown exponentially under
anaerobic conditions and shifted to aerobic growth when indicated on the figure. Growth of cultures
was followed by measuring OD450.
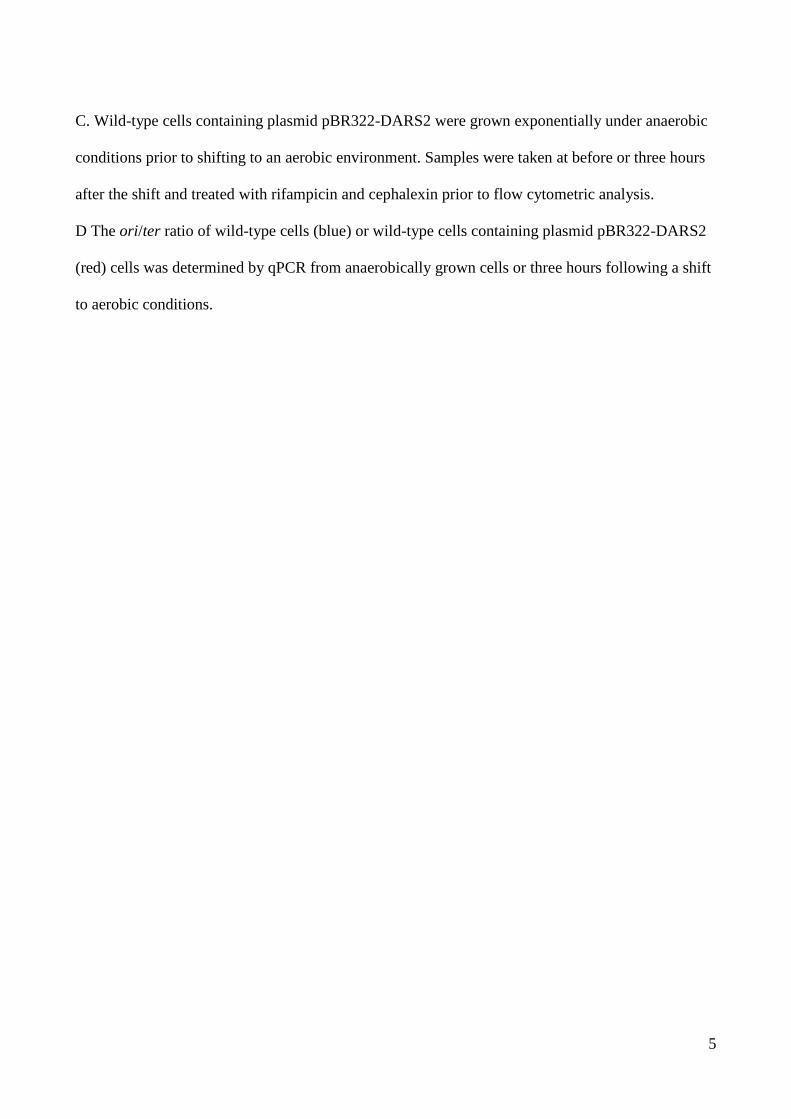
5
C. Wild-type cells containing plasmid pBR322-DARS2 were grown exponentially under anaerobic
conditions prior to shifting to an aerobic environment. Samples were taken at before or three hours
after the shift and treated with rifampicin and cephalexin prior to flow cytometric analysis.
D The ori/ter ratio of wild-type cells (blue) or wild-type cells containing plasmid pBR322-DARS2
(red) cells was determined by qPCR from anaerobically grown cells or three hours following a shift
to aerobic conditions.
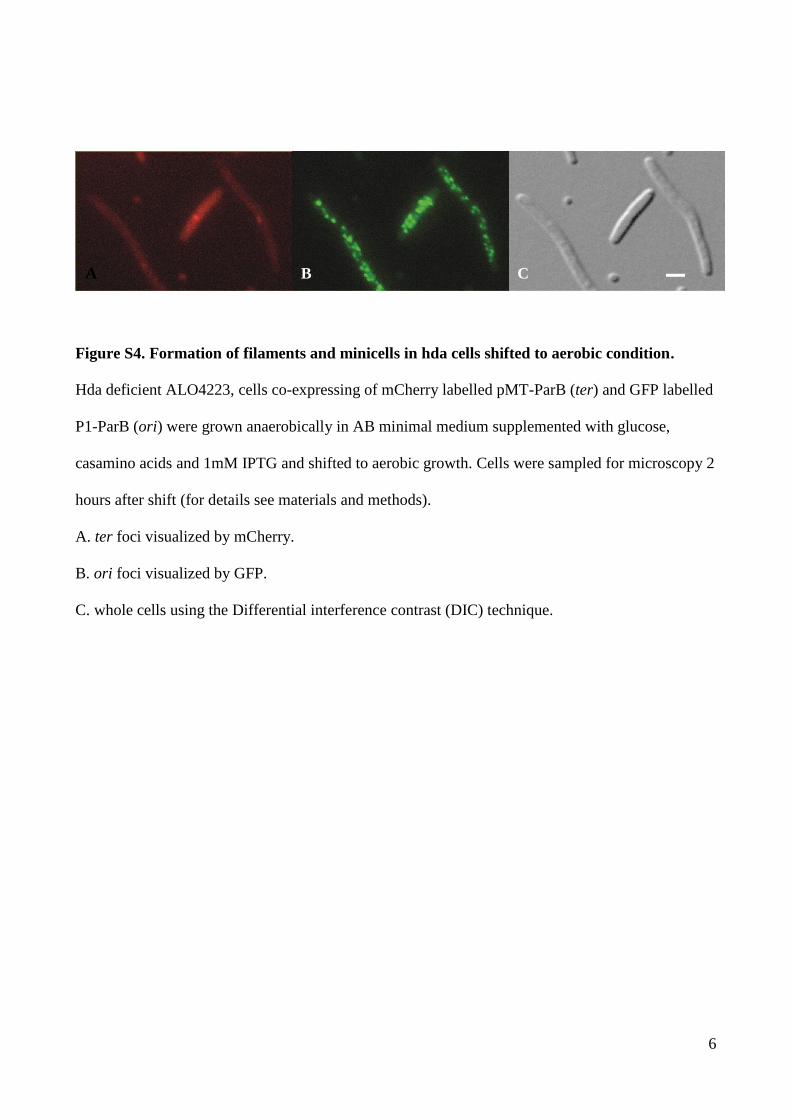
6
Figure S4. Formation of filaments and minicells in hda cells shifted to aerobic condition.
Hda deficient ALO4223, cells co-expressing of mCherry labelled pMT-ParB (ter) and GFP labelled
P1-ParB (ori) were grown anaerobically in AB minimal medium supplemented with glucose,
casamino acids and 1mM IPTG and shifted to aerobic growth. Cells were sampled for microscopy 2
hours after shift (for details see materials and methods).
A. ter foci visualized by mCherry.
B. ori foci visualized by GFP.
C. whole cells using the Differential interference contrast (DIC) technique.
A B C
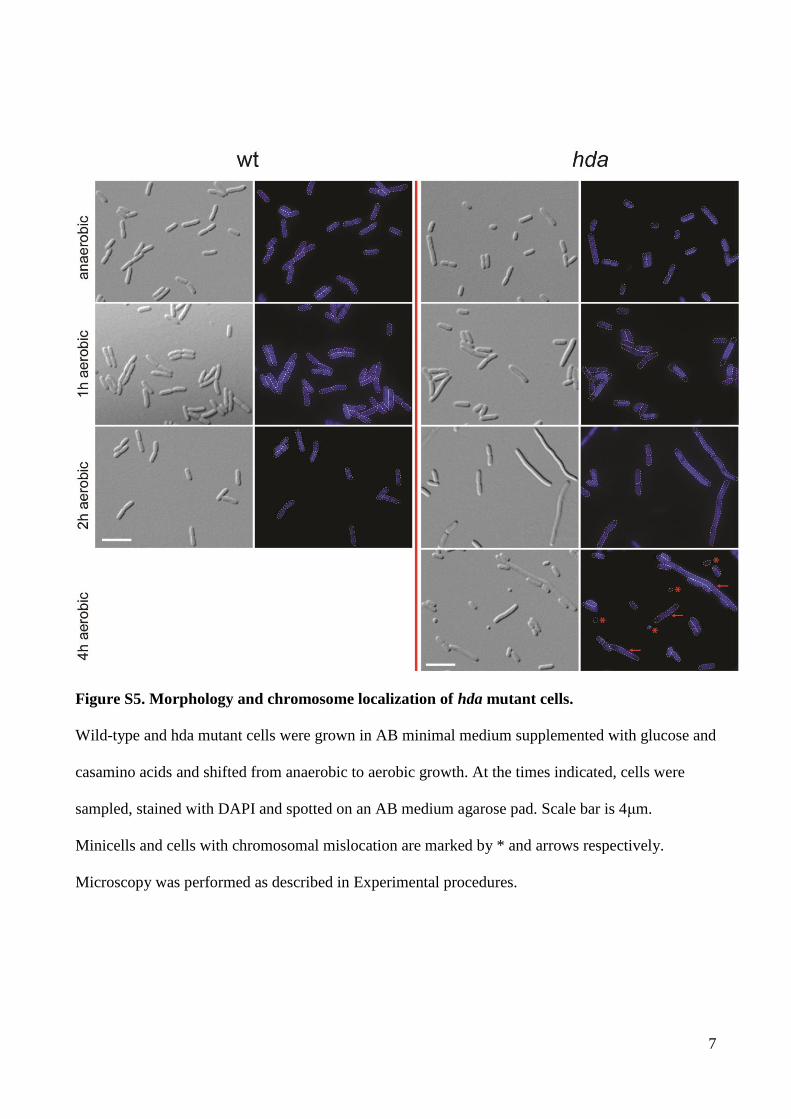
7
Figure S5. Morphology and chromosome localization of hda mutant cells.
Wild-type and hda mutant cells were grown in AB minimal medium supplemented with glucose and
casamino acids and shifted from anaerobic to aerobic growth. At the times indicated, cells were
sampled, stained with DAPI and spotted on an AB medium agarose pad. Scale bar is 4μm.
Minicells and cells with chromosomal mislocation are marked by * and arrows respectively.
Microscopy was performed as described in Experimental procedures.
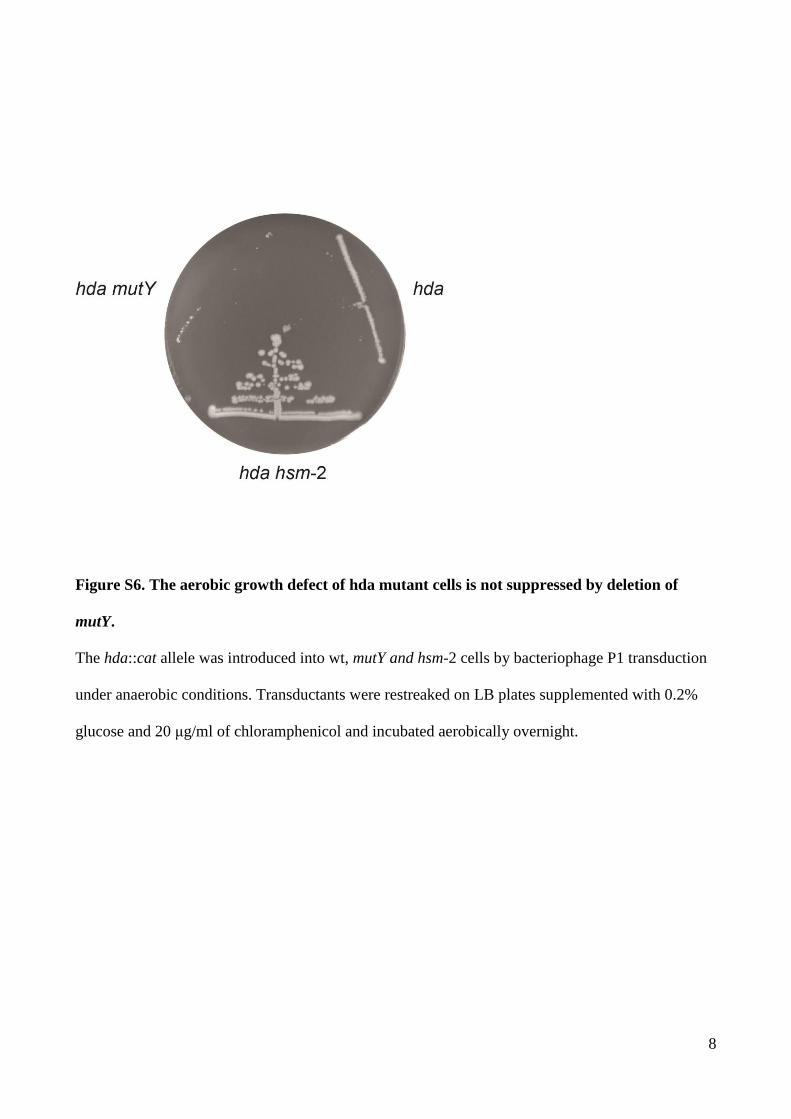
8
Figure S6. The aerobic growth defect of hda mutant cells is not suppressed by deletion of
mutY.
The hda::cat allele was introduced into wt, mutY and hsm-2 cells by bacteriophage P1 transduction
under anaerobic conditions. Transductants were restreaked on LB plates supplemented with 0.2%
glucose and 20 μg/ml of chloramphenicol and incubated aerobically overnight.
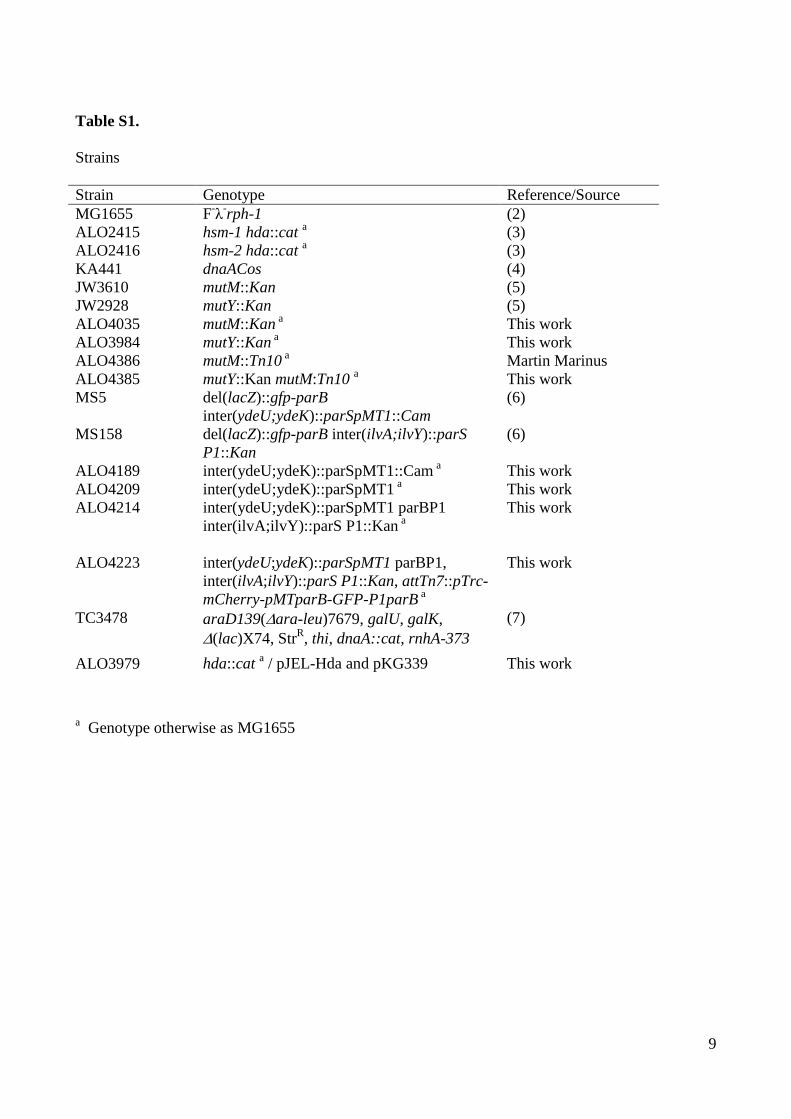
9
Table S1.
Strains
Strain Genotype Reference/Source
MG1655 F-λ
-rph-1 (2)
ALO2415 hsm-1 hda::cat a (3)
ALO2416 hsm-2 hda::cat a (3)
KA441 dnaACos (4)
JW3610 mutM::Kan (5)
JW2928 mutY::Kan (5)
ALO4035 mutM::Kan a This work
ALO3984 mutY::Kan a This work
ALO4386
ALO4385
mutM::Tn10 a
mutY::Kan mutM:Tn10 a
Martin Marinus
This work
MS5 del(lacZ)::gfp-parB
inter(ydeU;ydeK)::parSpMT1::Cam
(6)
MS158 del(lacZ)::gfp-parB inter(ilvA;ilvY)::parS
P1::Kan
(6)
ALO4189 inter(ydeU;ydeK)::parSpMT1::Cam a This work
ALO4209 inter(ydeU;ydeK)::parSpMT1 a This work
ALO4214 inter(ydeU;ydeK)::parSpMT1 parBP1
inter(ilvA;ilvY)::parS P1::Kan a
This work
ALO4223 inter(ydeU;ydeK)::parSpMT1 parBP1,
inter(ilvA;ilvY)::parS P1::Kan, attTn7::pTrc-
mCherry-pMTparB-GFP-P1parB a
This work
TC3478
araD139(ara-leu)7679, galU, galK,
(lac)X74, StrR, thi, dnaA::cat, rnhA-373
(7)
ALO3979 hda::cat a / pJEL-Hda and pKG339 This work
a Genotype otherwise as MG1655
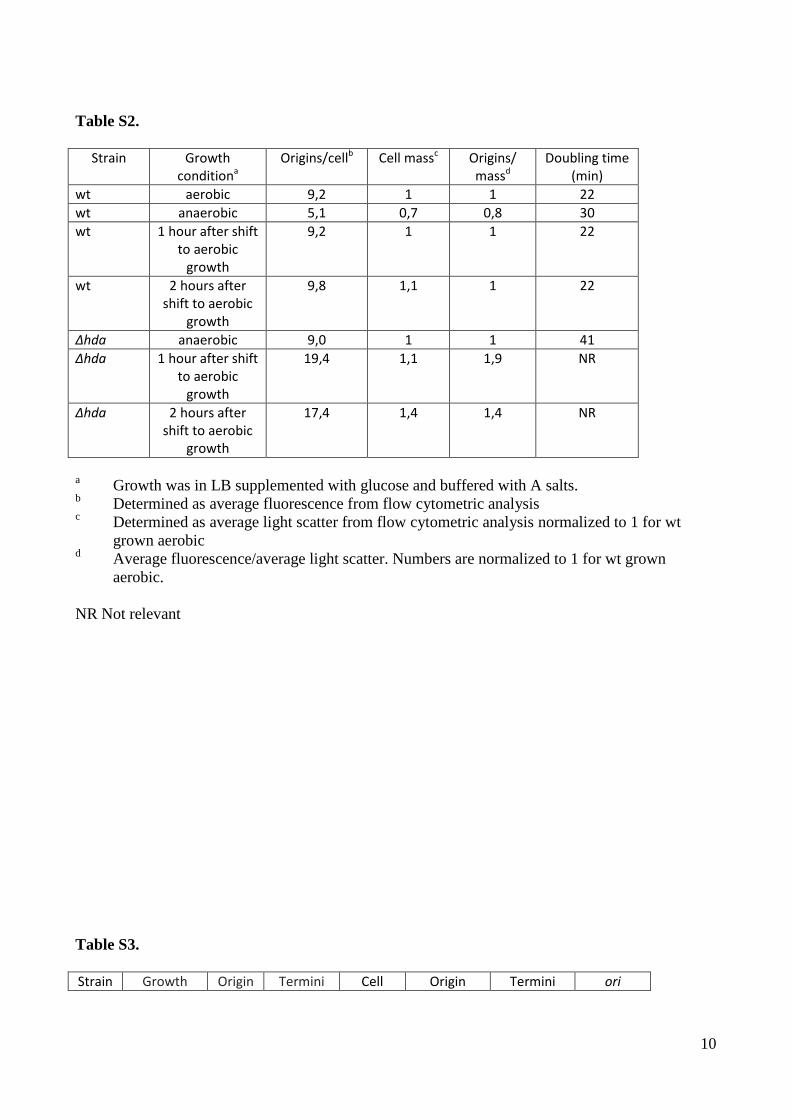
10
Table S2.
Strain Growth conditiona
Origins/cellb Cell massc Origins/ massd
Doubling time (min)
wt aerobic 9,2 1 1 22
wt anaerobic 5,1 0,7 0,8 30
wt 1 hour after shift to aerobic
growth
9,2 1 1 22
wt 2 hours after shift to aerobic
growth
9,8 1,1 1 22
Δhda anaerobic 9,0 1 1 41
Δhda 1 hour after shift to aerobic
growth
19,4 1,1 1,9 NR
Δhda 2 hours after shift to aerobic
growth
17,4 1,4 1,4 NR
a Growth was in LB supplemented with glucose and buffered with A salts.
b Determined as average fluorescence from flow cytometric analysis
c Determined as average light scatter from flow cytometric analysis normalized to 1 for wt
grown aerobic d Average fluorescence/average light scatter. Numbers are normalized to 1 for wt grown
aerobic.
NR Not relevant
Table S3.
Strain Growth Origin Termini Cell Origin Termini ori
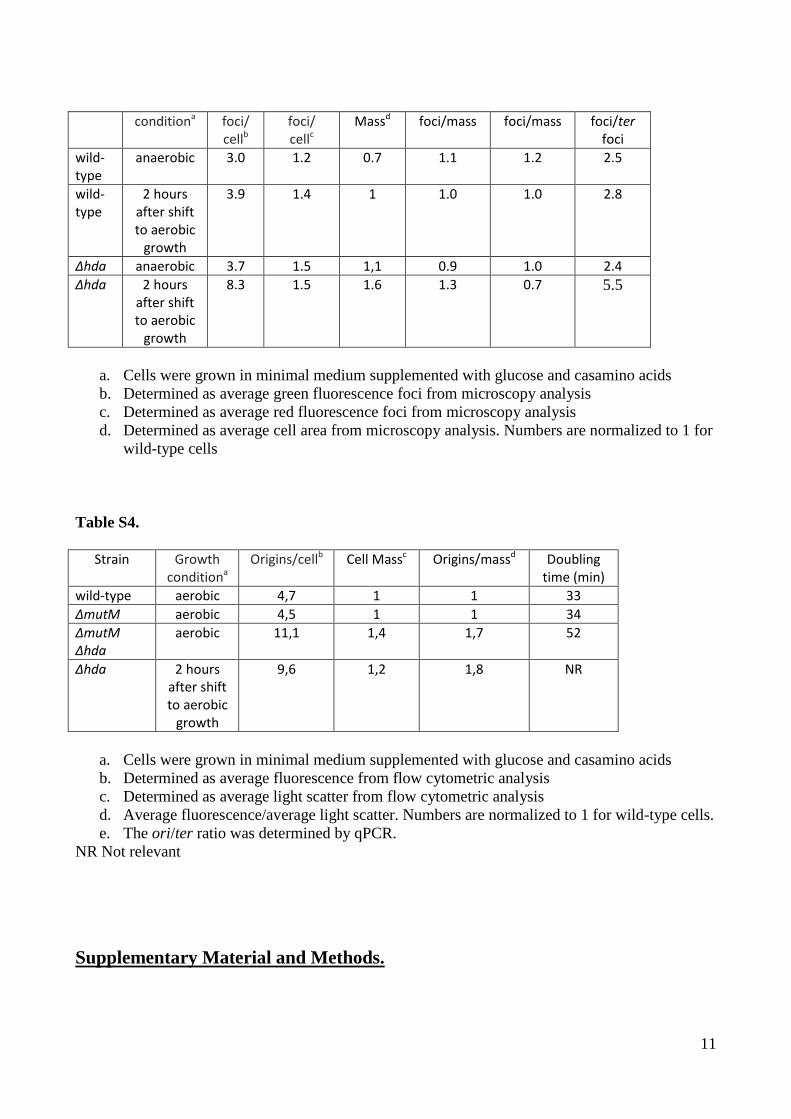
11
conditiona foci/ cellb
foci/ cellc
Massd foci/mass foci/mass foci/ter foci
wild-type
anaerobic 3.0 1.2 0.7 1.1 1.2 2.5
wild-type
2 hours after shift to aerobic
growth
3.9 1.4 1 1.0 1.0 2.8
Δhda anaerobic 3.7 1.5 1,1 0.9 1.0 2.4
Δhda 2 hours after shift to aerobic
growth
8.3 1.5 1.6 1.3 0.7 5.5
a. Cells were grown in minimal medium supplemented with glucose and casamino acids
b. Determined as average green fluorescence foci from microscopy analysis
c. Determined as average red fluorescence foci from microscopy analysis
d. Determined as average cell area from microscopy analysis. Numbers are normalized to 1 for
wild-type cells
Table S4.
Strain Growth conditiona
Origins/cellb Cell Massc Origins/massd Doubling time (min)
wild-type aerobic 4,7 1 1 33
ΔmutM aerobic 4,5 1 1 34
ΔmutM Δhda
aerobic 11,1 1,4 1,7 52
Δhda 2 hours after shift to aerobic
growth
9,6 1,2 1,8 NR
a. Cells were grown in minimal medium supplemented with glucose and casamino acids
b. Determined as average fluorescence from flow cytometric analysis
c. Determined as average light scatter from flow cytometric analysis
d. Average fluorescence/average light scatter. Numbers are normalized to 1 for wild-type cells.
e. The ori/ter ratio was determined by qPCR.
NR Not relevant
Supplementary Material and Methods.
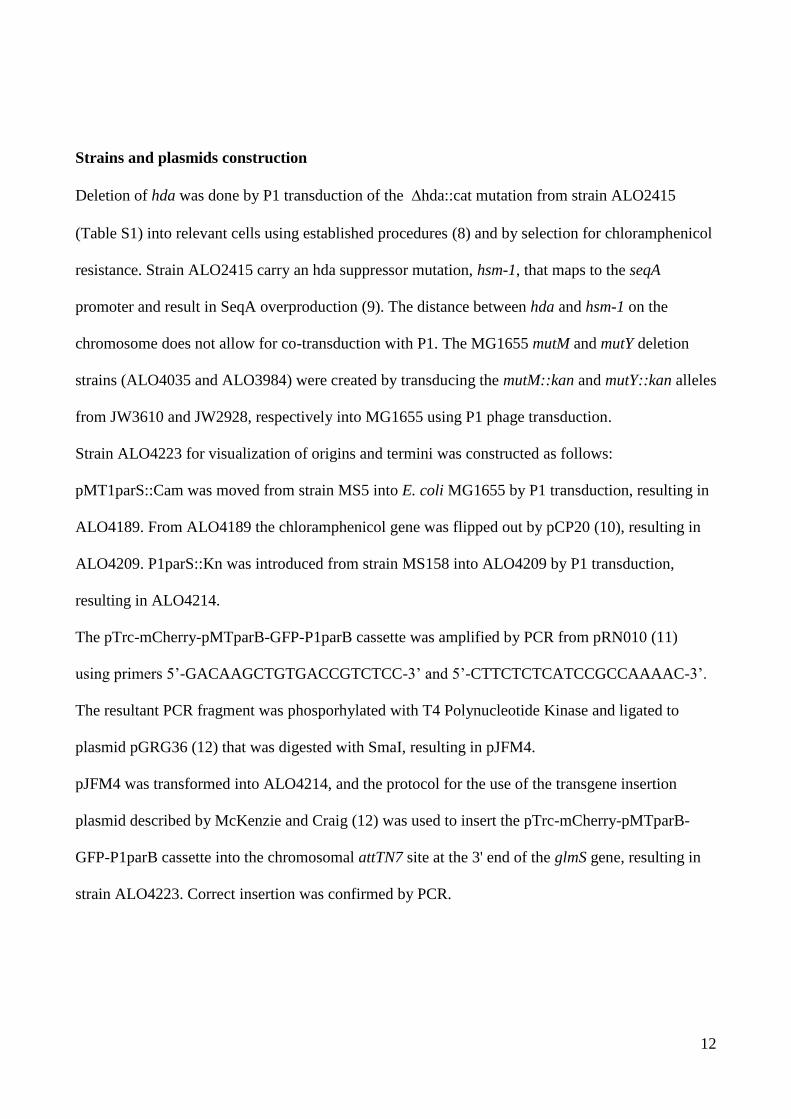
12
Strains and plasmids construction
Deletion of hda was done by P1 transduction of the hda::cat mutation from strain ALO2415
(Table S1) into relevant cells using established procedures (8) and by selection for chloramphenicol
resistance. Strain ALO2415 carry an hda suppressor mutation, hsm-1, that maps to the seqA
promoter and result in SeqA overproduction (9). The distance between hda and hsm-1 on the
chromosome does not allow for co-transduction with P1. The MG1655 mutM and mutY deletion
strains (ALO4035 and ALO3984) were created by transducing the mutM::kan and mutY::kan alleles
from JW3610 and JW2928, respectively into MG1655 using P1 phage transduction.
Strain ALO4223 for visualization of origins and termini was constructed as follows:
pMT1parS::Cam was moved from strain MS5 into E. coli MG1655 by P1 transduction, resulting in
ALO4189. From ALO4189 the chloramphenicol gene was flipped out by pCP20 (10), resulting in
ALO4209. P1parS::Kn was introduced from strain MS158 into ALO4209 by P1 transduction,
resulting in ALO4214.
The pTrc-mCherry-pMTparB-GFP-P1parB cassette was amplified by PCR from pRN010 (11)
using primers 5’-GACAAGCTGTGACCGTCTCC-3’ and 5’-CTTCTCTCATCCGCCAAAAC-3’.
The resultant PCR fragment was phosporhylated with T4 Polynucleotide Kinase and ligated to
plasmid pGRG36 (12) that was digested with SmaI, resulting in pJFM4.
pJFM4 was transformed into ALO4214, and the protocol for the use of the transgene insertion
plasmid described by McKenzie and Craig (12) was used to insert the pTrc-mCherry-pMTparB-
GFP-P1parB cassette into the chromosomal attTN7 site at the 3' end of the glmS gene, resulting in
strain ALO4223. Correct insertion was confirmed by PCR.
13
Plasmid pBR322-DARS2 was generated by ligating the DARS2 carrying HindIII - BamHI
fragment of pACYCDARS2 (9) into pBR322 digested with the same enzymes. Unless otherwise
indicated, plasmid pBR322-DARS2 was propagated in strain TC3478
To construct the R1 based plasmid pJEL-hda for hda depletion , the hda gene including promoter
was amplified from strain MG1655 using primers 5’-
CCAGAAGCTTAAGCACAGAACCTGATCCTG-3’ and 5’-
CCAGGGATCCGCGTAGTTCGGATA AGGCGT-3’. The PCR product was digested with
HindIII and BamHI and cloned into plasmid pJEL109 (13) digested with the same enzymes.
qPCR primers
The origins and termini were quantified using primers that amplified part of the gidA (5′-TTCGAT
CACCCCTGCGTACA-3′ and 5′-CGCAACAGCATGGCGA TAAC-3′) the dcp gene respectively
(5′-TTGAGCTGCGCCTCATCAAG-3′ and 5′-TCAACGTGCGAGCGATGAAT-3′) as previously
reported (3), while the middle region was quantified using primers that amplified part of the stpA
gene (5′- ATTGCTCAGGCGCTGGCAGA -3′ and 5′-TGCCGTGGAACCAACGAGCT -3′) .
To quantify the F plasmid pALO277, part of the kanamycin resistance gene was amplified using
previously reported primers qKNF (5′-CGGATGGAAGCCGGTCTTGTC-3′) and qKNR (5′-
AGAAGGCGATAGAAGGCGATG-3′) (14).
Hda depletion
In order to deplete Hda from aerobically growing cells, we used a conditional replication system
based on pKG339 that carries copA under lac promoter control (15). This system relies on the
replication control system of plasmid R1, where the copy number is negatively regulated by the
CopA antisense RNA. Hence, if CopA is overproduced from a co-resident plasmid, R1 replication
14
is blocked within a few minutes (16). We introduced the hda::cat mutation into wild-type cells
containing the R1 plasmid pJEL-hda. A further introduction of plasmid pKG339 resulted in strain
ALO3979.
Strain ALO3979 was grown AB minimal medium supplemented with glycerol, casamino acids,
tetracycline. In order to block the replication of pJEL-hda, 1 mM IPTG was added to the growth
medium. To maintain the cells in exponential growth, the cultures were diluted in fresh prewarmed
medium containing IPTG.
Supplementary References
Reference List
1. Riber,L. and Lobner-Olesen,A. (2005) Coordinated replication and sequestration of oriC and
dnaA are required for maintaining controlled once-per-cell-cycle initiation in Escherichia coli.
J Bacteriol, 187, 5605-5613.
2. Guyer,M.S., Reed,R.R., Steitz,J.A. and Low,K.B. (1981) Identification of a sex-factor-affinity
site in E. coli as gamma delta. Cold Spring Harb. Symp. Quant. Biol., 45, 135-140.
3. Riber,L., Olsson,J.A., Jensen,R.B., Skovgaard,O., Dasgupta,S., Marinus,M.G. and Lobner-
Olesen,A. (2006) Hda-mediated inactivation of the DnaA protein and dnaA gene
autoregulation act in concert to ensure homeostatic maintenance of the Escherichia coli
chromosome. Genes Dev., 20, 2121-2134.
4. Katayama,T. (1994) The mutant DnaAcos protein which overinitiates replication of the
Escherichia coli chromosome is inert to negative regulation for initiation. J Biol. Chem., 269,
22075-22079.
5. Baba,T., Ara,T., Hasegawa,M., Takai,Y., Okumura,Y., Baba,M., Datsenko,K.A., Tomita,M.,
Wanner,B.L. and Mori,H. (2006) Construction of Escherichia coli K-12 in-frame, single-gene
knockout mutants: the Keio collection. Mol. Syst. Biol., 2, 2006.
6. Stouf,M., Meile,J.C. and Cornet,F. (2013) FtsK actively segregates sister chromosomes in
Escherichia coli. Proc. Natl. Acad. Sci. U. S. A, 110, 11157-11162.
7. Ingmer,H. and Atlung,T. (1992) Expression and regulation of a dnaA homologue isolated
from Pseudomonas putida. Mol. Gen. Genet., 232, 431-439.
15
8. Miller,J.H. (1972) Experiments in Molecular Genetics. Cold Spring Harbor Laboratory, Cold
Spring Harbor, NY.
9. Charbon,G., Riber,L., Cohen,M., Skovgaard,O., Fujimitsu,K., Katayama,T. and Lobner-
Olesen,A. (2011) Suppressors of DnaA(ATP) imposed overinitiation in Escherichia coli. Mol.
Microbiol., 79, 914-928.
10. Cherepanov,P.P. and Wackernagel,W. (1995) Gene disruption in Escherichia coli: TcR and
KmR cassettes with the option of Flp-catalyzed excision of the antibiotic-resistance
determinant. Gene, 158, 9-14.
11. Kadoya,R. and Chattoraj,D.K. (2012) Insensitivity of chromosome I and the cell cycle to
blockage of replication and segregation of Vibrio cholerae chromosome II. MBio., 3.
12. McKenzie,G.J. and Craig,N.L. (2006) Fast, easy and efficient: site-specific insertion of
transgenes into enterobacterial chromosomes using Tn7 without need for selection of the
insertion event. BMC. Microbiol., 6, 39.
13. Løbner-Olesen,A., Boye,E. and Marinus,M.G. (1992) Expression of the Escherichia coli dam
gene. Mol. Microbiol., 6, 1841-1851.
14. Kettlun,C., Galvan,D.L., George,A.L., Jr., Kaja,A. and Wilson,M.H. (2011) Manipulating
piggyBac transposon chromosomal integration site selection in human cells. Mol. Ther., 19,
1636-1644.
15. Jensen,R.B., Grohmann,E., Schwab,H., Diaz-Orejas,R. and Gerdes,K. (1995) Comparison of
ccd of F, parDE of RP4, and parD of R1 using a novel conditional replication control system
of plasmid R1. Mol. Microbiol., 17, 211-220.
16. Kruse,T., Bork-Jensen,J. and Gerdes,K. (2005) The morphogenetic MreBCD proteins of
Escherichia coli form an essential membrane-bound complex. Mol. Microbiol., 55, 78-89.