Embed Size (px)
Citation preview

AbstractThe ability to extract RNA and prepare RNA sequencing (RNA-Seq) libraries from Formalin Fixed Paraffin Embedded (FFPE) tissues allows researchers to identify and validate new biomarkers of disease onset, progression, and therapy resistance. However, the typically poor quality of RNA derived from FFPE samples has previously limited use of this tissue source as a resource for transcriptome profiling and research by next generation sequencing (NGS)1.
Recently, when performing targeted enrichment of cDNA libraries, we have found that with protocol modifications of the Agilent Strand-Specific RNA Library Prep kit we can generate RNA-Seq data with minimal ribosomal contamination and good sequencing coverage. In this study, we used a set of matched fresh frozen (FF) and FFPE-derived RNA from tumor/normal samples to demonstrate that high-quality data can be derived from FFPE samples using a protocol that does not require upfront ribosomal depletion or poly(A) selection. When using the SureSelectXT RNA Direct protocol and the reagents from the SureSelectXT RNA Direct Kit, we found that transcripts were up regulated and down regulated to similar degrees with similar confidence levels in both the FF and FFPE samples, demonstrating the utility for meaningful gene expression studies with RNA stored in FFPE blocks.
SureSelectXT RNA Direct Protocol Provides Simultaneous Transcriptome Enrichment and Ribosomal Depletion of FFPE RNA
Application Note
AuthorsJennifer Carter Jones, Alex Siebold, and Anne Bergstrom Lucas

IntroductionIn much of the world, preserving tissue by formalin fixation followed by paraffin embedding of the tissue is the standard protocol for preserving tissue architecture for many traditional microscopy-based assays such as tissue staining. However, the fixation-induced crosslinking that is an asset in maintaining tissue architecture is not ideal for the preservation of nucleic acids within the tissue. RNA derived from FFPE can vary significantly in quality depending on the type of tissue that was preserved, how it was preserved, how long and/or well it was stored and the RNA extraction method. Often the poly(A) tails are not present in FFPE derived total RNA and methods used to isolate mRNA in RNA-Seq experiments frequently introduce significant bias.
To examine an alternative workflow for RNA transcription profiling, a quadruplicate set of matched FF and FFPE derived RNA from a matched pair of tumor/normal samples were processed with modifications to our SureSelect RNA Enrichment protocol. Based on the integrity of FFPE-derived RNA, appropriate modifications were made to create the high-quality libraries for targeted RNA sequencing. Changes to the standard workflow for FFPE-derived RNA include the amount of starting material to use, how long to fragment the samples, and how to adjust the PCR conditions and AMPure XP bead (Beckman Coulter Genomics) clean-up steps to maximize the amount of material that is being carried through the workflow. We demonstrate that the overall
alignment statistics are similar between the FFPE and FF samples, and a comparison of the tumor versus normal gene expression data shows a good correlation and concordance between the FF and FFPE exome-targeted samples.
Materials and MethodsRNA samplesWe obtained total RNA isolated from quadruplicate mirrored fresh frozen (FF) and FFPE samples from matched normal and malignant colon tissues from Asterand Technologies. We prepared three individual technical replicates for each of the four different mirrored RNA sample types: FF-Normal, FF-Tumor, FFPE-Normal, and FFPE-Tumor for a total of twelve libraries.Total RNA sample quality analysisMany RNA-Seq protocols recommend using an Agilent Bioanalyzer or an Agilent TapeStation to generate a RNA Integrity Number (RIN or RINe) for the RNA sample, with most protocols requiring a high-quality RIN value of 8.0 or greater. Unfortunately, total RNA derived from FFPE tissues
generate much lower RIN values and we have found that these low RIN values are not the best indicator of success with this new protocol. We have found that calculating the percentage of RNA fragments that are greater than 200 nt (DV200) to be a much more reliable indicator of FFPE sample quality2. When at least 20% of the fragments in the FFPE smear are greater than 200 nt, we recommend using 200 ng of total RNA input into each reaction. When using non-FFPE derived total RNA, we recommend starting with 100 ng of total RNA. These recommendations are captured in Table 1 below.
For this study, we used the Agilent 2100 Bioanalyzer with a Eukaryotic Total RNA Pico chip (5067-1513) and calculated RIN and DV200 values from the Bioanalyzer traces. The quality of the RNA samples was also analyzed with a NanoDrop spectrophotometer to obtain 260/280 and 260/230 absorbance ratios. Ideally both ratios should be as close to 2.0 as possible, and the NanoDrop concentration values are used to determine the nanogram amount of total RNA to add to the reaction.
Grade % RNA >200 nt Recommended input amount
Good FFPE RNA >50% 200 ng
Poor FFPE RNA 20% to 50% 200 ng
Inapplicable FFPE RNA <20% Not recommended for further processing
Intact (non-FFPE) RNA >70% 100 ng
Table 1. Recommendations for the total RNA input mass based on the fraction of RNA fragments that are greater than 200 nt. Ideally the FFPE samples should have at least 20% (DV200 >20%) of the fragments greater than 200 nt to use the RNA Direct workflow.
1
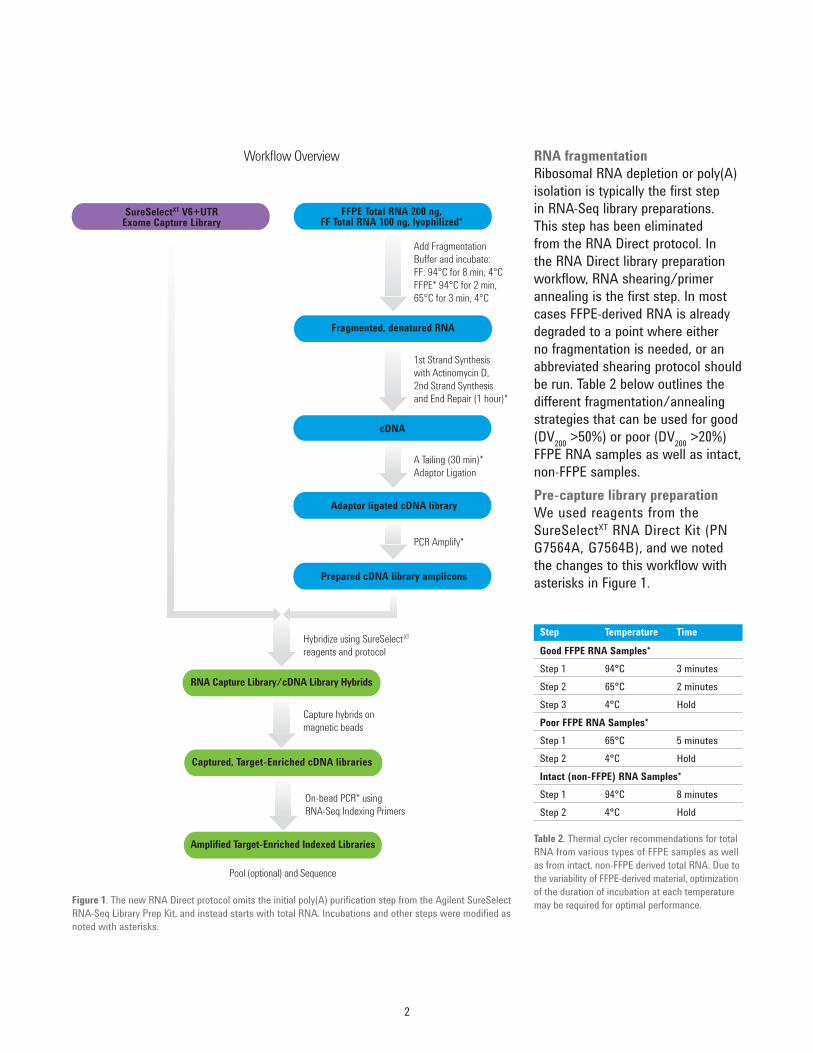
Figure 1. The new RNA Direct protocol omits the initial poly(A) purification step from the Agilent SureSelect RNA-Seq Library Prep Kit, and instead starts with total RNA. Incubations and other steps were modified as noted with asterisks.
SureSelectXT V6+UTRExome Capture Library
Amplified Target-Enriched Indexed Libraries
Pool (optional) and Sequence
Hybridize using SureSelect XT reagents and protocol
RNA Capture Library/cDNA Library Hybrids
Capture hybrids onmagnetic beads
Captured, Target-Enriched cDNA libraries
On-bead PCR* using RNA-Seq Indexing Primers
Fragmented, denatured RNA
Add Fragmentation Buffer and incubate:FF: 94°C for 8 min, 4°CFFPE* 94°C for 2 min, 65°C for 3 min, 4°C
cDNA
1st Strand Synthesis with Actinomycin D,2nd Strand Synthesis and End Repair (1 hour)*
Adaptor ligated cDNA library
A Tailing (30 min)*Adaptor Ligation
Prepared cDNA library amplicons
PCR Amplify*
FFPE Total RNA 200 ng, FF Total RNA 100 ng, lyophilized*
Workflow Overview
Step Temperature Time
Good FFPE RNA Samples*Step 1 94°C 3 minutesStep 2 65°C 2 minutesStep 3 4°C HoldPoor FFPE RNA Samples*Step 1 65°C 5 minutesStep 2 4°C HoldIntact (non-FFPE) RNA Samples*Step 1 94°C 8 minutesStep 2 4°C Hold
Table 2. Thermal cycler recommendations for total RNA from various types of FFPE samples as well as from intact, non-FFPE derived total RNA. Due to the variability of FFPE-derived material, optimization of the duration of incubation at each temperature may be required for optimal performance.
RNA fragmentationRibosomal RNA depletion or poly(A) isolation is typically the first step in RNA-Seq library preparations. This step has been eliminated from the RNA Direct protocol. In the RNA Direct library preparation workflow, RNA shearing/primer annealing is the first step. In most cases FFPE-derived RNA is already degraded to a point where either no fragmentation is needed, or an abbreviated shearing protocol should be run. Table 2 below outlines the different fragmentation/annealing strategies that can be used for good (DV200 >50%) or poor (DV200 >20%) FFPE RNA samples as well as intact, non-FFPE samples.Pre-capture library preparationWe used reagents from the SureSelectXT RNA Direct Kit (PN G7564A, G7564B), and we noted the changes to this workflow with asterisks in Figure 1.
2
Changes to the pre-capture portion of the SureSelectXT RNA Target Enrichment protocol include increasing the incubation time for the 2nd Strand Synthesis step to 60 minutes and increasing the A-tailing enzymatic reaction time to 30 minutes. We also increased the ratio of AMPure XP beads in the clean-up steps from a 1.2x volume to a 1.8x volume of beads. When performing the PCR amplification reaction of the adaptor-ligated cDNA library we used 14 cycles. The number of PCR cycles may need to be increased or decreased for different FFPE total RNA sample types. Capture and post-capture library preparationThe RNA Direct protocol requires 200 ng of cDNA input into each hybridization reaction. We used 5 µl of the 91 Mb SureSelect Human All Exon V6+UTRs (5190-8881) baits for each reaction and hybridized at 65°C for 24 hours. Another significant change in the RNA Direct protocol is the use of M-270 streptavidin beads (Thermo Fisher Scientific), instead of T1 streptavidin beads to capture the hybridized libraries. When using the M-270 beads to capture the biotinylated libraries we can omit the final elution step, and instead perform the PCR amplification of the captured libraries while still bound to the M-270 beads that have been resuspended in nuclease-free water. This “on-bead” PCR was performed with 19 µl (~half of the resuspended M-270 beads) for 12 cycles to amplify the captured libraries and add the unique index tags. The number of PCR cycles may need to be increased for different FFPE total RNA sample types using the other half of the M-270 streptavidin
beads to generate the ~10 nM concentration of final library needed for the sequencing steps.Next generation sequencing and data processingThe individual replicate samples were uniquely indexed and pooled post-capture and sequenced across two lanes on the Illumina HiSeq 2500 High Output (version 4 chemistry with 100 bp paired-end sequencing). The output from the HiSeq run was demultiplexed with bcl2fastq v1.8.2 generating fastq files that were trimmed and then aligned to hg19 with TopHat 2.0. We generated RNA-Seq quality control metrics by analyzing the TopHat BAM files using the RNA-SeQC tool developed by scientists at the Broad Institute4. The RNA-Seq data for each sample were normalized to 20 million reads for downstream gene expression comparisons. Differential gene expression analysisThe RNA-SeQC tool was used to generate a text file containing gene expression metrics measured as reads per kilobase of transcript per million mapped reads (RPKM) as mapped to Ensembl transcripts. The use of the RPKM metric normalizes a transcript’s read count by both gene length and total number of mapped reads in the sample. The RKPM measurement also accounts for the sources of variability between samples and genes. We used the Strand NGS software5 to analyze and visualize the RPKM gene expression data.
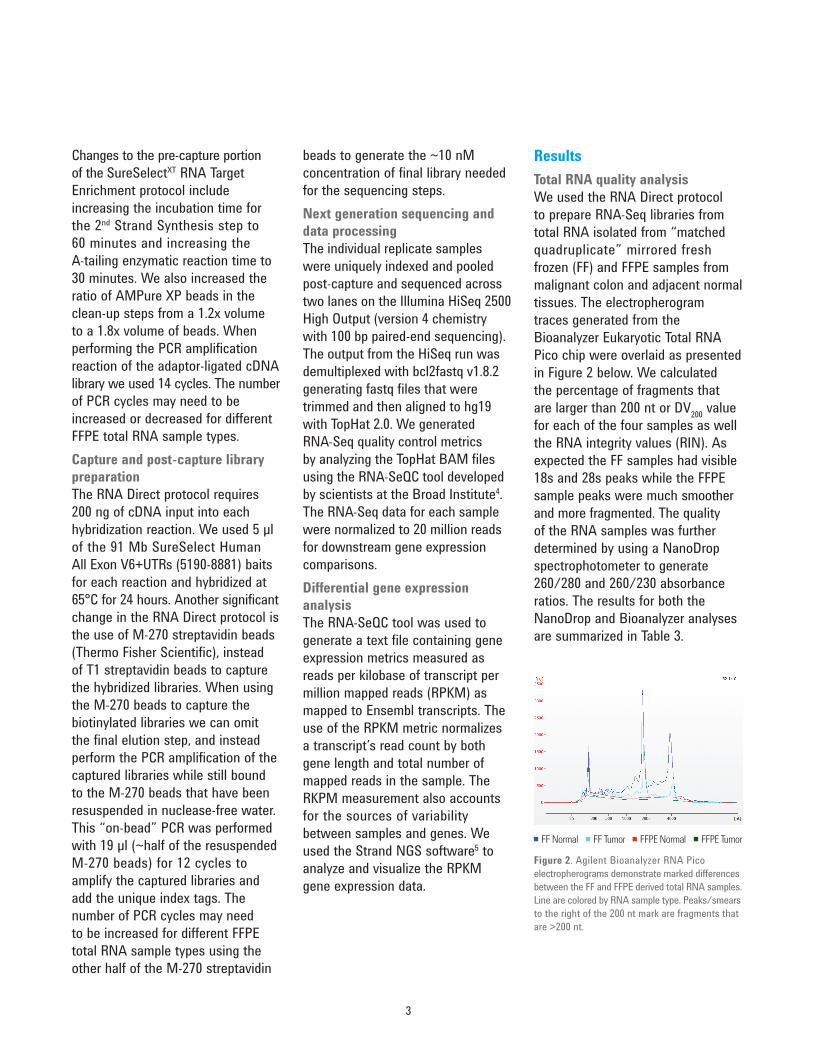
ResultsTotal RNA quality analysisWe used the RNA Direct protocol to prepare RNA-Seq libraries from total RNA isolated from “matched quadruplicate” mirrored fresh frozen (FF) and FFPE samples from malignant colon and adjacent normal tissues. The electropherogram traces generated from the Bioanalyzer Eukaryotic Total RNA Pico chip were overlaid as presented in Figure 2 below. We calculated the percentage of fragments that are larger than 200 nt or DV200 value for each of the four samples as well the RNA integrity values (RIN). As expected the FF samples had visible 18s and 28s peaks while the FFPE sample peaks were much smoother and more fragmented. The quality of the RNA samples was further determined by using a NanoDrop spectrophotometer to generate 260/280 and 260/230 absorbance ratios. The results for both the NanoDrop and Bioanalyzer analyses are summarized in Table 3.
Figure 2. Agilent Bioanalyzer RNA Pico electropherograms demonstrate marked differences between the FF and FFPE derived total RNA samples. Line are colored by RNA sample type. Peaks/smears to the right of the 200 nt mark are fragments that are >200 nt.
FF Normal FF Tumor FFPE Normal FFPE Tumor
3

uniquely indexed using 19 µl of the libraries bound to the M-270 beads. We performed 12 PCR cycles for this final amplification step. The indexed and amplified libraries were purified using AMPure XP beads and the final cDNA post-capture libraries were measured on a HSD1000 tape on the Agilent TapeStation 4200. An example of a electropherogram trace for one of the FFPE samples is shown in Figure 3.
Pre-capture sample preparation resultsSince both the FFPE and the FF total RNA samples had DV200 values that were >70%, we lyophilized 200 ng of FFPE total RNA and 100 ng of intact FF total RNA. The lyophilized samples were resuspended in 19 µl fragmentation buffer. Based on the fragmentation/annealing reaction conditions described in Table 1, the FFPE RNA was identified as “Good FFPE RNA” and the FF RNA as “Intact (non FFPE)” and the recommended incubation conditions in Table 1 were applied. The fragmented/denatured RNA with the annealed primers were used to make libraries following the modifications of the RNA Direct protocol that include the longer 2nd Strand Synthesis and A-tailing steps. The ratio of AMPure XP beads added to the clean-up steps was increased to 1.8x the volume of the reactions. The pre-capture amplification step was carried out for 14 cycles and aliquots of the pre-capture cDNA libraries were run on a D1000 tape on the Agilent TapeStation 4200. An example of a electropherogram trace for one of the FFPE samples is shown in Figure 3. Following the RNA Direct protocol, we obtained enough cDNA from each of the 12 samples to move forward with the targeted capture as shown in Figure 4.
Post-capture sample preparation resultsAfter hybridizing for 24 hours at 65°C with the SureSelect Human All Exon V6+UTRs baits, the hybridized libraries were captured with M-270 streptavidin beads. The final elution steps of the standard targeted RNA-Seq protocol were omitted and the M-270 beads were resuspended in 40 µl nuclease-free water.
The libraries were amplified and
Sample A260/A280 RIN DV200
FF Normal 1.96 6.7 85%
FF Tumor 2.10 6.1 74%
FFPE Normal 1.93 2.3 75%
FFPE Tumor 1.93 2.3 74%
Table 3. RNA quality metrics for the FF and FFPE total RNA samples
4
Figure 3. Agilent 4200 TapeStation traces using D1000 screen tapes for pre-capture PCR analysis (left) and HSD1000 screen tapes for the post-capture PCR sample analysis (right). Both are traces from the FFPE_N_B02 technical replicate sample but are representative of all of the samples.
Representative Agilent TapeStation 4200 electropherograms with a FFPE-derived sample:
Figure 4. Pre-capture library yield comparisons of technical replicates when using 100 ng total RNA input for the FF samples and 200 ng total RNA input for the FFPE samples. While there are some differences in yield between the technical replicates, the FF samples gave higher yields than the matched FFPE samples even when half the amount of total RNA was used in sample preparation. The red line on the graph indicates the minimum yield necessary (200 ng) to continue with the hybridization capture step.
Pre-Capture PCR Yields: Tumor vs Normal, FF vs FFPE (200 ng Needed for Capture)
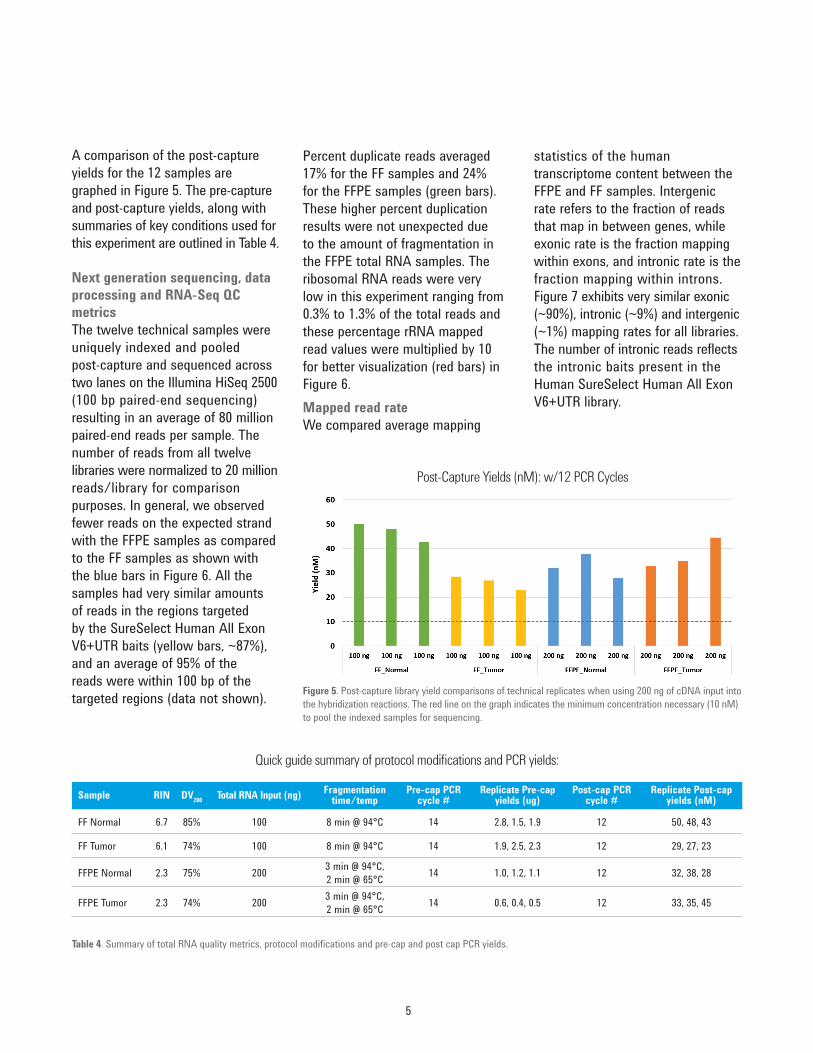
Percent duplicate reads averaged 17% for the FF samples and 24% for the FFPE samples (green bars). These higher percent duplication results were not unexpected due to the amount of fragmentation in the FFPE total RNA samples. The ribosomal RNA reads were very low in this experiment ranging from 0.3% to 1.3% of the total reads and these percentage rRNA mapped read values were multiplied by 10 for better visualization (red bars) in Figure 6.Mapped read rateWe compared average mapping
A comparison of the post-capture yields for the 12 samples are graphed in Figure 5. The pre-capture and post-capture yields, along with summaries of key conditions used for this experiment are outlined in Table 4.
Next generation sequencing, data processing and RNA-Seq QC metricsThe twelve technical samples were uniquely indexed and pooled post-capture and sequenced across two lanes on the Illumina HiSeq 2500 (100 bp paired-end sequencing) resulting in an average of 80 million paired-end reads per sample. The number of reads from all twelve libraries were normalized to 20 million reads/library for comparison purposes. In general, we observed fewer reads on the expected strand with the FFPE samples as compared to the FF samples as shown with the blue bars in Figure 6. All the samples had very similar amounts of reads in the regions targeted by the SureSelect Human All Exon V6+UTR baits (yellow bars, ~87%), and an average of 95% of the reads were within 100 bp of the targeted regions (data not shown). Figure 5. Post-capture library yield comparisons of technical replicates when using 200 ng of cDNA input into
the hybridization reactions. The red line on the graph indicates the minimum concentration necessary (10 nM) to pool the indexed samples for sequencing.
Post-Capture Yields (nM): w/12 PCR Cycles
Table 4. Summary of total RNA quality metrics, protocol modifications and pre-cap and post cap PCR yields.
Quick guide summary of protocol modifications and PCR yields:
5
statistics of the human transcriptome content between the FFPE and FF samples. Intergenic rate refers to the fraction of reads that map in between genes, while exonic rate is the fraction mapping within exons, and intronic rate is the fraction mapping within introns. Figure 7 exhibits very similar exonic (~90%), intronic (~9%) and intergenic (~1%) mapping rates for all libraries. The number of intronic reads reflects the intronic baits present in the Human SureSelect Human All Exon V6+UTR library.
Sample RIN DV200 Total RNA Input (ng) Fragmentation time/temp
Pre-cap PCR cycle #
Replicate Pre-cap yields (ug)
Post-cap PCR cycle #
Replicate Post-cap yields (nM)
FF Normal 6.7 85% 100 8 min @ 94°C 14 2.8, 1.5, 1.9 12 50, 48, 43
FF Tumor 6.1 74% 100 8 min @ 94°C 14 1.9, 2.5, 2.3 12 29, 27, 23
FFPE Normal 2.3 75% 200 3 min @ 94°C, 2 min @ 65°C 14 1.0, 1.2, 1.1 12 32, 38, 28
FFPE Tumor 2.3 74% 200 3 min @ 94°C, 2 min @ 65°C 14 0.6, 0.4, 0.5 12 33, 35, 45
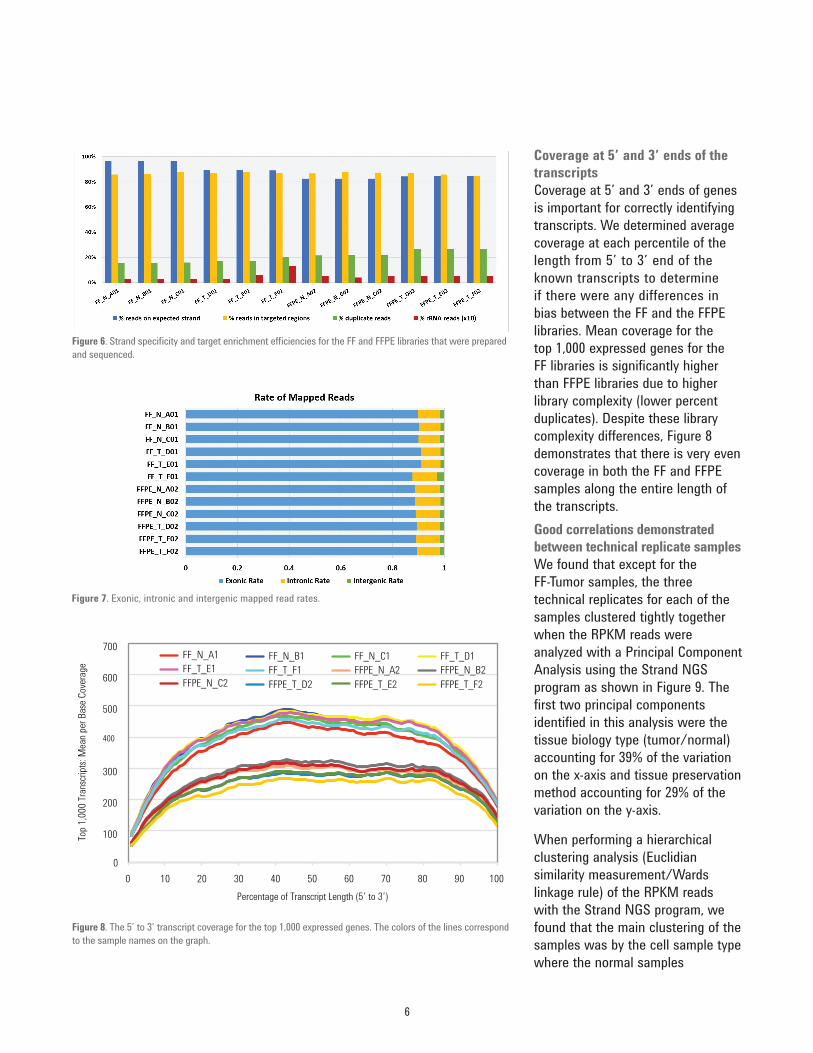
Figure 6. Strand specificity and target enrichment efficiencies for the FF and FFPE libraries that were prepared and sequenced.
Figure 7. Exonic, intronic and intergenic mapped read rates.
6
Figure 8. The 5’ to 3’ transcript coverage for the top 1,000 expressed genes. The colors of the lines correspond to the sample names on the graph.
0
100
200
300
400
500
600
700
0 10 20 30 40 50 60 70 80 90 100
Top 1
,000
Tran
scrip
ts: M
ean p
er B
ase C
over
age
Percentage of Transcript Length (5’ to 3’)
FF_N_A1 FF_N_B1 FF_N_C1 FF_T_D1FF_T_E1 FF_T_F1 FFPE_N_A2 FFPE_N_B2FFPE_N_C2 FFPE_T_D2 FFPE_T_E2 FFPE_T_F2
Coverage at 5’ and 3’ ends of the transcriptsCoverage at 5’ and 3’ ends of genes is important for correctly identifying transcripts. We determined average coverage at each percentile of the length from 5’ to 3’ end of the known transcripts to determine if there were any differences in bias between the FF and the FFPE libraries. Mean coverage for the top 1,000 expressed genes for the FF libraries is significantly higher than FFPE libraries due to higher library complexity (lower percent duplicates). Despite these library complexity differences, Figure 8 demonstrates that there is very even coverage in both the FF and FFPE samples along the entire length of the transcripts.Good correlations demonstrated between technical replicate samplesWe found that except for the FF-Tumor samples, the three technical replicates for each of the samples clustered tightly together when the RPKM reads were analyzed with a Principal Component Analysis using the Strand NGS program as shown in Figure 9. The first two principal components identified in this analysis were the tissue biology type (tumor/normal) accounting for 39% of the variation on the x-axis and tissue preservation method accounting for 29% of the variation on the y-axis.
When performing a hierarchical clustering analysis (Euclidian similarity measurement/Wards linkage rule) of the RPKM reads with the Strand NGS program, we found that the main clustering of the samples was by the cell sample type where the normal samples

Figure 9. Principal component analysis indicates tight technical replicate correlations and clear separation of the samples by cell biology (tumor/normal status) and tissue preservation method (FFPE/FF).
clustered on a different branch from the tumor samples regardless of FFPE or FF storage condition as shown in Figure 10. The second level of clustering after the sample type was by storage condition where the FF and FFPE samples were on different branches. The hierarchical clustering also shows that while there are many transcripts that have similar expression levels between the sample types and storage conditions, there are also clear differences that correlate to the normal or tumor sample type.Similar Gene Expression Results for the FF and FFPE SamplesWe observed a very high correlation of tumor versus normal log2 ratios for 75,263 Ensembl transcripts that had at least a fraction of a mapped read (RPKM >0) across all replicate samples. The significance of the fold-change (tumor versus normal) is shown in the volcano plots in Figure 11 where the log2 fold change values are plotted on the x-axis and the negative log10 corrected p-values are plotted on the y-axis. Transcripts that are significantly expressed (Benjamini Hochberg multiple testing corrected p-value of <0.05, horizontal green line) with a two-fold change in expression (vertical green lines) are colored red, with the number of significantly expressed transcripts for each storage condition indicated in red on the graph in Figure 11.
To further illustrate the high correlation of gene expression ratio concordance between the FF and FFPE stored total RNA samples, the log2 ratios of the tumor/normal fold change that were plotted on the x-axis in the two volcano plots
Figure 10. Hierarchical clustering analysis of RPKM expression results indicate that the biological difference between the samples (tumor versus normal) is stronger than the differences between the FFPE and FF tissue storage methods when the first level of clustering is on sample type and not storage condition.
Figure 11. Volcano plot analysis of significant fold-change where the x-axis delineates the tumor versus normal log2 fold change and the y-axis delineates the significance of the fold change. Points colored red are genes that are >2-fold expression at a corrected p-value of >0.05. The vertical green lines on the graphs delineate two-fold change in expression and the horizontal green line delineates the p-value cutoff of 0.05.
7
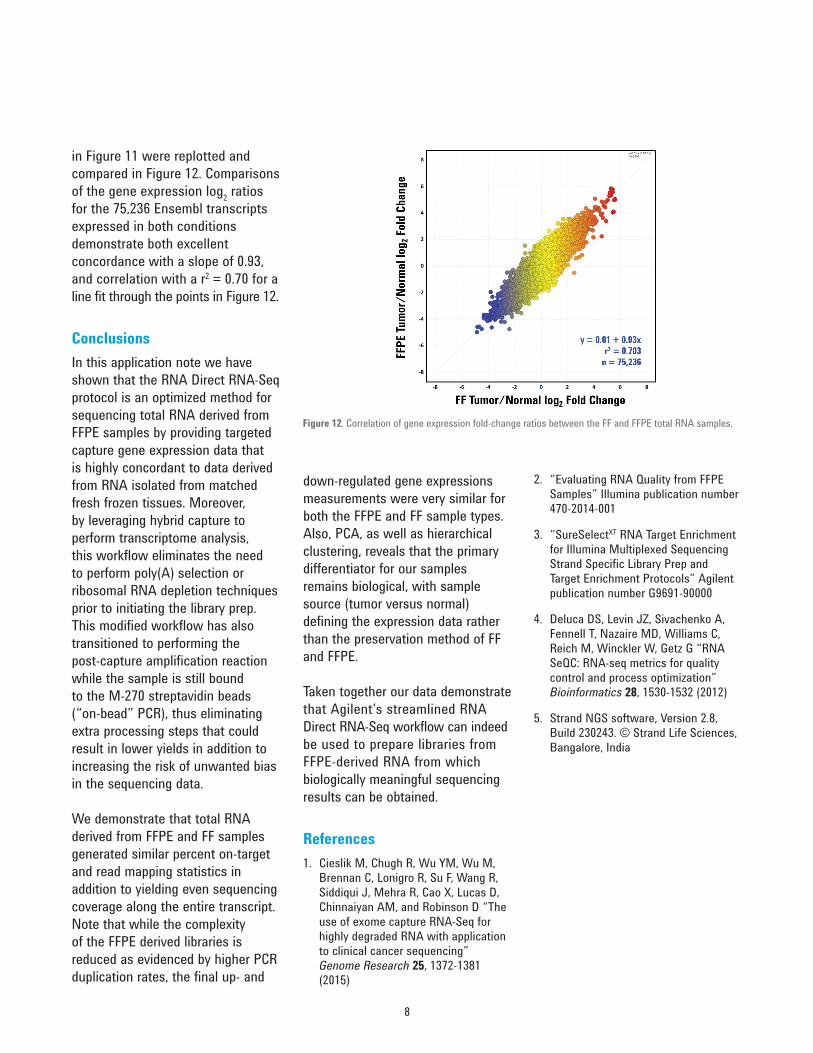
Figure 12. Correlation of gene expression fold-change ratios between the FF and FFPE total RNA samples.
in Figure 11 were replotted and compared in Figure 12. Comparisons of the gene expression log2 ratios for the 75,236 Ensembl transcripts expressed in both conditions demonstrate both excellent concordance with a slope of 0.93, and correlation with a r2 = 0.70 for a line fit through the points in Figure 12.
ConclusionsIn this application note we have shown that the RNA Direct RNA-Seq protocol is an optimized method for sequencing total RNA derived from FFPE samples by providing targeted capture gene expression data that is highly concordant to data derived from RNA isolated from matched fresh frozen tissues. Moreover, by leveraging hybrid capture to perform transcriptome analysis, this workflow eliminates the need to perform poly(A) selection or ribosomal RNA depletion techniques prior to initiating the library prep. This modified workflow has also transitioned to performing the post-capture amplification reaction while the sample is still bound to the M-270 streptavidin beads (“on-bead” PCR), thus eliminating extra processing steps that could result in lower yields in addition to increasing the risk of unwanted bias in the sequencing data.
We demonstrate that total RNA derived from FFPE and FF samples generated similar percent on-target and read mapping statistics in addition to yielding even sequencing coverage along the entire transcript. Note that while the complexity of the FFPE derived libraries is reduced as evidenced by higher PCR duplication rates, the final up- and
8
down-regulated gene expressions measurements were very similar for both the FFPE and FF sample types. Also, PCA, as well as hierarchical clustering, reveals that the primary differentiator for our samples remains biological, with sample source (tumor versus normal) defining the expression data rather than the preservation method of FF and FFPE.
Taken together our data demonstrate that Agilent’s streamlined RNA Direct RNA-Seq workflow can indeed be used to prepare libraries from FFPE-derived RNA from which biologically meaningful sequencing results can be obtained.
References1. Cieslik M, Chugh R, Wu YM, Wu M,
Brennan C, Lonigro R, Su F, Wang R, Siddiqui J, Mehra R, Cao X, Lucas D, Chinnaiyan AM, and Robinson D “The use of exome capture RNA-Seq for highly degraded RNA with application to clinical cancer sequencing” Genome Research 25, 1372-1381 (2015)
2. “Evaluating RNA Quality from FFPE Samples” Illumina publication number 470-2014-001
3. “SureSelectXT RNA Target Enrichment for Illumina Multiplexed Sequencing Strand Specific Library Prep and Target Enrichment Protocols” Agilent publication number G9691-90000
4. Deluca DS, Levin JZ, Sivachenko A, Fennell T, Nazaire MD, Williams C, Reich M, Winckler W, Getz G “RNA SeQC: RNA-seq metrics for quality control and process optimization” Bioinformatics 28, 1530-1532 (2012)
5. Strand NGS software, Version 2.8, Build 230243. © Strand Life Sciences, Bangalore, India

9

10
LEARN MORE AT: www.agilent.com/genomics
Find an Agilent customer center in your country: www.agilent.com/genomics/contactus
U.S. and Canada [email protected]
Asia [email protected]
For Research Use Only. Not for use in diagnostic procedures.
Trusted Answers. Together.
PR7000-0679© Agilent Technologies, Inc., 2017 Published in the USA, May 24, 2017 5991-8119EN