Embed Size (px)
Citation preview

Surface Accuracy Analysis of Single Panels for the Shanghai 65-M
Radio Telescope
LI FU
Shanghai Astronomical Observatory, Chinese Academy of Sciences, Shanghai
CHINA
Key Laboratory of Radio Astronomy, Chinese Academy of Sciences, Nanjing
CHINA
GUOXI LIU, CHAO JIN,
FENG YAN
54th Research Institute of China Electronics Technology Group Corporation, Shijiazhuang
CHINA
TAO AN, ZHIQIANG SHEN
Shanghai Astronomical Observatory, Chinese Academy of Sciences, Shanghai
CHINA
Key Laboratory of Radio Astronomy, Chinese Academy of Sciences, Nanjing
CHINA
Abstract: - We presented the surface accuracy measurements of 5 single panels of the Shanghai 65-meter radio
telescope by employing the coordinate measuring machine and laser tracker. The measurement data obtained
from the two instruments were analyzed with the common point transformation and CAD surface fitting
techniques, respectively. The derived rms uncertainties of panel accuracy from two methods are consistent with
each other, and both match the design specification. The simulations of the effects of manufacturing error,
gravity, temperature and wind on the panel surface accuracy with the finite element analysis method suggest
that the first two factors account for primary sources of the accuracy uncertainty. The panel deformation under
concentrated load was analyzed through finite element analysis and experiment, and the comparison error is
5.6%. There is not plastic deformation when people of weight below 70kg installs and remedies the panel.
Key-Words: - antennas, finite element methods, measurement, accuracy, panel
1. Introduction The surface of a large millimeter-wavelength
radio telescope has to be measured and calibrated to
a very high accuracy in order to guarantee a high
efficiency. The largest solid-panel radio telescopes
in the world, the Robert C. Byrd Green Bank
Telescope (GBT) of the US, the Effelsberg radio
telescope of the Germany, the Sardinia Radio
Telescope (SRT) of the Italy, and the Shanghai 65-
meter Radio Telescope (in brief, Sh65RT hereafter)
of the China, are all composed of high-accuracy
panels.
The GBT is a 100-meter diameter offset-
paraboloid Gregorian reflector radio telescope
operating in the frequency range from 290MHz to
100GHz. The primary reflector consists of 2004
small trapezoidal shaped panels (on average, 3.9m2
each) and the average accuracy of individual panels
is 68μm [1].
The Effelsberg 100-meter radio telescope works
in the frequency range from 0.3 to 95.5GHz. The
primary reflector consists of 2353 panels and the
overall mirror surface accuracy is slightly less than
0.5mm. The inner cycles (diameter < 60m) are made
of aluminum honeycomb panels, and the rms (root
mean square) deviations of this honeycomb-type
sector give a mean value of 0.22mm. The
intermediate diameter range of 60-85m is composed
of aluminum “cassette” panel and the rms is
0.27mm. The outer rings (diameter > 85m) are made
up of stainless steel mesh with thickness of 6 mm2,
WSEAS TRANSACTIONS on APPLIED and THEORETICAL MECHANICSLi Fu, Guoxi Liu, Chao Jin, Feng Yan
Tao An, Zhiqiang Shen
E-ISSN: 2224-3429 54 Volume 10, 2015
and the surface deviations are up to 0.55mm (rms)
[2].
The SRT is a shaped Gregorian 64-meter radio
telescope recently completed in Sardinian Island in
Italy. The frequency band continuously covers from
300MHz to 100GHz. The primary mirror composed
of 1008 panels distributed on 14 rings [3]. The
manufacturing error of individual panel is about
65μm, the thermal-induced error 11μm, the gravity-
induced error 29μm and the wind-induce error 4μm
[4].
GBT and Effelsberg radio telescopes have
achieved a lot of profound-impact scientific results
[5,6] and SRT is conducting commissioning
observations [7]. All these advanced sciences
depend on high-sensitivity observations which in
turn rely on the large high-accuracy reflectors.
Although the generic antenna structure design [8],
overall reflector accuracy and alignment of panels
[9] are important for maintaining the perfect
parabolic surface, the surface accuracy of single
panels is also of essential importance. In this paper,
we report the surface accuracy measurements of
single panels of the Sh65RT. The two different
measurement methods and the data processing
methods are described in section 2. In section 3, the
measurement data combined to the finite element
analysis (FEA) data are used to calculate the rms
value of the manufacturing error using the common
point coordinate transformation and CAD surface
fitting techniques. The effects of manufacturing
error, gravity, temperature and wind on panel
precision are evaluated with the FEA method. We
also discuss the effect of concentrated load on panel
deflection in section 4.
2. Measurements and Data Analysis of
Panel Surface Accuracy
2.1 Measurement methods
The panel surface accuracy of Sh65RT was
measured independently with two different
instruments and techniques, the coordinate
measuring machine and laser tracker.
2.1.1 Coordinate measuring machine
The primary reflector of the Sh65RT showed in
Figure 1 consists of 1008 panels distributed in 14
rings. The targets to measure are from different
sectors of the shaped reflector surface and the
largest area is about 5m2. As shown in Figure 2,
the panel is formed by steel frame supporting the
aluminum sheet, and is placed on four supports.
Before the measurements, the panels have been
placed in a room with constant temperature (20ºC)
for longer than eight hours.
Fig. 1 The 3D model of Sh65RT
First we used coordinate measuring machine
(CMM) for the panel surface accuracy measurement.
According to the dimension of the single panel and
accuracy required, ALPHA IMAGE 25.50.18 CMM
was adopted. The work environment temperature of
this instrument is 20ºC and the precision is
(8.0+8.0L/1000)μm.
Fig. 2 The measurement of panel under CMM.
Ideally, we set four panel corners to the
designed paraboloid by adjusting the supporting
screws near each corner so as to separate the panel
error from the backup structure (BUS) error. But, a
different way to accept a panel is to measure the
panel in the factory. We need to duplicate what we
define above. First, we established the panel
coordinate system. Reference surface is defined by
four corner points close to the installing holes. The y
axis is perpendicular to the reference surface. One
side of the panel was projected on the reference
surface to form the z axis. The coordinate origin is
set to a point on the line connecting z axis and y axis.
Next, we switched the reflector coordinate system to
the panel coordinate system. The four corner points
were repeatedly measured and adjusted to ensure
WSEAS TRANSACTIONS on APPLIED and THEORETICAL MECHANICSLi Fu, Guoxi Liu, Chao Jin, Feng Yan
Tao An, Zhiqiang Shen
E-ISSN: 2224-3429 55 Volume 10, 2015
that all four corners fell at y=0. Finally, according to
the preassigned points on the ideal model, operators
manually controlled the CMM to determine the
relative positions of other measuring points.
2.1.2 Laser tracker
Laser tracker is a portable precision metrology
tool enabling to achieve accuracy as high as 5μm/m.
The T3-60 system was adopted in our measurements.
It composes of a laser tracker and a spherically
mounted retroreflector which emits the laser beam.
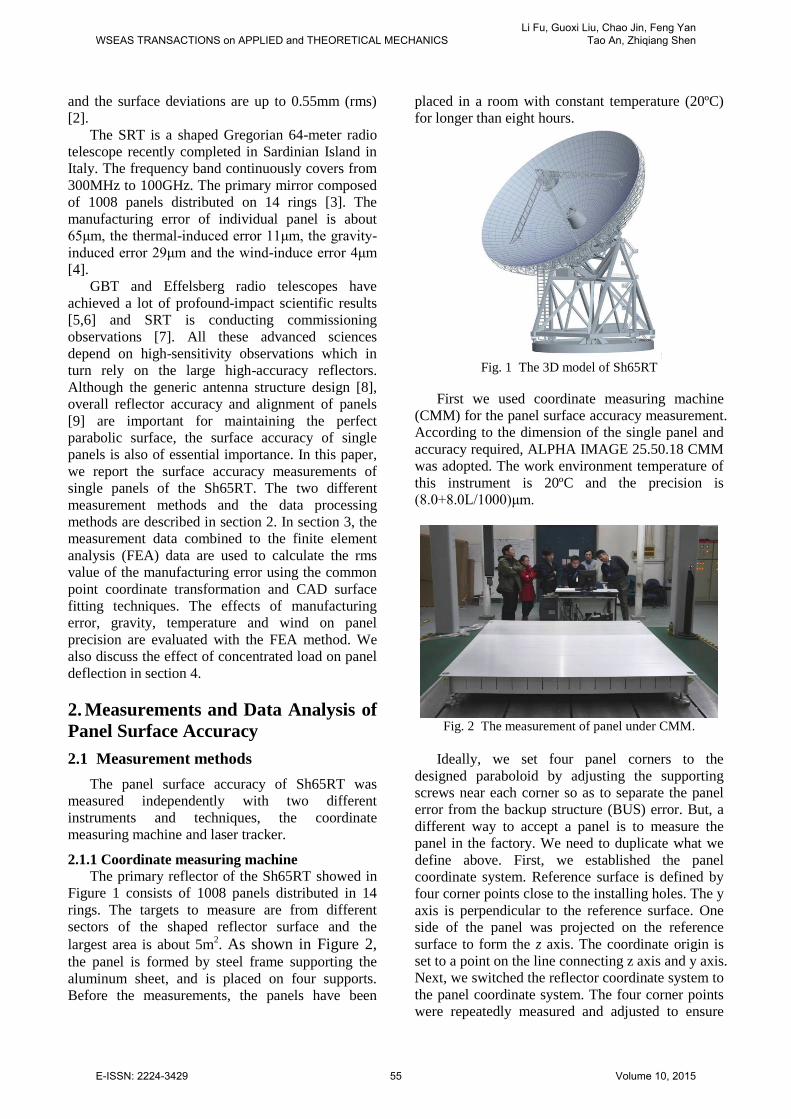
As shown in Figure 3, the same panels used in
above experiment were measured by the laser
tracker under the same work environment. The
positions of spherically mounted retroreflector are
the measuring points which obey the principle of
distribution of equal areas and the distance of two
consecutive points is between 50mm and 100mm.
Firstly, we set reasonable position between the
laser tracker and panel. After the instrumentation
turned on for half an hour, the panel can be
measured. The environment temperature and
pressure during preheating were recorded. The four
corner points were also repeatedly measured and
adjusted to ensure the corner points lie on a same
plane. More than 400 points have been measured.
Fig. 3 The measurement of panel under Laser Tracker.
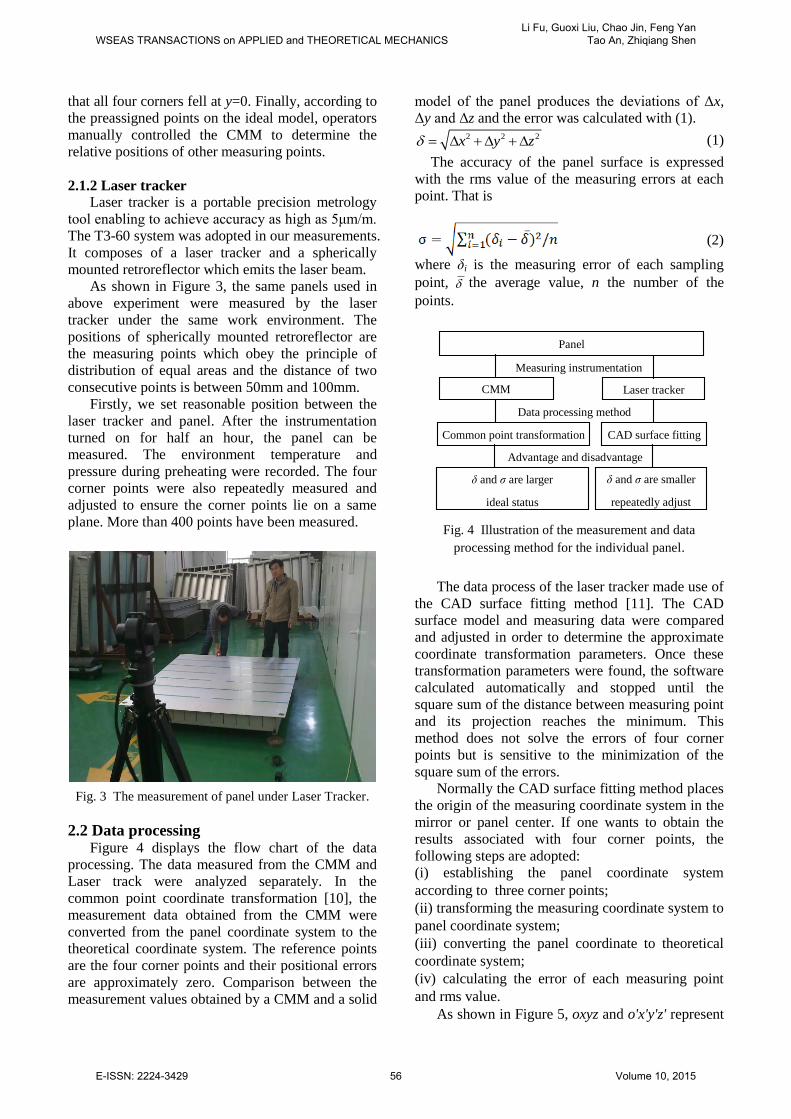
2.2 Data processing Figure 4 displays the flow chart of the data
processing. The data measured from the CMM and
Laser track were analyzed separately. In the
common point coordinate transformation [10], the
measurement data obtained from the CMM were
converted from the panel coordinate system to the
theoretical coordinate system. The reference points
are the four corner points and their positional errors
are approximately zero. Comparison between the
measurement values obtained by a CMM and a solid
model of the panel produces the deviations of Δx,
Δy and Δz and the error was calculated with (1). 2 2 2x y z (1)
The accuracy of the panel surface is expressed
with the rms value of the measuring errors at each
point. That is
(2)
where δi is the measuring error of each sampling
point, the average value, n the number of the
points.
Panel
CMM Laser tracker
Measuring instrumentation
Common point transformation CAD surface fitting
Data processing method
δ and ζ are larger
ideal status
δ and ζ are smaller
repeatedly adjust
Advantage and disadvantage
Fig. 4 Illustration of the measurement and data
processing method for the individual panel.
The data process of the laser tracker made use of
the CAD surface fitting method [11]. The CAD
surface model and measuring data were compared
and adjusted in order to determine the approximate
coordinate transformation parameters. Once these
transformation parameters were found, the software
calculated automatically and stopped until the
square sum of the distance between measuring point
and its projection reaches the minimum. This
method does not solve the errors of four corner
points but is sensitive to the minimization of the
square sum of the errors.
Normally the CAD surface fitting method places
the origin of the measuring coordinate system in the
mirror or panel center. If one wants to obtain the
results associated with four corner points, the
following steps are adopted:
(i) establishing the panel coordinate system
according to three corner points;
(ii) transforming the measuring coordinate system to
panel coordinate system;
(iii) converting the panel coordinate to theoretical
coordinate system;
(iv) calculating the error of each measuring point
and rms value.
As shown in Figure 5, oxyz and o'x'y'z' represent
WSEAS TRANSACTIONS on APPLIED and THEORETICAL MECHANICSLi Fu, Guoxi Liu, Chao Jin, Feng Yan
Tao An, Zhiqiang Shen
E-ISSN: 2224-3429 56 Volume 10, 2015
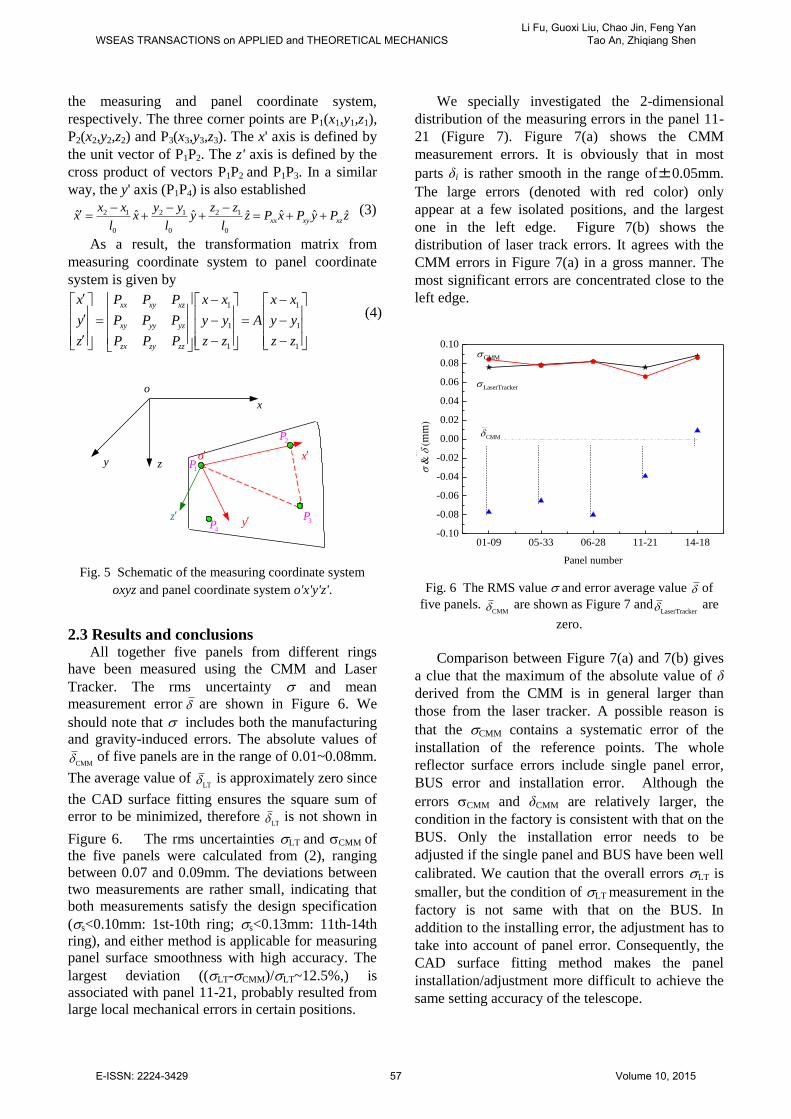
the measuring and panel coordinate system,
respectively. The three corner points are P1(x1,y1,z1),
P2(x2,y2,z2) and P3(x3,y3,z3). The x' axis is defined by
the unit vector of P1P2. The z' axis is defined by the
cross product of vectors P1P2 and P1P3. In a similar
way, the y' axis (P1P4) is also established
2 1 2 1 2 1
0 0 0
ˆ ˆ ˆ ˆ ˆˆ ˆxx xy xz
x x y y z zx x y z P x P y P z
l l l
(3)
As a result, the transformation matrix from
measuring coordinate system to panel coordinate
system is given by
1 1
1 1
1 1
xx xy xz
xy yy yz
zx zy zz
x P P P x x x x
y P P P y y A y y
P P P z z z zz
(4)
x
y z
o
x
yz
o1P
4P
2P
3P
Fig. 5 Schematic of the measuring coordinate system
oxyz and panel coordinate system o'x'y'z'.
2.3 Results and conclusions All together five panels from different rings
have been measured using the CMM and Laser
Tracker. The rms uncertainty and mean
measurement error are shown in Figure 6. We
should note that includes both the manufacturing
and gravity-induced errors. The absolute values of
CMM of five panels are in the range of 0.01~0.08mm.
The average value of LT is approximately zero since
the CAD surface fitting ensures the square sum of
error to be minimized, therefore LT is not shown in
Figure 6. The rms uncertainties LT and CMM of
the five panels were calculated from (2), ranging
between 0.07 and 0.09mm. The deviations between
two measurements are rather small, indicating that
both measurements satisfy the design specification
(s<0.10mm: 1st-10th ring; s<0.13mm: 11th-14th
ring), and either method is applicable for measuring
panel surface smoothness with high accuracy. The
largest deviation ((LT-CMM)/LT~12.5%,) is
associated with panel 11-21, probably resulted from
large local mechanical errors in certain positions.
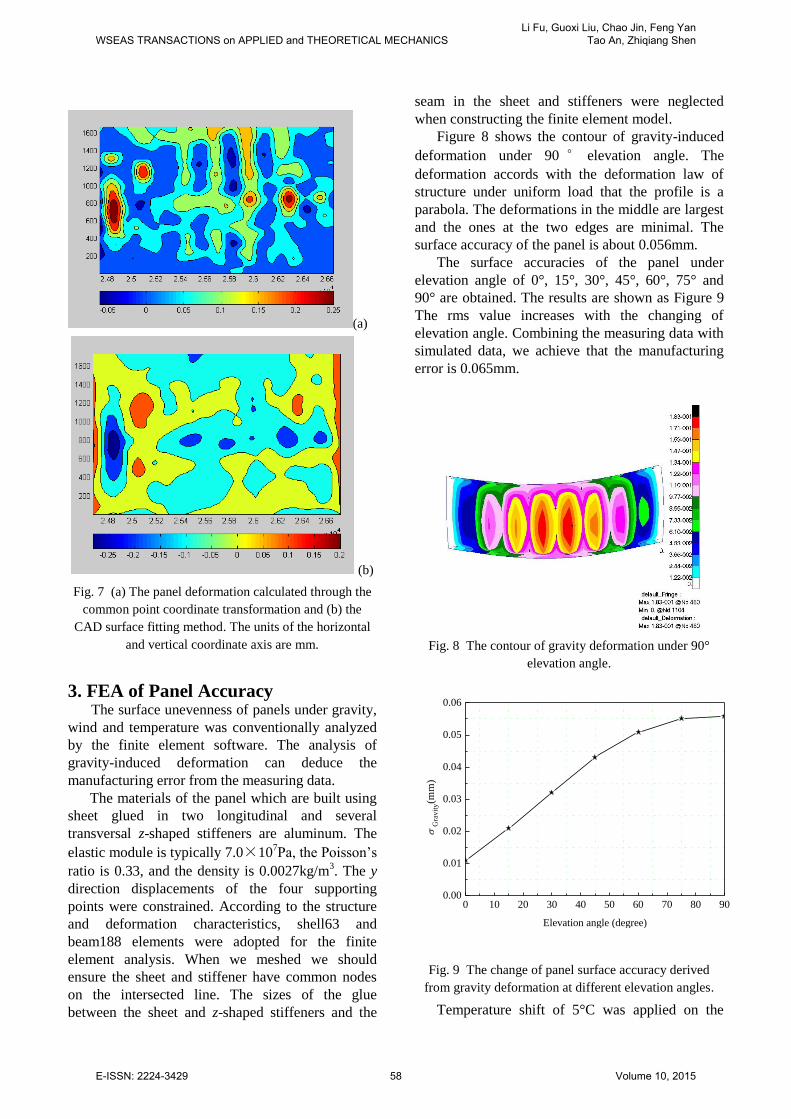
We specially investigated the 2-dimensional
distribution of the measuring errors in the panel 11-
21 (Figure 7). Figure 7(a) shows the CMM
measurement errors. It is obviously that in most
parts δi is rather smooth in the range of±0.05mm.
The large errors (denoted with red color) only
appear at a few isolated positions, and the largest
one in the left edge. Figure 7(b) shows the
distribution of laser track errors. It agrees with the
CMM errors in Figure 7(a) in a gross manner. The
most significant errors are concentrated close to the
left edge.
01-09 05-33 06-28 11-21 14-18-0.10
-0.08
-0.06
-0.04
-0.02
0.00
0.02
0.04
0.06
0.08
0.10
mm
Panel number
CMM
LaserTracker
CMM
Fig. 6 The RMS value and error average value of
five panels. CMM are shown as Figure 7 and
LaserTracker are
zero.
Comparison between Figure 7(a) and 7(b) gives
a clue that the maximum of the absolute value of δ
derived from the CMM is in general larger than
those from the laser tracker. A possible reason is
that the CMM contains a systematic error of the
installation of the reference points. The whole
reflector surface errors include single panel error,
BUS error and installation error. Although the
errors CMM and δCMM are relatively larger, the
condition in the factory is consistent with that on the
BUS. Only the installation error needs to be
adjusted if the single panel and BUS have been well
calibrated. We caution that the overall errors LT is
smaller, but the condition of LT measurement in the
factory is not same with that on the BUS. In
addition to the installing error, the adjustment has to
take into account of panel error. Consequently, the
CAD surface fitting method makes the panel
installation/adjustment more difficult to achieve the
same setting accuracy of the telescope.
WSEAS TRANSACTIONS on APPLIED and THEORETICAL MECHANICSLi Fu, Guoxi Liu, Chao Jin, Feng Yan
Tao An, Zhiqiang Shen
E-ISSN: 2224-3429 57 Volume 10, 2015
(a)
(b)
Fig. 7 (a) The panel deformation calculated through the
common point coordinate transformation and (b) the
CAD surface fitting method. The units of the horizontal
and vertical coordinate axis are mm.
3. FEA of Panel Accuracy The surface unevenness of panels under gravity,
wind and temperature was conventionally analyzed
by the finite element software. The analysis of
gravity-induced deformation can deduce the
manufacturing error from the measuring data.
The materials of the panel which are built using
sheet glued in two longitudinal and several
transversal z-shaped stiffeners are aluminum. The
elastic module is typically 7.0×10⁷Pa, the Poisson’s
ratio is 0.33, and the density is 0.0027kg/m3. The y
direction displacements of the four supporting
points were constrained. According to the structure
and deformation characteristics, shell63 and
beam188 elements were adopted for the finite
element analysis. When we meshed we should
ensure the sheet and stiffener have common nodes
on the intersected line. The sizes of the glue
between the sheet and z-shaped stiffeners and the
seam in the sheet and stiffeners were neglected
when constructing the finite element model.
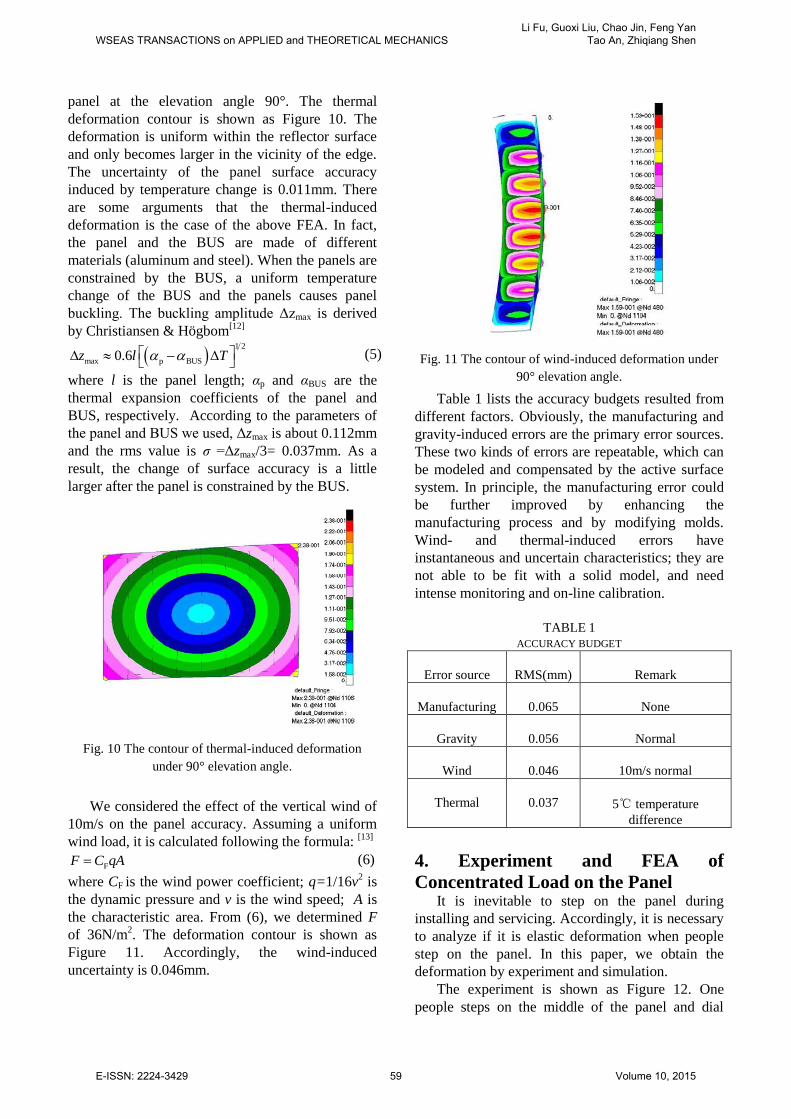
Figure 8 shows the contour of gravity-induced
deformation under 90 ° elevation angle. The
deformation accords with the deformation law of
structure under uniform load that the profile is a
parabola. The deformations in the middle are largest
and the ones at the two edges are minimal. The
surface accuracy of the panel is about 0.056mm.
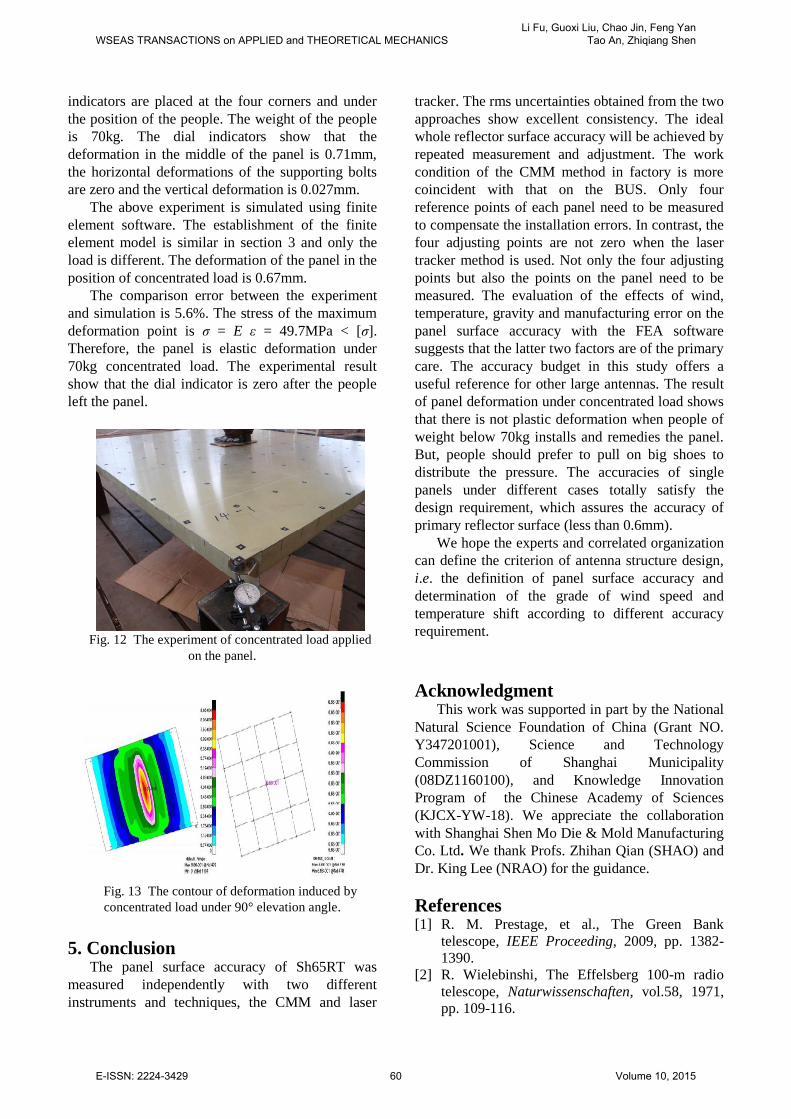
The surface accuracies of the panel under
elevation angle of 0°, 15°, 30°, 45°, 60°, 75° and
90° are obtained. The results are shown as Figure 9
The rms value increases with the changing of
elevation angle. Combining the measuring data with
simulated data, we achieve that the manufacturing
error is 0.065mm.
Fig. 8 The contour of gravity deformation under 90°
elevation angle.
0 10 20 30 40 50 60 70 80 900.00
0.01
0.02
0.03
0.04
0.05
0.06
G
rav
ity(m
m)
Elevation angle (degree)
Fig. 9 The change of panel surface accuracy derived
from gravity deformation at different elevation angles.
Temperature shift of 5°C was applied on the
WSEAS TRANSACTIONS on APPLIED and THEORETICAL MECHANICSLi Fu, Guoxi Liu, Chao Jin, Feng Yan
Tao An, Zhiqiang Shen
E-ISSN: 2224-3429 58 Volume 10, 2015
panel at the elevation angle 90°. The thermal
deformation contour is shown as Figure 10. The
deformation is uniform within the reflector surface
and only becomes larger in the vicinity of the edge.
The uncertainty of the panel surface accuracy
induced by temperature change is 0.011mm. There
are some arguments that the thermal-induced
deformation is the case of the above FEA. In fact,
the panel and the BUS are made of different
materials (aluminum and steel). When the panels are
constrained by the BUS, a uniform temperature
change of the BUS and the panels causes panel
buckling. The buckling amplitude Δzmax is derived
by Christiansen & Högbom[12]
1 2
max p BUS0.6z l T
(5)
where l is the panel length; αp and αBUS are the
thermal expansion coefficients of the panel and
BUS, respectively. According to the parameters of
the panel and BUS we used, Δzmax is about 0.112mm
and the rms value is ζ =Δzmax/3= 0.037mm. As a
result, the change of surface accuracy is a little
larger after the panel is constrained by the BUS.
Fig. 10 The contour of thermal-induced deformation
under 90° elevation angle.
We considered the effect of the vertical wind of
10m/s on the panel accuracy. Assuming a uniform
wind load, it is calculated following the formula: [13]
FF C qA (6)
where CF is the wind power coefficient; q=1/16v2 is
the dynamic pressure and v is the wind speed; A is
the characteristic area. From (6), we determined F
of 36N/m2. The deformation contour is shown as
Figure 11. Accordingly, the wind-induced
uncertainty is 0.046mm.
Fig. 11 The contour of wind-induced deformation under
90° elevation angle.
Table 1 lists the accuracy budgets resulted from
different factors. Obviously, the manufacturing and
gravity-induced errors are the primary error sources.
These two kinds of errors are repeatable, which can
be modeled and compensated by the active surface
system. In principle, the manufacturing error could
be further improved by enhancing the
manufacturing process and by modifying molds.
Wind- and thermal-induced errors have
instantaneous and uncertain characteristics; they are
not able to be fit with a solid model, and need
intense monitoring and on-line calibration.
TABLE 1
ACCURACY BUDGET
Error source RMS(mm) Remark
Manufacturing 0.065 None
Gravity 0.056 Normal
Wind 0.046 10m/s normal
Thermal 0.037 5℃ temperature
difference
4. Experiment and FEA of
Concentrated Load on the Panel It is inevitable to step on the panel during
installing and servicing. Accordingly, it is necessary
to analyze if it is elastic deformation when people
step on the panel. In this paper, we obtain the
deformation by experiment and simulation.
The experiment is shown as Figure 12. One
people steps on the middle of the panel and dial
WSEAS TRANSACTIONS on APPLIED and THEORETICAL MECHANICSLi Fu, Guoxi Liu, Chao Jin, Feng Yan
Tao An, Zhiqiang Shen
E-ISSN: 2224-3429 59 Volume 10, 2015
indicators are placed at the four corners and under
the position of the people. The weight of the people
is 70kg. The dial indicators show that the
deformation in the middle of the panel is 0.71mm,
the horizontal deformations of the supporting bolts
are zero and the vertical deformation is 0.027mm.
The above experiment is simulated using finite
element software. The establishment of the finite
element model is similar in section 3 and only the
load is different. The deformation of the panel in the
position of concentrated load is 0.67mm.
The comparison error between the experiment
and simulation is 5.6%. The stress of the maximum
deformation point is ζ = E ε = 49.7MPa < [ζ].
Therefore, the panel is elastic deformation under
70kg concentrated load. The experimental result
show that the dial indicator is zero after the people
left the panel.
Fig. 12 The experiment of concentrated load applied
on the panel.
Fig. 13 The contour of deformation induced by
concentrated load under 90° elevation angle.
5. Conclusion The panel surface accuracy of Sh65RT was
measured independently with two different
instruments and techniques, the CMM and laser
tracker. The rms uncertainties obtained from the two
approaches show excellent consistency. The ideal
whole reflector surface accuracy will be achieved by
repeated measurement and adjustment. The work
condition of the CMM method in factory is more
coincident with that on the BUS. Only four
reference points of each panel need to be measured
to compensate the installation errors. In contrast, the
four adjusting points are not zero when the laser
tracker method is used. Not only the four adjusting
points but also the points on the panel need to be
measured. The evaluation of the effects of wind,
temperature, gravity and manufacturing error on the
panel surface accuracy with the FEA software
suggests that the latter two factors are of the primary
care. The accuracy budget in this study offers a
useful reference for other large antennas. The result
of panel deformation under concentrated load shows
that there is not plastic deformation when people of
weight below 70kg installs and remedies the panel.
But, people should prefer to pull on big shoes to
distribute the pressure. The accuracies of single
panels under different cases totally satisfy the
design requirement, which assures the accuracy of
primary reflector surface (less than 0.6mm).
We hope the experts and correlated organization
can define the criterion of antenna structure design,
i.e. the definition of panel surface accuracy and
determination of the grade of wind speed and
temperature shift according to different accuracy
requirement.
Acknowledgment This work was supported in part by the National
Natural Science Foundation of China (Grant NO.
Y347201001), Science and Technology
Commission of Shanghai Municipality
(08DZ1160100), and Knowledge Innovation
Program of the Chinese Academy of Sciences
(KJCX-YW-18). We appreciate the collaboration
with Shanghai Shen Mo Die & Mold Manufacturing
Co. Ltd. We thank Profs. Zhihan Qian (SHAO) and
Dr. King Lee (NRAO) for the guidance.
References [1] R. M. Prestage, et al., The Green Bank
telescope, IEEE Proceeding, 2009, pp. 1382-
1390.
[2] R. Wielebinshi, The Effelsberg 100-m radio
telescope, Naturwissenschaften, vol.58, 1971,
pp. 109-116.
WSEAS TRANSACTIONS on APPLIED and THEORETICAL MECHANICSLi Fu, Guoxi Liu, Chao Jin, Feng Yan
Tao An, Zhiqiang Shen
E-ISSN: 2224-3429 60 Volume 10, 2015
[3] E. Cenacchi. SRT Project Book. Available:
http://www.ca.astro.it/srt/project-
book/index.htm
[4] A. Orfei, Updates on SRT, the Sardinia radio
telescope, in 8th Radionet Eng. Forum, Yebes,
2008, pp.1-40.
[5] J. M. Hollis, P. R. Jewell, F. J. Lovas, and A.
Remijan. Green Bank telescope observations of
interstellar Glycolaldehyde: Low-temperature
sugar, The Astrophysical Journal, 2004, pp. 45-
48.
[6] S. Cichowolski, E. M. Arnal. An Effelsberg HI
study of the ISM around WR 126, WR 154 and
WR 155, A&A, vol 414, 2004, pp. 203-209.
[7] G. Zacchiroli, et al., The panels for primary and
secondary mirror reectors and the Active
Surface System for the new Sardinia Radio
Telescope, Mem. S.A.It. Suppl., vol. 10, 2006,
pp. 126-130.
[8] Jr. Hoagg, et al. Method for fabricating antenna
reflector panels, United States Patent,1991, pp.
1-7.
[9] D. H. Parker, J. M. Payne, J. W. Shelton, and T.
L. Weadon. Instrument for setting radio
telescope surfaces, GBT MEMO 206, pp. 1-4.
[10] H. Kutoglu, C. Mekik, H. Akcin. Effects of
errors in coordinates on transformation
parameters, J. Surv. Eng., vol. 129, 2003, pp.
91–94.
[11] Z. C. Li, G. Y. Li, C. Jin. On the data
processing methods of surface antenna’s
inspection, FIG XXII International Congress,
2002, pp.1-9.
[12] W. N. Christiansen, J. A. Högbom.
Radiotelescopes, Cambridge University Press,
1985.
[13] Z. G. Zhu, S. H. Ye. Antenna structure design,
The National Defence Industry Press, 1980.
WSEAS TRANSACTIONS on APPLIED and THEORETICAL MECHANICSLi Fu, Guoxi Liu, Chao Jin, Feng Yan
Tao An, Zhiqiang Shen
E-ISSN: 2224-3429 61 Volume 10, 2015