Embed Size (px)
Citation preview

Full Paper
Surface Area Effects in Hydroxyapatite/Poly(e-caprolactone) Nanocomposites
Jasmeet Kaur, Meisha L. Shofner*
In order to understand the contribution of nanoparticle surface area to the properties ofnanocomposite materials, hydroxyapatite nanoparticles with different specific surface areas(60 m2 � g�1 and 111 m2 � g�1) were synthesized using reverse microemulsion and processedinto nanocomposites. Experimental results indicatedthat the thermomechanical reinforcement did show adependence on nanoparticle surface area, although thetransition temperatures did not. The reinforcementtrends were dependent on temperature, suggesting thatthe nanoparticles had a greater impact on the amorphouspolymer chains. The reinforcement above Tg may beplotted against nanoparticle surface area to obtain asingle reinforcement trend, suggesting that surfacearea is a general parameter for nanocomposite propertycontrol.
Introduction
Nanocomposite materials are novel alternatives to tradi-
tional composites and bulkmaterials inmany applications
due to the multifunctional properties, unique structure,
and large surface area of nanoscale fillers.[1–4] Of these
attributes, excess surface area distinguishes the nanoscale
fillers from larger fillers.[5] The amount of surface area
afforded by nanoparticles results in a significant volume
fraction of the polymer matrix in contact with the filler
surface, creating another reinforcement mechanism in
nanocomposites.[6,7] The polymer chains in this region,
known as the interphase, may be perturbed from their
bulk structure and properties due to the nanoparticle
surface, affecting the properties of the nanocomposites.[7–9]
The size,[10] shape,[11] aspect ratio,[12] concentration[11] and
J. Kaur, M. L. ShofnerSchool of Polymer, Textile and Fiber Engineering,Georgia Institute of Technology, 801 Ferst Drive, Atlanta,Georgia 30332-0295, USAFax: (404) 894-8780; E-mail: [email protected]
Macromol. Chem. Phys. 2009, 210, 677–688
� 2009 WILEY-VCH Verlag GmbH & Co. KGaA, Weinheim
surface chemistry[13] of the nanoparticles have been
shown to impact interphase development and the
resulting nanocomposite properties.
Many experimental studies have been performed to
understand the impact of particle morphology (size, shape
and aspect ratio) on nanocomposite properties. Mechan-
ical properties, such as strength and modulus, have
generally increased with decreasing particle size in
polymer nanocomposites,[14,15] and direct comparisons
between micron-scale and nanoscale particles showed
improved mechanical properties in nanocomposites when
compared at the same filler loading.[10] With regard to
particle shape, experimental and computational research
concerning chemically similar nanoparticles with differ-
ent shapes indicated that shape does not play a primary
role in nanocomposite reinforcement when the aspect
ratio of the nanoparticles is low.[11,16] Nanocomposites
showed the same reinforcement trend with increasing
surface area for spherical and platelet (aspect ratio¼ 10)
shaped particles.[11] Carbon nanotubes and nanoplatelets
possessed similar reinforcing capabilities at an aspect ratio
of 10 in both aligned and random configurations, but at an
DOI: 10.1002/macp.200800508 677
J. Kaur, M. L. Shofner
678
aspect ratio of 1 000, the particle shape did impact the
mechanical properties because nanoplatelets provided
higher reinforcement than nanotubes.[16]
The effect of surface area may be linked to the
nanoparticle attributes listed above. For example, at a
fixed material density, the nanoparticle surface area
contained in the composite will increase with decreasing
nanoparticle size and increasing nanoparticle concentra-
tion. Also, surface area can magnify the effect of
nanoparticle surface chemistry on properties by perturb-
ing a greater quantity of polymer chains as the nano-
particle/polymer interfacial area increases. These relation-
ships lead to a network view of nanocomposite
morphology.[17] As the amount of surface area increases,
the nanocomposite structure transitions from a bulk
matrix network to an interphase network, and then to a
nanoparticle network. These transformations, shown
schematically in Figure 1, can be envisioned with many
nanoparticle attributes (i.e., geometry), but in this
research, surface area has been used as the unifying
variable to remove some of the complications arising from
nanoparticle heterogeneity. Whereas many nanoparticles
do not possess uniform shape and size, the specific surface
area is measurable and provides a global view of the effect
of nanoparticle attributes on composite properties.
For the bulk matrix network, the polymer matrix is
continuous, and the nanoparticles and interphasematerial
are isolated from each other. The properties for this
nanocomposite structure will likely follow simple mixing
rules since the reinforcing nanoparticles and interphase
material are discontinuous. As the amount of surface area
increases, the interphase material forms a continuous
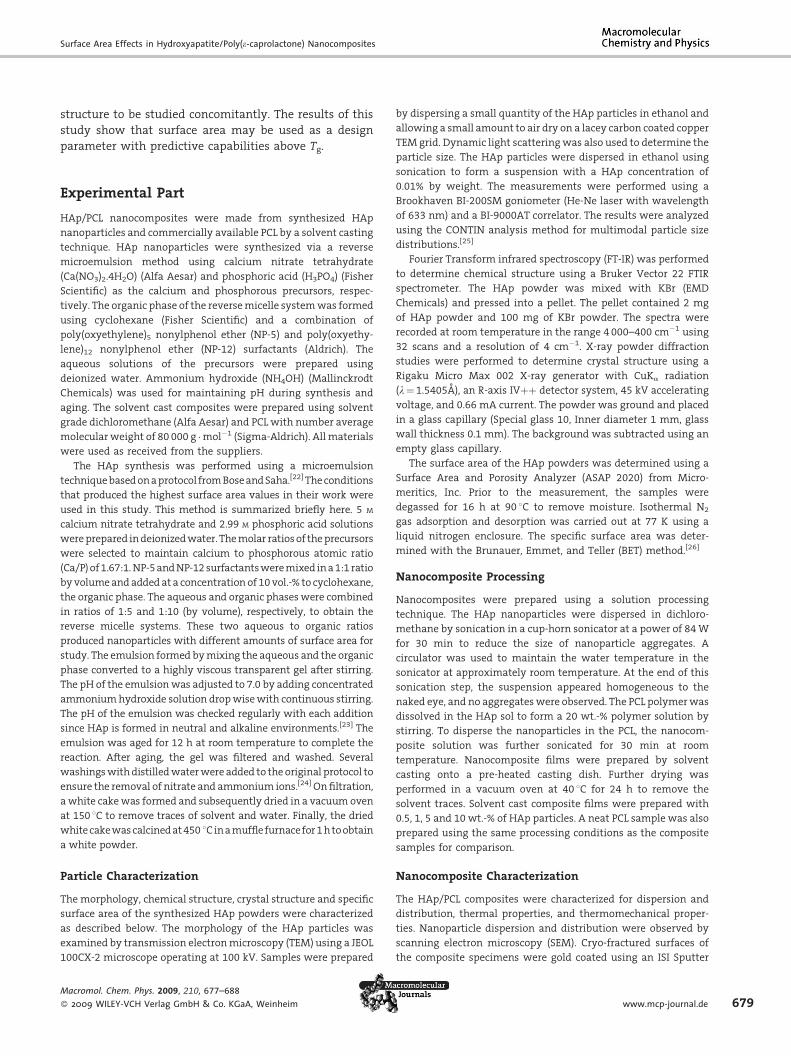
Figure 1. Nano/microstructures formed in nanocomposites atincreasing nanoparticle surface area. When the bulk polymermatrix is continuous, the contributions of the nanoparticlesand interphase are additive. When the interphase becomescontinuous, a physical network is formed that affects the polymerdynamics. When the nanoparticles form a continuous network, apercolated structure is formed that reflects the nanoparticleproperties in the nanocomposite. Schematic was inspired byDu et al. [17]
Macromol. Chem. Phys. 2009, 210, 677–688
� 2009 WILEY-VCH Verlag GmbH & Co. KGaA, Weinheim
network, and rheological measurements show a disconti-
nuity reflecting the physical network formed by the
interphase regions. For a strong interface in this structure,
the nanocomposite properties will exceed those predicted
by micromechanics and these results have been observed
experimentally.[18] At still higher amounts of surface area,
a percolated nanoparticle network is formed, and the
polymer becomes the adhesive holding the nanoparticle
network together.
Studies concerning surface area explicitly have shown
that reinforcement and the amount of interphase may be
related to nanoparticle surface area.[19–21] In poly(vinyl
alcohol) (PVA) composites made with single, double,
multiwalled as well as catalytic and functionalized carbon
nanotubes, the highest reinforcement was seen with the
smallest diameter nanotubes.[19] Another tan delta peak
appeared corresponding to overlapping regions of polymer
chains adjacent to the immobilized polymer adsorbed on
the filler surface. Its appearance was due to the large
volume of immobilized polymer, which was a direct result
of the high surface area of the filler. Similar peakswere also
found in composites of silica nanoparticles with poly-
styrene, poly(4-vinylpyridine), styrene-butadiene-rubber
and poly(dimethylsiloxane) (PDMS) at 10 wt.-% or above
and were attributed to slower dynamics of the interface
material which made up a significant volume of the total
polymer volume.[20] Analogous results have been obtained
for silica nanocomposites using quasielastic neutron
scattering (QENS).[21] Slow relaxation of polymer chains
adsorbed on the higher surface area silica nanoparticles
gave rise to an elastic component in QENS data in addition
to the quasielastic broadening caused by the free polymer
chains.
To understand more fully the effect of nanoparticle
surface area on the nanocomposite properties below and
above the glass transition temperature (Tg), this research
determined the thermal and thermomechanical properties
of nanocomposite materials consisting of hydroxyapatite
(HAp) nanoparticles in a poly(e-caprolactone) (PCL) matrix.
Two HAp nanoparticle systems were prepared using
reverse microemulsion to obtain nanoparticles with
specific surface areas of 60 m2 � g�1 and 111 m2 � g�1. In
order to study the contribution of surface area and
minimize the effect of particle-particle interactions, only
nanoparticle loadings up to 10 wt.-% were processed and
characterized. These concentrations were shown to be at
the point of the formation of the interphase network.
These experiments further provide insight into what
population of chains (crystalline or amorphous) was most
impacted by the inclusion of surfaces in the polymer. The
HAp synthesis method used allowed for the flexibility to
control the size and surface area of the particles. Thus, the
system chosen for study, HAp/PCL nanocomposites, allows
for the effects of nanoparticle surface area and polymer
DOI: 10.1002/macp.200800508
Surface Area Effects in Hydroxyapatite/Poly(e-caprolactone) Nanocomposites
structure to be studied concomitantly. The results of this
study show that surface area may be used as a design
parameter with predictive capabilities above Tg.
Experimental Part
HAp/PCL nanocomposites were made from synthesized HAp
nanoparticles and commercially available PCL by a solvent casting
technique. HAp nanoparticles were synthesized via a reverse
microemulsion method using calcium nitrate tetrahydrate
(Ca(NO3)2.4H2O) (Alfa Aesar) and phosphoric acid (H3PO4) (Fisher
Scientific) as the calcium and phosphorous precursors, respec-
tively. The organic phase of the reversemicelle systemwas formed
using cyclohexane (Fisher Scientific) and a combination of
poly(oxyethylene)5 nonylphenol ether (NP-5) and poly(oxyethy-
lene)12 nonylphenol ether (NP-12) surfactants (Aldrich). The
aqueous solutions of the precursors were prepared using
deionized water. Ammonium hydroxide (NH4OH) (Mallinckrodt
Chemicals) was used for maintaining pH during synthesis and
aging. The solvent cast composites were prepared using solvent
grade dichloromethane (Alfa Aesar) and PCL with number average
molecularweight of 80 000 g �mol�1 (Sigma-Aldrich). All materials
were used as received from the suppliers.
The HAp synthesis was performed using a microemulsion
techniquebasedonaprotocol fromBoseandSaha.[22]Theconditions
that produced the highest surface area values in their work were
used in this study. This method is summarized briefly here. 5 M
calcium nitrate tetrahydrate and 2.99 M phosphoric acid solutions
wereprepared indeionizedwater. Themolar ratiosof theprecursors
were selected to maintain calcium to phosphorous atomic ratio
(Ca/P)of1.67:1.NP-5andNP-12surfactantsweremixed ina1:1 ratio
byvolumeandaddedat a concentration of 10vol.-% to cyclohexane,
the organic phase. The aqueous and organic phaseswere combined
in ratios of 1:5 and 1:10 (by volume), respectively, to obtain the
reverse micelle systems. These two aqueous to organic ratios
produced nanoparticles with different amounts of surface area for
study. The emulsion formed bymixing the aqueous and the organic
phase converted to a highly viscous transparent gel after stirring.
The pH of the emulsionwas adjusted to 7.0 by adding concentrated
ammoniumhydroxide solution dropwisewith continuous stirring.
The pH of the emulsion was checked regularly with each addition
since HAp is formed in neutral and alkaline environments.[23] The
emulsion was aged for 12 h at room temperature to complete the
reaction. After aging, the gel was filtered and washed. Several
washingswithdistilledwaterwere added to the original protocol to
ensure the removal of nitrate and ammonium ions.[24] Onfiltration,
awhite cakewas formed and subsequently dried in a vacuum oven
at 150 8C to remove traces of solvent and water. Finally, the dried
whitecakewascalcinedat450 8Cinamufflefurnacefor1htoobtain
a white powder.
Particle Characterization
The morphology, chemical structure, crystal structure and specific
surface area of the synthesized HAp powders were characterized
as described below. The morphology of the HAp particles was
examined by transmission electronmicroscopy (TEM) using a JEOL
100CX-2 microscope operating at 100 kV. Samples were prepared
Macromol. Chem. Phys. 2009, 210, 677–688
� 2009 WILEY-VCH Verlag GmbH & Co. KGaA, Weinheim
by dispersing a small quantity of the HAp particles in ethanol and
allowing a small amount to air dry on a lacey carbon coated copper
TEM grid. Dynamic light scatteringwas also used to determine the
particle size. The HAp particles were dispersed in ethanol using
sonication to form a suspension with a HAp concentration of
0.01% by weight. The measurements were performed using a
Brookhaven BI-200SM goniometer (He-Ne laser with wavelength
of 633 nm) and a BI-9000AT correlator. The results were analyzed
using the CONTIN analysis method for multimodal particle size
distributions.[25]
Fourier Transform infrared spectroscopy (FT-IR) was performed
to determine chemical structure using a Bruker Vector 22 FTIR
spectrometer. The HAp powder was mixed with KBr (EMD
Chemicals) and pressed into a pellet. The pellet contained 2 mg
of HAp powder and 100 mg of KBr powder. The spectra were
recorded at room temperature in the range 4 000–400 cm�1 using
32 scans and a resolution of 4 cm�1. X-ray powder diffraction
studies were performed to determine crystal structure using a
Rigaku Micro Max 002 X-ray generator with CuKa radiation
(l¼1.5405A), an R-axis IVþþ detector system, 45 kV accelerating
voltage, and 0.66 mA current. The powder was ground and placed
in a glass capillary (Special glass 10, Inner diameter 1 mm, glass
wall thickness 0.1 mm). The background was subtracted using an
empty glass capillary.
The surface area of the HAp powders was determined using a
Surface Area and Porosity Analyzer (ASAP 2020) from Micro-
meritics, Inc. Prior to the measurement, the samples were
degassed for 16 h at 90 8C to remove moisture. Isothermal N2
gas adsorption and desorption was carried out at 77 K using a
liquid nitrogen enclosure. The specific surface area was deter-
mined with the Brunauer, Emmet, and Teller (BET) method.[26]
Nanocomposite Processing
Nanocomposites were prepared using a solution processing
technique. The HAp nanoparticles were dispersed in dichloro-
methane by sonication in a cup-horn sonicator at a power of 84W
for 30 min to reduce the size of nanoparticle aggregates. A
circulator was used to maintain the water temperature in the
sonicator at approximately room temperature. At the end of this
sonication step, the suspension appeared homogeneous to the
naked eye, and no aggregateswere observed. The PCL polymerwas
dissolved in the HAp sol to form a 20 wt.-% polymer solution by
stirring. To disperse the nanoparticles in the PCL, the nanocom-
posite solution was further sonicated for 30 min at room
temperature. Nanocomposite films were prepared by solvent
casting onto a pre-heated casting dish. Further drying was
performed in a vacuum oven at 40 8C for 24 h to remove the
solvent traces. Solvent cast composite films were prepared with
0.5, 1, 5 and 10 wt.-% of HAp particles. A neat PCL sample was also
prepared using the same processing conditions as the composite
samples for comparison.
Nanocomposite Characterization
The HAp/PCL composites were characterized for dispersion and
distribution, thermal properties, and thermomechanical proper-
ties. Nanoparticle dispersion and distribution were observed by
scanning electron microscopy (SEM). Cryo-fractured surfaces of
the composite specimens were gold coated using an ISI Sputter
www.mcp-journal.de 679
J. Kaur, M. L. Shofner
680
Coater and then imaged using a LEO 1530 SEM at a voltage of
10 kV. In the context of this research, dispersion was indicated by
an increase in nanoparticle surface area available to the polymer
(aggregates broken down), and distribution was indicated by a
homogeneous distribution of nanoparticles in the matrix (indi-
vidual or aggregated). Thermal transitions were measured by
differential scanning calorimetry (DSC) with a Seiko DSC 220. The
specimens were heated from �20 to 100 8C at a rate of
10 8C �min�1 under nitrogen gas flow. After a 10 min dwell, the
specimens were cooled back to �20 8C at the same rate. Two such
cycles were performed on each specimen. From the melting peak
of the first and the second run, the crystallinity (Xc %) of the
polymer was calculated according to the equation:
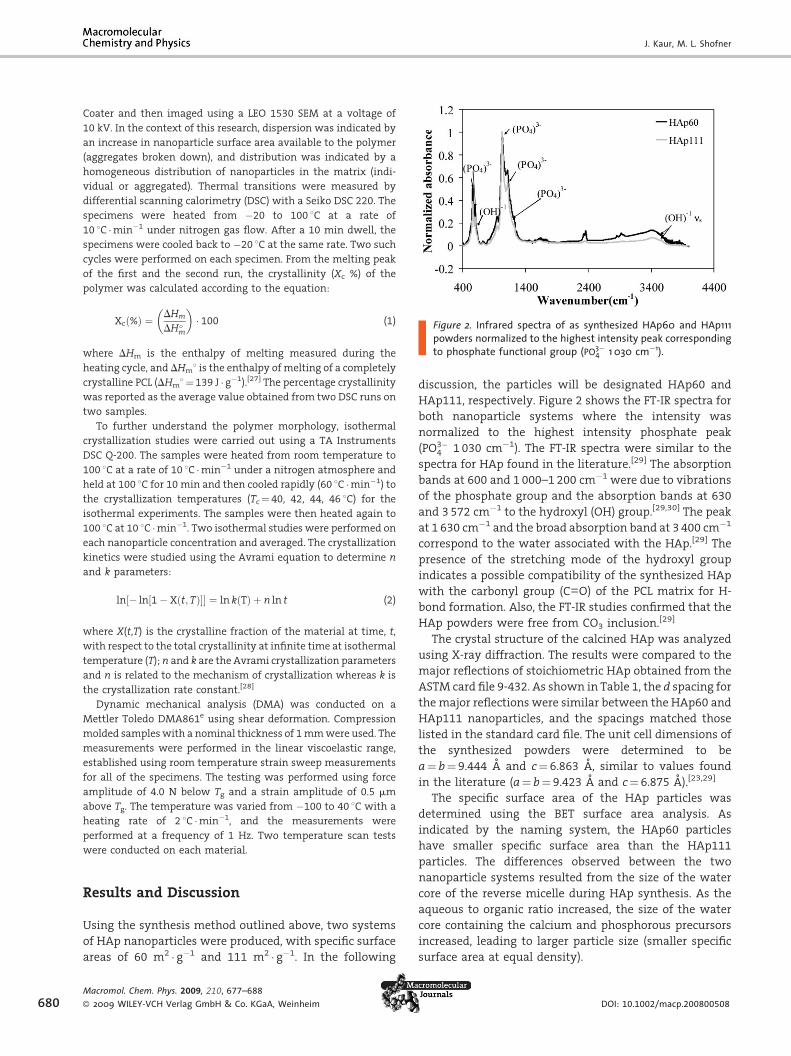
Figure 2. Infrared spectra of as synthesized HAp60 and HAp111powders normalized to the highest intensity peak corresponding
Macrom
� 2009
Xcð%Þ ¼DHm
DH�m
� �� 100 (1)
to phosphate functional group (PO3�4 1 030 cm�1).
where DHm is the enthalpy of melting measured during theheating cycle, and DHm8 is the enthalpy of melting of a completely
crystalline PCL (DHm8¼139 J � g�1).[27] The percentage crystallinity
was reported as the average value obtained from two DSC runs on
two samples.
To further understand the polymer morphology, isothermal
crystallization studies were carried out using a TA Instruments
DSC Q-200. The samples were heated from room temperature to
100 8C at a rate of 10 8C �min�1 under a nitrogen atmosphere and
held at 100 8C for 10 min and then cooled rapidly (60 8C �min�1) to
the crystallization temperatures (Tc¼ 40, 42, 44, 46 8C) for the
isothermal experiments. The samples were then heated again to
100 8C at 10 8C �min�1. Two isothermal studies were performed on
each nanoparticle concentration and averaged. The crystallization
kinetics were studied using the Avrami equation to determine n
and k parameters:
ln½� ln½1� Xðt; TÞ�� ¼ ln kðTÞ þ n ln t (2)
where X(t,T) is the crystalline fraction of the material at time, t,
with respect to the total crystallinity at infinite time at isothermal
temperature (T); n and k are the Avrami crystallization parameters
and n is related to the mechanism of crystallization whereas k is
the crystallization rate constant.[28]
Dynamic mechanical analysis (DMA) was conducted on a
Mettler Toledo DMA861e using shear deformation. Compression
molded sampleswith a nominal thickness of 1mmwere used. The
measurements were performed in the linear viscoelastic range,
established using room temperature strain sweep measurements
for all of the specimens. The testing was performed using force
amplitude of 4.0 N below Tg and a strain amplitude of 0.5 mm
above Tg. The temperature was varied from �100 to 40 8C with a
heating rate of 2 8C �min�1, and the measurements were
performed at a frequency of 1 Hz. Two temperature scan tests
were conducted on each material.
Results and Discussion
Using the synthesis method outlined above, two systems
of HAp nanoparticles were produced, with specific surface
areas of 60 m2 � g�1 and 111 m2 � g�1. In the following
ol. Chem. Phys. 2009, 210, 677–688
WILEY-VCH Verlag GmbH & Co. KGaA, Weinheim
discussion, the particles will be designated HAp60 and
HAp111, respectively. Figure 2 shows the FT-IR spectra for
both nanoparticle systems where the intensity was
normalized to the highest intensity phosphate peak
(PO3�4 1 030 cm�1). The FT-IR spectra were similar to the
spectra for HAp found in the literature.[29] The absorption
bands at 600 and 1 000–1 200 cm�1 were due to vibrations
of the phosphate group and the absorption bands at 630
and 3572 cm�1 to the hydroxyl (OH) group.[29,30] The peak
at 1 630 cm�1 and the broad absorption band at 3 400 cm�1
correspond to the water associated with the HAp.[29] The
presence of the stretching mode of the hydroxyl group
indicates a possible compatibility of the synthesized HAp
with the carbonyl group (C––O) of the PCL matrix for H-
bond formation. Also, the FT-IR studies confirmed that the
HAp powders were free from CO3 inclusion.[29]
The crystal structure of the calcined HAp was analyzed
using X-ray diffraction. The results were compared to the
major reflections of stoichiometric HAp obtained from the
ASTM card file 9-432. As shown in Table 1, the d spacing for
the major reflections were similar between the HAp60 and
HAp111 nanoparticles, and the spacings matched those
listed in the standard card file. The unit cell dimensions of
the synthesized powders were determined to be
a¼ b¼ 9.444 A and c¼ 6.863 A, similar to values found
in the literature (a¼ b¼ 9.423 A and c¼ 6.875 A).[23,29]
The specific surface area of the HAp particles was
determined using the BET surface area analysis. As
indicated by the naming system, the HAp60 particles
have smaller specific surface area than the HAp111
particles. The differences observed between the two
nanoparticle systems resulted from the size of the water
core of the reverse micelle during HAp synthesis. As the
aqueous to organic ratio increased, the size of the water
core containing the calcium and phosphorous precursors
increased, leading to larger particle size (smaller specific
surface area at equal density).
DOI: 10.1002/macp.200800508
Surface Area Effects in Hydroxyapatite/Poly(e-caprolactone) Nanocomposites
Table 1. Plane spacings observed in X-ray powder diffractionpattern of HAp and comparison with respective data for stoichio-metric HAp.
HAp60 HAp111 ASTM Card No. 9-432 for
stoichiometric HAp
d d d Miller indices
A A A
5.212 5.273 5.250 (101)
3.890 3.890 3.880 (111)
3.432 3.432 3.440 (002)
4.149 4.092 4.070 (200)
2.912 2.801 2.814 (211)
1.838 1.836 1.841 (213)
2.219 2.267 2.262 (310)
1.722 1.718 1.722 (004), (411)
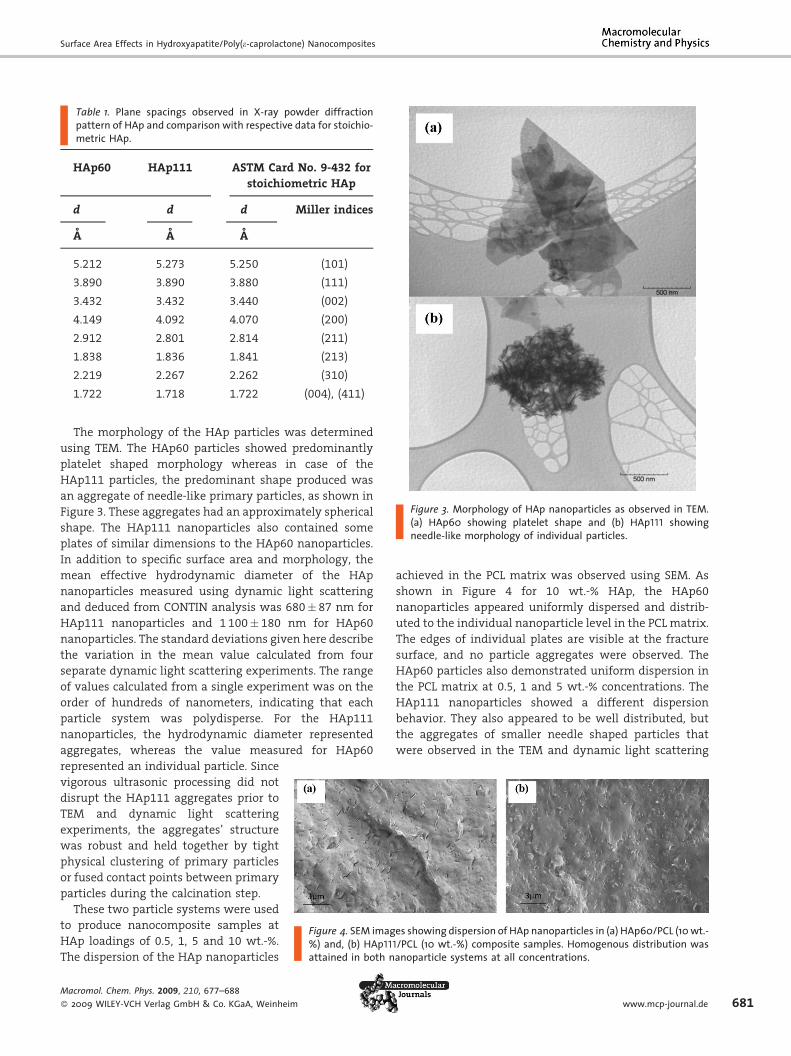
Figure 3. Morphology of HAp nanoparticles as observed in TEM.(a) HAp60 showing platelet shape and (b) HAp111 showingneedle-like morphology of individual particles.
The morphology of the HAp particles was determined
using TEM. The HAp60 particles showed predominantly
platelet shaped morphology whereas in case of the
HAp111 particles, the predominant shape produced was
an aggregate of needle-like primary particles, as shown in
Figure 3. These aggregates had an approximately spherical
shape. The HAp111 nanoparticles also contained some
plates of similar dimensions to the HAp60 nanoparticles.
In addition to specific surface area and morphology, the
mean effective hydrodynamic diameter of the HAp
nanoparticles measured using dynamic light scattering
and deduced from CONTIN analysis was 680� 87 nm for
HAp111 nanoparticles and 1 100� 180 nm for HAp60
nanoparticles. The standard deviations given here describe
the variation in the mean value calculated from four
separate dynamic light scattering experiments. The range
of values calculated from a single experiment was on the
order of hundreds of nanometers, indicating that each
particle system was polydisperse. For the HAp111
nanoparticles, the hydrodynamic diameter represented
aggregates, whereas the value measured for HAp60
Figure 4. SEM images showing dispersion of HAp nanoparticles in (a) HAp60/PCL (10wt.-%) and, (b) HAp111/PCL (10 wt.-%) composite samples. Homogenous distribution wasattained in both nanoparticle systems at all concentrations.
represented an individual particle. Since
vigorous ultrasonic processing did not
disrupt the HAp111 aggregates prior to
TEM and dynamic light scattering
experiments, the aggregates’ structure
was robust and held together by tight
physical clustering of primary particles
or fused contact points between primary
particles during the calcination step.
These two particle systems were used
to produce nanocomposite samples at
HAp loadings of 0.5, 1, 5 and 10 wt.-%.
The dispersion of the HAp nanoparticles
Macromol. Chem. Phys. 2009, 210, 677–688
� 2009 WILEY-VCH Verlag GmbH & Co. KGaA, Weinheim
achieved in the PCL matrix was observed using SEM. As
shown in Figure 4 for 10 wt.-% HAp, the HAp60
nanoparticles appeared uniformly dispersed and distrib-
uted to the individual nanoparticle level in the PCL matrix.
The edges of individual plates are visible at the fracture
surface, and no particle aggregates were observed. The
HAp60 particles also demonstrated uniform dispersion in
the PCL matrix at 0.5, 1 and 5 wt.-% concentrations. The
HAp111 nanoparticles showed a different dispersion
behavior. They also appeared to be well distributed, but
the aggregates of smaller needle shaped particles that
were observed in the TEM and dynamic light scattering
www.mcp-journal.de 681

J. Kaur, M. L. Shofner
Figure 5. % Crystallinity from second heat as a function of fillercontent for neat, HAp60 and HAp111 composite samples.
682
experiments were still present in the nanocomposites.
Overall, the HAp111 nanoparticles appeared to possess
smaller dimensions than the HAp60 nanoparticles. Similar
observations were made for the other HAp111 nanopar-
ticle loadings.
In order to compare the particle sizes obtained prior to
composite processing from dynamic light scattering to the
particle sizes observed in the composites, the dimensions
of HAp60 and HAp111 nanoparticles weremeasured using
SEM images of the nanocomposite fracture surfaces. The
number of particles measured in each system was
approximately 100. The HAp60 nanoparticles possessed
an average plate length of 990� 430 nm and an average
plate thickness of 20� 7 nm. Since the HAp60 nanoparticle
length is much greater than its thickness, the length of a
diagonal constructed across the face and through the
particle are the same values as the particle length when
considering significant figures, so the nanoparticle length
is used for comparison with the dynamic light scattering
data. The HAp111 nanoparticle aggregates possessed an
average diameter of 660� 310 nm. Since the measure-
ments from SEM images were largely consistent with the
hydrodynamic diameters obtained from dynamic light
scattering, the specific surface area measurements for the
HAp nanoparticles were assumed to apply to the
composites as well.
Thermal transitions and crystallization behavior for the
neat PCL and the nanocomposite samples were measured
using DSC. Table 2 lists the percent crystallinity values of
the neat PCL and the HAp/PCL composites, taken from both
the first and second heating cycles of the DSC measure-
ment. Themelting temperature was largely unchanged for
all of the materials and was 59 8C. Approximately 2 8Cseparated all of the values. The amount of crystallinity
achieved showed some variation with nanoparticle
loading as shown in Table 2 and Figure 5. Since all
Table 2. Percent crystallinity of neat PCL and HAp/PCL compositesamples from first and second heat cycles of DSC.
Sample %
Crystallinity
First Heat
%
Crystallinity
Second Heat
Neat PCL 40.2� 1.6 36.1� 1.8
0.5 wt.-% HAp60/PCL 40.5� 2.3 34.8� 1.3
1 wt.-% HAp60/PCL 39.0� 0.5 36.3� 3.0
5 wt.-% HAp60/PCL 36.2� 1.8 36.3� 1.7
10 wt.-% HAp60/PCL 45.2� 2.2 38.7� 0.3
0.5 wt.-% HAp111/PCL 34.5� 1.4 30.9� 0.7
1 wt.-% HAp111/PCL 40.2� 3.3 32.8� 0.9
5 wt.-% HAp111/PCL 45.3� 3.2 37.3� 0.5
10 wt.-% HAp111/PCL 44.7� 0.1 38.2� 0.1
Macromol. Chem. Phys. 2009, 210, 677–688
� 2009 WILEY-VCH Verlag GmbH & Co. KGaA, Weinheim
crystallinity values for the nanocomposites were within
approximately 5% of the neat polymer, no changes were
regarded as significant. Similar behavior has been seen in
other nanocomposite materials and may be linked to the
strength and nature of the interfacial interaction. Covalent
bonds across the interface have been shown to increase
crystallinity whereas attractive non-covalent interactions
have shown decreased or similar crystallinity to the neat
polymer.[31–33] In nanocomposites with non-covalent
interactions, strong attractions can inhibit crystallinity
through constraining polymer molecules at the surface,
and weak attractions show little or no change to the
polymer crystallinity. Our results are consistent with the
latter case, indicating that the interfacial interactions are
likely weakly attractive. The crystallization temperatures
(defined as the peak temperature value for the event) of the
10 wt.-% HAp60/PCL and the 10 wt.-% HAp111/PCL were
increased 2.4 8C and 1.4 8C, respectively. The increased
crystallization temperature suggested that the presence of
HAp nanoparticles has some nucleating capability at
sufficient nanoparticle loadings consistent with previous
observations.[34]
To understand the nanoparticles’ impact on the kinetics,
isothermal crystallization studies were conducted on the
neat PCL, 1 wt.-%, 5 wt.-% and 10 wt.-% nanocomposites.
The half-time crystallization (t1/2) is a measure of overall
crystallization rate and is related to the rate constant. The
half-time values can be calculated from the equation as:
t1=2 ¼ ln 2
k
� �1=n
(3)
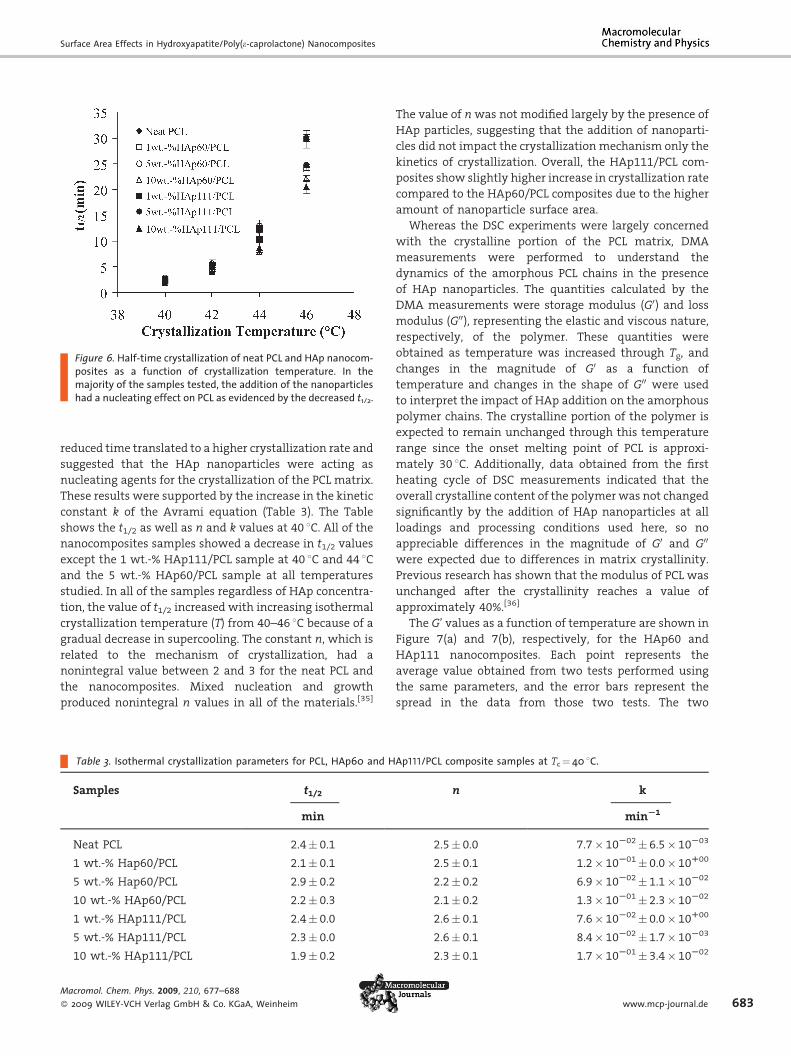
Figure 6 shows t1/2 as a function of isothermal crystal-
lization temperature. The majority of the nanocomposite
samples showed a lower t1/2 than the neat PCL. The
DOI: 10.1002/macp.200800508
Surface Area Effects in Hydroxyapatite/Poly(e-caprolactone) Nanocomposites
Figure 6. Half-time crystallization of neat PCL and HAp nanocom-posites as a function of crystallization temperature. In themajority of the samples tested, the addition of the nanoparticleshad a nucleating effect on PCL as evidenced by the decreased t1/2.
reduced time translated to a higher crystallization rate and
suggested that the HAp nanoparticles were acting as
nucleating agents for the crystallization of the PCL matrix.
These results were supported by the increase in the kinetic
constant k of the Avrami equation (Table 3). The Table
shows the t1/2 as well as n and k values at 40 8C. All of thenanocomposites samples showed a decrease in t1/2 values
except the 1 wt.-% HAp111/PCL sample at 40 8C and 44 8Cand the 5 wt.-% HAp60/PCL sample at all temperatures
studied. In all of the samples regardless of HAp concentra-
tion, the value of t1/2 increased with increasing isothermal
crystallization temperature (T) from 40–46 8C because of a
gradual decrease in supercooling. The constant n, which is
related to the mechanism of crystallization, had a
nonintegral value between 2 and 3 for the neat PCL and
the nanocomposites. Mixed nucleation and growth
produced nonintegral n values in all of the materials.[35]
Table 3. Isothermal crystallization parameters for PCL, HAp60 and H
Samples t1/2
min
Neat PCL 2.4� 0.1
1 wt.-% Hap60/PCL 2.1� 0.1
5 wt.-% Hap60/PCL 2.9� 0.2
10 wt.-% HAp60/PCL 2.2� 0.3
1 wt.-% HAp111/PCL 2.4� 0.0
5 wt.-% HAp111/PCL 2.3� 0.0
10 wt.-% HAp111/PCL 1.9� 0.2
Macromol. Chem. Phys. 2009, 210, 677–688
� 2009 WILEY-VCH Verlag GmbH & Co. KGaA, Weinheim
The value of nwas not modified largely by the presence of
HAp particles, suggesting that the addition of nanoparti-
cles did not impact the crystallization mechanism only the
kinetics of crystallization. Overall, the HAp111/PCL com-
posites show slightly higher increase in crystallization rate
compared to the HAp60/PCL composites due to the higher
amount of nanoparticle surface area.
Whereas the DSC experiments were largely concerned
with the crystalline portion of the PCL matrix, DMA
measurements were performed to understand the
dynamics of the amorphous PCL chains in the presence
of HAp nanoparticles. The quantities calculated by the
DMA measurements were storage modulus (G0) and loss
modulus (G00), representing the elastic and viscous nature,
respectively, of the polymer. These quantities were
obtained as temperature was increased through Tg, and
changes in the magnitude of G0 as a function of
temperature and changes in the shape of G00 were used
to interpret the impact of HAp addition on the amorphous
polymer chains. The crystalline portion of the polymer is
expected to remain unchanged through this temperature
range since the onset melting point of PCL is approxi-
mately 30 8C. Additionally, data obtained from the first
heating cycle of DSC measurements indicated that the
overall crystalline content of the polymerwas not changed
significantly by the addition of HAp nanoparticles at all
loadings and processing conditions used here, so no
appreciable differences in the magnitude of G0 and G00
were expected due to differences in matrix crystallinity.
Previous research has shown that the modulus of PCL was
unchanged after the crystallinity reaches a value of
approximately 40%.[36]
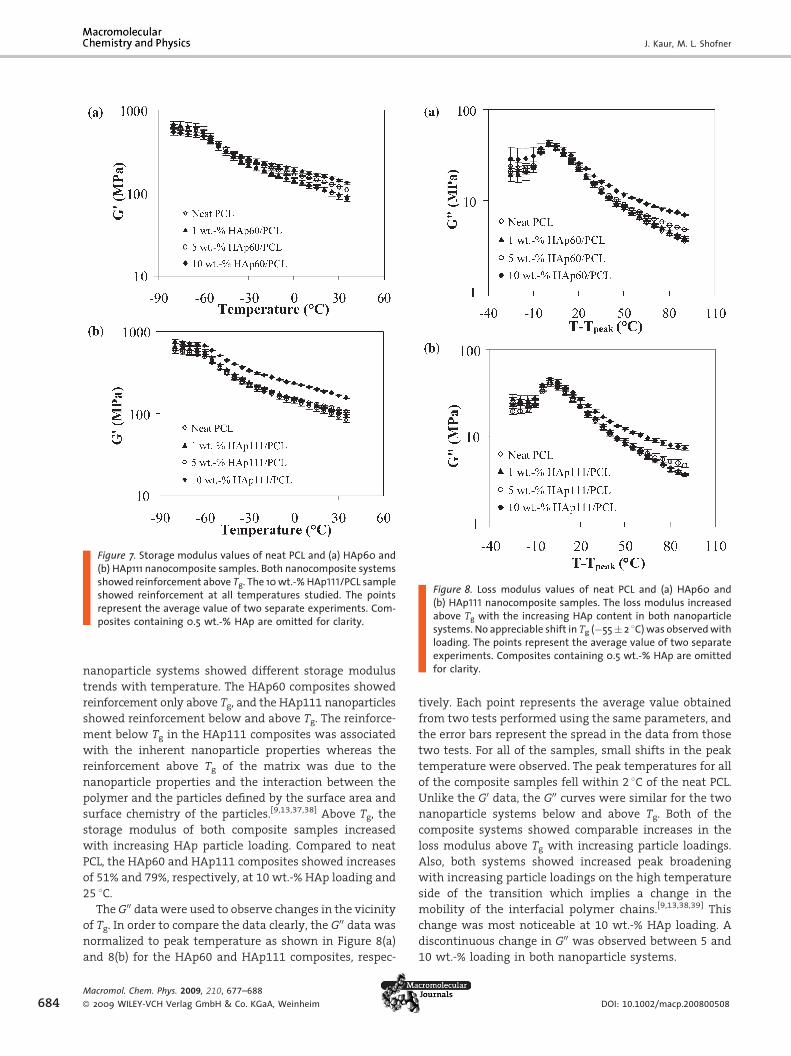
The G’ values as a function of temperature are shown in
Figure 7(a) and 7(b), respectively, for the HAp60 and
HAp111 nanocomposites. Each point represents the
average value obtained from two tests performed using
the same parameters, and the error bars represent the
spread in the data from those two tests. The two
Ap111/PCL composite samples at Tc¼ 40 8C.
n k
minS1
2.5� 0.0 7.7� 10S02� 6.5� 10S03
2.5� 0.1 1.2� 10S01� 0.0� 10R00
2.2� 0.2 6.9� 10S02� 1.1� 10S02
2.1� 0.2 1.3� 10S01� 2.3� 10S02
2.6� 0.1 7.6� 10S02� 0.0� 10R00
2.6� 0.1 8.4� 10S02� 1.7� 10S03
2.3� 0.1 1.7� 10S01� 3.4� 10S02
www.mcp-journal.de 683
J. Kaur, M. L. Shofner
Figure 7. Storage modulus values of neat PCL and (a) HAp60 and(b) HAp111 nanocomposite samples. Both nanocomposite systemsshowed reinforcement above Tg. The 10wt.-%HAp111/PCL sampleshowed reinforcement at all temperatures studied. The pointsrepresent the average value of two separate experiments. Com-posites containing 0.5 wt.-% HAp are omitted for clarity.
Figure 8. Loss modulus values of neat PCL and (a) HAp60 and(b) HAp111 nanocomposite samples. The loss modulus increasedabove Tg with the increasing HAp content in both nanoparticlesystems. No appreciable shift in Tg (�55� 2 8C)was observedwithloading. The points represent the average value of two separateexperiments. Composites containing 0.5 wt.-% HAp are omittedfor clarity.
684
nanoparticle systems showed different storage modulus
trends with temperature. The HAp60 composites showed
reinforcement only above Tg, and the HAp111 nanoparticles
showed reinforcement below and above Tg. The reinforce-
ment below Tg in the HAp111 composites was associated
with the inherent nanoparticle properties whereas the
reinforcement above Tg of the matrix was due to the
nanoparticle properties and the interaction between the
polymer and the particles defined by the surface area and
surface chemistry of the particles.[9,13,37,38] Above Tg, the
storage modulus of both composite samples increased
with increasing HAp particle loading. Compared to neat
PCL, the HAp60 and HAp111 composites showed increases
of 51% and 79%, respectively, at 10 wt.-% HAp loading and
25 8C.TheG00 datawere used to observe changes in the vicinity
of Tg. In order to compare the data clearly, the G00 data was
normalized to peak temperature as shown in Figure 8(a)
and 8(b) for the HAp60 and HAp111 composites, respec-
Macromol. Chem. Phys. 2009, 210, 677–688
� 2009 WILEY-VCH Verlag GmbH & Co. KGaA, Weinheim
tively. Each point represents the average value obtained
from two tests performed using the same parameters, and
the error bars represent the spread in the data from those
two tests. For all of the samples, small shifts in the peak
temperature were observed. The peak temperatures for all
of the composite samples fell within 2 8C of the neat PCL.
Unlike the G0 data, the G00 curves were similar for the two
nanoparticle systems below and above Tg. Both of the
composite systems showed comparable increases in the
loss modulus above Tg with increasing particle loadings.
Also, both systems showed increased peak broadening
with increasing particle loadings on the high temperature
side of the transition which implies a change in the
mobility of the interfacial polymer chains.[9,13,38,39] This
change was most noticeable at 10 wt.-% HAp loading. A
discontinuous change in G00 was observed between 5 and
10 wt.-% loading in both nanoparticle systems.
DOI: 10.1002/macp.200800508

Surface Area Effects in Hydroxyapatite/Poly(e-caprolactone) Nanocomposites
Figure 9. Normalized storage modulus curves for 10 wt.-% HAp/PCL nanocomposite samples. The reinforcement in both samplesincreased with temperature above Tg (�55 8C). Higher reinforce-ment was seen in the HAp111 sample at all temperatures studied.
To understand more fully the reinforcement trends in
both nanoparticle systems, G0 and G00 were normalized
with respect to neat PCL and the reinforcement values
were plotted against temperature. These data are shown in
Figure 9 and Figure 10, respectively, for HAp loading of
10 wt.-%. The error bars in these plots represent the
propagated error from the composite sample and the neat
PCL calculated using standard rules for the result of
division. As seen in Figure 9, the 10 wt.-% HAp111
nanocomposite showed a relatively constant level of
reinforcement (approximately 1.2�) below Tg, which was
attributed to the nanoparticle properties. The relative
storage modulus of the 10 wt.-% HAp60 composite was
also relatively constant but with no appreciable reinforce-
ment since the average value is below one. Above �60 8C,
Figure 10. Normalized loss modulus curves for 10 wt.-% HAp/PCLnanocomposite samples. Similar amounts of reinforcement areseen in loss modulus in both composites above Tg.
Macromol. Chem. Phys. 2009, 210, 677–688
� 2009 WILEY-VCH Verlag GmbH & Co. KGaA, Weinheim
the slope of the reinforcement curve changes to a positive
value indicating that the reinforcement of both of the
composites increased with temperature above Tg. The
HAp111 composite possessed a higher reinforcement at all
temperatures compared to the HAp60 composite sample
since it began at a higher level, but the slopes of both
curves are similar. The increased reinforcement afforded
by the HAp111 nanoparticle was attributed to the smaller
size and greater surface area of the nanoparticle aggregate
with respect to an individual HAp60 nanoparticle and the
strong forces holding the aggregate together. The reinfor-
cement indicated that the aggregate acted as a single
particle and its structure was not perturbed during testing
which is consistent with aggregate formation occurring
before composite processing. In contrast, the reinforce-
ment in loss modulus is nearly identical for the two
samples above Tg, as shown in Figure 10. The reinforce-
ment of loss modulus is greater than 2� at the maximum
temperature studied here. The different degrees of storage
modulus and loss modulus reinforcement indicated that
the increased surface area was able to promote a greater
degree of elastic coupling between the nanoparticle and
the polymer. However, the similar degree of viscous
coupling, represented by loss modulus reinforcement,
indicated that the interfacial interactionswere of the same
magnitude in both systems.[38]
Based on the DMA results, the two nanoparticle systems
have shown different reinforcing capabilities. The particle
characterization indicated that the surface chemistry and
crystallinity of the HAp60 and HAp111 nanoparticles were
similar. The main differences have arisen in overall
particle morphology and surface area. The HAp60 nano-
particles were plate-like particles and could be dispersed
and distributed in the polymer matrix to the level of
individual nanoparticles. These composites have shownno
appreciable, distinct change in mechanical properties at
temperatures below PCL’s Tg. The HAp111 nanoparticles
contained a majority population of needle-like particles
aggregated into spherical structures with a minor
population of plate-like particles. The needle-like particles
could not be dispersed to the single particle level in the
composites due to strong physical or chemical bonds
between the primary particles but were evenly distrib-
uted. These composites showed an ability to elastically
reinforce the polymer matrix at temperatures below Tg.
Since the particles possessed similar chemical and crystal-
line structure, these data indicated that the nanoparticle
dispersion was able to play a role in the reinforcement
behavior when the polymer chains are essentially frozen
below Tg. Above Tg, the particle systems displayed similar
trends in reinforcement to G0 and G00. These data suggest
that an interaction between the nanoparticles and the
polymer chains was present. Since there is a continuous
dependence on the reinforcement with temperature and
www.mcp-journal.de 685
J. Kaur, M. L. Shofner
686
the reinforcement was observed for both G0 and G00, the
interaction was with the amorphous chains as opposed to
the crystalline chains. For amorphous chains, this inter-
action may manifest itself as adsorption of the polymer
chains on the nanoparticles[40] or increased entanglement
density at the interface.[38] Either mechanismwill lead to a
restricted mobility of the chains, causing slower chain
relaxation and an increased reinforcement above Tg. From
this analysis, the nanoparticle shape and dispersion
characteristics did not have a pronounced effect above
Tg but did influence the properties before the onset of long
range polymer mobility.
Mechanical Composite Models
Previous research has shown that for particle shapes with
similar aspect ratios the particle shape did not play a
significant role in the mechanical properties,[11,16] and this
research supports this view above Tg. The effect of surface
area is more complicated. To examine the differences in
the HAp60 and HAp111 composites, two approaches have
been used: comparison to a micromechanical model and
scalingwith specific composite surface area. The simplified
Kerner equation, which assumes some adhesion between
the filler and the matrix, was employed to the storage
modulus data of the composites below (�80 8C) and above
(�10 8C) the glass transition temperature of PCL (�60 8C).The simplified Kerner equation for moderate concentra-
tions of fillers which are more rigid than the polymer
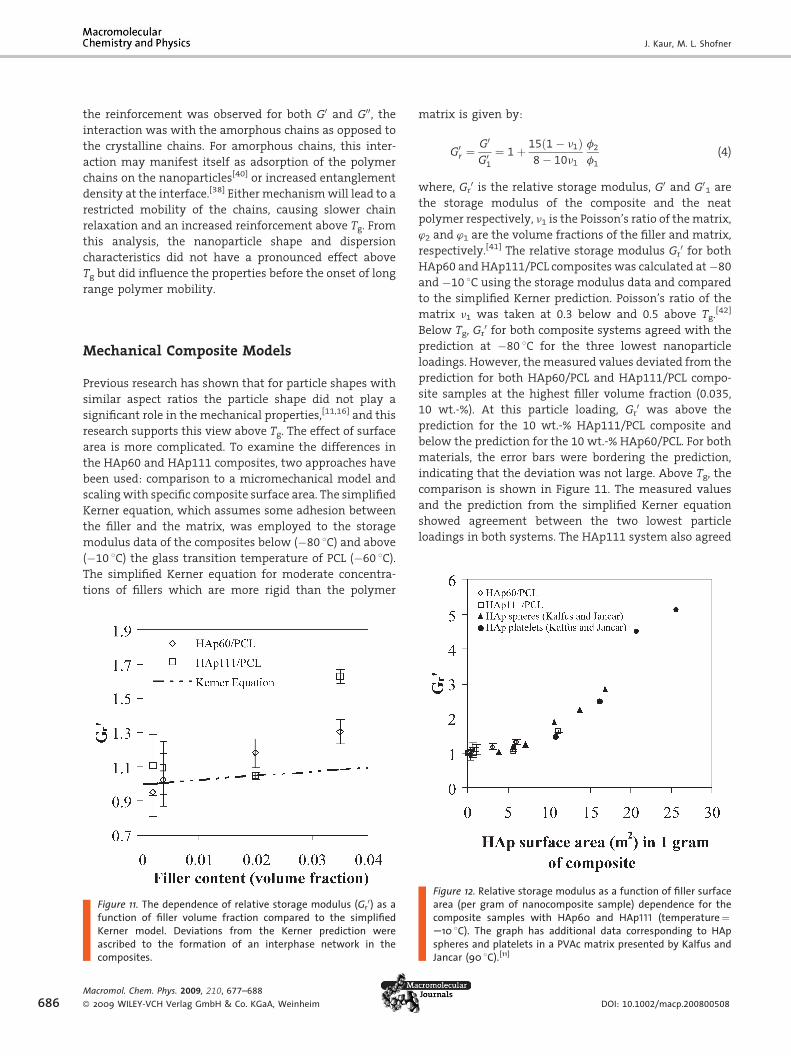
Figure 11. The dependence of relative storage modulus (Gr0) as a
function of filler volume fraction compared to the simplifiedKerner model. Deviations from the Kerner prediction wereascribed to the formation of an interphase network in thecomposites.
Macromol. Chem. Phys. 2009, 210, 677–688
� 2009 WILEY-VCH Verlag GmbH & Co. KGaA, Weinheim
matrix is given by:
FiguarecomS10sphJan
G0r ¼
G0
G01
¼ 1þ 15ð1� n1Þ8� 10n1
f2
f1
(4)
where, Gr0 is the relative storage modulus, G0 and G0
1 are
the storage modulus of the composite and the neat
polymer respectively, n1 is the Poisson’s ratio of thematrix,
w2 and w1 are the volume fractions of the filler and matrix,
respectively.[41] The relative storage modulus Gr0 for both
HAp60 and HAp111/PCL composites was calculated at�80
and �10 8C using the storage modulus data and compared
to the simplified Kerner prediction. Poisson’s ratio of the
matrix n1 was taken at 0.3 below and 0.5 above Tg.[42]
Below Tg, Gr0 for both composite systems agreed with the
prediction at �80 8C for the three lowest nanoparticle
loadings. However, themeasured values deviated from the
prediction for both HAp60/PCL and HAp111/PCL compo-
site samples at the highest filler volume fraction (0.035,
10 wt.-%). At this particle loading, Gr0 was above the
prediction for the 10 wt.-% HAp111/PCL composite and
below the prediction for the 10 wt.-% HAp60/PCL. For both
materials, the error bars were bordering the prediction,
indicating that the deviation was not large. Above Tg, the
comparison is shown in Figure 11. The measured values
and the prediction from the simplified Kerner equation
showed agreement between the two lowest particle
loadings in both systems. The HAp111 system also agreed
re 12. Relative storage modulus as a function of filler surfacea (per gram of nanocomposite sample) dependence for theposite samples with HAp60 and HAp111 (temperature¼8C). The graph has additional data corresponding to HAperes and platelets in a PVAc matrix presented by Kalfus andcar (90 8C).[11]
DOI: 10.1002/macp.200800508

Surface Area Effects in Hydroxyapatite/Poly(e-caprolactone) Nanocomposites
with the prediction at 2 vol.-% (5 wt.-%) and showed a
deviation at only the highest nanoparticle loading. The
HAp60 composite showed an earlier deviation at 2 vol.-%
(5 wt.-%) and the degree of deviation for prediction
increased at the highest particle loading. The measured
values that follow the predictionwere considered to have a
morphology with a continuous bulk polymer matrix
network. When the measured values deviated from the
prediction, the morphology of the nanocomposite was
dominated by an interphase network. The HAp111 would
be expected to form an interphase network at lower
nanoparticle loadings since more surface area was
available. However, this discrepancy was attributable to
the different dispersion levels achieved.
As shown in Figure 11, the HAp 60 and HAp111
composites showed different amounts of reinforcement at
particle loadings of 5wt.-% and 10wt.-%, but the simplified
Kerner model predicts the same relative storage modulus
for the nanocomposites at a given particle loading.
Therefore, the relative modulus was plotted as a function
of nanoparticle surface area to determine the correlation
between the twoHAp systems, as shown in Figure 12. Data
from Kalfus and Jancar[11] were plotted on the same chart.
These data were for HAp nanocomposites containing
either spherical or platelet nanoparticles in a poly(vinyl
acetate) (PVAc) matrix. The relativemodulus values shown
were collected at approximately 50 8C above Tg of each
matrix: 90 8C for PVAc and �10 8C for PCL. The relative
modulus of the both HAp60 and HAp111 composites was
found to follow the same trend as the data corresponding
to the different shapedHAp particles. These results suggest
that the polymer morphology (semi-crystalline PCL and
amorphous PVAc) did not play a significant role in the
degree of reinforcement above Tg in the nanocomposites
since the data fall on a continuous curve. The common
reinforcement trend also indicates that in the system
studied here the amorphous chains were primarily
responsible for reinforcement in the nanocomposites that
showed a deviation from the simplified Kerner model. In
addition, these data showed that the reinforcement can be
scaled with the amount of nanoparticle surface area
available in a polymer nanocomposite in a general way,
suggesting that it may be used as a parameter to modify
physical models concerning nanocomposite properties.
Conclusion
Polymer nanocomposites containing HAp nanoparticles
with different amounts of specific surface area were
processed and characterized to elucidate the effects of
nanoparticle surface area and polymer morphology on
nanocomposite properties. Through these studies, a
relationship between the amount of nanoparticle surface
Macromol. Chem. Phys. 2009, 210, 677–688
� 2009 WILEY-VCH Verlag GmbH & Co. KGaA, Weinheim
area available in a composite and the reinforcing efficacy
was indicated. While DSC measurements did not show
significant alterations to the crystalline content of PCL,
DMA measurements did suggest that the mobility of the
amorphous polymer chainswere restricted by the addition
of nanoparticles in both HAp60 and HAp111 composites.
In the nanocomposites, the interphase network was
formed at 5 wt.-% HAp60 and 10 wt.-% HAp111 as
evidenced by a discontinuous increase in storage modulus
above Tg and reinforcement values higher than those
predicted bymicromechanics. Differences in the formation
of an interphase network can be attributed to different
dispersion characteristics of the two nanoparticle systems.
A comparison to data collected for amorphous polymer
nanocomposites also indicate that the reinforcement
achieved is a general behavior for nanocomposites
containing low aspect ratio particles and that available
surface area is a valid parameter for nanocomposite design
and modeling prior to the formation of a nanoparticle
network.
Acknowledgements: The authors gratefully acknowledge fundingfrom Georgia Institute of Technology, the Solvay AdvancedPolymers Young Faculty Award, and the National ScienceFoundation under Award CMMI-0800019. Additionally, theauthors would like to thank Prof. Haskell Beckham, Prof. SatishKumar, Prof. Rina Tannenbaum, and their research groups for useof their laboratory facilities.
Received: October 16, 2008; Revised: February 5, 2009; Accepted:February 6, 2009; DOI: 10.1002/macp.200800508
Keywords: dynamic mechanical analysis; hydroxyapatite; nano-composites; poly(e-caprolactone)
[1] M. Alexandre, P. Dubois,Mater. Sci. Eng. R-Reports 2000, 28, 1.[2] C. M. Chan, J. Wu, J.-X. Li, Polymer 2002, 43, 2981.[3] F. Hussain, M. Hojjati, M. Okamoto, R. E. Gorga, J. Compos.
Mater. 2006, 40, 1511.[4] E. Reynaud, T. Jouen, C. Gauthier, G. Vigier, J. Varlet, Polymer
2001, 42, 8759.[5] K. I. Winey, R. A. Vaia, MRS Bulletin 2007, 32, 314.[6] A. Eitan, F. T. Fisher, R. Andrews, L. C. Brinson, L. S. Schadler,
Compos. Sci. Technol. 2006, 66, 1162.[7] B. Pukanszky, Eur. Polym. J. 2005, 41, 645.[8] A. Dufresne, Composite Interfaces 2000, 7, 53.[9] Y.-H. Hu, C.-Y. Chen, C.-C. Wang, Polym. Degrad. Stab. 2004, 84,
545.[10] X. J. Wang, Y. B. Li, J. Wei, K. de Groot, Biomaterials 2002, 23,
4787.[11] J. Kalfus, J. Jancar, Polym. Compos. 2007, 28, 365.[12] V. Favier, G. R. Canova, J. Y. Cavaille, H. Chanzy, A. Dufresne,
C. Gauthier, Polym. Adv. Technol. 1995, 6, 351.[13] M. Avella, F. Bondioli, V. Cannillo, E. Di Pace, M. E. Errico, A. M.
Ferrari, B. Focher, M. Malinconico, Compos. Sci. Technol. 2006,66, 886.
www.mcp-journal.de 687

J. Kaur, M. L. Shofner
688
[14] S. Mishra, S. H. Sonawane, R. P. Singh, J. Polym. Sci., Part B:Polym. Phys. 2005, 43, 107.
[15] J. Douce, J. P. Boilot, J. Biteau, L. Scodellaro, A. Jimenez, ThinSolid Films 2004, 466, 114.
[16] H. Liu, L. C. Brinson, Compos. Sci. Technol. 2008, 68, 1502.[17] F. M. Du, R. C. Scogna, W. Zhou, S. Brand, J. E. Fischer, K. I.
Winey, Macromolecules 2004, 37, 9048.[18] T. Ramanathan, H. Liu, L. C. Brinson, J. Polym. Sci., Part B:
Polym. Phys. 2005, 43, 2269.[19] M. Cadek, J. N. Coleman, K. P. Ryan, V. Nicolosi, G. Bister,
A. Fonseca, J. B. Nagy, K. Szostak, F. Beguin, W. J. Blau, NanoLetters 2004, 4, 353.
[20] G. Tsagaropoulos, A. Eisenberg, Macromolecules 1995, 28,6067.
[21] S. Gagliardi, V. Arrighi, R. Ferguson, M. T. F. Telling, Phys.B: Condens. Matter 2001, 301, 110.
[22] S. Bose, S. K. Saha, Chem. Mater. 2003, 15, 4464.[23] H. Aoki, ‘‘Science and Medical Applications of Hydroxyapa-
tite’’, JAAS, Tokyo 1991.[24] L. B. Kong, J. Ma, F. Boey, J. Mater. Sci. 2002, 37, 1131.[25] S. W. Provencher, Comput. Phys. Commun. 1982, 27, 213.[26] P. A. Webb, C. Orr, ‘‘Analytical Methods in Fine Particle
Technology’’, Micromeritics Instruments Corporation, Nor-cross, Georgia 1997.
[27] V. Crescenz, G. Manzini, G. Calzolari, C. Borri, Eur. Polym. J.1972, 8, 449.
Macromol. Chem. Phys. 2009, 210, 677–688
� 2009 WILEY-VCH Verlag GmbH & Co. KGaA, Weinheim
[28] M. Avrami, J. Chem. Phys. 1939, 7, 1103.[29] S. Koutsopoulos, J. Biomed. Mater. Res. 2002, 62, 600.[30] J. Arends, J. Christoffersen,M. R. Christoffersen, H. Eckert, B. O.
Fowler, J. C. Heughebaert, G. H. Nancollas, J. P. Yesinowski, S. J.Zawacki, J. Cryst. Growth 1987, 84, 515.
[31] M. Roy, J. K. Nelson, R. K. MacCrone, L. S. Schadler, C. W. Reed,R. Keefe, W. Zenger, IEEE Trns. Dielectr. Electr. Insul. 2005, 12,629.
[32] Y. L. Lu, G. B. Zhang, M. Feng, Y. Zhang, M. S. Yang, D. Y. Shen,J. Polym. Sci., Part B: Polym. Phys. 2003, 41, 2313.
[33] B. Q. Chen, J. R. G. Evans, Macromolecules 2006, 39, 747.[34] J. Y. Hao, M. L. Yuan, X. M. Deng, J. Appl. Polym. Sci. 2002, 86,
676.[35] R. G. Alamo, L. Mandelkern, Macromolecules 1991, 24,
6480.[36] S. Acierno, E. Di Maio, S. Iannace, N. Grizzuti, Rheol. Acta 2006,
45, 387.[37] G. Havet, A. I. Isayev, Rheol. Acta 2003, 42, 47.[38] S. S. Sternstein, A.-J. Zhu, Macromolecules 2002, 35, 7262.[39] J. Kalfus, J. Jancar, Polymer 2007, 48, 3935.[40] Q. A. Xi, C. F. Zhao, J. Z. Yuan, S. Y. Cheng, J. Appl. Polym. Sci.
2004, 91, 2739.[41] L. E. Nielsen, R. F. Landel, ‘‘Mechanical Properties of Polymers
and Composites’’, Marcel Dekker, Inc., New York 1994.[42] T. B. Lewis, L. E. Nielsen, J. Appl. Polym. Sci. 1970, 14,
1449.
DOI: 10.1002/macp.200800508