Embed Size (px)
Citation preview
Department of Industrial and Materials Science CHALMERS UNIVERSITY OF TECHNOLOGY Gothenburg, Sweden 2017
Surface Characterization of Contact Fatigue Tested Ground Spur Gears Master’s thesis in Materials Engineering
VIJAYA MOHAN SUBBARAMAIAH NAIDU


Surface Characterization of Contact Fatigue Tested
Ground Spur Gears
Vijaya Mohan Subbaramaiah Naidu
Department of Industrial and Materials Science
CHALMERS UNIVERSITY OF TECHNOLOGY Gothenburg, Sweden 2017

Diploma work in the Master Programme Materials Engineering Performed at: Chalmers University of Technology
Department of Industrial and Materials Science
&
Scania CV AB Materials Technology for Axle and Transmission, YTMN Södertälje, Sweden
Supervisor: Dinesh Mallipeddi Lic.Eng Department of Industrial and Materials Science [email protected] Matti Näslund Senior Engineer Department of Materials Technology for Axles and Transmission Scania CV AB [email protected]
Examiner: Mats Norell Senior Lecturer Department of Industrial and Materials Science [email protected]

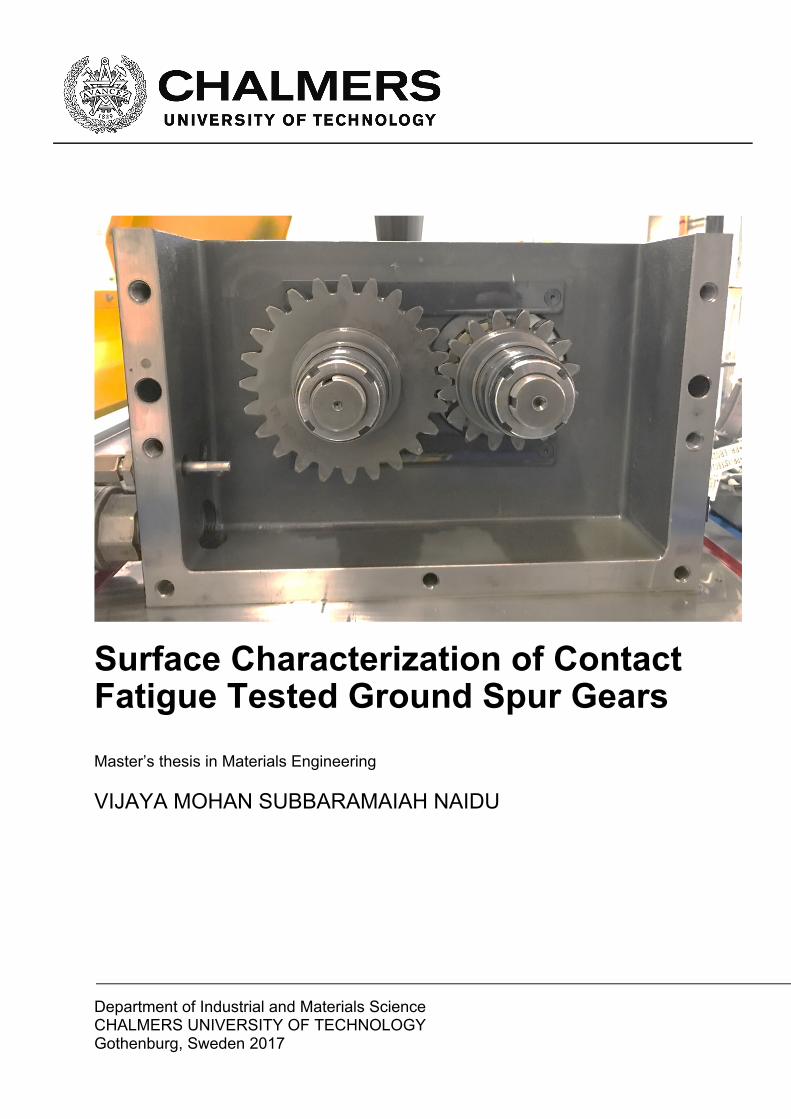
Surface Characterization of Contact Fatigue Tested Ground Spur Gears Vijaya Mohan Subbaramaiah Naidu © Vijaya Mohan Subbaramaiah Naidu, 2017. Department of Industrial and Materials Science Chalmers University of Technology SE-412 96 Gothenburg Sweden Telephone + 46 (0)31-772 1000 Cover: Test Gearbox of the back to back FZG test rig with carburized ground spur gears mounted. Printed by Chalmers Reproservice Gothenburg, Sweden 2017

Surface Characterization of Contact Fatigue Tested Ground Spur Gears Vijaya Mohan Subbaramaiah Naidu
Abstract
A gearbox with gears of different sizes is a part of the vehicle transmission system that plays
an important role in transmitting the engine power. In service, gears fail in many ways but
mostly due to surface contact fatigue. Gear failures can cost thousands of dollars. Failure due
to contact surface fatigue represents an important fraction on all gear failures (about 20%
according to ASM, 1975) and other failure types can have origin from surface contact fatigue.
Micropitting is a kind of surface contact fatigue failure which causes pits on the surface of the
gear. It looks like dark gray patches to the naked eye. It can be observed in all types of hardened
gears and it can occur at a relatively low number of cycles say less than 106 cycles. Surface
roughness has the greatest influence on micro pitting. Compressive residual stresses on the
surface of the gears can be beneficial in improving the fatigue life of the gears.
The aim of this project is to closely study the evolution of residual stresses and surface
topography of ground gears that are contact fatigue tested in FZG test rig. To understand the
residual stress state and surface roughness change pattern closely test cycles with relatively
small intervals are performed. Residual stress and surface roughness were measured on all the
tested gears.
This report discusses the evolution of residual stresses and the change of the surface roughness
on contact fatigue tested carburized ground spur gears. It is found that micropitting starts to
initiate at 200 cycles. Compressive residual stresses on the surface tend to increase after 200
cycles and follow a pattern in decreasing over further testing. But, these stress changes are
confined only to 10 microns in depth from the gear surface. It is also found from this study that
magnitude of residual stress in the axial direction is only one-third of that in the profile
direction. The surface roughness keeps reducing gradually until 63k Cycles.
Keywords: Spur Gear, Residual stress, Surface topography, Micropitting

Contents
1 Introduction ........................................................................................................................... 1
2 Theoretical Background ......................................................................................................... 3
2.1 Residual Stress ............................................................................................................................ 3
2.2 Surface Roughness ..................................................................................................................... 5
2.3 Gear Geometry ........................................................................................................................... 6
3 Test Matrix/Test Conditions ................................................................................................... 9
4 Material ................................................................................................................................ 11
5 Gear Manufacturing ............................................................................................................. 12
6 Experimental Methods/Material Investigation .................................................................... 13
6.1 FZG Gear Test Rig ..................................................................................................................... 13
6.1.1 Mounting and Demounting of Test Gears ............................................................................ 14
6.1.2 Torque setting ...................................................................................................................... 15
6.2 Stylus Profilometry ................................................................................................................... 15
6.3 Surface Interferometry/ White Light Interferometry .............................................................. 16
6.4 Micro Hardness / Case Depth ................................................................................................... 18
6.5 Residual Stress / XRD for Stress Analysis ................................................................................. 19
6.5.1 X‐Ray Diffraction .................................................................................................................. 19
6.5.2 Diffractometer ...................................................................................................................... 19
6.5.3 Residual stress measurements ............................................................................................. 21
6.5.4 In‐depth residual stress measurements ............................................................................... 21
6.6 Scanning Electron Microscope ................................................................................................. 22
6.6.1 Basic construction of a SEM ................................................................................................. 23
7 Results and Discussion ......................................................................................................... 25
7.1 Surface Topography ................................................................................................................. 25
7.2 Tested Gear surface inspection ................................................................................................ 27
7.3 Surface Roughness – Profilometry ........................................................................................... 29
7.4 Surface Roughness – Interferometry ....................................................................................... 32
7.5 Case depth and Hardness ......................................................................................................... 34
7.6 Residual Stress .......................................................................................................................... 36
8 Conclusion ............................................................................................................................ 41

9 Future work .......................................................................................................................... 42
10 References ....................................................................................................................... 43

1
1 Introduction
A gearbox with gears of different sizes is a part of the vehicle transmission system that plays
an important role in transmitting the engine power. In service, gears fail in many ways and
surface contact fatigue is one of them. Gear failures can cost thousands of euros. Failure due to
contact surface fatigue represents an important fraction on all gear failures (about 20%
according to ASM, 1975) and other failure types can have origin from surface contact fatigue
[1].
Micropitting is a kind of surface contact fatigue failure which causes pits on the surface of the
gear. It can be seen as dull and dark gray patches to the naked eye. It can be observed in all
types of hardened gears and it can occur at a relatively low number of cycles. Gears need to be
replaced in severe occasions because of the noise and increase in vibrations caused by the
resulting tooth profile deviations which might end up in catastrophic failure.
The aim of this project is to closely study the evolution of residual stresses and surface
topography of ground gears that are contact fatigue tested in FZG test rig. It is found from
literature [2] that surface roughness has the greatest influence on micro-pitting in addition to
residual stresses. In order to study this phenomenon in detail, both surface roughness and
residual stresses are measured on all the tested samples.
FZG test gear pair has a driving gear or pinion which is a 16-tooth gear and a driven gear or
wheel which is a 24-tooth gear. There are different types of surface finishing available and in
this research, Ground finished gears were tested. During the initial cycles, the asperities on the
gear tooth are deformed to get a much smoother surface and this is a part of the process called
Running-In. Surface characteristics can be different depending on the running in conditions and
these characteristics can be either be favourable or harmful for the gears in a long run. [3]
Having this in mind a test matrix is carefully developed to see how the surface characteristics
are evolving right from initial cycles.
Ground manufactured spur gears are tested using FZG test rig at Scania, Södertälje according
to the test matrix designed at Chalmers. Surface topography of gears is measured using stylus

2
profilometry and white light interferometry. Residual stresses on the surface of the tested gear
tooth are studied by making depth profiles. These so-called depth profiles are made by etching
the gear tooth and residual stresses are measured at various depths to understand the material
behaviour after each test cycle.
FZG gears are tested based on a set of test conditions which are discussed in detail in the later
section.

3
2 Theoretical Background
The surface of the gear is loaded cyclically and as the result, the surface is deformed plastically
and elastically inducing wear and contact fatigue in the long run. As the gears start to run,
friction between the contact surfaces will generate heat and that will be transmitted to the nearby
gear tooth surface. So, the microstructure of the gear surface might change [4]. The
characteristics connected with this is residual stress and surface topography which is discussed
in detail in the following sections.
2.1 Residual Stress
Merriam webster defines residual stress as “A stress that exists within a solid body though no
external stress-producing forces are acting”. Residual stresses are generally defined as locked-
in stresses in a material even when there are no external forces applied. Residual stresses can
be either tensile or compressive depending on how they are formed. Tensile residual stress
means the material is being pulled apart while compressive residual stress acts by pushing the
material together. [5]
As the name also implies it is the stress that is left over once the external forces stop acting on
a solid body. There are several mechanisms through which residual stress occurs, some of them
are plastic deformation of materials, temperature gradients induced stress, and phase
transformation etc., Stresses caused by non-uniform deformations may be a natural result of a
manufacturing process or can be a result of the desired stress process. Some of the processes
which induce residual stresses are welding and grinding. [6]
Thermally induced stresses are a result of non-uniform heating or cooling processes which
produce uneven expansion or contraction of the materials. For example, quenching of metals
tends to leave behind temperature gradient mechanised stresses. Chemically induced stresses
are a result of volume distortions caused by chemical treatments or phase transformations such
as solution or martensite hardening. [6]
Residual stresses are generated in a material by different mechanisms because of phase change
in addition to thermal, mechanical and chemical processes. Residual stresses are induced in a
material when there is a phase transformation resulting in the volume change i.e. transformation
from austenite to martensite. Plastic deformation of material can also induce residual stresses

4
in a material. Apart from these, residual stresses can also be induced by different cold working
processes such as shot-peening. Machining processes such as grinding, turning, milling can also
induce residual stresses.
In order to improve damage tolerance i.e. crack initiation and propagation, compressive residual
stresses are generally induced on the surface of the gears and this also improves the fatigue
performance [7]. It is a known fact that tensile residual stresses on the surface are detrimental
to the performance of the gears. But, compressive residual stresses on the surface in the other
hand gives higher fatigue strength.
Compressive residual stresses on the surface of the gears can be beneficial in increasing the
fatigue strength of the gears and also helps in delaying the initiation of cracks. When the gears
are in cyclic loading and the heat transmitted from friction can play a major role in changing
the residual stress pattern. This particular change occurs due to dislocation movement which
converts residual elastic strains into micro plastic strains [4].
In this research, compressive residual stresses are introduced by case hardening and grinding.
The geometry of the gear is distorted during case hardening. In order to maintain the geometry
as per specifications generally, a finishing process is carried out [3]. In this research, the gears
are ground finished. Grinding induces changes in residual stresses of the carburized gears [8].
To be precise the residual stresses that are introduced by hardening are altered due to ground
finishing. This introduces non-equal stresses in profile and axial direction. Residual stress levels
in profile direction can be more than twice that of stresses in the axial direction on the surface
[3].
The change in residual stress state is not throughout the gear but it’s limited to the outermost
surface of the gear. According to Mallipeddi [3] there is no difference in stress levels after 5µm
from the surface. The in-depth residual stress profiles are almost same in both profile and axial
direction. The same is true for the gears that are tested for a long time. The residual stress
change is confined only to the near surface region.
Research shows that the compressive residual stresses increases after carburizing and surface
finishing. But, once the gears start to run they are influenced by cyclic loading and heat, that is
generated from friction compressive residual stresses tend to decrease continuously and

5
transform into tensile residual stress. This phenomenon of change in residual stress state is due
to dislocation movements according to Batista et al [4]. The major aim of this thesis is to
understand the residual stress change pattern. This is achieved by designing a test matrix with
relatively small intervals between a number of cycles to see if the compressive residual stresses
are actually decreasing continuously or do they change in a different pattern. The test matrix is
discussed in Chapter 3.
2.2 Surface Roughness
Surface roughness is quantified in microns. It is the difference between the peaks and valleys
on the surface. The surface is termed as rough if the difference between the peaks and valleys
to the mean plane is high and smooth when the difference is low. Surface roughness plays a
very important role in determining the fatigue life of a component. According to Erichello et al
[2] surface roughness has the greatest influence on micropitting. The gears used in this study
were of Ra = 0.4 µm. When the gears start running they will be in sliding and rolling contact
and the asperities get in contact first and will be deformed plastically to form a smooth surface.
But at the same time, the presence of these asperities can be worse for the gear surface while
running on high loads.
According to ISO 4287, the parameters of surface roughness are defined as follows,
Ra – Arithmetic mean of the values from the mean line of the assessed roughness profile
Rt – Total height of the profile
Rp – Maximum profile peak height
Rv - Maximum profile valley depth
Rz – Maximum height of the profile
Rq – Root mean square deviation of the assessed profile
Most of the comparison of the surface roughness results in this research is based on arithmetic
mean deviation (Ra). Ra is the average of roughness values of peaks in the roughness profile. Ra
is calculated from Equation 1 where, L is the measurement distance and Z(x) is the profile
height function.
Equation 1 Calculation of Arithmetic mean of surface roughness

6
Calculation of Ra from the profile is shown in Figure 1. Other parameters such as Rt,Rp, Rv and
Rz are shown in Figure 2 and Figure 3 respectively.
Figure 1 Arithmetic mean roughness values (Ra)
Figure 2 Total Height of the Profile (Rt)
Figure 3 Profile showing Maximum Profile peak height (Rp), Maximum Profile peak height (Rp), Maximum height of the profile (Rz)
2.3 Gear Geometry
Gears are toothed wheels that transmit power. There are two gears in a spur gear arrangement.
One is wheel or the driving gear and the other one is pinion or the driven gear. It is important
to know the spur gear nomenclature to understand the experiments that were performed in this
research better.
7
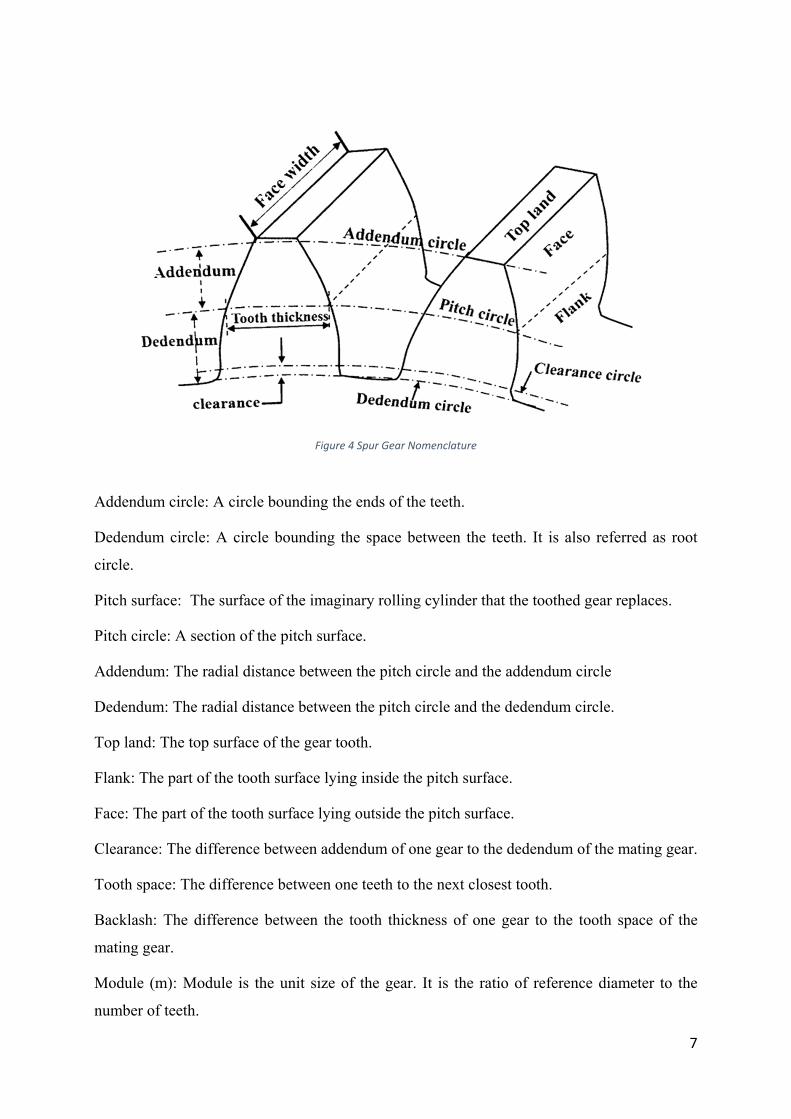
Figure 4 Spur Gear Nomenclature
Addendum circle: A circle bounding the ends of the teeth.
Dedendum circle: A circle bounding the space between the teeth. It is also referred as root
circle.
Pitch surface: The surface of the imaginary rolling cylinder that the toothed gear replaces.
Pitch circle: A section of the pitch surface.
Addendum: The radial distance between the pitch circle and the addendum circle
Dedendum: The radial distance between the pitch circle and the dedendum circle.
Top land: The top surface of the gear tooth.
Flank: The part of the tooth surface lying inside the pitch surface.
Face: The part of the tooth surface lying outside the pitch surface.
Clearance: The difference between addendum of one gear to the dedendum of the mating gear.
Tooth space: The difference between one teeth to the next closest tooth.
Backlash: The difference between the tooth thickness of one gear to the tooth space of the
mating gear.
Module (m): Module is the unit size of the gear. It is the ratio of reference diameter to the
number of teeth.

8
FZG type C-PTX gears were used in this research shown in Figure 5 and their geometry is
shown in Table 1
.
Parameter Wheel Pinion
Number of teeth 24 16
Centre distance(mm) 91.5
Face width(mm) 14 14
Pitch diameter(mm) 109.8 73.2
Tip diameter(mm) 118.35 82.45
Module 4.5 4.5
Pressure angle(o) 22.44 20
Table 1 Gear geometry of the FZG gears
Figure 5 FZG Gear ‐ Wheel (Left) Pinion (Right)

9
3 Test Matrix/Test Conditions
The test goes from initial cycles to a high number of cycles approaching the end of life of the
gear. The test matrix consists of 12 tests the shortest test being run for just 8 seconds and the
longest one for around 296 hours.
The test matrix that is used in this project is as follows:
Table 2 Test Matrix
All the above tests were carried out with the same test conditions in the FZG test bench. The
contact pressure was set to be 2.4GPa which translates into load stage 8. This was achieved by
setting the torque to 239.3Nm on the test bench computer which is equivalent to the contact
pressure of 2.4GPa on the pitch point. The speed of the wheel or the driven gear is set to 1500
RPM and the speed of the pinion or the driving gear was therefore 2250RPM. The test was run
with 75W-80 MTF oil. The lubricant temperature was set to 85oC.
S.No Cycles Time Log Scale
Pinion Wheel
1 As-Ground As-Ground
2 300 200 8 secs 2.3
3 945 630 25 secs 2.8
4 3000 2000 78 secs 3.3
5 9000 6000 4 mins 3.8
6 30k 20k 13 mins 4.3
7 94.5k 63k 42 mins 4.8
8 300k 200k 133 mins 5.3
9 945k 630k 7 hrs 5.8
10 3.24x10^6 2.16x10^6 24 hrs 6.3
11 9.48x10^6 6.32x10^6 70 hrs 6.8
12 3.9x10^7 2.6x10^7 289 hrs 7.4

10
According to the plan, Test No.12 was planned to run for 26000k cycles on the wheel. But, the
test stopped even before the planned number of cycles because of the heavy vibration due to
macro pitting on the wheel. This test was actually run for only 22092k cycles.
11
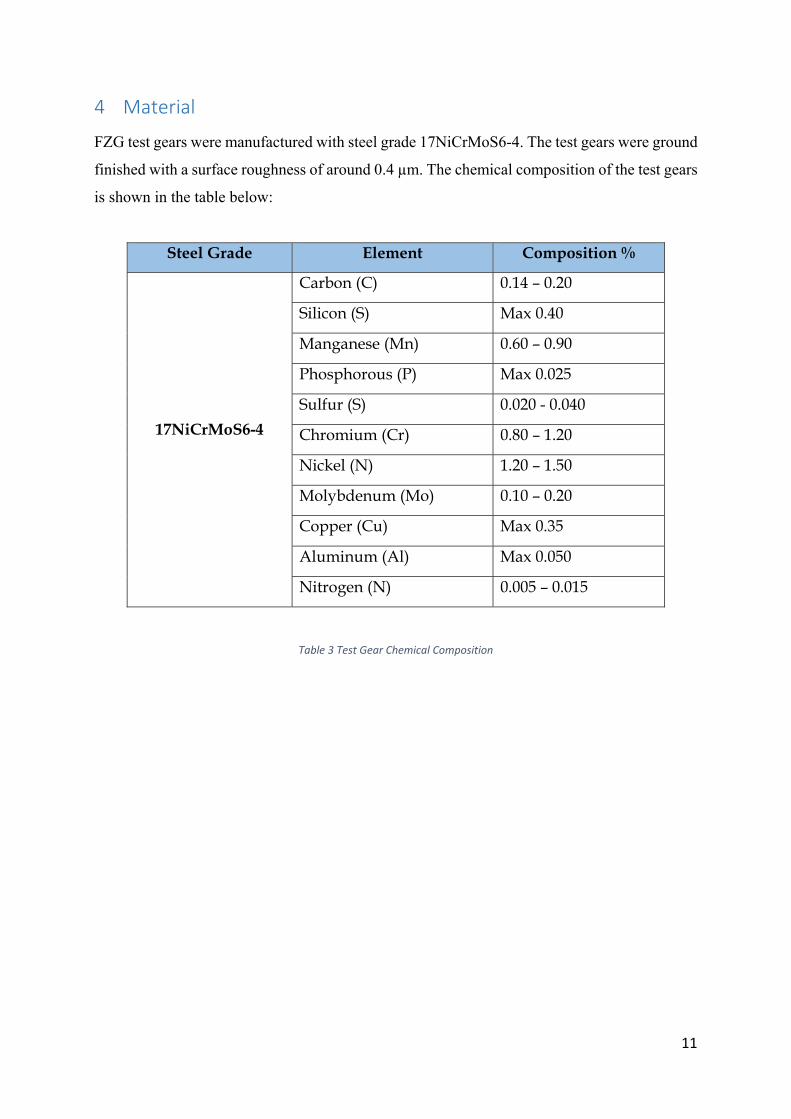
4 Material
FZG test gears were manufactured with steel grade 17NiCrMoS6-4. The test gears were ground
finished with a surface roughness of around 0.4 µm. The chemical composition of the test gears
is shown in the table below:
Steel Grade Element Composition %
17NiCrMoS6-4
Carbon (C) 0.14 – 0.20
Silicon (S) Max 0.40
Manganese (Mn) 0.60 – 0.90
Phosphorous (P) Max 0.025
Sulfur (S) 0.020 - 0.040
Chromium (Cr) 0.80 – 1.20
Nickel (N) 1.20 – 1.50
Molybdenum (Mo) 0.10 – 0.20
Copper (Cu) Max 0.35
Aluminum (Al) Max 0.050
Nitrogen (N) 0.005 – 0.015
Table 3 Test Gear Chemical Composition

12
5 Gear Manufacturing
Case hardening is a heat treatment process used for steels with low carbon content say 0.1 to
0.3 wt%. During carburizing, the steel in question is heat treated at elevated temperatures in a
carbon rich environment for a particular time. This process is done on steel components after
machining. In this case, gears are machined to the required geometry and then heat treated.
Minor distortions may occur after heat treatment and the gears are mechanically finished to
achieve the required geometry. Carburizing helps in improving the component’s resistance to
failure by diffusion of carbon into the surface of the component while creating a case with
higher hardness and compressive residual on the surface and relatively less hardness in the core.
[9]
Generally, carburizing is done by heating the steel components in a closed atmosphere furnace
with rich carbon environment. The longer the components are heated in the carbon rich
environment thicker the carburized layer. Heat treatment process for carburizing is shown in
Figure 6. After carburizing, the gears were quenched which results in a volume change
associated with phase transformation of austenite into martensite. This gives rise to compressive
residual stresses on the surface of the gear. Later, the component is tempered at around 200C
for 2 hours.
Figure 6 Heat treatment process of case carburizing. [10]

13
6 Experimental Methods/Material Investigation
The main aim of this thesis is to study the evolution and distribution of residual stress and
surface roughness on ground finished carburized gears after testing them in FZG test rig for a
different number of cycles and how these characteristics evolve over testing from a low number
of cycles to the high number of cycles approaching the end of life. In this section, the different
techniques that are used in this study are discussed briefly.
The gears were tested using FZG test rig at Scania technical centre, Södertälje.
6.1 FZG Gear Test Rig
FZG Gear test rig is a test bench manufactured by Strama MPS powered by an electric motor.
This rig was used in this research work see Figure 7. It has two gearboxes named test gearbox
and slave gearbox. The test and slave gearboxes are engaged by two torsional shafts out of
which one shaft is equipped with a clutch which is used to set the torque on the test gears. Test
gearbox can be temperature controlled and both the gearboxes have the ability to monitor the
temperatures with the help of inbuilt temperature sensors. The test and slave gearboxes are
equipped with a heating unit which can heat the lubricant before starting the test. Heat was
transmitted due to the friction of gears during the test in both test and slave gearboxes. Both the
gearboxes have cooling units so desired temperatures can be programmed and that will be
maintained throughout the test. Vibration sensors are also installed on the gearboxes so that the
test will be automatically stopped if the gears reaches the programmed vibration limits to avoid
any catastrophic failures. The test and slave gearboxes didn’t have the same type of gears, Test
gears were spur gears while helical gears were used in slave gearbox.

14
Figure 7 FZG Test Rig
Parameters such as number of cycles (wheel or driven gear), speed, torque, test gearbox
temperature can be programmed in the test bench in the form of recipes. There are different
steps in a recipe, say in the first step we program only the test gearbox temperature and in the
second step the number of cycles is programmed. Test progresses step by step hence, for the
used recipe the test will not be started until the test gearbox is heated to the programmed
temperature.
6.1.1 Mounting and Demounting of Test Gears
The test gearbox is opened and cleaned thoroughly with methylated spirits (T-röd). Torque
should be released before mounting the test gears so the shafts rotate freely. The test gears are
heated at 150oC for 5 minutes so that they expand a bit to be mounted easily on the shafts. The
wheel or the driven gear was mounted first followed by the pinion or the driving gear. The gears
were locked onto the shaft by a series of nuts and then the gearbox is locked. Lubricant is filled
in this stage in the test gearbox and it’s always a measured amount of lubricant as per the test
conditions. Now the gearbox is locked and all the screws were tightened with a torque wrench.
All the sensors are put back in place on the test gearbox and the same things are followed while
demounting the gears only exception being the pinion or the driven gear was demounted first.
Oil samples can be collected after the test if any oil testing is required otherwise the oil can be
drained into the oil well by opening the oil valve.

15
Figure 8 Test Gearbox with Wheel and Pinion mounted
6.1.2 Torque setting
Torque was set manually on this rig with the help of a special tool as shown in Figure 9. This
tool is mounted on the clutch and it’s screwed to set the desired torque. Torque can be monitored
with the help of the inbuilt computer of the test rig. Once the desired torque is achieved the
bolts are tightened and the tool in demounted.
Figure 9 Torque setting in FZG test rig
6.2 Stylus Profilometry
A profilometer is a device that is used to determine the roughness of a surface. It measures the
difference between the highest and the lowest point of a surface accurately to nanometer range.
There are two types of profilometers, Contact and non-contact profilometers, both profilometers
are used in this research.

16
Stylus profilometer was used to determine the surface roughness of a component. In this
research, MarTalk with drive unit LD120 was used with a measuring length of around 4 mm at
a speed of 0.2 mm/s.
Stylus profilometer or otherwise collectively called as contact profilometer uses a probe to
physically touch the surface and is moved along the surface of the component being measured
to acquire the surface height. Stylus profilometer has a table and a moving arm to which the
probe is attached. This method requires a force feedback and it is highly sensitive in Z direction
which will give very accurate surface roughness. Contact profilometers are not sensitive to
light, surface reflection or surface color which gives the advantage of measuring any kind of
surface to highest precision. The stylus tip and shape can influence the measurements.
6.3 Surface Interferometry/ White Light Interferometry
White light interferometry is an optical non-contact profilometer which is used to measure
surface topography. In this research, Sensofar PLµ 2300 with a 50x/0.55 DI lens from Nikon
was used for acquiring the surface topography and SensoMAP software to analyse the surface
topography. Sensofar PLµ 2300 is shown in Figure 10 for reference.
Sensofar PLµ 2300 is a multi-lens setup which makes it easy to switch between interferometry
and confocal microscope.

17
Figure 10 Sensofar PLµ 2300
White light interferometry basically uses beams of light to read the surface. A light beam is shot
out, the beam is split into two as reference beam and measurement beam (light beam from the
test material). Interference occurs because of these two beams and then light and dark bands
are formed which are otherwise called as interference fringes. Vertical Scanning Interferometry
(VSI) mode is used in this research. VSI mode used a neutral filter for white light and vertically
scans the test material with the help of focus and interference fringes. Interference fringes are
further processed to calculate surface heights.

18
6.4 Micro Hardness / Case Depth
Case depth is defined as the thickness of the hardened carburized layers on a component. Case
hardening is generally used in components where high wear and fatigue resistance is required.
Case depth is measured according to ISO 2639. Hardness was measured on the surface of the
gear and the values were plotted with hardness in vickers on the y-axis and distance from the
surface on the x-axis. The corresponding case depth was calculated by drawing a parallel line
at 550HV onto the curve and projecting it on the x-axis. In addition, Surface hardness was also
measured with a knoop indent at 20µm from the surface.
The case depth evaluation was made at half the tooth height (approximately at the pitch line)
and at the tooth root position as shown in the Figure 11. The load used was 9.81 N and Vickers
indents were done according to ISO 6507-1.
Figure 11 Positions for Case Depth Measurements
Qness Q10 A+ is used to measure both surface hardness and case depth. A picture of the
equipment is shown in Figure 12 for reference.
Figure 12 Qness Q10 A+ Micro‐hardness equipment

19
6.5 Residual Stress / XRD for Stress Analysis
Tensile residual stress is generally undesirable, certain tools and methods are required to detect
it. One such method is X-ray diffraction.
6.5.1 X‐Ray Diffraction The X-ray diffraction method is a non-destructive technique that can be used for the
measurement of residual stresses on the surface of materials. X-ray diffraction techniques
exploit the fact that when a metal is under stress, applied or residual stress, the resulting elastic
strains cause the atomic planes in the metallic crystal structure to change their spacing. X-ray
diffraction can directly measure this inter-planar atomic spacing; from this quantity, the total
stress on the metal can then be obtained. [11]
The principle behind XRD method is Braggs law,
Mathematically it refers to the simple equation,
nλ = 2dsinθ
Where, d is the distance between atomic layers in a crystal
Where, θ is the angle of incidence of X-rays
And λ is the wavelength of incident X-rays with n being an integer.
This law was derived by English physicists Sir W.H Bragg and W.L. Bragg in the year 1913
who later went on to be awarded the Nobel Prize in physics.
In essence, once the peaks are measured, the interplanar distance can be calculated and then
compared to a non-stressed sample to determine the residual stress.
6.5.2 Diffractometer A diffractometer is a device which is used to analyse the structure of any crystalline material
by inducing x rays or neutrons at an angle and detecting the scatter pattern produced by the
interaction with the material. It primarily consists of an X-ray generator, a turntable on which
the samples are placed and a detector as shown in the Figure 13 and Figure 14.

20
Figure 13 Schematic of a diffractometer
The detector detects the constructive interference patterns of the scattered radiation and the
angle is measured and plotted as shown in the graph.
Figure 14 Schematic of a diffractometer
When the sample is tilted using the turntable, the angle of incidence changes and expectedly
the position of the detector should also be changed in order to observe a favourable interference
pattern. This results in a new reading and when they are plotted against each other, the
difference in planar spacing can be observed which can then be used to evaluate the stress
levels.

21
Figure 15 XSTRESS 3000 G2R
6.5.3 Residual stress measurements
Residual stresses were measured using XSTRESS 3000 G2R as shown in Figure 15 with
chromium X-ray source. Residual stresses were measured in 3 directions (axial, intermediate
and profile directions) with 5 equal tilts from –45o to +45o. X-rays were irradiated using a 1.5
mm diameter collimator which was custom made for this research. Stresses were measured at
two points on the gear tooth, one at the addendum and another at the dedendum as shown in
Figure 16.
Figure 16 Gear Mapping for Residual Stress Measurements
6.5.4 In‐depth residual stress measurements
X-rays used in XRD are capable of penetrating to only a few micrometres from the surface. So,
in order to measure subsurface residual stresses, we have to expose the material to X-rays.

22
Electrochemical etching was used to remove the material for measuring subsurface residual
stresses. 3M NaCl solution was used as the electrolyte. Gear tooth was set as anode by
connecting it to positive charge and the cone shaped electrolyte holder contains the cathode.
These two are connected by placing the cathode on the gear tooth. On applying electric current
the gear surface is etched by dissolution of the material into the electrolyte.
After etching the depth is measured using a stylus profilometer to make sure residual stresses
are measured at desired depths. The material was removed in a circle of diameter 3.5mm and
etching is done exactly at the same point over again to make sure the stresses are measured at
the same point in depths. The electrochemical cell used for etching is shown in Figure 17.
Figure 17 Electrochemical cell used for Etching [3]
6.6 Scanning Electron Microscope
Scanning electron microscope (SEM), is a type of electron microscope, designed for directly
studying the surfaces of solid objects, that utilizes a beam of focused electrons of relatively low
energy as an electron probe that is scanned in a regular manner over the specimen. [12]
It works by the irradiation of the area of observation of a sample by a focused electron beam
and recording the signals which emerge because of interaction between the electrons and the
sample. It is capable of 10x to more than 10000x magnification levels and can be used to
observe a wide variety of materials on a nanometer to micrometer scale. It also has the benefit
of offering a 3D image of the topography of the scanned surface [13].

23
6.6.1 Basic construction of a SEM Scanning Electron Microscope (SEM) broadly consists of a microscope column and a control
console. As the names imply, the microscope column is where the sample is placed to be
observed and consists of all the imaging devices and the control console is through which SEM
is operated and where the results are displaced. [13]
Microscope column
The electron column is made up of an electron gun, some electron lenses and a vacuum
pump all housed in an enclosure
The vacuum pump generates a vacuum of about one billionth of atmospheric pressure.
The electron gun accelerates free electrons with the help of cathode ray tubes to an
energy of 0.1 to 30 keV
To improve the focus of the electron gun, electron lenses which essentially are circular
magnets are used to deflect the electron beams and to improve the focus.
In order to scan the object as desired (either as a rectangular raster scan or a circular
scan) scanning coils are used to trace the electron beams across the samples held in the
specimen stage.
In order to detect the signals occurring from the sample-electron beam interaction, two
common electron detectors can be used. One to detect secondary electrons and the other
to detect the backscattered electrons.
Control console
The control console is made up of input devices like keyboards/mice and output devices
like monitors etc.,
It also has an inbuilt computer to merge the data from the detectors to generate visual
images.
Some of the aspects that are accessible via the console are control over the lens to
determine the focus of the beam, manipulating the contrast of images, control over the
scanning trace.
Secondary electrons
The electron beam interacts with the electrons present in the material. Since electron-electron
interactions are repulsive by nature, the highly-energized electron beam tends to displace the
host electrons out of their atoms. These slow moving ejected electrons can be detected via a

24
positively charged detector. The images generated by secondary electrons are in 3 dimensions
as they can be attracted from multiple directions as they are slow moving [14]
Secondary electrons signal was used in this research with EHT of 10KV and Working distance
of around 15-20mm. The purpose of using SEM in this research was to study the damage and
wear on the gear surface in detail. Gear tooth samples were cut out of the gear and cleaned with
ethanol and mounted in the SEM chamber.

25
7 Results and Discussion
7.1 Surface Topography
SEM images with high magnification are used for studying the surface topography. Surface
topography plays an important role in the fatigue life of the gear. There were irregular peaks
and valleys seen in the image and those irregular peaks are called as asperities. In this section,
the main focus was to understand how these asperities are smoothened by plastic deformation
over different tests. All the SEM images shown are of the wheel or the driving gear with the tip
at the top and the root at the bottom. SEM images of all the samples are not examined in this
research. Instead, SEM images of selected samples are presented for better comparison of the
results. Surface topography of as-ground gear tooth is shown in Figure 18.The figure on the
left shows the grinding lay at addendum and the figure on right shows the grinding lay in the
dedendum.
Figure 18 SEM image of As‐Ground gear tooth ‐ Addendum (Left) Dedendum (Right)
According to the literature [2], negative sliding region is more prone to micro pitting and in this
research the negative sliding for the wheel is at dedendum hence, dedendum is more prone to
micro pitting than addendum and it was observed that heavy micro pitting had occurred at
dedendum as seen in Figure 19. In addition to the relatively heavy micropitting at the
dedendum, sliding direction can also be seen on the picture in the right where material deforms
plastically in the sliding direction which leads to the formation of micropits.

26
Figure 19 SEM images of 63K Cycles gear tooth ‐ Addendum (Left) Dedendum (Right)
As discussed in 7.2, Micro pits develop inside a spindle shaped dark band at the dedendum as
shown in the SEM image in Figure 20. Micropitting occurs in this spindle shaped area. Sliding
direction can be seen in the picture.
Figure 20 SEM Image of 2160K Cycles showing micro pit area in Spindle shape
S
S S

27
7.2 Tested Gear surface inspection
The gears were thoroughly inspected after testing and gear tooth samples were cut out from all
the tested gears for material characterization. Macro photographs of the gear tooth were
captured to understand the micro-pitting progression in macro level. On examining the gears, it
was found that areas with dark bands starts to initiate at relatively low cycles (200 cycles) and
contact pattern was visible to the naked eye.
The progression of dark bands can be seen in the series of pictures shown in Figure 21.
Figure 21 Macro Photos of tested gear tooth
As seen in as-ground gear tooth the grinding lay is quite visible. After the gear was tested for
200 cycles we can see some dark band at the dedendum which might be the deformation pattern
of the asperities. This shows that the area with dark bands showing the deformation pattern
initiating already at 200 cycles at high loads at dedendum. Load used in this research was 239.3
Nm. Since high loads were used for initial cycles plastic deformation of asperities on the surface
would have occurred resulting in dark bands on the surface of the gear. It was observed in
As - Ground 200 Cycles 630 Cycles
6000 Cycles
2000 Cycles
20K Cycles 63K Cycles 200K Cycles
630K Cycles 2160K Cycles 6320K Cycles 22092K Cycles

28
research [15] [2], that negative sliding is more prone to micro pitting. Since, driven gears are
examined in this research, negative sliding is at dedendum therefore dedendum is more prone
to micro pitting. It was also observed that there were no signs of dark bands at the addendum
until 22092k cycles as per the macro photos presented above. The dark bands as seen in the
macro photos tend to grow progressively along the contact pattern. The dark bands are spindle
shaped and it grows gradually over further testing. Micropitting occurs inside this spindle
shaped area. A small white patch can be seen on 630k cycles samples inside the dark spindle
shaped region which might indicate pitting. As the gears are in rolling-sliding contact, the peaks
around the pits plastically deform towards the sliding direction. Plastic deformation of these
pits can be seen clearly in SEM images which are discussed in the previous chapter. After 6320k
cycles, the contact pattern of the gears progresses towards the addendum as seen in the figure
and micropits are initiated in the addendum and the pits which are already present in the
dedendum starts to develop into bigger pits.
It has been observed [4] that micropitting starts to initiate after 20 hours of testing in carburized
gears. But, it’s interesting to see that dark bands actually start to initiate after few seconds of
testing and micropits are developing inside these dark bands on further testing.

29
7.3 Surface Roughness – Profilometry
Surface roughness is actually the difference between the peaks and valleys on the surface on a
microscopic level. Surface roughness plays a very important role in determining the fatigue life
of a component. According to a study by Erichello [2], the fatigue life of a gear decreases as
the surface roughness increases. With this in mind, the surface roughness of the gears is
measured for as manufactured gear tooth as well as all the tested gear tooth to understand how
the surface roughness is changing over testing under constant loads.
Figure 22 Mapping for surface roughness measurements
In this section, surface roughness measurements using profilometry is discussed. The gears used
in this research had a surface roughness (Ra) of around 0.4 µm. Surface roughness was measured
at four points using stylus profilometer. The mapping of the measurement points on the gear
tooth is shown in the Figure 22. The measurement distance is 6mm and of which 4mm is
evaluated. As shown in the Figure 22 position 1 is measured along the axial direction in the
addendum. Position 2 in the axial direction of dedendum of the gear tooth. Position 3 is
measured in the profile direction of the dedendum and position 4 in the profile direction of the
addendum of the gear tooth.
From the surface roughness results, it is clear that the gear surface is smoothened while testing
the gears under load. A graph showing how the roughness had changed over the cycles along
the profile direction of the gear flank is shown in Figure 23. Roughness value for 22092k cycles
was removed from the graph as it's relatively high (2.482µm) because of heavy pitting on the
gear tooth. The surface roughness of as-ground gear is around 0.4µm and over the cycles, the
surface roughness reduces relatively. But after 63k cycles, the surface roughness tends to
increase remarkably, this could correspond to the progression of micro pits. But it can also be
that the stylus ran over many micropits and in 200k cycle’s sample, they were smoothened. No

30
conclusion can be made based on these results since, the same gear was not tested further but it
was a different gear that was tested for a longer time. In fact, 63k cycles had more peaks and
valleys that resulted in high Ra value when compared to the other samples. After 63k cycles
micro pits tend to develop and progress more evenly hence the difference in surface roughness.
Micro pits coalesce and progress into pits after 6320k cycles and the gear fails eventually.
Arithmetic mean surface roughness (Ra) in profile direction follows a similar pattern at both
addendum and dedendum as seen in Figure 23.
Figure 23 Surface Roughness (Ra) in Profile Direction
Surface roughness measured in the axial direction is different to the ones measured in profile
direction as the stylus was run along the grinding lay of the gear tooth. So, the roughness values
for as-ground samples measured in the axial direction was not similar to the results in profile
direction. But, as we can see in Figure 24 the gears tend to smoothen until 2160k cycles at
addendum. The difference in roughness at addendum and dedendum is because of the heavy
pitting at the dedendum of 2160k cycles sample. Figure 21 shows heavy pitting on 2160k cycles
sample at the dedendum.
0,200
0,300
0,400
0,500
0,600
0,700
Ra (µm)
No. of Cycles
Surface Roughness (Ra) in Profile Direction
Addendum
Dedendum

31
Figure 24 Surface Roughness (Ra) in Axial Direction
Apart from Ra, other parameters were measured for surface roughness. All the results of
measurement at dedendum in the profile direction are presented in Table 4. Other than these
results, it should be stressed upon the fact that only one line over the surface of the gear tooth
was measured using stylus profilometer. It is uncertain that the micropits or pits might not fall
on the line of measurement always. So, profilometer might not be suitable for studying the
evolution of local damage as the data from a single line measurement is not enough to draw any
conclusion about the progression of local damage.
Position 3 (Dedendum Profile Direction)
Sample Ra(µm) Rq(µm) Rz(µm) Rt(µm) Rp(µm) Rv(µm) Rsk Rku
As-Ground 0.416 0.52 2.456 3.199 1.107 1.349 -0.028 3.024
200 Cycles 0.397 0.513 2.294 3.636 1.006 1.288 0.462 3.431
630 Cycles 0.387 0.583 3.072 7.577 1.794 1.278 2.638 22.893
2000 Cycles 0.396 0.494 2.166 2.95 0.968 1.197 0.665 2.921
6000 Cycles 0.393 0.492 1.956 2.788 0.819 1.137 0.591 2.755
20K Cycles 0.381 0.49 2.149 3.572 0.94 1.209 0.704 3.424
63K Cycles 0.682 1.178 5.403 10.43 3.249 2.154 1.912 12.595
200K Cycles 0.48 0.635 4.015 6.881 1.81 2.205 0.103 6.202
630K Cycles 0.495 0.669 3.233 5.507 1.12 2.113 0.204 4.04
2160K Cycles 0.395 0.505 2.829 5.229 0.789 2.04 -0.386 4.149
6320k Cycles 0.56 0.767 4.051 6.723 1.165 2.886 -1.268 8.655
22092K Cycles 2.482 4.513 15.448 42.406 5.068 10.379 -3.118 20.027
Table 4 Profilometry results of Dedendum in profile direction
0,000
0,050
0,100
0,150
0,200
0,250
0,300
Ra(µm)
No. of Cycles
Surface Roughness (Ra) in Axial Direction
Addendum
Dedendum

32
7.4 Surface Roughness – Interferometry
Surface roughness was measured using non-contact white light interferometer in addition to
profilometer. The values from interferometer are not as accurate as profilometer since there are
many external factors that can affect the measurement values such as external light. But, this
method is used to visualize how the surface looks in 3D.
Surface roughness was measured in both addendum and dedendum with measurement area of
1.122*1.168mm2 which was actually measured using extended topography of 5*7 images
stitched together with an overlapping area of 15%. After measuring the profile, the .plu file was
evaluated using SensoMAP. SensoMAP is a software which is used to evaluate the
interferometry surfaces by adding various filters, cut offs and extracting a 3D image from the
measured .plu file.
The measured profile is imported to SensoMAP software and the profile is levelled first. After
levelling, the form is removed which is actually the involute profile in this case. Now the profile
is filtered to separate waviness and roughness from the profile. Robust Gaussian filter with a
cut-off of 8µm was used for filtering. The high peaks and deep valleys were filtered by
thresholding the profile from 0.1% to 99.9%. This resulted in a filtered surface.
Figure 25 Surface Interferometry 2D and 3D Images of 63K Cycles

33
Figure 26 Surface Interferometry Images of 200K Cycles (Left) and 630K Cycles (Right)
This method indicate that micropits should start to develop after 63k cycles. The micropits are
seen as red circles in the middle of the Figure 25. It was observed that the micropitting at this
stage was not that severe. As the test continues these micro pits evolve into bigger pits with
higher peaks around them as shown in Figure 26. Peaks around the micro pits on further testing
under load tend to deform plastically towards the sliding direction. From the surface
interferometry images presented, it is evident that even though micro pits start to initiate in
early cycles they tend to grow only after 63k cycles. As per the surface image of the sample
tested for 630k cycles, it can be seen that micro pits are evenly spread out all over the dedendum.

34
7.5 Case depth and Hardness
Case depth and surface hardness are measured on all the tested gears. Case depth of as-ground
gear is measured to be around 1mm at the flank and 0.9mm at the root. As discussed in 6.4 ,
case depth is measured according to ISO 2639. Case depth was slightly different at root and
flank for each test. The difference in case depth is depicted in a chart shown in Figure 27 and
Figure 28.
Figure 27 Case depth Vs No. of Cycles at Root
Figure 28 Case depth Vs No. of Cycles at Flank
Surface hardness was measured in terms of knoop hardness at both addendum and dedendum
at about 0.02mm from the surface. The chart in Figure 29 shows similar variation in surface
hardness at addendum and dedendum.
0,75
0,8
0,85
0,9
0,95
1
Asground
200Cycles
630Cycles
2000Cycles
6000Cycles
20KCycles
63KCycles
200KCycles
630KCycles
2160KCycles
6320kCycles
22092KCycles
Case Dep
th (mm)
Case Depth (mm) - Root
0,85
0,9
0,95
1
1,05
Asground
200Cycles
630Cycles
2000Cycles
6000Cycles
20KCycles
63KCycles
200KCycles
630KCycles
2160KCycles
6320kCycles
22092KCycles
Case Dep
th (mm)
Case Depth (mm) - Flank

35
Figure 29 Surface Hardness VS No. of Cycles
It was seen that surface hardness changes don’t follow any pattern. But, after 2000 cycles and
630K cycles there is a dip in surface hardness in the dedendum which is estimated to be around
70HK and 60HK. Taking into account that knoop hardness measurement has a deviation of 80
HK it is understood that there is no major change in surface hardness after testing. According
to Batista [4], the material tends to soften after contact fatigue testing for carbo-nitrided gears.
But, in this research, it was found that there was no change in micro-hardness at 20µm from the
surface of the gear after contact fatigue testing. It is also that the same gear was not investigated
for all the tests but, it was different gears that were used for each test and hardness might vary
in these gears because of the hardening position in the furnace and the quenching.
720
740
760
780
800
820
840
Asground
200Cycles
630Cycles
2000Cycles
6000Cycles
20KCycles
63KCycles
200KCycles
630KNew
2160KCycles
6320kCycles
22092KCycles
Knoop Hardness (HK)
No. Of Cycles
Surface Hardness Vs No.of Cycles
Addendum Dedendum

36
7.6 Residual Stress
Residual stresses were measured to understand how the stresses evolve under rolling and sliding
contact. Surface residual stresses and sub-surface stresses are measured in both profile and axial
directions as discussed in previous chapters. Surface residual stresses are measured for all the
samples. Surface residual stress in profile direction is shown in Figure 30. From the graph, it
can be seen that residual stress in as-ground gear is approximately -465Mpa at addendum and
-560Mpa at dedendum in the profile direction. It is also evident that the residual stresses are
compressive for all the samples. The stresses in the axial direction are found to be only one-
third of that in profile direction.
Figure 30 Residual Stress in Profile Direction
Compressive residual stresses clearly increased up to 200 cycles of contact fatigue testing at
dedendum and kept decreasing after that. On the other hand, compressive residual stresses
increased up to 2000 cycles at the addendum and then decreased continuously. Research [4]
shows that compressive residual stresses increase after 30 hours of contact fatigue testing in
carbo-nitrided gears and then decrease with further testing. But it was found that compressive
residual stress actually starts to increase already after 8 seconds of contact fatigue testing for
case hardened ground gears as shown in Figure 30. So, it might be that compressive residual
stresses starts to increase in the initial cycles and then keeps decreasing. Residual stress
-700,00
-600,00
-500,00
-400,00
-300,00
-200,00
-100,00
0,00 AS-G
ROUND
200 C
YCLES
630 C
YCLES
2000 C
YCLES
6000 C
YCLES
20K C
YCLES
63K C
YCLES
200K C
YCLES
630K N
EW
2160K C
YCLES
6320K C
YCLES
22092K C
YCLES
RESIDUAL STRESS (M
PA)
RS IN PROFILE DIRECTION
Dedendum
Addendum

37
distribution on the surface follow a similar pattern of decreasing compressive residual stresses
at both addendum and dedendum in profile direction with exception of 6320k cycles, where the
stresses are more towards tensile at dedendum and towards compressive at 6320k. The residual
stress results of 6320k cycles and 22092k cycles tend to evolve differently at addendum and
dedendum and this might be an uncertainty in measurements because of heavy micropitting on
these gear samples.
Figure 31 Residual Stress in Axial direction
Residual stress distribution in the axial direction is shown in Figure 31. Similar to the stresses
in profile direction this also follows a similar pattern at addendum and dedendum but the
magnitude of stress was found to be only one-third of that in profile direction. There was a big
increase of around 300MPa in compressive residual stress after 200 cycles unlike in profile
direction where the gain was only 150MPa.
Sub-surface residual stresses were measured by XRD with the help of electrochemical etching.
Depth profiles were not done for all the samples because of time constraints. Instead, depth
profiles are done at intervals and the longest cycle was skipped intendedly as it had heavy pitting
on the gear tooth surface and etching the sample was difficult as it was damaged heavily. As
already discussed, surface compressive residual stresses tend to increase up to 200 cycles at
dedendum and then start to decrease gradually in profile direction. Residual stress of as-ground
sample in profile direction is almost thrice that of in the axial direction. The evolution and
distribution of subsurface residual stresses at addendum and dedendum in both axial and profile
-800,00
-700,00
-600,00
-500,00
-400,00
-300,00
-200,00
-100,00
0,00 AS-G
ROUND
200 C
YCLES
630 C
YCLES
2000 C
YCLES
6000 C
YCLES
20K C
YCLES
63K C
YCLES
200K C
YCLES
630K N
EW
2160K C
YCLES
6320K C
YCLES
22092K C
YCLES
RESIDUAL STRESS (M
PA)
RS IN AXIAL DIRECTION
Addendum
Dedendum

38
direction are presented in the graphs below. It is evident from Figure 32 that the changes in
residual stresses are close to the surface and are confined to only 5µm in profile direction. But,
the distribution of residual stresses in the axial direction seems to change until 10µm from the
surface of the gear as seen in Figure 33 but the difference was observed only in axial direction
for two conditions and this need to be cross checked by reproducing the results from different
gear tooth. Batista [4] observed that residual stress changes are confined to near surface layers
of around 10µm and we can see similar results in this research as well.
Figure 32 Residual Stress depth profiles at dedendum in Profile direction
-700,00
-600,00
-500,00
-400,00
-300,00
-200,00
-100,00
0 5 10 20 40 70 100 150 200
Residual Stress (M
Pa)
Depth from Surface (µm)
Residual Stress - Profile Direction - Dedendum
As Ground
200 Cycles
2000 Cycles
20k Cycles
200k Cycles
6320k Cycles

39
Figure 33 Residual Stress depth profiles at Dedendum in Axial direction
Figure 34 Residual Stress depth profiles at Addendum in Profile direction
-700,00
-600,00
-500,00
-400,00
-300,00
-200,00
-100,00
0 5 10 20 40 70 100 150 200
Residual Stress (M
Pa)
Depth from Surface (µm)
Residual Stress - Axial Direction - Dedendum
As Ground
200 Cycles
2000 Cycles
20k Cycles
200k Cycles
6320k Cycles
-700,00
-600,00
-500,00
-400,00
-300,00
-200,00
-100,00
0 5 10 20 40 70 100 150 200
Residual Stress (M
Pa)
Depth from Surface (µm)
Residual Stress - Profile Direction - Addendum
As Ground
200 Cycles
2000 Cycles
20k Cycles
200k Cycles
6320k Cycles

40
Figure 35 Residual Stress depth profiles at Addendum in Axial direction
-700,00
-600,00
-500,00
-400,00
-300,00
-200,00
-100,00
0 5 10 20 40 70 100 150 200
Residual Stress (M
Pa)
Depth from Surface (µm)
Residual Stress - Axial Direction - Addendum
As Ground
200 Cycles
2000 Cycles
20k Cycles
200k Cycles
6320k Cycles

41
8 Conclusion From this research, the following conclusions were made. Gray patches are seen visually towards the dedendum already after 200 cycles and
micropits are formed in this area
Micropitting started to develop after 63K cycles based on the surface roughness results.
The material was not softened at 20µm from the gear surface after contact fatigue
testing.
Profilometry was not suitable for studying the evolution of local damage.
Compressive residual stresses in profile direction tend to increase already after 200
cycles and then decrease gradually after further testing.
Residual stress changes close to the surface and are confined to 5µm from the gear
surface in profile direction. Whereas, the same is extending to 10µm in the axial
direction.

42
9 Future work
Surface chemistry analysis on the tested gear tooth samples.

43
10 References
[1] A. Oila, "Micropitting and Related Phenomena in Case Carburised Gears," New Castle University, 2003.
[2] R. L. Errichello, "Morphology of Micropitting," Gear Technology, pp. 74-81, 2012.
[3] D. Mallipeddi, "Surface Intergrity Characterization of Gears with respect to Running-In," Chalmers Univeristy of Technology, Gothenburg, 2016.
[4] A. Batista, "Contact fatigue of automotive gears: evolution and effects of residualstresses introduced by surface treatments," Fatigue and Fracture of Engineering Materials and Structures 23, pp. 217-228, 2000.
[5] Proto Manufacturing, "Residual stress info," [Online]. Available: http://www.protoxrd.com/residual-stress-info.html. [Accessed 01 07 2017].
[6] O. Anderoglu, "Residual stress measurement using X-Ray," Texas A&M University, 2004.
[7] V. Monine, "Analysis of residual stress state in speed gears for automotive vehicles," in International Centre for Diffraction Data (ICDD), 2001.
[8] R.LeMaster, B.Boggs, J.Bunn, C.Hubbard and T.Watkins, "Grinding Induced Changes in Residual Stresses of Carburized Gears," Gear Technology, pp. 42-49, 2009.
[9] Metlab, "Metlab Heat treatment," [Online]. Available: http://www.metlabheattreat.com/carburizing.html. [Accessed 04 07 2017].
[10] N. Ånmark, "Steel characteristics and their link to chip breaking and tool wear in metal cutting," KTH Royal Institute of Technology, Stockholm, 2016.
[11] N. S. Rossini, "Methods of measuring residual stresses in components," Materials & Design, vol. 35, pp. 577-588, 2012.
[12] Britannica Academic, "Scanning Electron Microscope," [Online]. Available: http://academic.eb.com.proxy.lib.chalmers.se/levels/collegiate/article/scanning-electron-microscope/474202. [Accessed 22 08 2017].
[13] J. I. Goldstein, Scanning Electron Microscopy and X-Ray Microanalysis, New York: Kluwer Academic , Plenum Publishers, 2003.
[14] Iowa State University College of Engineering, "Secondary Electrons and Detection," [Online]. Available: http://www.mse.iastate.edu/research/laboratories/sem/microscopy/how-does-the-sem-work/high-school/how-the-sem-works/secondary-electrons-and-detection/. [Accessed 22 08 2017].
[15] A. Oila and S.J.Bull, "Assessment of the factors influencing micropitting," Wear, vol. 258, pp. 1510-1524, 2005.
[16] Strama, "Strama FZG," Strama MPS, [Online]. Available: http://www.strama-mps.de/en/products/test-rigs/standards/fzg-gear-test-rig/. [Accessed 07 06 2017].
[17] Polytec GmbH, [Online]. Available: https://commons.wikimedia.org/w/index.php?curid=19460032. [Accessed 22 08 2017].
[18] G.A.Webster, "Residual stress distributions and their influence on fatigue lifetimes," International journal of fatigue, vol. 23, pp. 375-383, 2001.

44
[19] Mitutoyo, "Quick Guide to Surface Roughness Measurement," Mitutoyo America Corporation, 2016.
[20] R. Martins, C. Locatelli and J. Seabra, "Evolution of tooth fkank roughness during gear micropitting tests," Industrial Lubrication and Tribology, vol. 63, no. 1, pp. 34-45, 2011.
[21] M.N.James, D.J.Hughes, Z.Chen, H.Lombard, D.G.Hattingh, D.Asquith, J.R.Yates and P.J.Wenster, "Residual stresses and fatigue performance," Engineering failure analysis, vol. 14, pp. 384-395, 2007.
[22] R.J.Pomeroy and K.L.Johnson, "Residual stress in rolling contact," Journal of strain analysis, vol. 4, no. 3, pp. 208-218, 1969.
[23] W. Z.Zhuang and G. R.Halford, "Investigation of residual stress relaxation under cyclic load," International journal of fatigue, vol. 23, pp. 31-37, 2001.
[24] H. K. D. H. Bhadeshia, "Martensite in Steels," 2002. [Online]. Available: https://www.phase-trans.msm.cam.ac.uk/2000/C9/lectures45.pdf. [Accessed 2 6 2017].