Embed Size (px)
Citation preview

Surface-Emitting Semiconductor Laser for htracavity Spectroscopy and Microscopy
K. E. Meissner, P. L. Gourley, T. M. Brennan, B. E. Hammons, and A. E. McDonald Sandia National Laboratories, Albuquerque NM 87185
Abstract
We demonstrate lasing action in a novel microcavity laser which can be utilized for intracavity spectroscopy as well as high contrast imaging of small (- lOpm) structures. The system can be easily visualized as a Fabry-Perot cavity containing a gain media and an object for study. Since the primary constraint on the object is transparency at the lasing wavelength, investigation of lasing in objects such as microspheres, liquid droplets, and biological cells is possible. The resonator consists of an epitaxial MBE grown mirror and gain region on a GaAs wafer. This is essentially an open-cavity vertical cavity surface emitting laser (VCSEL). The object to be studied is placed on the wafer and covered with a glass dielectric mirror which acts as the output coupler. When the semiconductor gain region is photo-pumped, the object within the cavity provides lateral optical confinement through its index difference with the surrounding media, increases the cavity Q, and thus encourages lasing action. The emitted laser light can be spectrally and spatially resolved. The narrow lasing lines can provide information about the lasing modes supported and the size of the object. The spatially resolved laser light provides high contrast microscopic images of the electro-magnetic modes oscillating in the resonator. We present an investigation of stable lasing modes in polystyrene spheres.
Introduction
The current state of semiconductor technology encourages miniaturization and integration of previously large scale devices onto a single semiconductor wafer. In the future, these wafers will contain not only discrete transistors, lasers, waveguides and detectors, but also fully integrated opto-electronic systems. These systems will possess the capability to generate, transmit, and detect light and may possibly include digital processing. As a consequence, new methods of using the existing technology must evolve.
The vertical cavity surface emitting laser (VCSELs) offers unique geometries for integrating optical systems onto a wafer. Recent advances have greatly increased the efficiency as well as the output power of these devices.’ Additionally, the attainable wavelength region covers the near infia-red and is being extended to shorter wavelengths in the visible.2 This spectral range makes the VCSEL a viable candidate for spectroscopic applications including analytical chemistry, materials studies, and biomedical diagnostics. Finally, the ability to integrate these devices of a wafer could permit massively parallel processing of both samples and data on a single chip3
~ ~ 1 6 N ’ p I C W 4 OF THIS DOCUMENT 18

Here, we present a device based on current VCSEL technology which permits the introduction of small (-1Opm) objects into the lasing cavity. This device permits the study of light confinement by the object through the supported lasing modes. By varying the object and/or the surrounding media, the effects of object shape, object index of refraction, and index difference with the surrounding media on the lasing properties can be studied. These studies are of interest for the fimdamental physics of microcavity lasers and for applied spectroscopy.
Once developed, this device could prove usefil in biomedical diagnostics. It covers the correct spatial dimensions as well as wavelength region. In fact, an integrated system of these devices may provide a high speed, compact method of performing cell diagnostics.
Structure and Operation
There is a great amount of interest in structuring microcavity lasers. Much of the previous work dealt with externally structuring the laser mirrors and cavity to yield a desired property. Examples include the etching of VCSELs into mesa structures4, and forming a thin cylindrical cavity in the microdisk laser.' Structuring within the cavity has also been used to enhance laser performance. The quantum well gain region in VCSELs has been engineered such that the gain regions are co-incident with the field anti-nodes to enhance lasing efficiency.6 Also, quantum wires have been used to form gain regions in microcavity lasers to control light polari~ation.~ Passive intracavity regions which do not provide gain may also be structured. Honeycomb lattices have been added to assist in the confinement of light lateral to the wafer plane', and oxidation of spacer layers is being used to control injected ~urrent .~ All of these processes are designed to improve the basic performance of the laser.
Here, we present a laser in which we study the effects of a small object (-lOpm) placed within the cavity. For these objects, polystyrene microspheres are chosen. The dielectric contrast between the sphere and the surrounding media lowers the lasing threshold power, and the sphere defines lateral optical modes that can be studied spatially and spectrally. The natural resonance's of microspheres" as well as lasing fiom dye- doped microspheres has been of interest for some time. However as far as we know, this is the first time the effects of microspheres within a planar Fabry-Perot resonator have been investigated.
This laser consists of a semiconductor gain region, and the microsphere contained within a Fabry-Perot resonator. The gain region is excited with an external pump laser. Below the lasing threshold, only broad spectral emission and dim, featureless spots are observed. Above the lasing threshold, narrow spectral emission lines, and well-defined spatial modes are simultaneously observed. Additionally, the microspheres are found to greatly lower this lasing threshold when compared to the bare cavity.
11,12
~ -~ - - ~~ ~-
DISCLAIMER
This report was prepared as an account of work sponsored by an agency of the United States Government. Neither the United States Government nor any agency thereof, nor any of their employees, makes any warranty, express or implied, or assumes any legal liability or responsi- bility for the accuracy, completeness, or usefulness of any information, apparatus, product, or process disclosed, or represents that its use would not infringe privately owned rights. Refer- ence herein to any specific commercial product, process, or service by trade name, trademark, manufacturer, or otherwise does not necessarily constitute or imply its endorsement, recorn- mendation, or favoring by the United States Government or any agency thereof. The views and opinions of authors expressed herein do not necessarily state or reflect those of the United States Government or any agency thereof.
. -~~ _._

DISCLAIMER
Portions of this document may be illegible in electronic image products. images are produced from the best available original document.
I
Our novel device consists of an epitaxially MBE grown mirror and gain region on a Gallium Arsenide (GaAs) substrate. In essence, this is an open- cavity VCSEL structure. The microsphere is placed above the gain region, and the cavity is completed by a dichroic multilayer dielectric mirror on glass acting as the output coupler. Figure 1 shows the basic cavity with a
Figure 1: Basic cavity with sphere of diameter, d.
sphere of diameter, d, and index of refiaction, nl, surrounded by a media with index of refraction, n2.
To create gain in the semiconductor, the sample is photo-pumped with a laser source. For these structures, the emission wavelength of the gain region is around 850nm. So, the pump wavelength is chosen to be around 750nm where the light will be absorbed by the quantum wells in the gain region, but not by the barriers in the gain region or the semiconductor mirror stack. Gain is created in the samples at a carrier density of approximately 1 x 10l2 cm-2. Naturally, a higher carrier density results in a gain region which is spectrally wider as well as larger.
Here, the samples are photo-pumped with CW light as well as femtosecond light pulses. The first case is used to produce a lower carrier density (1 to 2~10'~cm-~), and spectrally narrow gain that permits only one lasing mode to oscillate. This will be referred to as the low gain condition. The femtosecond pulses produce a high gain condition (carrier density - 3 to 5~10'~cm-~) in which the gain is spectrally broad and permits many lasing modes to oscillate. CW laser pumping is useful for obtaining high signal-to-noise images and spectra with single transverse oscillations. Femtosecond laser pumping is useful for obtaining high signal-to-noise spectra with multiple transverse mode oscillations.
The introduction of a transparent object possessing an index, nl, higher than that of the surrounding cavity media, n2, provides lateral confinement for the light within the cavity. In effect, the object acts as a waveguide and in doing so assists the lasing process by concentrating the light. Due to the lateral confinement, a number of transverse electromagnetic (TEM) modes are possible. The determination of which TEM modes oscillate is a function of index confinement, gain width, object shape, and other parameters. The low gain case produces very simple spectra, but provides information about the dominant lasing mode. The high gain case has a more complicated spectrum, and provides information about the object's size and three dimensional shape.
CCD camera
Beamspli r
I 1 I 1 I 1
rigure 2: Experimental setup utilized

For this experiment, a system employing both microscopic imaging and spectroscopy was utilized. Figure 2 shows a diagram of the system. The microscope focuses the light on the sample and collects the emitted light. Through beamsplitters, part of this emitted light is sent to a CCD camera. The rest is normally sent to a 0.85m double spectrometer providing a spectral resolution of less than 1A. This resolution permits study of the TEM mode structure and separation. In place of the spectrometer, a streak camera can provide temporal information about the emitted light with a resolution of <lops. The simultaneous imaging and spectroscopic data allow easy association of the spatial mode profile with the corresponding spectrum.
When operating with a bare cavity (no object) under femtosecond excitation, a dim featureless spot is seen on the camera, and a broad spontaneous emission is seen on the spectrometer. The bare cavity can be made to lase, but only at very high pump powers (- ~ O X higher than with the spheres). The cavity decay time remains approximately constant at 4.511s up until lasing begins. When a polystyrene microsphere is introduced into the cavity, dramatic changes occur. At pump power below the threshold for the sphere, the spontaneous emission from the sphere becomes much brighter than that of the surrounding cavity. At these low powers, the cavity decay time remains approximately 4.5ns. As the pump power increases, the emission from the sphere becomes more intense and the cavity - _ _ decay time decreases with increasing power. Finally, the onset of lasing occurs, and the signal decays faster than the temporal resolution of our streak camera. The onset of lasing is also marked by the appearance of a narrow (<1A) spectral peak@) and a sudden brightening, and spatial definition of the sphere's emission. Figure 3 is an image of two 10.5pm spheres lasing in different modes. Note the high contrast between the lasing spheres and the surrounding cavity which is being pumped, but has not begun to lase.
Figure 3: Image of two 10.5pm spheres lasing in the cavity.
Microsp heres
As objects within the cavity, polystyrene microspheres were chosen since they are readily available in well controlled sizes. Here, we studied spheres with diameters of 4 . l p q 6.1pm7 10.5pm, and 21.7pm immersed in de-ionized water. As previously stated, they were observed in both high and low gain situations. Each case yields informative data about the spheres.
We begin with low gain pumping. Generally, only one mode oscillates in each sphere. This mode will be the lateral mode experiencing the least amount of loss due to the spherical shape. When lasing begins, a narrow spectral line rises in conjunction with the appearance of a well-defined spatial mode. This spectral line is usually narrower than the spectral resolution of our spectrometer. Remaining fixed in position, the line

strengthens and eventually broadens as the pump power is increased. As anticipated fiom the spherical shape, the TEN0 mode is dominant in all sphere sizes. Higher order modes begin to increasingly appear as the sphere size increases.
Representative of this data is the histogram of mode distribution for the 10.5pm spheres in Figure 4. Although quite a few higher order modes are observed the TEN0 mode is dominant. The distribution of the higher order modes appears to favor radial modes.
The same data was taken on the other diameter microspheres, and the results summarized in Table 1. In
Sphccc Count h.
Figure 4: Distribution of modes for a 10.5pm sphere under low gain conditions.
all cases, the TEN0 is dominant. Although as size increases, the percentage of TEN0 modes generally decreases. As expected, the appearance of higher order modes increases in relative fiequency as the sphere diameter increases. Oddly, the 6.1pm spheres de@ the trends, and have nearly equal numbers of TEN0 and TEMlo modes as well as having no higher order modes.
angular radial 4. lum 84% 14% 2% 0% 0% 0% 6.lpm 55% 45% 0% 0% 0% 0% 10.5pm 12% 21% 3% 3% 0% 1%
Table 1: Mode distribution for the different diameter spheres expressed as a percentage of the total number of modes observed.
Figure 5 shows the threshold power for both the TEN0 and TEMlo as a fbnction of sphere diameter. The threshold power for the TEN0 is always less than that for the TEMlo mode indicating that it is the preferred mode in all diameter spheres. Both modes seem to have a minimum around 6pm. Below this diameter, the threshold power rises rapidly, and for larger diameters, the threshold power increases gradually. This curve indicates that there is an optimum size for the sphere within the cavity. It should be noted that the difference in threshold power between the TFdVbo mode and the TEMM mode reaches a minimum with the 6.1pm spheres, and a maximum with the 4. lpm spheres.

The dominant mode oscillating under low gain has provided quite a bit of information about the spheres in the Fabry-Perot. Figure 5 and table 1 show that the dominant mode prefers radial modes to angular modes. This is expected due to the spherical shape. Also, the 6.1pm spheres demonstrate a nearly equal possibility of oscillating in the "Em0 and TEMlo modes. This is confirmed by the observation that the difference in threshold power between these two modes reaches a minimum with
I I I I t I 5 10 15 20
Sphere Size (pm)
Figure 5: Threshold power as a function of sphere diameter under CW pumping. Squares are the "EM00 data and the circles are the "EMIo data.
these spheres. The minimum in threshold power for both modes around 6pm is most likely a balance between diffiaction losses and mode volume. Similar sine effects have been seen in VCSELS.~ The mode distributions give some indication as to the general shape of the object in the cavity, but do not provide any exact information.
In order to see a complete mode spectrum, a high gain condition is utilized. With a femtosecond laser source, the gain region created is spectrally wide enough to support several lateral modes. As the pump power is increased fiom zero, the behavior parallels that of the CW pumping. In fact, operating the femtosecond pump at low power (gain) causes the same dominant mode to oscillate as the CW pumping. Above this power additional modes begin to appear. As these other modes appear, the previously sharp image rapidly becomes a bright, featureless spot due to the superposition of all the modes. Spectrally, a new peak rises as each new mode oscillates. The modes tend to be spectrally broad compared to the low gain modes due to power broadening under high gain.
Figure 6 shows the mode spectra for 6 .1pq 10.5pm, and 21.7pm spheres at high gain. The wavelength shift is fiom an arbitrary wavelength and is intended to show the shift between peaks not the absolute position of the peaks. All spectra are centered between 835nm and 845nm. For now, we will concentrate on the 6.1pm spectrum. Here, the "EM10 mode began oscillating first, and remained the largest of the modes. It is the higher energy mode in the spectrum. At
2 1 . 7 ~ Sphere A
10.- Sphere
6 . 1 ~ Sphere
-10 -8 -6 4 -2 0 Wavelength Shift (nm)
I Figure 6: Mode spectra for various spheres under iigh gain situation.
I
higher power, the TEN0 mode also began to oscillate, and the lower energy peak became evident. In this case, no other peaks appeared at either higher or lower energy.
The two remaining spectra show that as the sphere diameter increases, the number of possible lateral modes increases. Again, the TEN0 mode has been identified as the lowest energy mode, and no lower energy modes appear. Note that the mode separation becomes smaller as the sphere diameter becomes larger. The 10.5pm spectrum actually showed two weaker higher energy modes which not evident on the spectrum.
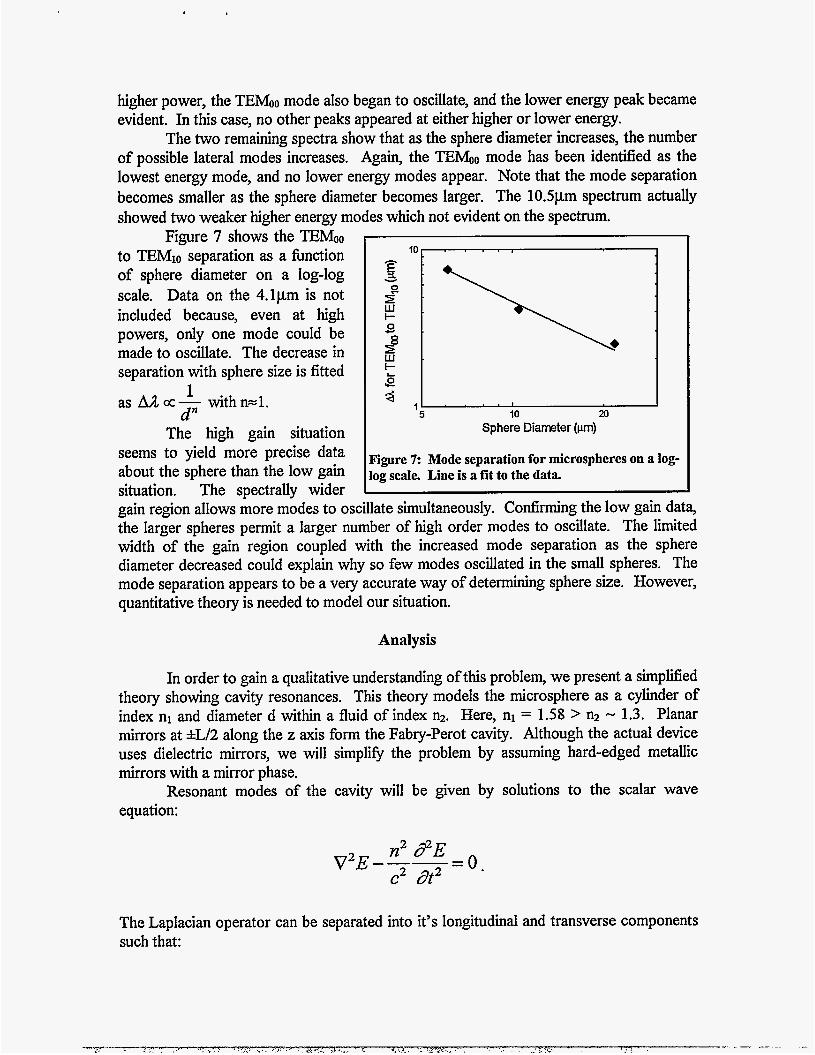
Figure 7 shows the TEN0 to TEMlo separation as a function of sphere diameter on a log-log scale. Data on the 4.lpm is not included because, even at high powers, only one mode could be made to oscillate. The decrease in separation with sphere size is fitted
1 as AA cc- withnzl. d"
The high gain situation seems to yield more precise data
I . 5 10 20
Sphere Diameter (w)
Pipre 7: Mode separation for microspheres on a log- about the sphere than the low gain log scale. Line is a fit to the data. situation. The spectrally wider gain region allows more modes to oscillate simultaneously. Confirming the low gain data, the larger spheres permit a larger number of high order modes to oscillate. The limited width of the gain region coupled with the increased mode separation as the sphere diameter decreased could explain why so few modes oscillated in the small spheres. The mode separation appears to be a very accurate way of determining sphere size. However, quantitative theory is needed to model our situation.
Analysis
In order to gain a qualitative understanding of this problem, we present a simplified theory showing cavity resonances. This theory models the microsphere as a cylinder of index nl and diameter d within a fluid of index n2. Here, nl = 1.58 > n2 - 1.3. Planar mirrors at *L/2 along the z axis form the Fabry-Perot cavity. Although the actual device uses dielectric mirrors, we will simp1iQ the problem by assuming hard-edged metallic mirrors with a mirror phase.
Resonant modes of the cavity will be given by solutions to the scalar wave equation:
The Laplacian operator can be separated into it's longitudinal and transverse components such that:

- 0. (V: +Vf)E----- n2 8 E c2 at2
We assume the time and longitudinal dependence to be:
where kl is the wavevector of the p eigenmode of the Fabry-Perot cavity and & is the sum of the mirror phases. The wave equation then becomes:
VfE + [T n2w2 - k:], = 0 .
L gitudinall! the boundary conditions demand a null in the field at the mirrors (z = &/2). For the p longitudinal mode, we must have k, = (nZ + &)L In region 1, we let
k; > 0 making the eigenmodes oscillatory. In region 2, n:w2 a; =-- C2
k; < 0 causing the eigenmodes to decay as r+-. If we now let E(r,cp) = niw2 r; =7-
E(r)cos(vcp), the wave equation becomes:
d2E 1dE dr2 r dr
for region 1. Replacement of a by y gives the equation in region 2. This is simply Bessel's equation with solutions of Jv(ar) in region 1 and K,(yr) in region 2. Finally, field must also be continuous at the boundary. Thus, the solution will be oscillatory within the cylinder and decaying outside.
However, we wish to gain insight as to the spectrum of eigedkequecies. For this, we must solve:
We now have a good qualitative vision of what the eigenmodes should look like.
for w. Simple solutions can be obtained by considering modes well contained within the cylinder, or Jv(ad/2) = 0. Solving for the wavelength we obtain:

where xvp is the pth zero of the vh Bessel fbnction. In this case, the longitudinal wavevector will be much greater than the transverse wavevector, or kl >> a. This is equivalent to saying that the field amplitude oscillates much faster along z than along r. As a result, the lateral modes will be much more closely spaced than the longitudinal modes.
In both gain cases, the gain region is generally wide enough to support one longitudinal mode. However, several lateral modes may oscillate simultaneously in the high gain situation. So, we wish to know the lateral mode spectrum. The separation of these lateral modes for a given longitudinal mode (set I constant) is given by:
a3x; A&=- 2n 2 nld 2 2 '
Each lateral mode will have both a transverse electric (TE) and a transverse magnetic (TM) mode associated with it. Figure 8 shows the computed spectrum for a 21.7pm diameter microsphere.
This theory has been intended to give a qualitative idea of the expected mode structure. It does not predict which modes will oscillate. Rather it merely gives insight as to the mode shape and separation. Also, a cylinder in which the field goes to zero at the sidewall is an admittedly poor
Wavelength Shift (nm)
Figure 8: Computed spectral shift of lateral modes i from a longitudinal mode.
approximation of a dielectric microsphere. However, these solutions should give a rough idea of what the spectra will show and what influences the mode spacing. Comparison between Figure 8 and the mode spacing for the 21.7pm sphere in Figure 6 shows that the theory gives a fair qualitative picture of the relative mode spacing. The theory does not do a very good job of predicting the mode spacing as a fbnction of size. Whereas the
theory predicts AA oc - with n=2, the experiment shows n=l. This model obviously
requires a more rigorous treatment of the problem, but does serve to give a flavor as to the dynamics of the problem.
1 d"

t C
Conclusion
We have presented a novel spectroscopic device based on existing VCSEL technology. This device has the ability to be integrated into a complete optical system on a semiconductor wafer. The device demonstrated the capability to measure relative sizes very accurately, and to give an indication as to an object's shape. Since it is much faster and easier to observe spectral peaks than to perform image analysis, this device could be part of a system measuring the size of very small objects at very high speed. Naturally after more complete development, this device will be electrically pumped instead of photo- pumped to decrease cost and increase compactness. If integrated on a highly parallel system, the device shows great promise for high speed sample throughput.
Acknowledgments
This work was sponsored by the United States Department of Energy under contract number DE-AC0494AL85000, and supported in part by the Division of Materials Science, Office of Basic Energy Science.
1. 2 . 3 .
4 .
5 .
6 .
7 .
8 .
9 .
10.
11.
12.
References
for a recent review: P. L. Gourley, Nature 371, 571-577 (1994). R. P. Schneider, and J. A. Lott, Appl. Phys. Lett. 63,917-919 (1993). P. L. Gourley, K. L. Lear, and R. P. Schneider, E E E Spectrum, 3 1-37, August, 1994. P. L. Gourley, T. J. Drummond, T. E. Zipperian, J. L. Reno, and T. A. Plut, J.
S . L. McCall, A. F. J. Levi, R. E. Slusher, S . J. Pearton, and R. A. Logan, Appl. Phys. Lett. 60,289-291 (1992). P. L. Gourley, T. M. Brennan, B. E. Hammons, S . W. Corzine, R. S . Geels, R. H. Yan, J. W. Scott, and L. A. Coldren, Appl. Phys. Lett. 54, 1209-1211 (1989). A. Chavez-Pirson, H. Ando, H. Saito, and H. Kanbe, Appl. Phys. Lett. 64, 1759- 1761 (1994). P. L. Gourley, J. R. Wendt, G. A. Vawter, T. M. Brennan, and B. E. Hammons, Appl. Phys. Lett. 64, 687-689 (1994). D. L. Huffaker, D. G. Deppe, K. Kumar, and T. J. Rogers, Appl. Phys. Lett. 65,
R. E. Benner, P. W. Barber, J. F. Owen, and R. K. Chang, Phys. Rev. Lett. 44,
M. K. Gonokami, K. Takeda, H. Yasuda, and K. Ema, Jpn. J. Appl. Phys. 31,
H. Taniguchi, T. Fujiwara, H. Yamada, S . Tanosaki, and M. Baba, Appl. Phys. Lett. 62,2155-2157 (1993).
Appl. Phys. 64,6578-6580 (1988).
97-99 (1994).
475-478 (1980).
L99-L10 1 (1 992).


![Plasmonic hole-transport-layer enabled self-powered hybrid ...semiconductor-based devices, such as light-emitting diodes (LEDs), laser and photodetectors [5–11]. A photodetector](https://img.pdfslide.net/doc/110x75/60f7985ea4960e6f6d36a6fb/plasmonic-hole-transport-layer-enabled-self-powered-hybrid-semiconductor-based.jpg)