Embed Size (px)
Citation preview

W&M ScholarWorks W&M ScholarWorks
Dissertations, Theses, and Masters Projects Theses, Dissertations, & Master Projects
Summer 2018
Surface-Enhanced Raman Spectroscopy Studies of Organic Dyes Surface-Enhanced Raman Spectroscopy Studies of Organic Dyes
for Art Conservation and Ph Sensing Applications for Art Conservation and Ph Sensing Applications
Shelle Nicholle Butler College of William and Mary - Arts & Sciences, [email protected]
Follow this and additional works at: https://scholarworks.wm.edu/etd
Part of the Physical Chemistry Commons
Recommended Citation Recommended Citation Butler, Shelle Nicholle, "Surface-Enhanced Raman Spectroscopy Studies of Organic Dyes for Art Conservation and Ph Sensing Applications" (2018). Dissertations, Theses, and Masters Projects. Paper 1530192818. http://dx.doi.org/10.21220/s2-atxh-8g14
This Thesis is brought to you for free and open access by the Theses, Dissertations, & Master Projects at W&M ScholarWorks. It has been accepted for inclusion in Dissertations, Theses, and Masters Projects by an authorized administrator of W&M ScholarWorks. For more information, please contact [email protected].

Surface-Enhanced Raman Spectroscopy Studies of Organic Dyes for Art Conservation and pH Sensing Applications
Shelle N. Butler
Richmond, Virginia
B.S. Chemistry, Virginia Commonwealth University, 2016 B.S. Forensic Science, Virginia Commonwealth University, 2016
A Thesis presented to the Graduate Faculty of The College of William & Mary in Candidacy for the Degree of
Master of Science
Department of Chemistry
College of William & Mary May 2018

© Copyright by Shelle N. Butler 2018


ABSTRACT
Surface-enhanced Raman scattering (SERS) spectroscopy is a powerful analytical technique with widespread applications. In this work, the application of SERS in the fields of art conservation and pH sensing are reviewed. First, the theory of this unambiguous and ultrasensitive technique is explained. Next, a review of the pedagogical journey in art conservation research through the lenses of undergraduates is offered in Chapter 2. Finally, an investigation in pH sensing SERS is explored pursuing developing a SERS pH sensitive probe while offering new insight into SERS capabilities and the relationship between analyte and nanoparticle.

i
TABLE OF CONTENTS
Acknowledgements ………………………………………………………………. ii
Chapter 1: SERS Theory and Background
Raman Scattering ……….……………………………………....…………1
SERS Theory……………………………………………………….……….5
References…………………………………………………………………10
Chapter 2: Research with Undergraduates at the Intersection of Chemistry
and Art: Surface-Enhanced Raman Scattering Studies of Oil Paintings
Introduction…….…………………………………………………………..12
Background: SERS in Conservation Science…………………………..14
Case Studies……………………………………………………………….18
References…………………………………………………………………32
Chapter 3: SERS pH Sensing
Background.………….…………………………………………………….37
Experimental……………………………………………………………….41
Results and Discussion…………………………………………………...44
Conclusion and Future Work…………………….………………….……51
References…………………………………………………………………53

ii
ACKNOWLEDGEMENTS
I would like to express my sincere appreciation to Professor Kristin L. Wustholz, under whose guidance this investigation was conducted, for her patience, guidance and criticism throughout the investigation. The author is also indebted to Professors Elizabeth J. Harbron and Michael J. Kelley for their careful reading and criticism of the manuscript. I would also like to take the opportunity to thank all of the amazing undergraduate researchers in our lab, whose curiosity allowed me to gain a better understanding of research and to form better mentor/mentee relationships. I would also like to my graduate peers for helping me maintain my sanity throughout the challenges encountered along the way.

1
Chapter 1: SERS Theory and Background
Raman Scattering
Two ways in which light can scatter include: Rayleigh scattering and
Raman scattering. In Rayleigh scattering, the incident photon energy (ℎ𝜈0) is
the same energy as the scattered photon energy. Scattered light has a higher
propensity towards the conserved Raleigh scattering effect. However, a small
amount of light energy, 1 in 1010 incident photons,1 may be scattered at a
different energy relative to inherent frequency in an effect known as Raman
scattering. Whereas Rayleigh scattering is the elastic scattering of light, Raman
scattering is the inelastic scattering of light. When light acts upon a molecule,
an oscillating field is applied which momentarily causes a distortion in the
electron cloud creating a higher energy state than its normal vibrational states,
referred to as a “virtual state.” Upon the return to ground state, the minute
energy difference between the incident light energy and the scattered photon
energy is known as the Raman shift (ℎ𝜈′). The energy shift is indicative of the
characteristic molecular vibrational modes.
Raman spectroscopy relies on the polarizability of a molecule.
Polarizability is the relative tendency of the charge distribution shape to change
and shift when an electric field is applied. The applied electric field generates
an induced dipole that radiates photons without exchanging energy (Rayleigh
scattering) or with exchanging energy (Raman scattering) with the vibrational
modes within the molecule. The induced polarization (𝑃) is expressed as:

2
𝑃 = 𝛼𝐸 (1)
where α is the polarizability, or the ease of an atom's electron cloud to become
distorted from its normal shape by an applied electric field, 𝐸. The electric field
is governed by:
𝐸 = 𝐸0 cos 2𝜋 𝜈0𝑡 (2)
where 𝜈0 refers to the frequency of the excitation light source (e.g. a laser). The
linear relationship between the laser intensity of the excitation source and the
induced polarizability is revealed by combining Equations 1 and 2. Since
Raman spectroscopy is a vibrational spectroscopic technique, as visualized in
the simple Jablonski diagram in Figure 1, it is applied to reveal a characteristic
structural fingerprint, which can be utilized to identify molecules. The normal
modes (𝑄𝑗) that make up the characteristic molecular vibrations are expressed
by:
𝑄𝑗 = 𝑄𝑗𝑜 cos 2𝜋𝜈𝑗 𝑡 (3)
where νj is the characteristic vibrational frequency and 𝑄𝑗𝑜 is the static molecule.
Both corresponding to the jth normal modes for which there are 3N-6 normal
modes in nonlinear molecules and 3N-5 normal modes in linear molecules with
N, atoms. The polarizability of the molecular electrons is thereby modified by
the molecular vibrations such that:
𝛼 = 𝛼0 + (𝛿𝛼
𝛿𝑄𝑗) 𝑄𝑗 + ⋯ (4)
3
Combining the terms presented in Equations 1-4, yields the following:
𝑃 = 𝛼0𝐸0 cos 2𝜋𝜈0𝑡 + 𝐸0𝑄𝑗𝑜 (
𝛿𝛼
𝛿𝑄𝑗)
cos 2𝜋(𝜈0+𝜈𝑗)𝑡+cos 2𝜋(𝜈0−𝜈𝑗)𝑡
2 (5)
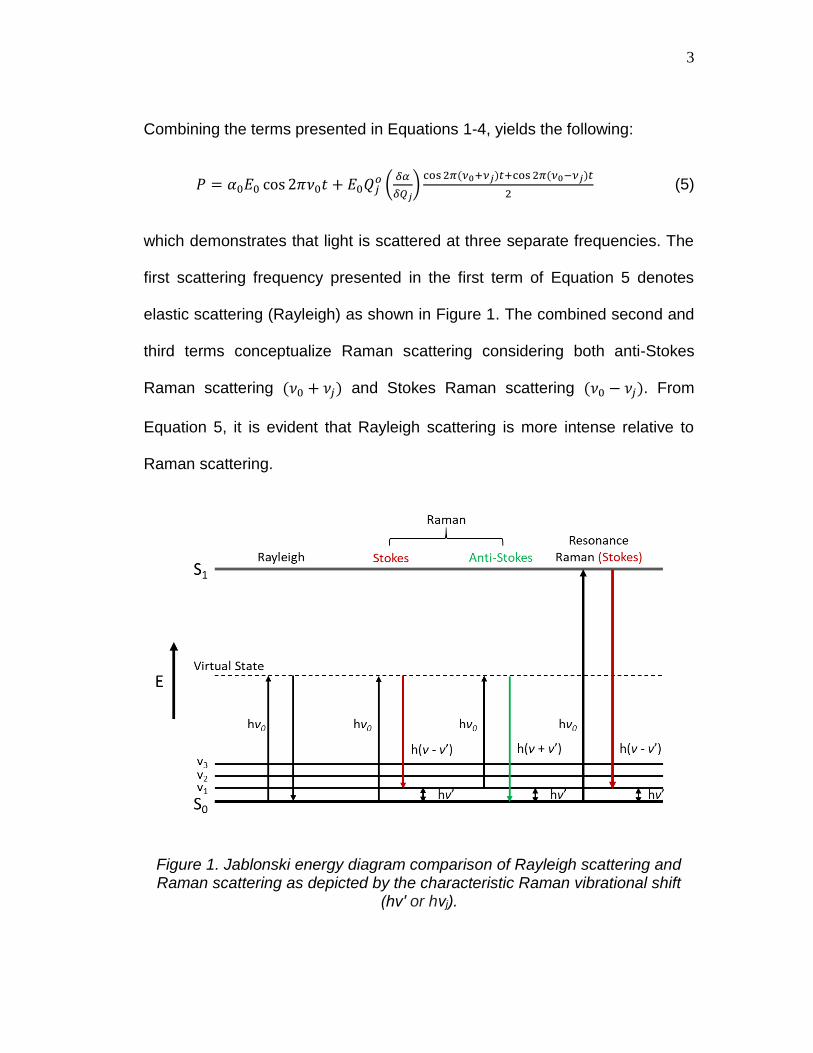
which demonstrates that light is scattered at three separate frequencies. The
first scattering frequency presented in the first term of Equation 5 denotes
elastic scattering (Rayleigh) as shown in Figure 1. The combined second and
third terms conceptualize Raman scattering considering both anti-Stokes
Raman scattering (𝜈0 + 𝜈𝑗) and Stokes Raman scattering (𝜈0 − 𝜈𝑗). From
Equation 5, it is evident that Rayleigh scattering is more intense relative to
Raman scattering.
Figure 1. Jablonski energy diagram comparison of Rayleigh scattering and Raman scattering as depicted by the characteristic Raman vibrational shift
(hν′ or hνj).

4
Typically, under standard conditions, molecules populate a ground
vibronic state. When the incident photon interacts with the molecule, the photon
may lose energy equal to the vibrational transition of the molecule resulting in
a decreased scattered photon energy (i.e. a Stokes shift). If the molecule
occupies an excited vibrational state, then the photon may gain energy when
scattered leading to an anti-Stokes shift. When the incident frequency of the
applied field matches the electronic resonance of the molecule then the
conditions are met for resonance Raman scattering, which could lead to
enhanced Raman signals.
The Raman scattering intensity (𝐼𝑅), which is the number of photons
scattered is given as:
𝐼𝑅 ∝ (𝜈0 ± 𝜈𝑗)4𝛼𝑗2𝑄𝑗
2 (6)
The intensity of scattered photons is plotted against the energy of the scattered
photons, expressed in wavenumbers, to produce a Raman spectrum.
Raman spectroscopy is an incredibly useful analytical technique for the
identification of organic, inorganic, and biological samples, which can be
complicated for other techniques due to interferences caused by complex
matrices. The technique is applied to gases, liquids, and solids, including thin
films and powders. Raman spectroscopy is a complimentary analytical
technique to infrared (IR) spectroscopy. IR spectroscopy relies on the existence
of a dipole moment, a separation of charge character within a molecule. The

5
principle selection rule for Raman requires a finite change in polarizability
during the molecular vibration, (𝛿𝛼
𝛿𝑄𝑗) ≠ 0. Even if the molecule is polarizable,
certain analytes can encounter obstacles with Raman scattering. For example,
Raman scattering faces major obstacles when applied to organic dyes: the
weakness of scattering intensity, competitive effects with fluorescence, and not
all modes may be Raman active. Even though other techniques have been
incorporated to regain the lost intensity (e.g. FT-Raman), another method
emerged in the 1970’s to provide a remarkably enhanced Raman signal.
Surface-Enhanced Raman Scattering (SERS)
Over 40 years ago, Fleischmann and colleagues reported unusually
intense Raman scattering from pyridine adsorbed to electrochemically
roughened silver electrodes.2 At the time, the authors believed that the
increased surface area generated the enhancement due to the surface
roughening process. Unknowingly, the discovery marked the first published
observed SERS. Just a few years following Fleischmann’s observation,
Jeanmarie and Van Duyne and Albrecht and Creighton independently
demonstrated that the signal enhancement is due to electromagnetic (EM) and
chemical mechanisms.3,4
SERS works by two known mechanisms: chemical and EM
enhancements. The chemical enhancement is attributed to charge transfer

6
between the chemisorbed species to the metal nanoparticle and is a minor
component that has a weak enhancement on the order of 102.5 The
fluorescence of the molecule is quenched due to energy transfer to the metal.6
However, the majority of the overall signal enhancement is attributed to
the EM contribution, which produces signal intensity increases from 104 to
1014,5 the higher end is indicative of resonance Raman scattering. The
mechanism is due to the optical properties of nanostructured metallic surfaces.
The main optical property is referred to as localized surface plasmon resonance
(LSPR) effect. LSPR is a phenomenon that occurs due to light interacting with
particles much smaller than the incident wavelength. As the light interaction
occurs, surface electrons oscillate as the electromagnetic field is applied to the
metal nanoparticles leading to a plasmon. The plasmon oscillates locally about
the surface of the nanoparticle with a resonance frequency, referred to as
LSPR as shown in Figure 2.5,7,8
Figure 2. The signal enhancement due to oscillations of surface electrons (yellow) when an electric field (blue) is applied to metal nanoparticles
generating LSPR.

7
The EM enhancement can be defined by an intrinsic enhancement factor
(EF). The EF of a given signal can be expressed relative to the intensity of its
normal Raman intensity as:
𝐸𝐹 = |𝐸𝑜𝑢𝑡|2|𝐸′
𝑜𝑢𝑡|2
|𝐸0|4 = 𝐼𝑆𝐸𝑅𝑆/𝑁𝑆𝐸𝑅𝑆
𝐼𝑁𝑅/𝑁𝑁𝑅 (7)
where the EM field intensity at the surface of the sphere (|Eout|2) and the
intensity of the Raman scattering (|E’out|2) are enhanced and scaled by the
incident field intensity (|E0|4).7 The EF is simply expressed by the SERS
intensity (ISERS) relative to the normal Raman intensity (INR).7 To produce a
significant EF, nanoparticles made from noble metals (e.g. silver, gold, or
platinum) are added to the surface of the sample to serve as antennae that
amplify the Raman signal and subdue interference caused by fluorescence.
Even though other metals can be used to provide the surface, however, silver
characteristically provides the largest enhancement factors.9
In 1982, Lee and Meisel published a method of synthesizing powerful
citrate-reduced silver sols.10 The Lee-Meisel method of silver nanoparticle
(AgNP) synthesis is widely used for its simplicity of producing generally
spherical nanoparticles. Lee-Meisel AgNPs offer higher SERS efficiency when
partially aggregated, due to the formation of “hot spots” of large field
enhancements.11 When the chemisorbed analyte is localized in the LSPR
region a “hot spot” is produced, Figure 3.5,7,12 The hot spot is the area where
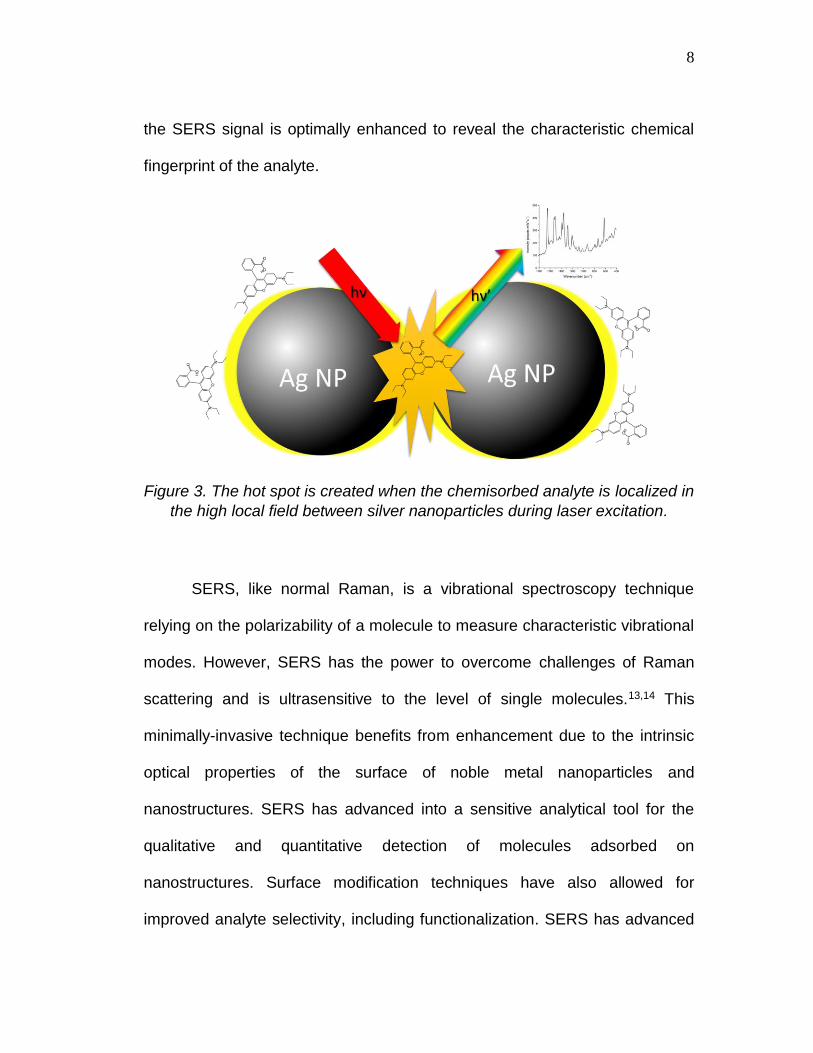
8
the SERS signal is optimally enhanced to reveal the characteristic chemical
fingerprint of the analyte.
Figure 3. The hot spot is created when the chemisorbed analyte is localized in
the high local field between silver nanoparticles during laser excitation.
SERS, like normal Raman, is a vibrational spectroscopy technique
relying on the polarizability of a molecule to measure characteristic vibrational
modes. However, SERS has the power to overcome challenges of Raman
scattering and is ultrasensitive to the level of single molecules.13,14 This
minimally-invasive technique benefits from enhancement due to the intrinsic
optical properties of the surface of noble metal nanoparticles and
nanostructures. SERS has advanced into a sensitive analytical tool for the
qualitative and quantitative detection of molecules adsorbed on
nanostructures. Surface modification techniques have also allowed for
improved analyte selectivity, including functionalization. SERS has advanced

9
to probe chemical queries in areas as diverse as chemistry, materials science,
nanoscience and beyond.

10
References
1. McCreery, R. L. Raman Spectroscopy for Chemical Analysis. Measurement Science and Technology 2001, 12, 653.
2. Fleischmann, M.; Hendra, P. J.; McQuillan, A. J. Raman spectra of pyridine adsorbed at a silver electrode. Chem. Phys. Lett. 1974, 26, 163-166.
3. Jeanmaire, D. Surface Raman spectroelectrochemistry Part I. Heterocyclic, aromatic, and aliphatic amines adsorbed on the anodized silver electrode. J. Electroanal. Chem. 1977, 84, 1-20.
4. Albrecht, M. G.; Creighton, J. A. Anomalously intense Raman spectra of pyridine at a silver electrode. J. Am. Chem. Soc. 1977, 99, 5215-5217.
5. Stiles, P. L.; Dieringer, J. A.; Shah, N. C.; Van Duyne, R. P. Surface-Enhanced Raman Spectroscopy. Annu. Rev. Anal. Chem. 2008, 1, 601-626.
6. Shahbazyan, T.; Pustovit, V. Fluorescence quenching near small metal nanoparticles. J. Chem. Phys. 2012, 136, 6.
7. Kosuda, K. M.; Bingham, J. M.; Wustholz, K. L.; Van Duyne, R. P. Nanostructures and Surface-Enhanced Raman Spectroscopy. In Comprehensive Nanoscience and Technology; Andrews, D., Scholes, G. and Wiederrecht, G., Eds.; Academic Press: Oxford, 2011; pp 263-301.
8. Schatz, G. C.; Van Duyne, R. P.; Griffiths, P. R. Electromagnetic Mechanism of Surface-Enhanced Spectroscopy. In Handbook of Vibrational Spectroscopy; Chalmers, J. M., Griffiths, P. R., Eds.; Wiley & Sons: Chichester, UK, 2006; Vol. 1, pp 11-21.
9. Graham, D.; Faulds, K.; Smith, W. E. Biosensing using silver nanoparticles and surface enhanced resonance Raman scattering. Chem. Commun. 2006, 4363-4371.
10. Lee, P. C.; Meisel, D. Adsorption and surface-enhanced Raman of dyes on silver and gold sols. J. Phys. Chem. 1982, 3391-3395.
11. Shiohara, A.; Wang, Y.; Liz-Marzán, L. M. Recent approaches toward creation of hot spots for SERS detection. J. Photochem. Photobiol., C 2014, 21, 2-25.
12. Wustholz, K. L.; Henry, A.; McMahon, J. M.; Freeman, R. G.; Valley, N.; Piotti, M. E.; Natan, M. J.; Schatz, G. C.; Van Duyne, R. P. Structure-activity relationships in gold nanoparticle dimers and trimers for surface-enhanced Raman spectroscopy. J. Am. Chem. Soc. 2010, 132, 10903-10910.
13. Kleinman, S. L.; Ringe, E.; Valley, N.; Wustholz, K. L.; Phillips, E.; Scheidt, K. A.; Schatz, G. C.; Van Duyne, R.,P. Single-molecule surface-enhanced Raman spectroscopy of crystal violet isotopologues: theory and experiment. J. Am. Chem. Soc. 2011, 133, 4115.

11
14. Kneipp, K.; Wang, Y.; Kneipp, H.; Perelman, L. T.; Itzkan, I.; Dasari, R. R.; Feld, M. S. Single Molecule Detection Using Surface-Enhanced Raman Scattering (SERS). Phys. Rev. Lett. 1997, 78, 1667-1670.

12
Chapter 2: Research with Undergraduates at the Intersection of Chemistry and Art: Surface-Enhanced Raman Scattering Studies of Oil Paintings
Introduction
Undergraduate students are increasingly provided the opportunity to
explore Raman spectroscopy as a part of their physical and analytical
chemistry courses. Here, we describe a new approach for engaging
undergraduate students with Raman spectroscopy in the research lab setting.
In particular, Wustholz at William & Mary and Svoboda at Colonial Williamsburg
engage in productive collaboration wherein predominately undergraduate
students develop SERS-based methods to identify fugitive pigments in works
of art. In this chapter, we describe several case studies that highlight the
pedagogical journeys of student researchers working at the intersection of
chemistry and art. We describe how this collaborative SERS research has led
to discovery, innovation, and the professional development of undergraduates.
Our Story: Where Chemistry and Art Meet
Located in historic Williamsburg, Virginia, William & Mary is the second
oldest college in the United States. Here, a diverse group of talented
undergraduate students focusing on majors in the social sciences,
humanities, and natural sciences converge to study and conduct research on
shared curiosities. Since 2010, we have been interested in pursuing research
with undergraduates at the intersection of chemistry and art. In particular, we

13
use surface-enhanced Raman scattering (SERS) spectroscopy to identify
artists' pigments in historic paintings (Figure 1). This collaborative research
has benefitted undergraduate students in several ways. First, SERS studies
of art objects are an attractive way to introduce undergraduates to concepts in
Raman spectroscopy and to develop their associated laboratory skills. Next,
since undergraduates are inherently excited about research with real-world
application, this project has been an effective tool to recruit students,
particularly those from underrepresented groups, into the research lab.
Finally, the students involved in this collaboration are productive and well
prepared for future careers in chemistry. In this chapter, we present a series
of colorful case studies, wherein former and current undergraduate
researchers develop new methods for SERS-based analysis of art.
Figure 1. Lindsay Oakley (’12) prepares an art sample for SERS analysis with Wustholz in the paintings conservation lab of Colonial Williamsburg. Image
courtesy of the Colonial Williamsburg Foundation.

14
Background: SERS in Conservation Science
The fading of colors in works of art is a major challenge for the
conservation of our cultural heritage. As these "fugitive" colorants fade upon
exposure to light, the aesthetics of the composition as well as the original
intention of the artist can be significantly modified. In general, organic colorants
are more susceptible to fading than their inorganic counterparts because of
photo-oxidation and photo-induced dissociation of carbon-carbon bonds to
produce a loss of color.1 Figure 2 shows the chemical structures of several
organic chromophores that comprise important fugitive artists' pigments. For
conservation professionals, identifying fugitive, organic pigments in art is vital
to understanding material degradation, identifying early stages of deterioration,
and formulating more-informed exhibition guidelines. Unfortunately, however,
the identification of organic dyes and pigments in art is one of the most
significant challenges in conservation.
Figure 2. Chemical structures of the main component(s) of (a) carmine lake (carminic acid), (b) madder lake (alizarin), (c)-(d) Reseda lake (luteolin and
apigenin, respectively), (e) indigo, and (f) mauve dye (mauveine A).
15
Conventional analytical techniques such as high performance liquid
chromatography (HPLC) have been used to identify organic colorants, but
require large samples (~1 mg) from a precious work of art, which are then
destroyed in the analysis process.2-4 Scanning electron microscopy with energy
dispersive X-ray (SEM/EDX) is widely used in the conservation setting to
perform elemental analysis.5-8 However, this approach is limited to the
detection of heavy atoms and does not provide for the identification of organic-
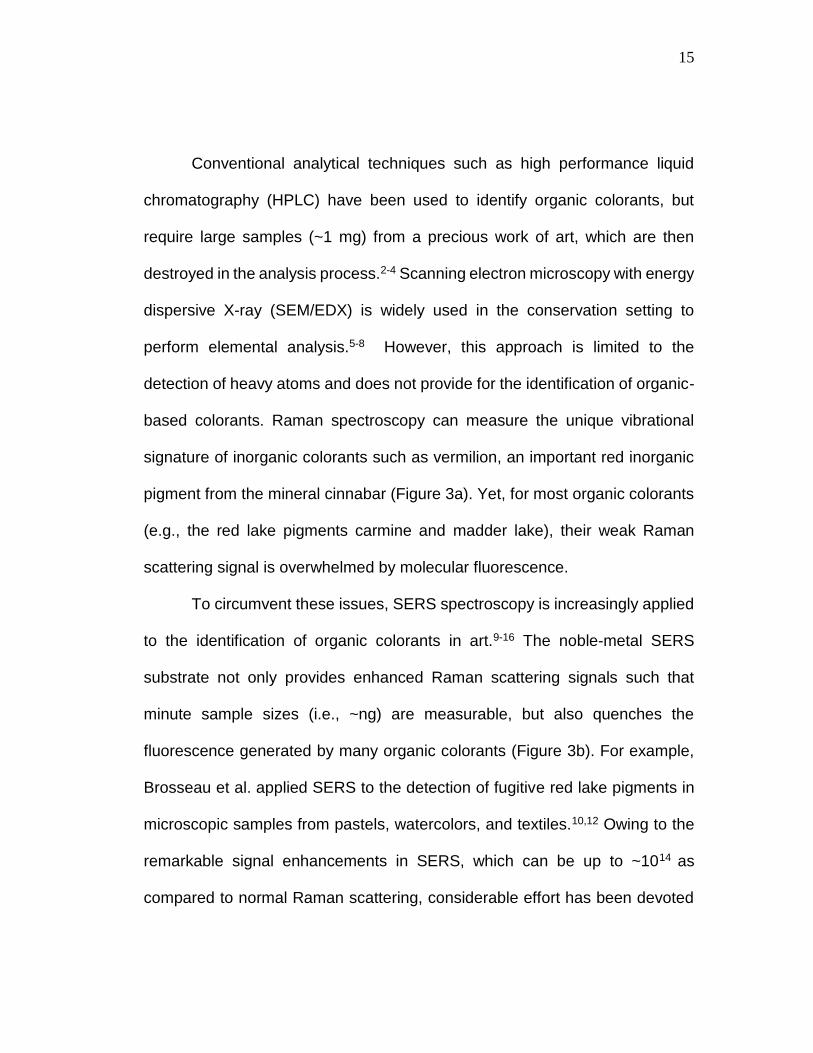
based colorants. Raman spectroscopy can measure the unique vibrational
signature of inorganic colorants such as vermilion, an important red inorganic
pigment from the mineral cinnabar (Figure 3a). Yet, for most organic colorants
(e.g., the red lake pigments carmine and madder lake), their weak Raman
scattering signal is overwhelmed by molecular fluorescence.
To circumvent these issues, SERS spectroscopy is increasingly applied
to the identification of organic colorants in art.9-16 The noble-metal SERS
substrate not only provides enhanced Raman scattering signals such that
minute sample sizes (i.e., ~ng) are measurable, but also quenches the
fluorescence generated by many organic colorants (Figure 3b). For example,
Brosseau et al. applied SERS to the detection of fugitive red lake pigments in
microscopic samples from pastels, watercolors, and textiles.10,12 Owing to the
remarkable signal enhancements in SERS, which can be up to ~1014 as
compared to normal Raman scattering, considerable effort has been devoted
16
to understanding the underlying enhancement mechanisms.17-21 In general,
there is broad consensus that SERS studies of chromophores benefit
significantly from the electromagnetic mechanism (EM) as well as resonance
Raman effects.19-22
Figure 3. The normal Raman spectrum of vermilion is readily obtained using 785-nm excitation, but molecular fluorescence precludes Raman measurements of organic pigments carmine and madder lake. (b)
Corresponding SERS spectra of the lake pigments obtained using citrate-reduced silver nanoparticles (AgNPs) as the enhancing substrate. Adapted
with permission from reference 23. Copyright 2015 American Chemical Society.
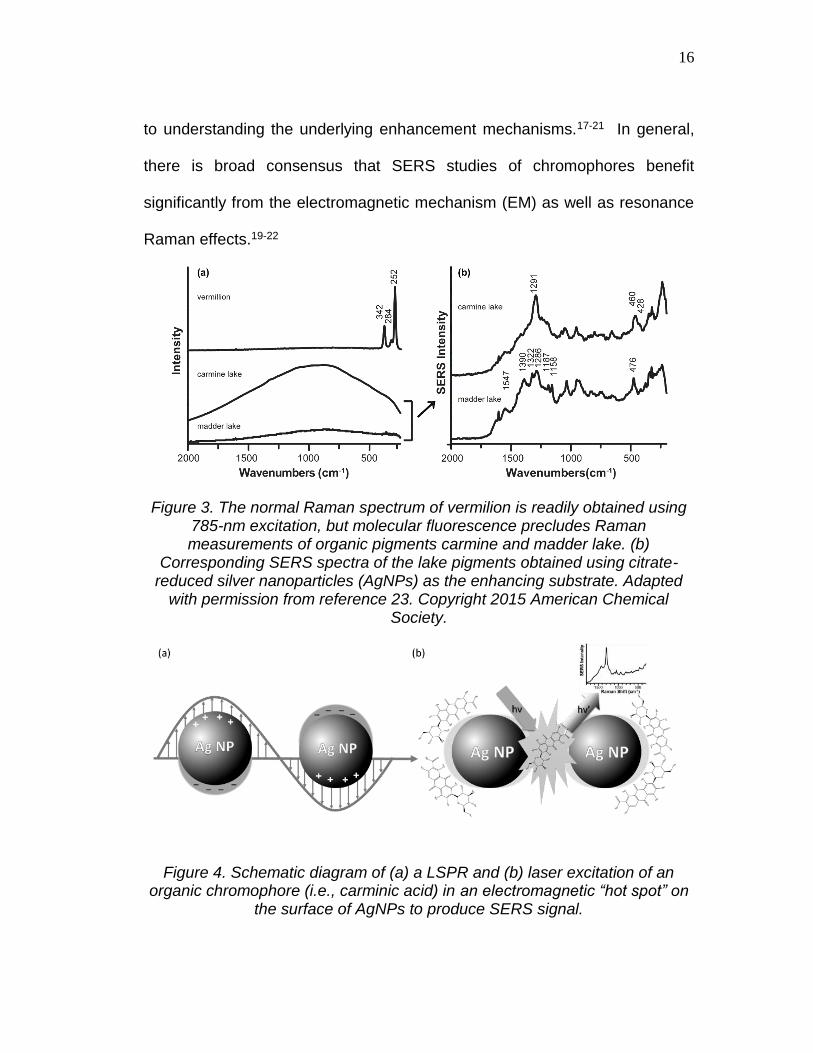
Figure 4. Schematic diagram of (a) a LSPR and (b) laser excitation of an organic chromophore (i.e., carminic acid) in an electromagnetic “hot spot” on
the surface of AgNPs to produce SERS signal.

17
The EM is enhancement in the local field intensity as a result of excitation
of a localized surface plasmon resonance (LSPR).19,20,24 Figure 4 presents a
schematic of how the incident electromagnetic field excites a collective
oscillation of the conduction electrons in a noble metal nanoparticle, which
results in enhanced fields close to the surface.24 In particular, for a small metal
sphere, the EM field intensity at the nanoparticle surface is given by: |Eout|2 =
2E02|(εin − εout)/(εin + 2εout)|2, where εin and εout are the dielectric constants of the
metal nanoparticle and external environment, respectively.24 Maximum
enhancement occurs when εin ≈ −2εout, a resonance condition that is satisfied
in the visible region for Au and Ag. Therefore, when an analyte (e.g., carminic
acid – the primary component of carmine lake) is localized in a region of high
EM enhancement such as a “hot spot,”19,22,24 laser excitation of the sample
yields extremely enhanced Raman signals (i.e., SERS). The extent of signal
enhancement relative to normal Raman measurements is expressed as an
enhancement factor (EF) that is given by:
𝐸𝐹 = 𝐼𝑆𝐸𝑅𝑆/𝑁𝑆𝐸𝑅𝑆
𝐼𝑁𝑅𝑆/𝑁𝑁𝑅𝑆 (1)
where ISERS and INRS are the SERS and normal Raman scattering intensities,
respectively, which are normalized by the number of molecules (N). Several
groups have examined the SERS enhancement mechanism17-21 and
demonstrated the widespread applicability of SERS to problems in chemical
and biological sensing.25-32 For example, recent reviews have demonstrated

18
the application of SERS to the identification of colorants that are relevant to art
and archaeology.33-35
Our research focuses on the development of SERS methodologies for
the identification of fugitive organic pigments in oil paintings. Historic oil
paintings may contain an amalgamation of colorants, resins, oils, gums, and
waxes, all of which have undergone ageing and degradation. This inherent
complexity represents a compelling real-world problem for undergraduate
research students. How can SERS be used to identify the fugitive colorant
within a microscopic paint sample, which can exhibit seemingly infinite spatial
and temporal complexity? The following case studies highlight how
undergraduate research in SERS can lead to discovery and innovation in both
chemistry and art conservation as well as contribute to students' professional
development.
Case Studies
Revealing Reds with Undergraduates
Due to the inherent complexity of historic oil paintings, organic pigments
are typically extracted from the paint matrix, both mechanically and chemically,
prior to investigation using SERS. For example, Leona and coworkers
demonstrated the first SERS study of oil glazes, wherein hydrofluoric acid was
used to pretreat disperse samples containing red lake pigments in order to

19
extract the colorant from the binding medium.11,15 In this method, the acid
pretreatment serves to hydrolyze the water-soluble dye from the insoluble lake
pigment (e.g., carminic acid from carmine lake).15 Although this approach is
effective, a direct analysis of art samples without HF is preferable in the
undergraduate research setting. In particular, a direct, non-hydrolysis approach
has the advantages of preserving sample integrity, simplifying the analysis
procedure, and most importantly, eliminating the hazards associated with using
HF. Therefore, our first undergraduate research students, Lindsay Oakley (‘12)
and Stephen Dinehart (‘12), set out to develop a non-hydrolysis SERS-based
method for identifying fugitive red lake pigments in historic oil paintings.
Previous work by Brosseau and coworkers demonstrated that citrate-
reduced silver nanoparticles (AgNPs)36 are effective SERS substrates for
identifying red lake pigments in relatively homogeneous artists’ media (i.e.,
pastels and watercolors).12 As a first step toward non-hydrolysis SERS of oil
paintings, the students made oil paints using historic methods and red lake
pigments derived from the natural dyestuffs madder root, brazilwood, cinnabar,
lac and cochineal insects. We demonstrated that AgNPs provide for the SERS-
based identification of red lake pigments in reference paints.37 Students also
reported that understanding the origins of these colorants and making oil paints
in the conservation setting are particularly appealing aspects of this project.
After these control experiments, Oakley traveled to the paintings conservation
lab at nearby Colonial Williamsburg to meet her subjects, Portrait of Isaac

20
Barré by Sir Joshua Reynolds, 1766, and a painting by the earliest native-
born American of European descent, Portrait of William Nelson by Robert
Feke, circa 1750. Figure 5a shows the latter painting, which during
conservation treatment exhibited some signs of minor fading. Working with a
microscope and surgical blade, Svoboda performed the delicate work of
removing a single pigment grain from the paint matrix of the faded region.
Figure 5. (a) Portrait of William Nelson by Robert Feke, probably 1748-1750, CWF 1986-245. (b) Photomicrograph of lip sample coated in AgNPs. (c)
Corresponding SERS spectrum obtained at 632.8-nm. Labeled peaks are consistent with carmine lake and asterisks denote bands due to adsorbed
citrate. (d) Fluorescence spectra of the (solid line) lip sample) and a (dashed line) reference paint of carmine lake in linseed oil. Reproduced with
permission from reference 37. Copyright 2011 American Chemical Society.
Figure 5b shows a photomicrograph of sample obtained from the lip region of
the Portrait of William Nelson and coated in AgNPs. Figure 5c presents the

21
SERS spectrum of the sample obtained using a Raman microscope with 632.8-
nm excitation, with labeled peaks consistent with carmine lake.37
During the course of these studies, we observed that the AgNPs are not
entirely adhered to the paint sample, since some regions of the sample
exhibited excellent SERS signal while others produced solely fluorescence.
Whereas SERS elucidates the vibrational fingerprint of an analyte,
corresponding fluorescence measurements can provide a probe of local
environment. For example, the fluorescence spectrum of the lip sample (Figure
5d) is an excellent match to a reference paint comprised of carmine lake in
linseed oil. SERS measurements also revealed that Sir Joshua Reynolds used
carmine lake to create the fleshtones in Portrait of Isaac Barré.37 Corresponding
fluorescence measurements support the interpretation that the binding medium
for Reynolds' work contains both linseed oil and copal resin.
Ultimately, this correlated non-hydrolysis SERS and fluorescence
approach enabled the definitive identification of the organic colorant and
binding medium in an exceptionally small art sample, without the need for HF
extraction. Moreover, this study demonstrated the utility of SERS for identifying
red lake pigments in fleshtones – challenging regions that contain miniscule
quantities of the sought colorant. Although this approach is effective for historic
red lake pigments, we quickly discovered that the detection of yellow and blue
organic pigments requires sample pretreatment. For example, Oakley worked
with David Fabian (‘13) and Hannah Mayhew (‘14) to develop a simple, rapid

22
and effective protocol for SERS-based identification of indigo in microscopic
paint from art.38 In this approach, a sample pretreatment strategy based on the
in situ conversion of insoluble indigo to soluble indigo carmine using H2SO4 is
used to solubilize the pigment into the aqueous suspension of AgNPs. This
study laid the groundwork for our growing interest in determining a general
strategy to identify paint samples that contain pigment mixtures (e.g., optical
mixtures of blue and yellow organic pigments that are used to create green
paint).
It’s Not Easy Being Green
An ideal analytical method for identifying pigments in historic oil
paintings should be exceedingly sensitive, selective, minimally invasive, and
applicable to a wide range of colorants. Although previous work by our group37-
40 and others11,14,15 demonstrated the utility of SERS for identifying individual
organic pigments in minute samples from historic oil paintings, none provided
for the identification of pigment mixtures in paint. Considering the variety of
colorants that are likely to appear in historic oil paint,41 we decided to pursue a
strategic approach for SERS-based analysis of pigment mixtures. In particular,
motivated by the problem of fading in paint containing yellow organic pigments
(e.g., green foliage that now appears blue), we investigated a series of green
paints comprised of optical mixtures of blue and yellow organic pigments.

23
Joo Yeon (Diana) Roh (‘16) and Mary Matecki (‘16) first contributed to
studying yellow organic pigments (i.e., Reseda lake, Stil de Grain, and
gamboge) in reference samples of yellow and green paint.40 Next, using a
series of green reference paints, they established a practical flowchart for
SERS-based identification of both the blue and yellow organic pigments within
the paints.41 In the first step, users obtain a normal Raman measurement of the
untreated art sample to reveal the possible presence of the inorganic pigment,
Prussian blue. If, however, the characteristic Raman bands for Prussian blue
are not present and broad fluorescence band is observed, then sample
treatment with HCl/MeOH is performed.40
Figure 6. (a) Portrait of Elizabeth Burwell Nelson (Mrs. William Nelson) by Robert Feke, probably 1748-1750, CWF 1986-246. (b) Photomicrograph of the rose stem where the microscopic sample was obtained. Corresponding
SERS spectra of the sample obtained following the flowchart (c) after treatment with HCl/MeOH is compared to (d) reference green paint containing
Reseda lake. Asterisks denote bands due to citrate. Reproduced with permission from reference 41. Copyright 2016 American Chemical Society.

24
If, on the other hand, weak Raman scattering at ~1633 and ~1592 cm-1 are
observed, consistent with gamboge, users perform an extraction step with
acetonitrile and water. After SERS measurements to reveal the yellow, organic
pigment, the final step is to treat the sample with H2SO4 to elucidate indigo
using SERS.
After success with the reference samples, Roh and Matecki subjected
the flowchart approach to the ultimate challenge – a minute sample from the
Portrait of Elizabeth Burwell Nelson (Mrs. William Nelson) by Robert Feke
(Figure 6a). In this portrait, the sitter holds a rose stem that now appears blue
(Figure 6b), suggesting the presence of a photosensitive yellow organic
pigment that has faded over time. To test this hypothesis, we examined a
microscopic sample from the stem following the treatment flowchart. At step 1,
the sample exhibited normal Raman peaks due to Prussian blue (PB), with no
evidence for gamboge. Therefore, the sample was treated with HCl/MeOH to
reveal SERS bands at 1585, 1494, 1296, 1118, 735, 607, and 429 cm-1 for
Reseda lake (RL), as shown in Figure 6c. This study marked the first successful
identification of a yellow lake pigment in a historic painting and the first
detection of two different pigments in a single paint sample.41
SERS Analysis of Early Work by Paul Cézanne
Although SERS studies of oil paintings have demonstrated high
sensitivity and selectivity, these investigations are largely focused on natural,

25
organic colorants that originate from plant and animal sources. To extend the
applicability of SERS to a wider range of organic colorants, we turned our
attention to the early, synthetic dyes that date to the mid-19th century. In
particular, Kristen Frano (M.S. '15) used SERS to examine the first synthetic
organic dye, mauve, which was serendipitously discovered by William Henry
Perkin in 1856.42,43
Figure 7. (a) Miracle of the Slave, Paul Cézanne after Jacopo Tintoretto, c. 1856-1870, Muscarelle Museum of Art, 2014.067. (b) Photomicrograph of red-violet turban detail. (c) Corresponding SERS spectra of the (red line) sample and (black line) reference mauve dye from a modern synthesis,
obtained using 632.8-nm excitation. Asterisks denote bands due to citrate. Images courtesy of the Muscarelle Museum of Art at the College of William
and Mary, Williamsburg, VA.
Previous work by Cañamares and coworkers44,45 demonstrated that coupling
thin layer chromatography to SERS provides for structural elucidation of the
main components in mauve dye. However, to our knowledge, mauve dye had
not been identified in an actual work of art.

26
Miracle of the Slave, a recent acquisition by the Muscarelle Museum of
Art at William & Mary, provided an interesting case study for our research
group. Visual inspection of the painting by a team of curators indicated that
Miracle of the Slave (Figure 7a) was painted by Paul Cézanne as a copy of an
original work by Jacopo "Tintoretto" Robusti. To examine this hypothesis, we
examined the luminous regions of transparent paint, which are consistent with
the presence of organic dye-based colors, using direct, non-hydrolysis SERS.37
SERS spectra of the red-violet hues found in the turban details of the figure just
left of center (Figure 7b), obtained using 632.8-nm excitation, are inconsistent
with references for a variety of modern and historic red and purple colorants
(i.e., madder lake, carmine lake, lac, brazilwood, logwood, Tyrian purple,
kermes, crystal violet, cobalt violet, rhodamine B, dioxazine violet). The
observed SERS peaks at 1529, 1450, 1340, 1193, 1183, 1141, 1105, 1004,
952, 843, 830, 748, and 679 cm-1 are consistent with reference samples of
mauve dye prepared using a modern synthesis.44-46 However, several
prominent vibrational modes for the modern mauve dye (i.e., 1638, 1593, 1560,
610, 559, 434, and 387 cm-1) are absent from the art sample.45,47 It is possible
that degradation of the historical sample as well as a difference in chromophore
composition between the modern synthesis and a period synthesis prepared
from coal tar explain these discrepancies.
Ultimately, based on the observed SERS spectral correlation to mauve
and the lack of evidence for alternative colorants, the red-violet hue in the
27
turban is attributed to an early synthetic organic colorant, most likely mauve or
analogous aniline derivative. With its intense color and low cost, mauve
became extremely popular very quickly and Perkins' establishment of a factory
in 1862 to produce mauve commercially marked the beginning of the modern
dye industry.42,43 Its presence in Miracle of the Slave firmly refines the date of
the painting to a time after 1856, consistent with the initial attribution of the
painting to the early period of Paul Cézanne.
Engaging Undergraduates with SERS in Teaching Labs
The undergraduate students involved in SERS studies of art are
exceedingly enthusiastic about their research and eager to share their results
with others. This enthusiasm inspired us to develop a new experiment for an
upper-division teaching laboratory that simulates a problem-solving scenario in
the conservation setting. In particular, students enrolled in the Integrated
Physical and Analytical Chemistry Laboratory are challenged to identify the
pigments in a mock Warhol-inspired oil painting. Although several laboratory
experiments to explore SERS44-47 and the field of art conservation48-51 existed,
none integrated SERS with art conservation. Frano and Mayhew developed a
problem-based learning approach to the experiment, where the instructor
facilitates group discussion and guides student inquiry to solve the problem –
in this case, identifying unknown pigments in a "precious" artwork.23

28
Students begin by evaluating the different analytical techniques that
might be appropriate for painting analysis. After determining that Raman
spectroscopy is a reasonable approach for this purpose, students attempt
normal Raman measurements on the painting (Figure 8), which is comprised
of inorganic (nonfluorescent) and organic (fluorescent) pigments.
Figure 8. Schematic of the procedure for an upper-division laboratory experiment where students analyze minute samples from an oil painting using
a benchtop Raman spectrometer equipped with 785-nm laser excitation. Adapted with permission from reference 23. Copyright 2015 American
Chemical Society.
When confronted with the broad, featureless spectra of the organic pigments,
students proceed to synthesize AgNPs for SERS analysis and extract a
microscopic sample from the painting using a surgical blade.36 To date,
approximately 200 students have conducted this experiment and successfully
identified vermilion, lac dye, carmine lake, and madder lake paints. According
to student feedback, one of the strongest aspects of the experiment is problem
solving a real-world investigation from beginning to end.9

29
More recently, Wustholz has developed a course for first-year
undergraduate students, Light at the Museum: the Science and Art of
Conservation. In this course, undergraduates learn how scientists use
techniques such as Raman spectroscopy and SERS to identify artists'
materials in actual works of art. The learning outcomes for this class are
evaluated using a series of scaffolded assignments, where students build the
knowledge and skills necessary to create a presentation to the class on a
museum object. In the final presentation, students explain, interpret, and
analyze the results of a technical examination and their bearing on the artwork
itself (e.g., historical significance, artist, attribution, conservation). We find that
art conservation is an appealing vehicle through which to deliver fundamental
concepts in Raman spectroscopy.
Conclusion: Where Are They Now?
Where are they – the paintings and the students – now? The information
revealed by our SERS analyses of paintings is often presented to museum
visitors in the form of digital reconstructions. These reconstructions, informed
by chemical characterization performed by undergraduate students, offer
insight into the original intent of the artist before fading occurred. Ultimately, the
definitive identification of the more vulnerable organic-based colors so sought
after by artists helps the viewer – curator, conservator, chemist, museum-goer

30
– better understand their original appearances as well as color changes as part
of the patina of age.
Since 2010, 14 students have been involved this collaboration, including
12 women and another 2 from underrepresented groups. Of these 14 students,
8 have co-authored manuscripts, 6 have gone on to Ph.D. programs in
chemistry or materials science, and the rest to medicine, education, or industry
positions. Interestingly, most of the undergraduate research students who went
to Ph.D. programs were initially planning other careers. For example, Lindsay
Oakley ('12) originally stated that she wasn't interested in graduate school in
chemistry but that she loved art history. Just two years later, she had
discovered a passion for research, co-authored two manuscripts, and was
headed to a top Ph.D. program in materials science and engineering at
Northwestern University. She recently obtained a Ph.D. and is currently
focusing on conservation research in Denmark. Other former undergraduate
researchers like Fabian, Roh, and Choffel, and are pursuing graduate-level
research in chemistry.
Engaging students in SERS research through the lens of art
conservation exposes bright minds to opportunities outside of the standard
chemistry curricula. As they gain experience handling minute samples from
precious paintings and working in the conservation setting, students develop
excellent problem-solving, hand, and communication skills. Ultimately, these
SERS-based research and teaching experiences are an effective way to
31
enhance the preparation of undergraduate students for future careers in
chemistry as part of a robust liberal arts education.
Acknowledgments
We gratefully and wholeheartedly thank the former and current students that
have driven this collaborative research project: Lindsay Oakley, Stephen
Dinehart, David Fabian, Hannah Mayhew, Kristen Frano, Diana Roh, Mary
Matecki, Kathleen Nelsen, Marisa Choffel, Carolyn Farling, Kalie Fikse, and
Kathleen Lauer. We acknowledge the Eppley Foundation for Research,
Jeffress Memorial Trust, and the William & Mary Charles Center for funding of
this project. We are also indebted to Colonial Williamsburg for continued
support of this collaboration and especially to Ronald L. Hurst, Vice President
for Collections, Conservation, and Museums and The Carlisle H. Humelsine
Chief Curator at Colonial Williamsburg Foundation.
32
References
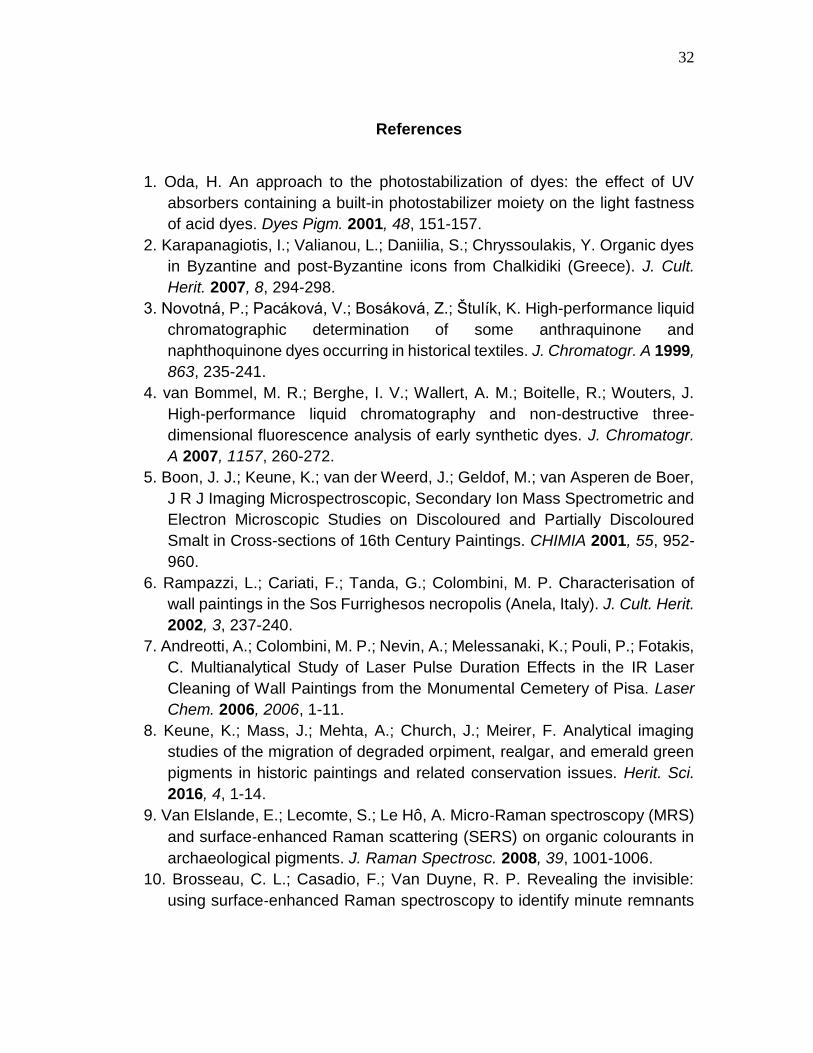
1. Oda, H. An approach to the photostabilization of dyes: the effect of UV
absorbers containing a built-in photostabilizer moiety on the light fastness
of acid dyes. Dyes Pigm. 2001, 48, 151-157.
2. Karapanagiotis, I.; Valianou, L.; Daniilia, S.; Chryssoulakis, Y. Organic dyes
in Byzantine and post-Byzantine icons from Chalkidiki (Greece). J. Cult.
Herit. 2007, 8, 294-298.
3. Novotná, P.; Pacáková, V.; Bosáková, Z.; Štulık, K. High-performance liquid
chromatographic determination of some anthraquinone and
naphthoquinone dyes occurring in historical textiles. J. Chromatogr. A 1999,
863, 235-241.
4. van Bommel, M. R.; Berghe, I. V.; Wallert, A. M.; Boitelle, R.; Wouters, J.
High-performance liquid chromatography and non-destructive three-
dimensional fluorescence analysis of early synthetic dyes. J. Chromatogr.
A 2007, 1157, 260-272.
5. Boon, J. J.; Keune, K.; van der Weerd, J.; Geldof, M.; van Asperen de Boer,
J R J Imaging Microspectroscopic, Secondary Ion Mass Spectrometric and
Electron Microscopic Studies on Discoloured and Partially Discoloured
Smalt in Cross-sections of 16th Century Paintings. CHIMIA 2001, 55, 952-
960.
6. Rampazzi, L.; Cariati, F.; Tanda, G.; Colombini, M. P. Characterisation of
wall paintings in the Sos Furrighesos necropolis (Anela, Italy). J. Cult. Herit.
2002, 3, 237-240.
7. Andreotti, A.; Colombini, M. P.; Nevin, A.; Melessanaki, K.; Pouli, P.; Fotakis,
C. Multianalytical Study of Laser Pulse Duration Effects in the IR Laser
Cleaning of Wall Paintings from the Monumental Cemetery of Pisa. Laser
Chem. 2006, 2006, 1-11.
8. Keune, K.; Mass, J.; Mehta, A.; Church, J.; Meirer, F. Analytical imaging
studies of the migration of degraded orpiment, realgar, and emerald green
pigments in historic paintings and related conservation issues. Herit. Sci.
2016, 4, 1-14.
9. Van Elslande, E.; Lecomte, S.; Le Hô, A. Micro‐Raman spectroscopy (MRS)
and surface‐enhanced Raman scattering (SERS) on organic colourants in
archaeological pigments. J. Raman Spectrosc. 2008, 39, 1001-1006.
10. Brosseau, C. L.; Casadio, F.; Van Duyne, R. P. Revealing the invisible:
using surface‐enhanced Raman spectroscopy to identify minute remnants

33
of color in Winslow Homer's colorless skies. J. Raman Spectrosc. 2011, 42,
1305-1310.
11. Pozzi, F.; Lombardi, J. R.; Bruni, S.; Leona, M. Sample Treatment
Considerations in the Analysis of Organic Colorants by Surface-Enhanced
Raman Scattering. Anal. Chem. 2012, 84, 3751-3757.
12. Brosseau, C. L.; Rayner, K. S.; Casadio, F.; Grzywacz, C. M.; Van Duyne,
R. P. Surface-Enhanced Raman Spectroscopy: A Direct Method to Identify
Colorants in Various Artist Media. Anal. Chem. 2009, 81, 7443-7447.
13. Castro, R.; Pozzi, F.; Leona, M.; Melo, M. J. Combining SERS and
microspectrofluorimetry with historically accurate reconstructions for the
characterization of lac dye paints in medieval manuscript illuminations. J.
Raman Spectrosc. 2014, 45, 1172-1179.
14. Pozzi, F.; Berg, K. J.; Fiedler, I.; Casadio, F. A systematic analysis of red
lake pigments in French Impressionist and Post‐Impressionist paintings by
surface‐enhanced Raman spectroscopy (SERS). J. Raman Spectrosc.
2014, 45, 1119-1126.
15. Leona, M.; Hoffmann, R. Microanalysis of Organic Pigments and Glazes in
Polychrome Works of Art by Surface-Enhanced Resonance Raman
Scattering. PNAS 2009, 106, 14757-14762.
16. Van Elslande, E.; Lecomte, S.; Le Hô, A. Micro-Raman spectroscopy
(MRS) and surface‐enhanced Raman scattering (SERS) on organic
colourants in archaeological pigments. J. Raman Spectrosc. 2008, 39,
1001-1006.
17. Kneipp, K.; Wang, Y.; Kneipp, H.; Perelman, L. T.; Itzkan, I.; Dasari, R. R.;
Feld, M. S. Single Molecule Detection Using Surface-Enhanced Raman
Scattering (SERS). Phys. Rev. Lett. 1997, 78, 1667-1670.
18. Dieringer, J. A.; Lettan, 2., Robert B; Scheidt, K. A.; Van Duyne, R. P. A
frequency domain existence proof of single-molecule surface-enhanced
Raman spectroscopy. J. Am. Chem. Soc. 2007, 129, 16249-16256.
19. Stiles, P. L.; Dieringer, J. A.; Shah, N. C.; Van Duyne, R. P. Surface-
Enhanced Raman Spectroscopy. Ann. Rev. Anal. Chem. 2008, 1, 601-626.
20. Schatz, G. C.; Van Duyne, R. P.; Griffiths, P. R. Electromagnetic
Mechanism of Surface-Enhanced Spectroscopy. In Handbook of Vibrational
Spectroscopy; Chalmers, J. M., Griffiths, P. R., Eds.; Wiley & Sons:
Chichester, UK, 2006; Vol. 1, pp 11-21.
21. Kleinman, S. L.; Ringe, E.; Valley, N.; Wustholz, K. L.; Phillips, E.; Scheidt,
K. A.; Schatz, G. C.; Van Duyne, R. P. Single- molecule surface- enhanced
34
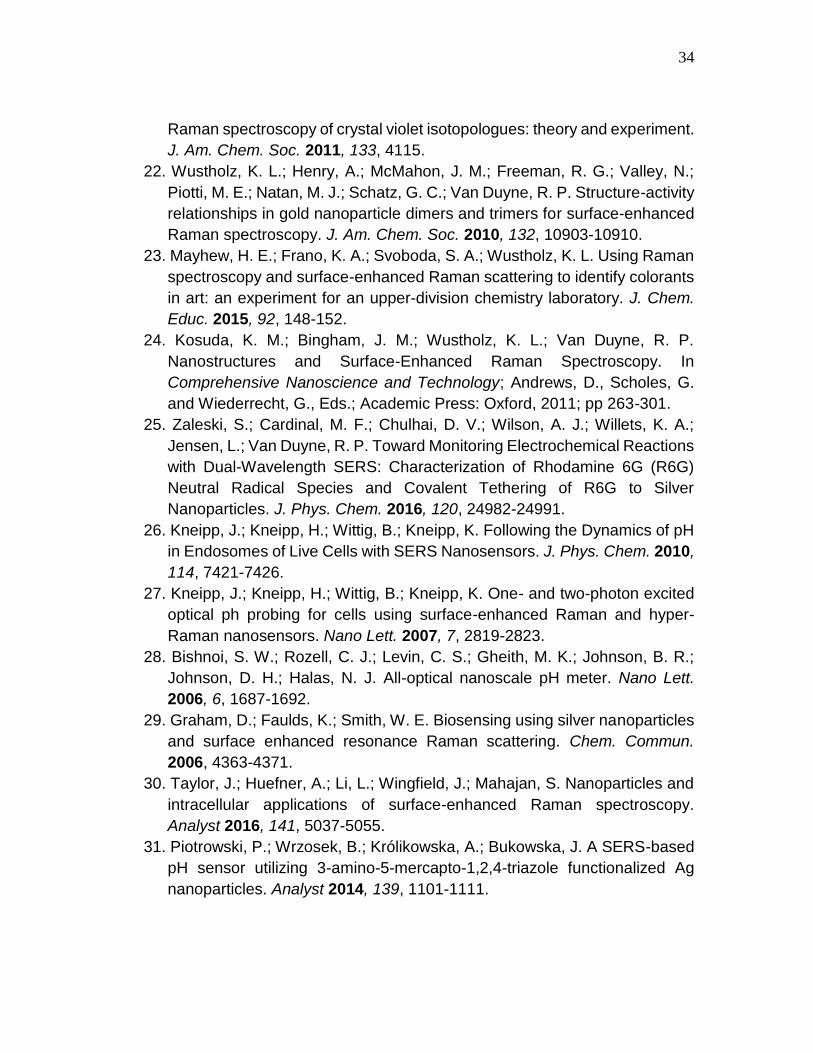
Raman spectroscopy of crystal violet isotopologues: theory and experiment.
J. Am. Chem. Soc. 2011, 133, 4115.
22. Wustholz, K. L.; Henry, A.; McMahon, J. M.; Freeman, R. G.; Valley, N.;
Piotti, M. E.; Natan, M. J.; Schatz, G. C.; Van Duyne, R. P. Structure-activity
relationships in gold nanoparticle dimers and trimers for surface-enhanced
Raman spectroscopy. J. Am. Chem. Soc. 2010, 132, 10903-10910.
23. Mayhew, H. E.; Frano, K. A.; Svoboda, S. A.; Wustholz, K. L. Using Raman
spectroscopy and surface-enhanced Raman scattering to identify colorants
in art: an experiment for an upper-division chemistry laboratory. J. Chem.
Educ. 2015, 92, 148-152.
24. Kosuda, K. M.; Bingham, J. M.; Wustholz, K. L.; Van Duyne, R. P.
Nanostructures and Surface-Enhanced Raman Spectroscopy. In
Comprehensive Nanoscience and Technology; Andrews, D., Scholes, G.
and Wiederrecht, G., Eds.; Academic Press: Oxford, 2011; pp 263-301.
25. Zaleski, S.; Cardinal, M. F.; Chulhai, D. V.; Wilson, A. J.; Willets, K. A.;
Jensen, L.; Van Duyne, R. P. Toward Monitoring Electrochemical Reactions
with Dual-Wavelength SERS: Characterization of Rhodamine 6G (R6G)
Neutral Radical Species and Covalent Tethering of R6G to Silver
Nanoparticles. J. Phys. Chem. 2016, 120, 24982-24991.
26. Kneipp, J.; Kneipp, H.; Wittig, B.; Kneipp, K. Following the Dynamics of pH
in Endosomes of Live Cells with SERS Nanosensors. J. Phys. Chem. 2010,
114, 7421-7426.
27. Kneipp, J.; Kneipp, H.; Wittig, B.; Kneipp, K. One- and two-photon excited
optical ph probing for cells using surface-enhanced Raman and hyper-
Raman nanosensors. Nano Lett. 2007, 7, 2819-2823.
28. Bishnoi, S. W.; Rozell, C. J.; Levin, C. S.; Gheith, M. K.; Johnson, B. R.;
Johnson, D. H.; Halas, N. J. All-optical nanoscale pH meter. Nano Lett.
2006, 6, 1687-1692.
29. Graham, D.; Faulds, K.; Smith, W. E. Biosensing using silver nanoparticles
and surface enhanced resonance Raman scattering. Chem. Commun.
2006, 4363-4371.
30. Taylor, J.; Huefner, A.; Li, L.; Wingfield, J.; Mahajan, S. Nanoparticles and
intracellular applications of surface-enhanced Raman spectroscopy.
Analyst 2016, 141, 5037-5055.
31. Piotrowski, P.; Wrzosek, B.; Królikowska, A.; Bukowska, J. A SERS-based
pH sensor utilizing 3-amino-5-mercapto-1,2,4-triazole functionalized Ag
nanoparticles. Analyst 2014, 139, 1101-1111.

35
32. Ngo, H. T.; Wang, H.; Fales, A. M.; Vo-Dinh, T. Plasmonic SERS biosensing
nanochips for DNA detection. Anal. Bioanal. Chem. 2016, 408, 1773-1781.
33. Wustholz, K. L.; Brosseau, C. L.; Casadio, F.; Van Duyne, R. P. Surface-
enhanced Raman spectroscopy of dyes: from single molecules to the
artists' canvas. Phys. Chem. Chem. Phys. 2009, 11, 7350-7359.
34. Chen, K.; Leona, M.; Vo-Dinh, T. Surface-enhanced Raman scattering for
identification of organic pigments and dyes in works of art and cultural
heritage material. Sens. Rev. 2007, 27, 109-120.
35. Casadio, F.; Leona, M.; Lombardi, J. R.; Van Duyne, R. Identification of
organic colorants in fibers, paints, and glazes by surface enhanced Raman
spectroscopy. Acc. Chem. Res. 2010, 43, 782-791.
36. Lee, P. C.; Meisel, D. Adsorption and surface-enhanced Raman of dyes on
silver and gold sols. J. Phys. Chem. 1982, 3391-3395.
37. Oakley, L. H.; Dinehart, S. A.; Svoboda, S. A.; Wustholz, K. L. Identification
of Organic Materials in Historic Oil Paintings Using Correlated
Extractionless Surface-Enhanced Raman Scattering and Fluorescence
Microscopy. Anal. Chem. 2011, 83, 3986-3989.
38. Oakley, L. H.; Fabian, D. M.; Mayhew, H. E.; Svoboda, S. A.; Wustholz, K.
L. Pretreatment Strategies for SERS Analysis of Indigo and Prussian Blue
in Aged Painted Surfaces. Anal. Chem. 2012, 84, 8006-8012.
39. Frano, K. A.; Mayhew, H. E.; Svoboda, S. A.; Wustholz, K. L. Combined
SERS and Raman analysis for the identification of red pigments in cross-
sections from historic oil paintings. Analyst 2014, 139, 6450-6455.
40. Mayhew, H. E.; Fabian, D. M.; Svoboda, S. A.; Wustholz, K. L. Surface-
enhanced Raman spectroscopy studies of yellow organic dyestuffs and lake
pigments in oil paint. Analyst 2013, 138, 4493-4499.
41. Roh, J. Y.; Matecki, M. K.; Svoboda, S. A.; Wustholz, K. L. Identifying
Pigment Mixtures in Art Using SERS: A Treatment Flowchart Approach.
Anal. Chem. 2016, 88, 2028-2032.
42. Sousa, M. M.; Melo, M. J.; Parola, A. J.; Morris, P. J. T.; Rzepa, H. S.; de
Melo, J Sérgio Seixas A study in mauve: unveiling Perkin's dye in historic
samples. Chem. Eur. J. 2008, 14, 8507-8513.
43. Conceição Oliveira, M. d.; Dias, A.; Douglas, P.; Seixas de Melo, J S
Perkin’s and Caro’s Mauveine in Queen Victoria’s Lilac Postage Stamps: A
Chemical Analysis. Chem. Eur. J. 2014, 20, 1808-1812.
44. Cañamares, M. V.; Reagan, D. A.; Lombardi, J. R.; Leona, M. TLC-SERS
of mauve, the first synthetic dye. J. Raman Spectrosc. 2014, 45, 1147-1152.

36
45. Cañamares, M. V.; Lombardi, J. R. Raman, SERS, and DFT of Mauve Dye:
Adsorption on Ag Nanoparticles. J. Phys. Chem. C 2015, 119, 14297-
14303.
46. Scaccia, R. L.; Coughlin, D.; Ball, D. W. A microscale synthesis of mauve.
J. Chem. Educ. 1998, 75, 769.
47. Galasso, V. A DFT characterization of the structures and UV/vis absorption
spectra of mauveine dyes. Chem. Phys. Lett. 2008, 457, 250-253.
48. Nivens, D. A.; Padgett, C. W.; Chase, J. M.; Verges, K. J.; Jamieson, D. S.
Art, Meet Chemistry; Chemistry, Meet Art: Case Studies, Current Literature,
and Instrumental Methods Combined to Create a Hands-On Experience for
Nonmajors and Instrumental Analysis Students. J. Chem. Educ. 2010, 87,
1089-1093.
49. Smith, G.; Nunan, E.; Walker, C.; Kushel, D. Inexpensive, Near-Infrared
Imaging of Artwork Using a Night- Vision Webcam for Chemistry-of-Art
Courses. J. Chem. Educ. 2009, 86, 1382-1388.
50. Harmon, K.; Miller, L.; Millard, J. Crime Scene Investigation in the Art World:
The Case of the Missing Masterpiece. J. Chem. Educ. 2009, 86, 817-819.
51. Nielsen, S. E.; Scaffidi, J.; Yezierski, E. J. Detecting Art Forgeries: A
Problem- Based Raman Spectroscopy Lab. J. Chem. Educ. 2014, 91, 446-
450.
37
Chapter 3: SERS pH Sensing
SERS for Theranostics: Background
SERS has powerful capability as a diagnostic tool in various
nanophotonics for theranostics including biosensing applications. Theranostics
is the portmanteau term for an application that pursues new diagnostic and
therapeutic measures to monitor and target disease.1 To date, SERS has been
applied to glucose sensing,2-5 DNA detection,6-9 and intracellular monitoring of
drug effects.10,11 Owing to its ultrasensitive and unambiguous reporting SERS
has been applied in both solid- and solution-phase experiments. SERS
substrate stability in aqueous suspensions also makes it an ideal technique in
biological environments. Additionally, Raman measurements benefit from a
wide spectral range due to its intrinsic scattering effect, which differs from other
spectroscopic techniques requiring specific excitation and emission
wavelengths for each particular analyte. However, SERS applications can also
gain intensity by exciting at the particular resonance frequency of the analyte
molecule to produce resonance Raman enhancement. Though SERS
biosensors have gained momentum in recent years, major challenges still exist.
For example, glucose exhibits small normal Raman cross-sections and weak
adsorption to free SERS-active surfaces, such as roughened silver substrates
have been observed.3 However, the biological applications of SERS are
increasingly moving forward to address real-world applications. For example,
Kircher and colleagues improved tumor visualization via magnetic-resonance

38
and photoacoustic imaging combined with surface-enhanced Raman analysis
to conduct in vivo tumor resection surgeries as successfully demonstrated in
living mice.12
Figure 1. Schematic of various developing methods and applications in the field of nanotechnology theranostics. Adapted from reference 1.
Several groups have demonstrated the widespread applicability of SERS to
problems in chemical and biological sensing.13-20 For example, recent reviews

39
have explored SERS utility for diagnostics at the molecular level in
biological21,22 and environmental23 assays.
Emerging biosensing techniques for mapping pH in cellular
environments are complicated by the complex molecular matrix within cells.
Tumor microenvironments are a topic of interest for many researchers because
of the effects of changing local environments such as lowering of pH and
increased temperature, which increase the spread of cancer cells.24
Fluorescent dyes have been utilized to probe the pH of these complex
environments but face further challenges due to the lack of photostability.
Fluorescent dyes as molecular pH probes have been explored in several
studies.25-29 However, there is still a need for a method to probe pH in complex
microenvironments with high sensitivity, selectivity and increased spatial
resolution.
Surface-enhanced Raman spectroscopy is applied to address the
issues faced by fluorescent pH probes. The SERS technique has an
enhancement capability upwards of 10 orders of magnitude in a resonant
system revealing characteristic chemical fingerprints of the analyte dye in
condensed-phase experiments.30 Bishnoi and coworkers used gold
nanoparticles (AuNPs) to serve as optical pH sensors consisting Au nanoshell
spheres and an adsorbed monolayer of para-mercaptobenzoic acid (pMBA).16
However, this requires the use of additional steps to form the adsorbed pMBA

40
monolayer, which also shortens the shelf-life of the colloidal suspension due to
increased aggregation and subsequent deactivation of the nanoparticles.
The purpose of the current study is to make a simple, stable, and
sensitive SERS pH probe. For this goal, we utilized a pH-sensitive dye that is
stable in an aqueous environment but did not require additional steps that
would hinder particle stability. We enlisted the synthetic expertise of the
Harbron group at William and Mary to supply the pH probe dye. Rhodamine
spirolactam (RSL) dyes are fluorescent pH probes and tunable to target specific
pKa values by substituting functional groups on the spirolactam ring, e.g. 2,6-
diisopropylaniline (RB-DIA) as shown in Figure 2. The functionalization of RSL
dyes makes RSLs robust pH reporters.
Figure 2. Rhodamine B-based spirolactam RSL dye for pH sensing.
As the proton concentration is increased in solution, the spirolactam ring opens
and becomes abundantly more SERS active due to the increase in conjugation
(Figure 2). In previous fluorescent pH probe work, the pKa has been calculated
based on sigmoidal curve fitting of fluorescence intensities as a response to
41
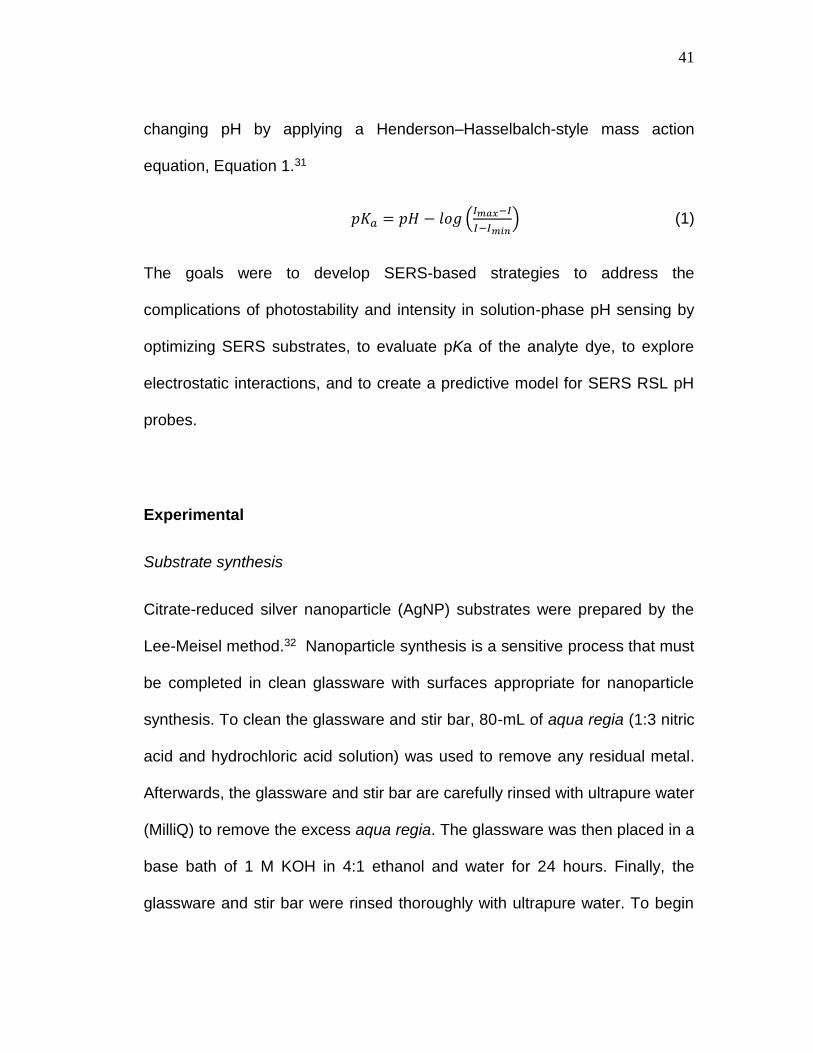
changing pH by applying a Henderson–Hasselbalch-style mass action
equation, Equation 1.31
𝑝𝐾𝑎 = 𝑝𝐻 − 𝑙𝑜𝑔 (𝐼𝑚𝑎𝑥−𝐼
𝐼−𝐼𝑚𝑖𝑛) (1)
The goals were to develop SERS-based strategies to address the
complications of photostability and intensity in solution-phase pH sensing by
optimizing SERS substrates, to evaluate pKa of the analyte dye, to explore
electrostatic interactions, and to create a predictive model for SERS RSL pH
probes.
Experimental
Substrate synthesis
Citrate-reduced silver nanoparticle (AgNP) substrates were prepared by the
Lee-Meisel method.32 Nanoparticle synthesis is a sensitive process that must
be completed in clean glassware with surfaces appropriate for nanoparticle
synthesis. To clean the glassware and stir bar, 80-mL of aqua regia (1:3 nitric
acid and hydrochloric acid solution) was used to remove any residual metal.
Afterwards, the glassware and stir bar are carefully rinsed with ultrapure water
(MilliQ) to remove the excess aqua regia. The glassware was then placed in a
base bath of 1 M KOH in 4:1 ethanol and water for 24 hours. Finally, the
glassware and stir bar were rinsed thoroughly with ultrapure water. To begin

42
the AgNP synthesis, a 1000-mL Erlenmeyer flask containing 500-mL dd-H2O
MilliQ was heated with stiring. In darkened lab conditions, approximately 92.2
mg silver nitrate (AgNO3) was added to heated water in the reaction vessel.
After reaching a vigorous boil, 10-mL of a 1% (w/v) sodium citrate solution was
added to the reaction vessel. After the characteristic color change from clear
and colorless to clear and yellow to turbid and green is observed, the reaction
vessel is heated for an additional 30 minutes or until approximately 275-mL of
solution remains. To assess the quality of the AgNP synthesis, SERS intensity
of the ~1400 cm-1 of the citrate capping agent was measured for wet 0.75-μL
droplets on glass coverslips.
SERS measurements
All SERS measurements were conducted with an inverted confocal microscope
(Nikon, TiU) with spectrograph (Princeton Instruments, SP2356, 600 g/mm
grating) using excitation at 632.8-nm from a HeNe laser source (Research
Electro-Optics). Each sample measurement was collected using WinSpec/32
software and an acquisition time of 30 seconds and 921 μW laser power at the
sample.

43
Concentration Dependence Studies
Samples were prepared in 1-mL glass vials containing between 1 and 10-μL
centrifuged (30 minutes, 13.4k rpm) AgNP. Two different concentration
dependence series were performed to determine the optimal relative AgNP
concentration for each synthesis: 1) citrate concentration dependence
experiment and 2) an analyte concentration dependence experiment. The
diluent for both experiments was ultrapure water. Each sample contained a final
volume of 500 μL. Rhodamine B (RB) was used as a preliminary model for RB-
DIA. For the RB concentration dependence experiments, 10-μL of the 10-4 M
RB solution was added to each vial. SERS intensities for citrate at ~1400 cm-1
and RB at ~1650 and ~625 cm-1 peaks were plotted at relative concentrations
to determine optimum relative concentration for each pH sensing experiment.
pH Sensing
RB-DIA dye solid (closed form) was supplied by the Harbron research lab
(William & Mary, Chemistry Department). Due to the relative insolubility of RB-
DIA in water, the RB-DIA solution was prepared in 2:1 water:ethanol with a final
dye concentration of 1.67x10⁻³ M. Each sample was prepared in a 1-mL glass
vial containing 10-μL of RB-DIA working solution, 1 to 5-μL of AgNP (based on
concentration dependence experiment results) and MilliQ water up to a total
volume of 500-μL. Sulfuric acid (0.01 M) and sodium hydroxide (0.01 M) were

44
used to adjust solution pH (Oakton pH 2700 pH meter). A Boltzmann sigmoidal
fit was applied to the SERS intensity data in OriginPro 9.1 software.
Results and Discussion
Concentration Dependence Studies
The concentration dependence experiment was designed to address the
variation from synthesis-to-synthesis with our citrate-reduced silver
nanoparticles. Particle size, shape, and concentration can vary between
syntheses and each influence the scattering intensity. The concentration
dependence experiment was created to account for the concentration effects.
The purpose was to determine the optimum relative nanoparticle concentration
for a series of solution phase experiments. The concentration with the highest
SERS intensity relative to the baseline was designated as the optimum relative
concentration at neutral pH. For example, in one synthesis, the optimal AgNP
concentration was 1-μL in a total volume of 500-μL or 0.20% v/v because the
highest peak intensity is observed at this relative volume, as shown in Figure
3.

45
Figure 3. Concentration dependence experiment with RB showing maximum
peak intensities at 0.20% v/v. Trend lines added to visualize.
The optimal relative concentrations of AgNP ranged from 0.20% to 1.0% across
syntheses. This shows the variation between SERS intensity from batch-to-
batch and provides a method to compensate for that variation in solution phase
experiments.
pH Sensing
We conducted comparative investigations into SERS Intensity and pH effects
to develop a SERS pH probe. The SERS spectrum and pH of the neutral RB-
DIA/AgNP solution were collected prior to addition of acid or base. We adjusted
the pH of the sample solution from neutral to basic (pH ~10). We then

46
Figure 4. Overlaid spectra of the RB-DIA/AgNP pH probe response to
changing pH in solution.
decreased the pH in roughly whole pH unit increments to pH ~2-3. We followed
this pattern due to the observed AgNP deactivation once at acidic ranges (pH
4-3) causing the AgNP to crash out of solution.33 For every pH increment, the
SERS spectrum and pH of the RB-DIA/AgNP solution were collected. The
~1650 and ~620 cm-1 peak baseline-subtracted intensities for the RB-
DIA/AgNP solution were plotted according to pH of the solution to determine
the pH probe kinetics in solution as a metric for pH probe response (Figure 5),
including the calculation of the pKa from Equation 1. A Boltzmann sigmoidal fit

47
was applied to the pH SERS plot to define the parameters in calculating the
pKa, where A1 is the Imax and A2 is the Imin.
Figure 5. Boltzmann sigmoidal fitting to SERS pH data.
The calculated pKa was 5.8 ±0.1, which was within the standard error range of
the pKa calculated via fluorescence from the Harbron group (pKa 5.7 ±0.1).29
However, the reproducibility of results over several trials to assess the
predictive power of the model was difficult. When we evaluated the SERS
intensity by the Boltzmann model as a predictive model of pH (Figure 6), the
error was significant.

48
Figure 6. Evaluation of the predicted pH values by Boltzmann model
calculations to the actual experimental pH values.
Another significant complication was observed with the RB control experiment
yielding relatively the same pKa (5.7 ±0.8) as RB-DIA and similar SERS pH
plots, Figure 7. The literature pKa value for RB is 3.1.34 This revelation pointed
towards another phenomenon confounding the results.
49
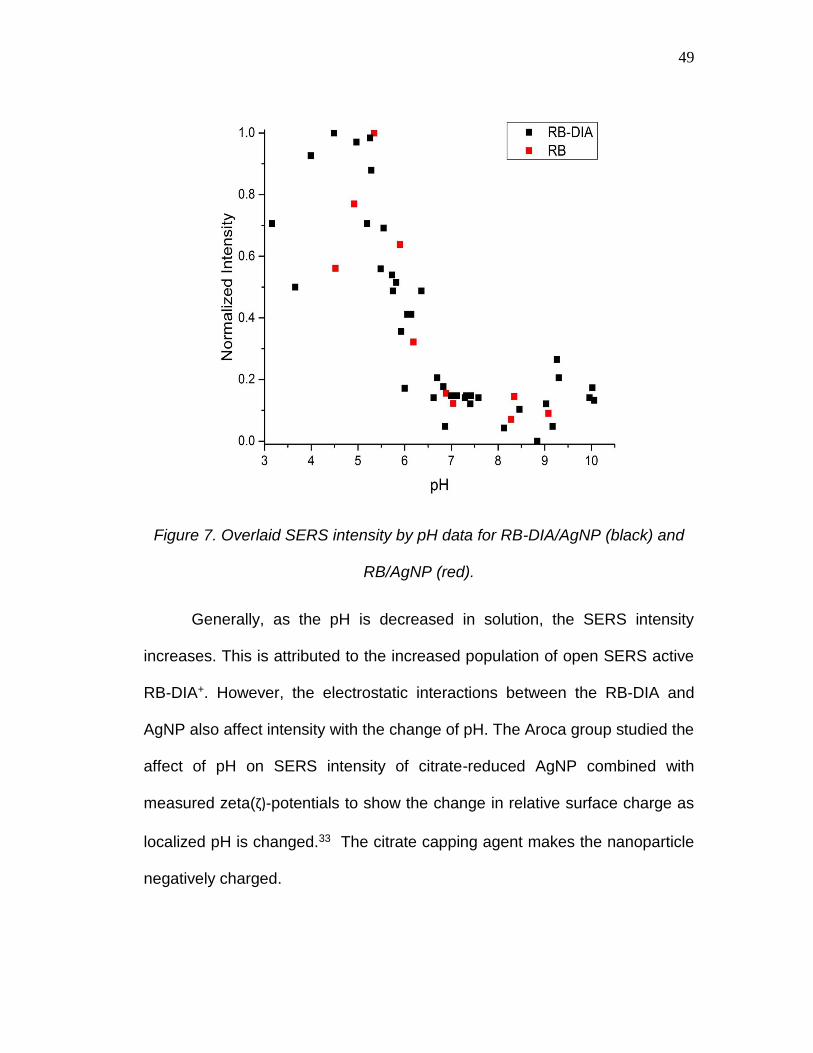
Figure 7. Overlaid SERS intensity by pH data for RB-DIA/AgNP (black) and
RB/AgNP (red).
Generally, as the pH is decreased in solution, the SERS intensity
increases. This is attributed to the increased population of open SERS active
RB-DIA+. However, the electrostatic interactions between the RB-DIA and
AgNP also affect intensity with the change of pH. The Aroca group studied the
affect of pH on SERS intensity of citrate-reduced AgNP combined with
measured zeta(ζ)-potentials to show the change in relative surface charge as
localized pH is changed.33 The citrate capping agent makes the nanoparticle
negatively charged.

50
Figure 8. Diagram of nanoparticle surface charges and potentials across the
electric double layer (EDL).
The ζ-potential is measured at the slipping plane (Figure 8) via dynamic light
scattering (DLS), which is used to elucidate the surface charge and the relative
particle stability in solution. 33 Understanding the surface charge provides
insight into analyte affinity towards the AgNP. The SERS intensity increases as
the RB-DIA+ concentration increase. However, RB is not undergoing the same
structural dynamic yet still offers a similar SERS response. The RB-DIA affinity
towards the nanoparticle should be investigated further to understand the
underlying mechanism affecting SERS intensity. RB has an overall positive
charge, which explains the similar electrostatic response to the AgNP as
observed with RB-DIA. However, the spatial dependence between dye and
substrate and surface charge effects on SERS intensity should be pursued by
dynamic light scattering (DLS) studies to address complications.

51
Conclusion and Future Work
At the beginning of this work, it was hypothesized that the analyte dye RB-DIA
would indicate pH sensitivity by reversible protonation/deprotonation. However,
electrostatics play a critical role in the pH-dependent SERS study. Though this
was not the intention at the onset, the observed SERS pH sensor response is
indicative of the electrostatic interactions at the nanoparticle surface and,
therefore, has the potential to be used to probe ζ-potential.
In future work, there are two different paths leading from this project.
The first pathway is further study of the electrostatic interactions between
AgNPs and analyte dyes to create an accurate method for characterizing the ζ-
potential. Additionally, this would assist in providing another metric for particle
stability in AgNP colloidal suspensions. Secondly, the electrostatic effects can
be blocked to examine the protonation/deprotonation of RB-DIA. RB-DIA can
be covalently attached by thiolation to the nanoparticle surface to act as a
molecular tether to circumvent electrostatic complications. Preliminary results
show that thiol attachment without the analyte dye does not produce a change
in SERS intensity as a function of pH, Figure 9.
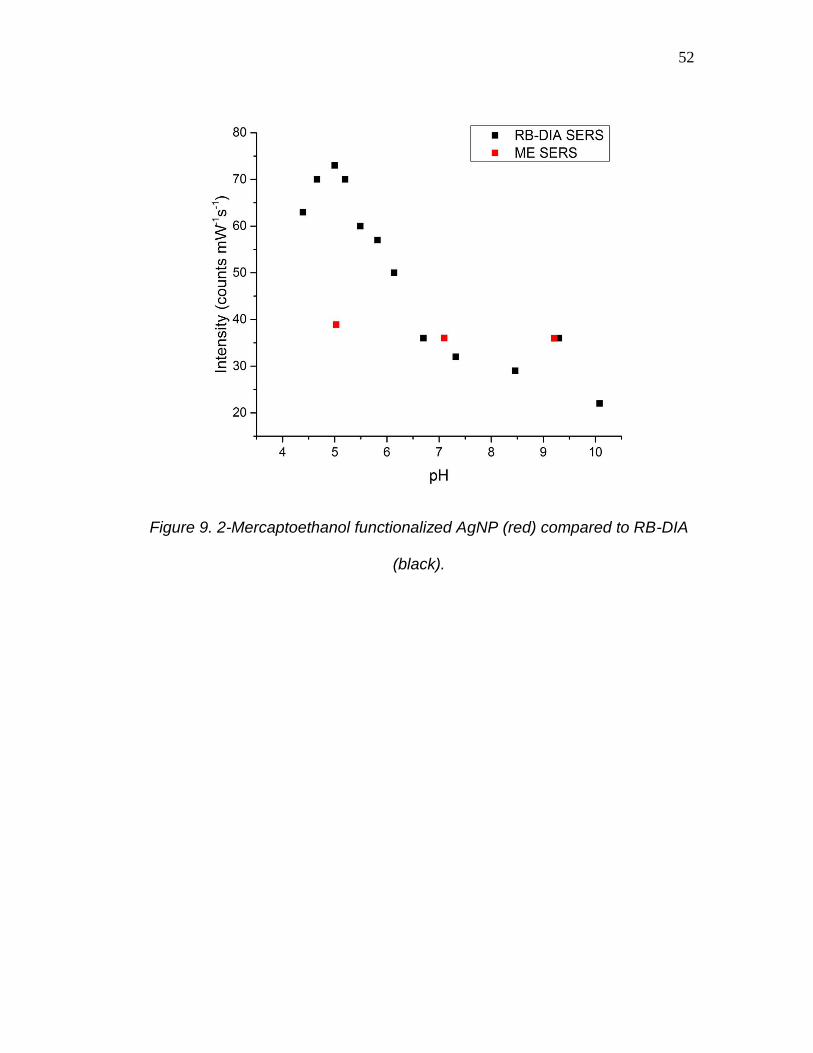
52
Figure 9. 2-Mercaptoethanol functionalized AgNP (red) compared to RB-DIA
(black).

53
References
1. João Conde; João Rosa; João C. Lima; Pedro V. Baptista Nanophotonics for Molecular Diagnostics and Therapy Applications. Int. J. Photoenergy 2012, 2012, 1-11.
2. Chanda Ranjit Yonzon; Christy L Haynes; Xiaoyu Zhang; Joseph T Walsh Jr; Richard P Van Duyne A glucose biosensor based on surface-enhanced Raman scattering: Improved partition layer, temporal stability, reversibility, and resistance to serum protein interference. Analytical Chemistry 2004, 76, 78-85.
3. Rodríguez-Lorenzo, L.; Alvarez-Puebla, R. A.; Pastoriza-Santos, I.; Mazzucco, S.; Stéphan, O.; Kociak, M.; Liz-Marzán, L. M.; García de Abajo, F Javier Zeptomol detection through controlled ultrasensitive surface-enhanced Raman scattering. Journal of the American Chemical Society 2009, 131, 4616.
4. Stuart, D. A.; Yuen, J. M.; Shah, N.; Lyandres, O. In Vivo Glucose Measurement by Surface-Enhanced Raman Spectroscopy. Analytical Chemistry 2006, 78, 7211-7215.
5. Ma, K.; Yuen, J. M.; Shah, N. C.; Walsh Jr., J. T.; Glucksberg, M. R.; Van Duyne, R. P. In Vivo, Transcutaneous Glucose Sensing Using Surface-Enhanced Spatially Offset Raman Spectroscopy: Multiple Rats, Improved Hypoglycemic Accuracy, Low Incident Power, and Continuous Monitoring for Greater than 17 Days. Anal. Chem. 2011, 83, 9146.
6. Barhoumi, A.; Zhang, D.; Tam, F.; Halas, N. J. Surface-enhanced Raman spectroscopy of DNA. Journal of the American Chemical Society 2008, 130, 5523-5529.
7. Cho, H.; Lee, B.; Liu, G. L.; Agarwal, A.; Lee, L. P. Label-free and highly sensitive biomolecular detection using SERS and electrokinetic preconcentration. Lab on a chip 2009, 9, 3360.
8. Papadopoulou, E.; Bell, S. E. J. Label-Free Detection of Single-Base Mismatches in DNA by Surface-Enhanced Raman Spectroscopy. Angewandte Chemie 2011, 123, 9224-9227.
9. Chen, Y.; Chen, G.; Feng, S.; Pan, J.; Zheng, X.; Su, Y.; Chen, Y.; Huang, Z.; Lin, X.; Lan, F.; Chen, R.; Zeng, H. Label-free serum ribonucleic acid analysis for colorectal cancer detection by surface-enhanced Raman spectroscopy and multivariate analysis. Journal of Biomedical Optics 2012, 17, 067003.
10. Kwangsu Ock; Won Il Jeon; Erdene Ochir Ganbold; Mira Kim; Jinho Park; Ji Hye Seo; Keunchang Cho; Sang-Woo Joo; So Yeong Lee Real-Time Monitoring of Glutathione-Triggered Thiopurine Anticancer Drug Release in Live Cells Investigated by Surface-Enhanced Raman Scattering. Analytical Chemistry 2012, 84, 2172.
11. Kang, B.; Afifi, M. M.; Austin, L. A.; El-Sayed, M. A. Exploiting the nanoparticle plasmon effect: observing drug delivery dynamics in single

54
cells via Raman/fluorescence imaging spectroscopy. ACS nano 2013, 7, 7420.
12. Kircher, M. F.; De La Zerda, A.; Jokerst, J. V.; Zavaleta, C. L.; Kempen, P. J.; Mittra, E.; Pitter, K.; Huangm, R.; Campos, C.; Habte, F.; Sinclair, R.; Brennan, C. W.; Mellinghoff, I. K.; Holland, E. C.; Gambhir, S. S. A brain tumor molecular imaging strategy using a new triple-modality MRI-photoacoustic-Raman nanoparticle. Nat. Med. 2012, 18, 829-834.
13. Zaleski, S.; Cardinal, M. F.; Chulhai, D. V.; Wilson, A. J.; Willets, K. A.; Jensen, L.; Van Duyne, R.,P. Toward Monitoring Electrochemical Reactions with Dual-Wavelength SERS: Characterization of Rhodamine 6G (R6G) Neutral Radical Species and Covalent Tethering of R6G to Silver Nanoparticles. J. Phys. Chem. 2016, 120, 24982-24991.
14. Kneipp, J.; Kneipp, H.; Wittig, B.; Kneipp, K. Following the Dynamics of pH in Endosomes of Live Cells with SERS Nanosensors. J. Phys. Chem. 2010, 114, 7421-7426.
15. Kneipp, J.; Kneipp, H.; Wittig, B.; Kneipp, K. One- and two-photon excited optical ph probing for cells using surface-enhanced Raman and hyper-Raman nanosensors. Nano Lett. 2007, 7, 2819-2823.
16. Bishnoi, S. W.; Rozell, C. J.; Levin, C. S.; Gheith, M. K.; Johnson, B. R.; Johnson, D. H.; Halas, N. J. All-optical nanoscale pH meter. Nano Lett. 2006, 6, 1687-1692.
17. Graham, D.; Faulds, K.; Smith, W. E. Biosensing using silver nanoparticles and surface enhanced resonance Raman scattering. Chem. Commun. 2006, 4363-4371.
18. Taylor, J.; Huefner, A.; Li, L.; Wingfield, J.; Mahajan, S. Nanoparticles and intracellular applications of surface-enhanced Raman spectroscopy. Analyst 2016, 141, 5037-5055.
19. Piotrowski, P.; Wrzosek, B.; Królikowska, A.; Bukowska, J. A SERS-based pH sensor utilizing 3-amino-5-mercapto-1,2,4-triazole functionalized Ag nanoparticles. Analyst 2014, 139, 1101-1111.
20. Ngo, H. T.; Wang, H.; Fales, A. M.; Vo-Dinh, T. Plasmonic SERS biosensing nanochips for DNA detection. Anal. Bioanal. Chem. 2016, 408, 1773-1781.
21. Howes, P. D.; Chandrawati, R.; Stevens, M. M. Bionanotechnology. Colloidal nanoparticles as advanced biological sensors. Science (New York, N.Y.) 2014, 346, 1247390.
22. Howes, P.; Rana, S.; Stevens, M. Plasmonic nanomaterials for biodiagnostics. Chem. Soc. Rev. 2014, 43, 3835-3853.
23. Wei, H.; Hossein Abtahi, S. M.; Vikesland, P. J. Plasmonic colorimetric and SERS sensors for environmental analysis. Environ. Sci.: Nano 2015, 2, 12-135.
24. Sikkandhar, M. G.; Nedumaran, A. M.; Ravichandar, R.; Singh, S.; Santhakumar, I.; Goh, Z. C.; Mishra, S.; Archunan, G.; Gulyas, B.;

55
Padmanabhan, P. Theranostic Probes for Targeting Tumor Microenvironment: An Overview. Int. J. Mol. Sci. 2017, 18, 1036.
25. Chen, J.; Chen, C.; Chang, C. A fluorescent pH probe for acidic organelles in living cells. Org. Biomol. Chem. 2017, 15, 7936-7943.
26. Nakata, E.; Yukimachi, Y.; Kariyazono, H.; Im, S.; Abe, C.; Uto, Y.; Maezawa, H.; Hashimoto, T.; Okamoto, Y.; Hori, H. Design of a bioreductively-activated fluorescent pH probe for tumor hypoxia imaging. Bioorganic & Medicinal Chemistry 2009, 17, 6952-6958.
27. Song, P.; Chen, X.; Xiang, Y.; Huang, L.; Zhou, Z.; Wei, R.; Tong, A. A ratiometric fluorescent pH probe based on aggregation-induced emission enhancement and its application in live-cell imaging. Journal of Materials Chemistry 2011, 21, 13470.
28. Schulte, A.; Lorenzen, I.; Böttcher, M.; Plieth, C. A novel fluorescent pH probe for expression in plants. Plant methods 2006, 2, 7.
29. Czaplyski, W. L.; Purnell, G. E.; Roberts, C. A.; Allred, R. M.; Harbron, E. J. Substituent effects on the turn-on kinetics of rhodamine-based fluorescent pH probes. Org. Biomol. Chem. 2014, 12, 526-533.
30. Stiles, P. L.; Dieringer, J. A.; Shah, N. C.; Van Duyne, R. P. Surface-Enhanced Raman Spectroscopy. Annu. Rev. Anal. Chem. 2008, 1, 601-626.
31. Liu, L.; Guo, P.; Chai, L.; Shi, Q.; Xu, B.; Yuan, J.; Wang, X.; Shi, X.; Zhang, W. Fluorescent and colorimetric detection of pH by a rhodamine-based probe. Sensors and Actuators B: Chemical 2014, 194, 498-502.
32. Lee, P. C.; Meisel, D. Adsorption and surface-enhanced Raman of dyes on silver and gold sols. J. Phys. Chem. 1982, 3391-3395.
33. Alvarez-Puebla, R. A.; Arceo, E.; Goulet, P. J. G.; Garrido, J. J.; Aroca, R. F. Role of nanoparticle surface charge in surface-enhanced Raman scattering. J. Phys. Chem. B 2005, 109, 3787-3792.
34. Lopez Arbeloa, F.; Lopez Arbeloa, T.; Tapia Estevez, M. J.; Lopez Arbeloa, I. Photophysics of rhodamines: molecular structure and solvent effects. J. Phys. Chem. 1991, 95, 2203-2208.