Embed Size (px)
Citation preview

HAL Id: hal-01476943https://hal-amu.archives-ouvertes.fr/hal-01476943
Submitted on 26 Feb 2017
HAL is a multi-disciplinary open accessarchive for the deposit and dissemination of sci-entific research documents, whether they are pub-lished or not. The documents may come fromteaching and research institutions in France orabroad, or from public or private research centers.
L’archive ouverte pluridisciplinaire HAL, estdestinée au dépôt et à la diffusion de documentsscientifiques de niveau recherche, publiés ou non,émanant des établissements d’enseignement et derecherche français ou étrangers, des laboratoirespublics ou privés.
Surface excess amounts in high-pressure gas adsorption:Issues and benefits
Jean Rouquerol, Françoise Rouquerol, Phillip Llewellyn, Renaud Denoyel
To cite this version:Jean Rouquerol, Françoise Rouquerol, Phillip Llewellyn, Renaud Denoyel. Surface excess amountsin high-pressure gas adsorption: Issues and benefits. Colloids and Surfaces A: Physicochemical andEngineering Aspects, Elsevier, 2016, 496, pp.3 - 12. �10.1016/j.colsurfa.2015.10.045�. �hal-01476943�

1
Surface excess amounts in high-pressure gas adsorption:
issues and benefits (2015-09-28 version)
Jean Rouquerol*, Françoise Rouquerol, Phillip Llewellyn and Renaud Denoyel
Aix Marseille Université, CNRS, MADIREL (UMR 7246), 13397 Marseille, France
*Corresponding author. Tel : +33-491-881417 Fax : +33-491-882511 e-mail address : [email protected]
Abstract
This paper introduces a calculation procedure aimed at improving the accuracy and
meaningfulness of high-pressure gas adsorption data obtained by either adsorption manometry
or gravimetry. The procedure is based on the Gibbs model and avoids the usual simplifying
assumption that the well-defined Gibbs Dividing Surface (the GDS) coincides with the ill-
defined adsorptive-accessible surface of the microporous adsorbent. Instead, it makes a clear
distinction between the two surfaces and introduces the concept of “Gibbs exclusion volume”
(i.e. the volume enclosed by the GDS) which is shown to be central in the calculation of the
surface excess amount and useful to avoid any confusion with the adsorbent volume. It is
shown, in the case of methane adsorption on gas shale, how this procedure avoids introducing
the uncertainty due to the dead volume determination in an inter-laboratory comparison. The
conditions for a surface excess isotherm to be a useful intermediate step in the assessment of
the amount adsorbed are stressed and illustrated.
Keywords: Gibbs adsorption model; Gibbs exclusion volume; Amount adsorbed; Surface
excess amount; Dead space; Buoyancy correction;
1 Introduction
It is commonly accepted that both manometric and gravimetric adsorption experiments
directly lead to surface excess amounts. At the same time, it is considered that the amount
adsorbed is the quantity needed all at once for practical applications of adsorption
(determination of adsorptive capacity, BET area, pore-size distribution…) and for its
understanding (comparison of adsorption equations between themselves or of experimental
data with those assessed by simulation and modeling) [1-3].
Hence two opposite viewpoints found in the literature. Some are advocating for a
systematic presentation of adsorption isotherms in the form of surface excess amounts, even
proposing a new classification of isotherms (Donohue and Aranovitch [4]), different from the
generally accepted IUPAC classification of isotherms for vapor adsorption (Thommes et al.,
[5]). The latter isotherms are indeed plotted in amounts adsorbed, i.e. in what is considered to
be their final useful form. Going further in the same direction, some authors even raise strong
reservations about the use of surface excess amounts in the case of gas adsorption by
microporous adsorbents (Serpinskii and Yakubov [6], Tolmachev [7], and, most recently,
Myers and Monson [8] in the scope of a detailed thermodynamic treatment).
This is why the two questions we wish to answer in this paper are (i) is the surface
excess presentation of gas adsorption data still useful to address the issues found in the
determination of the amount adsorbed by microporous solids under high pressure and (ii) if
yes, under what conditions.

2
2 Issues found in the determination of the amount adsorbed under high
pressure
2.1 Part of the dead volume in the calculation
The issues we shall consider are mainly found with adsorbents containing micropores
(i.e. less than 2 nm wide), which are precisely those of interest in high-pressure adsorption
processes. Although our reasoning will be first carried out in the scope of adsorption
manometry, we shall see, in a final section, how to extend it to adsorption gravimetry, much
used in the high-pressure range.
In gas adsorption, the amount adsorbed is defined as the content of the adsorption
space, the latter including all places where the concentration of the adsorptive is higher than
in the bulk of the surrounding gas phase [5]. Incidentally, since we shall stick to this precise
definition of the amount adsorbed, we shall not need using clarifying terms like “absolute
amount adsorbed” [9] or “total amount adsorbed” [10].
For adsorption of a single gas monitored by adsorption manometry, the calculation of the
amount adsorbed na is apparently most simply carried out after:
na = n - cg V g
i (1)
where n is the total amount of gas enclosed in the system and cg the final gas concentration in
the “dead space” available to adsorptive “i” in its gas phase. This dead space has a volume V g
i
(the “dead volume”). For the sake of clarity we shall only mention the “dead space” and its
“dead volume” for application of equation (1). Also, for an easier understanding, the
definitions of the symbols used in this paper are listed at the end.
Unfortunately, the dead volume is not that easy to determine accurately, so that it is
currently considered to be the major source of uncertainty in the calculation of the amount
adsorbed [11, 5]. Hence the few comments hereafter.
2.2 Definition of the dead volume
The dead volume V g
i we need in equation (1) to calculate any point of the adsorbed amount
isotherm is the volume available to the gas phase, up to the outer limit of the adsorption
space:
V g
i = V – ( VSi + Va
i) (2)
where V is the sum of the volume of the empty adsorption bulb + the dosing volume up to the
membrane of the pressure transducer, VSi is the adsorbent volume inaccessible to the
molecules of adsorptive “i” and Vai is the volume of the adsorption space for adsorptive “i”,
i.e. the adsorbate volume. Subscript “i” in V g
i stresses that the dead volume may depend on
the adsorptive.

3
2.3 Change of the dead volume as adsorption proceeds
The adsorbate volume Vai logically changes as adsorption proceeds, what has a direct effect
on the dead volume, as illustrated in Figures 1-a (corresponding to the onset of adsorption,
when the adsorbate volume is minimum and the dead volume maximum) and 1-b (where the
adsorption space is larger).
2.4 Assessment of the dead volume when the adsorbent is microporous
The usual way for assessing the dead volume is based on expansion of a gas assumed not to
adsorb in the conditions chosen for the measurement. Helium is commonly used, though it is
well known that helium is prone to adsorption in micropores, then leading to a larger apparent
dead volume than expected [12-19], an effect which can be minimized by increasing the
measurement temperature [20, 21] and which can be taken into account by appropriate
procedures [22, 17, 23]. Nevertheless, even then, and even in the absence of any adsorption,
the small size of the helium molecule may allow assessing a larger volume than that available
to the adsorptive molecule, as represented in Figure 3-a. In the opposite, it was also suggested
not to reject the possibility that helium, being more inert than many adsorptives, could finally
assess a smaller volume [19]. These last shortcomings could in principle be avoided by using
expansion of the adsorptive itself, at a temperature where adsorption is expected not to occur,
but, usually, this condition is even more difficult to fulfil than with helium when the
adsorbent is microporous. It is only in simulation studies that the dead volume can be
correctly calculated, but attention must then be paid to the definition of the volume inside the
pores: it can be either the volume limited by a surface passing through the center of the
surface atoms of the adsorbent [20], or the volume that is accessible to the center of the
adsorbed molecules [24-26], therefore limited by an “r-distance surface” or, still, the volume
limited by the “probe-accessible” surface [5], also known as the “Connolly surface” when the
probe is spherical ( i.e. the surface drawn by the bottom of a spherical molecule rolling over
the van der Waals surface of the adsorbent). The latter probe-accessible volume is the closest
to the volume expected to be assessed by a “good experiment” of gas expansion and is the
dead volume we are referring to in equation (2).
Figure 1 - Change of dead volume between (a) onset of adsorption and (b) complete micropore filling, as the
volume of the adsorption space (made up, of the spherical molecules of adsorbate) increases

4
It may also make sense of simply using the “skeletal” density of the adsorbent, either
calculated from structural data (in case of crystalline adsorbents) or measured on a non-porous
material of similar composition and state. For microporous materials, the “void volume” then
assessed (see Figure 2-b) tends to be larger than the dead volume which is looked for (see
Figure 2-a).
We should therefore conclude that, in the case of microporous adsorbents, the
evaluation of the dead volume required to derive the amount adsorbed with help of equation
(1) is not a simple matter and opens the way to personal appreciation and assumptions.
This uncertainty in the dead volume logically results in an uncertainty in the amount
adsorbed. Although this uncertainty has been continuously – and reasonably - considered as
usually negligible for adsorption of vapors below 1 bar, this is not any more the case for high-
pressure adsorption, as well recognized by the scientists in this field and illustrated in section
4. Fortunately, if we wish to keep the experimental adsorption data with their original
accuracy, without spoiling them by any uncertain value for the dead volume, we can draw
benefit from the Gibbs model in the way developed hereafter.
3 The Gibbs model: representation and requirements
“For the precise measurement of the quantities” Gibbs devised a representation whose
principle, when applied to adsorption, can be summarized as follows:
- Imagine a “geometrical surface”, close to the adsorbing surface, with “a precisely
determined position” and which will “be called the Dividing Surface” (Gibbs [27])
(we call it now the “Gibbs Dividing Surface” (GDS))
- Assume that adsorption takes place on that GDS
Figure 2 - Volumes assessed (a) by expansion of helium or gas « i » and (b) from skeletal density of adsorbent

5
- Also assume, for the sake of a simplified calculation, that the volume V a of the
adsorption space (i.e. the space in which the concentration of the adsorptive is higher
than in the surrounding gas phase) is continuously equal to zero.
- Then call the resulting quantity, i.e. the virtual amount located on the GDS, a “surface
excess amount”
Two types of schemes may help appreciating the meaning and also the relativeness of this
concept of surface excess amount.
In a first instance we can represent the adsorption system as totally enclosed in a container of
volume V as shown in Figure 3-a. This volume V is equivalent to the volume of the empty
adsorption bulb + the dosing volume of Figure 1.
.
Figure 4-a stresses the uncertainties found in the description of a real system with adsorptive
“i”: uncertainties (i) in the dead volume V g
i available to “i”, (ii) in the adsorbent volume V S
i
inaccessible to “i” and (iii) in the adsorbate volume Vai .
Fig 3-b shows the same system, but now in the scope of the Gibbs representation: the
adsorbate volume VaGibbs is assumed to be zero, whereas a well-defined GDS (here, a closed
surface, whose location is selected by the experimenter) separates the well-defined outer
volume of the gas phase from a well-defined inner volume VGDS. Given that this inner volume
plays an essential part in the calculation of the surface excess amount n (see equation (3)) it
is convenient to give it a name; we shall call it hereafter the “Gibbs exclusion volume” since,
by definition and for the sake of the calculation of n, it is assumed to be inaccessible to the
adsorptive, with the symbol VGDS since it is the volume surrounded by the GDS. Now, all
volumes are well-defined and so is the resulting surface excess amount n which is easily
obtained as:
n = n – cg (V –VGDS) (3)
where n is the total amount of adsorptive introduced in the system and cg the final
experimental concentration of the gas phase. It can be seen, after this equation, that the choice
of the GDS location by the experimenter simplifies into the mere choice of a value for VGDS.
We may also notice, from equation (3), that the calculation of the surface excess amount can
in reality be carried out, with unchanged accuracy, whatever the value of the “Gibbs exclusion
volume” VGDS, i.e. whatever the position of the GDS. Since our sole objective is here to use
Figure 3 - Adsorption system (a) real and (b) idealized by Gibbs

6
the surface excess amount as an intermediate step in view of assessing a meaningful amount
adsorbed, we propose to simply drop the original Gibbs constraint of a GDS “in or very near
to the surface of discontinuity”. In this way, we also drop the corresponding need of
accurately determining the adsorbent volume VSi before evaluating any surface excess
amount. Since the evaluation of V S
i is delicate and is a source of inaccuracy with microporous
adsorbents, we can then avoid spoiling the reported experimental data. In other words, we do
not need any more to focus on the validity of the VSi determination but simply on the choice
of a well-defined value for VGDS. Doing that, we believe we are keeping Gibbs spirit when he
writes “We are therefore at liberty to choose such a position for the dividing surface as may
for any purpose be convenient “ [27]. Since there are as many values of n as possible values
of VGDS, the surface excess amount n should always be provided together with the value of
VGDS chosen by the experimenter. Incidentally, this recommendation is also valid when, after
the traditional viewpoint, the GDS is assumed to coincide with the adsorbing surface,
especially when microporous: in reality, without the knowledge of the VGDS chosen for its
calculation, any surface excess amount is of limited value. With our proposal, the VGDS can
also be chosen for instance much larger than the volume of the adsorbent (which will result in
a much larger n), or smaller, which will result in a smaller n, even negative in some cases
(which can explain the negative values sometimes reported [28, 15]) what would not affect
the accuracy of the data reporting. The VGDS can even be chosen equal to zero, as proposed by
Gumma and Talu [29], the corresponding n then being called the “net adsorption”.
The part of the “Gibbs exclusion volume” in the calculation of the surface excess amount n
has not attracted the attention until now, since it is traditionally assumed that the GDS exactly
coincides with the actual probe-accessible surface. This is in line with Gibbs proposal –for the
case of plane or moderately curved surfaces – to locate the imaginary GDS “in or very near to
the surface of discontinuity” (although we should recognize that this is a condition much
difficult to fulfill in the presence of a real microporous adsorbent for which the volume
inaccessible to the adsorptive is uneasy to determine accurately). Hence a simplified
representation of the Gibbs model (e.g. [30, 31]), where the adsorptive concentration c is
plotted vs. the distance z from the surface (cf Figure 4) and which only takes into account the
Gibbs assumption that the volume of the adsorption space (i.e. the adsorbate volume or, still,
the thickness of the adsorbed layer) is taken equal to zero. This representation is satisfactory
for vapor adsorption below 1 bar: for instance, with help of equation (4), one can check that
the difference between VGDS and VSi can be as high as VS
i itself (assuming a standard specific
volume vSi of 0.5 cm3g-1) without introducing in the (N2) BET area an error higher than 1m2g-
1. This is not any more the case for high-pressure, supercritical, adsorption, where the
resulting errors are easily increased by two orders of magnitude. Hence the need to introduce
a representation showing the GDS as a precisely defined, geometrical surface, necessarily
distinct from any ill-defined physical surface like the surface of a microporous adsorbent. To
stress this distinction, Talu [32] calls the GDS a “hyper-surface”.

7
Figure 5 introduces this assumption, showing that the geometrically well-defined GDS,
symbolized by a straight line, cannot coincide with the more complex shape of the adsorptive-
accessible surface of the adsorbent. Figure 5-b tells us that, with this position of the GDS, n
= na - nC , where nC (corresponding to rectangle C) is the portion of the amount adsorbed
which is counted as a gas, after the Gibbs representation, and which makes the difference
between n and na.
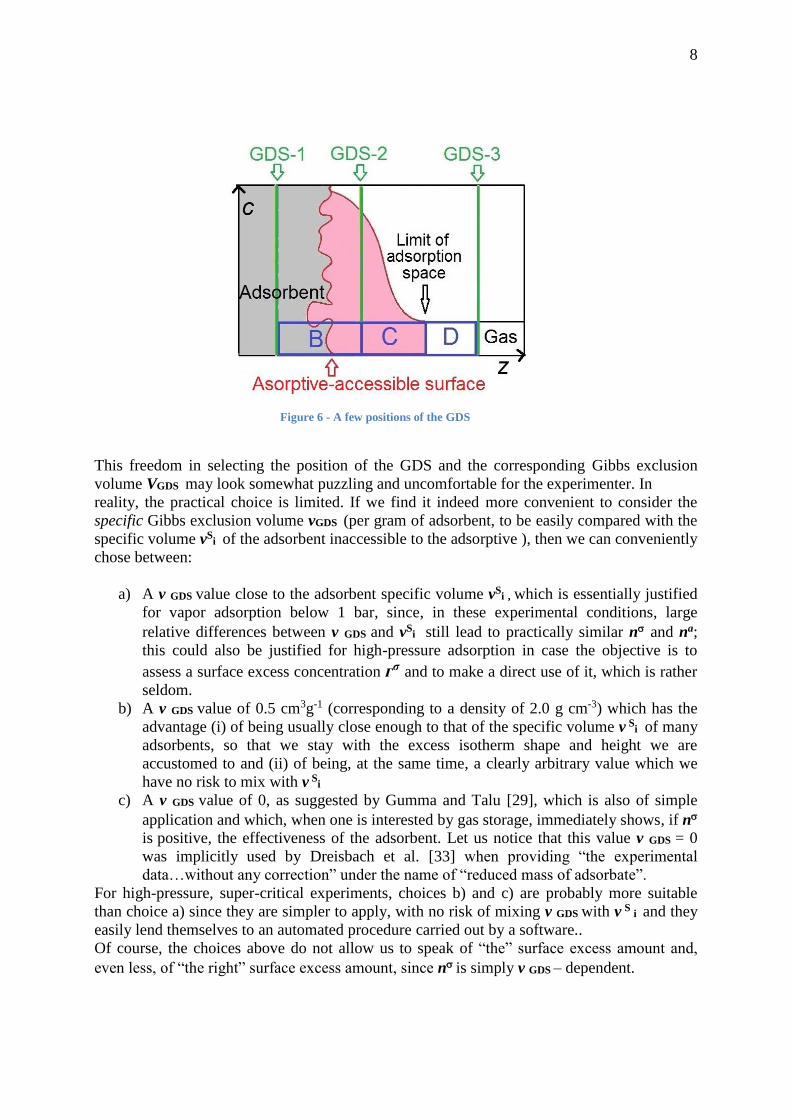
To each arbitrary position of the GDS (and of the Gibbs exclusion volume) corresponds a
different value of the surface excess amount n, as illustrated by Figure 6. If nB, nC and nD
stand for the amounts of gas represented by rectangles B, C and D, respectively, we can write:
n = na - nC - nB for GDS-1
n = na - nC for GDS-2
n = na + nD for GDS-3
Figure 4 - Simplified representation of the Gibbs model giving adsorptive concentration c vs. distance z from
adsorbent surface: (a) The real system - (b) Representation of the surface excess amount in case the GDS is assumed to
coincide with the adsorptive-accessible surface of the adsorbent
Figure 5 - General representation of the Gibbs model for adsorption on microporous adsorbents. (a) The real system -
(b) The Gibbs representation with a GDS distinct from the adsorptive-accessible surface
8
This freedom in selecting the position of the GDS and the corresponding Gibbs exclusion
volume VGDS may look somewhat puzzling and uncomfortable for the experimenter. In
reality, the practical choice is limited. If we find it indeed more convenient to consider the
specific Gibbs exclusion volume vGDS (per gram of adsorbent, to be easily compared with the
specific volume vSi of the adsorbent inaccessible to the adsorptive ), then we can conveniently
chose between:
a) A v GDS value close to the adsorbent specific volume vSi , which is essentially justified
for vapor adsorption below 1 bar, since, in these experimental conditions, large
relative differences between v GDS and vSi still lead to practically similar n and na;
this could also be justified for high-pressure adsorption in case the objective is to
assess a surface excess concentration ᴦσ and to make a direct use of it, which is rather
seldom.
b) A v GDS value of 0.5 cm3g-1 (corresponding to a density of 2.0 g cm-3) which has the
advantage (i) of being usually close enough to that of the specific volume v S
i of many
adsorbents, so that we stay with the excess isotherm shape and height we are
accustomed to and (ii) of being, at the same time, a clearly arbitrary value which we
have no risk to mix with v S
i
c) A v GDS value of 0, as suggested by Gumma and Talu [29], which is also of simple
application and which, when one is interested by gas storage, immediately shows, if n
is positive, the effectiveness of the adsorbent. Let us notice that this value v GDS = 0
was implicitly used by Dreisbach et al. [33] when providing “the experimental
data…without any correction” under the name of “reduced mass of adsorbate”.
For high-pressure, super-critical experiments, choices b) and c) are probably more suitable
than choice a) since they are simpler to apply, with no risk of mixing v GDS with v S
i and they
easily lend themselves to an automated procedure carried out by a software..
Of course, the choices above do not allow us to speak of “the” surface excess amount and,
even less, of “the right” surface excess amount, since n is simply v GDS – dependent.
Figure 6 - A few positions of the GDS

9
It may be worth noticing that, in the field of adsorption at the liquid/solid interface, it has
been customary, for a long time, to consider positions of the GDS either coincident with the
adsorbing surface (e.g. [34]) or not, especially when making use of the concepts of relative or
reduced surface excess amount ([35, 30].
Let us finally notice that clearly separating the GDS from the probe-accessible surface, like in
Figure 5-b, may help reminding that the “precisely determined position” of the GDS (or,
better said, the exact value chosen for the Gibbs exclusion volume VGDS ) should always be
reported together with the surface excess amount n to make it meaningful. Conversely,
referring to Figure 6-b where the GDS is superimposed with the probe-accessible surface may
let think that the GDS location (and therefore the Gibbs exclusion volume) is to be
determined experimentally (which is not compulsory after our proposal) and is prone to the
errors related with the dead volume determination (which is not in the spirit of Gibbs views,
where the GDS is a “precisely defined…geometrical surface”). The risk is then to completely
lose a major interest of the Gibbs model, i.e. the preservation of the basic experimental
accuracy.
4 Assessing the amount adsorbed
As reminded in the introduction, the quantity needed both for practical applications of
adsorption (determination of surface area, of pore-size distribution…) and for its
understanding and interpretation (application of theories, comparison with simulation…) is
the amount adsorbed na, not the surface excess amount n which is usually assessed, in a first
step, from any adsorption manometry or gravimetry experiment. Passing from n to na
requires knowing the following data:
a/ The Gibbs exclusion volume VGDS used to calculate n. Most often, this volume is chosen
by the experimenter either from his experimental assessment of the dead volume by gas
expansion or from the density of the adsorbent (either skeletal density or density of the non-
porous material). It should be stressed that the uncertainties about the dead volume or the
adsorbent density have no effect on the accuracy of n provided the value used for VGDS is
known and stated.
b/ The gas law (ideal or real) also used in the calculation of n to derive the concentration in
the gas phase cg from the pressure p.
c/ The adsorbent volume VSi which is considered inaccessible to the adsorptive « i » used.
d/ The actual volume Vai of the adsorbate at any stage of the adsorption, i.e. the volume of the
adsorption space.
From the above data we can then derive na from n after :
na = n + cg Vai + cg (VS
i - VGDS ) (4)
(a) (b)
where term (a) corresponds to the assumption of zero adsorption volume in the Gibbs model
and term (b) takes into account the fact that the GDS does not coincide with the probe-
accessible surface of the adsorbent. When these two surfaces are assumed to coincide, like in
the simplified representation of Figure 6, equation (4) simplifies into the common form:
na = n + cg Vai (5)

10
In the case of sub-critical adsorption below 1 bar, term (a) in equation (4) is usually
considered small enough to be ignored in comparison with n [8]. If we consider for instance
the case of N2 adsorption at 77 K with a N2 adsorbate density of 0.8 g cm-3 (assumed to be
comparable to the density of the liquid) and a gas density of 5 mg cm-3 (at 77 K under 1 bar),
we see that term (a) accounts for 0.6% of n when the gas pressure is 1 bar, and only for
0.06% when the relative pressure is 0.1, i.e. in the mid of the usual BET range.
Whereas term (b), it can also be usually ignored, essentially, here again, because of the low
value of cg as compared with the concentration of the adsorbate and provided the difference
between the Gibbs exclusion volume VGDS and the actual adsorbent volume VSi inaccessible
to adsorptive “i” is of the same order of magnitude as the volume Vai of the adsorption space:
this is what the experimenter usually tries to do by choosing for VGDS the apparent VSi as
determined by helium expansion.
In the case of super-critical adsorption above 10 bar, the situation is quite different,
essentially because of the much smaller difference between the concentrations in the gas and
the adsorbed phase. Small errors on the estimation of the volumes of the adsorbent VS i and
the adsorption space Vai now have an appreciable influence on the calculated value of the
amount adsorbed n a.
Let us see for instance the effect of an uncertainty on the specific volume vai of the adsorption
space. Even when vai is assumed to be equal to the specific microporous volume, as
commonly done [2, 28, 36, 37, 38], an uncertainty of the order of 0.05 cm3 g-1 (or larger) can
easily result from an error in the microporous volume itself, either because the latter was
determined with a molecular probe (e.g. N2) different from the adsorptive or because, due to
the solid potential field, the actual density of the adsorbed probe is not homogeneous and
differs from the usually assumed density of the liquid: as well stressed by Talu [32], the pore
volume then assessed is not strictly speaking a property of the pure solid but a property of the
solid/probe gas system. Moreover, in case supercritical adsorption is considered to take place
after a mechanism of monolayer surface coverage [3], part of the volume of the wide
micropores (i.e. 0.7 to 2 nm wide [5]) does not contribute to vai once they are able to
accommodate more than two adsorbate molecules in width. The situation is still different in
the critical temperature region, where a multilayer was shown to take place under high
pressure [39, 40]. Furthermore, in case the adsorbent is not exclusively microporous (e.g. a
number of activated carbons), the actual adsorption space logically also includes a small part
Figure 7 - High-pressure argon surface excess isotherms for a 13 X zeolite (below) and an active carbon (above),
from Salem et al. [2].

11
of the mesoporous volume. At 100 bar, at room temperature, a 0.05 cm3 g-1 uncertainty on vai
leads to an uncertainty of 0.2 mmol on the amount adsorbed, i.e. between 4 and 12% of the
amount calculated from the surface excess isotherms shown in Figure 7 and taken as a
standard example. Hence the interest of any procedure allowing to improve the accuracy of vai
determination, as recently proposed by Phadungbut et al. [41], although still limited to
simulation in the case of a flat adsorbing surface.
Whereas the effect of an uncertainty about vSi , the specific volume inaccessible to the
adsorptive, it can be indirectly appreciated through the simulation carried out by Do et al. [25]
for high-pressure adsorption of argon on graphite at 298 K, simulated in a box whose volume
to area ratio is 400 times the collision diameter. Figure 8 gives the areal surface excess
amount isotherms, calculated with a Gibbs exclusion volume equal either to the correct
adsorbent volume (upper curve) or to an incorrect one, as resulting from erroneous dead
volumes with relative errors ranging from only 0.1% to 0.3%. A conversion into adsorbed
amount isotherms based on these same correct and incorrect adsorbent volumes would result
into an upward shift and a change in shape, the upper “correct” isotherm then approaching the
Langmuir shape and the other isotherms staying beneath, at a distance as large as that seen in
Figure 8.
A more direct examination of the effect of an uncertainty on vSi can be made thanks to a
recent inter-laboratory comparison of high-pressure methane adsorption on gas shales
(Gasparik et al. [42]). We should first stress that this work was carried out very carefully and
that it was quite demanding, given the small BET area of the microporous shales examined (8
m2g-1). We can therefore consider this work as an interesting reference which, nevertheless,
will show us the limits of the current, general, custom of referring to the simplified
representation of the Gibbs model shown in Figure 4-b and of dropping, consequently, term b
in equation (4). We see indeed in Figure 9 that the surface excess amounts n reported by the
seven participating laboratories differ, at 100 bar, from 0.06 to 0.13 mmol g-1, i.e. from more
than simple to double. Nevertheless, because the usual procedure was applied, each surface
excess isotherm was calculated with its own GDS, as “automatically” located by a helium
dead volume determination.
Figure 8 - Effect of dead volume uncertainties on data reported for
Ar-graphite system at 298 K, from Do et al. [25]
12
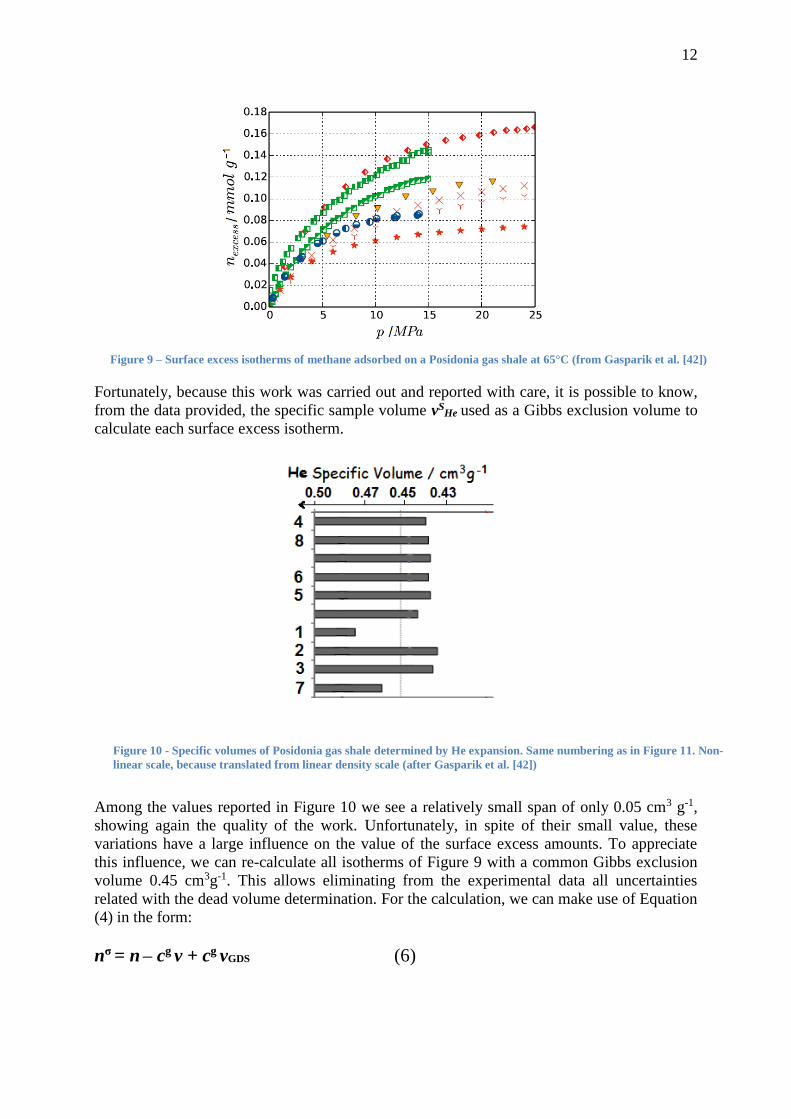
Fortunately, because this work was carried out and reported with care, it is possible to know,
from the data provided, the specific sample volume vSHe used as a Gibbs exclusion volume to
calculate each surface excess isotherm.
Among the values reported in Figure 10 we see a relatively small span of only 0.05 cm3 g-1,
showing again the quality of the work. Unfortunately, in spite of their small value, these
variations have a large influence on the value of the surface excess amounts. To appreciate
this influence, we can re-calculate all isotherms of Figure 9 with a common Gibbs exclusion
volume 0.45 cm3g-1. This allows eliminating from the experimental data all uncertainties
related with the dead volume determination. For the calculation, we can make use of Equation
(4) in the form:
nσ = n – cg v + cg vGDS (6)
Figure 9 – Surface excess isotherms of methane adsorbed on a Posidonia gas shale at 65°C (from Gasparik et al. [42])
Figure 10 - Specific volumes of Posidonia gas shale determined by He expansion. Same numbering as in Figure 11. Non-
linear scale, because translated from linear density scale (after Gasparik et al. [42])

13
which shows that a change ΔvGDS in the value chosen for the specific Gibbs exclusion volume
results in a change cg ΔvGDS of the specific surface excess amount nσ. Since we are
essentially looking for orders of magnitude we can determine the value of the adsorptive
concentration cg with help of the ideal gas law (with a real gas law, the concentration would
be somewhat higher, and so the change of nσ).
Figure 11. Influence of the specific Gibbs exclusion volume vGDS on the surface excess isotherms of CH4 on a Posidonia
gas shale at 65°C: (a) Each isotherm calculated with different vGDS, based on helium dead volume (after Gasparik et
al. [42]) (b) All isotherms calculated with same vGDS of 0.45 cm3 g-1. Symbols correspond to points used to build these
curves; experimental points are given in Figure 9.
For the sake of clarity, Figure 11-a simply reproduces the isotherms of Figure 9, with
adequate labelling. As we said, each of these surface excess isotherms was calculated with its
own value of the Gibbs exclusion volume which we can estimate, after the data of Figure 10,
to be close to 0.477, 0.437, 0.439, 0.442, 0.440, 0.441, 0.463, and 0.441 cm3 g-1 for isotherms
1 to 8, respectively. Figure 11-b gives, with the same labelling, the surface excess isotherms
calculated with a common specific Gibbs exclusion volume chosen equal to 0.45 cm3g-1. We
see that, most unfortunately, eliminating in Figure 11-b the uncertainties in the dead volume
determination does not reduces the span but, instead increases it: this simply shows that the
part of the other sources of uncertainty is larger than initially thought, especially for isotherms
1 and 7 which are well discriminated from the others by the procedure proposed. These
observations lead to the conclusion that (i) although small, the differences resulting from
different positions of the GDS (i.e. different values of the Gibbs exclusion volume) are a main
source of discrepancy (ii) it is possible to cancel them by simply providing all participating
laboratories with the same, conventional but well-defined Gibbs exclusion volume VGDS
which then allows calculating a “dead-volume free” surface excess amount n by means of
equations (3) or (10) and (iii) it then becomes possible to examine more directly the influence
of other sources of discrepancy like sampling, outgassing, calibration of pressure transducers,
temperature homogeneity and control etc…

14
5 Surface excess and adsorbed amounts in gravimetric experiments
In adsorption gravimetry, the weight increase due to adsorption is alleviated by the buoyancy,
proportional to the gas (or fluid) density gi, which, in case of a single-sided magnetic
suspension balance, acts over (i) all of its mobile parts in contact with the adsorptive (of
volume VB , including the sample pan) (ii) the adsorbent proper (of volume VS i , inaccessible
to adsorptive “i” ) and (iii) the adsorbed phase (of volume Vai normally depending on the
extent of adsorption) in close interaction with the adsorbent. Reasoning on the masses and
calling m the measured mass change, gi the simultaneous density change of the fluid
phase and ma the mass adsorbed, we get, for adsorption of a single gas “i” (neglecting, to
simplify, the change in Vai , in line with the assumption that it remains equal to the
microporous volume):
m = ma - gi (VB + VSi + Va
i)
and, introducing the adsorptive molar mass Mi to pass from ma to the amount adsorbed na :
na = m/Mi + gi (VB + VSi + Va
i) /Mi (7)
where, like in adsorption manometry, VSi and Va
i are not much easy to estimate with
accuracy. To assess the surface excess amount we should make use, by self-consistency, of
the same equation (4) as that used in adsorption manometry, under the form:
n = n a - cg Vai - cg (VS
i - VGDS ) (8)
where all symbols keep the same meaning as in adsorption manometry and where the Gibbs
exclusion volume VGDS is also to be arbitrarily chosen by the experimenter . Being in the
scope of gravimetry, we can replace the gas concentration cg by the ratio gi / Mi where gi is
the density of adsorptive « i » in the gas phase and Mi its molar mass:
n = n a – ( gi / Mi) Vai - ( gi / Mi) (VS
i - VGDS ) (9)
By introducing in the latter equation the expression of na given by equation (7) we finally get:
n = m/Mi + gi (VGDS + VB )/Mi
(10)
This expression of the surface excess amount has the same basic meaning as expression (3)
proposed for adsorption manometry, i.e.(i) it is independent from any assumption about VSi
and Vai , therefore keeping the full accuracy of the experiment, and (ii) to be meaningful, the
resulting surface excess amount n should be reported together with the value of VGDS used in
its calculation.
We can then draw the amount adsorbed from equation (9) which becomes:
n a = n + ( gi / Mi) Vai + ( gi / Mi) (VS
i - VGDS ) (11)

15
with, here again, like in adsorption manometry (see equation (4)) a term taking into account
the volume Vai of the adsorption space and another one, usually skipped, taking into account
the difference between the actual volume VS i of the adsorbent inaccessible to the adsorptive
and the Gibbs exclusion volume VGDS used in the calculation of n . Incidentally, let us
notice that, like in adsorption manometry, these two terms (due here to buoyancy) become
negligible for adsorption of vapors below 1 bar, so that, here again, na and n can then be
considered to be practically identical [43].
It could have been possible to directly calculate the amount adsorbed by inserting our
assumed values for Vai and VS
i in equation (7): by skipping the intermediate step of the
surface excess amount calculation we would then have lost the possibility of an accurate and
assumption-less reporting of the experimental data.
The results of Dreisbach et al. [33], obtained by adsorption gravimetry of argon on active
carbon up to 500 bar, allow illustrating the intermediate and relative role of the surface excess
amount. This is visible in Figure 12, in which 3 of the 4 curves are from the original work,
although presented here with different ordinates and additional information about the Gibbs
exclusion volumes.
The three lower curves are surface excess isotherms which can be assessed by means of
equation (10) and which were calculated with different values of the specific Gibbs exclusion
volume vGDS, namely 0 (which corresponds to the “reduced mass of adsorbate”), 0.45 (where
vGDS is taken equal to the specific volume of the solid as determined from a helium dead
volume) and 0.50 cm3 g-1 (a value easy to take for the sake of standardization and
comparisons; this is the curve we have added to the original ones). We should stress that these
three curves, including the lowest one which reports largely negative surface excess amounts
above 30 MPa, exactly contain the same amount and quality of experimental information, i.e.
the three of them allow calculating exactly the same isotherm of amount adsorbed (the upper
curve), with help of Equation 11, once the adsorptive density vs pressure is known and once
the values for the specific adsorbent volume vSA inaccessible to argon and for the specific
adsorbate volume vaA are fixed, which is done here with help of the data provided by Figure
13. Here, the adsorbate volume is assumed to increase with pressure, i.e. not to be constantly
equal to the microporous volume.
Figure 12 - Adsorption of argon on active carbon Norit R1 at 298.15 K (after Dreisbach et al. [33]). Three lower
curves: surface excess isotherms with different values of the specific Gibbs exclusion volume vGDS. Upper curve:
isotherm of amount adsorbed, with corresponding assumptions on solid volume and adsorbate volume.

16
Incidentally, given the assumptions about the adsorbent and adsorbate volumes which are
required to calculate the amount adsorbed and which lead to some final uncertainty, one can
wish, now that the “amount adsorbed” is well defined [2], avoiding the term “absolute amount
adsorbed”, not to give the misleading feeling that this quantity has a kind of absolute value.
Conclusions
Our main proposal is to draw full benefit from the Gibbs initial model by considering
the calculation of the surface excess amount as a first, intermediate step whose interest is to
allow reporting experimental data with keeping the full accuracy of the experiment. For that
purpose, it should not include any estimation or uncertain determination of the adsorbent
volume inaccessible to the adsorptive. This is made possible once the GDS is given an exact
definition, independent from the surface of the adsorbent. An independent GDS also means an
independent volume enclosed by the GDS, different from the less well characterized
adsorbent volume inaccessible to the adsorptive. Given the central part plaid in the calculation
of the surface excess amount by the volume enclosed by the GDS, it may deserve being given
a special name and symbol, e.g. the “Gibbs exclusion volume” with symbol VGDS.
Determining, in a first step, the surface excess amount, does not require any knowledge about
the adsorbent or the adsorption mechanism so that this can be done automatically, by a simple
software containing a fixed value for the specific Gibbs exclusion volume (e.g. 0.5 or even 0
cm3 g-1). The assumption-free surface excess isotherms then obtained (by either adsorption
manometry or adsorption gravimetry) totally lend themselves, even long after being produced,
to any new assumption considered necessary to carry out the calculation of the amount
adsorbed, provided the Gibbs exclusion volume used in their calculation is stated. It remains
possible, at the expense of more work, to use a Gibbs exclusion volume determined by helium
expansion, as has been done traditionally until now, but, again, this volume should be stated
and reported together with the excess isotherm, to make the latter really meaningful and
convertible into an adsorbed amount isotherm, especially when it is found necessary to use a
different adsorbent volume.
The assessment of the amount adsorbed is indeed the second, compulsory step of the
calculation, since it is required for any application, understanding and simulation of
adsorption. This is the step requiring from the experimenter expertise and extra data in order
to make a reasonable evaluation of the adsorbent volume inaccessible to the adsorptive (a data
difficult to assess when the adsorbent is microporous) and of the volume occupied by the
adsorbed phase. This also means that when surface excess isotherms are published alone, they
should be provided with any information available about the adsorbent volume VSi
Figure 13- Values taken for the specific solid volume and the specific (solid + adsorbate) volume to calculate
the isotherm of amount adsorbed in Figure 14 (from Dreisbach et al. [33])

17
inaccessible to the adsorptive and about the microporous volume, if one wants to make it
possible to calculate the amounts adsorbed.
A clear separation of the two steps above should be quite rewarding: the automatic and
assumption-free assessment of the surface excess amount (with the broad, though precise
meaning given in this paper) preserves the accuracy of the experimental data whereas the
assessment of the amount adsorbed lends itself to the critical and explicit reasoning of the
researcher. This should make it easier to carry out inter-laboratory comparisons of
experimental results (by only referring to surface excess amounts) and should help making
clear the assumptions used in the derivation of the amount adsorbed, then providing a safe
start to the final interpretation.
List of symbols
cg: concentration of the gas phase
Mi: molar mass of adsorptive “i”
n: total amount of adsorptive enclosed in volume V
na: amount adsorbed, i.e. contained by the adsorption space (na also stands for specific
surface amount, i.e. per unit mass of adsorbent, depending on the context)
n: surface excess amount, always relative to a given value of the “Gibbs exclusion volume”
VGDS (n also stands for the specific surface amount, i.e. per unit mass of adsorbent,
depending on the context)
m: recorded mass change in adsorption gravimetry experiment
ma: mass adsorbed in adsorption gravimetry experiment
gi: gas or fluid density of adsorptive “i”
V : internal volume of manometric adsorption set-up, with no sample, i.e. bulb volume +
dosing volume and pressure transducer
Vai : volume of the adsorption space for adsorptive “i” (va
i if specific, i.e. per unit mass of
adsorbent)
V g
i : “dead volume” seen by adsorptive “i”, i.e. volume of the “dead space” available to the
gas phase “i” and which is limited by the internal walls of the adsorption manometry set-up
and by the outer limit of the adsorption space for adsorptive “i”
VSi : adsorbent volume inaccessible to adsorptive “i”. (vS
i if specific, i.e. per unit mass of
adsorbent)
VSHe : adsorbent volume inaccessible to helium (vS
He if specific, i.e. per unit mass of
adsorbent)

18
VGDS: “Gibbs exclusion volume”, i.e. volume enclosed by the GDS (vGDS if specific, i.e. per
unit mass of adsorbent)
VaGibbs: volume of the adsorption space in Gibbs representation (= 0)
VB , VC, VD: gas volumes represented in Figure 8 by rectangles B, C and D, repectively
ᴦσ: surface excess concentration n/ A (where A is the surface area)
References
[1] K. Murata, K. Kaneko, Nano-range interfacial layer upon high-pressure adsorption of
supercritical gases, Chem. Phys. Lett., 321 (2000) 342–348.
[2] M.M.K. Salem, P. Braeuer, M. V. Szombathely, M. Heuchel, P. Harting, K. Quitzsch, M.
Jaroniec, Thermodynamics of high-pressure adsorption of argon, nitrogen and methane on
microporous adsorbents, Langmuir 14 (1998) 3376- 3389.
[3] Y. Zhou, L. Zhou, Fundamentals of high pressure adsorption, Langmuir 25 (23) (2009)
13461- 13466.
[4] M.D. Donohue, G.L. Aranovitch, Classification of Gibbs adsorption isotherms,
Adv.Colloid. Interface Sci. 76-77 (1998) 137-152.
[5] M. Thommes, K. Kaneko, A.V. Neimark, J.P. Olivier, F. Rodriguez-Reinoso, J.
Rouquerol, K.S.W. Sing, Physisorption of gases, with special reference to the evaluation of
surface area and pore size distribution (IUPAC Technical Report), Pure Appl. Chem. (2015)
in press.
[6] V.V. Serpinskii, T.S. Yakubov, Adsorption as Gibbs excess and total content, Russian
Chem. Bull. 34 (1985) 6-11.
[7] A.V. Tolmachev, Adsorption of gases, vapors and solutions : I Thermodynamics of
adsorption, Prot. Metals Phys. Chem. Surf. 46 (2) (2010) 170
[8] A.L. Myers, P.A. Monson, Physical adsorption of gases : the case for absolute adsorption
as the basis for the thermodynamic analysis, Adsorption 20 (2014) 591-622.
[9] A.L. Myers, A.J.Calles, G.Calleja, Comparison of molecular simulation of adsorption with
experiment, Adsorption 3 (2) (1997) 107-115.
[10] K. Murata, J. Miyawaki, K. Kaneko, A simple determination method of the absolute
adsorbed amount for high pressure gas adsorption, Carbon 40 (2002) 425-428.
[11] D.D. Do, H.D. Do, D. Nicholson, A computer appraisal of BET theory, BET surface area
and the calculation of surface excess for gas adsorption on a graphite surface, Chem. Eng. Sci.
65 (2010) 3331- 3340.

19
[12] F.A.P. Maggs, P.H. Schwabe, J.H. Williams, Adsorption of helium on carbons :
influence on measurement of density, Nature 186 (1960) 956-958.
[13] K. Kaneko, N. Setoyama,T. Suzuki, Ultramicropore characterization by He . In : J.
Rouquerol, F. Rodriguez-Reinoso, K.S.W. Sing, K.K. Unger (Eds), Proceedings of the
COPS III Symposium, Elsevier, Amsterdam,1994, pp. 593- 602.
[14] P. Malbrunot,D. Vidal, J. Vermesse, R. Chahine, T.K. Bose, Adsorbent helium density
measurement and its effect on adsorption isotherms at high pressure, Langmuir 13 (1997)
539-544.
[15] R. Staudt, S. Bohn, F. Dreisbach, J.U. Keller, Gravimetric and volumetric measurements
of helium adsorption on different porous solids, In : Proceedings of the COPS IV
Symposium, B. McEnaney, T.J. Mays, J. Rouquerol, F. Rodriguez- Reinoso, K.S.W. Sing,
K.K. Unger (Eds) Royal Society of Chemistry, Cambridge, UK, 1997, pp. 261-266.
[16] S. Sircar, Role of helium void measurement in estimation of Gibbsian surface excess, In
Proceedings of the FOA 7, K. Kaneko, H. Kanosh, Y. Hanzawa (Eds), IK International :
Chiba-city, Japan (2001) pp. 656-663.
[17] S. Gumma, O.Talu, Gibbs dividing surface and helium adsorption, Adsorption 9 (2003)
17-28.
[18] R. Pini, Interpretation of net and excess adsorption isotherms in microporous adsorbents ,
Microporous and mesoporous material 187 ( 2014) 40-52.
[19] F. Rouquerol, J. Rouquerol, K.S.W. Sing, P. Lewellyn, G. Maurin, G., 2014 “Adsorption
by Powders and Porous Solids”, Academic Press, Oxford, Paris 626 p.
[20] W.A. Steele and G.D. Halsey, The interaction of rare gas atoms with surfaces, J. Chem.
Phys. 22 (1954) 979- 984.
[21] Y. Wang, B. Helvensteijn, N. Nizamidin, A. M. Erion, L.A. Steiner, L. M. Mulloth, B.
Luna, M. D. LeVan, High pressure excess isotherms for adsorption of oxygen and nitrogen in
zeolites, Langmuir, 27 (2011) 10648- 10656.
[22] I..Suzuki, K.Kakimato and S.Oki, Volumetric determination of adsorption of helium over
some zeolites with temperature-compensated differential tensimeter having symmetrical
design, Rev. Sci. Instrum. 58 (1987) 1226-1230
[23] K.Lorentz, M.Wessling, How to determine the correct sample volume by gravimetric
sorption measurements, Adsorption 19 (2013) 1117-1125.
[24] D.D.Do, H.D. Do, Appropriate volumes for adsorption isotherm studies: The absolute
void volume, accessible pore volume and enclosing particle volume, J. Colloid Interface Sci.
316 (2007) 317-330.

20
[25] D.D.Do, H.D. Do, Chunyan Fan, D. Nicholson, On the existence of negative excess
isotherms for argon adsorption on graphite surfaces and in graphitic pores under supercritical
conditions at pressures up to 10,000 atm., Langmuir 26 (7) (2010) 4796-4806.
[26] L. Herrera, Chunyan Fan, D.D. Do, D. Nicholson, A revisit to the Gibbs dividing surface
and helium adsorption, Adsorption 17 (2011) 955- 965.
[27] J. W. Gibbs, On the Equilibrium of Heterogeneous Substances, Second Part, Trans. of
the Connecticut Academy of Arts and Sciences, Vol.III (1877) 343- 520.
[28] A.A. Pribylov, V.V. Serpinskii, S.M. Kalashnikov, Adsorption of gases by microporous
adsorbents under pressures up to hundreds megapascals, Zeolites 8 (11) (1991) 846-849.
[29] S. Gumma and O. Talu, Net adsorption : a thermodynamic framework for supercritical
gas adsorption and storage in porous solids, Langmuir 26 (22) (2010) 17013- 17023.
[30] D.H., Everett, Manual of symbols and terminology for physicochemical quantities and
units, Pure and Applied Chem. 31(4) (1972) 579- 638.
[31] F. Rouquerol, J. Rouquerol, K.S.W. Sing, Adsorption by powders and porous solids,
Academic press, London, New York, 1999, 467 p., Chapter 2.
[32] O. Talu, Net adsorption of gas/vapor mixtures in microporous solids, J. Phys. Chem. C
117 (2013) 13059- 13071.
[33] F. Dreisbach, H.W. Losch, P. Harting, Highest pressure adsorption equilibria data :
measurement with magnetic suspension balance and analysis with a new adsorbent/adsorbate-
volume, Adsorption 8 (2002) 95-109.
[34] H. Kern, W.v. Rybinski, G. Findenegg, Prefreezing of liquid n-alkanes near graphite
surfaces, J. Colloid Interface Sci. 59 N°2 (1977) 301-307.
[35] G. Findenegg, The volumetric behavior of hydrocarbon liquids near the graphon surface,
J. Colloid Interface Sci. 35 N°2 (1971) 249-253.
[36] N. Quirke, S.R.R.Tennison, The interpretation of pore size distributions of microporous
carbons, Carbon 34 (1996) 1281-1286.
[37] A.V. Neimark, P.L. Ravikovitch, Calibration of pore volume in adsorption experiments
and theoretical models, Langmuir 19 (13) (1997) 5148-5160.
[38] A.L. Myers, P.A. Monson, Adsorption in porous materials at high pressure: theory and
experiment, Langmuir 18 (2002) 10261- 10273.
[39] G. Findenegg, High pressure physical adsorption of gases on homogeneous surfaces. In:
A.L.Myers, G.Belfort (Eds.), Fundamentals of Adsorption, Engineering Foundation, New
York, 1983, pp. 207-218.

21
[40] I. Zhou, Y.P. Zhou, Sh.P. Bai, B.Yang, Studies on the transition behavior of physical
adsorption from the sub- to the supercritical region: experiments on silica gel, J. Colloid
Interface Sci. 253 (2002) 9-15.
[41] Poomiwat Phadungbut, Chuyan Fan, D.D. Do, D. Nicholson, Chaiyot Tangsathitkulchai,
Determination of absolute adsorption for argon on flat surfaces under sub- and supercritical
conditions, Colloids and Surfaces A Physicochem. Eng; Aspects 480 (2015) 19-27.
[42] M. Gasparik, T.F.T. Rexer, A.C. Aplin, P. Billemont, G de Weireld, Y. Gensterblum, M.
Henry, B.M. Krooss, S. Liu, X. Ma, R. Sakurovs, Z. Song, G. Staib, K. M. Thomas, S. Wang,
T. Zhang, First international inter-laboratory comparison of high-pressure CH4 , CO2 and C2H6
sorption isotherms on carbonaceous shales, Inter. J. Coal Geology 132 (2014) 131- 146.
[43] G. de Weireld, Y.Bemabkhout, M.Frère, Buoyancy effect correction on high pressure
pure gas adsorption gravimetric experiments, Ann.de Chimie-Sci. des Matériaux, 30 (4)
(2005) 411-423
Highlights
The dead volume issue in high pressure gas adsorption is carefully examined
The usual Gibbs representation is modified for adsorption by microporous adsorbents
The concept of “Gibbs exclusion volume” is proposed for a safe data reporting
Case study: how to improve an inter-laboratory comparison of adsorption data