Embed Size (px)
Citation preview

Ecological Modelling 181 (2005) 461–478
Surface modelling of human population distribution in China
Tian Xiang Yuea,∗, Ying An Wanga, Ji Yuan Liua, Shu Peng Chena, Dong Sheng Qiua,Xiang Zheng Denga, Ming Liang Liua, Yong Zhong Tiana, Bian Ping Sub
a Institute of Geographical Sciences and Natural Resources Research, Chinese Academy of Sciences,917 Building, Datun, Anwai, Beijing 100101, China
b College of Science, Xi’an University of Architecture and Technology, Xi’an 710055, China
Received 24 March 2003; received in revised form 23 April 2004; accepted 4 June 2004
Abstract
On the basis of introducing major data layers corresponding to net primary productivity (NPP), elevation, city distributionand transport infrastructure distribution of China, surface modelling of population distribution (SMPD) is conducted by meansof grid generation method. A search radius of 200 km is defined in the process of generating each grid cell. SMPD not only paysattention to the situation of relative elements at the site of generating grid cell itself but also calculates contributions of othergrid cells by searching the surrounding environment of the generating grid cell. Human population distribution trend since 1930in China is analysed. The results show that human population distribution in China has a slanting trend from the eastern regionto the western and middle regions of China during the period from 1930 to 2000. Two scenarios in 2015 are developed undertwo kinds of assumptions. Both scenarios show that the trends of population floating from the western and middle regions to thee©
K
1
timsm
f
entels,n ap-uc-gu-sed
nies,in-
hoddeast
0
astern region of China are very outstanding with urbanization and transport development.2004 Elsevier B.V. All rights reserved.
eywords:Surface modelling; Population distribution; Grid generation; Geographical information system
. Introduction
A surface model is the mathematical representa-ion of a surface in such a form that it can be usedn design calculations. Since the first digital terrain
odel for road design was produced by the Mas-achusetts Institute of Technology in 1957, surfaceodelling has begun to be developed (Stott, 1977; Yue
∗ Corresponding author. Tel.: +86 10 64889633;ax: +86 10 64889630.
E-mail address:[email protected] (T.X. Yue).
et al., 2004). Surface modelling includes developmof digital terrain models, spatial interpolation modarea-based matching models and a multi-resolutioproach. Three widely used principal ways of strturing a digital terrain model are triangulated irrelar networks, regular grid networks and contour-banetworks (Moore et al., 1992). Spatial interpolatiomodels include interpolation by drawing boundartrend surface analysis, moving averages, Krigingterpolation, spline curves and finite element met(Stein, 1999; Sabin, 1990; Shipley, 1990). Area-basematching models include radiometric model and l
304-3800/$ – see front matter © 2004 Elsevier B.V. All rights reserved.doi:10.1016/j.ecolmodel.2004.06.042
462 T.X. Yue et al. / Ecological Modelling 181 (2005) 461–478
squares correlation (Mustaffar and Mitchell, 2001;Heipke, 1997; Gruen, 1985; Foestner, 1982). Themulti-resolution approach is an image-driven surfaceestimation, which is characterized by three phases thatare shape modelling, multi-resolution model construc-tion and variable resolution representations (Sarti andTubaro, 2002; Cignoni et al., 1998).
Surface modelling of population distribution(SMPD) that was developed on the basis of grid gen-eration method (Yue et al., 2003) is aimed at formulat-ing population in a regular grid system, in which eachgrid cell contains an estimate of total population thatis representative for that particular location. Compilingpopulation data in grid form is by no means a new ap-proach. For instance,Adams (1968)presented a com-puter generated grid map of population density in westAfrica; Population Atlas of China presented grid pop-ulation data for several regions in China (Institute of
ousand persons grouped by non-agricultural population in urban district).
Geography of Chinese Academy of Sciences, 1987);transforming population data from census to grid(Tobler et al., 1997), apportioning census counts to eachgrid cell based on probability coefficients (Dobson etal., 2000), and estimating population using nighttimelight data (Sutton, 1997; Sutton et al., 1997, 2001; Lo,2001; Sutton et al., 2003).
2. Background of major data layers
In addition to total population in every province,the major data layers that are matched with their corre-sponding SMPD variables include net primary produc-tivity (NPP), elevation, city distribution and transportinfrastructure distribution. The elevation is a naturalfactor and has a slow change with time so that it isspatial variable and could be regarded as a temporal
Fig. 1. Spatial distribution of cities in 2000 in China (unit: th
T.X. Yue et al. / Ecological Modelling 181 (2005) 461–478 463
constant within 100 years. Although NPP is based onclimate and soil, it could be modified by human activ-ities so that it is a spatial and temporal variable. Citydistribution and transport infrastructure distribution arespatial and temporal variables, which are determinedby both natural factors and human activities, have arapid change with time in China during recent 100years.
2.1. Spatial distribution of cities in China
Urbanization is a process of the concentration ofpopulation in cities. Spatial distribution of cities andproximity to cities are essential factors for human pop-ulation distribution of China. The spatial distributionof cities in China has had the feature that city den-sity is much higher in eastern China than in west-
ern China in modern history. During the period from1843 to 1893, urban population proportion had slowgrowth, which was increased from 5.1% to 6.0% aver-agely in China; in the area of lower reaches of YangtzeRiver the urban population proportion was increasedfrom 7.4% to 10.6%, in the coastal area of southChina from 7.0% to 8.7%; in inland area the pro-portion paced up and down between 4.0% and 5.0%.From 1895 to 1931, in areas along coast and YangtzeRiver, northeast China and north China cities were de-veloped rapidly, while in inland area cities were de-veloped very slowly, even at a standstill. In the early1930s, urban population proportion was about 9.2% inChina. From 1931 to 1949, the turbulent and unstablesituation led to slow population growth in China andthe urban population proportion increased to 10.6%(Zhang, 1997). Cities in China spatially concentrates
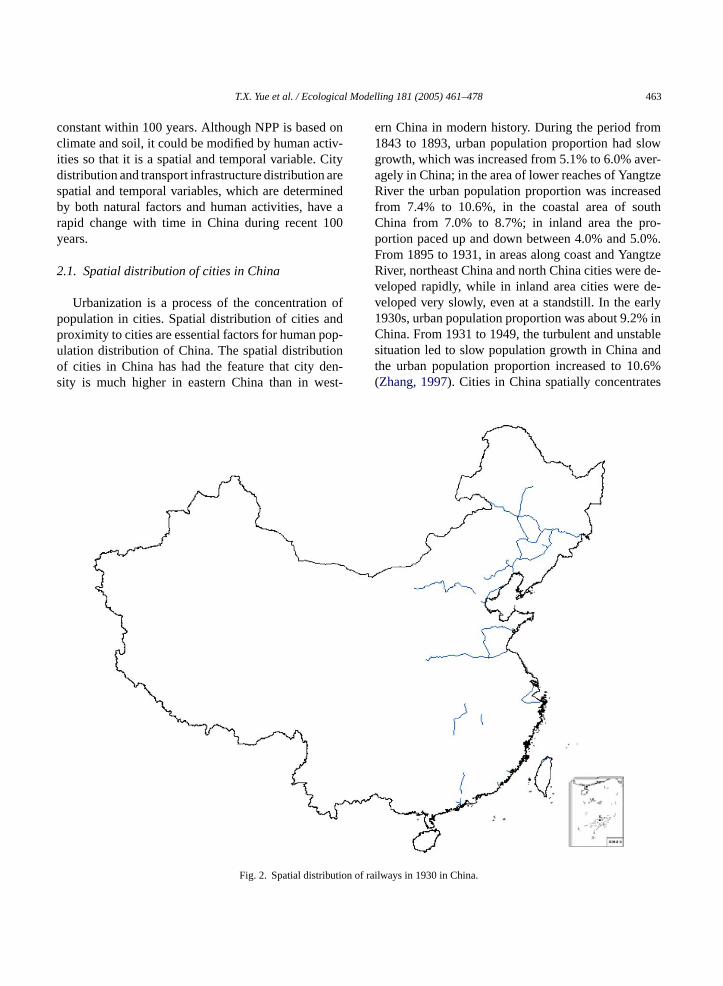
Fig. 2. Spatial distribution of r
ailways in 1930 in China.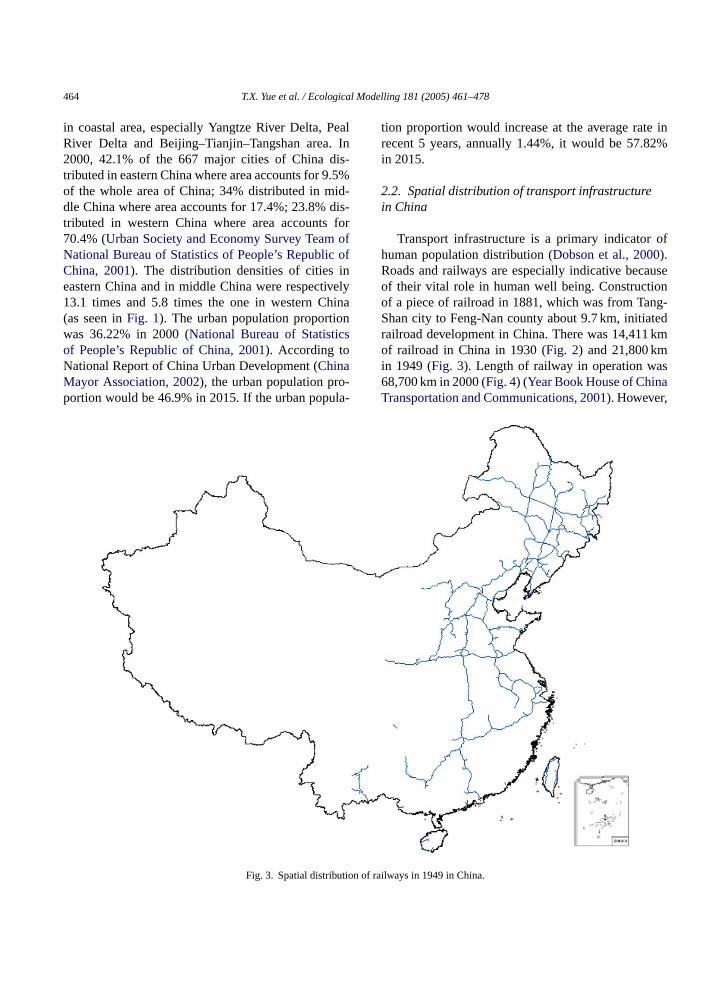
464 T.X. Yue et al. / Ecological Modelling 181 (2005) 461–478
in coastal area, especially Yangtze River Delta, PealRiver Delta and Beijing–Tianjin–Tangshan area. In2000, 42.1% of the 667 major cities of China dis-tributed in eastern China where area accounts for 9.5%of the whole area of China; 34% distributed in mid-dle China where area accounts for 17.4%; 23.8% dis-tributed in western China where area accounts for70.4% (Urban Society and Economy Survey Team ofNational Bureau of Statistics of People’s Republic ofChina, 2001). The distribution densities of cities ineastern China and in middle China were respectively13.1 times and 5.8 times the one in western China(as seen inFig. 1). The urban population proportionwas 36.22% in 2000 (National Bureau of Statisticsof People’s Republic of China, 2001). According toNational Report of China Urban Development (ChinaMayor Association, 2002), the urban population pro-portion would be 46.9% in 2015. If the urban popula-
tion proportion would increase at the average rate inrecent 5 years, annually 1.44%, it would be 57.82%in 2015.
2.2. Spatial distribution of transport infrastructurein China
Transport infrastructure is a primary indicator ofhuman population distribution (Dobson et al., 2000).Roads and railways are especially indicative becauseof their vital role in human well being. Constructionof a piece of railroad in 1881, which was from Tang-Shan city to Feng-Nan county about 9.7 km, initiatedrailroad development in China. There was 14,411 kmof railroad in China in 1930 (Fig. 2) and 21,800 kmin 1949 (Fig. 3). Length of railway in operation was68,700 km in 2000 (Fig. 4) (Year Book House of ChinaTransportation and Communications, 2001). However,
Fig. 3. Spatial distribution of r
ailways in 1949 in China.
T.X. Yue et al. / Ecological Modelling 181 (2005) 461–478 465
Fig. 4. Spatial distribution of railways in 2000 in China.
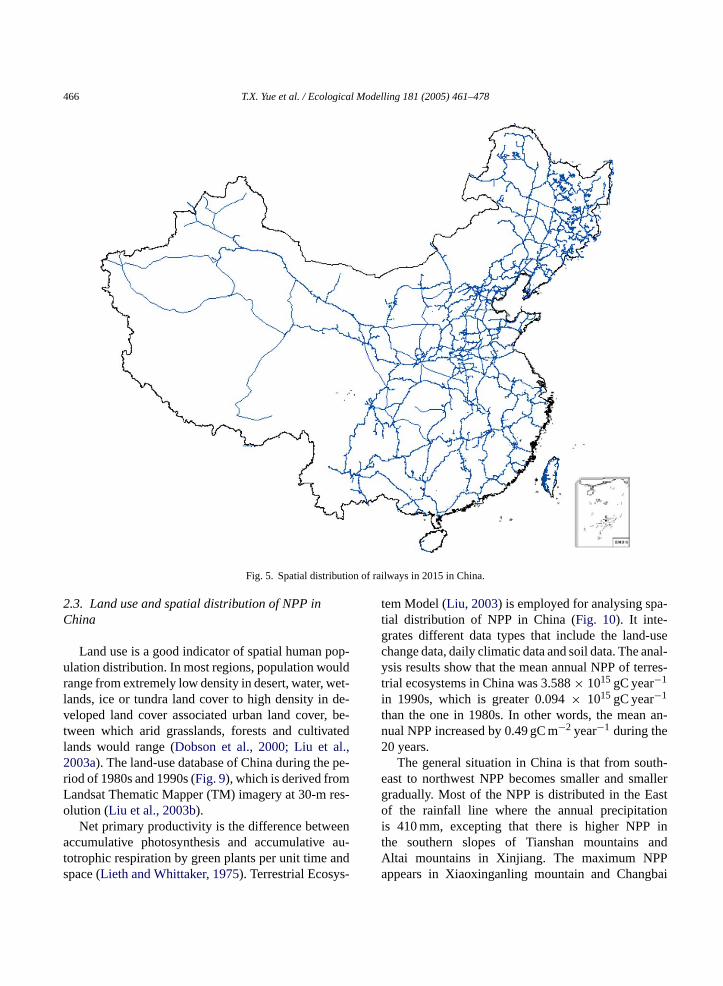
relative research results showed that the appropriatelength of railroad should be 100,000 km in China, fromwhich current railroad length has a great gap (Chen andZhang, 2000). To implement the western developmentstrategy, railroad building in China is paying attentionto strengthening the linkage between eastern region andwestern region of China, speeding up construction ofaccesses to central Asia and southeast Asia and improv-ing connection within the western region of China. To-tal length of railroad in China would reach 81,653 kmin 2015 (Fig. 5).
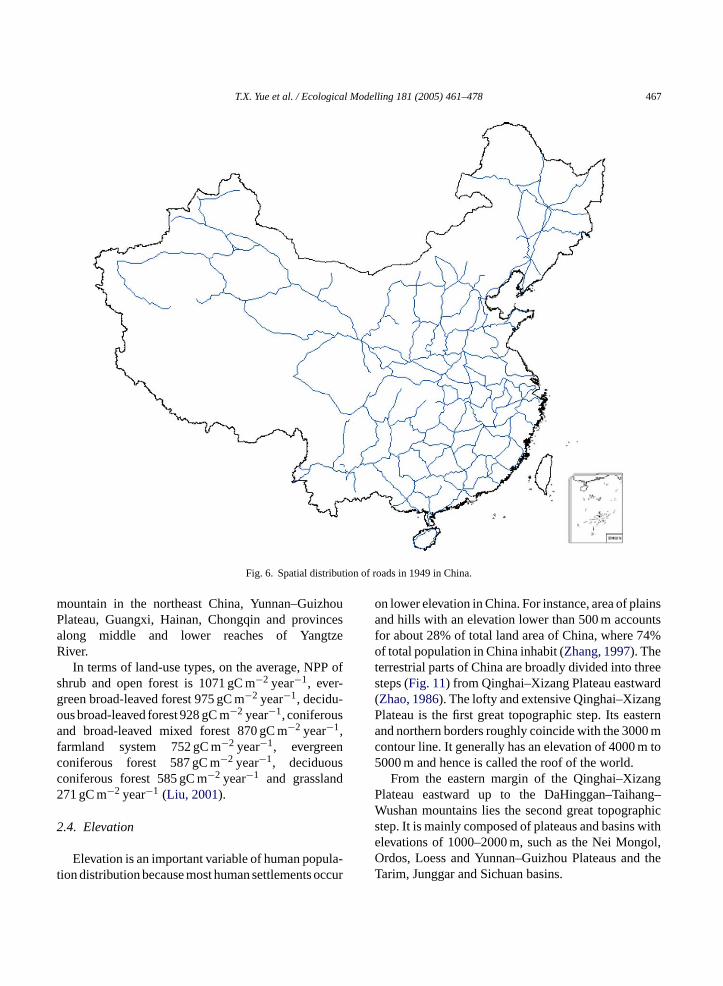
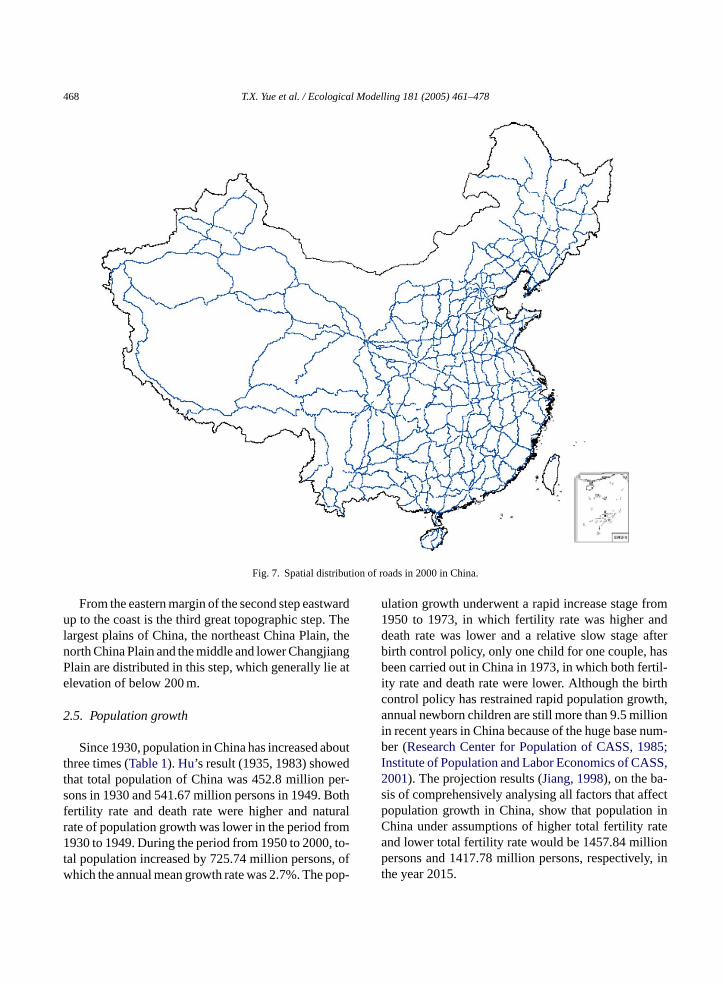
In 1902, the first automobile was imported inChina and in 1906 the first piece of road was con-structed. In 1949, length of highways that automo-biles could go through was 80,700 km (Fig. 6). Af-ter construction for 50 years, total length of high-ways was about 1.4 million km in 2000 (Fig. 7) (YearBook House of China Transportation and Communi-
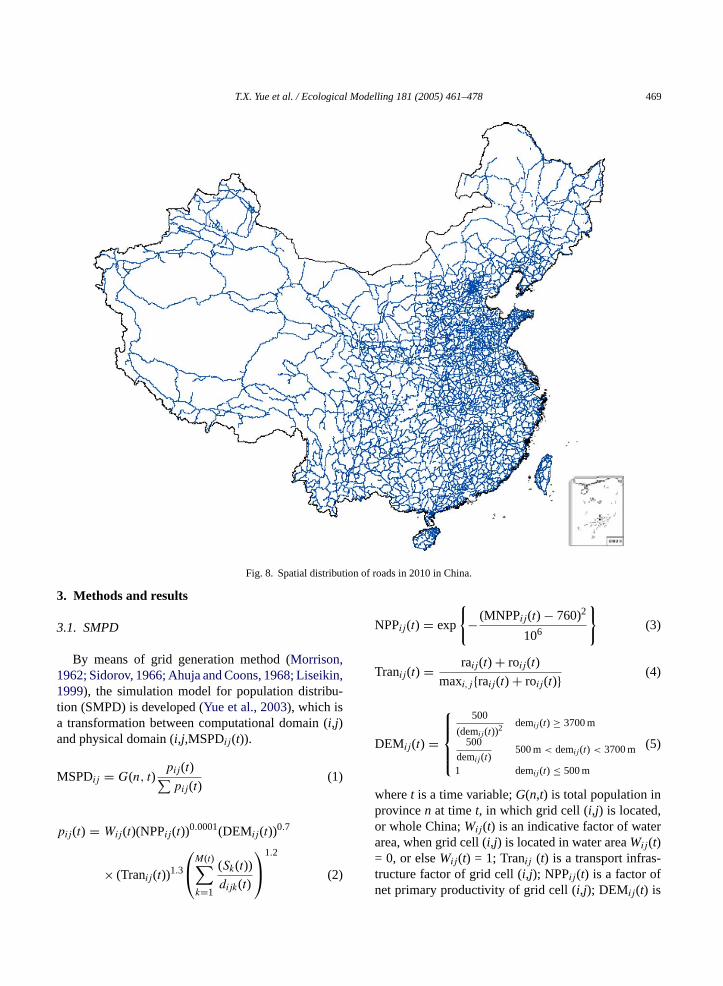
cations, 2001). In recent 10 years, major projects ofhighway construction include seven east–west maintrunk roads and five south–north main trunk roadsas well as three important sections, of which totallength is about 35,000 km (Fig. 8). The seven east–westmain trunk roads include highways from Suifenheto Manzhouli, from Dandong to Lasa, from Qing-dao to Yinchuan, from Lianyungang to Huerguosi,from Shanghai to Chengdu, from Shanghai to Ruiliand from Hengyang to Kunming. The 5 south–northmain trunk roads include highways from Tongjiang ofHeilongjiang province to Sanya of Hainan province,from Beijing to Fuzhou, from Beijing to Zhuhai,from Erlianhaote to Hekou and from Chongqing toZhanjiang. The 3 important sections include highwaysfrom Beijing to Shenyang, from Beijing to Shang-hai and passageway going abroad from southwesternChina.
466 T.X. Yue et al. / Ecological Modelling 181 (2005) 461–478
Fig. 5. Spatial distribution of railways in 2015 in China.
2.3. Land use and spatial distribution of NPP inChina
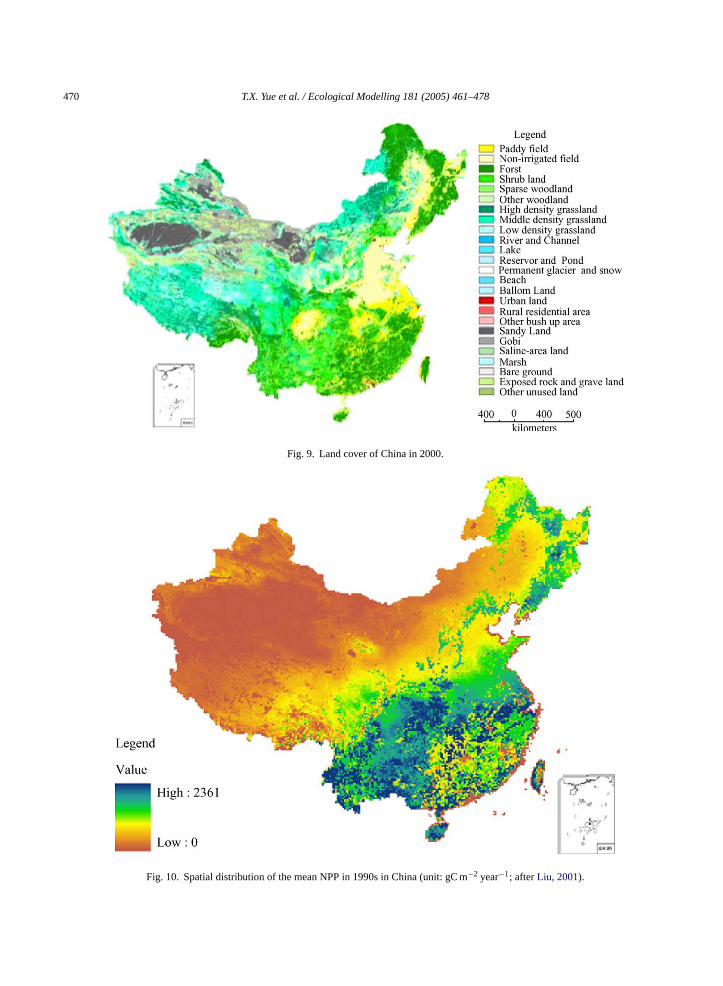
Land use is a good indicator of spatial human pop-ulation distribution. In most regions, population wouldrange from extremely low density in desert, water, wet-lands, ice or tundra land cover to high density in de-veloped land cover associated urban land cover, be-tween which arid grasslands, forests and cultivatedlands would range (Dobson et al., 2000; Liu et al.,2003a). The land-use database of China during the pe-riod of 1980s and 1990s (Fig. 9), which is derived fromLandsat Thematic Mapper (TM) imagery at 30-m res-olution (Liu et al., 2003b).
Net primary productivity is the difference betweenaccumulative photosynthesis and accumulative au-totrophic respiration by green plants per unit time andspace (Lieth and Whittaker, 1975). Terrestrial Ecosys-
tem Model (Liu, 2003) is employed for analysing spa-tial distribution of NPP in China (Fig. 10). It inte-grates different data types that include the land-usechange data, daily climatic data and soil data. The anal-ysis results show that the mean annual NPP of terres-trial ecosystems in China was 3.588× 10¹⁵ gC year−1
in 1990s, which is greater 0.094× 10¹⁵ gC year−1
than the one in 1980s. In other words, the mean an-nual NPP increased by 0.49 gC m−2 year−1 during the20 years.
The general situation in China is that from south-east to northwest NPP becomes smaller and smallergradually. Most of the NPP is distributed in the Eastof the rainfall line where the annual precipitationis 410 mm, excepting that there is higher NPP inthe southern slopes of Tianshan mountains andAltai mountains in Xinjiang. The maximum NPPappears in Xiaoxinganling mountain and Changbai
T.X. Yue et al. / Ecological Modelling 181 (2005) 461–478 467
Fig. 6. Spatial distribution of roads in 1949 in China.
mountain in the northeast China, Yunnan–GuizhouPlateau, Guangxi, Hainan, Chongqin and provincesalong middle and lower reaches of YangtzeRiver.
In terms of land-use types, on the average, NPP ofshrub and open forest is 1071 gC m−2 year−1, ever-green broad-leaved forest 975 gC m−2 year−1, decidu-ous broad-leaved forest 928 gC m−2 year−1, coniferousand broad-leaved mixed forest 870 gC m−2 year−1,farmland system 752 gC m−2 year−1, evergreenconiferous forest 587 gC m−2 year−1, deciduousconiferous forest 585 gC m−2 year−1 and grassland271 gC m−2 year−1 (Liu, 2001).
2.4. Elevation
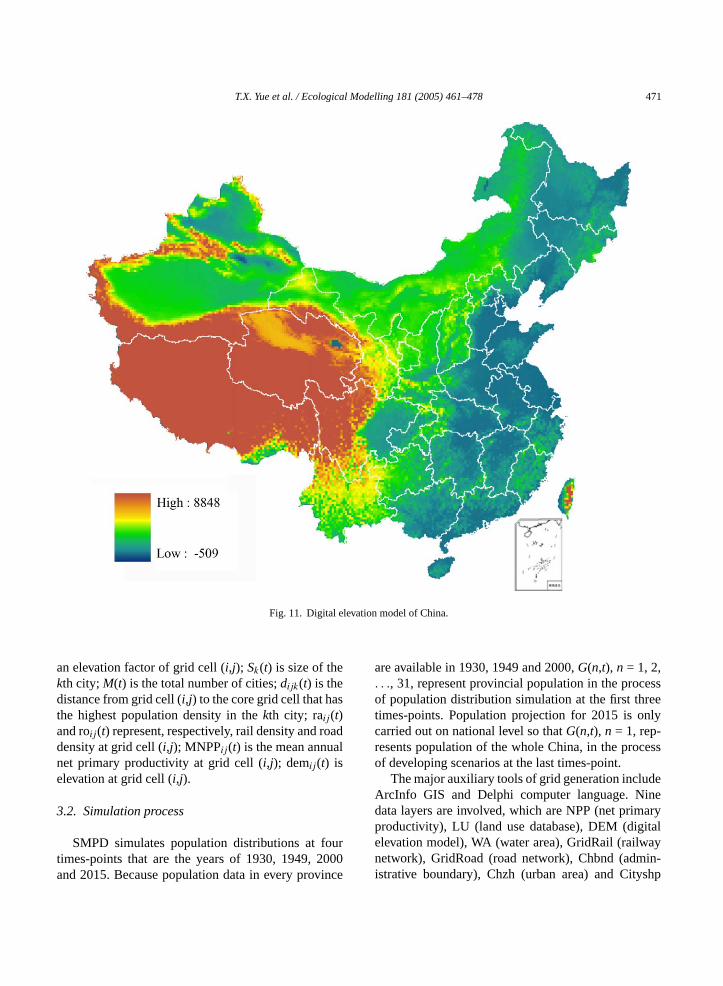
Elevation is an important variable of human popula-tion distribution because most human settlements occur
on lower elevation in China. For instance, area of plainsand hills with an elevation lower than 500 m accountsfor about 28% of total land area of China, where 74%of total population in China inhabit (Zhang, 1997). Theterrestrial parts of China are broadly divided into threesteps (Fig. 11) from Qinghai–Xizang Plateau eastward(Zhao, 1986). The lofty and extensive Qinghai–XizangPlateau is the first great topographic step. Its easternand northern borders roughly coincide with the 3000 mcontour line. It generally has an elevation of 4000 m to5000 m and hence is called the roof of the world.
From the eastern margin of the Qinghai–XizangPlateau eastward up to the DaHinggan–Taihang–Wushan mountains lies the second great topographicstep. It is mainly composed of plateaus and basins withelevations of 1000–2000 m, such as the Nei Mongol,Ordos, Loess and Yunnan–Guizhou Plateaus and theTarim, Junggar and Sichuan basins.
468 T.X. Yue et al. / Ecological Modelling 181 (2005) 461–478
Fig. 7. Spatial distribution of roads in 2000 in China.
From the eastern margin of the second step eastwardup to the coast is the third great topographic step. Thelargest plains of China, the northeast China Plain, thenorth China Plain and the middle and lower ChangjiangPlain are distributed in this step, which generally lie atelevation of below 200 m.
2.5. Population growth
Since 1930, population in China has increased aboutthree times (Table 1). Hu’s result (1935, 1983) showedthat total population of China was 452.8 million per-sons in 1930 and 541.67 million persons in 1949. Bothfertility rate and death rate were higher and naturalrate of population growth was lower in the period from1930 to 1949. During the period from 1950 to 2000, to-tal population increased by 725.74 million persons, ofwhich the annual mean growth rate was 2.7%. The pop-
ulation growth underwent a rapid increase stage from1950 to 1973, in which fertility rate was higher anddeath rate was lower and a relative slow stage afterbirth control policy, only one child for one couple, hasbeen carried out in China in 1973, in which both fertil-ity rate and death rate were lower. Although the birthcontrol policy has restrained rapid population growth,annual newborn children are still more than 9.5 millionin recent years in China because of the huge base num-ber (Research Center for Population of CASS, 1985;Institute of Population and Labor Economics of CASS,2001). The projection results (Jiang, 1998), on the ba-sis of comprehensively analysing all factors that affectpopulation growth in China, show that population inChina under assumptions of higher total fertility rateand lower total fertility rate would be 1457.84 millionpersons and 1417.78 million persons, respectively, inthe year 2015.
T.X. Yue et al. / Ecological Modelling 181 (2005) 461–478 469
Fig. 8. Spatial distribution of roads in 2010 in China.
3. Methods and results
3.1. SMPD
By means of grid generation method (Morrison,1962; Sidorov, 1966; Ahuja and Coons, 1968; Liseikin,1999), the simulation model for population distribu-tion (SMPD) is developed (Yue et al., 2003), which isa transformation between computational domain (i,j)and physical domain (i,j,MSPDij(t)).
MSPDij = G(n, t)pij(t)∑pij(t)
(1)
pij(t) = Wij(t)(NPPij(t))0.0001(DEMij(t))
0.7
× (Tranij(t))1.3
M(t)∑
k=1
(Sk(t))
dijk(t)
1.2
(2)
NPPij(t) = exp
{− (MNPPij(t) − 760)2
106
}(3)
Tranij(t) = raij(t) + roij(t)
maxi,j{raij(t) + roij(t)} (4)
DEMij(t) =
500
(demij(t))2demij(t) ≥ 3700 m
500
demij(t)500 m< demij(t) < 3700 m
1 demij(t) ≤ 500 m
(5)
wheret is a time variable;G(n,t) is total population inprovincen at timet, in which grid cell (i,j) is located,or whole China;Wij(t) is an indicative factor of waterarea, when grid cell (i,j) is located in water areaWij(t)= 0, or elseWij(t) = 1; Tranij (t) is a transport infras-tructure factor of grid cell (i,j); NPPij(t) is a factor ofnet primary productivity of grid cell (i,j); DEMij(t) is
470 T.X. Yue et al. / Ecological Modelling 181 (2005) 461–478
Fig. 9. Land cover of China in 2000.
Fig. 10. Spatial distribution of the mean NPP in 1990s in China (unit: gC m−2 year−1; afterLiu, 2001).
T.X. Yue et al. / Ecological Modelling 181 (2005) 461–478 471
Fig. 11. Digital elevation model of China.
an elevation factor of grid cell (i,j); Sk(t) is size of thekth city;M(t) is the total number of cities;dijk(t) is thedistance from grid cell (i,j) to the core grid cell that hasthe highest population density in thekth city; raij(t)and roij(t) represent, respectively, rail density and roaddensity at grid cell (i,j); MNPPij(t) is the mean annualnet primary productivity at grid cell (i,j); demij(t) iselevation at grid cell (i,j).
3.2. Simulation process
SMPD simulates population distributions at fourtimes-points that are the years of 1930, 1949, 2000and 2015. Because population data in every province
are available in 1930, 1949 and 2000,G(n,t), n = 1, 2,. . ., 31, represent provincial population in the processof population distribution simulation at the first threetimes-points. Population projection for 2015 is onlycarried out on national level so thatG(n,t), n = 1, rep-resents population of the whole China, in the processof developing scenarios at the last times-point.
The major auxiliary tools of grid generation includeArcInfo GIS and Delphi computer language. Ninedata layers are involved, which are NPP (net primaryproductivity), LU (land use database), DEM (digitalelevation model), WA (water area), GridRail (railwaynetwork), GridRoad (road network), Chbnd (admin-istrative boundary), Chzh (urban area) and Cityshp

472 T.X. Yue et al. / Ecological Modelling 181 (2005) 461–478
Table 1The provincial population of China excluding Taiwan, Hong Kong and Macao temporarily
Region Area (km2) Population size (million persons) Population density (person per km2)
1930 1949 2000 1930 1949 2000
Western China 6725746 110.63 174.57 354.60 16 26 53Inner Mongolia 1143327 4.40 37.88 23.01 4 33 20Guangxi 236544 11.50 18.42 47.24 49 78 200Chongqing 82390 Belong to Sichuan Belong to Sichuan 30.91 Belong to Sichuan Belong to Sichuan 375Sichuan 483759 51.34 57.30 84.07 106 118 174Guizhou 176109 11.03 14.16 36.77 63 80 209Yunnan 383101 11.52 15.95 40.77 30 42 106Tibet 1201653 0.78 1.00 2.51 1 1 2Shaanxi 205732 10.39 13.17 35.72 50 64 174Gansu 404622 5.49 9.68 25.34 14 24 63Qinghai 716677 1.28 1.48 4.80 2 2 7Ningxia 51785 0.39 1.20 5.54 8 23 107Xinjiang 1640111 2.51 4.33 17.92 2 3 11
Middle China 1670726 150.15 161.41 419.41 90 97 251Shanxi 156563 11.30 12.81 31.96 72 82 204Anhui 140165 21.92 27.86 62.78 156 199 448Jiangxi 166960 17.16 12.68 41.64 103 76 249Henan 165619 31.92 41.74 95.27 193 252 575Hubei 185950 25.94 25.36 59.36 140 136 319Hunan 211815 29.54 29.87 65.15 139 141 308Jilin 191093 7.82 10.09 26.27 41 53 137Helongjiang 452561 4.55 1.01 36.98 10 2 82
Eastern China 1203528 187.23 205.68 462.71 156 171 384Beijing 16386 1.52 4.14 11.14 93 253 680Tianjin 11620 1.47 3.99 9.19 126 344 791Hebei 188111 30.29 30.86 66.71 161 164 355Liaoning 146316 16.08 18.31 41.35 110 125 283Shanghai 8013 3.91 5.06 13.22 488 632 1650Jiangsu 103405 30.29 35.12 70.69 293 340 684Zhejiang 103196 20.07 20.83 45.01 194 202 436Fujian 122468 13.99 11.88 33.05 114 97 270Shandong 157119 36.67 45.49 89.75 233 290 571Guangdong 179776 32.93 30.00 74.99 183 167 417Hainan 40070 Belong to
GuangdongBelong toGuangdong
7.61 Belong toGuangdong
Belong toGuangdong
190
(geographical coordinate of city). The data are firstpre-processed as follows: (1) converting NPP into vec-tor data, (2) overlaying Chbnd with GridRoad andGridRail by Intersect and creating a data layer, ChB-ndNew, (3) adding fields, CityFlag for urban code andrural code and CityArea for areas of urban districts, inChzh, (4) overlaying Chzh with ChBndNew by Inter-sect and creating a data layer, ChCity, (5) overlayingNPP with ChCity by Intersect and creating a data layer,NppNew, (6) overlaying LU with NppNew by Intersectand creating a data layer, LNpp, (6) overlaying DEM
with LNpp by Intersect and creating a data layer, DL-Npp and (7) overlaying WA with DLNpp by Intersectand creating a data layer, WDLNpp.
Every grid cell in 1 km× 1 km resolution is gener-ated on the basis of WDLNpp, which includes six steps:(1) to read the attribute values of natural and socioe-conomic indicators at every grid cell, (2) to calculatethe contribution of NPP and elevation to the generat-ing grid cell, (3) to define a search radius of 200 kmand to search cities and transport infrastructures thathave considerable effects on the generating grid cell,
T.X. Yue et al. / Ecological Modelling 181 (2005) 461–478 473
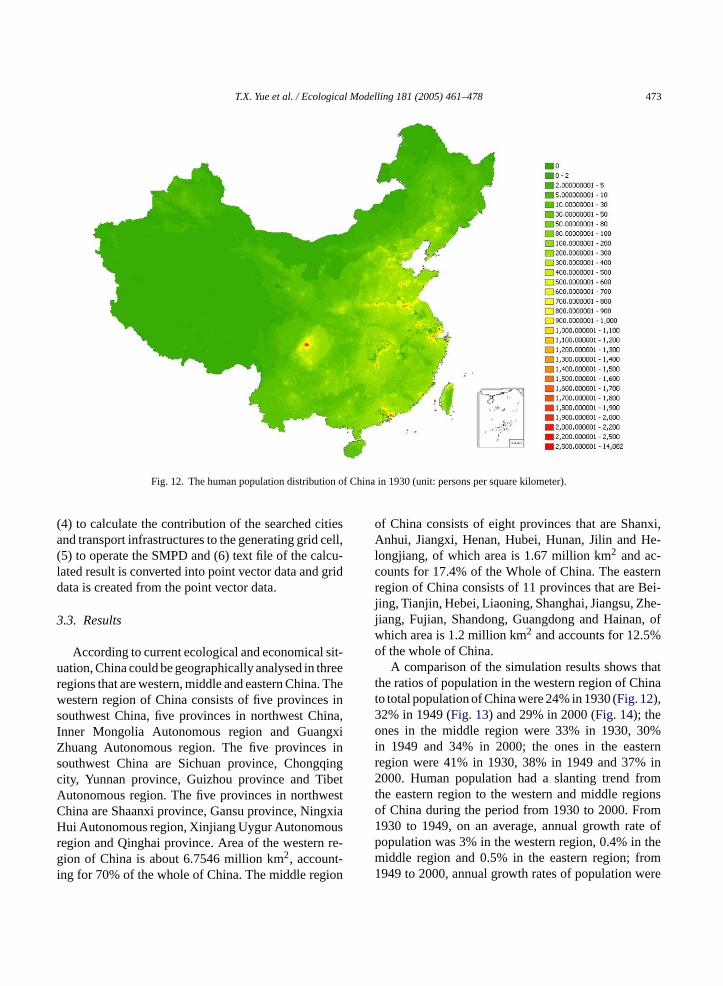
Fig. 12. The human population distribution of China in 1930 (unit: persons per square kilometer).
(4) to calculate the contribution of the searched citiesand transport infrastructures to the generating grid cell,(5) to operate the SMPD and (6) text file of the calcu-lated result is converted into point vector data and griddata is created from the point vector data.
3.3. Results
According to current ecological and economical sit-uation, China could be geographically analysed in threeregions that are western, middle and eastern China. Thewestern region of China consists of five provinces insouthwest China, five provinces in northwest China,Inner Mongolia Autonomous region and GuangxiZhuang Autonomous region. The five provinces insouthwest China are Sichuan province, Chongqingcity, Yunnan province, Guizhou province and TibetAutonomous region. The five provinces in northwestChina are Shaanxi province, Gansu province, NingxiaHui Autonomous region, Xinjiang Uygur Autonomousregion and Qinghai province. Area of the western re-gion of China is about 6.7546 million km2, account-ing for 70% of the whole of China. The middle region
of China consists of eight provinces that are Shanxi,Anhui, Jiangxi, Henan, Hubei, Hunan, Jilin and He-longjiang, of which area is 1.67 million km2 and ac-counts for 17.4% of the Whole of China. The easternregion of China consists of 11 provinces that are Bei-jing, Tianjin, Hebei, Liaoning, Shanghai, Jiangsu, Zhe-jiang, Fujian, Shandong, Guangdong and Hainan, ofwhich area is 1.2 million km2 and accounts for 12.5%of the whole of China.
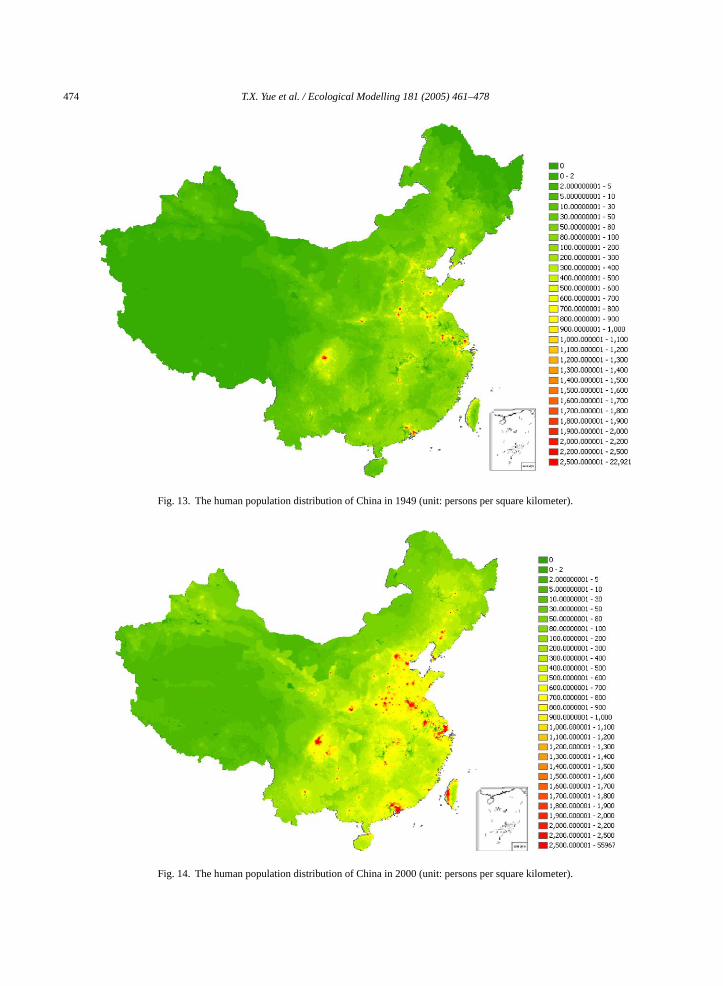
A comparison of the simulation results shows thatthe ratios of population in the western region of Chinato total population of China were 24% in 1930 (Fig. 12),32% in 1949 (Fig. 13) and 29% in 2000 (Fig. 14); theones in the middle region were 33% in 1930, 30%in 1949 and 34% in 2000; the ones in the easternregion were 41% in 1930, 38% in 1949 and 37% in2000. Human population had a slanting trend fromthe eastern region to the western and middle regionsof China during the period from 1930 to 2000. From1930 to 1949, on an average, annual growth rate ofpopulation was 3% in the western region, 0.4% in themiddle region and 0.5% in the eastern region; from1949 to 2000, annual growth rates of population were
474 T.X. Yue et al. / Ecological Modelling 181 (2005) 461–478
Fig. 13. The human population distribution of China in 1949 (unit: persons per square kilometer).
Fig. 14. The human population distribution of China in 2000 (unit: persons per square kilometer).
T.X. Yue et al. / Ecological Modelling 181 (2005) 461–478 475
Table 2Population change of in different regions of China excluding Taiwan, Hong Kong and Macao temporarily
Years and scenarios The western region The middle region The eastern region
Population Ratio (%) Population Ratio (%) Population Ratio (%)
1930 110.63 24 150.15 33 187.23 411949 174.57 32 161.42 30 205.68 382000 354.6 29 419.41 34 462.71 37
2015Scenario I 180.86 12 427.56 29 849.42 58Scenario II 196.55 14 439.31 31 781.92 55
respectively 2%, 3.1% and 2.5% in the western, middleand eastern region (Table 2).
From now to 2015, all of urban population propor-tion, large-scale highway construction and populationgrowth have at least two possibilities in China. If theincrease of urban population proportion at the averagerate in recent 5 years, annually 1.44%, the urban pop-ulation proportion would be 57.82% in 2015; but interms of the National Report of China Urban Devel-opment, the increase rate will be 1.0% annually and
lation
the urban population proportion will be 46.9% (ChinaMayor Association, 2002). The major highway con-struction projects will be completed in 2010. During theperiod from 2010 to 2015, construction length of high-ways might be continued at the increase rate, 0.25%annually, as in the period from 2000 to 2010; it is alsopossible that large-scale highway construction stagnatetemporally. In terms of the projection (Jiang, 1998),population would be 1457.84 million persons at highertotal fertility rate and would be 1417.78 million persons
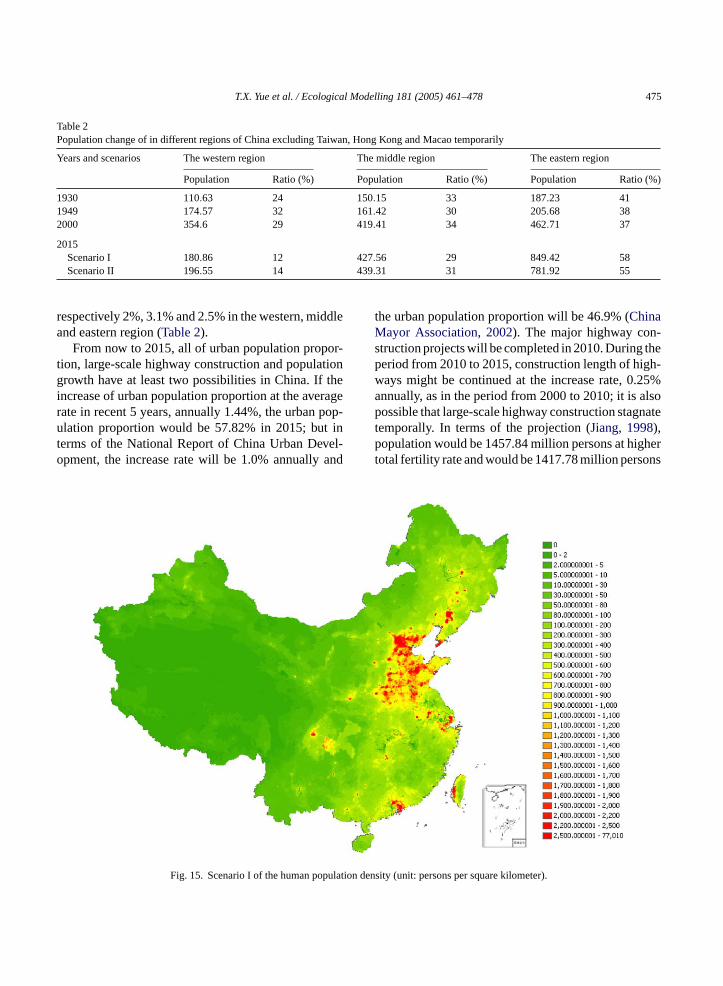
Fig. 15. Scenario I of the human popu
density (unit: persons per square kilometer).
476 T.X. Yue et al. / Ecological Modelling 181 (2005) 461–478
Fig. 16. Scenario II of the human population density (unit: persons per square kilometer).
at lower total fertility rate in 2015 in China. There-fore, as an example of SMPD advantage for scenariodevelopment, two scenarios are here developed underassumptions that railway construction planning wouldhave been successfully carried out, increase rate of NPPwould be 0.49 gC m−2 year−1 and elevation on nationallevel has little change. The two scenarios are distin-guished into I and II. In the scenario I, it is supposedthat the urban population proportion would be 57.82%in 2015, annual increase rate of highway constructionwould be 0.25% during the period from 2010 to 2015,and population would be 1457.84 million persons in2015 (Fig. 15). In the scenario II, the urban populationproportion would be 46.9%, large-scale highway con-struction during the period from 2010 to 2015 wouldbe temporal stagnation and there would be 1417.78million persons in 2015 (Fig. 16). Both scenarios showthat population might greatly float from the western andmiddle regions to the eastern region of China (Table 2).The more rapid the urbanization and transportation de-velopment would be, the bigger the population floatingspeed would be.
4. Discussions
The translation of model results into geographicalpatterns is already under rapid development by useof geographical information system (GIS) (Jørgensen,2002). SMPD is such a method that integrates spa-tial and non-spatial information from various sourcessuch as remote sensing, statistics, ecosystem researchnetwork, various monitoring systems, and investiga-tion on-the-spot by means of GIS. In addition toSMPD, GIS-based methods that have been devel-oped for integrating economic and ecological in-formation in recent years include spatial detailedBiotope Landscape Model (Muenier et al., 2004),GIS-extended nitrate pollution model (Mate jıcek etal., 2003), FORRUS-S model for forest management(Chumachenko et al., 2003), Model of HierarchicalPatch Dynamics (Burnett and Blaschke, 2003), GIS-based Erosion Productivity Impact Calculator Model(Tan and Shibasaki, 2003), Optimisation Method-ology for land use patterns (Seppelt and Voinov,2002), the multi-disciplinary integrated model system
T.X. Yue et al. / Ecological Modelling 181 (2005) 461–478 477
consisting of the models ProLand, ELLA and SWAT(Weber et al., 2001), and Spatial EPIC (Priya andShibasaki, 2001). Comparing with other GIS-basedmethods, SMPD not only pays attention to the sit-uation of relative elements at the site of generat-ing grid cell itself but also calculates contributionsof other grid cells by searching the surrounding en-vironment of the generating grid cell. For instance,in the case of this paper, a search radius of 200 kmis defined in the process of generating each gridcell. Although the Optimisation Methodology adopteda grid search strategy and performed a grid searchthrough the entire control space assuming a homo-geneous land use and identical fertilizer amounts foreach cell, it aimed at searching temporal change in-formation of each grid cell in a series of maps dur-ing the simulation period of 551 days instead ofsearching the surrounding environment of the gridcell.
Human population distribution in China is mainlydetermined by geographical location such as dis-tance from cities and transport infrastructuresand environmental conditions such as net pri-mary productivity and elevation. Research results ofwildlife population distributions (Ji and Jeske, 2000;Krivan, 2003; Westerberg and Wennergren, 2003)show that distributions of wildlife population arecharacterized by geographical location and sea-sonal variations of movement patterns. Movementbehaviour of wildlife populations is impacted by en-v tiont om-p therc dif-f ve ad s.T e-t en-t torss ruc-t mew ef-f orss ef-f la-t d inS iond
Acknowledgments
This work is supported by National Basic ResearchPriorities Program (grant no. 2002CB4125) of Ministryof Science and Technology of the People’s Republicof China and by Projects of National Natural ScienceFoundation of China (grant no. 40371094).
References
Adams, J., 1968. A Population Map of West Africa, Graduate Schoolof Geography Discussion Paper No. 26. London School of Eco-nomics, London.
Ahuja, D.V., Coons, S.A., 1968. Geometry for construction and dis-play. IBM Syst. J. 7, 188–205.
Burnett, C., Blaschke, T., 2003. A multi-scale segmentation/objectrelationship modelling methodology for landscape analysis.Ecol. Model. 168, 233–249.
Chen, H., Zhang, W.C., 2000. Transport Geography of China. Sci-ence Press, Beijing (in Chinese).
China Mayor Association, 2002. National Report of China UrbanDevelopment. Xiyuan Press, Beijing (in Chinese).
Chumachenko, S.I., Korotkov, V.N., Palenova, M.M., Politov, D.V.,2003. Simulation modelling of long-term stand dynamics atdifferent scenarios of forest management for coniferous-broad-leaved forests. Ecol. Model. 170, 345–361.
Cignoni, P., Montani, C., Rocchini, C., Scopigno, R., 1998. Zeta: aresolution modeling system. Graphical Models Image Process.60, 305–329.
Dobson, J.E., Bright, E.A., Coleman, P.R., Durfee, R.C., Worley,B.A., 2000. LandScan: a global population database for estimat-ing populations at risk. Photogrammetr. Eng. Remote Sens. 66
F tion.
G erfulmote
H ori-9.
H ina.ese).
H ogr.
I . Theng.
I Al-op-
J tribu-ippi
J ation
ironmental conditions and land uses. In addio predator–prey dynamics and interspecific cetition, physical texture, food resources, weaonditions and landscape structure as well aserences in the magnitude of these factors hairect effect on wildlife population distributionherefore, wildlife population distribution is also d
ermined by geographical locations and environmal conditions generally. But some specific facuch as urbanization and transportation infrastures, which might negatively contribute to soildlife population distributions, have a positive
ect on human population distribution; other factuch as net primary productivity have a similarect on both human population and wildlife popuion. It seems that grid generation method employeMPD could be used to simulate wildlife populatistribution.
(7), 849–857.oestner, W., 1982. On the geometric precision of digital correla
Int. Arch. Photogrammetr. Remote Sens. 24 (3), 176–189.ruen, A.W., 1985. Adaptive least squares correlation: a pow
image matching technique. S. Afr. J. Photogrammetr. RoSens. Cartogr. 14 (3), 175–188.
eipke, C., 1997. Automation of interior, relative and absoluteentation. ISPRS J. Photogrammetr. Remote Sens. 52, 1–1
u, H.Y., 1983. Discussions on Distribution of Population in ChEastern China Normal University Press, Shanghai (in Chin
u, H.Y., 1935. The distribution of population in China. Acta GeSin. 2 (2), 32–74 (in Chinese).
nstitute of Geography of Chinese Academy of Sciences, 1987Population Atlas of China. Oxford University Press, Hong Ko
nstitute of Population and Labor Economics of CASS, 2001.manac of China’s Population. House of Almanac of China’s Pulation, Beijing (in Chinese).
i, W., Jeske, C., 2000. Spatial modeling of the geographical distion of wildlife populations: a case study in the lower MississRiver region. Ecol. Model. 132, 95–104.
iang, Z.H., 1998. China Population Projection. China’s PopulPress, Beijing (in Chinese).
478 T.X. Yue et al. / Ecological Modelling 181 (2005) 461–478
Jørgensen, S.E., 2002. Integration of Ecosystem Theories: a Pattern.Kluwer Academic Publishers, Dordrecht, pp. 68–71.
Krivan, V., 2003. Idea free distributions when resources un-dergo population dynamics. Theor. Population Biol. 64, 25–38.
Lieth, H., Whittaker, R.H., 1975. Primary Productivity of the Bio-sphere. Springer-Verlag, New York.
Liseikin, V.D., 1999. Grid Generation Methods. Springer-Verlag,Berlin.
Liu, J.Y., Yue, T.X., Wang, Y.A., Qiu, D.S., Liu, M.L., Deng, X.Z.,Yang, X.H., Huang, Y.J., 2003a. Digital simulation of populationdensity in China. Acta Geogr. Sin. 58 (1), 17–24 (in Chinese).
Liu, J.Y., Liu, M.L., Zhuang, D.F., Zhang, Z.X., Deng, X.Z., 2003b.Study on spatial pattern of land-use change in China during1995–2000. Sci. Chin. (Ser. D) 46, 373–384.
Liu, M.L., 2003. Dynamic Responses of Terrestrial Ecosystems toCarbon Cycle Under Impact of Climate Change and Land-useChange in China. Post-Doctoral thesis of Institute of Geograph-ical Sciences and Natural Resources Research of CAS.
Liu, M.L., 2001. Land-use/Land-cover Change and Vegetation Car-bon Pool and Productivity of Terrestrial Ecosystems in China.Doctoral thesis of Institute of Geographical Sciences and Natu-ral Resources Research of CAS.
Lo, C.P., 2001. Modeling the population of China using DMSP op-erational linescan system nighttime data. Photogrammetr. Eng.Remote Sens. 67 (9), 1037–1047.
Mate jıcek, L., Benesova, L., Tonika, J., 2003. Ecological modellingof nitrate pollution in small river basins by spreadsheets and GIS.Ecol. Model. 170, 245–263.
Morrison, D., 1962. Optimal mesh size in the numerical integrationof an ordinary differential equation. J. Assoc. Comput. Machin.9, 98–103.
Moore, I.D., Grayson, R.B., Ladson, A.R., 1992. Digital terrain mod-elling: a review of hydrological, geomorphological, and biologi-cal application. In: Beven, K.J., Moore, I.D. (Eds.), Terrain Anal-
ns,
M olog-rios.
M tch-ans-, 42–
N 001.
P ula-136,
R ina’sjing
S eory.od-
S ulti-
Seppelt, R., Voinov, A., 2002. Optimisation methodology for land usepatterns using spatially explicit landscape models. Ecol. Model.151, 125–142.
Shipley, D.G., 1990. A 3-D finite element mesh generator. In: Creasy,C.F.M., Craggs, C. (Eds.), Applied Surface Modelling. Ellis Hor-wood, New York, pp. 19–24.
Stein, M.L., 1999. Interpolation of Spatial Data. Springer-Verlag Inc,New York.
Sidorov, A.F., 1966. An algorithm for generating optimal numericalgrids. Trudy MIAN USSR 24, 147–151 (in Russian).
Stott, J.P., 1977. Review of surface modelling. In: The Institution ofCivil Engineers Surface (Ed.), Modelling by Computer. ThomasTelford Ltd for The Institution of Civil Engineers, London, pp.1–8.
Sutton, P., Elvidge, C., Obremski, T., 2003. Building and evaluatingmodels to estimate ambient population density. Photogrammetr.Eng. Remote Sens. 69 (5), 545–553.
Sutton, P., Roberts, D., Elvidge, C., Baugh, K., 2001. Census fromHeaven: an estimate of the global human population using night-time satellite imagery. Int. J. Remote Sens. 22 (16), 3061–3076.
Sutton, P., Roberts, D., Elvidge, C., Meij, H., 1997. A comparison ofnighttime satellite imagery and population density for the con-tinental United States. Photogrammetr. Eng. Remote Sens. 63(11), 1303–1313.
Sutton, P., 1997. Modelling population density with night-time satel-lite imagery and GIS. Comput. Environ. Urban Syst. 21 (3/4),227–244.
Tan, G., Shibasaki, R., 2003. Global estimation of crop productivityand the impacts of global warming by GIS and EPIC integration.Ecol. Model. 168, 357–370.
Tobler, W., Deichmann, U., Gottsegen, J., Maloy, K., 1997. Worldpopulation in a grid of spherical quadrilaterals. Int. J. PopulationGeogr. 3, 203–225.
Urban Society and Economy Survey Team of National Bureau ofticalse).
W senomicEcol.
W tribu-odel.
Y ions,ions.ions,
Y ing.
Y .Z.,on
Z ons,
Z Press
ysis and Distributed Modelling in Hydrology. John Wiley & SoChichester, pp. 7–34.
uenier, B., Birr-Pedersen, K., Schou, J.S., 2004. Combined ecical and economic modeling in agricultural land use scenaEcol. Model. 174, 5–18.
ustaffar, M., Mitchell, H.L., 2001. Improved area-dased maing by using surface gradients in the pixel co-ordinate trformation. ISPRS J. Photogrammetr. Remote Sens. 5652.
ational Bureau of Statistics of People’s Republic of China, 2China Statistical Yearbook. China Statistics Press, Beijing.
riya, S., Shibasaki, R., 2001. National spatial crop yield simtion using GIS-based crop production model. Ecol. Model.113–129.
esearch Center for Population of CASS, 1985. Almanac of ChPopulation. House of Almanac of China’s Population, Bei(in Chinese).
abin, M., 1990. Commutative surprises in curve and surface thIn: Creasy, C.F.M., Craggs, C. (Eds.), Applied Surface Melling. Ellis Horwood, New York, pp. 9–18.
arti, A., Tubaro, S., 2002. Image-based surface modeling: a mresolution approach. Signal Process. 82, 1215–1232.
Statistics of People’s Republic of China, 2001. Urban StatisYearbook of China. China Statistics Press, Beijing (in Chine
eber, A., Fohrer, N., Moller, D., 2001. Long-term land uchanges in a mesoscale watershed due to socio-ecofactors—effects on landscape structures and functions.Model. 140, 125–140.
esterberg, L., Wennergren, U., 2003. Predicting the spatial distion of a population in a heterogeneous landscape. Ecol. M166, 53–65.
ear Book House of China Transportation and Communicat2001. Year Book of China Transportation and CommunicatYear Book House of China Transportation and CommunicatBeijing (in Chinese).
ue, T.X., Du, Z.P., Liu, J.Y., 2004. High precision surface modellProg. Nat. Sci. 14 (2), 83–89 (in Chinese).
ue, T.X., Wang, Y.A., Chen, S.P., Liu, J.Y., Qiu, D.S., Deng, XLiu, M.L., Tian, Y.Z., 2003. Numerical simulation of populatidistribution in China. Population Environ. 25 (2), 141–163.
hao, S.Q., 1986. Physical Geography of China. John Wiley & SNew York.
hang, S.Y., 1997. Population Geography of China. BusinessHouse, Beijing (in Chinese).