Embed Size (px)
Citation preview
S1
Supporting Information
Surface Plasmon Enabling Nitrogen Fixation in Pure Water
through a Dissociative Mechanism under Mild Conditions
Canyu Hu,†,‡ Xing Chen,¶,‡ Jianbo Jin,†,‡ Yong Han,§ Shuangming Chen,†
Huanxin Ju,† Jun Cai,§,¦ Yunrui Qiu,† Chao Gao,† Chengming Wang,†
Zeming Qi,† Ran Long,†,* Li Song,† Zhi Liu,§,¦ and Yujie Xiong†,*
†Hefei National Laboratory for Physical Sciences at the Microscale, Collaborative
Innovation Center of Chemistry for Energy Materials (iChEM), School of Chemistry
and Materials Science, and National Synchrotron Radiation Laboratory, University of
Science and Technology of China, Hefei, Anhui 230026, P. R. China.
¶Department of Chemistry, Pennsylvania State University, University Park,
Pennsylvania 16802, United States.
§School of Physical Science and Technology, Shanghai Tech University, Shanghai
201203, China.
¦State Key Laboratory of Functional Materials for Informatics, Shanghai Institute of
Microsystem and Information Technology, Chinese Academy of Sciences, Shanghai
200050, P. R. China.
*Corresponding author. E-mail: [email protected]; [email protected]
‡These authors contributed equally.
S2
1. Experimental materials:
Ruthenium(III) chloride hydrate (RuCl3·xH2O, 35.0-42.0% Ru basis) was obtained
from Aladdin. Gold(III) chloride tetrahydrate (HAuCl4·4H2O, 99.95%), diethylene
glycol (C4H10O3, DEG, 99.0%) and acetone (C3H6O, 99.5%) were purchased from
Sinopharm Chemical Reagent Co., Ltd. Polyvinyl pyrrolidone (PVP, average M.W. =
40000) was obtained from Sigma-Aldrich. The water used in all experiments was
deionized (DI). All the chemical reagents were used without further purification.
2. Experimental procedures:
Synthesis of AuRux. AuRux nanostructures were synthesized by following similar
procedures to AuRu0.31 except for the difference in the concentration of RuCl3·xH2O as
well as the usage volume and injection speed of the precursor solution. The
experimental parameters were set as follows: 1) 4 mL precursor solution containing
5.23 mg RuCl3·xH2O and 10.39 mg HAuCl4·4H2O was injected at a rate of 1.2 mL·min-
1 for AuRu0.39; 2) 3.7 mL precursor solution containing 2.62 mg RuCl3·xH2O and 10.39
mg HAuCl4·4H2O was injected at a rate of 1.5 mL·min-1 for AuRu0.23; 3) 3.5 mL
precursor solution containing 1.31 mg RuCl3·xH2O and 10.39 mg HAuCl4·4H2O was
injected at a rate of 1.8 mL·min-1 for AuRu0.14; 4) 3.5 mL precursor solution without
RuCl3·xH2O was injected at a rate of 1.8 mL·min-1 for Au nanoparticles.
3. Instrumentation:
Transmission electron microscopy (TEM) images were taken on a Hitachi Model H-
7700 microscopy at an accelerating voltage of 100 kV. High-resolution transmission
electron microscopy (HRTEM) images and energy dispersive spectroscopy (EDS)
mapping profiles were recorded on a JEOL JEM-2100F field-emission high resolution
transmission electron microscope at an accelerating voltage of 200 kV.
Powder X-ray diffraction (XRD) patterns were collected using a Japan Rigaku DMax-
γA rotation anode X-ray diffractometer equipped with graphite monochromatized Cu
S3
Kα radiation (λ = 1.54178 Å).
The concentrations of elements were measured with a Thermo Scientific PlasmaQuad
3 inductively-coupled plasma mass spectrometry (ICP-MS) after ultrasonic dissolution
with hot Aqua regia.
Ultraviolet-visible (UV-vis) extinction spectra were collected in the spectral region of
200-800 nm with an Agilent Technologies Cary 60 spectrometer. The samples were
dispersed and diluted with DI water to the same concentration before measurement.
4. ESR measurements:
50 µL of aqueous suspension of nanostructures (1 mg/mL for AuRu0.31) was mixed with
500 µL of spin-trapping agent solution (50 mM). The solution was then characterized
with a JES-FA200 electron spin resonance (ESR) spectroscopy at 20C. The
measurements were performed in different chemical environments and incident light
conditions. The Xe lamp irradiation experiment was carried out by USHIO Optical
Modulex SX-U1501XQ (500 W).
5. First-Principles Simulations:
The geometry optimization was performed using the Becke-Perdew (BP86) functional
and Slater-type orbitals represented by double-𝛇 polarized (DZP) functions with large
frozen cores. The relativistic effects were taken into account by means of the scalar
Zero Order Regular Approximation (ZORA).S1-S3 The electron densities were
calculated at the level of BP86/TZP. The unrestricted spin-polarized density
functional theory (DFT) was employed to treat the open-shell system. All calculations
were carried out by the Amsterdam Density Functional (ADF) program package.S4
6. XAFS characterization:
Au L3-edge and Ru K-edge X-ray absorption fine structure (XAFS) measurements were
S4
performed at the beamline 14W1 in Shanghai Synchrotron Radiation Facility (SSRF),
China. The X-ray was monochromatized by a double-crystal Si (311) monochromator.
The storage ring of SSRF was operated at 3.5 GeV with the current of 300 mA. The
acquired extended XAFS (EXAFS) data were processed according to the standard
procedures using the WinXAS3.1 program.S5 Theoretical amplitudes and phase-shift
functions were calculated with the FEFF8.2 code using the crystal structural parameters
of the Au foil and Ru foil.S6
S5
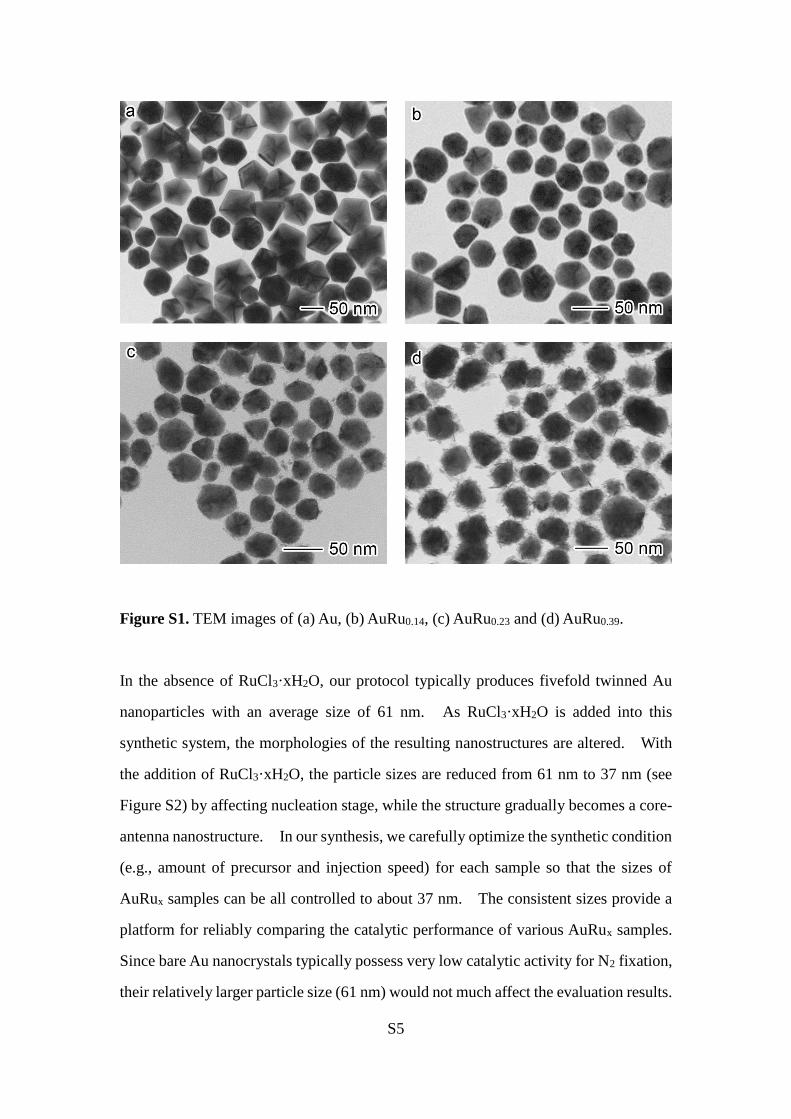
Figure S1. TEM images of (a) Au, (b) AuRu0.14, (c) AuRu0.23 and (d) AuRu0.39.
In the absence of RuCl3·xH2O, our protocol typically produces fivefold twinned Au
nanoparticles with an average size of 61 nm. As RuCl3·xH2O is added into this
synthetic system, the morphologies of the resulting nanostructures are altered. With
the addition of RuCl3·xH2O, the particle sizes are reduced from 61 nm to 37 nm (see
Figure S2) by affecting nucleation stage, while the structure gradually becomes a core-
antenna nanostructure. In our synthesis, we carefully optimize the synthetic condition
(e.g., amount of precursor and injection speed) for each sample so that the sizes of
AuRux samples can be all controlled to about 37 nm. The consistent sizes provide a
platform for reliably comparing the catalytic performance of various AuRux samples.
Since bare Au nanocrystals typically possess very low catalytic activity for N2 fixation,
their relatively larger particle size (61 nm) would not much affect the evaluation results.
S6
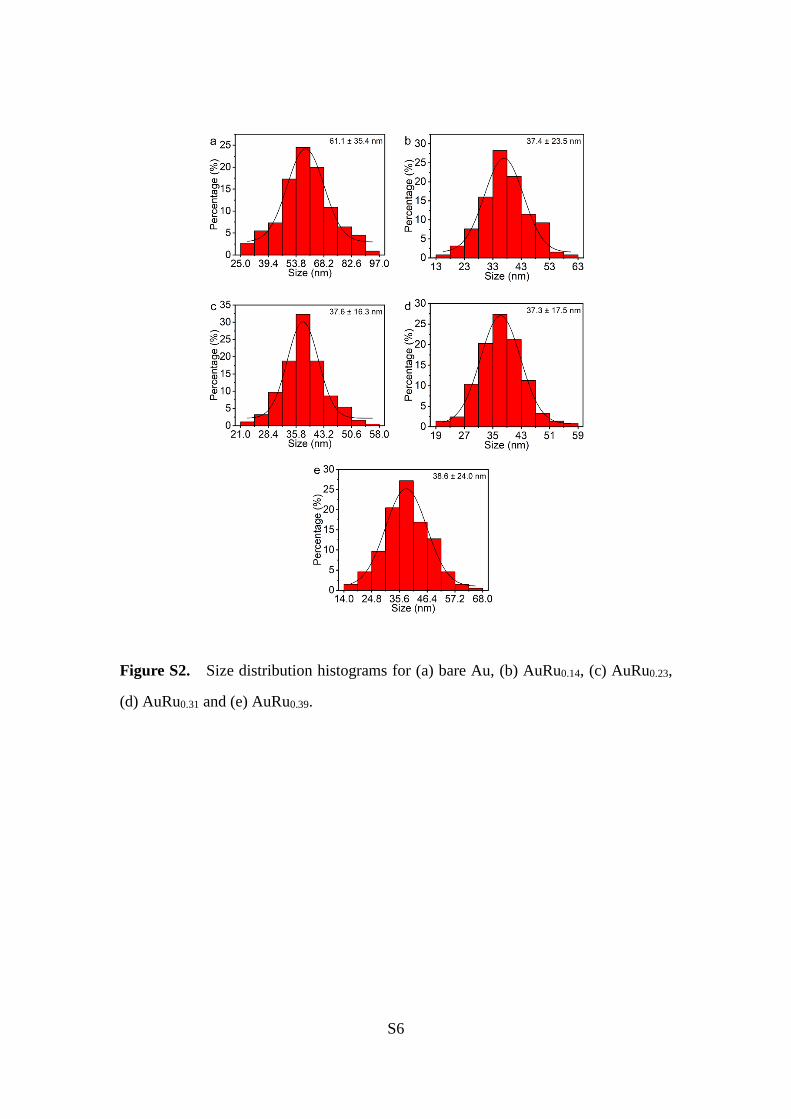
Figure S2. Size distribution histograms for (a) bare Au, (b) AuRu0.14, (c) AuRu0.23,
(d) AuRu0.31 and (e) AuRu0.39.
S7
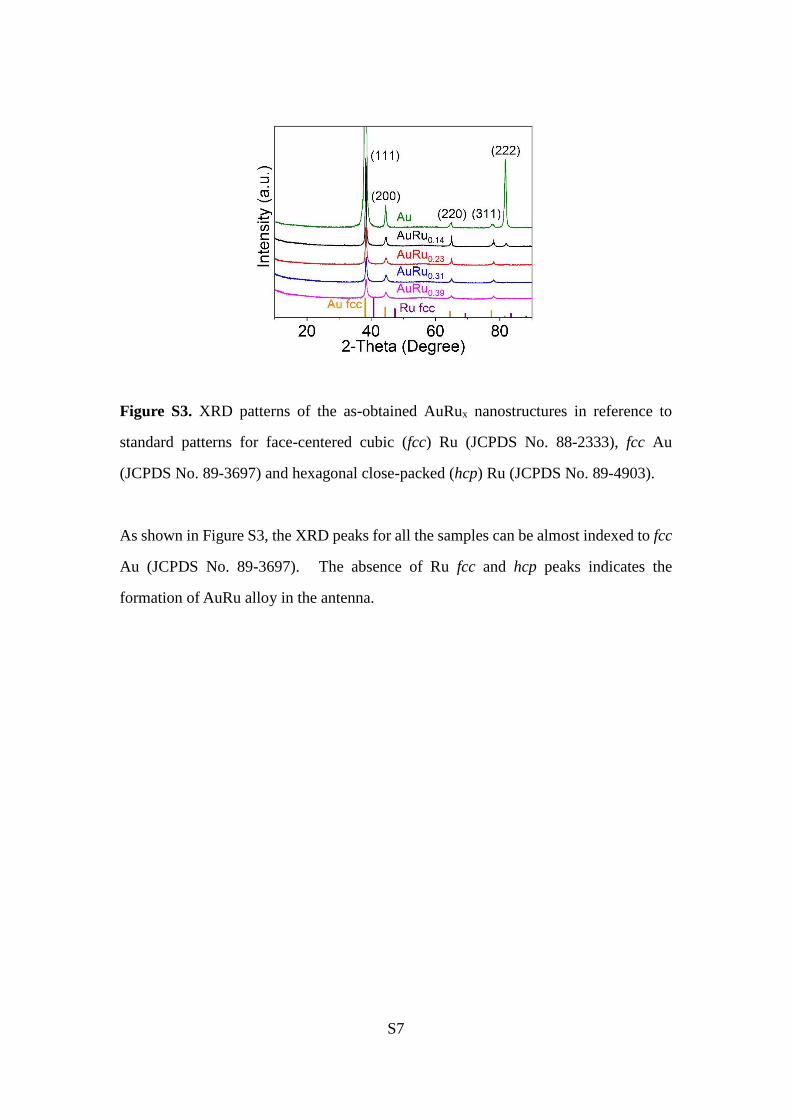
Figure S3. XRD patterns of the as-obtained AuRux nanostructures in reference to
standard patterns for face-centered cubic (fcc) Ru (JCPDS No. 88-2333), fcc Au
(JCPDS No. 89-3697) and hexagonal close-packed (hcp) Ru (JCPDS No. 89-4903).
As shown in Figure S3, the XRD peaks for all the samples can be almost indexed to fcc
Au (JCPDS No. 89-3697). The absence of Ru fcc and hcp peaks indicates the
formation of AuRu alloy in the antenna.
S8
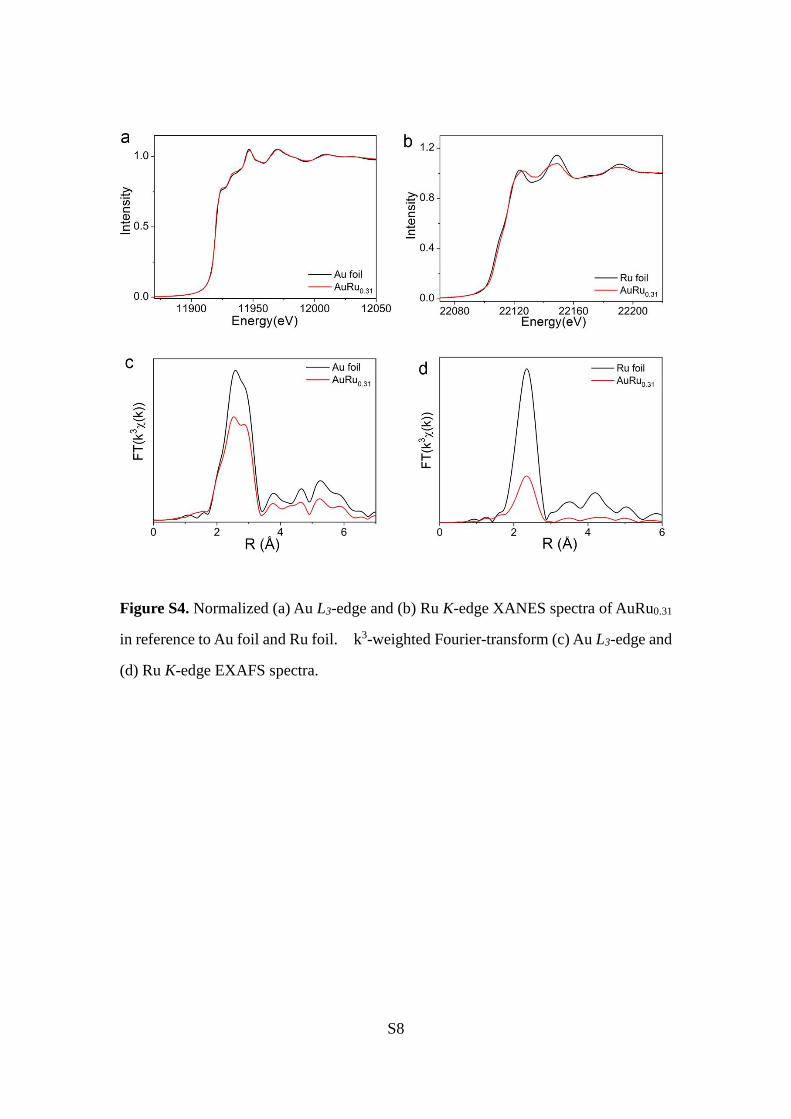
Figure S4. Normalized (a) Au L3-edge and (b) Ru K-edge XANES spectra of AuRu0.31
in reference to Au foil and Ru foil. k3-weighted Fourier-transform (c) Au L3-edge and
(d) Ru K-edge EXAFS spectra.
S9
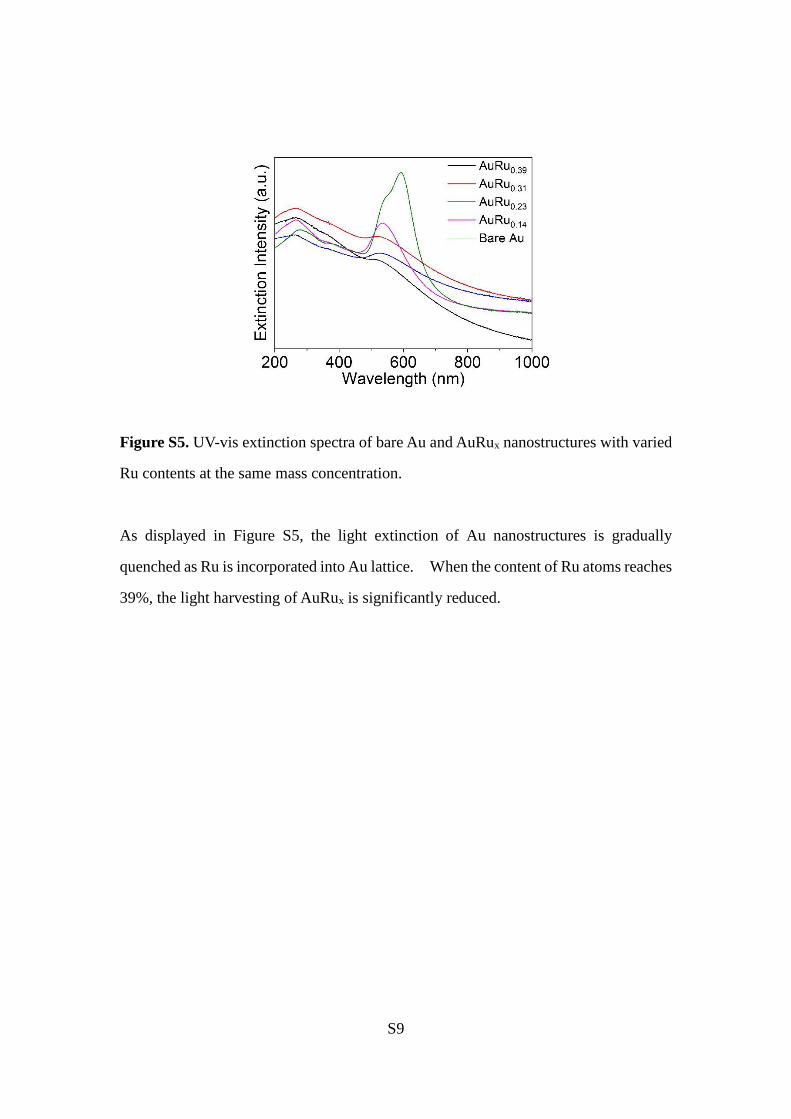
Figure S5. UV-vis extinction spectra of bare Au and AuRux nanostructures with varied
Ru contents at the same mass concentration.
As displayed in Figure S5, the light extinction of Au nanostructures is gradually
quenched as Ru is incorporated into Au lattice. When the content of Ru atoms reaches
39%, the light harvesting of AuRux is significantly reduced.
S10
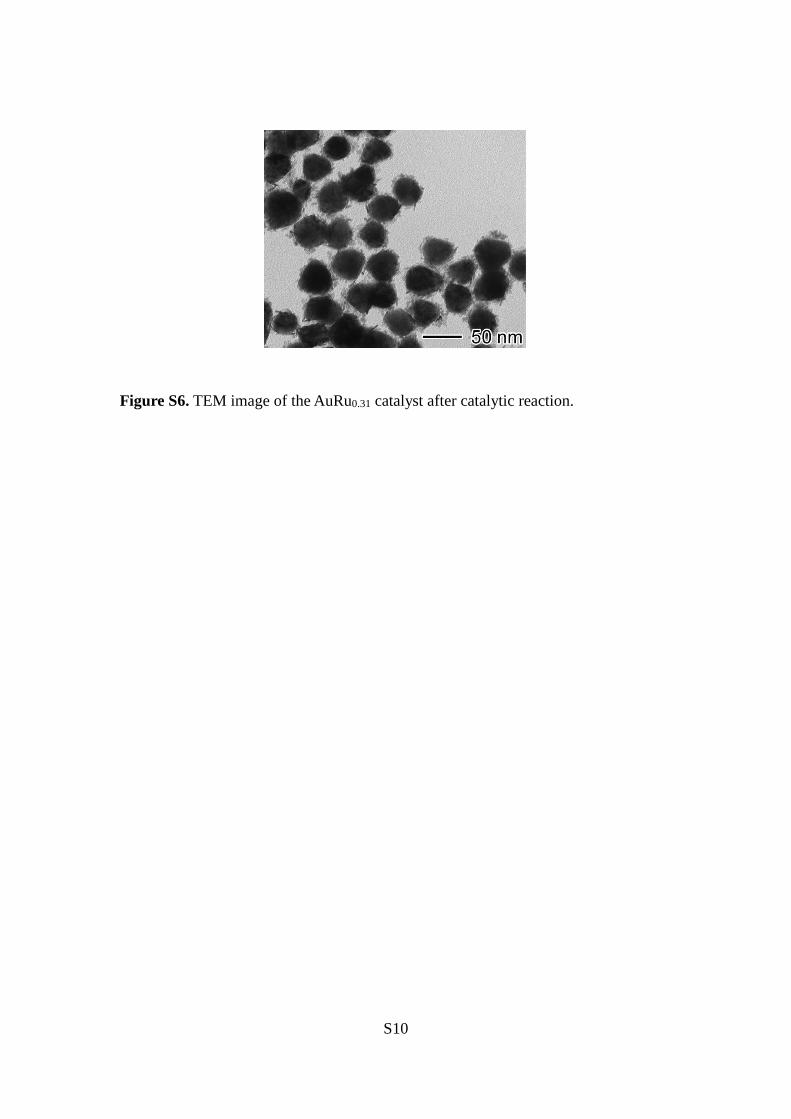
Figure S6. TEM image of the AuRu0.31 catalyst after catalytic reaction.
S11
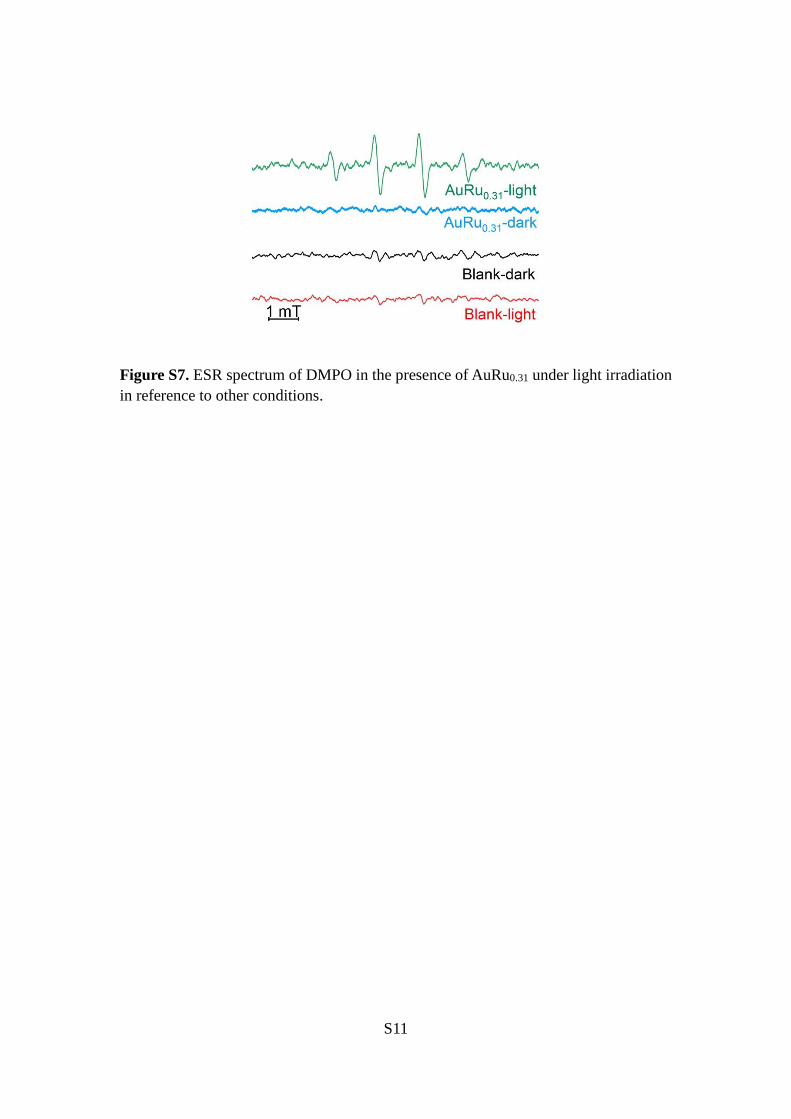
Figure S7. ESR spectrum of DMPO in the presence of AuRu0.31 under light irradiation
in reference to other conditions.
S12
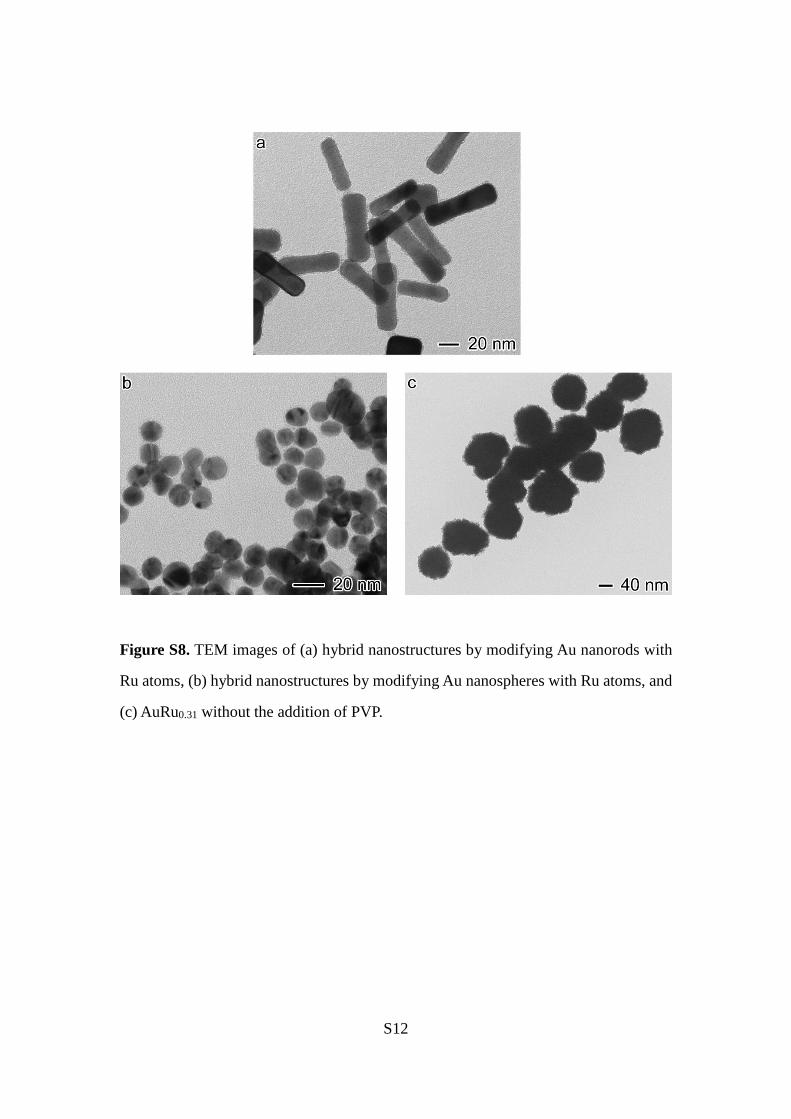
Figure S8. TEM images of (a) hybrid nanostructures by modifying Au nanorods with
Ru atoms, (b) hybrid nanostructures by modifying Au nanospheres with Ru atoms, and
(c) AuRu0.31 without the addition of PVP.
S13
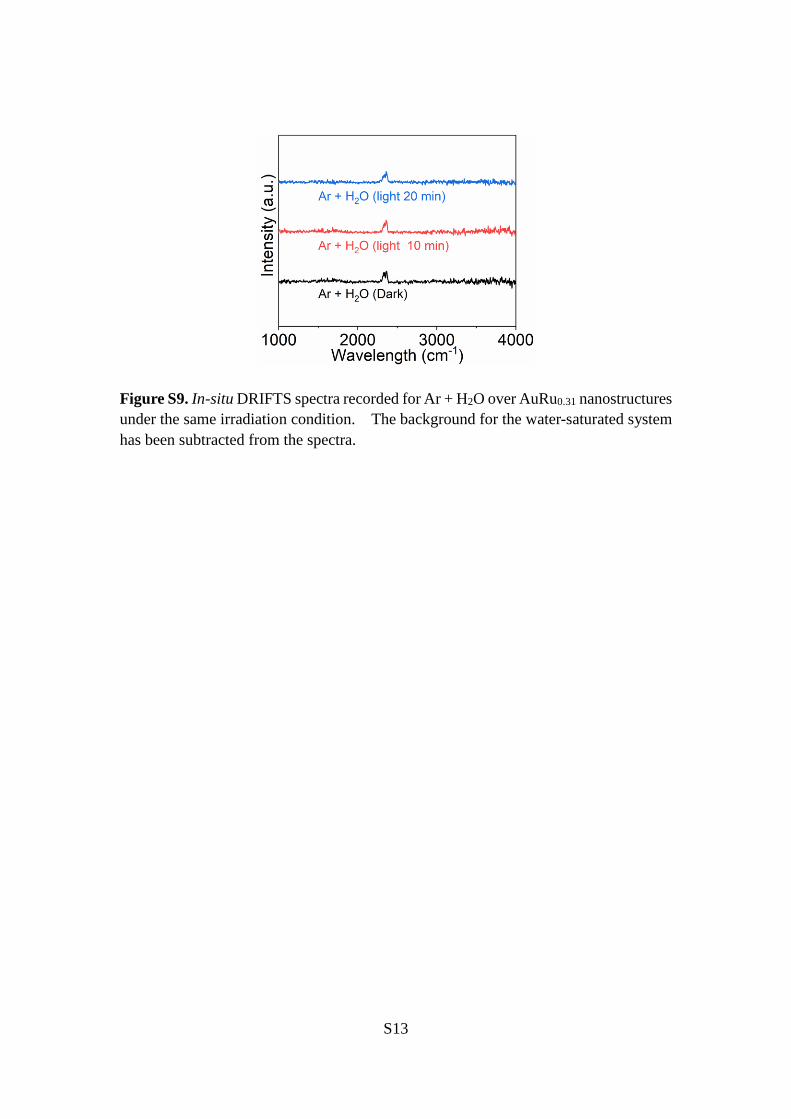
Figure S9. In-situ DRIFTS spectra recorded for Ar + H2O over AuRu0.31 nanostructures
under the same irradiation condition. The background for the water-saturated system
has been subtracted from the spectra.

S14
Figure S10. DRIFTS spectra recorded for H2O adsorbed on sample surface. The
background for the fully dried sample has been subtracted from the spectra.
Figure S10 shows that the absorption bands of H2O are located at 1625-1800 and 3420-
3850 cm-1, which are obviously different from the absorption band of ammonia at 3000-
3600 cm-1 and NH4+ at 1404 cm-1.
S15
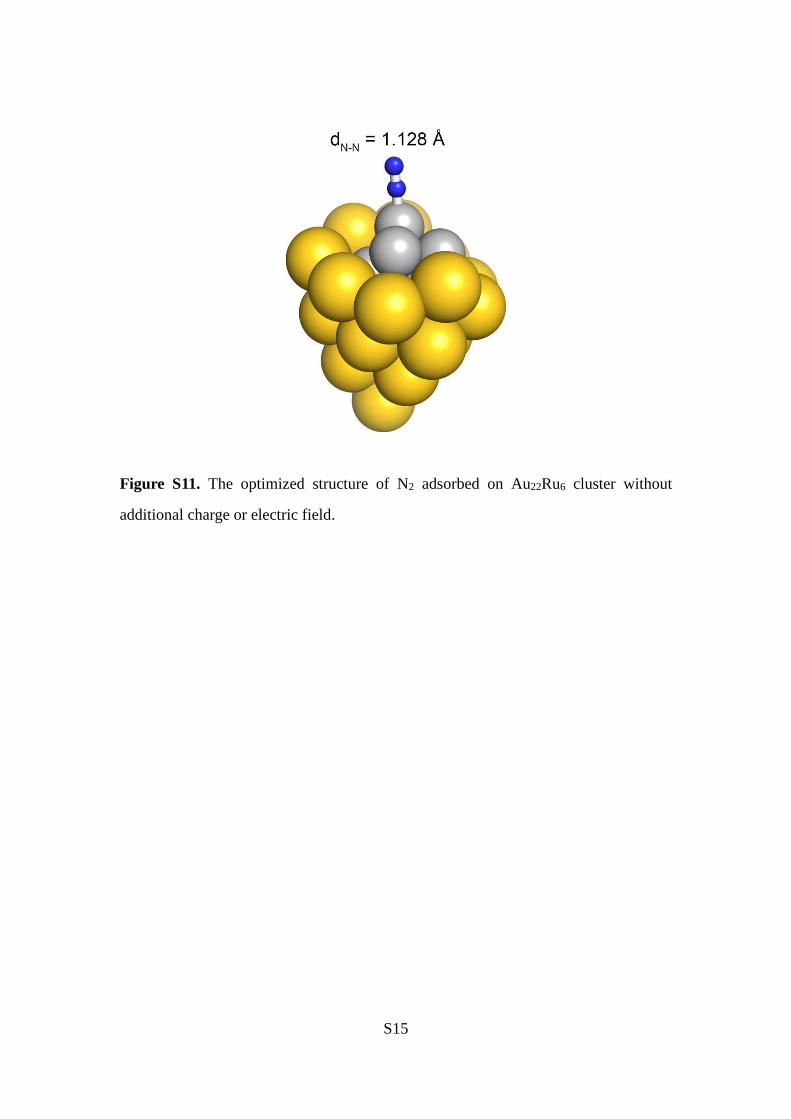
Figure S11. The optimized structure of N2 adsorbed on Au22Ru6 cluster without
additional charge or electric field.
S16
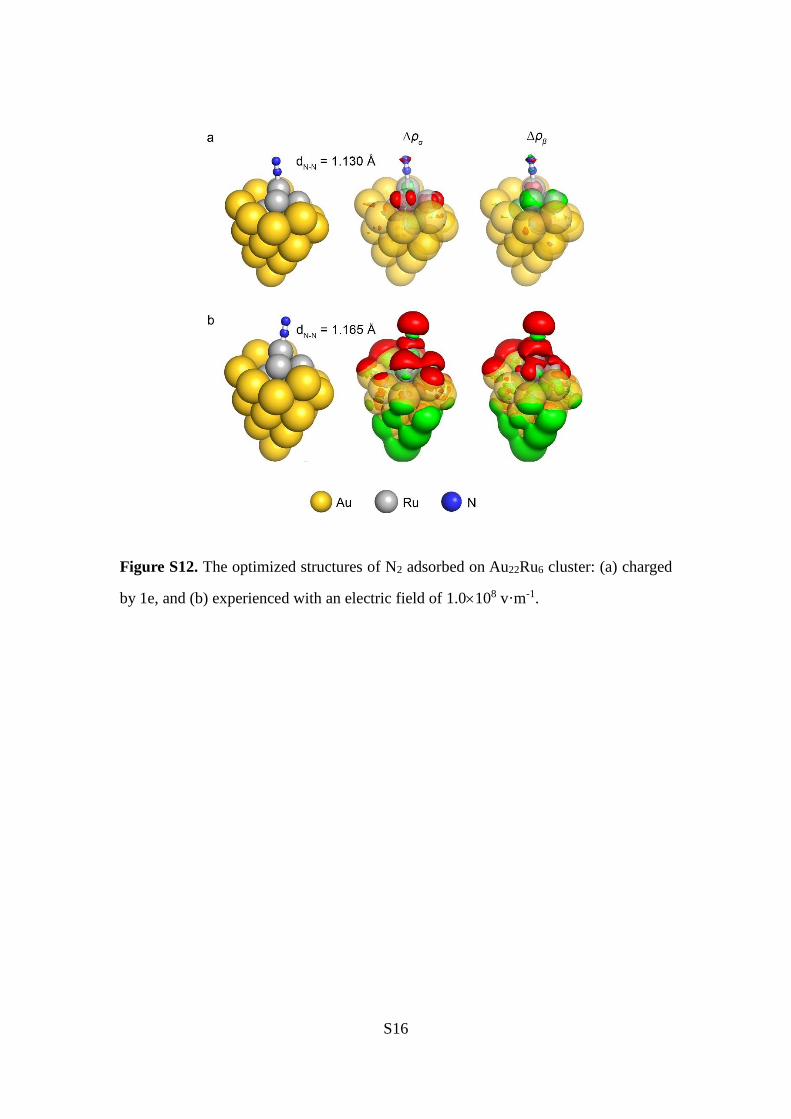
Figure S12. The optimized structures of N2 adsorbed on Au22Ru6 cluster: (a) charged
by 1e, and (b) experienced with an electric field of 1.0108 v·m-1.
S17
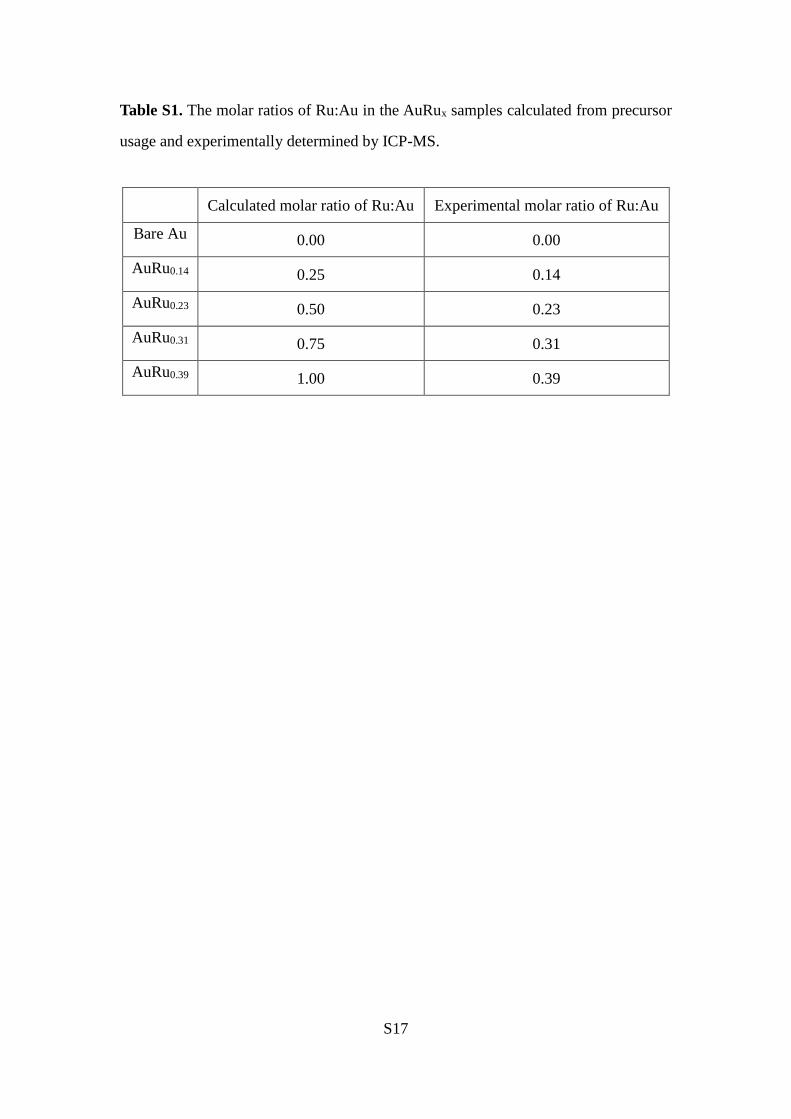
Table S1. The molar ratios of Ru:Au in the AuRux samples calculated from precursor
usage and experimentally determined by ICP-MS.
Calculated molar ratio of Ru:Au Experimental molar ratio of Ru:Au
Bare Au 0.00 0.00
AuRu0.14 0.25 0.14
AuRu0.23 0.50 0.23
AuRu0.31 0.75 0.31
AuRu0.39 1.00 0.39
S18
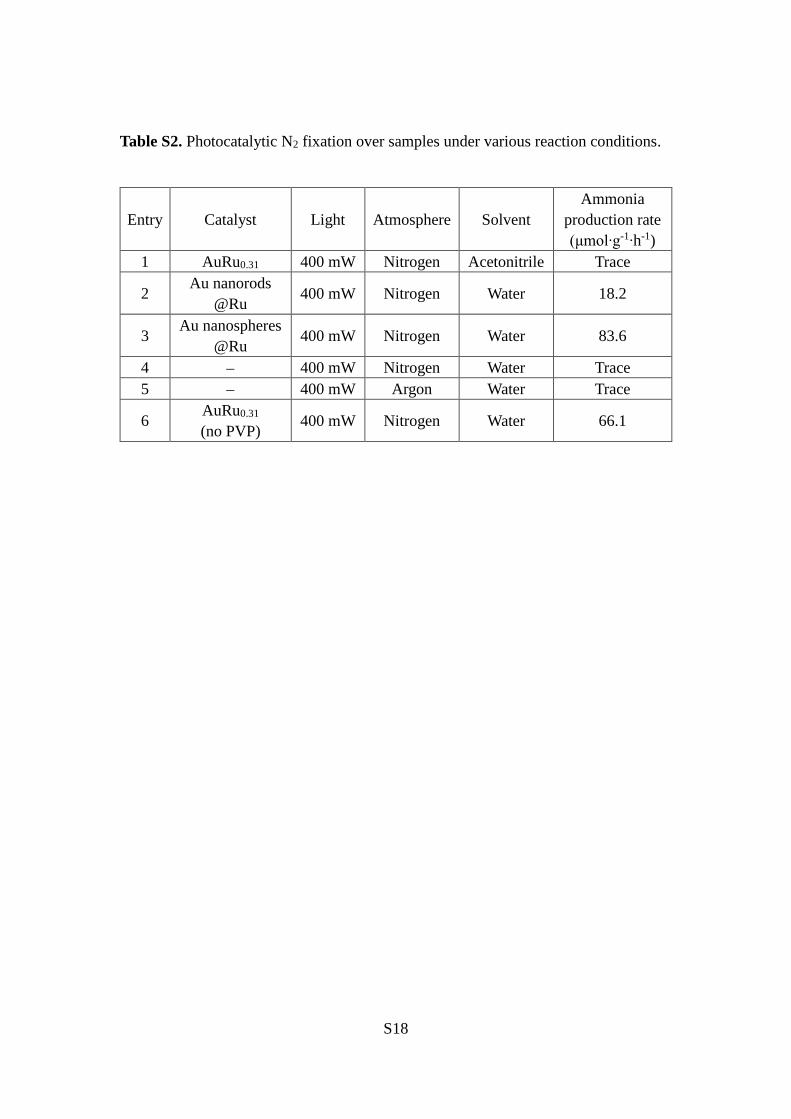
Table S2. Photocatalytic N2 fixation over samples under various reaction conditions.
Entry Catalyst Light Atmosphere Solvent
Ammonia
production rate
(μmol∙g-1∙h-1)
1 AuRu0.31 400 mW Nitrogen Acetonitrile Trace
2 Au nanorods
@Ru 400 mW Nitrogen Water 18.2
3 Au nanospheres
@Ru 400 mW Nitrogen Water 83.6
4 400 mW Nitrogen Water Trace
5 400 mW Argon Water Trace
6 AuRu0.31
(no PVP) 400 mW Nitrogen Water 66.1
S19
References:
S1. van Lenthe, E.; Baerends, E. J.; Snijders, J. G. Relativistic Regular Two-component
Hamiltonians. J. Chem. Phys. 1993, 99, 4597.
S2. van Lenthe, E.; Baerends, E. J.; Snijders, J. G. Relativistic Total Energy Using
Regular Approximations. J. Chem. Phys. 1994, 101, 9783.
S3. van Lenthe, E.; Ehlers, A.; Baerends, E.-J. Geometry Optimizations in the Zero
Order Regular Approximation for Relativistic Effects. J. Chem. Phys. 1999, 110,
8943.
S4. te Velde, G.; Bickelhaupt, F. M.; Baerends, E. J.; Fonseca Guerra, C.; van
Gisbergen, S. J. A.; Snijders, J. G.; Ziegler, T. Chemistry with ADF. J. Comput.
Chem. 2001, 22, 931.
S5. Ressler, T. WinXAS: a Program for X-ray Absorption Spectroscopy Data Analysis
under MS-Windows. J. Synchrotron Radiat. 1998, 5, 118.
S6. Ankudinov, A. L.; Ravel, B.; Rehr, J. J.; Conradson, S. D. Real-space Multiple-
Scattering Calculation and Interpretation of X-ray-absorption Near-edge Structure.
Phys. Rev. B 1998, 58, 7565.