Embed Size (px)
Citation preview
Surface plasmon resonanceon conducting metal oxides
NC State University
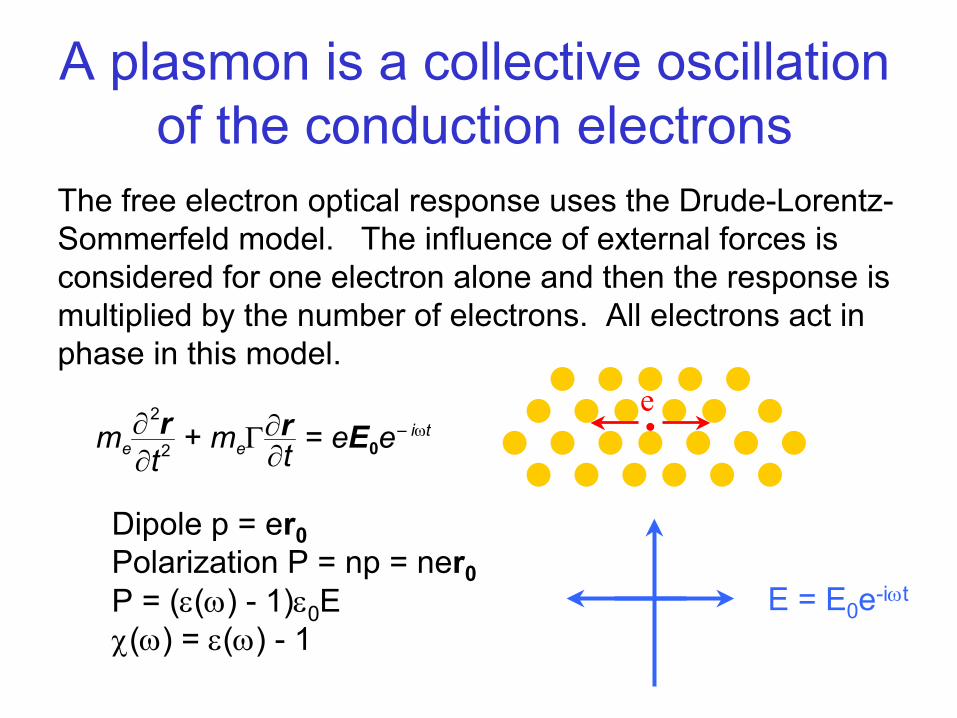
A plasmon is a collective oscillation of the conduction electrons
The free electron optical response uses the Drude-Lorentz-Sommerfeld model. The influence of external forces is considered for one electron alone and then the response is multiplied by the number of electrons. All electrons act in phase in this model.
me∂2r∂t2
+ meΓ∂r∂t = eE0e– iωt
e
E = E0e-iωt
Dipole p = er0Polarization P = np = ner0P = (ε(ω) - 1)ε0Eχ(ω) = ε(ω) - 1
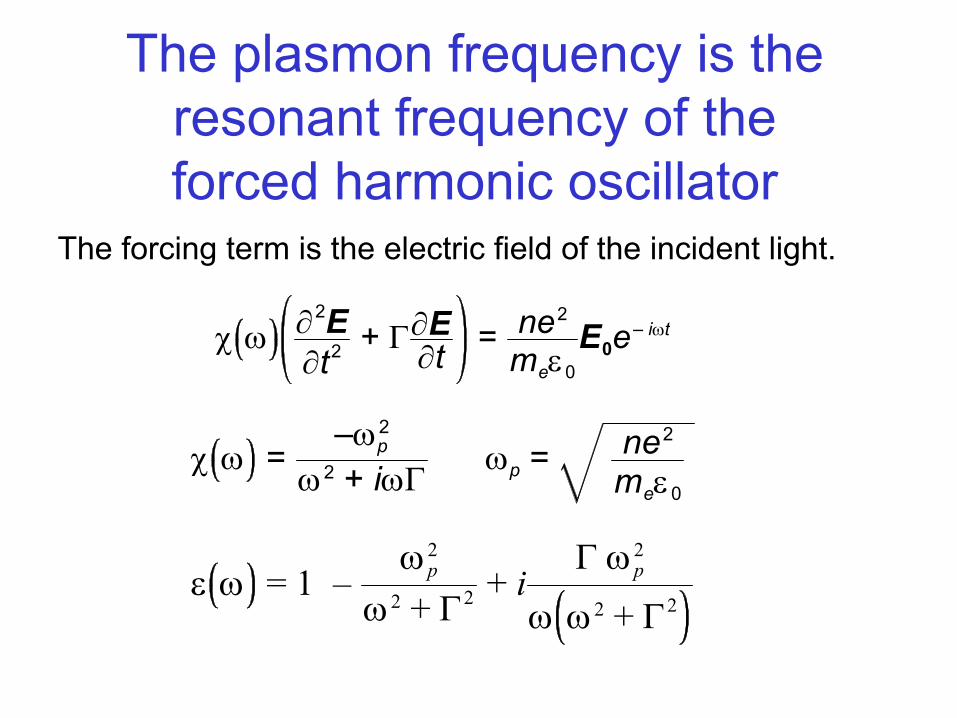
The plasmon frequency is the resonant frequency of the forced harmonic oscillator
The forcing term is the electric field of the incident light.
χ ω ∂2E∂t2
+ Γ∂E∂t = ne2
meε0E0e– iωt
χ ω =–ωp
2
ω2 + iωΓ ωp = ne2
meε0
ε ω = 1 –ωp
2
ω2 + Γ2 + iΓ ωp
2
ω ω2 + Γ2
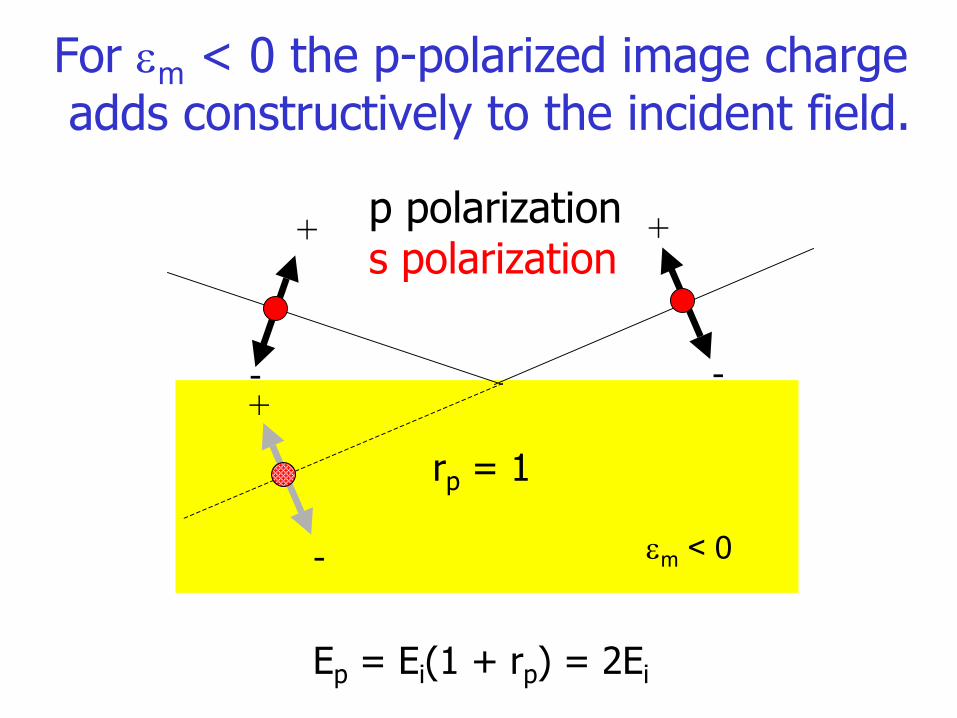
For εm < 0 the p-polarized image chargeadds constructively to the incident field.
p polarizations polarization
+
+-
-
Ep = Ei(1 + rp) = 2Ei
rp = 1
-
+
εm < 0
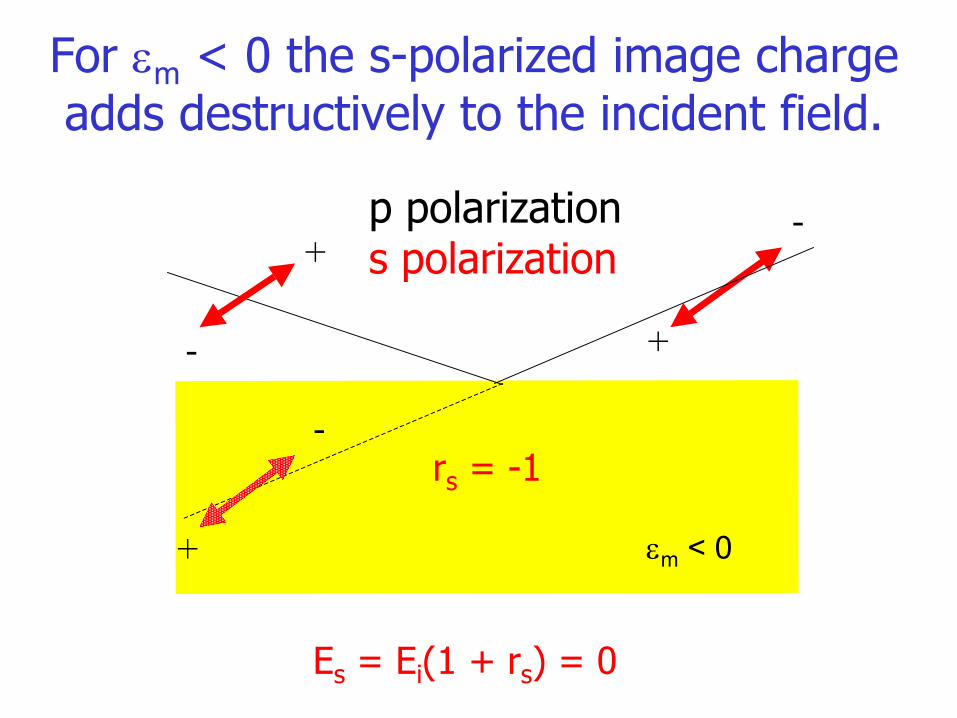
For εm < 0 the s-polarized image chargeadds destructively to the incident field.
p polarizations polarization+
+
-
-
+
-
Es = Ei(1 + rs) = 0
rs = -1
εm < 0
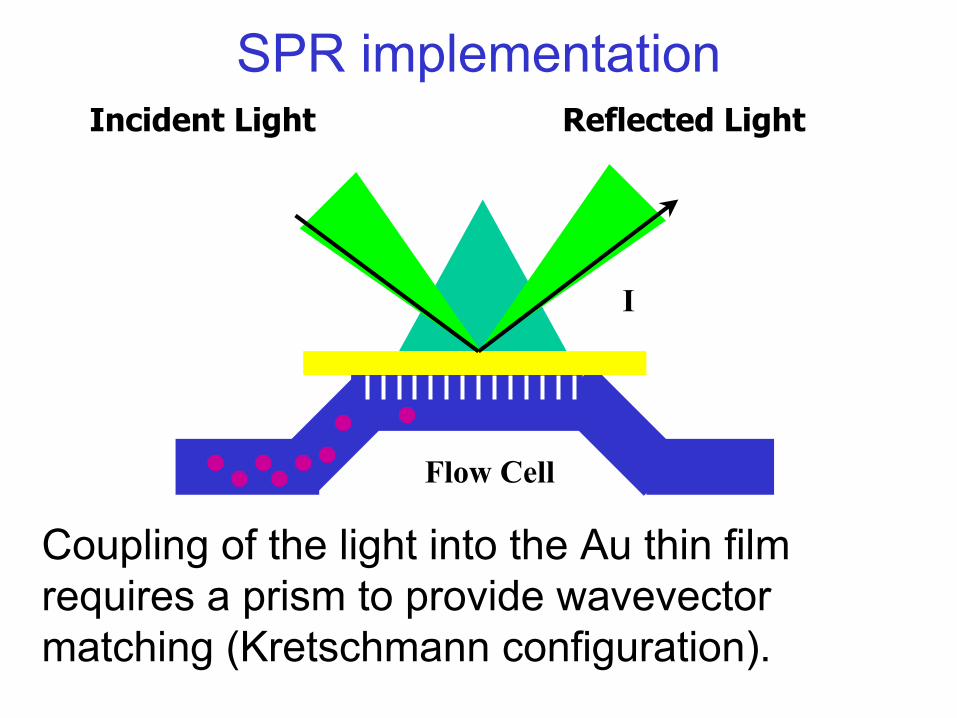
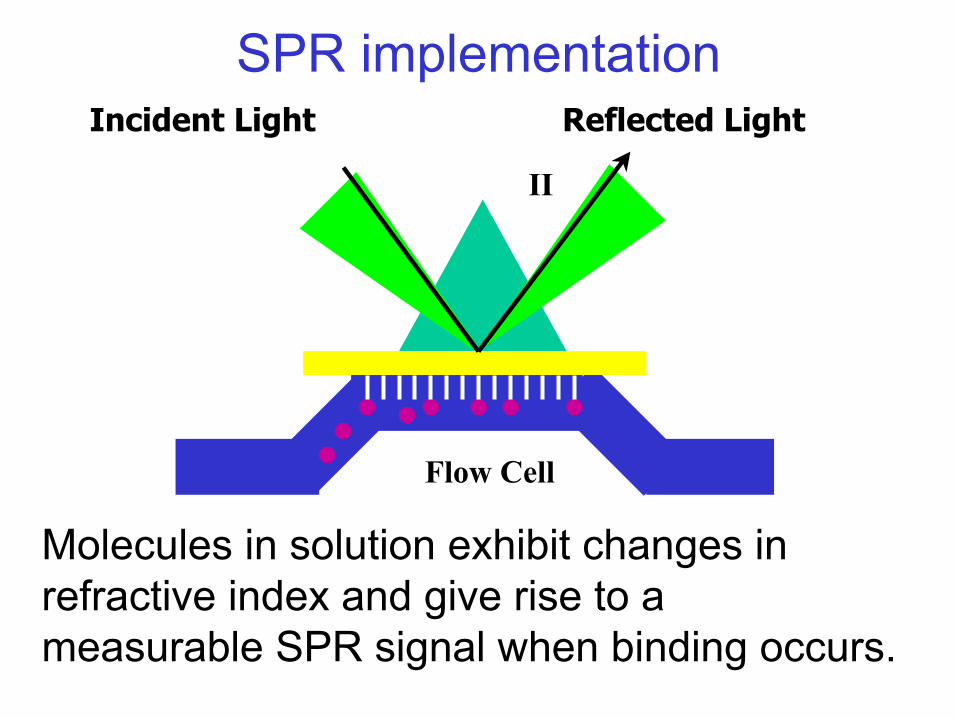
SPR implementation
I
Flow Cell
Coupling of the light into the Au thin film requires a prism to provide wavevectormatching (Kretschmann configuration).
Reflected LightIncident Light
II
Incident Light Reflected Light
Flow Cell
SPR implementation
Molecules in solution exhibit changes in refractive index and give rise to a measurable SPR signal when binding occurs.

Plasmon bands for different indices of refraction
Angle-dependent absorption calculated for a thin Au film
Brockman et al.Ann. Rev. Phys. Chem. 2000

Self-Assembly of12-phosphododecanoic acidon a surface of In28Sn4O48
(10.12 Å x 10.12 Å x 28.00 Å)
Monolayer with carboxylate head groups
for functionalization
3 unit cells are shown

Reflectance FTIR spectra of 12-Phosphonododecanoic Acid on ITO
1.0
0.8
0.6
0.4
0.2
0.0
Abs
orba
nce
(x10
-3)
31003000290028002700
Wavenumbers (cm-1)1.0
0.8
0.6
0.4
0.2
0.0
Abs
orba
nce
(x10
-3)
1850180017501700165016001550
Wavenumbers (cm-1)
Deposited from DMSO:CH2 stretches 2858 (symmetric)2926 (asymmetric) cm-1
Deposited from 50/50 (v/v)
DMSO/18MΩ H2O :CH2 stretches2848 (symmetric)2922 (asymmetric) cm-1
C=O stretch at 1716 cm-1
Brewer, Brown and FranzenLangmuir 2002, 18, 6857
0.8
0.6
0.4
0.2
0.0
Ref
lect
ance
, Pow
er R
efle
ctiv
ity
1210864
Wavenumbers (x103) (cm-1)
7.6
13.8
9.7
experiment theory
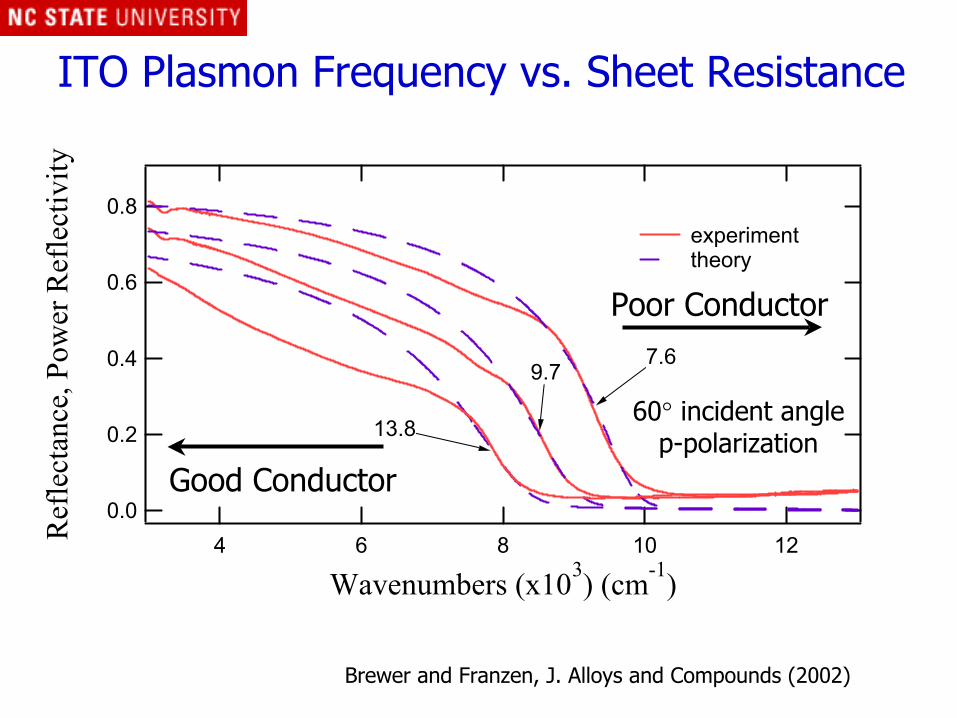
ITO Plasmon Frequency vs. Sheet Resistance
60° incident anglep-polarization
Good Conductor
Poor Conductor
Brewer and Franzen, J. Alloys and Compounds (2002)
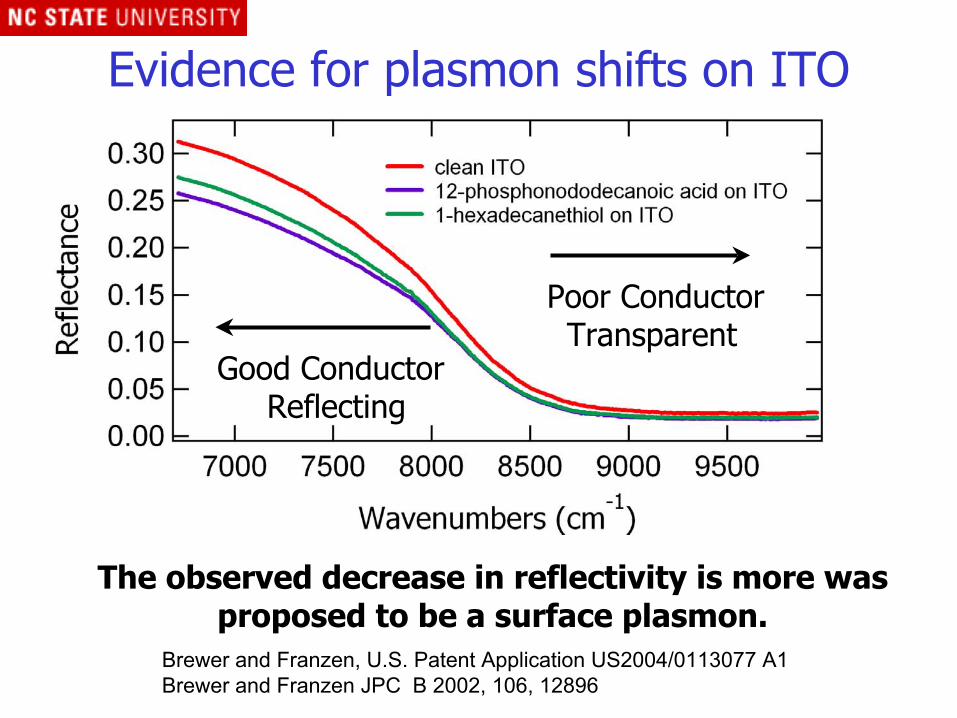
Evidence for plasmon shifts on ITO
The observed decrease in reflectivity is more was proposed to be a surface plasmon.
Poor ConductorTransparent
Good ConductorReflecting
Brewer and Franzen, U.S. Patent Application US2004/0113077 A1Brewer and Franzen JPC B 2002, 106, 12896

k+ = – k x2 – (ω/c)2εs
k– = k x2 – (ω/c)2εm
k–εs – k+εm = 0
The coupled fields inside (-) and outside (+) the solids are givenby:
where
The electric field of the surface plasmon (SP) represents a harmonic wave along the surface with a frequency w and awave vector kx, while perpendicular to the surface (z-direction)the fields are exponentially decaying. The boundary conditions require that:
E± x,z,t = E0±exp [i(k xx – ωt)]exp – k±z
The electric field at the interface

εm is the dielectric constant of the metalεs is the dielectric constant of the substrate
For the metal the dielectric constant is complexand can be derived from the index of refraction.
k sp = ωc
εm ω εs ω
εm ω + εs ω
The SPR Dispersion Relation
ε = ε′ + iε′′ , N = n + ikε = N2 = n2 – k2 + i2nkε′ = n2 – k2 , ε′′ = 2nk
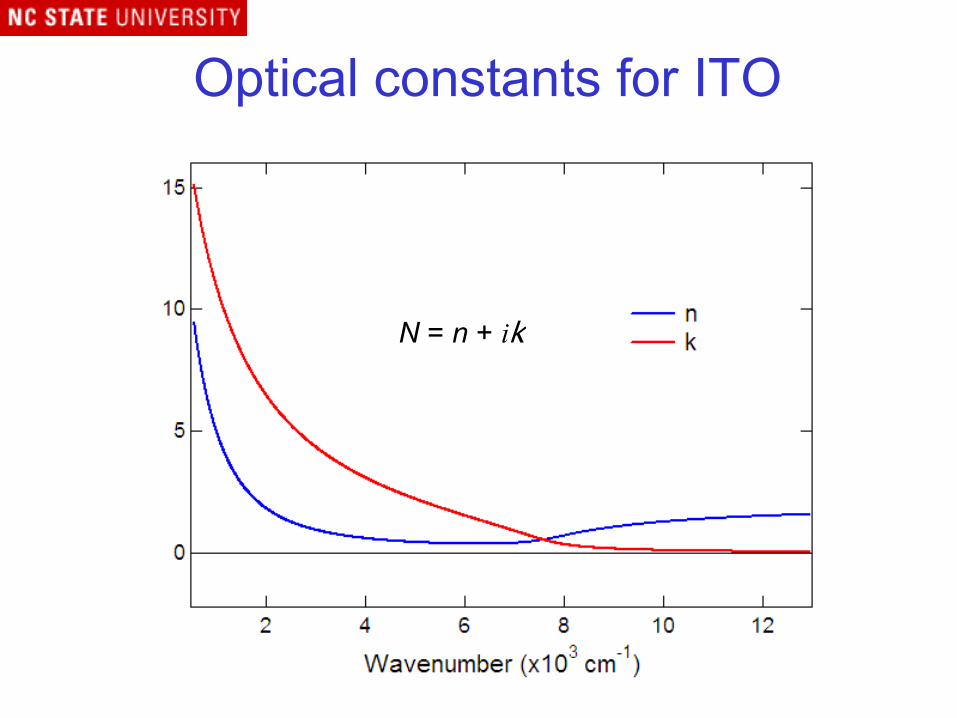
Optical constants for ITO
N = n + ik
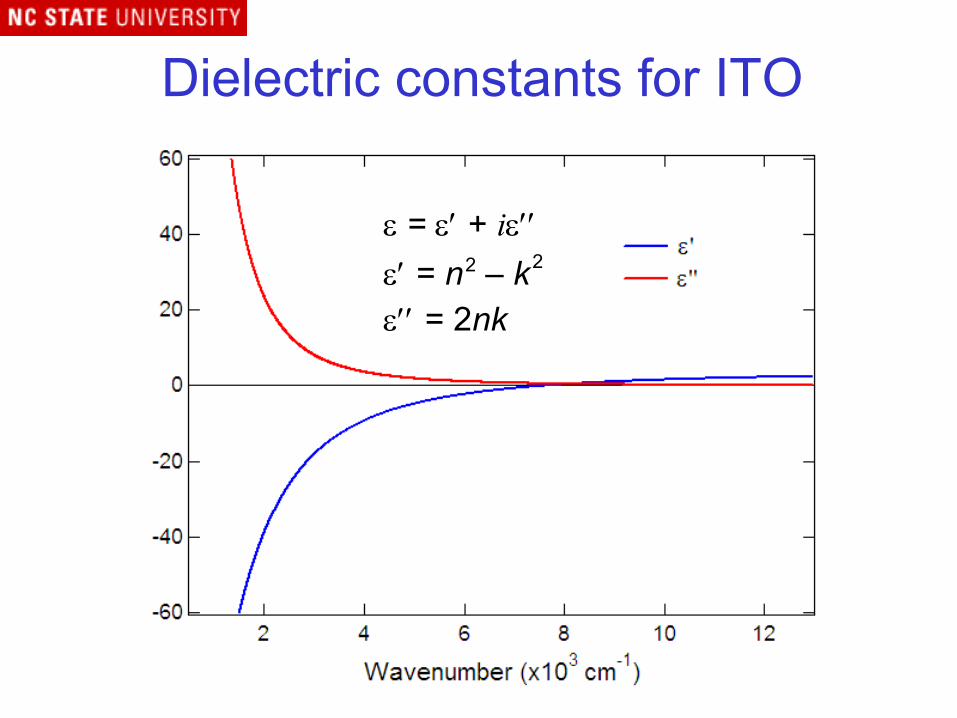
Dielectric constants for ITO
ε = ε′ + iε′′ε′ = n2 – k2
ε′′ = 2nk

ITO Dispersion Curve
k sp = ωc
εm ω εs ω
εm ω + εs ω

Instrumentation
GWC Modular Attachment for FT-SPRMany thanks to Steve Weibel and Thermo/Nicolet

2-D spectralComparison of ITO and Au
A. The dark swathrepresents the angle-dependent absorptiondue to ωsp. B. The feature at B isBelow the critical angle.We believe that this isωp.
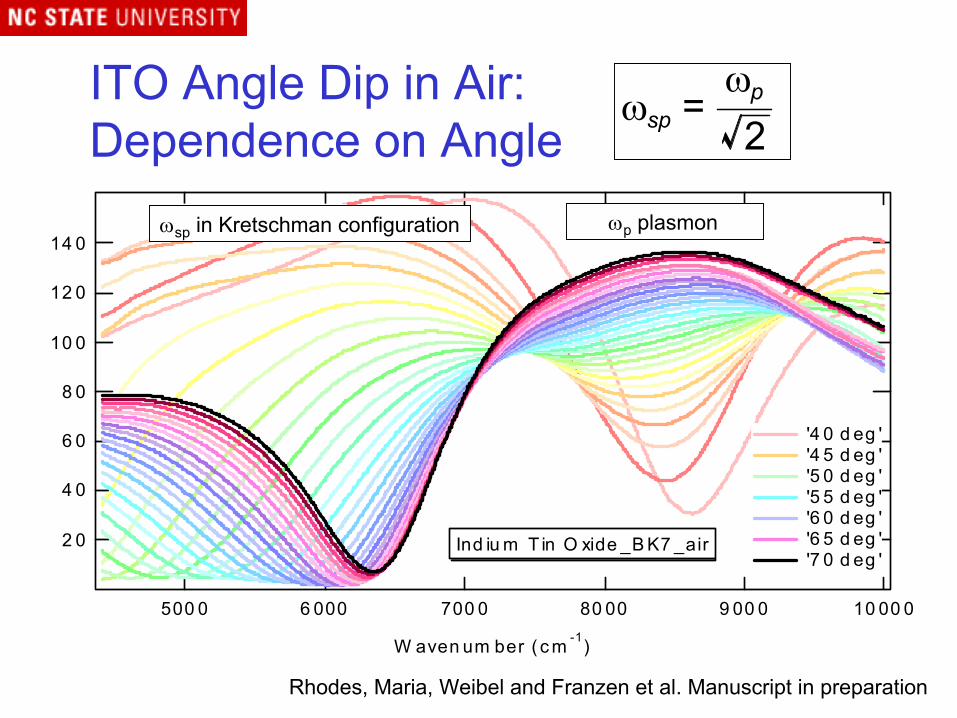
ITO Angle Dip in Air: Dependence on Angle
14 0
12 0
10 0
8 0
6 0
4 0
2 0
10 00 09 00 080 00700 06 000500 0
W aven um ber ( c m -1)
'4 0 d eg ' '4 5 d eg ' '5 0 d eg ' '5 5 d eg ' '6 0 d eg ' '6 5 d eg ' '7 0 d eg '
Bu lk P las m o nS urfa ce P las m o n
Ind iu m T in O xide _B K7 _air
Rhodes, Maria, Weibel and Franzen et al. Manuscript in preparation
ωsp in Kretschman configuration ωp plasmon
ωsp =ωp2

ITO Angle Dip in Air:Single wavenumber representation
Crissy Rhodes, Steve Weibel, Jon-Paul Maria
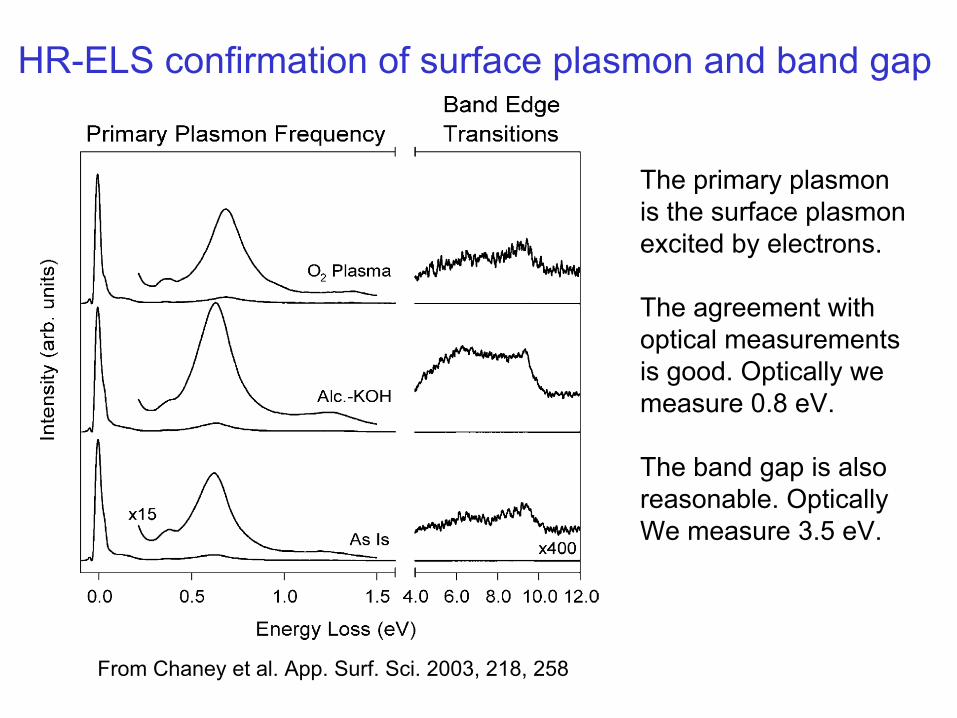
From Chaney et al. App. Surf. Sci. 2003, 218, 258
HR-ELS confirmation of surface plasmon and band gap
The primary plasmonis the surface plasmonexcited by electrons.
The agreement withoptical measurementsis good. Optically wemeasure 0.8 eV.
The band gap is also reasonable. OpticallyWe measure 3.5 eV.

10 20 30 40 50-5000
0
5000
10000
15000
20000
25000
30000
35000
In
tens
ity [a
rb. u
nits
]
Energy Loss [eV]
Silicon SiO2 ITO
AB C
Bulk or Volume Plasmon (VEELS)
Crissy Rhodes, Donavon Leonard, Gerd Duscher
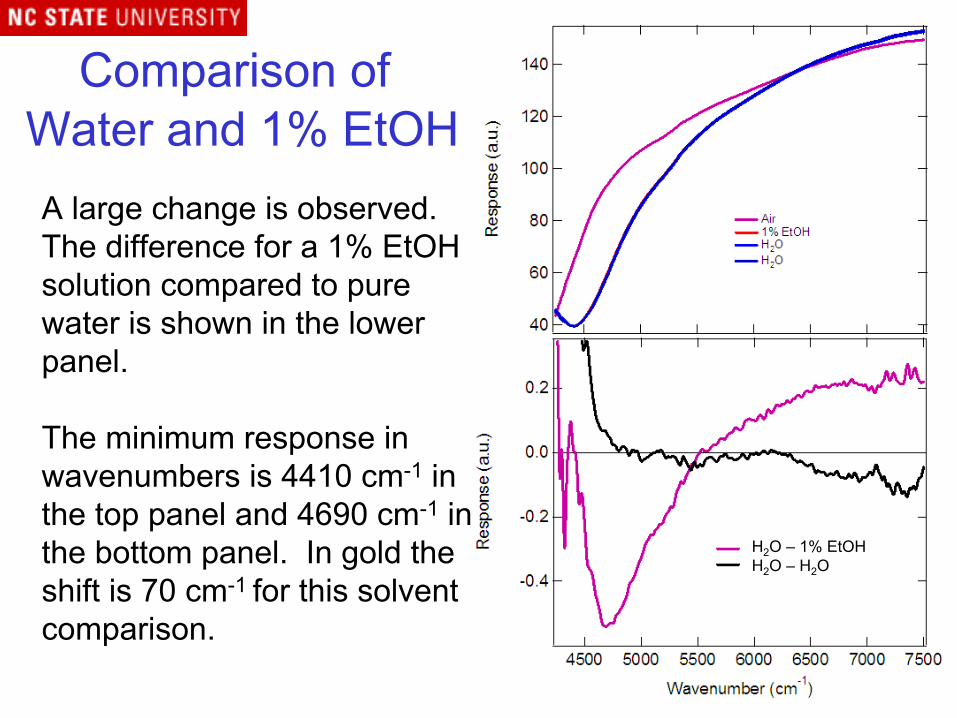
Comparison ofWater and 1% EtOHA large change is observed.The difference for a 1% EtOH solution compared to pure water is shown in the lower panel.
The minimum response in wavenumbers is 4410 cm-1 in the top panel and 4690 cm-1 in the bottom panel. In gold the shift is 70 cm-1 for this solvent comparison.
H2O – 1% EtOHH2O – H2O

Generalization of the method• SPR on metal oxide thin films is a general phenomenon• sp-type include the transparent conducting oxides• d-type are compatible with semi-conductors and are
extremely robust conducting substrates0.8
0.6
0.4
0.2
0.0
Ref
lect
ance
1210864
Wavenumbers (x103) (cm-1)
Increasing Angle
IrO2
Brewer, Franzen and Maria. Chem Phys. 2005, 205, 313
Steve Weibel (GWC Technologies)NIH, NSF, ARO, Applied Biosystems Inc.
Cell Delivery ProjectDr. Alex TkachenkoJoseph RyanChiamaka AgbassiYanli LiuEric Kaufman
Viral NanotechnologyProf. Steve LommelDr. Richard GuentherLina Loo
Acknowledgements
SPR and NanosensorsProf. Jean-Paul MariaProf. Gerd DuscherDr. Simon LappiDr. Marta Cerruti (poster)Crissy Rhodes (poster)Selina MosesMark LosegoDonavon Leonared
DehaloperoxidaseDr. Vesna SerranoJennifer BelyeaMichael DavisLauren GilveyZach Nicholson
RNA NanotechnologyProf. Bruce EatonProf. Dan FeldheimDr. Richard GuentherShowyi JuMagda Dolska
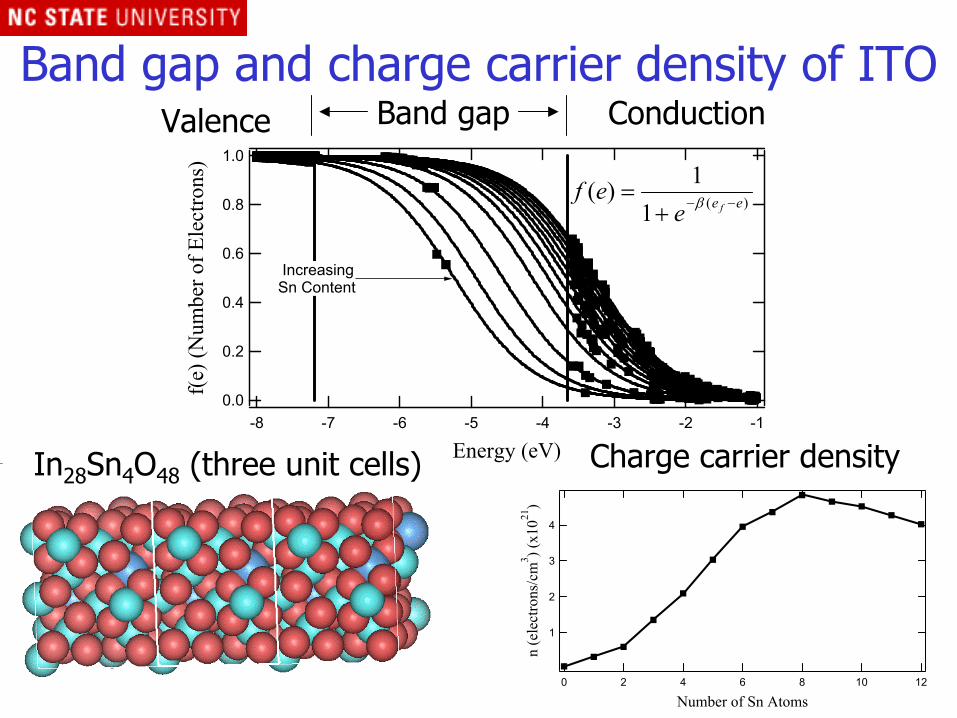
1.0
0.8
0.6
0.4
0.2
0.0f(e)
(Num
ber o
f Ele
ctro
ns)
-8 -7 -6 -5 -4 -3 -2 -1
Energy (eV)
IncreasingSn Content
)(11)( ee fe
ef −−+= β
Band gap and charge carrier density of ITO
4
3
2
1
n (e
lect
rons
/cm
3 ) (x1
021)
121086420
Number of Sn Atoms
Band gap ConductionValence
Charge carrier densityIn28Sn4O48 (three unit cells)

Determination of reduced mass by energy calculation in reciprocal space
A primitive cubic cell was usedfor calculation of conduction bandenergies along various k vectors
Calculated me ωp∆ (Γ → X) 0.31 11,430 cm-1
Σ(Γ → M) 0.42 9,880 cm-1
Λ (Γ → R) 0.54 8,670 cm-1
E k = Eo + h2k2
2me
ωp = ne2
meε0
Brewer and Franzen JPC B. 2002, 106, 12986Alloys and Compounds, 2002, 338, 73