Embed Size (px)
Citation preview
CHAPTER9
Surface Ultraviolet Radiation
Lead Author: R.L. McKenzie
Co-authors: M. Blumthaler
C.R. Booth
S.B. Diaz
J.E. Frederick
T. Ito
S. Madronich
G. Seckmeyer
Contributors: S. Cabrera
M. Ilyas
J.B. Kerr
C.E. Roy
P.C. Simon
D.I. Wardle
CHAPTER 9
SURFACE ULTRAVIOLET RADIATION
Contents
SCIENTIFIC SUMMARY ........................................................................................................................... ................ 9. 1
9. 1 INTRODUCTION ............................................................................................................................... ............... 9.3
9.2 UPDATE ON TREND OBSERVATIONS .......................................................................................................... 9.3
9.2. 1 Results Derived from Broad-Band Meters ................................................................................................ 9.3
9.2.2 Multi-Wavelength Measurements .............................................................................................................. 9.4
9.2.3 Status of Trend Observations .............................................................. ...................................................... 9.4
9.3 SPECTRO-RADIOMETER RESULTS ....................................................................... ....................................... 9.4
9.3. 1 Intercomparisons ....................................................................................................................................... 9.5
9.3.2 Geographic Differences ............................................................................................................................. 9.6
9.3.3 High Latitude (North and South) .............................................................................................. ................ 9.7
9.3.4 Northern Hemisphere Midlatitude .......................................................................................................... 9. 1 0
9.4 IMPLICATIONS OF RECENT CHANGES .................................................................................................... 9. 1 2
9.4. 1 Stratospheric Aerosols from the Mt. Pinatubo Eruption ......................................................................... 9. 1 2
9.4.2 Tropospheric Pollution ...................................................................................... . . .................................... 9. 1 2
9 .4.3 Magnitude of Changes ........................................................................................................................... . 9. 1 4
9.5 UPDATE ON PREDICTIONS .................. ...................................... ........................... ....................................... 9. 1 4
9.5. 1 Semi-Empirical Method ......................................................................................................................... . 9. 1 4
9.5.2 Calculated Changes in Clear-Sky U V Using Global Ozone Measurements ........................................ . .. 9. 1 4
9.5 . 3 Cloud and Albedo Effects ............................................... ......................................................................... 9. 1 6
9.5.4 UV Forecasts .................................................................................................................................... ....... 9. 1 8
9.6 GAPS IN KNOWLEDGE ............................. ....... ............................................................................................. 9. 1 8
REFERENCES ........................................................................................................................................................... 9. 1 8
SURFACE UV RADIATION
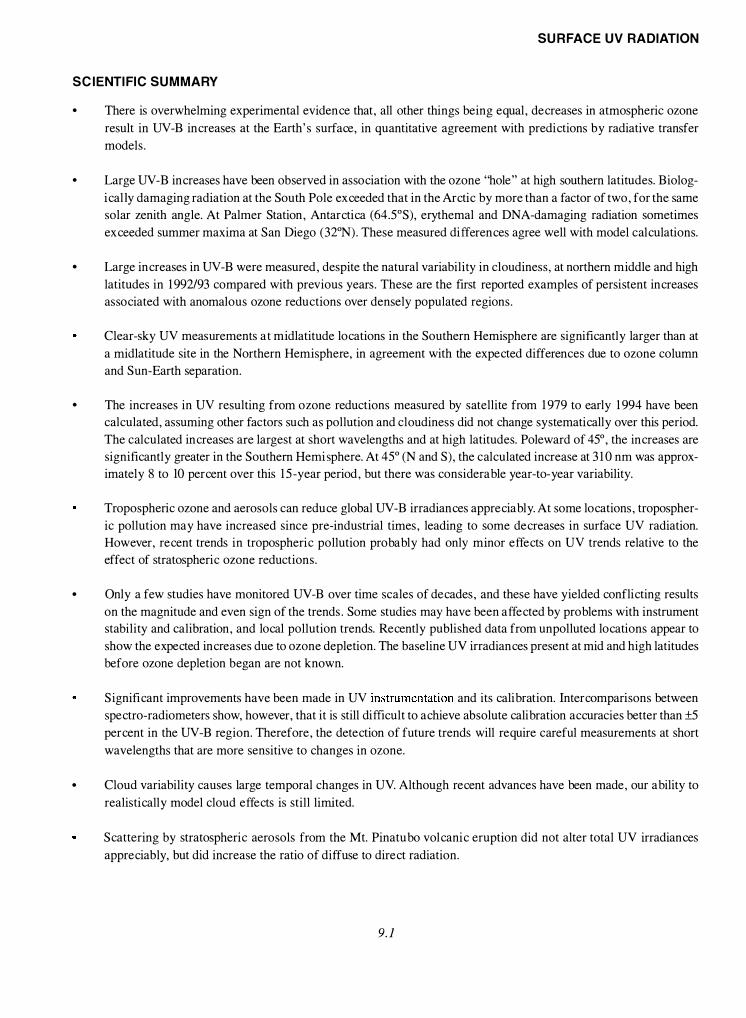
SCIENTIFIC SUMMARY
• There is overwhelming experimental evidence that, all other things being equal, decreases in atmospheric ozone
result in UV-B increases at the Earth' s surface, in quantitative agreement with predictions by radiative transfer
models .
• Large UV-B increases have been observed in association with the ozone "hole" at high southern latitudes. Biolog
ical! y damaging radiation at the South Pole exceeded that in the Arctic by more than a factor of two, for the same
solar zenith angle. At Palmer Station, Antarctica (64.5°S), erythemal and DNA-damaging radiation sometimes
exceeded summer maxima at San Diego (32°N) . These measured differences agree well with model calculations.
• Large increases in UV-B were measured, despite the natural variability in cloudiness, at northern middle and high
latitudes in 1 992/93 compared with previous years. These are the first reported examples of persistent increases
associated with anomalous ozone reductions over densely populated regions .
Clear-sky UV measurements at midlatitude locations in the Southern Hemisphere are significantly larger than at
a midlatitude site in the Northern Hemisphere, in agreement with the expected differences due to ozone column
and Sun-Earth separation.
• The increases in UV resulting from ozone reductions measured by satellite from 1 979 to early 1 994 have been
calculated, assuming other factors such as pollution and cloudiness did not change systematically over this period.
The calculated increases are largest at short wavelengths and at high latitudes. Poleward of 45°, the increases are
significantly greater in the Southern Hemisphere. At 45° (N and S), the calculated increase at 3 1 0 nm was approx
imately 8 to 10 percent over this 1 5 -year period, but there was considerable year-to-year variability.
Tropospheric ozone and aerosols can reduce global UV-B irradiances appreciably. At some locations, tropospher
ic pollution may have increased since pre-industrial times, leading to some decreases in surface UV radiation.
However, recent trends in tropospheric pollution probably had only minor effects on UV trends relative to the
effect of stratospheric ozone reductions .
• Only a few studies have monitored UV-B over time scales of decades, and these have yielded conflicting results
on the magnitude and even sign of the trends . Some studies may have been affected by problems with instrument
stability and calibration, and local pollution trends. Recently published data from unpolluted locations appear to
show the expected increases due to ozone depletion. The baseline UV irradiances present at mid and high latitudes
before ozone depletion began are not known.
Significant improvements have been made in UV instrumentation and its calibration. Intercomparisons between
spectra-radiometers show, however, that it is still difficult to achieve absolute calibration accuracies better than ±5
percent in the UV-B region. Therefore, the detection of future trends will require careful measurements at short
wavelengths that are more sensitive to changes in ozone.
• Cloud variability causes large temporal changes in UV. Although recent advances have been made, our ability to
realistically model cloud effects is still limited.
Scattering by stratospheric aerosols from the Mt. Pinatubo volcanic eruption did not alter total UV irradiances
appreciably, but did increase the ratio of diffuse to direct radiation.
9.1
9.1 INTRODUCTION
Although the ultraviolet (UV) region represents
only a small component of the total solar spectrum, these
wavelengths are important because the photon energies
are comparable with molecular bond energies in the bio
sphere. The UV radiation that reaches the Earth surface
can be arbitrarily divided into 2 sub-regions : UV-B (280-
3 1 5 nm), which is strongly absorbed by ozone; and
UV-A (3 1 5-400 nm), which is only weakly absorbed by
ozone. Less than 2 percent of the extra-terrestrial solar
energy falls within the UV-B range, and only a small
fraction of this reaches the surface.
Here we review progress in our understanding of
UV at the surface since the last assessment (WMO,
1 992) and attempt to identify remaining gaps in our
knowledge. Impacts of UV increases (e.g. , effects on the
biosphere, including human health and materials) are
outside the scope of this report and are discussed in the
UNEP "Effects Panel" reports ( 1 99 1, 1 994) . Impacts on
tropospheric chemistry that may result from changes in
UV radiation fields are also discussed in Chapter 5 of
this report . These may lead to either positive or negative
feedbacks to stratospheric ozone depletion (UNEP, 199 1
and 1 994; Madronich and Granier, 1 994) .
Detailed reviews of our understanding of UV at
the surface can also be found in Tevini ( 1 993) and Young
et al. ( 1 993) .
9.2 UPDATE ON TREND OBSERVATIONS
9.2.1 Results Derived from Broad-Band Meters
Analyses of broad-band data have focused on vari
ability in the radiation received in specific geographic
regions over time scales of months to years. The much
discussed work of Scotto et al. ( 1 988) showed a decline
in annually integrated irradiance measured by eight Rob
ertson-Berger (RB) meters in the continental United
States between 1 974 and 1 985 . The average trend based
on all stations was -0.7 percent per year, while the statis
tically significant values for individual stations varied
from -0.5 to - 1 .0 percent per year. A careful analysis of
the RB meter's operating characteristics was carried out
shortly after the publication of Scotto et al. ( 1 988) .
These studies showed that the spectral response func
tions of selected meters were remarkably stable over
9.3
SURFACE UV RADIATION
time, although small differences between instruments
existed (DeLuisi et al., 1 992). As part of this evaluation,
Kennedy and Sharp ( 1 992) found no obvious problems
in the RB meter system apart from a well-documented
temperature sensitivity. This does not appear to be a like
ly explanation for the downward trends found by Scotto
et al. ( 1 988) . However, some of the detailed information
required to assess the stability of the RB meter network
is no longer in existence. More recent work (DeLuisi,
1 993; DeLuisi et al., 1 994) has uncovered a potential
shift in calibration of the RB meter network in 1 980 that
could remove the downward trend found by Scotto et al.
( 1 988) . This issue merits further attention before defini
tive conclusions are reached.
Frederick and Weatherhead ( 1 992) studied the
time series of RB data from two specific sites, Bismarck
(46. 8°N) and Tallahassee (30.4°N), where Dobson col
umn ozone data were available over the period from
1 974 to 1985 . They found that the derived trend in clear
sky RB data during the summer months was consistent
with that expected from the Dobson data. However, dur
ing winter, when the measured broad-band irradiances
were very small, a pronounced downward trend near -2
percent per year exists in the RB data. This differs in sign
from spectrally weighted irradiance calculations for
clear skies based on the Dobson ozone. The winter be
havior in the RB data sets at Bismarck and Tallahassee is
not readily explained by any known change in the atmo
sphere above these sites. Although the influences of
cloudiness and ozone in the boundary layer can be de
tected in the output of the RB meter (Frederick et al. ,
1 993a), these influences are not likely to be causes of the
winter trends in broad-band irradiance.
B lumthaler and Ambach ( 1 990) reported an up
ward trend in RB readings made from an unpolluted site
in the Swiss Alps at latitude 4 7°N during the period 1 98 1
through 1 989. Readings were expressed as ratios t o the
total solar irradiance measured by a pyranometer so as to
remove the effects of aerosols. These measurements
have continued, and the upward trend in the ratios was
0.7 ± 0.3 percent per year to the end of 1 99 1, but results
from 1 992 were similar to those at start of the period.
The analysis did not examine the trend by month of the
year.
Recently, Zheng and Basher ( 1 993) reported an
upward trend in clear-sky RB data from Invercargill,
New Zealand, at 46°S . The observation site is in an un-
SURFACE UV RADIATION
polluted region where changes in aerosols were small
over the observation period. The deduced trend is anti
correlated in the expected way with column ozone data
from the same location.
Temperature coefficients of order 1 %/K have been
reported for RB meters and their derivatives (Johnsen
and Moan, 1 99 1; Blumthaler, 1 993; Dichter et al.,
1 994) . Of the trend analyses above, only that by
Blumthaler and Ambach ( 1 990) applied corrections for
instrument temperature changes . New generation tem
perature-stabilized instruments are now available and
are being tested against spectra-radiometers (Grainger et
al. , 1 993; McKenzie, 1 994a) .
9.2.2 Multi-Wavelength Measurements
The longest time series of UV irradiance at the
ground has been published by Correll et al. ( 1 992) . A
multi-filter instrument was used in Maryland (39°N,
77°W), over the period September 1 975 to December
1 990. The data show a large increase in UV-B, especially
at shorter wavelengths over the period 1 980 to 1 987 . The
authors deduce from their measurements that the "RB
weighted" UV (over the interval 295-320 nm, however)
would have increased by 35 percent over the period
1 977-78 to 1 985 . This increase is much larger than ex
pected from stratospheric ozone losses. The integral
used would, however, show greater sensitivity to ozone
loss than a real RB meter, which is more responsive at
wavelengths longer than 320 nm in the UV-A region that
are unaffected by ozone changes . A decrease in the irra
diances after 1 987 may be a consequence of changes to
the instrument at that time, though the authors speculate
that changes in aerosols and cloud conditions may have
influenced the results .
9.2.3 Status of Trend Observations
The measurement of trends in UV is challenging
from an instrumental point of view, and the availability
and deployment of instruments to monitor trends in UV
have been far from ideal. Instrument development over
the past few years has continued to address the issues of
stability, spectral response, spectral resolution, cost, and
ease of maintenance in an attempt to meet the varied
needs of the community. Short-term process studies have
revealed strong anticorrelations between ozone and UV,
in agreement with those expected from model c alcula-
9.4
tions (WMO, 1 992) . Thus there is no doubt that, in the
absence of other changes, reductions in stratospheric
ozone will result in UV increases. However, the results
of long-term studies have been conflicting. The network
of RB meters was never designed to measure long-term
trends, and questions still remain over the ability of
broad-band meters to achieve this aim. Evidence now
suggests that changing aerosol (and cloud) conditions
can lead to increases or decreases in UV (Justus and
Murphey, 1 994) . Further comparisons between RB mea
surements and pyranometer data at other sites are
warranted. It is significant that at unpolluted sites, the
observed increases in UV are comparable with those ex
pected from ozone changes. Even at more polluted sites
where UV has apparently not increased, it is reasonable
to assert that current UV levels are greater than they
would otherwise have been without ozone depletion.
Better instruments are now available to monitor changes.
These include improved broad-band monitors and so
phisticated spectro-radiometers that can distinguish
between changes caused by ozone and other effects such
as aerosols and clouds. However, if current predictions
are correct (see Chapter 1 3 ), much of the expected ozone
depletion has already occurred. It will therefore be im
portant to maintain careful calibration of these
instruments over decadal time scales if trends in UV are
to be discerned from natural variability. Although mea
surements from polluted sites will be of interest to
epidemiologists and for process studies, instruments de
signed to monitor trends due to ozone depletion should
generally be located at remote sites where tropospheric
changes are minimized.
9.3 SPECTRO-RADIOMETER RESULTS
The observation period from spectra-radiometers
is too short to detect trends . However, multi-year data are
now available from a network of instruments operated
by the National Science Foundation (NSF) (Booth et al. ,
1 994) and from several other groups (Gardiner et al.,
1 993; McKenzie et al. , 1 993; Kerr and McElroy, 1 993;
Ito et al. , 1 994) . Process studies using these data have
already provided experimental corroboration of the
modeled relationship between ozone and UV (WMO,
1 992).
SURFACE UV RADIATION
r--. 100 , , I , ,
E .�' , , c , , , I
I N I
I 10 I I
E , , ,
I I
I � I , I
E , , '
� I ,
I I w I
I u I
I z '
, <( ,
, I
0 ,
0.1 ,
<( , New Zealand , Lauder, , 0:::: I
0:::: , I Neuherberg, Germany
tF e b 2 1 , 1 9 9 1 ) Jul 29, 1991)
I I
I I
, I
0.01 290 295 300 305 310 315 320 330
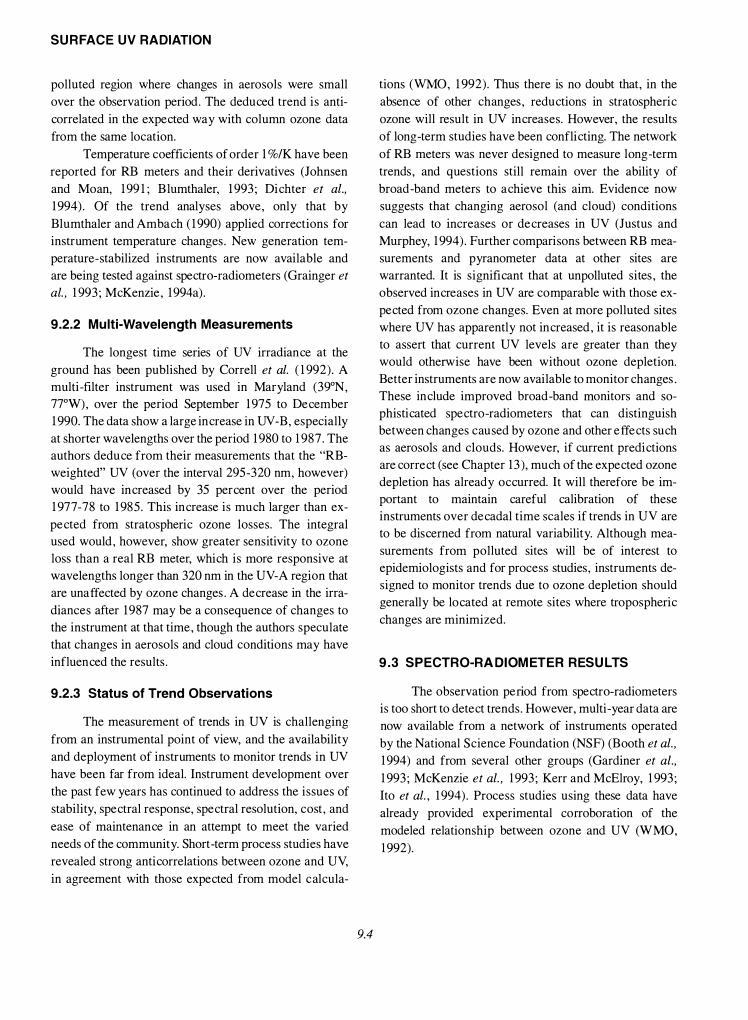
WAVELENGTH (nm) Figure 9-1. Measured clear-sky spectral irradiances in New Zealand and Germany
_for solar zenith angle
34.3°. The ozone column was 266 Dobson units (DU) in New Zealand and 352 DU m Germany. Note the logarithmic scale on the y-axis (adapted from Seckmeyer and McKenzie, 1992).
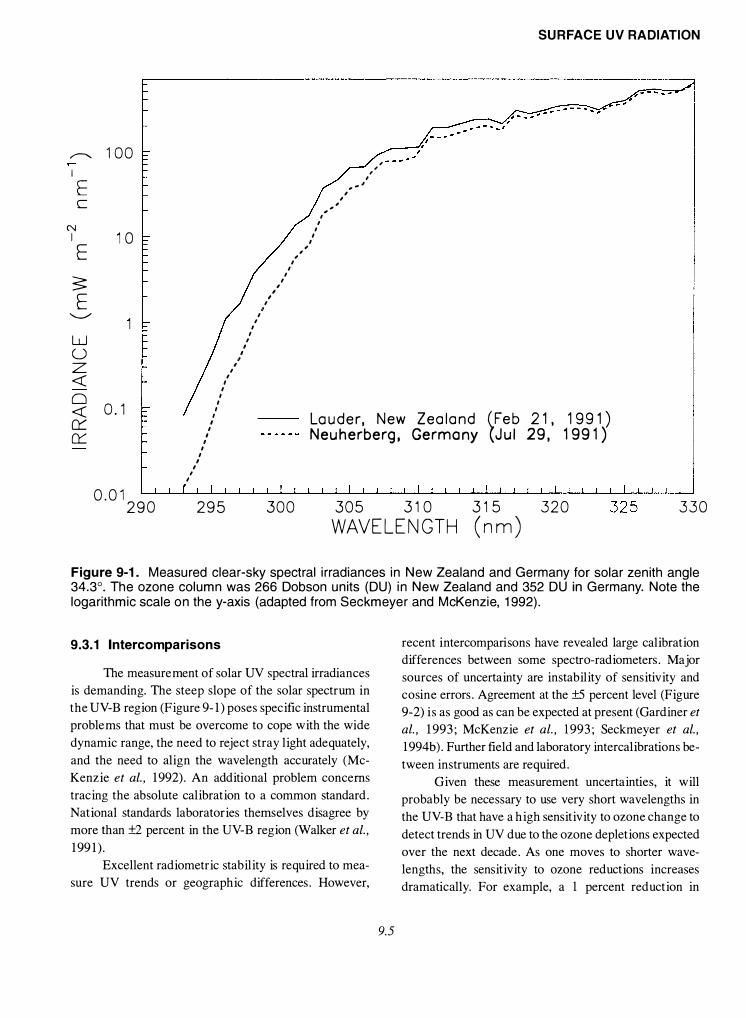
9.3.1 Intercomparisons
The measurement of solar UV spectral irradiances
is demanding. The steep slope of the solar spectrum in
the UV-B region (Figure 9-1) poses specific instrumental
problems that must be overcome to cope with the wide
dynamic range, the need to reject stray light adequately,
and the need to align the wavelength accurately (Mc
Kenzie et al., 1992). An additional problem concerns
tracing the absolute calibration to a common standard.
National standards laboratories themselves disagree by
more than ±2 percent in the UV-B region (Walker et al.,
1991).
Excellent radiometric stability is required to mea
sure UV trends or geographic differences. However,
9.5
recent intercomparisons have revealed large calibration
differences between some spectra-radiometers. Major
sources of uncertainty are instability of sensitivity and
cosine errors. Agreement at the ±5 percent level (Figure
9-2) i s as good as can be expected at present (Gardiner et
al., 1993; McKenzie et al., 1993; Seckmeyer et al.,
1994b ). Further field and laboratory intercalibrations be
tween instruments are required.
Given these measurement uncertainties, it will
probably be necessary to use very short wavelengths in
the UV-B that have a high sensitivity to ozone change to
detect trends in UV due to the ozone depletions expected
over the next decade. As one moves to shorter wave
lengths, the sensitivity to ozone reductions increases
dramatically. For example, a 1 percent reduction in
SURFACE UV RADIATION
_.... 250
t:,.L:,. C\J 'E 3: [:,. �sgs� • "liE. E 200 ........ Q) u c a 150
-a a "-"-
a 100
E Q)
•• • • •• n •
�� • • t>
•
[:,.
..r:::. -- CALCULATED, GREEN - 50 •
� "-
w
• • • • • MEASURED, IFU \BENTHAM ) ooooo MEASURED, NIWA J-Y) 00000 MEASURED, NIWA BENTHAM ) AAAAA MEASURED, ARL (SPEX )
0 6 8 10 12 14 16 18 20
Hour ( NZST= GMT+ 12) Figure 9-2. Comparison between measurements made with 4 spectra-radiometers at Lauder, New Zealand, on Feb 23, 1993. Instruments included were from National Institute of Water and Atmospheric Research, New Zealand (2), Australian Radiation Laboratory, Australia, and Fraunhofer Institute for Atmospheric Environment, Germany. Clear-sky model results are shown for comparison, although the observation day was not perfectly clear (adapted from McKenzie et at., 1993).
ozone causes an increase of approximately 1 percent in
UV at 3 1 0 nm, whereas the increase at 300 nm is 3 to 4
times as large (see Figure 9- 1 2) .
9.3.2 Geographic Differences
Although large geographical differences in UV-B
are expected from theoretical considerations, there have
been few published studies demonstrating measured
geographic differences in UV-B radiation. A climatology
obtained from a network of RB meters in the 1 970s
(Berger and Urbach, 1 982) may be biased by the strong
temperature coefficient of these instruments. Although
9. 6
the UV data base is improving, it still remains largely
uncoordinated. Large latitudinal gradients have, howev
er, been observed from the NSF network of
spectra-radiometers, as discussed in Section 9 .3 .3
(Booth et al., 1 994).
Geographic intercomparisons based on measure
ments from the same instrument (Seckmeyer and
McKenzie, 1 992) have shown that for clear-sky observ
ing conditions and similar solar zenith angles, UV
irradiances measured in Europe are much less than in
New Zealand (Figure 9- 1 ). The differences are larger
than expected from calculations using an earlier ozone
climatology, though their spectral characteristics indi-
N z
2.0 ' ' '
SURFACE UV RADIATION
Measured Ratio Calculated Ratio
I 1.5 f-
MELBOURNE AUSTRALIA I LAUDER NZ DoY=29, SZA= 19.8, Ozone=259 Du
s
0 w 0::: ci 1.0 2 0 u
0 I
I I I
' , , I
' , � �
� 0.5 0:::
I I
I
I I
I NEUHERBERG GERMANY I LAUDER NZ DoY= 1 94, SZA=26.3, Ozone=3 1 0 Du
I I
I
0.0 290 300 310 320 330 340 350
WAVELENGTH 360 370 380 390 400 (nm)
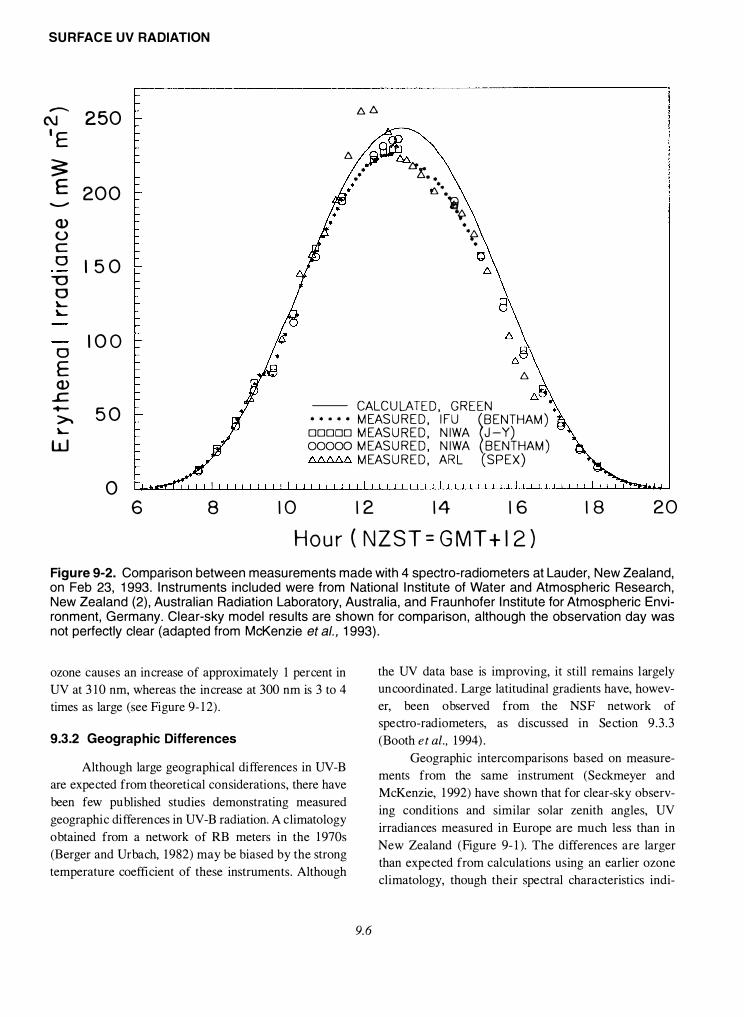
Figure 9-3. Geographic comparison between maximum clear-sky spectra measured in three countries. The ratios are with respect to a spectrum measured at Lauder on Dec. 27, 1992 (Day-of-Year [DoY] =362, sza=21.8°, ozone=278 DU). The smooth curves show calculated ratios assuming similar albedos and aerosol properties (adapted from McKenzie et a/., 1993).
cate that they are primarily due to ozone. This illustrates
the importance of tropospheric ozone, which has in
creased in Europe (Staehelin and Schmid, 1 99 1 ).
Data from cross-calibrated instruments have been
used to compare the maximum clear-sky irradiances
measured over several summers at three sites (McKenzie
et al., 1 993). Ratios of these maximum clear-sky spectra
obtained are shown in Figure 9-3. The maximum DNA
weighted UV (Setlow, 1 974) measured in New Zealand
(45°S) was 50 percent greater than at a similar latitude in
Germany (48°N). UV irradiances in Australia (38°S)
were significantly higher than in New Zealand. Figure
9-3 also shows ratios calculated with a simple model, as-
9. 7
surning no differences in aerosol loading. The calculated
differences in UV are due to differences in ozone, sun
angle, and Earth-Sun separation. Measured and calculat
ed ratios are in agreement within experimental
uncertainties.
9.3.3 High Latitude (North and South)
Year-to-year variability in cloudiness is among the
largest sources of variance in monthly integrated UV ir
radiance measured at the ground (Frederick et al.,
1 993b; Diaz et al., 1 994), although this can vary from
one location to the next, depending on the timing and
severity of ozone depletions. At the NSF site in Ushuaia,
SURFACE UV RADIATION
::J 0 (j) c 0 N 0
(f) :::::! 0 I-
(j) (j) !..... O'l (j)
500 11-N ov
400
300
200
100
0.04 __......._ N E
0.03 � c
--
0.02 � (1) 0 c
0.01 �
0
co '!.....
270 280 290 300 310 320 330 340 350 360
Day of Year, 1991
90 15000
'E 0
0 80 s
10000 :::J.. (j)
OJ c
<( .c .-t=
� 70 N
!..... co
0 (f)
60
'E c 0 0 <.0 '
5000 8 :::!:.-
270 280 290 300 310 320 330 340 350 360
Day of Year, 1991
<!) :0 rJ) 5
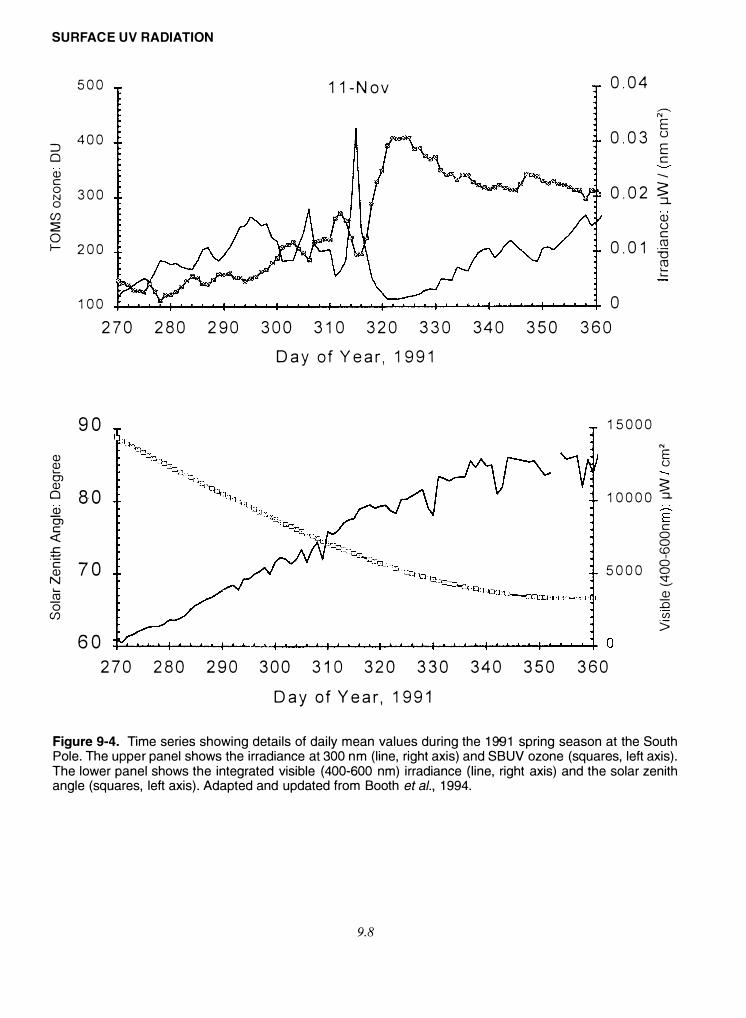
Figure 9-4. Time series showing details of daily mean values during the 1991 spring season at the South Pole. The upper panel shows the irradiance at 300 nm (line, right axis) and SBUV ozone (squares, left axis). The lower panel shows the integrated visible {400-600 nm) irradiance {line, right axis) and the solar zenith angle (squares, left axis). Adapted and updated from Booth et at., 1994.
9.8
Argentina (54.6°S), the lowest ozone column amounts to
date ( 1 988- 1 992) were in 1 992. However, the highest
UV irradiances occurred in 1 990, when the ozone hole
persisted and was displaced towards South America. In
December 1 99 1 , the erythemal UV (McKinlay and Dif
fey, 1 987) was 45 percent larger than the zonal mean
climatology, which is equivalent to moving 20° closer to
the equator. Because radiation at 305 nm is sensitive to
both ozone and cloud changes, whereas 340 nm radia
tion is insensitive to ozone, Frederick et al. ( 1 993c) have
investigated the irradiance ratio I3o5/I340 to remove
cloud effects from UV measurements in U shuaia. Over
the summers of 1 989-90 to 1 992-93, these ratios were
significantly larger than those deduced from a climatolo
gy of ozone measurements obtained over the period
1 980 to 1 986 (Frederick et al., 1 993c).
The unique geometry at South Pole Station (90°S)
means that there are no diurnal cycles in solar zenith an
gle. This simplifies investigation of the relationship
between UV, ozone, and other parameters . The strong
anticorrelation between UV and ozone is demonstrated
by Figure 9-4, which shows a UV maximum occurring
on 1 1 November 1 99 1 (day 3 1 5 ); a day when ozone was
a local minimum. As is normal for Antarctica, the high
est instantaneous UV irradiances (erythema, or UV-B)
do not occur at the time of the greatest ozone depletion,
but at a time closer to the summer solstice, combining
the effects of higher solar zenith angles with relatively
low ozone. In contrast, visible radiation increases steadi
ly as the solar zenith angle decreases over the
observation period (Figure 9-4). Perturbations by clouds
are relatively small at this site, probably due to the high
surface albedo and to extremely cold temperatures,
which keep clouds from becoming optically thick. Al
though the relative increases are large, the absolute UV
irradiances at this site are still small compared with those
at mid or low latitudes.
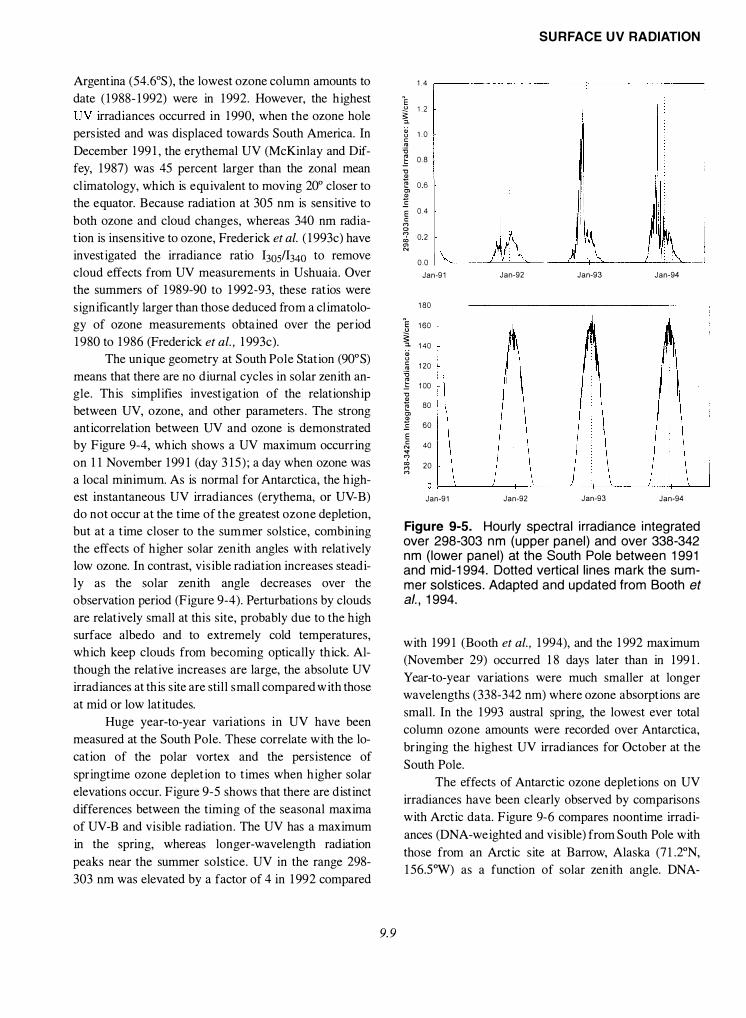
Huge year-to-year variations in UV have been
measured at the South Pole. These correlate with the lo
cation of the polar vortex and the persistence of
springtime ozone depletion to times when higher solar
elevations occur. Figure 9-5 shows that there are distinct
differences between the timing of the seasonal maxima
of UV-B and visible radiation. The UV has a maximum
in the spring, whereas longer-wavelength radiation
peaks near the summer solstice. UV in the range 298-
303 nm was elevated by a factor of 4 in 1 992 compared
9. 9
SURFACE UV RADIATION
1.4
� 1.2 � "-� 1.0 u ; 'ii � 0.8 "0 E 1: 06 Cl �
.E E 0.4 c
M g 02 "" "' N
0.0 Jan-91 Jan-92 Jan-93 Jan-94
180
1: 160 � "- 140 � u c 120 " 'ii � 1 00 "0 E 80 1: Cl �
.E 60 E c 40 N ;:!; "" 20 M M
Jan-91 Jan-92 Jan-93 Jan-94
Figure 9-5. Hourly spectral irradiance integrated over 298-303 nm (upper panel) and over 338-342 nm (lower panel) at the South Pole between 1991 and mid-1994. Dotted vertical lines mark the summer solstices. Adapted and updated from Booth et a/., 1994.
with 1 99 1 (Booth et al., 1 994), and the 1 992 maximum
(November 29) occurred 1 8 days later than in 1 99 1 .
Year-to-year variations were much smaller at longer
wavelengths (338-342 nm) where ozone absorptions are
small. In the 1 993 austral spring, the lowest ever total
column ozone amounts were recorded over Antarctica,
bringing the highest UV irradiances for October at the
South Pole.
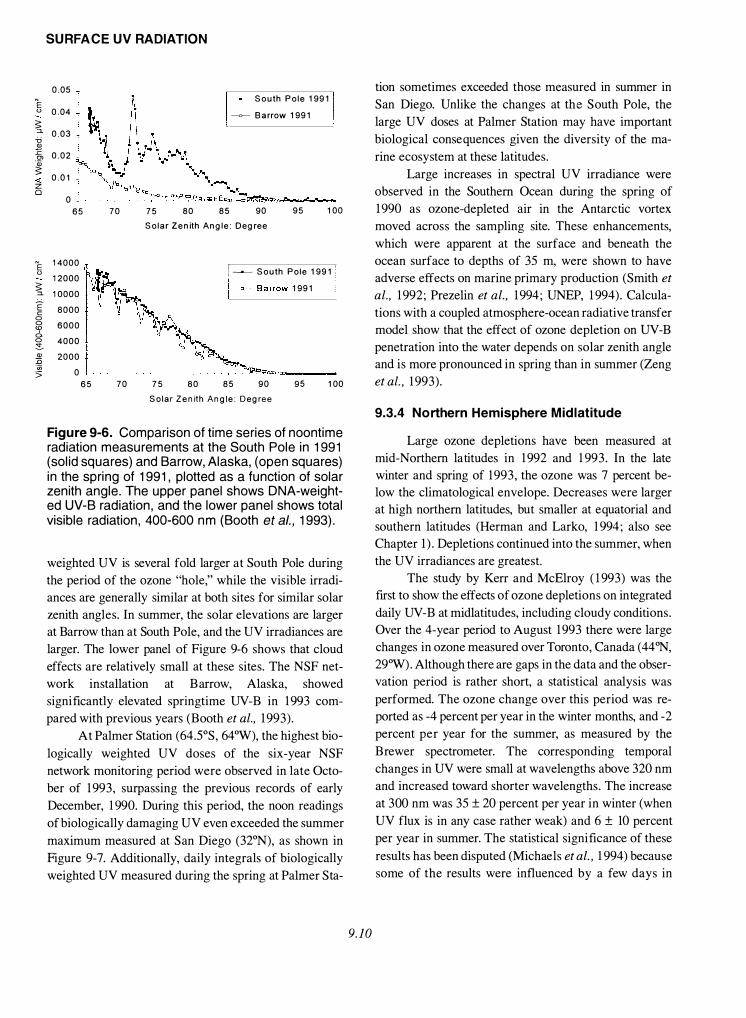
The effects of Antarctic ozone depletions on UV
irradiances have been clearly observed by comparisons
with Arctic data. Figure 9-6 compares noontime irradi
ances (DNA-weighted and visible) from South Pole with
those from an Arctic site at Barrow, Alaska (7 1 .2°N,
1 56 .SOW) as a function of solar zenith angle. DNA-
'E "
s: :::1.
ii Q) :c 0> "iii s: <( z 0
'E "
s: :::1.
E" c 0 0 <D 0. 0 :!. "' :0 "iii 5
SURFACE UV RADIATION
0.05
0.04
0.03
0.02
0.01
0 65 70
14000
12000
10000
8000
6000
4000 t 2000
0 65 70
75 80 85
----- South Pole 1991
�Barrow 1991
90 95 100
Solar Zenith Angle: Degree
75 80
f �- South Pole 1991
'�Barrow 1991
85 90 95 100
Solar Zenith Angle: Degree
Figure 9-6. Comparison of time series of noontime radiation measurements at the South Pole in 1991 (solid squares) and Barrow, Alaska, (open squares) in the spring of 1991, plotted as a function of solar zenith angle. The upper panel shows DNA-weighted UV-B radiation, and the lower panel shows total visible radiation, 400-600 nm (Booth et a/., 1993).
weighted UV is several fold larger at South Pole during
the period of the ozone "hole," while the visible irradi
ances are generally similar at both sites for similar solar
zenith angles. In summer, the solar elevations are larger
at Barrow than at South Pole, and the UV irradiances are
larger. The lower panel of Figure 9-6 shows that cloud
effects are relatively small at these sites. The NSF net
work installation at Barrow, Alaska, showed
significantly elevated springtime UV-B in 1 993 com
pared with previous years (Booth et al., 1 993).
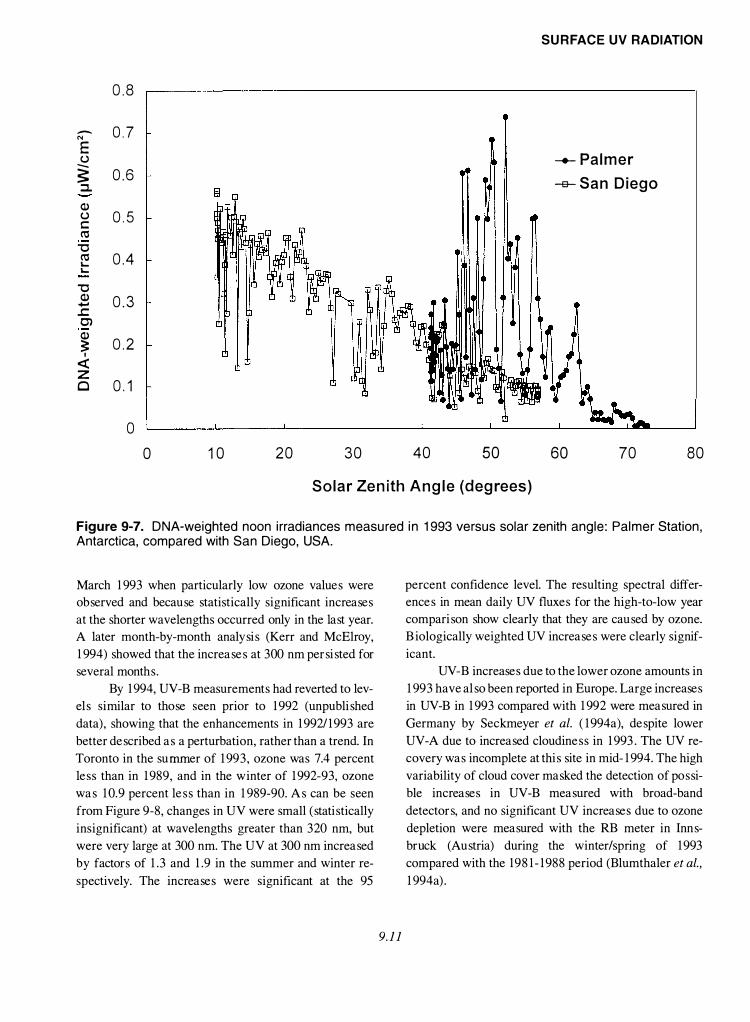
At Palmer Station (64.SOS, 64°W), the highest bio
logically weighted UV doses of the six-year NSF
network monitoring period were observed in late Octo
ber of 1 993, surpassing the previous records of early
December, 1 990. During this period, the noon readings
of biologically damaging UV even exceeded the summer
maximum measured at San Diego (32°N), as shown in
Figure 9-7. Additionally, daily integrals of biologically
weighted UV measured during the spring at Palmer Sta-
9.10
tion sometimes exceeded those measured in summer in
San Diego. Unlike the changes at the South Pole, the
large UV doses at Palmer Station may have important
biological consequences given the diversity of the ma
rine ecosystem at these latitudes.
Large increases in spectral UV irradiance were
observed in the Southern Ocean during the spring of
1 990 as ozone-depleted air in the Antarctic vortex
moved across the sampling site. These enhancements,
which were apparent at the surface and beneath the
ocean surface to depths of 35 m, were shown to have
adverse effects on marine primary production (Smith et
al., 1 992; Prezelin et al., 1 994; UNEP, 1 994) . Calcula
tions with a coupled atmosphere-ocean radiative transfer
model show that the effect of ozone depletion on UV-B
penetration into the water depends on solar zenith angle
and is more pronounced in spring than in summer (Zeng
et al., 1 993).
9.3.4 Northern Hemisphere Midlatitude
Large ozone depletions have been measured at
mid-Northern latitudes in 1 992 and 1 993 . In the late
winter and spring of 1 993, the ozone was 7 percent be
low the climatological envelope. Decreases were larger
at high northern latitudes, but smaller at equatorial and
southern latitudes (Herman and Larko, 1 994; also see
Chapter 1 ) . Depletions continued into the summer, when
the UV irradiances are greatest.
The study by Kerr and McElroy ( 1 993) was the
first to show the effects of ozone depletions on integrated
daily UV-B at midlatitudes, including cloudy conditions.
Over the 4-year period to August 1 993 there were large
changes in ozone measured over Toronto, Canada (44°N,
29°W) . Although there are gaps in the data and the obser
vation period is rather short, a statistical analysis was
performed. The ozone change over this period was re
ported as -4 percent per year in the winter months, and -2
percent per year for the summer, as measured by the
Brewer spectrometer. The corresponding temporal
changes in UV were small at wavelengths above 320 nm
and increased toward shorter wavelengths. The increase
at 300 nm was 35 ± 20 percent per year in winter (when
UV flux is in any case rather weak) and 6 ± 10 percent
per year in summer. The statistical significance of these
results has been disputed (Michaels et al., 1 994) because
some of the results were influenced by a few days in
SURFACE UV RADIATION
0.8
- 0.7 "' E (.) - ----Palmer � 0.6 :::l. -s- San Diego Q) (.) 0.5 c ro
"0 ro 0.4 1-1-
"0 Q) 0 . 3 -
..l: C) Q)
0.2 ;: I < z Cl 0.1
0
0 1 0 20 30 40 50 60 70 80
Solar Zenith Angle (degrees)
Figure 9-7. DNA-weighted noon irradiances measured in 1993 versus solar zenith angle: Palmer Station, Antarctica, compared with San Diego, USA.
March 1 993 when particularly low ozone values were
observed and because statistically significant increases
at the shorter wavelengths occurred only in the last year.
A later month-by-month analysis (Kerr and McElroy,
1 994) showed that the increases at 300 nm persisted for
several months .
By 1 994, UV-B measurements had reverted to lev
els similar to those seen prior to 1 992 (unpublished
data), showing that the enhancements in 1 992/ 1 993 are
better described as a perturbation, rather than a trend. In
Toronto in the summer of 1 993 , ozone was 7.4 percent
less than in 1 989, and in the winter of 1 992-93, ozone
was 1 0.9 percent less than in 1 989-90. As can be seen
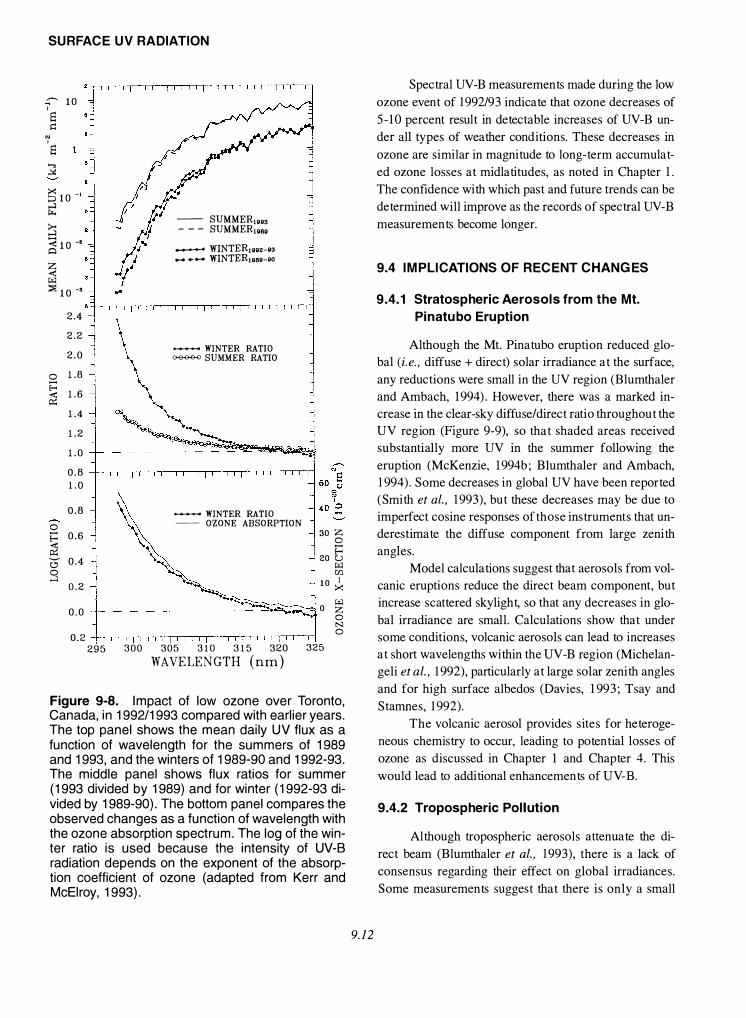
from Figure 9-8, changes in UV were small (statistically
insignificant) at wavelengths greater than 320 nm, but
were very large at 300 nm. The UV at 300 nm increased
by factors of 1 .3 and 1 .9 in the summer and winter re
spectively. The increases were significant at the 95
9.11
percent confidence level. The resulting spectral differ
ences in mean daily UV fluxes for the high-to-low year
comparison show clearly that they are caused by ozone.
B iologically weighted UV increases were clearly signif
icant.
UV-B increases due to the lower ozone amounts in
1 993 have also been reported in Europe. Large increases
in UV-B in 1 993 compared with 1 992 were measured in
Germany by Seckmeyer et al. ( 1 994a), despite lower
UV-A due to increased cloudiness in 1 993 . The UV re
covery was incomplete at this site in mid- 1 994. The high
variability of cloud cover masked the detection of possi
ble increases in UV-B measured with broad-band
detectors, and no significant UV increases due to ozone
depletion were measured with the RB meter in Inns
brock (Austria) during the winter/spring of 1 993
compared with the 198 1 - 1 988 period (Blumthaler et al.,
1 994a) .
SURFACE UV RADIATION
� 10 I s .::
"' I
s ...., �
� 10-1 ....:l ....
� < 10 -· 0 z < "'" ::g 10 -·
2.4
2.2
2.0
0 1.8 E== 1.6 < 0::
1.4
1.2
1.0
0.8 1.0
0.8 0 E== 0.6 < 0:: 0 0.4 0 ....:l
0.2
0.0
-- SUMMER,oo3 - - - SUMMER1080
...._...... WINTER10o2-o3 .......... WINTER,oao-oo
�WINTER RATIO � SUMMER RATIO
� WINTER RATIO -- OZONE ABSORPTION
30 z 0 E==
20 u "'" (fl
10 � . "-'w:+:i:;c::;::-----...____j 0 �
0 N
-0 . 2 ---l-,-,--,-,--,-,--,-,--,-,---,-,--,-,--,-,--,--,-,--,-,--,-,--,-,--,-,-,--rl 0
295 300 305 310 315 320 WAVELENGTH (nm)
325
Figure 9-8. Impact of low ozone over Toronto, Canada, in 1992/1993 compared with earlier years. The top panel shows the mean daily UV flux as a function of wavelength for the summers of 1989 and 1993, and the winters of 1989-90 and 1992-93. The middle panel shows flux ratios for summer (1993 divided by 1989} and for winter (1992-93 divided by 1989-90}. The bottom panel compares the observed changes as a function of wavelength with the ozone absorption spectrum. The log of the winter ratio is used because the intensity of UV-B radiation depends on the exponent of the absorption coefficient of ozone (adapted from Kerr and McElroy, 1993}.
9.12
Spectral UV-B measurements made during the low
ozone event of 1 992/ 93 indicate that ozone decreases of
5 - 1 0 percent result in detectable increases of UV-B un
der all types of weather conditions. These decreases in
ozone are similar in magnitude to long-term accumulat
ed ozone losses at midlatitudes, as noted in Chapter 1 .
The confidence with which past and future trends can be
determined will improve as the records of spectral UV-B
measurements become longer.
9.4 IMPLICATIONS OF RECENT C HANGES
9.4.1 Stratospheric Aerosols from the Mt.
Pinatubo Eruption
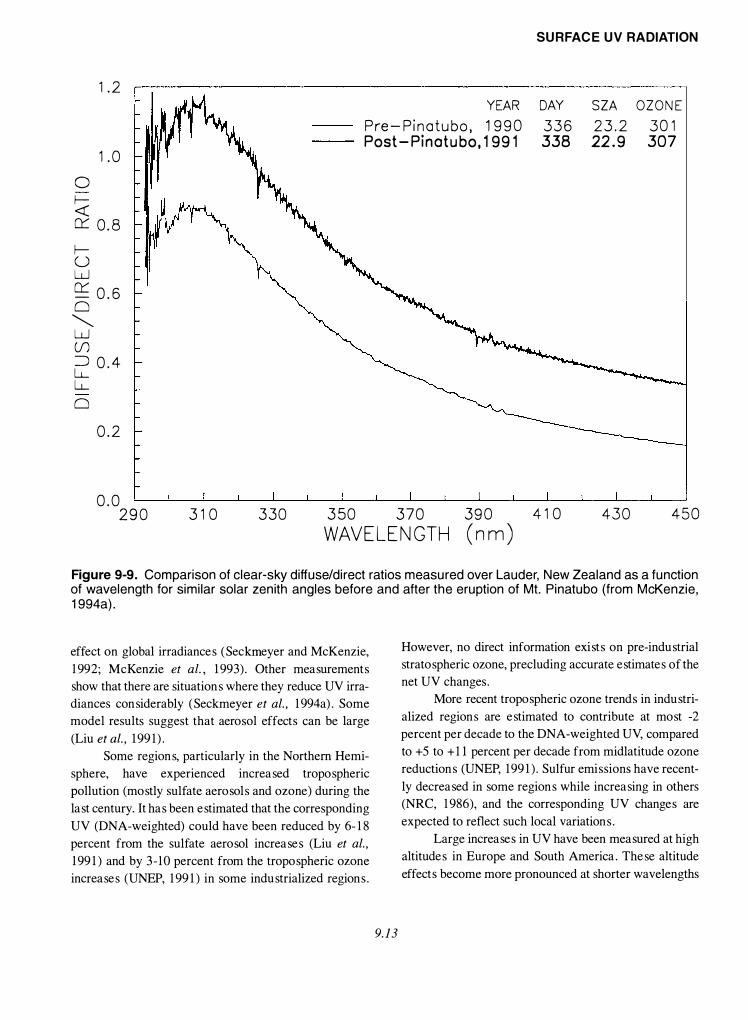
Although the Mt . Pinatubo eruption reduced glo
bal (i.e., diffuse+ direct) solar irradiance at the surface,
any reductions were small in the UV region (Blumthaler
and Ambach, 1 994). However, there was a marked in
crease in the clear-sky diffuse/direct ratio throughout the
UV region (Figure 9-9), so that shaded areas received
substantially more UV in the summer following the
eruption (McKenzie, 1 994b; B1umtha1er and Ambach,
1 994) . Some decreases in global UV have been reported
(Smith et al., 1 993), but these decreases may be due to
imperfect cosine responses of those instrument s that un
derestimate the diffuse component from large zenith
angles.
Model calculations suggest that aerosols from vol
canic eruptions reduce the direct beam component , but
increase scattered skylight, so that any decreases in glo
bal irradiance are small. Calculations show that under
some conditions, volcanic aerosols can lead to increases
at short wavelengths within the UV-B region (Michelan
geli et al., 1 992), particularly at large solar zenith angles
and for high surface albedos (Davies, 1 993; Tsay and
Stamnes, 1 992).
The volcanic aerosol provides sites for heteroge
neous chemistry to occur, leading to potential losses of
ozone as discussed in Chapter 1 and Chapter 4. This
would lead to additional enhancements of UV-B.
9.4.2 Tropospheric Pollution
Although tropospheric aerosols attenuate the di
rect beam (Blumthaler et al., 1 993), there is a lack of
consensus regarding their effect on global irradiances.
Some measurements suggest that there is only a small
SURFACE UV RADIATION
1.2 YEAR
Pre- Pinatubo, 1990 Post-Pinatubo, 1991
DAY 336 338
SZA 23.2 22.9
OZONE 301 307
0 f--<(
1.0
cr::: 0. 8
f-u w cr::: -0.6 0 � w (J)
2 0.4 LL 0
0.2
0.0 290 310 330 350 370
WAVELENGTH 390 (nm) 410 430 450
Figure 9-9. Comparison of clear-sky diffuse/direct ratios measured over Lauder, New Zealand as a function of wavelength for similar solar zenith angles before and after the eruption of Mt. Pinatubo (from McKenzie, 1994a).
effect on global irradiances (Seckmeyer and McKenzie,
1 992; McKenzie et al., 1 993). Other measurements
show that there are situations where they reduce UV irra
diances considerably (Seckmeyer et al., 1 994a). Some
model results suggest that aerosol effects can be large
(Liu et al., 1 99 1 ).
Some regions, particularly in the Northern Hemi
sphere, have experienced increased tropospheric
pollution (mostly sulfate aerosols and ozone) during the
last century. It has been estimated that the corresponding
UV (DNA-weighted) could have been reduced by 6- 1 8
percent from the sulfate aerosol increases (Liu et al.,
1 99 1 ) and by 3 - 10 percent from the tropospheric ozone
increases (UNEP, 1 99 1 ) in some industrialized regions.
9.13
However, no direct information exists on pre-industrial
stratospheric ozone, precluding accurate estimates of the
net UV changes.
More recent tropospheric ozone trends in industri
alized regions are estimated to contribute at most -2
percent per decade to the DNA-weighted UV, compared
to +5 to + 1 1 percent per decade from midlatitude ozone
reductions (UNEP, 1 99 1 ). Sulfur emissions have recent
ly decreased in some regions while increasing in others
(NRC, 1 986), and the corresponding UV changes are
expected to reflect such local variations.
Large increases in UV have been measured at high
altitudes in Europe and South America. These altitude
effects become more pronounced at shorter wavelengths
SURFACE UV RADIATION
(Cabrera et al . , 1994; Blumthaler et al . , 1 994b) . At 300
nm, increases of 24 ± 4%/km have been measured in
Europe for snow-free conditions (Blumthaler et al . ,
1 994b) . UV-B increases of 1 8%/km have also been mea
sured, although this included the effect of snow cover at
the high elevation site (Ambach et al . , 1 993) . Larger gra
dients in UV-B have been observed during the winter
near Santiago, Chile (33°S), though the same study re
ported gradients of only 4-5%/km in less polluted
regions (Cabrera et al . , 1 994) . The calculated gradients
for clear conditions are typically 5-8%/km (Madronich,
1 993) . Larger gradients result from increased tropo
spheric ozone or aerosols .
High concentrations of tropospheric pollutant
gases (e.g., SOz, NOz , 03) can also have a significant
influence on surface UV irradiances (Bais et al . , 1 993) .
9.4.3 Magnitude of Changes
Recent ozone losses in the Northern Hemisphere
have been much larger than expected (Herman and Lar
ko, 1 994; Chapter 4), so that UV increases are much
larger. For the first time, greatly enhanced UV was seen
for extended periods of time in heavily populated lati
tude bands, and there may be future implications for
human health (UNEP, 1 994). However, the UV irradi
ances in 1 993 were still less than for comparable
southern latitudes where ozone and aerosol concentra
tions are lower, and where the minimum Sun-Earth
separation occurs in summer.
Previously, the Radiation Amplification Factor
(RAF) for changes in ozone was defined in terms of a
linear relationship between incremental changes in
ozone (L103) and UV (L1E) :
(9- 1 )
I f this definition i s (incorrectly) applied to the
large depletions in ozone that have occurred recently, the
magnitude of the deduced increase in UV is underesti
mated. To avoid this problem, the radiative change due to
ozone depletion has been reformulated in terms of a
power law (Madronich, 1 993) so that:
RAF = ln(E*/E)/ln(03/03*) , (9-2)
where E* and E are two UV irradiances, and 03* and 03 are corresponding ozone amounts . With this definition,
previously calculated RAF values, which agree well with
9.14
measurements (e.g. , UNEP, 199 1 ), can still be used to
deduce the increases in UV caused by the large reduc
tions in ozone that have occurred in Antarctica and more
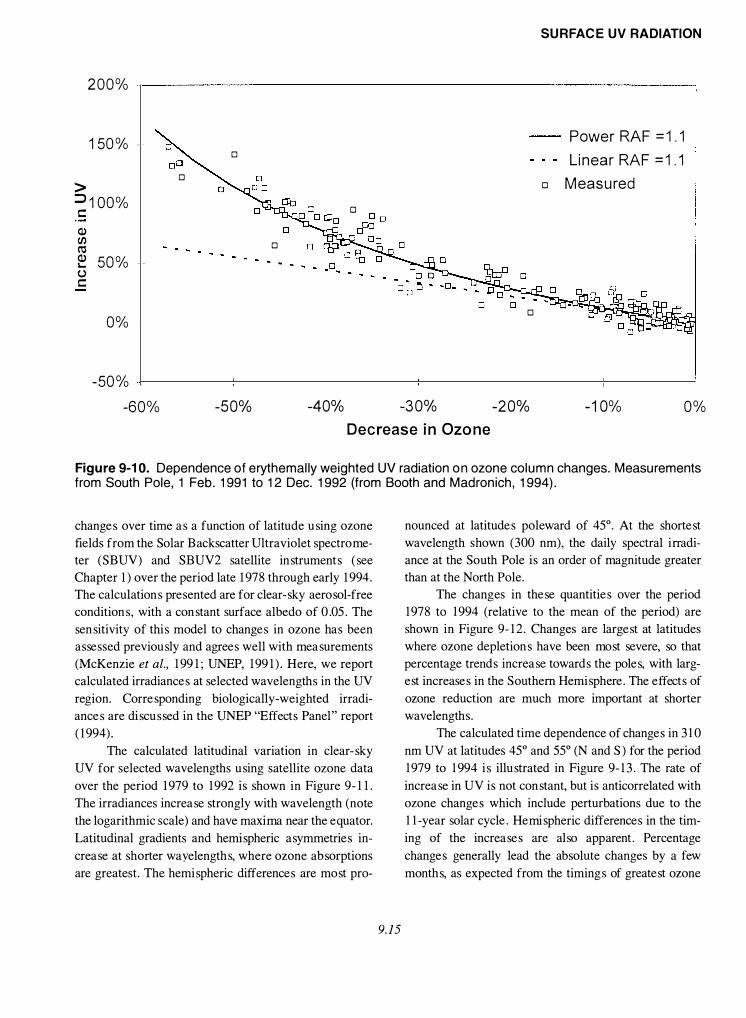
recently at midlatitudes . For example, Booth and Mad
ronich ( 1 994) have used measurements from Antarctica
to show that the power relationship works well, even for
ozone variations of a factor of two (Figure 9- 1 0).
9.5 UPDATE ON PREDICTIONS
9.5.1 Semi-Empirical Method
No suitable data base exists to directly measure
changes in UV that may have already occurred as a result
of ozone depletion. Unfortunately, the potential to calcu
late temporal changes in UV at the surface is also limited
by inadequacies in our capability to model the effects of
clouds. A semi-empirical technique has been imple
mented to overcome these difficulties, so that UV-B can
be inferred using solar pyranometer data to estimate
cloud effects, and ozone data (Ito et al . , 1 994). Satellite
ozone data suitable for these studies are available from
the year 1 978, when ozone depletions were small .
The relationship between pyranometer data and
ozone data to derive UV-B was verified using ground
based measurements of UV spectra at four sites in Japan,
and the technique has been applied to infer historical
records of UV over an eleven-year period at these sites .
Over this period, the long-term changes were found to be
small compared with the year-to-year variability. The
geographical distribution of UV over Japan has also
been deduced (Ito et al., 1994) .
Although the technique is imperfect, the historical
record and geographical differences derived may pro
vide useful information for users such as
epidemiologists . The method will be more useful if it
can be successfully applied to biologically weighted UV
irradiances (e.g. , erythemal irradiance) rather than an un
weighted integral (290-3 1 5 nm) which is relatively
insensitive to ozone changes .
9.5.2 Calculated Changes in Clear-Sky UV
Using Global Ozone Measurements
A multi-layer radiative transfer model (Madron
ich, 1 993) was used to calculate UV irradiances (i. e. , the
flux passing through a horizontal surface) and their
200%
150% - ·
> :::::>1 00% s::: Q) (/) (\1 e 5o% -u s:::
0%
-50% -60%
0
0
-50%
0
0
. . -
0
-40% -30% -20%
SURFACE UV RADIATION
0
Power RAF =1.1 Linear RAF =1.1
Measured
-10% 0% Decrease in Ozone
Figure 9-10. Dependence of erythemally weighted UV radiation on ozone column changes. Measurements from South Pole, 1 Feb. 1991 to 12 Dec. 1992 (from Booth and Madronich, 1994).
changes over time as a function of latitude using ozone
fields from the Solar Backscatter Ultraviolet spectrome
ter (SBUV) and SBUV2 satellite instruments (see
Chapter 1 ) over the period late 1 978 through early 1 994.
The calculations presented are for clear-sky aerosol-free
conditions, with a constant surface albedo of 0.05. The
sensitivity of this model to changes in ozone has been
assessed previously and agrees well with measurements
(McKenzie et al., 1 99 1; UNEP, 1 99 1 ) . Here, we report
calculated irradiances at selected wavelengths in the UV
region. Corresponding biologically-weighted irradi
ances are discussed in the UNEP "Effects Panel" report
( 1 994).
The calculated latitudinal variation in clear-sky
UV for selected wavelengths using satellite ozone data
over the period 1 979 to 1 992 is shown in Figure 9- 1 1.
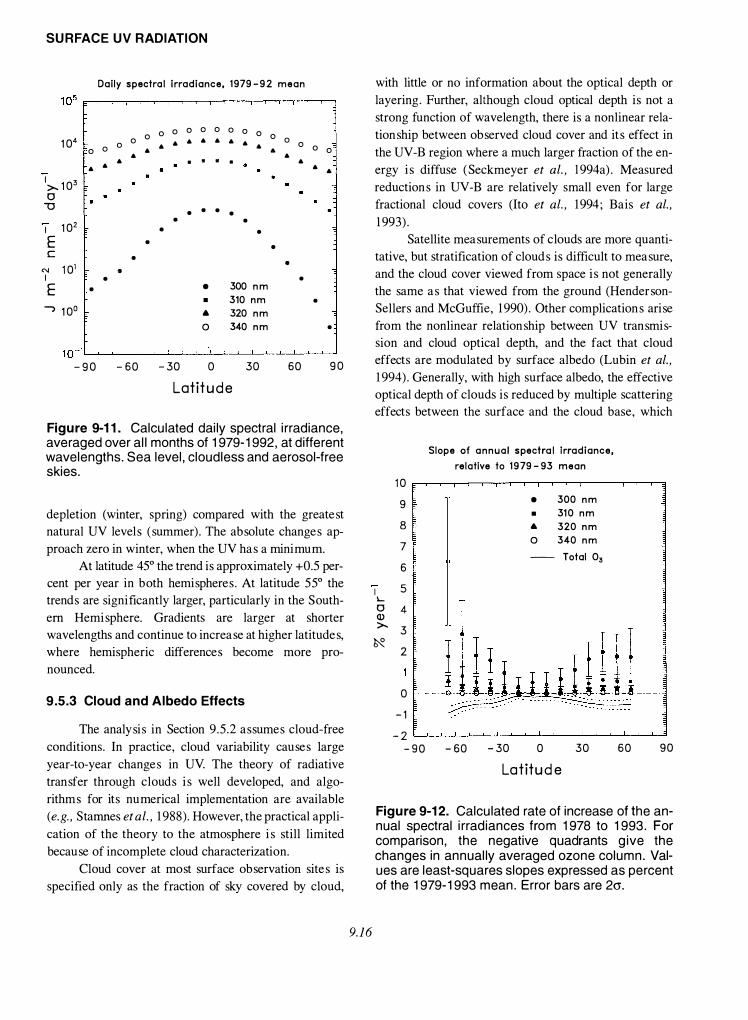
The irradiances increase strongly with wavelength (note
the logarithmic scale) and have maxima near the equator.
Latitudinal gradients and hemispheric asymmetries in
crease at shorter wayelengths, where ozone absorptions
are greatest. The hemispheric differences are most pro-
9.15
nounced at latitudes poleward of 45°. At the shortest
wavelength shown (300 nm), the daily spectral irradi
ance at the South Pole is an order of magnitude greater
than at the North Pole.
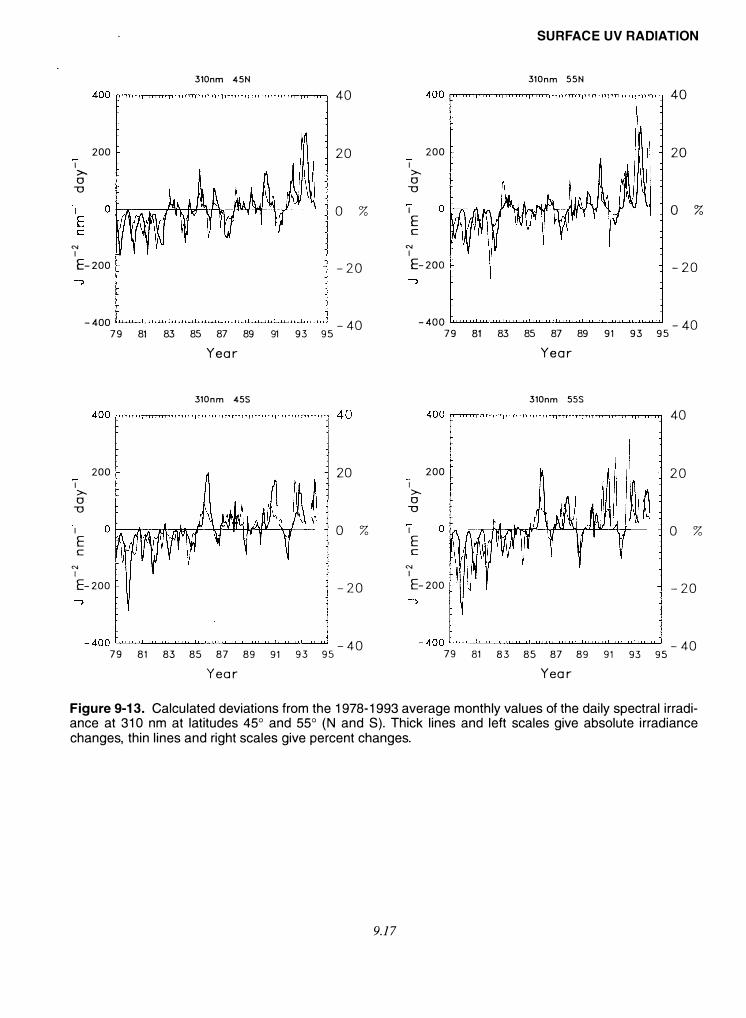
The changes in these quantities over the period
1 978 to 1 994 (relative to the mean of the period) are
shown in Figure 9- 1 2. Changes are largest at latitudes
where ozone depletions have been most severe, so that
percentage trends increase towards the poles, with larg
est increases in the Southern Hemisphere. The effects of
ozone reduction are much more important at shorter
wavelengths.
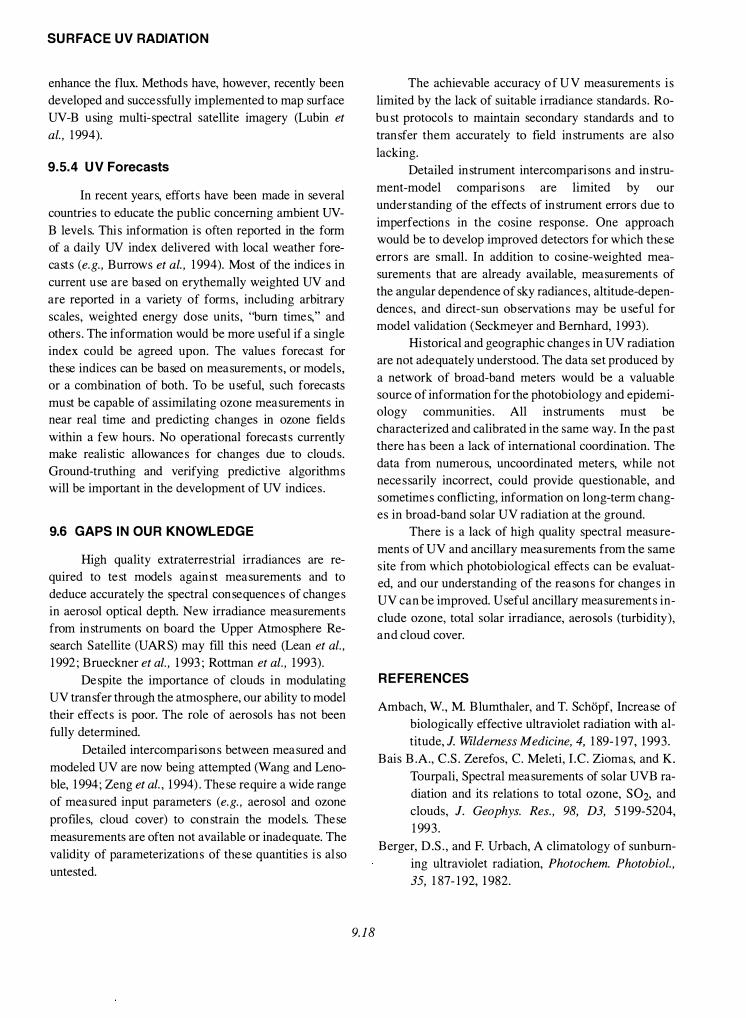
The calculated time dependence of changes in 3 1 0
nm UV at latitudes 45° and 55° (N and S ) for the period
1 979 to 1 994 is illustrated in Figure 9- 1 3. The rate of
increase in UV is not constant, but is anticorrelated with
ozone changes which include perturbations due to the
1 1 -year solar cycle. Hemispheric differences in the tim
ing of the increases are also apparent. Percentage
changes generally lead the absolute changes by a few
months, as expected from the timings of greatest ozone
SURFACE UV RADIATION
Dai ly spectra l i rradiance, 1 979 - 9 2 mean
0 0 0 0 0 0 0 0 1 04 0 0 .. .. .. .. 0 0 0 .. .. .. .. 0 0 0 0 .. .. 0 .. ..
.. .. . . . . .. .. .. ..
I >- 1 03 0
"'0 • • • •
1 02 • •
I • • E • • c • •
<'l 1 01 • I • •
E • • 300 n m • 310 n m •
-, 1 00 .. 320 n m 0 340 n m •
1 0-1L-�������-L��-L����� - 9 0 - 6 0 - 30 0 30 60 9 0
Lat it u d e
Figure 9-11. Calculated daily spectral irradiance, averaged over all months of 1979-1992, at different wavelengths. Sea level, cloudless and aerosol-free skies.
depletion (winter, spring) compared with the greatest
natural UV levels (summer) . The absolute changes ap
proach zero in winter, when the UV has a minimum.
At latitude 45° the trend is approximately +0.5 per
cent per year in both hemispheres . At latitude 55° the
trends are significantly larger, particularly in the South
em Hemisphere. Gradients are larger at shorter
wavelengths and continue to increase at higher latitudes,
where hemispheric differences become more pro
nounced.
9.5.3 Cloud and Albedo Effects
The analysis in Section 9 .5 .2 assumes cloud-free
conditions . In practice, cloud variability causes large
year-to-year changes in UV. The theory of radiative
transfer through clouds is well developed, and algo
rithms for its numerical implementation are available
(e.g. , Starnnes et al., 1 988) . However, the practical appli
cation of the theory to the atmosphere is still limited
because of incomplete cloud characterization.
Cloud cover at most surface observation sites is
specified only as the fraction of sky covered by cloud,
9.1 6
with little or no information about the optical depth or
layering. Further, although cloud optical depth is not a
strong function of wavelength, there is a nonlinear rela
tionship between observed cloud cover and its effect in
the UV-B region where a much larger fraction of the en
ergy is diffuse (Seckmeyer et al., l 994a) . Measured
reductions in UV-B are relatively small even for large
fractional cloud covers (Ito et al., 1 994; Bais et al.,
1 993) .
Satellite measurements of clouds are more quanti
tative, but stratification of clouds is difficult to measure,
and the cloud cover viewed from space is not generally
the same as that viewed from the ground (Henderson
Sellers and McGuffie, 1 990) . Other complications arise
from the nonlinear relationship between UV transmis
sion and cloud optical depth, and the fact that cloud
effects are modulated by surface albedo (Lubin et al.,
1 994) . Generally, with high surface albedo, the effective
optical depth of clouds is reduced by multiple scattering
effects between the surface and the cloud base, which
1 0
9
8
7
6
I 5 L 0 4 (!) >- 3
Slope of a n n u a l s pectra l l rradiance, re lative to 1 9 79 - 93 mean
• 300 n m • 31 0 n m • 320 n m 0 340 n m -- Total 03
� 2
0
- 1
- 2 ��_L�������-L�����
- 9 0 - 5 0 - 30 0 3 0 6 0 9 0
La t it u d e
Figure 9-12. Calculated rate of increase of the annual spectral irradiances from 1978 to 1993. For comparison, the negative quadrants give the changes in annually averaged ozone column. Values are least-squares slopes expressed as percent of the 1979-1993 mean. Error bars are 2cr.
I >--0
-o
"' I
200
E- 200
310nm 45N 40
2 0
0 %
- 2 0
- 400 - 40 7 9 81 83 85 87 89 91 9 3 9 5
I >--0
-o
200
Yea r
310 n m 455
I 0 ������4rt���-4�--E c
"' I E- 2oo
20
0 %
- 2 0
- 4oo���ww���������� - 4 0 9 3 9 5 7 9 8 1 83 85 87 8 9
Y e a r 9 1
SURFACE UV RADIATION
I >--0
-o
200
31 0 n m S S N
I 0 �����������¥-� E c
"' I E- 2oo
40
20
0 %
- 2 0
- 400 - 40 7 9 � 83 85 87 89 9 1 9 3 9 5
I >--0
-o
200
Y e a r
310nm SSS
1 O br�����������--E c
"' I E- 2oo
40
2 0
0 %
- 2 0
- 4oo�������������� - 40 9 5 7 9 81 8 3 8 5 87 8 9
Yea r 9 1 9 3
Figure 9-13. Calculated deviations from the 1978-1993 average monthly values of the daily spectral irradiance at 310 nm at latitudes 45° and 55° (N and S). Thick lines and left scales give absolute irradiance changes, thin lines and right scales give percent changes.
9.1 7
SURFACE UV RADIATION
enhance the flux. Methods have, however, recently been
developed and successfully implemented to map surface
UV-B using multi-spectral satellite imagery (Lubin et
al. , 1 994).
9.5.4 UV Forecasts
In recent years, efforts have been made in several
countries to educate the public concerning ambient UV
B levels. This information is often reported in the form
of a daily UV index delivered with local weather fore
casts (e.g. , Burrows et al. , 1 994). Most of the indices in
current use are based on erythemally weighted UV and
are reported in a variety of forms, including arbitrary
scales, weighted energy dose units , "bum times," and
others . The information would be more useful if a single
index could be agreed upon. The values forecast for
these indices can be based on measurements or models
or a combination of both. To be useful, su�h forecast� must be capable of assimilating ozone measurements in
near real time and predicting changes in ozone fields
within a few hours . No operational forecasts currently
make realistic allowances for changes due to clouds.
Ground-truthing and verifying predictive algorithms
will be important in the development of UV indices .
9.6 GAPS IN OUR KNOWLED GE
High quality extraterrestrial irradiances are re
quired to test models against measurements and to
deduce accurately the spectral consequences of changes
in aerosol optical depth. New irradiance measurements
from instruments on board the Upper Atmosphere Re
search Satellite (UARS) may fill this need (Lean et al. ,
1 992; Brueckner et al. , 1 993; Rottman et al. , 1 993).
Despite the importance of clouds in modulating
UV transfer through the atmosphere, our ability to model
their effects is poor. The role of aerosols has not been
fully determined.
Detailed intercomparisons between measured and
modeled UV are now being attempted (Wang and Leno
ble, 1 994; Zeng et al. , 1 994). These require a wide range
of measured input parameters (e.g. , aerosol and ozone
profiles, cloud cover) to constrain the models. These
measurements are often not available or inadequate. The
validity of parameterizations of these quantities is also
untested.
9. 1 8
The achievable accuracy o f U V measurements is
limited by the lack of suitable irradiance standards . Ro
bust protocols to maintain secondary standards and to
transfer them accurately to field instruments are also
lacking.
Detailed instrument intercomparisons and instru
ment-model comparisons are limited by our
understanding of the effects of instrument errors due to
imperfections in the cosine response. One approach
would be to develop improved detectors for which these
errors are small . In addition to cosine-weighted mea
surements that are already available, measurements of
the angular dependence of sky radiances, altitude-depen
dences, and direct-sun observations may be useful for
model validation (Seckmeyer and Bernhard, 1 993).
Historical and geographic changes in UV radiation
are not adequately understood. The data set produced by
a network of broad-band meters would be a valuable
source of information for the photobiology and epidemi
ology communities . All instruments must be
characterized and calibrated in the same way. In the past
there has been a lack of international coordination. The
data from numerous, uncoordinated meters, while not
necessarily incorrect, could provide questionable, and
sometimes conflicting, information on long-term chang
es in broad-band solar UV radiation at the ground.
There is a lack of high quality spectral measure
ments of UV and ancillary measurements from the same
site from which photobiological effects can be evaluat
ed, and our understanding of the reasons for changes in
UV can be improved. Useful ancillary measurements in
clude ozone, total solar irradiance, aerosols (turbidity),
and cloud cover.
REFERENCES
Ambach, W. , M. Blumthaler, and T. Schopf, Increase of
biologically effective ultraviolet radiation with al
titude, J. Wilderness Medicine, 4, 1 89- 1 97, 1 993 .
Bais B .A., C.S . Zerefos, C. Meleti, I .C . Ziomas, and K.
Tourpali, Spectral measurements of solar UVB ra
diation and its relations to total ozone, S02, and
clouds, J. Geophys. Res. , 98, D3, 5 1 99-5204,
1 993 .
Berger, D .S . , and F. Urbach, A climatology of sunburn
ing ultraviolet radiation, Photochem. Photobiol. ,
35, 1 87- 1 92, 1 982.
Blumthaler, M., Solar UV measurements, in UV-B Radi
ation and Ozone Depletion: Effects on Humans,
Animals, Plants, Microorganisms, and Materials,
edited by M. Tevini, Lewis Publishers, Boca Ra
ton, Florida, USA, 7 1 -94, 1 993 .
Blumthaler, M. , and W. Ambach, Indication of increas
ing solar ultraviolet-B radiation in alpine regions,
Science, 248, 206-208, 1 990.
Blumthaler, M., and W. Ambach, Changes in solar radia
tion fluxes after the Pinatubo eruption, Tell us, 46B,
76-78, 1 994.
Blumthaler, M., W. Ambach, R. Silbernagl, and J.
Staehelin, Erythemal UV-B irradiance (Robert
son-Berger sunburn meter data) under ozone
deficiencies in winter/spring 1 993, Photochem.
Photobiol. , 59, 6, 657-659, 1 994a.
Blumthaler, M., M. Huber, and W. Ambach, Measure
ments of direct and global UV spectra under
varying turbidity, in Proceedings International
Symposium on High Latitude Optics, Tromso,
Norway, 28 June-2 July, 1 993 .
Blumthaler, M. , A.R. Webb, G. Seckmeyer, and A.F.
Bais, Simultaneous spectral UV measurements
applied to the determination of the altitude effect,
presented at WMO Meeting of Experts on UV-B
Measurements, Les Diablerets, Switzerland, 1 8-
2 1 July, 1 994b.
Booth, C.R. , and S . Madronich, Radiation Amplification
Factors : Improved formulation accounts for large
increases in ultraviolet radiation associated with
Antarctic ozone depletion, in Ultraviolet Radia
tion in Antarctica: Measurements and Biological
Research, edited by C. S. Weiler and P. A. Penhale,
AGU Antarctic Research Series, volume 62,
American Geophysical Union, Washington, D.C. ,
39-42, 1 994.
Booth, C.R. , T.B . Lucas, J.H. Morrow, C .S . Weiler, and
P.A. Penhale, The United States National Science
Foundation/Antarctic Program's Network for
Monitoring Ultraviolet Radiation, in Ultraviolet
Radiation in Antarctica: Measurements and Bio
logical Research, edited by C. S. Weiler and P. A.
Penhale, AGU Antarctic Research Series, volume
62, American Geophysical Union, Washington,
D.C. , 1 7-37, 1 994.
9.19
SURFACE UV RADIATION
Booth, C.R. , T.M. Mestechkina, T. Lucas, 1. Tusson, and
J. Morrow, Contrasts in Southern and Northern
Hemisphere high latitude ultraviolet irradiance, in
Proceedings International Symposium on High
Latitude Optics, European Optical Society and In
ternational Society for Optical Engineering,
Tromso, Norway, 28 June-2 July, 1 993 .
Brueckner, G.E. , K.L. Edlow, L.E. Floyd, J .L. Lean, and
M.E. VanHoosier, The Solar Ultraviolet Spectral
Irradiance Monitor (SUSIM) experiment on board
the Upper Atmosphere Research Satellite
(UARS), J. Geophys. Res. , 98, D6, 1 0695 - 1 07 1 1 ,
1 993 .
Burrows, W.R. , M. Vallee, D.l . Wardle, J .B . Kerr, L.J.
Wilson, and D.W. Tarasick, The Canadian opera
tional procedure for forecasting total ozone and
UV radiation, accepted for publication in Met.
Apps. , 1 994.
Cabrera, S . , S. Bozzo, and H. Fuenzalida, Latitudinal
and altitudinal variations of UV radiation along
Chile, submitted to Photochem. Photobiol. , 1 994.
Correll , D.L. , C.O. Clark, B. Goldberg, V.R. Goodrich,
D.R. Hayes, W.H. Klein, and W.D . Scherer, Spec
tral ultraviolet-B radiation fluxes at the Earth's
surface: Long-term variations at 39°N, 77°W, J. Geophys. Res. , 97, 7579-759 1 , 1 992.
Davies, R. , Increased transmission of ultraviolet radia
tion to the surface due to stratospheric scattering,
J. Geophys. Res. , 98, 725 1 -7253 , 1 993 .
DeLuisi, J .J . , Possible calibration shift in the U.S . sur
face UV network instrumentation 1 979 to 1 985,
paper presented at the U.S . Department of Energy
UV-B Critical Issues Workshop, Cocoa Beach,
Florida, 24-26 February, 1 993 .
DeLuisi, J.J. , 1. Wendell, and F. Kreiner, An examination
of the spectral response characteristics of seven
Robertson-Berger meters after long-term field use,
Photochem. Photobiol. , 56, 1 1 5- 1 22, 1 992.
DeLuisi, J .J . , J.M. Barnett, and G.F. Cotton, A close ex
amination of the U.S . Robertson-Berger network:
Detection of a calibration anomaly, submitted to
Geophys. Res. Lett. , 1 994.
Diaz, S .B . , C .R. Booth, T.B . Lucas, and I . Smolskaia,
Effects of ozone depletion on irradiances and bio
logical doses over Ushuaia, Archiev fiir
Hidrologie, special issue in press, 1 994.
SURFACE UV RADIATION
Dichter, B .K., D.J. Beaubien, and A.F. Beaubien, Effects
of ambient temperature changes on UV-B mea
surements using thermally regulated and
unregulated fluorescent phosphor ultraviolet pyra
nometers, in Proceedings Quadrennial Ozone
Symposium, Charlottesville, Virginia, June 1 992,
NASA Conf. Public . 3266, 766-769, 1 994.
Frederick, J.E., and E. C. Weatherhead, Temporal chang
es in surface ultraviolet radiation: A study of the
Robertson-Berger meter and Dobson data records,
Photochem. Photobiol. , 56, 1 23- 1 3 1 , 1 992.
Frederick, J.E., A.E. Koob, A.D. Alberts, and E.C.
Weatherhead, Empirical studies of tropospheric
transmission in the ultraviolet: Broad band mea
surements, J. Appl. Meteorol. , 32, 1 883- 1 892,
1 993a.
Frederick, J.E., P.F. Soulen, S .B . Diaz, I. Smolskaia,
C.R. Booth, T. Lucas, and D. Neuschuler, S olar ul
traviolet irradiance observed from S outhern
Argentina: September 1 990 to March 1 99 1 , J. Geophys. Res. , 98, D5, 889 1 -8897, 1 993b.
Frederick, J.E., S .B . Diaz, I . Smolskaia, W. Esposito, T.
Lucas, and C.R. Booth, Ultraviolet solar radiation
in the high latitudes of South America, submitted
to Photochem. Photobiol. , October 1 993c.
Gardiner, B.G., A.R. Webb, A.F. Bais, M. Blumthaler, I .
Dirmhirn, P. Foster, D. Gillotay, K. Henriksen, M.
Huber, P. J. Kirsch, P.C. Simon, T. Svenoe, P.
Weihs, and C.S . Zerefos, European intercompari
son of ultraviolet spectroradiometers, Environ.
Techn. , 14, 25-43, 1 993.
Grainger, R.G. , R.E. Basher, and R.L. McKenzie, UV-B
Robertson-Berger characterization and field cali
bration, Appl. Optics, 32, 3, 343-349, 1 993 .
Henderson-Sellers, A . , and K. McGuffie, Are cloud
amounts estimated from satellite sensor and con
ventional surface-based observations related?, Int.
J. Remote Sensing, 11 , 3 , 543-550, 1 990.
Herman, J.R., and D. Larko, Low ozone amounts during
1 992- 1 993 from NIMBUS-7 and METEOR-3/
TOMS, J. Geophys. Res. , 99, D2, 3483-3496,
1 994.
9.20
Ito, T. , Y. Sakoda, T. Uekubo, H. Naganuma, M. Fukuda,
and M. Hayashi, Scientific application of UV-B
observations from JMA network, in Proceedings
13th UOEH International Symposium and the 2nd
Pan Pacific Cooperative Symposium on Human
Health and Ecosystems, Kitakyushu, Japan, 1 3- 1 5
October 1 993, i n press, 1 994.
Johnsen, B., and J. Moan, The temperature sensitivity of
the Robertson-Berger sunburn meter, model 500,
J. Photochem. Photobiol. B. : Bioi. , 1 1, 277-284,
1 99 1 .
Justus, C.G., and B .B . Murphey, Temporal trends i n sur
face irradiance at ultraviolet wavelengths, J. Geophys. Res. , 99, Dl, 1 389- 1 394, 1 994.
Kennedy, B.C. , and W.E. Sharp, A validation study of
the Robertson-Berger meter, Photochem. Photobi
ol. , 56, 1 33- 1 4 1 , 1 992.
Kerr, J.B . , and C.T. McElroy, Evidence for large upward
trends of ultraviolet-B radiation linked to ozone
depletion, Science, 262, 1 032- 1 034, 1 993 .
Kerr, J .B. , and C .T. McElroy, Response (to comment by
Michaels et al. , 1 994), Science, 264, 1 342- 1 343,
1 994.
Lean, J., M. VanHoosier, G. Brueckner, D. Prinz, L.
Floyd, and K. Edlow, SUSIM/UARS observations
of the 1 20 to 300 nm flux variations during the
maximum of the solar cycle: Inferences for the
1 1 -year cycle, Geophys. Res. Lett., 1 9, 22, 2203-
2206, 1 992.
Liu, S .C., S .A. McKeen, and S . Madronich, Effect
of anthropogenic aerosols on biologically active
ultraviolet radiation, Geophys. Res. Lett., 1 8, 1 2,
2265-2268, 1 99 1 .
Lubin, D., P. Ricchiazzi, C . Gautier, and R.H. Whritner,
A method for mapping Antarctic surface ultravio
let radiation using multi-spectral satellite imagery,
in Ultraviolet Radiation in Antarctica: Measure
ments and Biological Research, edited by C. S .
Weiler and P. A. Penhale, AGU Antarctic Research
Series, volume 62, American Geophysical Union,
Washington, D.C. , 53-8 1 , 1 994.
Madronich, S . , The atmosphere and UV-B radiation at
ground level, in Environmental UV Photobiology,
edited by A. R. Young et al., Plenum Press, New
York, 1 -39, 1 993 .
Madronich, S . , and C. Granier, Tropospheric chemistry
changes due to increased UV-B radiation, in
Stratospheric Ozone Depletion!UV-B Radiation in
the Biosphere, edited by R. H. Biggs and M. E. B .
Joyner, NATO ASI Series I , Vol l 8, Springer-Ver
lag, 3- 1 0, 1 994.
McKenzie, R.L. , UV radiation monitoring in New
Zealand, in Stratospheric Ozone Depletion!UV-B
Radiation in the Biosphere, edited by R.H. Biggs
and M.E.B . Joyner, NATO ASI Series I, Vol 1 8,
Springer-Verlag, 239-246, 1 994a.
McKenzie, R.L., UV spectral irradiance in New
Zealand: Effects of Pinatubo volcanic aerosol, in
Proceedings Quadrennial Ozone Symposium,
Charlottesville, Virginia, June 1 992, NASA Conf.
Public. 3266, 627-630, 1 994b.
McKenzie, R.L. , P.V. Johnston, M. Kotkamp, A. Bittar,
and J .D. Hamlin, Solar ultraviolet spectroradiome
try in New Zealand: Instrumentation and sample
results from 1 990, Appl. Optics, 31, 30, 650 1 -
6509, 1 992.
McKenzie, R.L. , W.A. Matthews, and P.V. Johnston, The
relationship between erythemal UV and ozone,
derived from spectral irradiance measurements,
Geophys. Res. Lett., 18, 1 2, 2269-2272, 1 99 1 .
McKenzie, R.L. , M . Kotkamp, G . Seckmeyer, R . Erb,
C.R. Roy, H.P. Gies, and S .J. Toomey, First South
ern Hemisphere intercomparison of solar UV
spectra, Geophys. Res. Lett., 20, 20, 2223-2226,
1 993 .
McKinlay, A.F., and B. L . Diffey, A reference spectrum
for ultraviolet induced erythema in human skin, in
Human Exposure to Ultraviolet Radiation: Risks
and Regulations, edited by W. R. Passchler and B .
F. M . Bosnajokovic, Elsevier, Amsterdam, 1 987.
Michaels, PJ. , S .F. Singer, and P.C. Knappenberger,
Analysing Ultraviolet-B radiation: Is there a
trend? Science, 264, 1 34 1 - 1 342, 1 994.
Michelangeli D.V., M. Allen, Y.L. Young, R.-L. Shia, D.
Crisp, and J . Eluszkiewicz, Enhancement of atmo
spheric radiation by an atmospheric aerosol layer,
J. Geophys. Res., 97, Dl, 865-874, 1 992.
NRC, Acid Deposition Long-Term Trends, National Re
search Council, National Academy Press,
Washington, D .C . , 1 986.
9.21
SURFACE UV RADIATION
Prezelin, B .B . , N.P. Boucher, and R.C. Smith, Marine
primary production under the influence of the Ant
arctic ozone hole: Icecolors ' 90, in Ultraviolet
Radiation in Antarctica: Measurements and Bio
logical Research, edited by C. S. Weiler and P. A.
Penhale, AGU Antarctic Research Series, volume
62, American Geophysical Union, Washington,
D.C. , 1 59- 1 86, 1 994.
Rottman, GJ., T.N. Woods, and T.P. Sparn, Solar-Stellar
Irradiance Comparison Experiment 1 : 1 . Instru
ment design and operation, J. Geophys. Res. , 98,
D6, 1 0667- 1 0677, 1 993.
Scotto, J . , G. Cotton, F. Urbach, D. Berger, and T. Fears,
Biologically effective ultraviolet radiation: mea
surements in the United States 1974- 1 985,
Science, 239, 762-764, 1988 .
Seckmeyer, G. , and R.L . McKenzie, Increased ultravio
let radiation in New Zealand ( 45°S) relative to
Germany (48°N), Nature, 359, 1 35- 1 37, 1 992.
Seckmeyer, G. , and G. Bernhard, Cosine error of spec
tral UV-irradiances, in Proceedings International
Symposium on High Latitude Optics, Tromso,
Norway, 28 June-2 July, 1 993 .
Seckmeyer, G. , B . Mayer, R. Erb, and G. Bernhard,
UVB in Germany higher in 1 993 than in 1 992,
Geophys. Res. Lett., 21, 7, 577-580, 1 994a.
Seckmeyer, G., S. Thiel , M. Blumthaler, P. Fabian, S .
Gerber, A . Gugg-Helminger, D.-P. Hader, M. Hu
ber, C. Kettner, U. Kohler, P. Kopke, H. Maier, J.
Schafer, P. Suppan, E. Tamm, and E. Thomalia,
First intercomparison of spectral UV radiation
measurement systems, Appl. Optics, in press,
1 994b.
Setlow, R.B . , The wavelengths in sunlight effective in
producing skin cancer: A theoretical analysis,
Proc. Nat. Acad. Sci. USA., 71(9), 3363-3366,
1 974.
Smith, GJ., M.G. White, and K.G. Ryan, Seasonal
trends in erythemal and carcinogenic ultraviolet
radiation at mid-Southern latitudes 1989- 1 99 1 ,
Photochem. and Photobiol. , 57, 3 , 5 1 3-5 17 , 1 993.
Smith, R.C. , B .B . Prezelin, K.S. Baker, R.R. Bidigare,
N.P. Boucher, T. Coley, D. Karentz, S . Macintyre,
H.A. Matlick, D. Menzies, M. Ondrusek, Z. Wan,
and KJ. Waters, Ozone depletion: Ultraviolet ra
diation and phytoplankton biology in Antarctic
waters, Science, 255, 952-959, 1 992.
SURFACE UV RADIATION
Staehelin, J . , and W. Schmid, Trend analysis of tropo
spheric ozone concentrations utilizing the 20-year
data set of ozone balloon soundings over Payerne
(Switzerland), Atmos. Environ. , 25A, 9, 1 739-
1 749, 1 99 1 .
Starnnes, K. , S .-C. Tsay, W. Wiscombe, and K . Jaya
weera, Numerically stable algorithm for
discrete-ordinate-method radiative transfer in
multiple scattering and emitting layered media,
Appl. Opt. , 27, 2502-2509, 1 988 .
Tevini, M., (ed.) , UV-B Radiation and Ozone Depletion:
Effects on Humans, Animals, Plants, Microorgan
isms, and Materials, Lewis Publishers, Boca
Raton, Florida, USA, 1 993 .
Tsay, S .-C., and K. Starnnes, Ultraviolet radiation in the
Arctic : The impact of potential ozone depletions
and cloud effects, J. Geophys. Res. , 97, 7829-
7840, 1 992.
UNEP, Environmental Effects of Ozone Depletion: 1991
Update, United Nations Environment Programme,
panel report pursuant to Article 6 of the Montreal
Protocol on Substances that Deplete the Ozone
Layer, November 1 99 1 .
UNEP, Environmental Effects of Ozone Depletion: 1994
Update, United Nations Environment Programme,
panel report pursuant to Article 6 of the Montreal
Protocol on Substances that Deplete the Ozone
Layer, in preparation, 1 994.
9.22
Walker, J.H., R.D. Saunders, J.K. Jackson, and K.D.
Mielenz, Results of a CCPR intercomparison of
spectral irradiance measurements by National
Laboratories, J. Res. National Institute of Stan
dards and Technology (NIST), 96, 647-668, 1 99 1 .
Wang, P., and J . Lenoble, Comparison between measure
ments and modeling of UV-B irradiance for clear
sky: A case study, Appl. Optics, 33, 1 8 , 3964-
397 1 , 1 994.
WMO, Scientific Assessment of Ozone Depletion: 1 991,
World Meteorological Organization Global Ozone
Research and Monitoring Project-Report No. 25,
Geneva, 1 992.
Young, A.R., L.O. Bjorn, J. Moan, and W. Nultsch (eds.) ,
Environmental UV Photobiology, Plenum Press,
New York, 1 993.
Zeng, J . , Z. Jin, and K. Starnnes, Impact of stratospheric
ozone depletion on UV penetration into the ocean
at high latitudes, in Underwater Light Measure
ments, edited by H. Chr. Eilertsen, Proc. SPIE
2048, 1 993 .
Zeng, J . , R.L. McKenzie, K. Starnnes, M. Winleland,
and J. Rosen, Measured UV spectra compared
with discrete ordinate method simulations, J. Geo
phys. Res. , in press, 1 994.
Zheng, X., and R.E. Basher, Homogenisation and trend
detection analysis of broken series of solar UV-B
data, Theor. Appl. Climatol. , 47, 4, 1 89-303, 1 993 .