Embed Size (px)
Citation preview
www.elsevier.com/locate/jvolgeores
Journal of Volcanology and Geothermal Research 135 (2004) 169–193
Surface unit characterization of the Mauna Ulu flow field,
Kilauea Volcano, HawaiVi, using integrated field and remote
sensing analyses
Jeffrey M. Byrnesa,*, Michael S. Ramseya, David A. Crowna,b
aDepartment of Geology and Planetary Science, University of Pittsburgh, Pittsburgh, PA 15260-3332, USAbPlanetary Science Institute, Tucson, AZ 85719-23951, USA
Accepted 5 December 2003
Abstract
Investigation of surface units in the Mauna Ulu flow field, Kilauea Volcano, HawaiVi, was conducted through field and
remote sensing analyses. Recently acquired Advanced Spaceborne Thermal Emission and Reflection Radiometer (ASTER) and
MASTER (MODIS/ASTER airborne simulator) datasets, which cover the visible- through thermal-wavelength region, have
been analyzed and correlated with a field-based characterization of Mauna Ulu flow-unit surfaces. Field observations were
made of unit morphologies (decimeter- to decameter-scale) as well as small-scale (millimeter- to centimeter-scale) surface
textures. Estimates were made of the extent of surface crust spallation, as well as the abundance of vesicles and phenocrysts on
the surface crust and spallation surfaces. The field-based characteristics were compared with remote sensing data, including
visible and near-infrared reflectance spectra, thermal infrared emissivity spectra, and emissivity-derived small-scale roughness.
Visible-wavelength characteristics are controlled primarily by color, luster, and decimeter- to meter-scale surface irregularities,
whereas thermal-wavelength characteristics are primarily controlled by the abundance of small-scale roughness elements such
as vesicles. Although individual data pixels are not of sufficient resolution to identify typical individual lava flow units using
point spectra, mean spectra allow characterization of unit surface crusts. Flow-unit morphologies and surface textures are related
to differences in emplacement and post-emplacement modification of VaVa and pahoehoe lobes. Pahoehoe surface properties
reflect the flow regime during emplacement and the history of cooling, degassing, and crystal formation/settling. The nature of
pahoehoe surface crusts indicates that within the wide range of emplacement conditions expressed within the flow field, two
sets of conditions are dominant, producing a bronzy, smooth crust or a dark, rough crust. The former makes up the majority of
the pahoehoe surfaces and reflects minimal cooling and degassing prior to emplacement, whereas the latter reflects cooling and
crystallization during storage within the flow field. This study provides a detailed characterization of Mauna Ulu surface units,
and presents an integrated field and remote sensing approach to mapping and interpreting the emplacement of lava flow fields.
D 2004 Elsevier B.V. All rights reserved.
Keywords: volcanism; remote sensing; lava flows; pahoehoe; Mauna Ulu; HawaiVi
0377-0273/$ - see front matter D 2004 Elsevier B.V. All rights reserved.
doi:10.1016/j.jvolgeores.2003.12.016
* Corresponding author. Tel.: +1-412-624-8773; fax: +1-412-
624-3914.
E-mail address: [email protected] (J.M. Byrnes).
1. Introduction
Knowledge of lava flow emplacement processes is
fundamental to characterizing volcano growth and to
J.M. Byrnes et al. / Journal of Volcanology and Geothermal Research 135 (2004) 169–193170
understanding the development of lava flow fields on
Earth and in other planetary environments. The objec-
tives of this research are to quantitatively characterize
surfaces within the Mauna Ulu lava flow field, Kilauea
Volcano, HawaiVi (Fig. 1), to document relationships
between surface units and remote sensing signatures,
and to use the distribution of surface units to examine
flow field development using remote sensing analyses.
Field observations were made to determine surface
characteristics associated with different types of lava
flow units, to identify which characteristics related to
flow emplacement can be identified remotely, and to
provide a ground-based comparison to the remote
sensing data. Remote sensing analyses utilized recently
acquired Advanced Spaceborne Thermal Emission and
Reflection Radiometer (ASTER) and MASTER
(MODIS/ASTER airborne simulator) datasets (Yama-
guchi et al., 1998; Hook et al., 2001). These datasets
provide a means to extend the spatial and spectral
coverage to almost the entire f 61 km2 Mauna Ulu
flow field from an initialf 6 km2 study site within the
flow field, which was originally investigated to deter-
mine relationships between pahoehoe surface units,
topography, and lava tubes (Byrnes and Crown,
2001). The current study also further develops a field
and remote sensing approach to mapping and interpret-
ing the emplacement of complex volcanic surfaces.
2. Background
Compound basaltic flow fields are emplaced in a
complicated sequence of interfingering and overlap-
ping lava flows. This results in complex surfaces
composed of numerous flow units emplaced in differ-
ent styles and at different times during flow field
evolution. The small-scale (millimeter- to centimeter-
scale) texture and unit-scale (decimeter- to decameter-
scale) morphology of flow surfaces are indicative of
local emplacement conditions and provide important
constraints for understanding flow field development.
For example, surface characteristics have been related
to effusion rate (Walker, 1972; Pinkerton and Sparks,
1976; Rowland and Walker, 1990), style of eruption
and lava transport (Swanson, 1973), flow rheology
(Peterson and Tilling, 1980; Rowland and Walker,
1987), flow inflation (Walker, 1991; Hon et al., 1994),
thermal conditions (Keszthelyi and Denlinger, 1996),
local topography and lava storage (Crown and Baloga,
1999; Byrnes and Crown, 2001), and scale dependen-
cies of lava distributary networks (Crown et al., 1998,
1999, 2001, 2004).
Swanson (1973) described three gradational
pahoehoe types within the Mauna Ulu flow field.
Differences in eruption, transport, and degassing are
reflected in the morphology and surface texture of
these pahoehoe flow types. Near-vent surface-fed
flows formed either smooth-surfaced, dense pahoe-
hoe or shelly pahoehoe, depending on whether the
lava was emplaced from high lava fountains or
overflows of the vent, respectively. Dense, near-vent
pahoehoe was fountain-fed, which allowed degassing
and produced relatively vesicle-free lava in thin flow
units. These flows commonly formed broad, leveed
channels with associated overflows that, except for
their lack of tumuli, are grossly similar to hummocky
tube-fed pahoehoe. Surface units fed from non-foun-
taining vent overflows were gas rich and produced
shelly pahoehoe, which contains cavities formed by
volatile exsolution and/or draining of the flow inte-
rior. These flows were emplaced as toes and sheets
with crusts that may display fractures, buckles, and
festoons. Dense, hummocky, tube-fed pahoehoe in
the medial and distal portions of the flow field has
an intermediate vesicularity indicative of limited
degassing during transport through the lava tube
system. These flow units have smooth and common-
ly glassy surfaces, commonly form lobes of pahoe-
hoe toes, and display tumuli. Both fountain-fed and
tube-fed flows undergo the transition to VaVa in
various places within the Mauna Ulu flow field
(Swanson, 1973).
In addition to a range of meter-scale surface
morphologies, differences in small-scale texture have
been described. Wilmoth and Walker (1993) charac-
terized differences in vesicles for tube-fed flows in
the Mauna Ulu and Kupaianaha flow fields. S-type
(spongy) pahoehoe displays selvages (outer f 6 cm)
containing abundant (>40 vol.%), small (< 4 mm),
approximately spherical vesicles. P-type (pipe-vesicle
bearing) pahoehoe is less common and displays lower
vesicularity, lower porosity, and larger vesicles (in-
cluding pipe vesicles near the base of each flow unit)
relative to S-type pahoehoe. P-type pahoehoe may
also be distinguished in young basalt flows based
upon its distinct bluish surface coloration. S-type
J.M. Byrnes et al. / Journal of Volcanology and Geothermal Research 135 (2004) 169–193 171
pahoehoe commonly spalls flakes of the surface skin
(millimeter-scale thickness) during and immediately
following emplacement, whereas spallation is negli-
gible for P-type pahoehoe. Wilmoth and Walker
(1993) suggest that spallation of S-type crust occurs
due to focusing of thermal-contraction stresses within
the vesicular selvage that does not occur within the
dense P-type crust.
Vesicles are significant for several reasons in
addition to their effect of increasing bulk flow vis-
cosity (e.g. Polacci et al., 1999). The distribution of
vesicles is indicative of pahoehoe eruption and trans-
port styles, as described above for fountain- vs. vent
overflow-fed and surface- vs. tube-fed pahoehoe
flows (Swanson, 1973). Vesicles also affect flow
cooling, as increased surface vesicle abundance pro-
motes cooling of flow lobes (Keszthelyi and Denlin-
ger, 1996; Harris et al., 1998). Furthermore, vesicle
distributions are correlated with flow ponding, coa-
lescence, and inflation, reflecting the local pressure
and cooling conditions at the interface of a flow’s
surface crust and molten interior (Hon et al., 1994;
Cashman and Kauahikaua, 1997).
3. The Mauna Ulu flow field
The Mauna Ulu satellitic shield is located on the
upper east rift zone of Kilauea Volcano (Fig. 1). An
approximately 61-km2 flow field was emplaced from
Mauna Ulu and local vents in two main episodes.
The long-lived eruption (May 1969 to July 1974)
displayed a wide variety of activity, including fire-
fountaining (up to >500 m high), ‘‘gas-piston’’ cycles
of lava column rise and fall, and the development of
an extensive lava tube system that fed flows more
than 12 km from the vent region to the Pacific Ocean
(Swanson, 1973; Swanson et al., 1979; Tilling et al.,
1987).
Holcomb (1976) mapped the distribution of VaVa aswell as surface-fed and tube-fed pahoehoe within the
Mauna Ulu flow field. He indicated that tube-fed
pahoehoe flows emanated from ‘‘master lava tube
systems’’ that are marked by low, broad ridges.
Swanson (1973) suggested that most of the Mauna
Ulu tube-fed pahoehoe was probably emplaced from
small, distributary tubes that branched from the
master tubes.
4. Field characterization of the Mauna Ulu flow
field
4.1. Initial Mauna Ulu site study
The Mauna Ulu flow field was chosen because the
flows are well exposed and relatively pristine (mostly
free of soil and vegetation), and because the eruption
was long lived and well documented (e.g. Moore et
al., 1973; Swanson, 1973; Holcomb, 1976, 1987;
Swanson et al., 1979; Tilling et al., 1987). In addition,
the Mauna Ulu flow field has been imaged by a
variety of remote sensing instruments at multiple
wavelengths. An initial site within the Mauna Ulu
flow field (Byrnes and Crown, 2001) was selected to
examine the diversity of pahoehoe surface units; this
site is within flows that were mapped by Holcomb
(1976) as tube-fed flows and classified as dense,
hummocky pahoehoe by Swanson (1973). The initial
study site is located on and below Holei Pali 7 to 9 km
from the Mauna Ulu vent and covers f 6.2 km2
(f 10% of the flow field). Four varieties of pahoehoe
lava flow surface units were defined and mapped
using high-resolution color aerial photographs
(Byrnes and Crown, 2001). Field observations indi-
cated that the visible-wavelength signatures repre-
sented in the photographs are controlled by the
characteristic colors, surface textures (roughness and
presence or lack of glassy crust), and morphologies
(sheets, toes, or channels) of these units.
The four pahoehoe units mapped in the initial
study area display primary morphologies related to
their emplacement. These morphologies range from
sheets (broad, flat units occurring where emplacement
is unconfined, or resulting from the coalescence and
inflation of toes and/or small sheets and channels) to
toes (small units, interconnected networks of which
form small to intermediate lobes) to channels (cen-
tralized area of flow concentration, occurring where
local flow rates are sufficiently high) (Byrnes and
Crown, 2001). Flow-unit surfaces may be smooth,
ropy, or slabby, gradational to a clinkery VaVa texture.
Unit I is characterized by highly reflective, bronze-
colored sheets that display little decimeter-scale to-
pography, large occurrences of which display com-
posite surfaces containing coalesced small sheets and/
or toes. Unit II is composed of lobes of pahoehoe toes
that display a similar crust and preserve decimeter-
J.M. Byrnes et al. / Journal of Volcanology and Geothermal Research 135 (2004) 169–193172
J.M. Byrnes et al. / Journal of Volcanology and Geothermal Research 135 (2004) 169–193 173
scale toe topography, and is transitional to unit I with
increased flow coalescence and inflation. Although
unit I and II have similar surface crusts, examination
of which is a focus of the current study, they are
distinguished based on their primary morphology,
either sheet (unit I) or toe network (unit II). Unit III
is composed of lobes of dark pahoehoe toes that lack a
smooth, reflective surface crust, appears to have had a
higher flow viscosity during emplacement (based on
relatively equant toes and vesicles preserved on ex-
posure surfaces), and represents locally late-stage
emplacement (based upon stratigraphic position, and
consistent with inferred viscosity). Unit IV typically
exhibits a disrupted, slabby surface that includes
primary unit I, II, and III surfaces and is transitional
to VaVa. Unit IV is commonly found in channelized
zones that may be bordered by lateral levees. Byrnes
and Crown (2001) provide detailed descriptions and
field photographs of these units.
The surface unit distribution was found to be
correlated with pre-eruption topography and position
within the flow field (i.e. along lateral flow field
margins vs. within lobe interiors away from the
margins) (Byrnes and Crown, 2001). Units were not
found to be spatially correlated with the main feeder
lava tubes mapped by Holcomb (1976), consistent
with the assessment of Swanson (1973) that lava was
emplaced primarily from distributary tubes rather than
master tube segments. Recent field mapping (Crown
et al., 2001, 2004) indicates that the Mauna Ulu lava
tube network is more complex than is shown by
Holcomb (1976), which is consistent with mapping
of active lava tubes within the PuVu VOVo-Kupaianahaflow field (Mattox et al., 1993; Kauahikaua et al., in
press) and suggests that Holcomb’s mapping was not
sufficiently detailed to accurately represent tube sys-
tem geometry. Small-scale textures of surface crusts
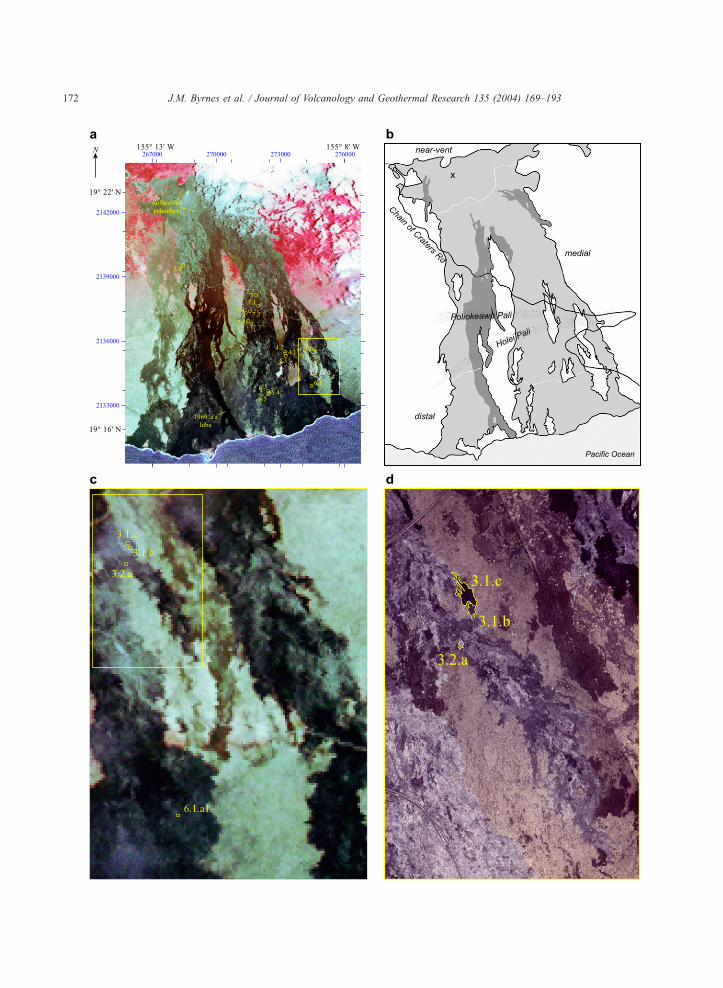
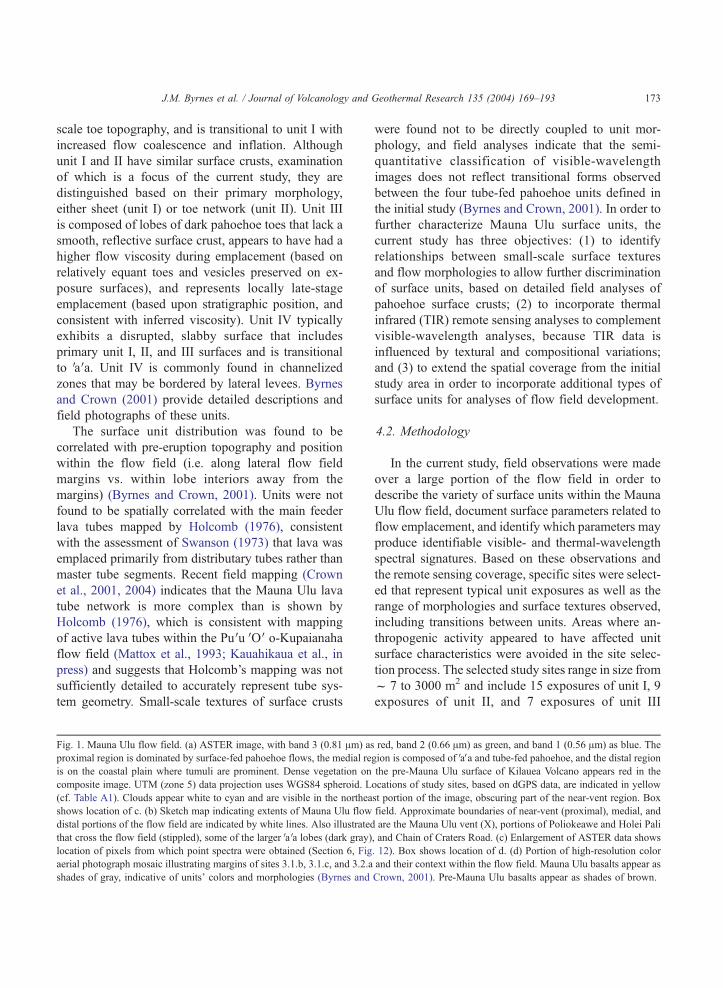
Fig. 1. Mauna Ulu flow field. (a) ASTER image, with band 3 (0.81 Am) as
proximal region is dominated by surface-fed pahoehoe flows, the medial re
is on the coastal plain where tumuli are prominent. Dense vegetation on
composite image. UTM (zone 5) data projection uses WGS84 spheroid. L
(cf. Table A1). Clouds appear white to cyan and are visible in the northea
shows location of c. (b) Sketch map indicating extents of Mauna Ulu flow
distal portions of the flow field are indicated by white lines. Also illustrated
that cross the flow field (stippled), some of the larger VaVa lobes (dark gray)
location of pixels from which point spectra were obtained (Section 6, Fig
aerial photograph mosaic illustrating margins of sites 3.1.b, 3.1.c, and 3.2.a
shades of gray, indicative of units’ colors and morphologies (Byrnes and
were found not to be directly coupled to unit mor-
phology, and field analyses indicate that the semi-
quantitative classification of visible-wavelength
images does not reflect transitional forms observed
between the four tube-fed pahoehoe units defined in
the initial study (Byrnes and Crown, 2001). In order to
further characterize Mauna Ulu surface units, the
current study has three objectives: (1) to identify
relationships between small-scale surface textures
and flow morphologies to allow further discrimination
of surface units, based on detailed field analyses of
pahoehoe surface crusts; (2) to incorporate thermal
infrared (TIR) remote sensing analyses to complement
visible-wavelength analyses, because TIR data is
influenced by textural and compositional variations;
and (3) to extend the spatial coverage from the initial
study area in order to incorporate additional types of
surface units for analyses of flow field development.
4.2. Methodology
In the current study, field observations were made
over a large portion of the flow field in order to
describe the variety of surface units within the Mauna
Ulu flow field, document surface parameters related to
flow emplacement, and identify which parameters may
produce identifiable visible- and thermal-wavelength
spectral signatures. Based on these observations and
the remote sensing coverage, specific sites were select-
ed that represent typical unit exposures as well as the
range of morphologies and surface textures observed,
including transitions between units. Areas where an-
thropogenic activity appeared to have affected unit
surface characteristics were avoided in the site selec-
tion process. The selected study sites range in size from
f 7 to 3000 m2 and include 15 exposures of unit I, 9
exposures of unit II, and 7 exposures of unit III
red, band 2 (0.66 Am) as green, and band 1 (0.56 Am) as blue. The
gion is composed of VaVa and tube-fed pahoehoe, and the distal regionthe pre-Mauna Ulu surface of Kilauea Volcano appears red in the
ocations of study sites, based on dGPS data, are indicated in yellow
st portion of the image, obscuring part of the near-vent region. Box
field. Approximate boundaries of near-vent (proximal), medial, and
are the Mauna Ulu vent (X), portions of Poliokeawe and Holei Pali
, and Chain of Craters Road. (c) Enlargement of ASTER data shows
. 12). Box shows location of d. (d) Portion of high-resolution color
and their context within the flow field. Mauna Ulu basalts appear as
Crown, 2001). Pre-Mauna Ulu basalts appear as shades of brown.
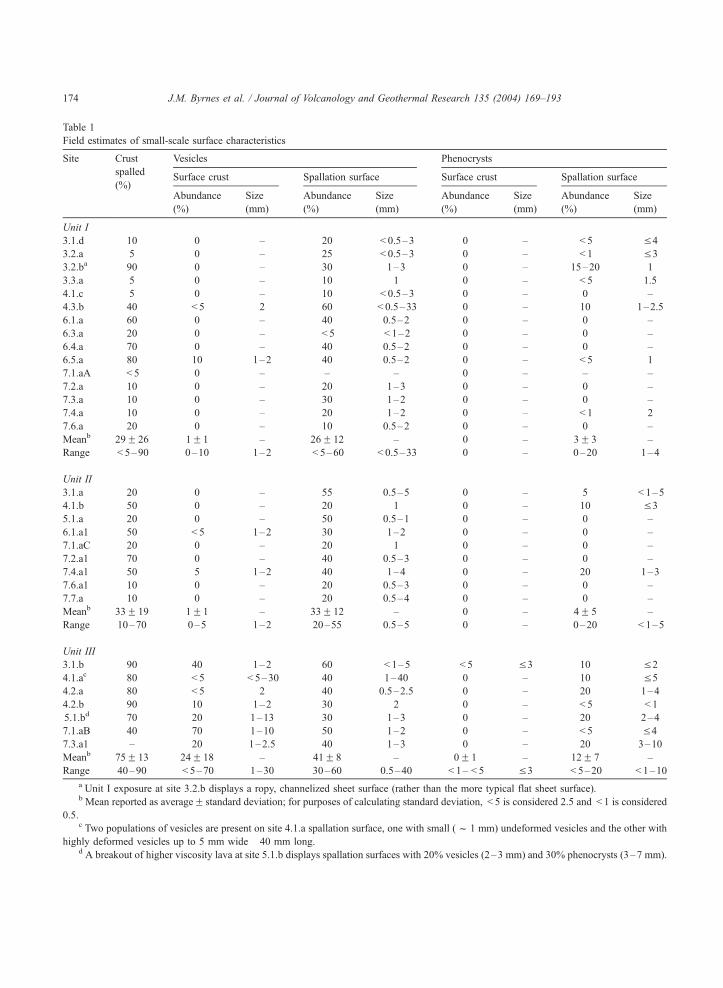
Table 1
Field estimates of small-scale surface characteristics
Site Crust Vesicles Phenocrysts
spalledSurface crust Spallation surface Surface crust Spallation surface
(%)Abundance
(%)
Size
(mm)
Abundance
(%)
Size
(mm)
Abundance
(%)
Size
(mm)
Abundance
(%)
Size
(mm)
Unit I
3.1.d 10 0 – 20 < 0.5–3 0 – < 5 V 4
3.2.a 5 0 – 25 < 0.5–3 0 – < 1 V 3
3.2.ba 90 0 – 30 1–3 0 – 15–20 1
3.3.a 5 0 – 10 1 0 – < 5 1.5
4.1.c 5 0 – 10 < 0.5–3 0 – 0 –
4.3.b 40 < 5 2 60 < 0.5–33 0 – 10 1–2.5
6.1.a 60 0 – 40 0.5–2 0 – 0 –
6.3.a 20 0 – < 5 < 1–2 0 – 0 –
6.4.a 70 0 – 40 0.5–2 0 – 0 –
6.5.a 80 10 1–2 40 0.5–2 0 – < 5 1
7.1.aA < 5 0 – – – 0 – – –
7.2.a 10 0 – 20 1–3 0 – 0 –
7.3.a 10 0 – 30 1–2 0 – 0 –
7.4.a 10 0 – 20 1–2 0 – < 1 2
7.6.a 20 0 – 10 0.5–2 0 – 0 –
Meanb 29F 26 1F1 – 26F 12 – 0 – 3F 3 –
Range < 5–90 0–10 1–2 < 5–60 < 0.5–33 0 – 0–20 1–4
Unit II
3.1.a 20 0 – 55 0.5–5 0 – 5 < 1–5
4.1.b 50 0 – 20 1 0 – 10 V 3
5.1.a 20 0 – 50 0.5–1 0 – 0 –
6.1.a1 50 < 5 1–2 30 1–2 0 – 0 –
7.1.aC 20 0 – 20 1 0 – 0 –
7.2.a1 70 0 – 40 0.5–3 0 – 0 –
7.4.a1 50 5 1–2 40 1–4 0 – 20 1–3
7.6.a1 10 0 – 20 0.5–3 0 – 0 –
7.7.a 10 0 – 20 0.5–4 0 – 0 –
Meanb 33F 19 1F1 – 33F 12 – 0 – 4F 5 –
Range 10–70 0–5 1–2 20–55 0.5–5 0 – 0–20 < 1–5
Unit III
3.1.b 90 40 1–2 60 < 1–5 < 5 V 3 10 V 2
4.1.ac 80 < 5 < 5–30 40 1–40 0 – 10 V 5
4.2.a 80 < 5 2 40 0.5–2.5 0 – 20 1–4
4.2.b 90 10 1–2 30 2 0 – < 5 < 1
5.1.bd 70 20 1–13 30 1–3 0 – 20 2–4
7.1.aB 40 70 1–10 50 1–2 0 – < 5 V 4
7.3.a1 – 20 1–2.5 40 1–3 0 – 20 3–10
Meanb 75F 13 24F 18 – 41F 8 – 0F 1 – 12F 7 –
Range 40–90 < 5–70 1–30 30–60 0.5–40 < 1– < 5 V 3 < 5–20 < 1–10
a Unit I exposure at site 3.2.b displays a ropy, channelized sheet surface (rather than the more typical flat sheet surface).b Mean reported as averageF standard deviation; for purposes of calculating standard deviation, < 5 is considered 2.5 and < 1 is considered
0.5.c Two populations of vesicles are present on site 4.1.a spallation surface, one with small (f 1 mm) undeformed vesicles and the other with
highly deformed vesicles up to 5 mm wide� 40 mm long.d A breakout of higher viscosity lava at site 5.1.b displays spallation surfaces with 20% vesicles (2–3 mm) and 30% phenocrysts (3–7 mm).
J.M. Byrnes et al. / Journal of Volcanology and Geothermal Research 135 (2004) 169–193174
J.M. Byrnes et al. / Journal of Volcanology and Geothermal Research 135 (2004) 169–193 175
(Table 1), which were geolocated using a high-resolu-
tion (f 10 cm horizontal accuracy) differential Global
Positioning System receiver (dGPS; Fig. 1, Appendix
A). Descriptions of each site were compiled, noting
unit morphology and color, context within the flow
field and local stratigraphic relationships, topographic
characteristics, and small-scale characteristics such as
vesicularity, phenocryst abundance, and microtopog-
raphy. For exposures of units I–III, estimates were
made of the degree of spallation of flow-unit surfaces
(expressed as the areal percentage of spalled vs. intact
crust), and the areal abundance and size of vesicles and
phenocrysts on surface crusts and spallation surfaces.
The degree of spallation for units I–III was estimated
over the entire unit exposure at a given site. Vesicular-
ity and phenocryst abundance and size were estimated
by selecting and describing representative areas (typ-
ically 5–10% of the unit exposure) of the surface crust
and spallation surfaces. These estimates were made in
order to characterize the range of surfaces observed and
understand gradations between unit surfaces. Values
for unit IVand VaVa surfaces were not obtained. Unit IVsurfaces are highly variable, containing slabs that are
interpreted to have formed initially as other units and
subsequently to have been disrupted, representing a
transitional phase to the development of VaVa clinkers.
VAVa surfaces do not typically preserve any quenched,
glassy crust, and vesicularity estimates are not possible
on these surfaces. Qualitative comparisons, however,
were made to near-vent (fountain-fed and shelly), P-
type, and unit IV pahoehoe varieties, as well as VaVa.
4.3. Results
Morphologically, unit I exposures at the decimeter-
to meter-scale typically are flat or display ropy,
channelized zones and range from individual sheets
to composite surfaces composed of coalesced toes and
sheets. The unit exhibits the lowest mean degree of
crust spallation (29%; Table 1), although also is
characterized by a wide range in this value. Surface
crusts display limited (< 5%), small (1 –2 mm)
vesicles and no phenocrysts, tend to be bronzy and
glassy, and may be smooth or display mm-size ridges
or dark, glassy knobs. Unit I spallation surfaces
display more and larger vesicles than non-spalled
crust, some small phenocrysts, and are concentrated
in areas within the unit that have undergone deforma-
tion due to surface folding during emplacement or
local post-emplacement inflation. Two types of sur-
face coatings or alteration have been observed at some
locales: (1) a white variety spatially associated with
small cracks, possibly gypsum; and (2) a splotchy,
yellow to orange variety that appears to be preferen-
tially associated with pahoehoe ropes but is also found
in flat parts of exposures, which is likely palagonite
(e.g. Crisp et al., 1990; McBirney, 1993). The areal
extent of observed alterations and coatings varies
within individual exposures of a unit and between
adjacent units, but is typically minimal.
Unit II exposures consist of lobes of toe networks
that display a similar low mean degree of crust
spallation (33%; Table 1) and exhibit both smooth
surfaces and small, ropy, channelized zones. Similar
to unit I, unit II surface crusts display limited (< 5%),
small (1–2 mm) vesicles and no phenocrysts, tend to
be bronzy and glassy, and may be smooth or display
millimeter-scale ridges and/or dark, glassy knobs.
Spallation surfaces are commonly more vesicular than
those of unit I and exhibit phenocrysts, and are also
associated with disrupted areas. Both the white and
splotchy surface coatings/alteration have been ob-
served on unit II surfaces.
Unit III exposures consist of lobes of toe networks
that may be smooth (at the decimeter-scale), ropy, or
slabby. Toes tend to be more equant, lobes are thicker,
and crust spallation is more prevalent relative to toes
of unit II. Unit III is generally the last unit emplaced
locally, based on flow stratigraphy, and is fed as
breakouts from other surface units. Unit III surface
crusts have relatively high vesicularities, may display
phenocrysts, and typically are dark and rough (milli-
meter- to centimeter-scale) due to the presence of
glassy knobs and/or ridges. Some unit III exposures
feed breakouts of even darker, more viscous lava that
typically displays more abundant and larger vesicles
and phenocrysts. In limited areas, the unit III surface
crust displays rare bronzy glass filaments similar to
those that are a common part of unit I and II surface
crusts. Spallation surfaces display more and larger
vesicles and phenocrysts. The splotchy variety of
surficial coating/alteration tends to be orange and is
commonly found on pahoehoe ropes.
Unit IV exposures are typically areally extensive
and commonly bounded by levees. They display
highly disrupted surfaces composed of jumbled plates

J.M. Byrnes et al. / Journal of Volcanology and Geothermal Research 135 (2004) 169–193176
and slabs exhibiting textures associated with units I,
II, and III that are intermixed with VaVa clinkers. VAVasurfaces typically lack glass, may be dark gray to red,
and are rough at the millimeter- to decimeter-scale.
Other varieties of pahoehoe were also observed,
including surface-fed and transitional units. Both
shelly pahoehoe and dense, fountain-fed pahoehoe
typically display a bronzy surface crust similar to
units I and II (Fig. 2). The fountain-fed pahoehoe
units are generally large (Fig. 2a) and display a
relatively smooth, bronzy surface crust and a range
of morphologies consistent with emplacement as
sheets, channels, and large (meter-scale), elongate
toes. Shelly pahoehoe displays a similar bronzy ap-
pearance, although it is not typically as smooth.
Shelly pahoehoe may be emplaced as sheets or toes
and is hollow beneath the upper few centimeters, and
with collapse of the shelly crust is transitional to a
Fig. 2. Surface-fed pahoehoe in the Mauna Ulu proximal region. (a)
Overview, showing folded and buckled shelly pahoehoe in the
foreground (on which B. Banks is standing), fountain-fed pahoehoe
in midground, and Mauna Ulu vent in background. (b) Detail of
shelly pahoehoe surface, displaying the altered glassy crust and
small portions of the spallation surface (sp).
disrupted surface similar to unit IV. Intermediate units
that display transitions to both surface-fed varieties
were also observed, indicated by Swanson (1973) to
have formed from low (< 100 m) lava fountains. The
surface-fed flows observed in the proximal region
have undergone significant post-emplacement degra-
dation of their surfaces compared to tube-fed flows in
the medial and distal regions, presumably due to
greater rainfall in the proximal region (f 3 m at the
vent vs. f 1 m at the coast; Hawaii Statewide GIS
Program data available at http://www.state.hi.us/
dbedt/gis/). Those units closest to the vent have
additionally been subjected to post-emplacement
chemical alteration due to degassing and potentially
steam interaction.
Field estimates of spallation, vesicle abundance,
and phenocryst abundance are shown in Table 1. Each
of the units displays a wide range in the proportion of
surface crust that has been spalled and the abundance
of vesicles and phenocrysts. The mean areal percent
of spalled crust is similar for units I (29%) and II
(33%) and significantly higher for unit III (75%).
Spallation appears to occur at different scales, from
flaking of the outermost skin (millimeter-scale thick-
ness) to fracturing and removal of crust (centimeter-
scale thickness), which exposes darker, progressively
higher-vesicularity portions of a flow-unit’s interior.
Most of the vesicles that had formed on the surfaces of
units I and II were stretched and flattened due to
plastic deformation of the crust during emplacement.
Unit III tends to preserve the concave surface expres-
sion of vesicles, although vesicles may be deformed.
Vesicularity within flow units indicates that units I, II,
and III are S-type pahoehoe. Vesicularity estimates
were not made for VaVa surfaces; however, these
surfaces were consistently found to have greater
millimeter- to centimeter-scale roughness than the
pahoehoe units. Olivine is the only phenocryst min-
eral identified. Phenocryst abundance on the spall-
ation surface (Table 1) is higher within unit III
exposures (12%) than for units I (3%) and II (4%).
Transitions between the four tube-fed pahoehoe
units are common. Unit I sheets undergo a transition
to unit II toes at their margins due to decreased flow
rate, and unit II toey lobes undergo a transition to unit
I sheets through coalescence and inflation of the flow
unit (Byrnes and Crown, 2001). A transitional unit
that is intermediate between units I and III is present
J.M. Byrnes et al. / Journal of Volcanology and Geothermal Research 135 (2004) 169–193 177
in the medial region above Holei Pali. It displays a
unit I sheet morphology and a surface texture similar
to unit III, attributed to high supply rates relative to
typical, toey unit III exposures and a degree of
apparent pre-emplacement cooling intermediate to
the typical unit I and III end members. Unit I, II,
and III morphologies may all change to a unit IV
morphology with disruption of the flow surface,
commonly associated with increased flow rate and/
or inflation and generally manifested as breaking of
the unit into slabs. Additionally, units III and IV are
transitional to an VaVa texture with increased disruption
of the flow surface.
Our observations indicate that S-type pahoehoe is
much more abundant than P-type at Mauna Ulu,
consistent with the findings of Wilmoth and Walker
(1993). We observed one exposure of P-type pahoe-
hoe below Holei Pali (site 6.2.a, Appendix A), which
is similar to descriptions by Wilmoth and Walker
(1993). The exposure displays a glassy blue crust that
lacks vesicles and phenocrysts and exhibits millime-
ter-scale knobs and minimal crust spallation (< 5%).
The spallation surface contains < 1% vesicles (0.5–
1.0 mm). Void spaces observed in the unit interior
were few in number, but were large (decimeter scale)
and occupied a substantial proportion of the volume
of small lobes. The splotchy surface coating/alteration
was observed to be extensive on the exposure, and the
white ‘‘crack filling’’ variety was also observed.
4.4. Significance
Detailed characterization of pahoehoe surfaces
yields a wide range of estimated values of surface
spall, vesicle abundance, and phenocryst abundance.
This indicates that each of the units may be produced
under a variety of conditions, which is consistent with
the observed unit transitions. The characterization also
indicates, however, that the smooth, bronzy surface
crust (units I and II) and the dark, rough surface crust
(unit III) represent two primary surface textures that
presumably reflect dominant conditions for Mauna
Ulu pahoehoe emplacement. Because spallation is
related to stresses that develop in the lava crust, the
greater amount of unit III spallation and lesser degree
of vesicle deformation on exposed unit III spallation
surfaces indicates that it had a different thermal
history from that of units I and II. Specifically, the
exposed surfaces of units I and II were able to
plastically deform surface bubbles, producing
stretched, flattened vesicles, whereas unit III expo-
sures display vesicles that preserve concavity and
exhibit little flow deformation, although brittle defor-
mation of vesicles appears to have occurred. The
abundance of vesicles and nature of vesicle deforma-
tion are consistent with previous field observations
that suggested unit III was relatively viscous during
emplacement (Crown and Baloga, 1999; Byrnes and
Crown, 2001).
Phenocrysts are indicative of cooling history and
may indicate prolonged storage within the subsurface
lava tube distributary network or may be transported
from the vent. The high phenocryst abundance of unit
III (relative to units I and II) contributes to higher bulk
flow viscosity (assuming the flow surfaces are repre-
sentative of the bulk flow, which is suggested by our
observations of unit interiors). Furthermore, the abun-
dance of phenocrysts, coupled with the observation
that unit III tends to locally be the last emplaced,
supports the hypothesis that the lava has experienced
storage in the subsurface distributary network (Crown
and Baloga, 1999; Byrnes and Crown, 2001). Two
mechanisms may produce differences in unit pheno-
cryst content: (1) crystal growth during storage within
the flow field; and (2) sorting due to crystal settling.
Whereas both processes could contribute to high unit
III phenocryst abundance, neither process alone is
likely to be efficient enough to produce the observed
dichotomy in phenocryst abundance.
Unit IV and VaVa textures indicate that the flow
surface experienced substantial disruption. In this
respect, they are secondary textures, although unit
IV preserves primary surface crusts on disrupted
slabs and plates. Similarities between surface-fed
pahoehoe and tube fed units I and II indicate that
similar sheet and toe flow regimes occurred through-
out the flow field, although several important differ-
ences are important for understanding flow field
development. The larger areal extent of individual
surface-fed toes and sheets suggests that the volu-
metric supply rate was greater for these units than
locally from lava tubes, consistent with observations
made of the emplacement of these units (Swanson,
1973). Furthermore, surface-fed flows do not gener-
ally appear to have undergone flow inflation, and the
significant differences in unit vesicularity (which
J.M. Byrnes et al. / Journal of Volcanology and Geothermal Research 135 (2004) 169–193178
affects flow rheology) suggest that the actual em-
placement of lava is more varied than is indicated by
the resulting morphologies.
These analyses indicate that the various morpholo-
gies and textures may form under a range of condi-
tions. For example, toes indicate low local flow rates
during emplacement, whereas sheets and channels
reflect successively higher flow rates (for similar
topography and flow substrate). Field relationships
indicate that smooth crusts are associated with flow
units (I and II) that were relatively hot and fluid during
emplacement, whereas greater areas of spalled vesic-
ular surface are associated with lava that had experi-
enced a greater degree of cooling prior to emplacement
(unit III). Combining morphologic and textural infor-
mation therefore allows better interpretation of the
state of the lava during emplacement than either
provides by itself. Although the wide range of small-
scale characteristics and the transitions between units
indicate that the surface units are emplaced under a
wide variety of conditions, the type examples suggest
that within the range of conditions, a limited set of
emplacement conditions (pertaining to supply rate,
flow viscosity, cooling history, etc.) were dominant
during the development of the Mauna Ulu flow field.
5. Spectral characterization of the Mauna Ulu flow
field
5.1. Thermal infrared remote sensing of volcanic
surfaces
Thermal infrared (TIR) wavelength remote sensing
datasets are useful for mapping variations in surface
properties and/or thermal anomalies because thermal
radiance is a function of surface emissivity (a material
property) and temperature (e.g. Gillespie et al., 1990;
Hook et al., 1992; Kahle and Alley, 1992). TIR data
have been used to discriminate rocks of different
mineralogic content (e.g. Vincent and Thomson,
1972; Walter and Salisbury, 1989) and lithology
(e.g. Vincent et al., 1972; Kruse and Kierein-Young,
1990). Previous volcanologic investigations have used
TIR data to map the distribution of basaltic units of
similar composition and varying age (Kahle et al.,
1988), silicic units of similar composition and varying
vesicularity (Ondrusek et al., 1993; Ramsey and Fink,
1999), and thermal anomalies associated with active
lava tubes (Realmuto et al., 1992).
Because thermal emittance from multiple compo-
nents mixes linearly in proportion to their areal
abundance, TIR spectra can be deconvolved to esti-
mate proportions of end member surfaces within a
pixel (Thomson and Salisbury, 1993; Ramsey and
Christensen, 1998). Vesicularity variations among
flow surfaces of uniform composition can be modeled
by measuring the relative depths of spectral features
(Ondrusek et al., 1993; Ramsey and Fink, 1997,
1999). For example, a basaltic pahoehoe exposure
can be modeled spectrally as a surface composed of
smooth basaltic glass and vesicles (or similar small-
scale roughness elements). Relative proportions of
these two spectral end members are calculated by
deconvolving the surface spectrum, linearly fitting the
spectral features to mixtures of the end members. The
contribution of small-scale roughness elements in
effect mutes the glass emissivity features, driving
the spectrum towards blackbody behavior (Ramsey
and Fink, 1999; Ramsey and Dehn, 2004-this issue).
Ramsey and Fink (1999) applied this modeling ap-
proach to calculate vesicularity of silicic lava dome
surfaces to map the distribution of textural units at
Medicine Lake Volcano, California. This methodolo-
gy is also being applied to active silicic domes
(Ramsey and Dehn, 2004-this issue).
5.2. The ASTER and MASTER datasets
Due to the significance of vesicularity for under-
standing lava flow emplacement, datasets were used
in this study that included TIR emittance in addition
to visible and near infrared (VNIR) reflectance. These
data (Fig. 3) were acquired for the Mauna Ulu flow
field by ASTER on May 4, 2000 and by MASTER on
October 14, 2000 during the PacRim II mission. The
ASTER instrument is described in detail by Yama-
guchi et al. (1998), and other applications to under-
standing volcanic processes are presented by Ramsey
and Flynn (2004-this issue) and Pieri and Abrams
(2004-this issue). The ASTER data were processed to
Level 1B (radiometric and geometric corrections),
and have 15 m/pixel spatial resolution in the VNIR,
30 m/pixel in the SWIR, and 90 m/pixel in the TIR.
Level 2 data were not available when analyses were
conducted. The airborne MASTER instrument was
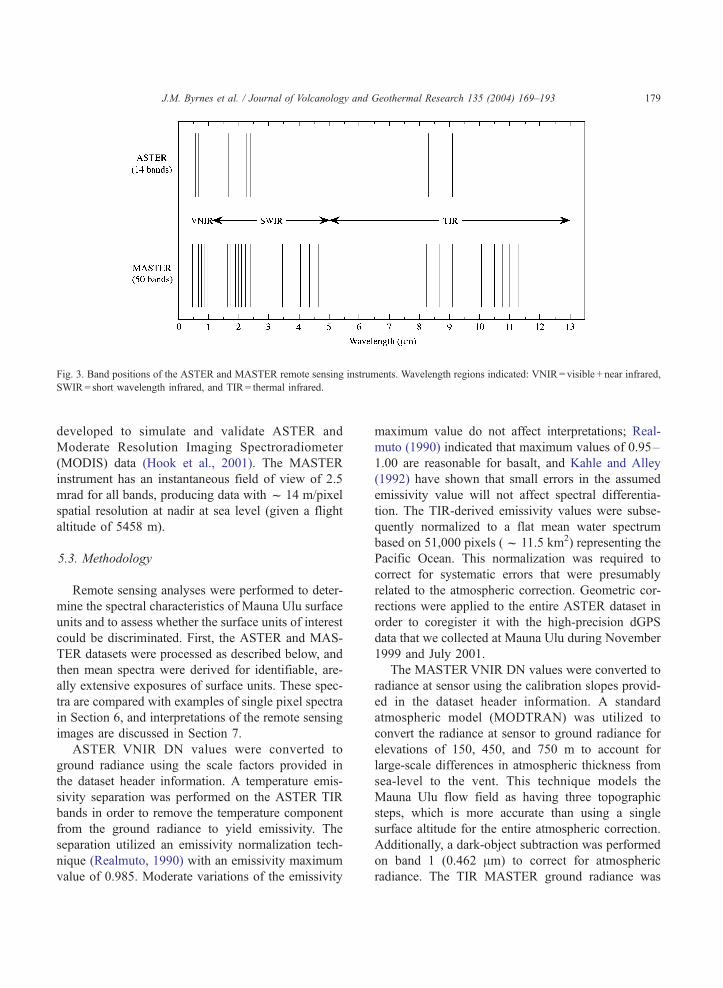
Fig. 3. Band positions of the ASTER and MASTER remote sensing instruments. Wavelength regions indicated: VNIR= visible + near infrared,
SWIR= short wavelength infrared, and TIR = thermal infrared.
J.M. Byrnes et al. / Journal of Volcanology and Geothermal Research 135 (2004) 169–193 179
developed to simulate and validate ASTER and
Moderate Resolution Imaging Spectroradiometer
(MODIS) data (Hook et al., 2001). The MASTER
instrument has an instantaneous field of view of 2.5
mrad for all bands, producing data with f 14 m/pixel
spatial resolution at nadir at sea level (given a flight
altitude of 5458 m).
5.3. Methodology
Remote sensing analyses were performed to deter-
mine the spectral characteristics of Mauna Ulu surface
units and to assess whether the surface units of interest
could be discriminated. First, the ASTER and MAS-
TER datasets were processed as described below, and
then mean spectra were derived for identifiable, are-
ally extensive exposures of surface units. These spec-
tra are compared with examples of single pixel spectra
in Section 6, and interpretations of the remote sensing
images are discussed in Section 7.
ASTER VNIR DN values were converted to
ground radiance using the scale factors provided in
the dataset header information. A temperature emis-
sivity separation was performed on the ASTER TIR
bands in order to remove the temperature component
from the ground radiance to yield emissivity. The
separation utilized an emissivity normalization tech-
nique (Realmuto, 1990) with an emissivity maximum
value of 0.985. Moderate variations of the emissivity
maximum value do not affect interpretations; Real-
muto (1990) indicated that maximum values of 0.95–
1.00 are reasonable for basalt, and Kahle and Alley
(1992) have shown that small errors in the assumed
emissivity value will not affect spectral differentia-
tion. The TIR-derived emissivity values were subse-
quently normalized to a flat mean water spectrum
based on 51,000 pixels (f 11.5 km2) representing the
Pacific Ocean. This normalization was required to
correct for systematic errors that were presumably
related to the atmospheric correction. Geometric cor-
rections were applied to the entire ASTER dataset in
order to coregister it with the high-precision dGPS
data that we collected at Mauna Ulu during November
1999 and July 2001.
The MASTERVNIR DN values were converted to
radiance at sensor using the calibration slopes provid-
ed in the dataset header information. A standard
atmospheric model (MODTRAN) was utilized to
convert the radiance at sensor to ground radiance for
elevations of 150, 450, and 750 m to account for
large-scale differences in atmospheric thickness from
sea-level to the vent. This technique models the
Mauna Ulu flow field as having three topographic
steps, which is more accurate than using a single
surface altitude for the entire atmospheric correction.
Additionally, a dark-object subtraction was performed
on band 1 (0.462 Am) to correct for atmospheric
radiance. The TIR MASTER ground radiance was
J.M. Byrnes et al. / Journal of Volcanology and Geothermal Research 135 (2004) 169–193180
converted to emissivity (as above) and normalized to a
flat mean water spectrum based on 8220 pixels
(f 1.85 km2) representing the Pacific Ocean. Only
MASTER TIR data within the 8- to 12-Am atmo-
spheric window were used. This region is free of H2O
and CO2 absorptions and contains the strongest rest-
strahlen bands (fundamental molecular vibrations of
silicates) (e.g. Salisbury and D’Aria, 1992).
The data were corrected for panoramic distortion
and coregistered with the dGPS and ASTER data.
Coregistration of the datasets was performed using
nearest neighbor resampling in order to avoid pixel
averaging, and all bands in both datasets were
resampled to 15 m/pixel. For comparison, a mosaic
of high-resolution color aerial photographs of the
initial study site and a supervised classification de-
rived from the mosaic (Byrnes and Crown, 2001)
were also coregistered with the dGPS, ASTER, and
MASTER data.
Average VNIR-derived reflectance and TIR-de-
rived emissivity values were calculated to compare
mean spectra of the four pahoehoe surface units of the
initial site study (Byrnes and Crown, 2001). The
pahoehoe unit map of Byrnes and Crown (2001)
was used to create data masks (representing the entire
classification) for pahoehoe units I–IV. Mean spectra
for those units were calculated using the masks with
subsampled, processed ASTER and MASTER data-
sets. Means represent averages of 1,342,821 pixels
(f 1.34 km2) for unit I, 778,452 pixels (f 0.78 km2)
for unit II, 358,367 pixels (f 0.36 km2) for unit III,
and 304,726 pixels (f 0.30 km2) for unit IV in the
subsampled data. Average VaVa spectra are based on thedistal portion of an extensive 1969 VaVa lobe (Fig. 1),
using 1190 pixels (f 0.27 km2) for ASTER and 2465
pixels (f 0.55 km2) for MASTER. Mean spectra for
surface-fed pahoehoe (fountain-fed and shelly) were
derived from two areas totaling 1404 pixels (f 0.32
km2) for ASTER. Fountain-fed and shelly pahoehoe
were not analyzed separately in the current study
because discrete, extensive exposures of each unit
have not been mapped in the available datasets.
Surface-fed pahoehoe was not analyzed for MASTER
due to extensive cloud cover over the proximal region
of the flow field during data acquisition.
Small-scale roughness was calculated for the AS-
TER and MASTER datasets through application of
the linear deconvolution model of Ramsey and Fink
(1999). For this study, the model fit two end-member
emissivity spectra to each pixel within the datasets,
that of an ideal blackbody and a Mauna Ulu basaltic
glass sample (laboratory spectra obtained following
Ruff et al., 1997). The model then calculated the
proportion of each end member to produce a value
for each pixel that represents the areal abundance of
the blackbody (i.e. small-scale roughness element).
The higher MASTER TIR spectral resolution (Fig. 3)
provides better constraints on the depth of the 9.1-Amabsorption feature.
5.4. Results
Reflectance spectra derived from the ASTER and
MASTER VNIR data are shown for the Mauna Ulu
surface units in Fig. 4. Error bars representing
standard error on the mean are smaller than the
symbols used to plot the data, although standard
deviations display overlap for all the data plotted.
The shapes and magnitudes of the reflectance spectra
differ between the two datasets, which may be partly
due to atmospheric effects, band positions, and
differences in viewing geometry and pixel size.
Despite these differences, the flow units display the
same overall progression in surface reflectance. Sur-
face-fed pahoehoe displays the greatest reflectance at
all wavelengths in the ASTER VNIR (Fig. 4a), and
both instruments indicate that reflectance decreases
from pahoehoe unit I sheets to unit II toe lobes to
unit III breakouts to disrupted unit IV surfaces and
finally to VaVa lobes.
Mean ASTER and MASTER emissivity spectra
(Fig. 5) display differences in emissivity at f 9.1 Am,
which are used with the linear deconvolution model
(Ramsey and Fink, 1999) to derive small-scale surface
roughness (Fig. 6). Differences in contrast between
Fig. 6a and b result from the difference in resolution
of the ASTER and MASTERTIR data (90 and >10 m/
pixel, respectively). The coarser resolution of ASTER
yields pixels that sample more surfaces than MAS-
TER pixels, reducing the range of roughness repre-
sented within the flow field. Mean model small-scale
roughness values indicate an increase in small-scale
surface roughness from relatively smooth-surfaced
units I and II to the more highly vesicular unit III to
the disrupted unit IV surfaces (Fig. 7), consistent with
a previous analysis of Thermal Infrared Multispectral
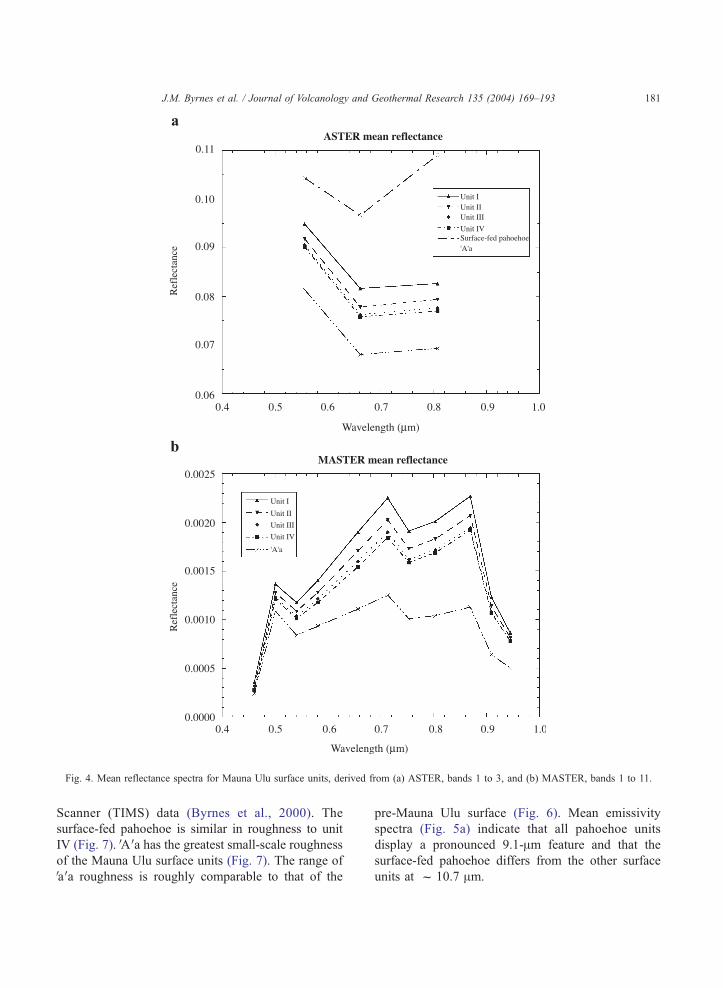
Fig. 4. Mean reflectance spectra for Mauna Ulu surface units, derived from (a) ASTER, bands 1 to 3, and (b) MASTER, bands 1 to 11.
J.M. Byrnes et al. / Journal of Volcanology and Geothermal Research 135 (2004) 169–193 181
Scanner (TIMS) data (Byrnes et al., 2000). The
surface-fed pahoehoe is similar in roughness to unit
IV (Fig. 7). VAVa has the greatest small-scale roughness
of the Mauna Ulu surface units (Fig. 7). The range of
VaVa roughness is roughly comparable to that of the
pre-Mauna Ulu surface (Fig. 6). Mean emissivity
spectra (Fig. 5a) indicate that all pahoehoe units
display a pronounced 9.1-Am feature and that the
surface-fed pahoehoe differs from the other surface
units at f 10.7 Am.
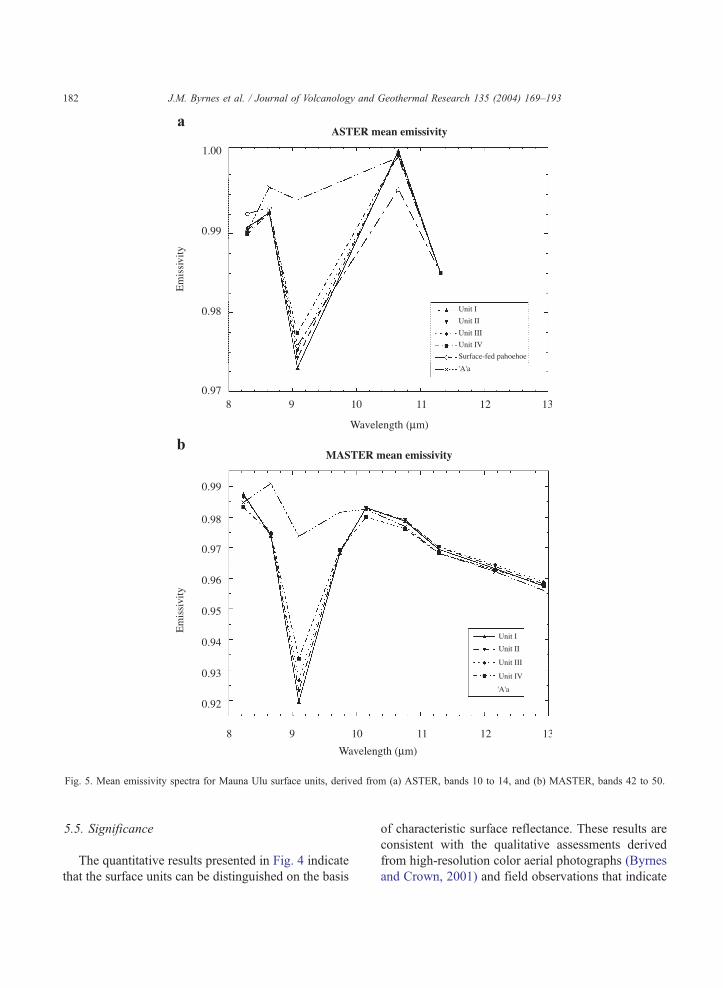
Fig. 5. Mean emissivity spectra for Mauna Ulu surface units, derived from (a) ASTER, bands 10 to 14, and (b) MASTER, bands 42 to 50.
J.M. Byrnes et al. / Journal of Volcanology and Geothermal Research 135 (2004) 169–193182
5.5. Significance
The quantitative results presented in Fig. 4 indicate
that the surface units can be distinguished on the basis
of characteristic surface reflectance. These results are
consistent with the qualitative assessments derived
from high-resolution color aerial photographs (Byrnes
and Crown, 2001) and field observations that indicate
J.M. Byrnes et al. / Journal of Volcanology and Geothermal Research 135 (2004) 169–193 183
that surface reflectance and color help to distinguish
emplacement units defined primarily on the basis of
flow morphology.
Mean emissivity spectra (Fig. 5) are consistent with
field investigations in this study as well as previous
work (Ramsey and Fink, 1997, 1999; Byrnes et al.,
2000) that indicates emissivity differences are expected
in the surface units due to variations in glass abundance
and small-scale roughness. Spectral features associated
with the presence of olivine are not identifiable, con-
sistent with field observations of low exposed pheno-
cryst concentrations (Table 1) and the limited areal
extent (much less than one 100–8100 m2 pixel) of the
most phenocryst-rich surfaces. An assumption of the
temperature-emissivity separation technique is that
temperature is isothermal within each pixel. Self-shad-
owing may be significant for unit IV, shelly pahoehoe,
and VaVa due to the nature of their characteristically
irregular surfaces, which may create temperature dif-
ferences within a pixel and produce errors in derived
emissivity (Gillespie et al., 1990). Despite self-shad-
owing, the results presented herein indicate that the
surface units examined have characteristic emissivity
spectra that may be used to distinguish them.
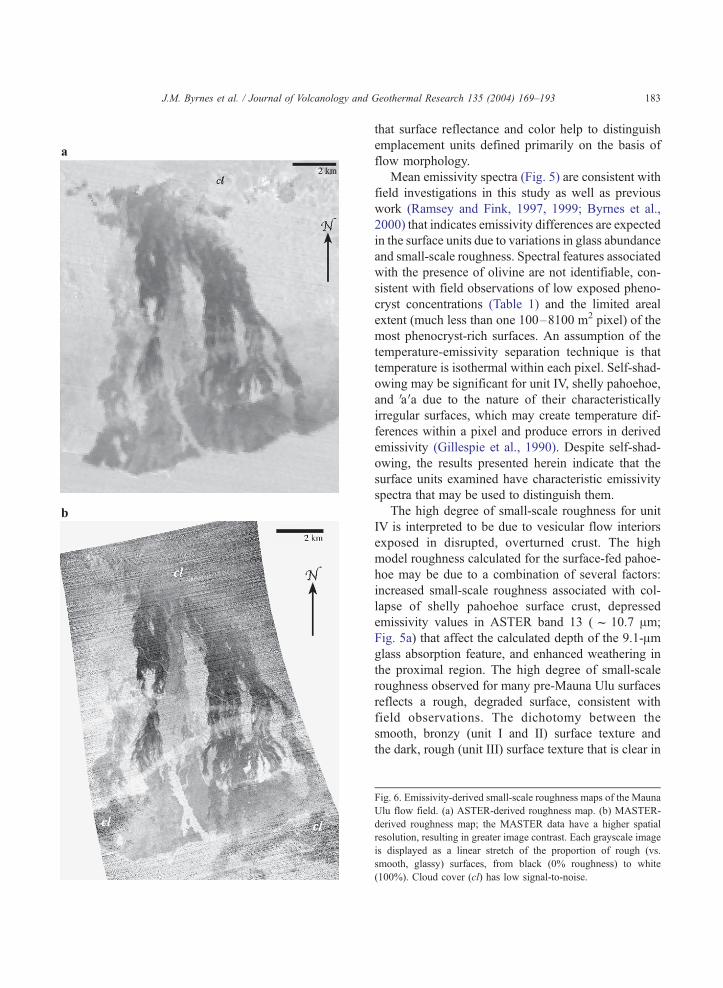
The high degree of small-scale roughness for unit
IV is interpreted to be due to vesicular flow interiors
exposed in disrupted, overturned crust. The high
model roughness calculated for the surface-fed pahoe-
hoe may be due to a combination of several factors:
increased small-scale roughness associated with col-
lapse of shelly pahoehoe surface crust, depressed
emissivity values in ASTER band 13 (f 10.7 Am;
Fig. 5a) that affect the calculated depth of the 9.1-Amglass absorption feature, and enhanced weathering in
the proximal region. The high degree of small-scale
roughness observed for many pre-Mauna Ulu surfaces
reflects a rough, degraded surface, consistent with
field observations. The dichotomy between the
smooth, bronzy (unit I and II) surface texture and
the dark, rough (unit III) surface texture that is clear in
Fig. 6. Emissivity-derived small-scale roughness maps of the Mauna
Ulu flow field. (a) ASTER-derived roughness map. (b) MASTER-
derived roughness map; the MASTER data have a higher spatial
resolution, resulting in greater image contrast. Each grayscale image
is displayed as a linear stretch of the proportion of rough (vs.
smooth, glassy) surfaces, from black (0% roughness) to white
(100%). Cloud cover (cl) has low signal-to-noise.
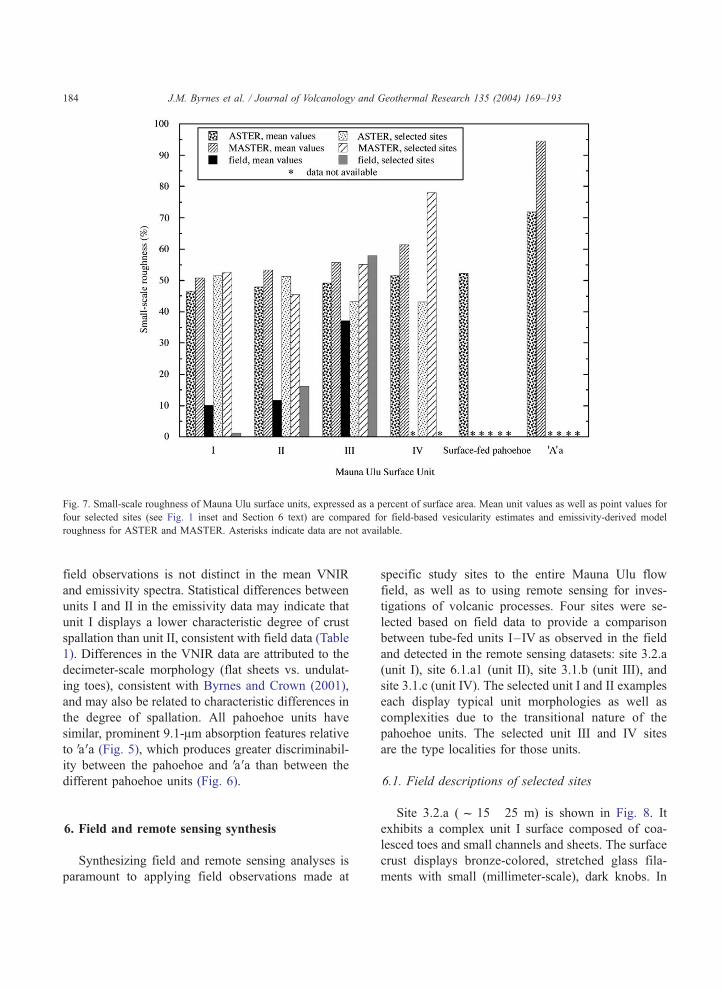
Fig. 7. Small-scale roughness of Mauna Ulu surface units, expressed as a percent of surface area. Mean unit values as well as point values for
four selected sites (see Fig. 1 inset and Section 6 text) are compared for field-based vesicularity estimates and emissivity-derived model
roughness for ASTER and MASTER. Asterisks indicate data are not available.
J.M. Byrnes et al. / Journal of Volcanology and Geothermal Research 135 (2004) 169–193184
field observations is not distinct in the mean VNIR
and emissivity spectra. Statistical differences between
units I and II in the emissivity data may indicate that
unit I displays a lower characteristic degree of crust
spallation than unit II, consistent with field data (Table
1). Differences in the VNIR data are attributed to the
decimeter-scale morphology (flat sheets vs. undulat-
ing toes), consistent with Byrnes and Crown (2001),
and may also be related to characteristic differences in
the degree of spallation. All pahoehoe units have
similar, prominent 9.1-Am absorption features relative
to VaVa (Fig. 5), which produces greater discriminabil-
ity between the pahoehoe and VaVa than between the
different pahoehoe units (Fig. 6).
6. Field and remote sensing synthesis
Synthesizing field and remote sensing analyses is
paramount to applying field observations made at
specific study sites to the entire Mauna Ulu flow
field, as well as to using remote sensing for inves-
tigations of volcanic processes. Four sites were se-
lected based on field data to provide a comparison
between tube-fed units I–IV as observed in the field
and detected in the remote sensing datasets: site 3.2.a
(unit I), site 6.1.a1 (unit II), site 3.1.b (unit III), and
site 3.1.c (unit IV). The selected unit I and II examples
each display typical unit morphologies as well as
complexities due to the transitional nature of the
pahoehoe units. The selected unit III and IV sites
are the type localities for those units.
6.1. Field descriptions of selected sites
Site 3.2.a (f 15� 25 m) is shown in Fig. 8. It
exhibits a complex unit I surface composed of coa-
lesced toes and small channels and sheets. The surface
crust displays bronze-colored, stretched glass fila-
ments with small (millimeter-scale), dark knobs. In
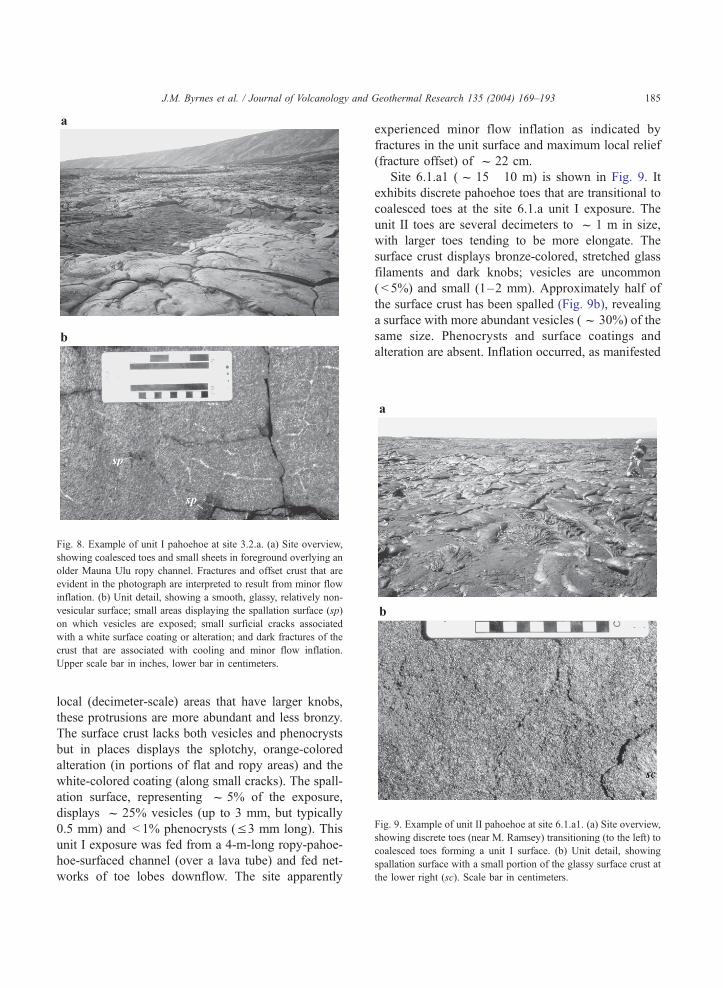
Fig. 8. Example of unit I pahoehoe at site 3.2.a. (a) Site overview,
showing coalesced toes and small sheets in foreground overlying an
older Mauna Ulu ropy channel. Fractures and offset crust that are
evident in the photograph are interpreted to result from minor flow
inflation. (b) Unit detail, showing a smooth, glassy, relatively non-
vesicular surface; small areas displaying the spallation surface (sp)
on which vesicles are exposed; small surficial cracks associated
with a white surface coating or alteration; and dark fractures of the
crust that are associated with cooling and minor flow inflation.
Upper scale bar in inches, lower bar in centimeters.
Fig. 9. Example of unit II pahoehoe at site 6.1.a1. (a) Site overview,
showing discrete toes (near M. Ramsey) transitioning (to the left) to
coalesced toes forming a unit I surface. (b) Unit detail, showing
spallation surface with a small portion of the glassy surface crust at
the lower right (sc). Scale bar in centimeters.
J.M. Byrnes et al. / Journal of Volcanology and Geothermal Research 135 (2004) 169–193 185
local (decimeter-scale) areas that have larger knobs,
these protrusions are more abundant and less bronzy.
The surface crust lacks both vesicles and phenocrysts
but in places displays the splotchy, orange-colored
alteration (in portions of flat and ropy areas) and the
white-colored coating (along small cracks). The spall-
ation surface, representing f 5% of the exposure,
displays f 25% vesicles (up to 3 mm, but typically
0.5 mm) and < 1% phenocrysts (V 3 mm long). This
unit I exposure was fed from a 4-m-long ropy-pahoe-
hoe-surfaced channel (over a lava tube) and fed net-
works of toe lobes downflow. The site apparently
experienced minor flow inflation as indicated by
fractures in the unit surface and maximum local relief
(fracture offset) of f 22 cm.
Site 6.1.a1 (f 15� 10 m) is shown in Fig. 9. It
exhibits discrete pahoehoe toes that are transitional to
coalesced toes at the site 6.1.a unit I exposure. The
unit II toes are several decimeters to f 1 m in size,
with larger toes tending to be more elongate. The
surface crust displays bronze-colored, stretched glass
filaments and dark knobs; vesicles are uncommon
( < 5%) and small (1–2 mm). Approximately half of
the surface crust has been spalled (Fig. 9b), revealing
a surface with more abundant vesicles (f 30%) of the
same size. Phenocrysts and surface coatings and
alteration are absent. Inflation occurred, as manifested
J.M. Byrnes et al. / Journal of Volcanology and Geothermal Research 135 (2004) 169–193186
in a large tumulus from which squeeze-ups emanate
(e.g. Walker, 1991).
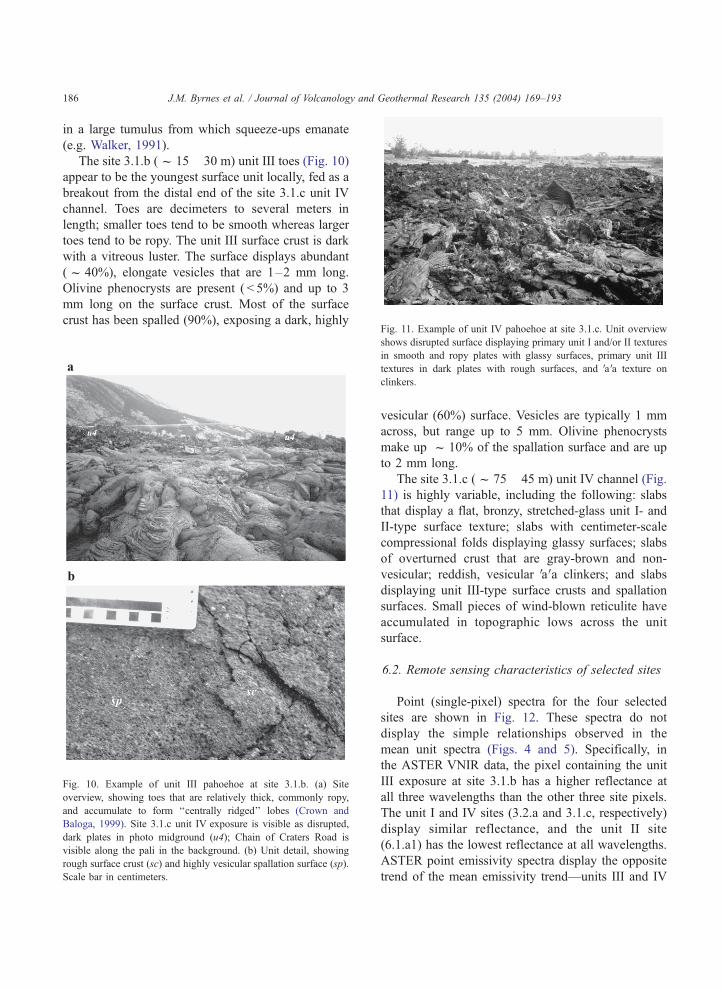
The site 3.1.b (f 15� 30 m) unit III toes (Fig. 10)
appear to be the youngest surface unit locally, fed as a
breakout from the distal end of the site 3.1.c unit IV
channel. Toes are decimeters to several meters in
length; smaller toes tend to be smooth whereas larger
toes tend to be ropy. The unit III surface crust is dark
with a vitreous luster. The surface displays abundant
(f 40%), elongate vesicles that are 1–2 mm long.
Olivine phenocrysts are present ( < 5%) and up to 3
mm long on the surface crust. Most of the surface
crust has been spalled (90%), exposing a dark, highly
Fig. 10. Example of unit III pahoehoe at site 3.1.b. (a) Site
overview, showing toes that are relatively thick, commonly ropy,
and accumulate to form ‘‘centrally ridged’’ lobes (Crown and
Baloga, 1999). Site 3.1.c unit IV exposure is visible as disrupted,
dark plates in photo midground (u4); Chain of Craters Road is
visible along the pali in the background. (b) Unit detail, showing
rough surface crust (sc) and highly vesicular spallation surface (sp).
Scale bar in centimeters.
Fig. 11. Example of unit IV pahoehoe at site 3.1.c. Unit overview
shows disrupted surface displaying primary unit I and/or II textures
in smooth and ropy plates with glassy surfaces, primary unit III
textures in dark plates with rough surfaces, and VaVa texture on
clinkers.
vesicular (60%) surface. Vesicles are typically 1 mm
across, but range up to 5 mm. Olivine phenocrysts
make up f 10% of the spallation surface and are up
to 2 mm long.
The site 3.1.c (f 75� 45 m) unit IV channel (Fig.
11) is highly variable, including the following: slabs
that display a flat, bronzy, stretched-glass unit I- and
II-type surface texture; slabs with centimeter-scale
compressional folds displaying glassy surfaces; slabs
of overturned crust that are gray-brown and non-
vesicular; reddish, vesicular VaVa clinkers; and slabs
displaying unit III-type surface crusts and spallation
surfaces. Small pieces of wind-blown reticulite have
accumulated in topographic lows across the unit
surface.
6.2. Remote sensing characteristics of selected sites
Point (single-pixel) spectra for the four selected
sites are shown in Fig. 12. These spectra do not
display the simple relationships observed in the
mean unit spectra (Figs. 4 and 5). Specifically, in
the ASTER VNIR data, the pixel containing the unit
III exposure at site 3.1.b has a higher reflectance at
all three wavelengths than the other three site pixels.
The unit I and IV sites (3.2.a and 3.1.c, respectively)
display similar reflectance, and the unit II site
(6.1.a1) has the lowest reflectance at all wavelengths.
ASTER point emissivity spectra display the opposite
trend of the mean emissivity trend—units III and IV
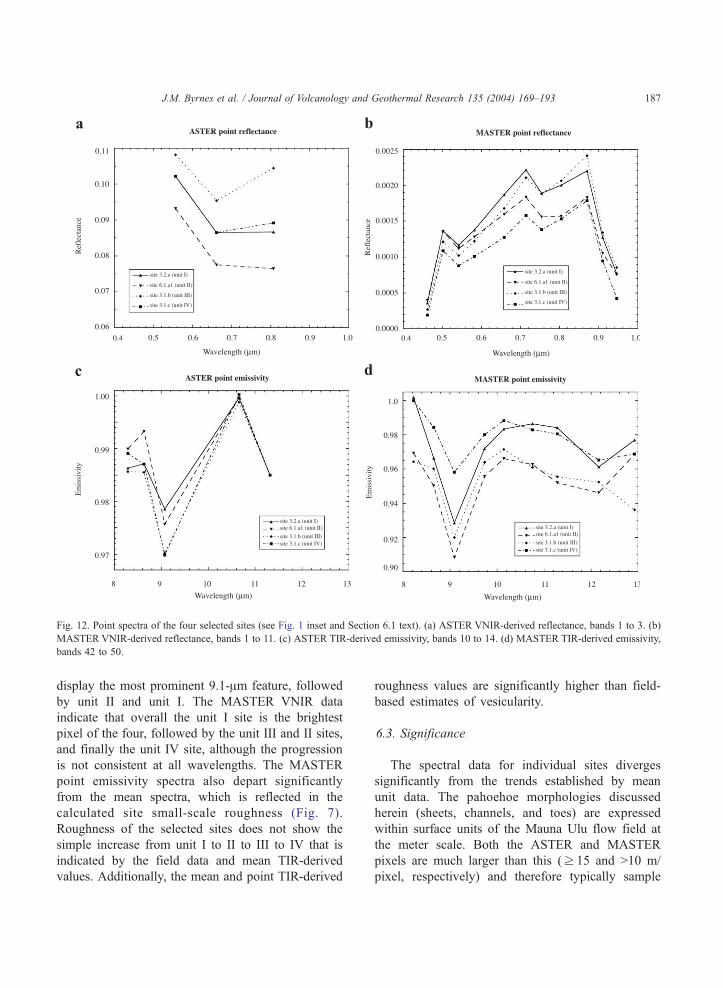
Fig. 12. Point spectra of the four selected sites (see Fig. 1 inset and Section 6.1 text). (a) ASTER VNIR-derived reflectance, bands 1 to 3. (b)
MASTERVNIR-derived reflectance, bands 1 to 11. (c) ASTER TIR-derived emissivity, bands 10 to 14. (d) MASTER TIR-derived emissivity,
bands 42 to 50.
J.M. Byrnes et al. / Journal of Volcanology and Geothermal Research 135 (2004) 169–193 187
display the most prominent 9.1-Am feature, followed
by unit II and unit I. The MASTER VNIR data
indicate that overall the unit I site is the brightest
pixel of the four, followed by the unit III and II sites,
and finally the unit IV site, although the progression
is not consistent at all wavelengths. The MASTER
point emissivity spectra also depart significantly
from the mean spectra, which is reflected in the
calculated site small-scale roughness (Fig. 7).
Roughness of the selected sites does not show the
simple increase from unit I to II to III to IV that is
indicated by the field data and mean TIR-derived
values. Additionally, the mean and point TIR-derived
roughness values are significantly higher than field-
based estimates of vesicularity.
6.3. Significance
The spectral data for individual sites diverges
significantly from the trends established by mean
unit data. The pahoehoe morphologies discussed
herein (sheets, channels, and toes) are expressed
within surface units of the Mauna Ulu flow field at
the meter scale. Both the ASTER and MASTER
pixels are much larger than this (z 15 and >10 m/
pixel, respectively) and therefore typically sample
J.M. Byrnes et al. / Journal of Volcanology and Geothermal Research 135 (2004) 169–193188
multiple surface units (i.e. mixed pixels). For exam-
ple, the site 3.1.c unit IV exposure is adjacent to a
kipuka of exposed pre-Mauna Ulu basalt. This pre-
eruption surface is visibly much brighter than the
Mauna Ulu basalt due to more extensive weathering
of the surface (consistent with observations by Lock-
wood and Lipman (1987) of basalt weathering on
Mauna Loa). Mixing of the pre-eruption surface with
the unit IV surface within the pixel accounts for
increased reflectance in the ASTER VNIR data and
increased roughness in the MASTER TIR-derived
data. Differences between the ASTER and MASTER
VNIR point data are due, at least in part, to differ-
ences in the actual pixel footprints and may be
amplified by small ( < 30 m) errors in coregistration.
The ASTER and MASTER TIR data have very
different spatial resolution, which causes even great-
er differences in derived emissivity and small-scale
roughness. Mixed pixels cause point spectra to
represent averaged values. This effect is illustrated
in Fig. 7 in that roughness values derived from the
remote sensing data are fairly constant for units I–III
relative to those observed in the field, because the
unit I and II sites are in pixels that include rougher
surfaces and the unit III site is within a pixel that
includes smoother surfaces. The TIR-derived rough-
ness values are in most cases higher than the field-
based vesicularity estimates, although no consistent
difference in values is present ( + 51% to � 3%).
This indicates that small-scale roughness elements
other than vesicles contribute to the emissivity spec-
tra, such as observed millimeter-scale knobs and
ridges and to a lesser extent small-scale surface
fractures.
It has been documented that surficial coatings and
alteration affect TIR signatures of basalt. For example,
they can mask the 9.1-Am absorption feature if com-
posed of hematite or palagonite (Fig. 2 of Kahle et al.,
1988) or halite from sea spray (ASTER spectral
library, http://speclib.jpl.nasa.gov/); alternatively, they
may enhance the glass signature if composed of
amorphous silica, although amorphous silica is not
abundant on the Mauna Ulu flow field surface.
Whereas observed surface coatings and alteration
may affect emissivity spectra at locales, coatings and
alteration are generally not areally extensive and, if
present, do not appear to affect the separability of unit
surfaces based on the mean spectra.
7. Discussion
Two dominant types of surface crusts have been
analyzed using field observations and VNIR and TIR
remote sensing data. Because Mauna Ulu surface
units are typically smaller than pixels in ASTER
and MASTER data, details of unit emplacement are
generally not identifiable due to various mixtures of
multiple units within a given pixel (i.e. mixed pixels),
as discussed in Section 6. Characteristic unit spectra
are better defined by increasing the ratio of signal
from a surface unit to noise of other unit surfaces,
accomplished by averaging a larger number of pixels
as discussed in Sections 5.3–5.5. Thus, within the
Mauna Ulu flow field, ASTER and MASTER datasets
may be used to constrain the dominant surface unit
over larger (multiple-pixel) areas as well as charac-
terize gross changes that occur in the distribution of
units within the flow field. Higher-resolution data are
necessary to precisely map the units observed in the
field (cf. Fig. 1c and d).
Several large-scale trends in emplacement are
apparent within the Mauna Ulu flow field, based
on synthesizing the field and remote sensing analy-
ses presented herein. Surface-fed pahoehoe units
(fountain-fed and shelly) are emplaced as large
sheets, toes, and channels, and signify relatively high
lava supply rates. ASTER and MASTER data indi-
cate that the proximal pahoehoe surface units have
VNIR and TIR spectral signatures that are similar to
each other and relatively homogeneous at the scale
of the data, except for the substantial chemical
alteration immediately adjacent to the Mauna Ulu
vent. The highly altered material nearest the vent is
not distinguishable in the roughness data, presum-
ably because the ASTER TIR data lack sufficient
spatial resolution and the MASTER data have suffi-
cient cloud cover to mask an alteration signature.
Medial and distal portions of the flow field display
VaVa and tube-fed pahoehoe units I–IV. VAVa exposuresare more common in the medial zone than in the
proximal zone, which may be partly due to the
nature of the pahoehoe to VaVa textural transition
and partly due to burial by subsequent pahoehoe
flows above Holei Pali. Tube-fed pahoehoe is
emplaced as sheets, toes, and channels that display
different small-scale surface characteristics due to
differences in cooling, degassing, and crystal forma-
J.M. Byrnes et al. / Journal of Volcanology and Geothermal Research 135 (2004) 169–193 189
tion and settling. The small-scale roughness model
indicates that the smoothest areally extensive surfa-
ces within the Mauna Ulu flow field are located in
interior portions (i.e. away from flow margins) of the
medial region, with roughness increasing toward the
flow field margins and increasing downflow. These
effects are presumably caused by progressive down-
flow disruption of the lava flows and increased
cooling of lava transported away from the master
tubes, despite the limited cooling within the master
tube system. Swanson (1973) indicated that lava
flowing through the Mauna Ulu master tubes did
not display measurable cooling downslope based on
optical pyrometer measurements. Higher-precision
measurements using glass geothermometry indicate
cooling of typically < 1 jC/km within the PuVu VOVomaster tube system (Helz et al., 2003). It is expected,
however, that flow velocities decrease as lava is
transported away from the main lava tube segments
through smaller distributary lava tubes, due to de-
creased local supply within the tube system and
increased friction along tube walls relative to the
lava volume transported, which may increase the rate
of heat loss relative to distance transported within a
tube. Cooling within distributary tubes may be
augmented by greater lava surface area to volume
ratios, which promotes conductive cooling to the
tube walls. Additionally, diminished flow can pro-
mote storage, which allows further cooling of the
lava prior to emplacement. In this fashion, lava
storage within distributary tubes may promote for-
mation of unit III pahoehoe and dark, rough surface
crusts. The distribution of this unit morphology and
crust variety may therefore be used to delineate sites
of subsurface storage and hence constrain the geom-
etry of the lava tube system.
Crust spallation is a complicating factor for surface
unit identification using both VNIR and TIR remote
sensing data because it appears to be related both to
lava flow characteristics during emplacement (such as
flow viscosity) as well as post-emplacement unit
modification (such as inflation). Significant variations
in our field measurements show that spallation is not a
simple function of morphologic form. In addition, the
effects of inflation on surface crusts appear to be non-
systematic, varying with extent and scale of flow
inflation. For example, inflation of an individual
pahoehoe toe can increase surface spall, whereas
inflation of an entire flow unit may not significantly
influence spall. Spallation darkens surface units by
removing the smoothest, most reflective portion of the
surface crust. TIR-derived emissivity data are respon-
sive to variations in proportion of smooth glass vs.
small-scale roughness elements (including vesicles,
surface protuberances, etc.). The formation of surface
roughness elements is related to flow emplacement
processes, as well as the thermal and degassing
histories of the lava. For example, vesicularity is a
function of the initial gas content, gas loss at the vent,
and gas exsolution and loss during transport and
storage; small surface knobs appear to have been
produced by vesicle deformation during crust forma-
tion. Spallation increases small-scale roughness by
exposing increasingly vesicle-rich surfaces from be-
neath primary surface crusts.
8. Summary and conclusions
The Mauna Ulu flow field exhibits surface units
displaying a range of morphologies and textures that
result from differences in flow emplacement condi-
tions, including four tube-fed pahoehoe units (I–IV),
proximal surface-fed pahoehoe (shelly and fountain-
fed), and VaVa. Unit-scale primary morphologies, in-
cluding lobes of pahoehoe toes, sheets, and channels,
are indicative of local supply conditions from the vent
(for surface-fed flows) or from lava tubes (for tube-fed
flows). The analysis of Byrnes and Crown (2001) led
to categorization of four varieties of tube-fed pahoe-
hoe units in the medial portion of the flow field,
defined on the basis of their dominant meter-scale
morphology and the color of the surface crust. These
pahoehoe units reflect differences in emplacement
controlled primarily by local flow rate and unit
remobilization, which are correlated with underlying
topographic slopes. This categorization did not, how-
ever, provide a complete characterization of the flow
field surface due to transitions between these units and
the presence of additional units within other parts of
the flow field. Analyses conducted herein have fo-
cused on new detailed characterizations of surface
crusts to improve our understanding of surface units at
Mauna Ulu.
Overall, the Mauna Ulu flow field surface is glassy
and phenocryst poor. Characteristic variations related
J.M. Byrnes et al. / Journal of Volcanology and Geothermal Research 135 (2004) 169–193190
to differences in emplacement processes between
surface units are identifiable in both field and remote-
ly sensed VNIR and TIR spectra. The wide range in
characteristics observed in the field indicates that each
of the units may be produced under a range of
conditions, consistent with the gradational nature of
the units observed within the flow field. Two domi-
nant types of surface crusts have been characterized: a
bronzy, smooth variety (associated with pahoehoe
units I and II) and a dark, rough variety (associated
with pahoehoe unit III). These two varieties of surface
crusts are indicative of the state of the lava during
emplacement, reflecting differences in cooling and
crystallization related to lava transport and storage.
The observed range of surface textures indicates that
these two principal varieties are gradational, suggest-
ing a continuous but bimodal distribution of lava
histories, related to differences in cooling and crys-
tallization during transport and storage within the
distributary tube network.
Bronzy, smooth crust is associated with a full
range of unit morphologies (i.e. toey lobes, sheets,
and channels) and occurs in small, medium, and
large surface units. This crust type is areally domi-
nant within the flow field. In terms of Byrnes and
Crown (2001), pahoehoe units I and II exhibit no
distinct differences in surface crust characteristics,
but rather reflect differences in local emplacement
parameters, such as flow rate, topography, and infla-
tion and coalescence. The bronzy, smooth crust,
which comprises the majority of Mauna Ulu pahoe-
hoe surfaces, is believed to represent lava that
experienced negligible cooling and degassing prior
to emplacement. Dark, rough crust typically is asso-
ciated with small lava breakouts. These units are
commonly associated with tumuli and channelized
flows, however more extensive sheet-like exposures
have been observed in a few localities. The small-
scale properties of this variety of surface crust and
the typical association of this crust with small lobes
of unit III pahoehoe toes are consistent with low
flow rate and high bulk viscosity during emplace-
ment relative to the bronzy, smooth variety. Succes-
sive stages of dark lava breakouts emplacing
rougher, more phenocryst-rich lava supports the
interpretation that storage and cooling within the
flow field controls the formation of lava displaying
this surface crust variety.
These two varieties of surface crusts have differ-
ent characteristic VNIR and TIR spectral properties,
which have been identified by averaging many
pixels. Flow field analysis using data that have
pixels larger than the flow units can provide infor-
mation on gross changes in lava emplacement within
the flow field. Application of the methodology
presented herein to flows in different settings may
be used to better understand effects of eruption
parameters (e.g. supply rate, eruption style) and
setting (e.g. transport network, topography, cooling
environment) on the emplacement of lava flow
fields.
Acknowledgements
The assistance of Chris Eisinger with the MAS-
TER atmospheric correction, Brian Banks with field
observations, and Bill Harbert, Sarah B.Z. McElfresh,
and Tamara Misner with image processing is greatly
appreciated. Thanks also go to Darcy Hu of HawaiViVolcanoes National Park for help with sample
collection permits and Rosalind Helz for providing a
preprint of her lava tube chapter. The manuscript
benefited greatly from thorough reviews and addi-
tional assistance by Dave Sherrod and Scott Rowland.
This research was supported by NASA grant NAG5-
10561. This is PSI contribution #363.
Appendix A
Sites listed in Table A1 were geolocated by map-
ping unit margins using a Trimble dGPS receiver to
achieve f 10 cm accuracy. Point locations listed
herein approximate unit geometric centers, although
in some cases are offset so that the point lies within
the unit. Additional information concerning the sites is
presented in the text and Table 1. Positions are
reported in Eastings and Northings relative to a
UTM zone 5 (North) projection, on a WGS84 spher-
oid. For convenience, latitude and longitude measure-
ments are included, computed using the coordinate
converter available at http://jeeep.com/details/coord/.
Not all sites in which detailed field surface character-
izations were made (Table 1) were precisely located.
Some additional sites where observations were made
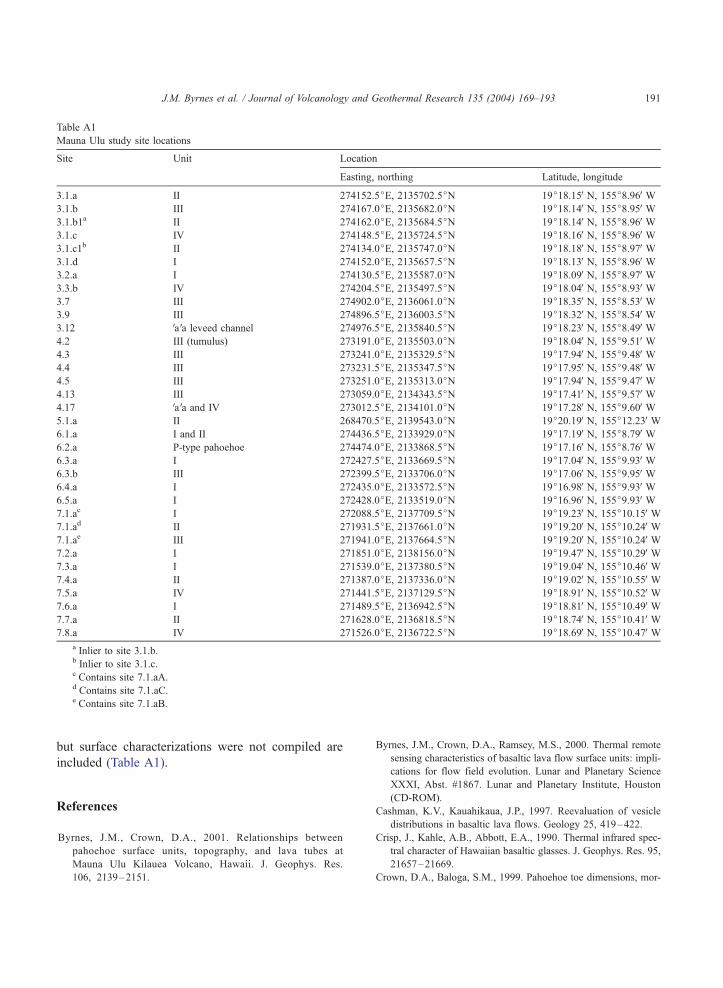
Table A1
Mauna Ulu study site locations
Site Unit Location
Easting, northing Latitude, longitude
3.1.a II 274152.5jE, 2135702.5jN 19j18.15VN, 155j8.96VW3.1.b III 274167.0jE, 2135682.0jN 19j18.14VN, 155j8.95VW3.1.b1a II 274162.0jE, 2135684.5jN 19j18.14VN, 155j8.96VW3.1.c IV 274148.5jE, 2135724.5jN 19j18.16VN, 155j8.96VW3.1.c1b II 274134.0jE, 2135747.0jN 19j18.18VN, 155j8.97VW3.1.d I 274152.0jE, 2135657.5jN 19j18.13VN, 155j8.96VW3.2.a I 274130.5jE, 2135587.0jN 19j18.09VN, 155j8.97VW3.3.b IV 274204.5jE, 2135497.5jN 19j18.04VN, 155j8.93VW3.7 III 274902.0jE, 2136061.0jN 19j18.35VN, 155j8.53VW3.9 III 274896.5jE, 2136003.5jN 19j18.32VN, 155j8.54VW3.12 VaVa leveed channel 274976.5jE, 2135840.5jN 19j18.23VN, 155j8.49VW4.2 III (tumulus) 273191.0jE, 2135503.0jN 19j18.04VN, 155j9.51VW4.3 III 273241.0jE, 2135329.5jN 19j17.94VN, 155j9.48VW4.4 III 273231.5jE, 2135347.5jN 19j17.95VN, 155j9.48VW4.5 III 273251.0jE, 2135313.0jN 19j17.94VN, 155j9.47VW4.13 III 273059.0jE, 2134343.5jN 19j17.41VN, 155j9.57VW4.17 VaVa and IV 273012.5jE, 2134101.0jN 19j17.28VN, 155j9.60VW5.1.a II 268470.5jE, 2139543.0jN 19j20.19VN, 155j12.23VW6.1.a I and II 274436.5jE, 2133929.0jN 19j17.19VN, 155j8.79VW6.2.a P-type pahoehoe 274474.0jE, 2133868.5jN 19j17.16VN, 155j8.76VW6.3.a I 272427.5jE, 2133669.5jN 19j17.04VN, 155j9.93VW6.3.b III 272399.5jE, 2133706.0jN 19j17.06VN, 155j9.95VW6.4.a I 272435.0jE, 2133572.5jN 19j16.98VN, 155j9.93VW6.5.a I 272428.0jE, 2133519.0jN 19j16.96VN, 155j9.93VW7.1.ac I 272088.5jE, 2137709.5jN 19j19.23VN, 155j10.15VW7.1.ad II 271931.5jE, 2137661.0jN 19j19.20VN, 155j10.24VW7.1.ae III 271941.0jE, 2137664.5jN 19j19.20VN, 155j10.24VW7.2.a I 271851.0jE, 2138156.0jN 19j19.47VN, 155j10.29VW7.3.a I 271539.0jE, 2137380.5jN 19j19.04VN, 155j10.46VW7.4.a II 271387.0jE, 2137336.0jN 19j19.02VN, 155j10.55VW7.5.a IV 271441.5jE, 2137129.5jN 19j18.91VN, 155j10.52VW7.6.a I 271489.5jE, 2136942.5jN 19j18.81VN, 155j10.49VW7.7.a II 271628.0jE, 2136818.5jN 19j18.74VN, 155j10.41VW7.8.a IV 271526.0jE, 2136722.5jN 19j18.69VN, 155j10.47VW
a Inlier to site 3.1.b.b Inlier to site 3.1.c.c Contains site 7.1.aA.d Contains site 7.1.aC.e Contains site 7.1.aB.
J.M. Byrnes et al. / Journal of Volcanology and Geothermal Research 135 (2004) 169–193 191
but surface characterizations were not compiled are
included (Table A1).
References
Byrnes, J.M., Crown, D.A., 2001. Relationships between
pahoehoe surface units, topography, and lava tubes at
Mauna Ulu Kilauea Volcano, Hawaii. J. Geophys. Res.
106, 2139–2151.
Byrnes, J.M., Crown, D.A., Ramsey, M.S., 2000. Thermal remote
sensing characteristics of basaltic lava flow surface units: impli-
cations for flow field evolution. Lunar and Planetary Science
XXXI, Abst. #1867. Lunar and Planetary Institute, Houston
(CD-ROM).
Cashman, K.V., Kauahikaua, J.P., 1997. Reevaluation of vesicle
distributions in basaltic lava flows. Geology 25, 419–422.
Crisp, J., Kahle, A.B., Abbott, E.A., 1990. Thermal infrared spec-
tral character of Hawaiian basaltic glasses. J. Geophys. Res. 95,
21657–21669.
Crown, D.A., Baloga, S.M., 1999. Pahoehoe toe dimensions, mor-
J.M. Byrnes et al. / Journal of Volcanology and Geothermal Research 135 (2004) 169–193192
phology, and branching relationships at Mauna Ulu Kilauea
Volcano, HawaiVi. Bull. Volcanol. 61, 288–305.Crown, D.A., Byrnes, J.M., Baloga, S.M., 1998. Scale-dependent
characteristics of Mauna Ulu pahoehoe flows. Lunar and Plane-
tary Science XXIX, Abst. #1376. Lunar and Planetary Institute,
Houston (CD-ROM).
Crown, D.A., Baloga, S.M., Byrnes, J.M., 1999. Emplacement of
pahoehoe flow fields: scale-dependent characteristics of Mauna
Ulu flows. Lunar and Planetary Science XXX, Abst. #1379.
Lunar and Planetary Institute, Houston (CD-ROM).
Crown, D.A., Byrnes, J.M., Ramsey, M.S., 2001. Mapping com-
pound lava flow fields on planetary surfaces. EOS (Trans.-Am.
Geophys. Union), (Suppl. 62) (P32D-0566).
Crown, D.A., Byrnes, J.M., Baloga, S.M., 2004. Scale-dependent
characteristics of Mauna Ulu pahoehoe flows, in preparation.
Gillespie, A.R., Smith, M.O., Adams, J.B., Willis, S.C., 1990.
Spectral mixture analysis of multispectral thermal infrared
images. In: Abbott, E.A. (Ed.), Proc. Sec. Therm. Infrared
Multispectral Scanner (TIMS) Workshop. JPL Publ., vol. 90-55,
pp. 57–74.
Harris, A.J.L., Flynn, L.P., Kesthelyi, L., Mouginis-Mark, P.J.,
Rowland, S.K., Resing, J.A., 1998. Calculation of lava effusion
rates from Landsat TM data. Bull. Volcanol. 60, 52–71.
Helz, R.T., Heliker, C., Hon, K., Mangan, M., 2003. Thermal
efficiency of lava tubes in the PuVu VOVo-Kupaianaha eruption.
In: Heliker, C.C., Swanson, D.A., Takahashi, T.J. (Eds.), The
PuVu VOVo-Kupaianaha Eruption of Kilauea Volcano, HawaiVi:The First Twenty Years. U. S. Geol. Surv. Prof. Pap. 1676,
105–120.
Holcomb, R.T., 1976. Preliminary map showing products of erup-
tions, 1962–1974 from the Upper East Rift Zone of Kilauea
Volcano, Hawaii. U.S. Geol. Surv. Misc. Field Studies, Map
MF-811, scale 1:24,000.
Holcomb, R.T., 1987. Eruptive history and long-term behavior of
Kilauea Volcano. In: Decker, R.W., Wright, T.L., Stauffer,
P.H. (Eds.), Volcanism in Hawaii. U. S. Geol. Surv. Prof.
Pap. 1350, 261–350.
Hon, K., Kauahikaua, J., Denlinger, R., Mackay, K., 1994. Em-
placement and inflation of pahoehoe sheet flows: observations
and measurements of active lava flows on Kilauea Volcano,
Hawaii. Geol. Soc. Am. Bull. 106, 351–370.
Hook, S.J., Gabell, A.R., Green, A.A., Kealy, P.S., 1992. A com-
parison of techniques for extracting emissivity information from
thermal infrared data for geologic studies. Remote Sens. Envi-
ron. 42, 123–135.
Hook, S.J., Myers, J.J., Thome, K.J., Fitzgerald, M., Kahle, A.B.,
2001. The MODIS/ASTER airborne simulator (MASTER)—a
new instrument for Earth science studies. Remote Sens. Envi-
ron. 76, 93–102.
Kahle, A.B., Alley, R.E., 1992. Separation of temperature and emit-
tance in remotely sensed radiance measurements. Remote Sens.
Environ. 42, 107–111.
Kahle, A.B., Gillespie, A.R., Abbott, E.A., Abrams, M.J., Wal-
ker, R.E., Hoover, G., Lockwood, J.P., 1988. Relative dating
of Hawaiian lava flows using multispectral thermal infrared
images: a new tool for geologic mapping of young volcanic
terranes. J. Geophys. Res. 93, 15239–15251.
Kauahikaua, J., Sherrod, D.R., Cashman, K.V., Heliker, C., Hon,
K., Mattox, T.N., Johnson, J.A., 2003. Hawaiian lava-flow
dynamics during the PuVu VOVo-Kupaianaha eruption: a tale
of two decades. In: Heliker, C.C., Swanson, D.A., Takahashi,
T.J. (Eds.), The PuVu VOVo-Kupaianaha Eruption of Kilauea
Volcano, HawaiVi: The First Twenty Years. U.S. Geol. Surv.
Prof. Pap. 1676, 63–88.
Keszthelyi, L., Denlinger, R., 1996. The initial cooling of pahoehoe
flow lobes. Bull. Volcanol. 58, 5–18.
Kruse, F.A., Kierein-Young, K.S., 1990. Mapping lithology and
alteration in the northern Death Valley region, California and
Nevada, with the Thermal Infrared Multispectral Scanner
(TIMS). In: Abbott, E.A. (Ed.), Proc. Sec. Therm. Infrared Mul-
tispectral Scanner (TIMS) Workshop. JPL Publ., vol. 90-55,
pp. 75–81.
Lockwood, J.P., Lipman, P.W., 1987. Holocene eruptive history of
Mauna Loa Volcano. In: Decker, R.W., Wright, T.L., Stauffer,
P.H. (Eds.), Volcanism in Hawaii. U. S. Geol. Surv. Prof. Pap.
1350, 509–535.
Mattox, T.N., Heliker, C., Kauahikaua, J., Hon, K., 1993. Deve-
lopment of the 1990 Kalapana flow field, Kilauea Volcano,
Hawaii. Bull. Volcanol. 55, 407–413.
McBirney, A.R., 1993. Igneous Petrology. Jones and Bartlett,
Boston.
Moore, J.G., Phillips, R.L., Grigg, R.W., Peterson, D.W., Swan-
son, D.A., 1973. Flow of lava into the sea, 1969–1971,
Kilauea Volcano, Hawaii. Geol. Soc. Am. Bull. 84, 537–546.
Ondrusek, J., Christensen, P.R., Fink, J.H., 1993. Mapping the
distribution of vesicular textures on silicic lavas using the
thermal infrared multispectral scanner. J. Geophys. Res. 98,
15903–15908.
Peterson, D.W., Tilling, R.I., 1980. Transition of basaltic lava from
pahoehoe to aa, Kilauea Volcano, Hawaii: field observations and
key factors. J. Volcanol. Geotherm. Res. 7, 271–293.
Pieri, D., Abrams, D., 2004. ASTER watches the world’s volca-
noes: a new paradigm for volcanological observation from orbit.
J. Volcanol. Geotherm. Res. 135, 13–28 (this issue).
Pinkerton, H., Sparks, R.S.J., 1976. The 1975 sub-terminal lavas,
Mount Etna: a case history of the formation of a compound flow
field. J. Volcanol. Geotherm. Res. 1, 167–182.
Polacci, M., Cashman, K.V., Kauahikaua, J.P., 1999. Textural char-
acterization of the pahoehoe— VaVa transition in Hawaiian basalt.
Bull. Volcanol. 60, 595–609.
Ramsey, M.S., Christensen, P.R., 1998. Mineral abundance deter-
mination: quantitative deconvolution of thermal emission spec-
tra. J. Geophys. Res. 103, 577–596.
Ramsey, M.S., Dehn, J., 2004. Spaceborne observations of the 2000
Bezymianny, Kamchatka eruption: the integration of high-reso-
lution ASTER data into near real-time monitoring using
AVHRR. J. Volcanol. Geotherm. Res. 135, 127–146 (this issue).
Ramsey, M.S., Fink, J.H., 1997. Mapping vesicularity of Hawaiian
lava flows via thermal infrared remote sensing. Abstr. Programs-
Geol. Soc. Am., Cordilleran Sect. 29 (5), A58.
Ramsey, M.S., Fink, J.H., 1999. Estimating silicic lava vesicularity
with thermal remote sensing: a new technique for volcanic map-
ping and monitoring. Bull. Volcanol. 61, 32–39.
Ramsey, M.S., Flynn, L.P., 2004. Strategies, insights, and the re-
J.M. Byrnes et al. / Journal of Volcanology and Geothermal Research 135 (2004) 169–193 193
cent advances in volcanic monitoring and mapping with data
from the earth observing system. J. Volcanol. Geotherm. Res.
135, 1–11 (this issue).
Realmuto, V.J., 1990. Separating the effects of temperature and
emissivity: emissivity spectrum normalization. In: Abbott,
E.A. (Ed.), Proc. Sec. Therm. Infrared Multispectral Scanner
(TIMS) Workshop. JPL Publ., vol. 90-55, pp. 31–36.
Realmuto, V.J., Hon, K., Kahle, A.B., Abbott, E.A., Pieri, D.C.,
1992. Multispectral thermal infrared mapping of the 1 October
1988 Kupaianaha flow field, Kilauea Volcano, Hawaii. Bull.
Volcanol. 55, 33–44.
Rowland, S.K., Walker, G.P.L., 1987. Toothpaste lava: characte-
ristics and origin of a lava structural type transitional between
pahoehoe and aa. Bull. Volcanol. 49, 631–641.
Rowland, S.K., Walker, G.P.L., 1990. Pahoehoe and aa in Hawaii:
volumetric flow rate controls the lava structure. Bull. Volcanol.
52, 615–628.
Ruff, S.W., Christensen, P.R., Barbera, P.W., Anderson, D.L., 1997.
Quantitative thermal emission spectroscopy of minerals: a lab-
oratory technique for measurement and calibration. J. Geophys.
Res. 102, 14899–14913.
Salisbury, J.W., D’Aria, D.M., 1992. Emissivity of terrestrial mate-
rials in the 8–14 Am atmospheric window. Remote Sens. Envi-
ron. 42, 83–106.
Swanson, D.A., 1973. Pahoehoe flows from the 1969–1971 Mauna
Ulu eruption, Kilauea Volcano, Hawaii. Geol. Soc. Am. Bull.
84, 615–626.
Swanson, D.A., Duffield, W.A., Jackson, D.B., Peterson, D.W.,
1979. Chronological narrative of the 1969–1971 Mauna Ulu
eruption of Kilauea Volcano, Hawai’i. U. S. Geol. Surv. Prof.
Pap. 1056, 1–55.
Thomson, J.L., Salisbury, J.W., 1993. The mid-infrared reflectance
of mineral mixtures (7–14 Am). Remote Sens. Environ. 45,
1–13.
Tilling, R.I., Christiansen, R.L., Duffield, W.A., Endo, E.T., Hol-
comb, R.T., Koyanagi, R.Y., Peterson, D.W., Unger, J.D., 1987.
The 1972–1974 Mauna Ulu eruption, Kilauea Volcano: an ex-
ample of quasi-steady-state magma transfer. In: Decker, R.W.,
Wright, T.L., Stauffer, P.H. (Eds.), Volcanism in Hawaii. U. S.
Geol. Surv. Prof. Pap. 1350, 405–469.
Vincent, R.K., Thomson, F., 1972. Spectral compositional imaging
of silicate rocks. J. Geophys. Res. 77, 2465–2472.
Vincent, R.K., Thomson, F., Watson, K., 1972. Recognition of
exposed quartz sand and sandstone by two-channel infrared
imagery. J. Geophys. Res. 77, 2473–2477.
Walker, G.P.L., 1972. Compound and simple lava flows and flood
basalts. Bull. Volcanol. 35, 579–590.
Walker, G.P.L., 1991. Structure, and origin by injection of lava
under surface crust, of tumuli, ‘‘lava rises’’, ‘‘lava-rise pits’’,
and ‘‘lava-inflation clefts’’ in Hawaii. Bull. Volcanol. 53,
546–558.
Walter, L.S., Salisbury, J.W., 1989. Spectral characterization of
igneous rocks in the 8- to 12-Am region. J. Geophys. Res. 94,
9203–9213.
Wilmoth, R.A., Walker, G.P.L., 1993. P-type and S-type pahoehoe:
A study of vesicle distribution patterns in Hawaiian lava flows.
J. Volcanol. Geotherm. Res. 55, 129–142.
Yamaguchi, Y., Kahle, A.B., Tsu, H., Kawakami, T., Pniel, M.,
1998. Overview of Advanced Spaceborne Thermal Emission
Reflectance Radiometer. IEEE Trans. Geosci. Remote Sens.
36, 1062–1071.