Embed Size (px)
Citation preview
Final Technical Report 2007 Surface Water Ambient Monitoring Program (SWAMP) Report on the Pueblo San Diego Hydrologic Unit January 2008

SURFACE WATER AMBIENT MONITORING PROGRAM (SWAMP) REPORT ON
THE PUEBLO SAN DIEGO HYDROLOGIC UNIT
Raphael D. Mazor Ken Schiff
Southern California Coastal Water Research Project 3535 Harbor Blvd., Suite 110
Costa Mesa, CA 92626 www.sccwrp.org
Prepared for the California Regional Water Quality Control Board, San Diego Region (Region 9).
This project was funded by the Surface Water Ambient Monitoring Program.
Technical Report 527_PuebloSanDiego
SWAMP Report on the Pueblo San Diego Hydrologic Unit
TABLE OF CONTENTS
1. Abstract .........................................................................................................1 2. Introduction ...................................................................................................2
2.1 Geographic Setting..................................................................................3 2.1.1 Climate..................................................................................................3 2.1.2 Hydrology..............................................................................................4 2.1.3 Land Use within the Watershed ............................................................5 2.1.4 Beneficial Uses and Known Impairments in the Watershed..................6
3. Methods ........................................................................................................6 3.1 Indicators .................................................................................................8 3.1.1 Water chemistry....................................................................................8 3.1.2 Toxicity..................................................................................................9 3.1.3 Tissue ...................................................................................................9 3.1.4 Bioassessment .....................................................................................9 3.1.5 Physical Habitat ....................................................................................9 3.2 Data Analysis.........................................................................................10 3.2.1 Thresholds ..........................................................................................10 3.2.2 Quality Assurance and Quality Control (QA/QC) ................................13
4. Results ........................................................................................................15 4.1 Water Chemistry....................................................................................15 4.2 Toxicity ..................................................................................................24 4.3 Tissue....................................................................................................25 4.4 Bioassessment ......................................................................................26 4.5 Physical Habitat.....................................................................................28
5. Discussion...................................................................................................28 6. Literature Cited............................................................................................33 7. Appendices .................................................................................................35
APPENDIX I ..............................................................................................I - 1 APPENDIX II ............................................................................................II - 1 APPENDIX III ..........................................................................................III - 1
i
SWAMP Report on the Pueblo San Diego Hydrologic Unit
LIST OF FIGURES
Figure 1. Location of the Pueblo San Diego HU...............................................3 Figure 2. Rainfall and sampling events at two stations in the San Diego region
...................................................................................................................4 Figure 3. The Pueblo San Diego watershed, including major waterways.........5 Figure 4. Land use within the Pueblo San Diego HU .......................................6 Figure 5. Location SWAMP and non-SWAMP sampling locations ...................8 Figure 6. Aquatic life threshold exceedances for water chemistry at SWAMP
sites..........................................................................................................23 Figure 7. Map of human health exceedances for water chemistry at SWAMP
sites..........................................................................................................24 Figure 8. Frequency of toxicity at SWAMP sites ............................................25 Figure 9. IBI scores at sites in the Pueblo San Diego HU ..............................26 Figure 10. Mean IBI scores at each bioassessment site and each season ....27 Figure 11. IBI values for each year and site ...................................................28 Figure 12. Summary of the ecological health of SWAMP sites. .....................32
ii
SWAMP Report on the Pueblo San Diego Hydrologic Unit
LIST OF TABLES
Table 1. Watersheds monitored under the SWAMP program. .........................2 Table 2. Sources of data used in this report....................................................7 Table 3: SWAMP sampling site locations.........................................................7 Table 4. Non-SWAMP sampling site locations .................................................7 Table 5. Threshold sources............................................................................11 Table 6. Water chemistry thresholds for aquatic life and human health
standards .................................................................................................12 Table 7. Number of anthropogenic organic compounds detected at each site
.................................................................................................................15 Table 8. Frequency of detection of anthropogenic organic compounds .........16 Table 9. Frequency of water chemistry threshold exceedances.....................21 Table 10. Number of constituents exceeding thresholds at each SWAMP site.
.................................................................................................................22 Table 11. Frequency of toxicity detected for each endpoint and at each site .25 Table 12. Mean and standard deviation of IBI scores at bioassessment sites
within the Pueblo San Diego HU..............................................................26 Table 13. Summary of the ecological health for five SWAMP sites in Pueblo
San Diego HU ..........................................................................................31
iii
SWAMP Report on the Pueblo San Diego Hydrologic Unit
1. ABSTRACT
In order to assess the ecological health of the Pueblo San Diego Hydrologic Unit (San Diego County, CA), water chemistry, water and sediment toxicity, and benthic macroinvertebrate communities were assessed at multiple sites on Chollas and Paradise Creeks. Water chemistry, toxicity, and bioassessment samples were assessed under SWAMP between 2005 and 2006. Bioassessment samples were also collected under other programs between 2003 and 2005. Although impacts to human health were assessed, the goal of this monitoring program was to examine impacts to aquatic life in the watershed. Most of these ecological indicators showed evidence of widespread impacts to the watershed. For example, water chemistry constituents at both sites exceeded aquatic life thresholds. Toxicity was evident at both sites, with the alga Selenastrum capricornutum indicating toxicity at both Paradise and Chollas Creeks. Bioassessment samples collected at 2 sites on Chollas Creek were all in poor or very poor condition. Mean annual IBIs ranged from 10.0 at the downstream site to 19.5 at the upstream site, indicating that benthic assemblages were typical of impacted communities. Multiple stressors, including contaminated water, were likely responsible for the poor health of the watershed. Despite limitations of this assessment (e.g., uncertain spatial and temporal variability, low levels of replication, non-probabilistic sampling, and lack of thresholds for several indicators), multiple lines of evidence support the conclusion that these sites in the Pueblo San Diego HU are in poor ecological condition.
1
SWAMP Report on the Pueblo San Diego Hydrologic Unit
2. INTRODUCTION
The Pueblo San Diego hydrologic unit (HU 908) is in southern San Diego County and is home to about 500,000 people and represents an important water resource in one of the most arid regions of the nation (SANDAG 1998). Despite strong interest in the surface waters of the Pueblo San Diego HU, a comprehensive assessment of the ecological health of these waters has not been conducted. The purpose of this study was to assess the health of the watershed using data collected in 2005 and 2006 under the Surface Water Ambient Monitoring Program (SWAMP), and data collected by other programs, such as monitoring by National Pollution Discharge Elimination System (NPDES) permittees and by the California Department of Fish and Game (DFG). SWAMP monitoring efforts rotated among sets of watersheds, ensuring that each HU is monitored once every 5 years (Table 1). These programs collected data to describe water chemistry, water and sediment toxicity, and macroinvertebrate community structure. By examining data from multiple sources, this report provides a measure of the ecological integrity of the Pueblo San Diego HU.
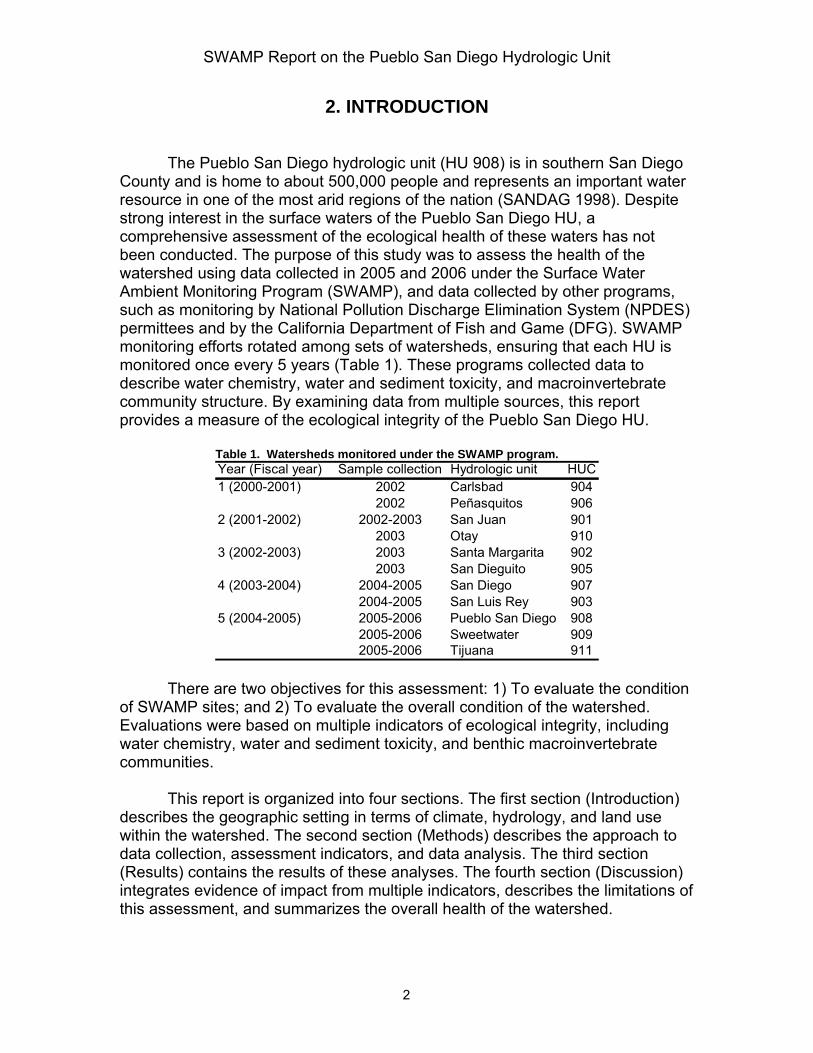
Table 1. Watersheds monitored under the SWAMP program. Year (Fiscal year) Sample collection Hydrologic unit HUC1 (2000-2001) 2002 Carlsbad 904
2002 Peñasquitos 9062 (2001-2002) 2002-2003 San Juan 901
2003 Otay 9103 (2002-2003) 2003 Santa Margarita 902
2003 San Dieguito 9054 (2003-2004) 2004-2005 San Diego 907
2004-2005 San Luis Rey 9035 (2004-2005) 2005-2006 Pueblo San Diego 908
2005-2006 Sweetwater 9092005-2006 Tijuana 911
There are two objectives for this assessment: 1) To evaluate the condition
of SWAMP sites; and 2) To evaluate the overall condition of the watershed. Evaluations were based on multiple indicators of ecological integrity, including water chemistry, water and sediment toxicity, and benthic macroinvertebrate communities. This report is organized into four sections. The first section (Introduction) describes the geographic setting in terms of climate, hydrology, and land use within the watershed. The second section (Methods) describes the approach to data collection, assessment indicators, and data analysis. The third section (Results) contains the results of these analyses. The fourth section (Discussion) integrates evidence of impact from multiple indicators, describes the limitations of this assessment, and summarizes the overall health of the watershed.
2
SWAMP Report on the Pueblo San Diego Hydrologic Unit
2.1 Geographic Setting
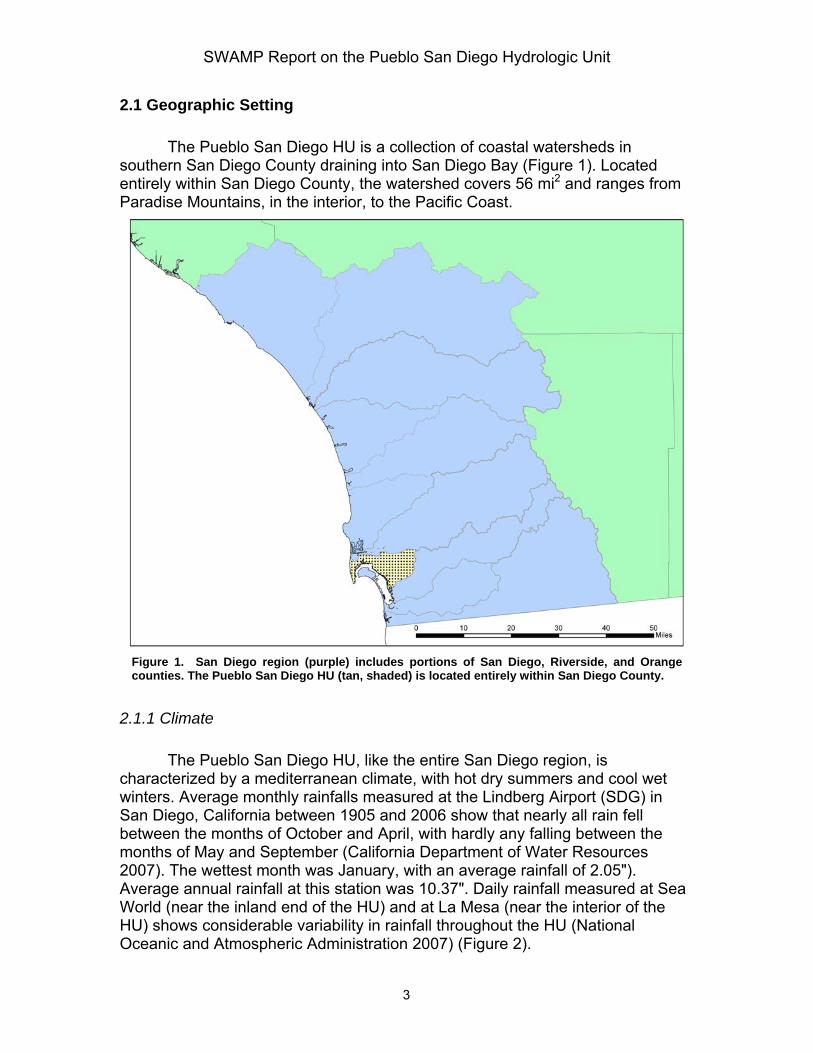
The Pueblo San Diego HU is a collection of coastal watersheds in southern San Diego County draining into San Diego Bay (Figure 1). Located entirely within San Diego County, the watershed covers 56 mi2 and ranges from Paradise Mountains, in the interior, to the Pacific Coast.
Figure 1. San Diego region (purple) includes portions of San Diego, Riverside, and Orange counties. The Pueblo San Diego HU (tan, shaded) is located entirely within San Diego County.
2.1.1 Climate
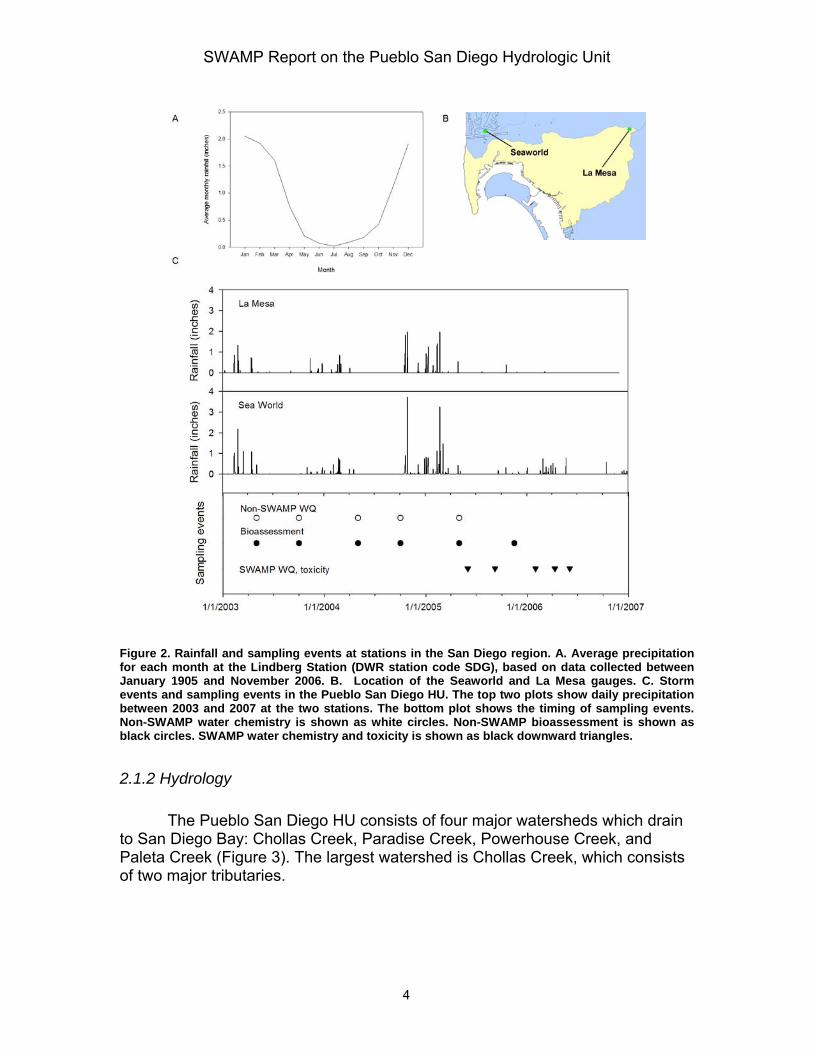
The Pueblo San Diego HU, like the entire San Diego region, is characterized by a mediterranean climate, with hot dry summers and cool wet winters. Average monthly rainfalls measured at the Lindberg Airport (SDG) in San Diego, California between 1905 and 2006 show that nearly all rain fell between the months of October and April, with hardly any falling between the months of May and September (California Department of Water Resources 2007). The wettest month was January, with an average rainfall of 2.05"). Average annual rainfall at this station was 10.37". Daily rainfall measured at Sea World (near the inland end of the HU) and at La Mesa (near the interior of the HU) shows considerable variability in rainfall throughout the HU (National Oceanic and Atmospheric Administration 2007) (Figure 2).
3
SWAMP Report on the Pueblo San Diego Hydrologic Unit
Figure 2. Rainfall and sampling events at stations in the San Diego region. A. Average precipitation for each month at the Lindberg Station (DWR station code SDG), based on data collected between January 1905 and November 2006. B. Location of the Seaworld and La Mesa gauges. C. Storm events and sampling events in the Pueblo San Diego HU. The top two plots show daily precipitation between 2003 and 2007 at the two stations. The bottom plot shows the timing of sampling events. Non-SWAMP water chemistry is shown as white circles. Non-SWAMP bioassessment is shown as black circles. SWAMP water chemistry and toxicity is shown as black downward triangles.
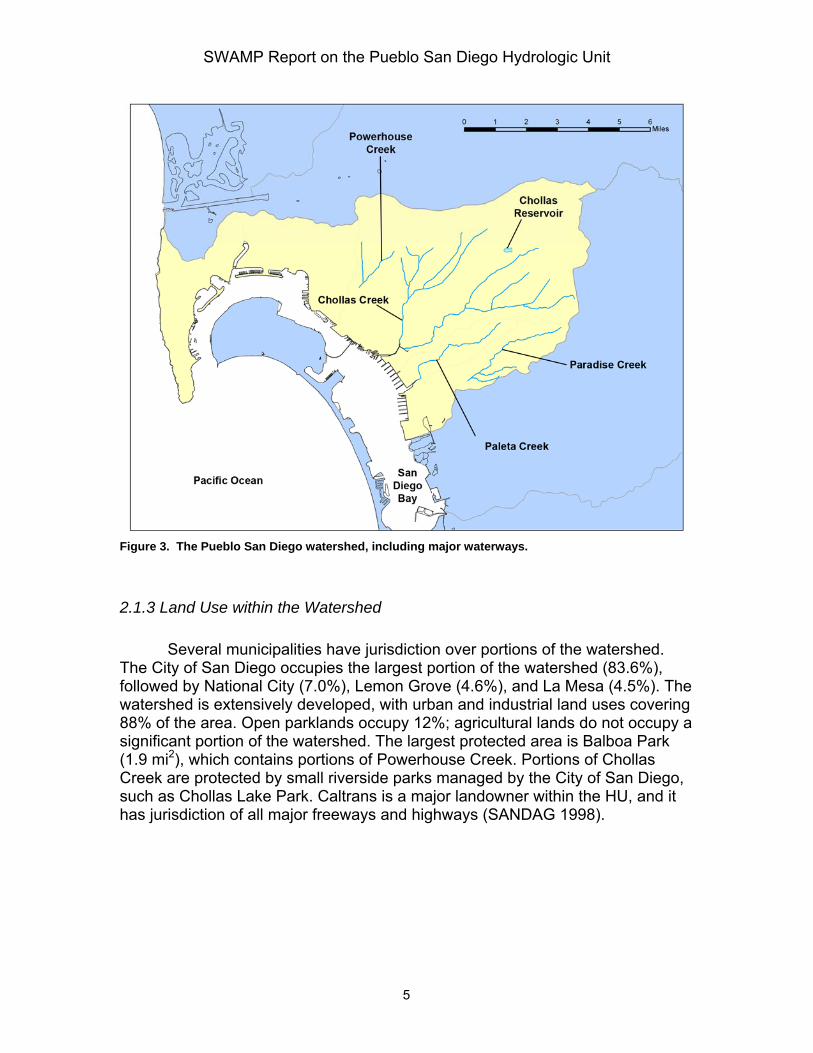
2.1.2 Hydrology The Pueblo San Diego HU consists of four major watersheds which drain to San Diego Bay: Chollas Creek, Paradise Creek, Powerhouse Creek, and Paleta Creek (Figure 3). The largest watershed is Chollas Creek, which consists of two major tributaries.
4
SWAMP Report on the Pueblo San Diego Hydrologic Unit
Figure 3. The Pueblo San Diego watershed, including major waterways. 2.1.3 Land Use within the Watershed Several municipalities have jurisdiction over portions of the watershed. The City of San Diego occupies the largest portion of the watershed (83.6%), followed by National City (7.0%), Lemon Grove (4.6%), and La Mesa (4.5%). The watershed is extensively developed, with urban and industrial land uses covering 88% of the area. Open parklands occupy 12%; agricultural lands do not occupy a significant portion of the watershed. The largest protected area is Balboa Park (1.9 mi2), which contains portions of Powerhouse Creek. Portions of Chollas Creek are protected by small riverside parks managed by the City of San Diego, such as Chollas Lake Park. Caltrans is a major landowner within the HU, and it has jurisdiction of all major freeways and highways (SANDAG 1998).
5
SWAMP Report on the Pueblo San Diego Hydrologic Unit
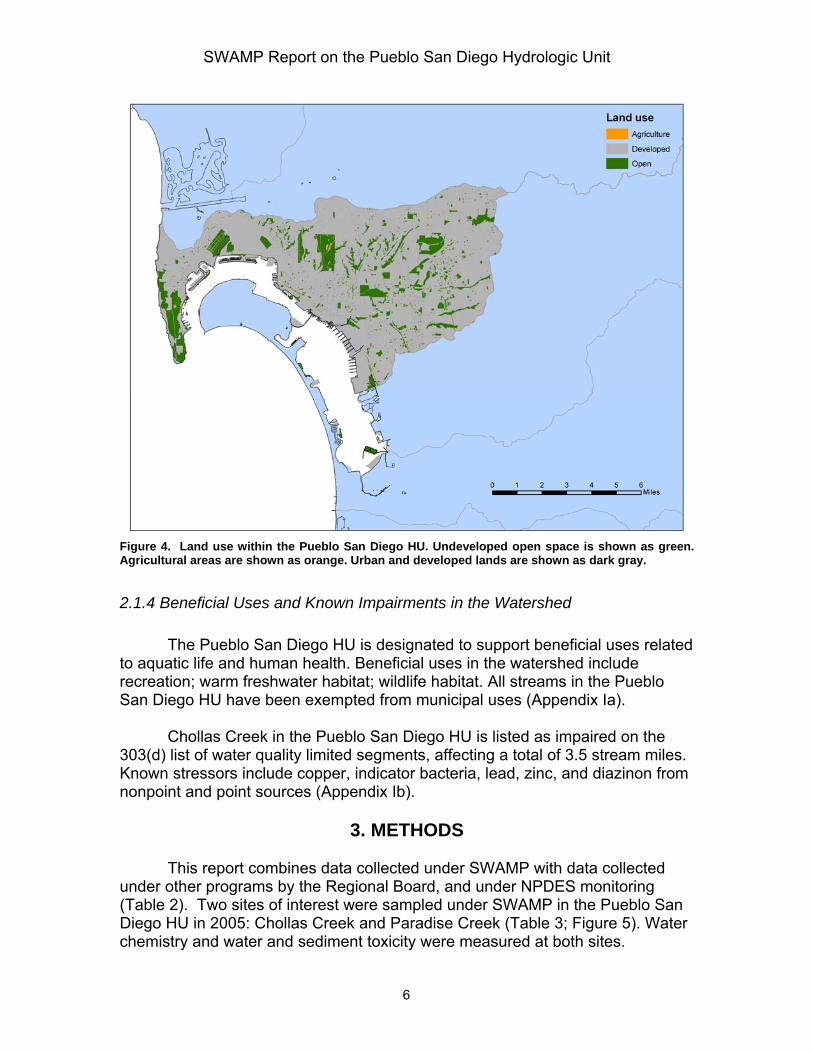
Figure 4. Land use within the Pueblo San Diego HU. Undeveloped open space is shown as green. Agricultural areas are shown as orange. Urban and developed lands are shown as dark gray. 2.1.4 Beneficial Uses and Known Impairments in the Watershed
The Pueblo San Diego HU is designated to support beneficial uses related to aquatic life and human health. Beneficial uses in the watershed include recreation; warm freshwater habitat; wildlife habitat. All streams in the Pueblo San Diego HU have been exempted from municipal uses (Appendix Ia).
Chollas Creek in the Pueblo San Diego HU is listed as impaired on the
303(d) list of water quality limited segments, affecting a total of 3.5 stream miles. Known stressors include copper, indicator bacteria, lead, zinc, and diazinon from nonpoint and point sources (Appendix Ib).
3. METHODS This report combines data collected under SWAMP with data collected under other programs by the Regional Board, and under NPDES monitoring (Table 2). Two sites of interest were sampled under SWAMP in the Pueblo San Diego HU in 2005: Chollas Creek and Paradise Creek (Table 3; Figure 5). Water chemistry and water and sediment toxicity were measured at both sites.
6
SWAMP Report on the Pueblo San Diego Hydrologic Unit
Bioassessment samples were collected in 2005 and 2006 under SWAMP and other programs by the San Diego Water Board at Chollas Creek. Bioassessment samples and limited water chemistry (e.g., temperature, conductivity, dissolved oxygen) were collected at a second site on Chollas Creek by the Regional Board, and by the County of San Diego as part of its NPDES monitoring (Table 4; Figure 5). Physical habitat and fish tissues were not assessed in the Pueblo San Diego HU.
Table 2. Sources of data used in this report. Project Indicators YearsSWAMP Water chemistry, toxicity, bioassessment 2005-2006Regional board monitoring Bioassessment 2005San Diego County NPDES Water chemistry, bioassessment 2003-2005
Table 3. SWAMP sampling site locations. Bioassessment samples were collected at the locations marked with an asterisk (*).
Site Description Latitude (°N) Longitude (°E)1 908PPAR04 Paradise Creek 4 32.66943 -117.102792 CHL4* Chollas Creek 4 32.69584 -117.12226
Table 4. Non-SWAMP sampling site locations. W = sites where conventional water chemistry was sampled. B = sites where benthic macroinvertebrates were sampled.
Site DescriptionSWAMP site within 500 m Sources W B Lattitude (N) Longitude (E)
1 None Regional Board (908CCTNFA) X 32.7273 -117.06977NPDES (CC-FB) X X
2 Chollas Creek above National Boulevard
CHL4 Regional Board (908CLCANB) X 32.69629 -117.12237
Chollas Creek tributary near Federal Avenue
7
SWAMP Report on the Pueblo San Diego Hydrologic Unit
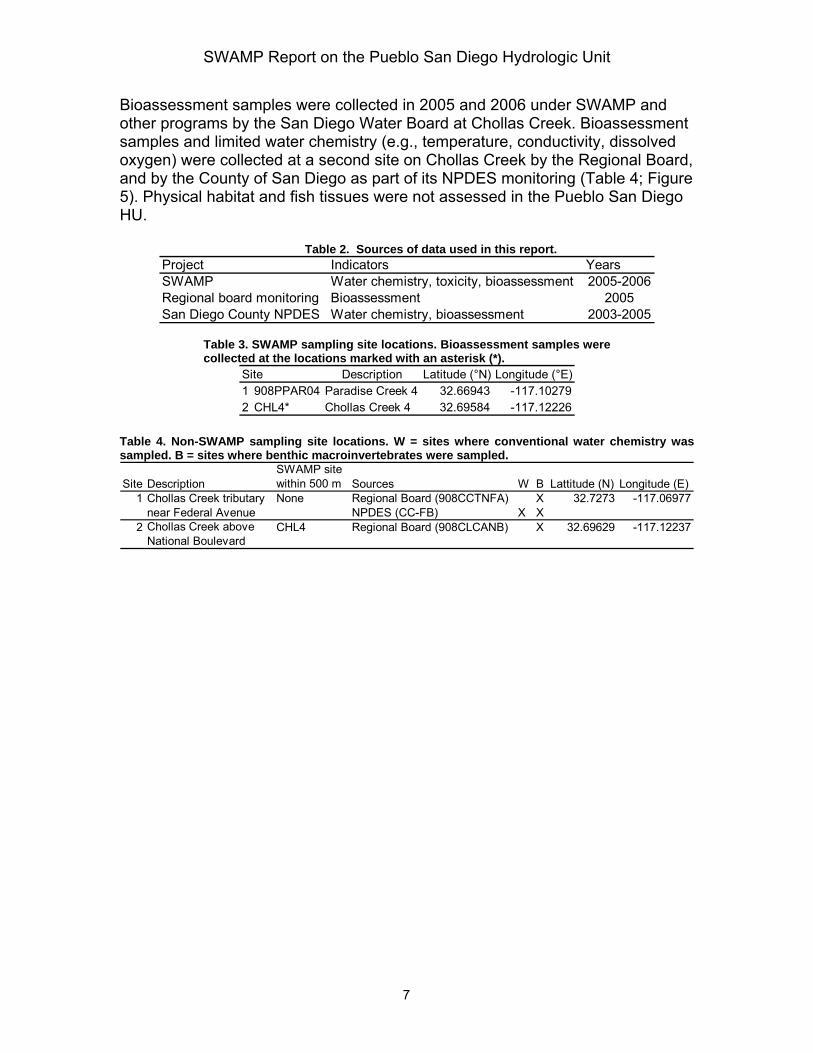
Figure 5. Sampling locations in the Pueblo San Diego HU. White circles represent sites sampled under SWAMP. Black circles represent sites sampled under non-SWAMP programs. Gray circles represent sites sampled under both SWAMP and non-SWAMP programs. 3.1 Indicators
Multiple indicators were used to assess the sites in the Pueblo San Diego HU. Water chemistry, water and sediment toxicity, and benthic macroinvertebrate communities.
3.1.1 Water chemistry To assess water chemistry, samples were collected at each site. Water chemistry was measured as per the SWAMP Quality Assurance Management Plan (QAMP) (Puckett 2002). Measured indicators included conventional water chemistry (e.g., pH, temperature dissolved oxygen, etc.), inorganics, herbicides, pesticides, polycyclic aromatic hydrocarbons (PAHs), dissolved metals, pesticides, and polychlorinated biphenyls (PCBs). Appendix II contains a complete list of constituents that were measured. Limited water chemistry was collected under non-SWAMP NPDES monitoring as well. This monitoring was restricted to physical parameters, and
8
SWAMP Report on the Pueblo San Diego Hydrologic Unit
followed procedures described in annual reports to the California Regional Water Quality Control Board, San Diego Region (e.g., Weston Solutions Inc. 2007). 3.1.2 Toxicity To evaluate water and sediment toxicity to aquatic life in Chollas and Paradise Creeks, toxicity assays were conducted on samples from each site as per the SWAMP QAMP (EPA 1993, Puckett 2002). Water toxicity was evaluated with 7-day exposures on the water flea, Ceriodaphnia dubia, and 96-hour exposures to the alga Selenastrum capricornutum. Both acute and chronic toxicity to C. dubia was measured as decreased survival and fecundity (i.e., eggs per female) relative to controls, respectively. Chronic toxicity to S. capricornutum was measured as changes in total cell count relative to controls. Sediment toxicity was evaluated with 10-day exposures on the amphipod Hyallela azteca. Both acute and chronic toxicity to H. azteca was measured as decreased survival and growth (mg per individual) relative to controls, respectively. Chronic toxicity endpoints (i.e., C. dubia fecundity, H. azteca growth, and S. capricornutum total cell count) were used to develop a summary index of toxicity at each site. All indicators were measured from one sample per site. All samples from Chollas Creek were collected on June 2, 2006. Water samples were collected at Paradise Creek on September 6, 2005. Sediment samples from Paradise Creek were collected on April 10, 2006. 3.1.3 Tissue
Fish tissues were not assessed in the Pueblo San Diego HU. 3.1.4 Bioassessment To assess the ecological health of the streams in Pueblo San Diego HU, benthic macroinvertebrate samples were collected at 2 sites on Chollas Creek. Samples were collected using SWAMP-comparable protocols, as per the SWAMP QAMP (Puckett 2002). Three replicate samples were collected from riffles at each site; 300 individuals were sorted and identified from each replicate, creating a total count of 900 individuals per site. Using a Monte Carlo simulation, all samples were reduced to 500 count for calculation of the Southern California Index of Biotic Integrity (IBI; Ode et al. 2005), a composite of seven metrics summed and scaled from 0 (poor condition) to 100 (good condition). 3.1.5 Physical Habitat
Physical habitat was not assessed in the Pueblo San Diego HU.
9
SWAMP Report on the Pueblo San Diego Hydrologic Unit
3.2 Data Analysis To evaluate the extent of human impacts to water chemistry in streams in the Pueblo San Diego HU, two frequency-based approaches were employed to detecting impacts. First, established aquatic life and human health thresholds for individual constituents were evaluated for frequency of exceedances. Second, the frequency of detection for anthropogenic constituents (such as PCBs, pesticides, and PAHs) was also evaluated. To evaluate the overall health of each site and of the watershed, three indicators were selected for analysis: number of constituents exceeding aquatic life water chemistry thresholds; frequency of chronic toxicity to S. capricornutum, C. dubia, and H. azteca; and mean IBI score. These results were plotted on a map of the watershed, indicating the severity and distribution of human impacts. Although non-SWAMP sources of water chemistry data were used, this report focuses on SWAMP data in order to maintain consistency of sampling methods and parameters measured at each site. Analyses of non-SWAMP water chemistry data is presented separately. In contrast, bioassessment data from multiple sources is analyzed together because of the high compatibility of sampling protocols used in different programs, and because of the limited availability of bioassessment data from a single source. Toxicity data were only available from SWAMP monitoring. 3.2.1 Thresholds In order to use the data to assess the health of the watershed, thresholds were established for each indicator: water quality, toxicity, and bioassessment. Exceedance of appropriate thresholds was considered evidence for impact on watershed health. Water chemistry data from this study were compared to water quality objectives established by state and federal agencies to protect the most sensitive beneficial uses designated in the Pueblo San Diego HU. Therefore, the most stringent water quality objectives (e.g., municipal drinking water, aquatic life, etc.) for the measured constituents were used as threshold points to evaluate the data. The Water Quality Control Plan for the San Diego Basin (BP) was the primary source of water chemistry thresholds. Other sources for standards used in water chemistry thresholds included the California Toxics Rule (CTR), the Environmental Protection Agency National Aquatic Life Criteria (EPA), the National Academy of Sciences Health Advisory (NASHA), United States Environmental Protection Agency Integrated Risk Information System (IRIS), Total Maximum Daily Loads (TMDLs) for Chollas Creek, and the California Code
10
SWAMP Report on the Pueblo San Diego Hydrologic Unit
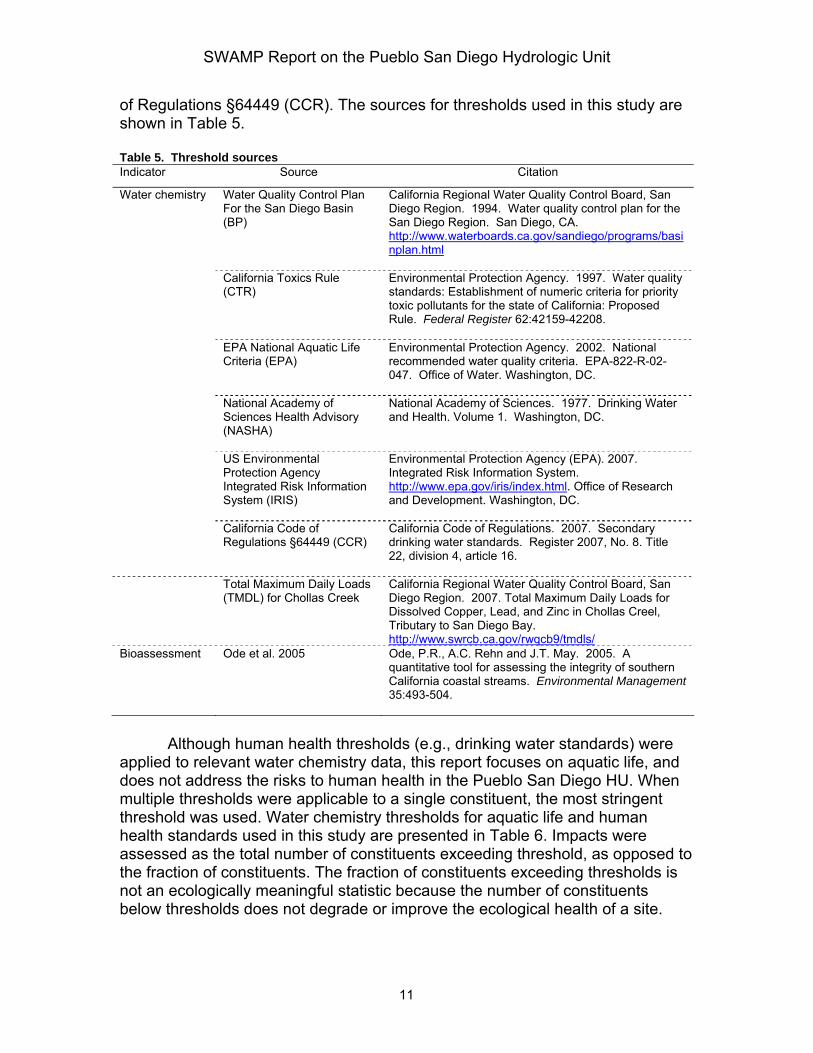
of Regulations §64449 (CCR). The sources for thresholds used in this study are shown in Table 5. Table 5. Threshold sources Indicator Source Citation
Water chemistry Water Quality Control Plan For the San Diego Basin (BP)
California Regional Water Quality Control Board, San Diego Region. 1994. Water quality control plan for the San Diego Region. San Diego, CA. http://www.waterboards.ca.gov/sandiego/programs/basinplan.html
California Toxics Rule (CTR)
Environmental Protection Agency. 1997. Water quality standards: Establishment of numeric criteria for priority toxic pollutants for the state of California: Proposed Rule. Federal Register 62:42159-42208.
EPA National Aquatic Life Criteria (EPA)
Environmental Protection Agency. 2002. National recommended water quality criteria. EPA-822-R-02-047. Office of Water. Washington, DC.
National Academy of Sciences Health Advisory (NASHA)
National Academy of Sciences. 1977. Drinking Water and Health. Volume 1. Washington, DC.
US Environmental Protection Agency Integrated Risk Information System (IRIS)
Environmental Protection Agency (EPA). 2007. Integrated Risk Information System. http://www.epa.gov/iris/index.html. Office of Research and Development. Washington, DC.
California Code of Regulations §64449 (CCR)
California Code of Regulations. 2007. Secondary drinking water standards. Register 2007, No. 8. Title 22, division 4, article 16.
Total Maximum Daily Loads (TMDL) for Chollas Creek
California Regional Water Quality Control Board, San Diego Region. 2007. Total Maximum Daily Loads for Dissolved Copper, Lead, and Zinc in Chollas Creel, Tributary to San Diego Bay. http://www.swrcb.ca.gov/rwqcb9/tmdls/
Bioassessment Ode et al. 2005 Ode, P.R., A.C. Rehn and J.T. May. 2005. A quantitative tool for assessing the integrity of southern California coastal streams. Environmental Management 35:493-504.
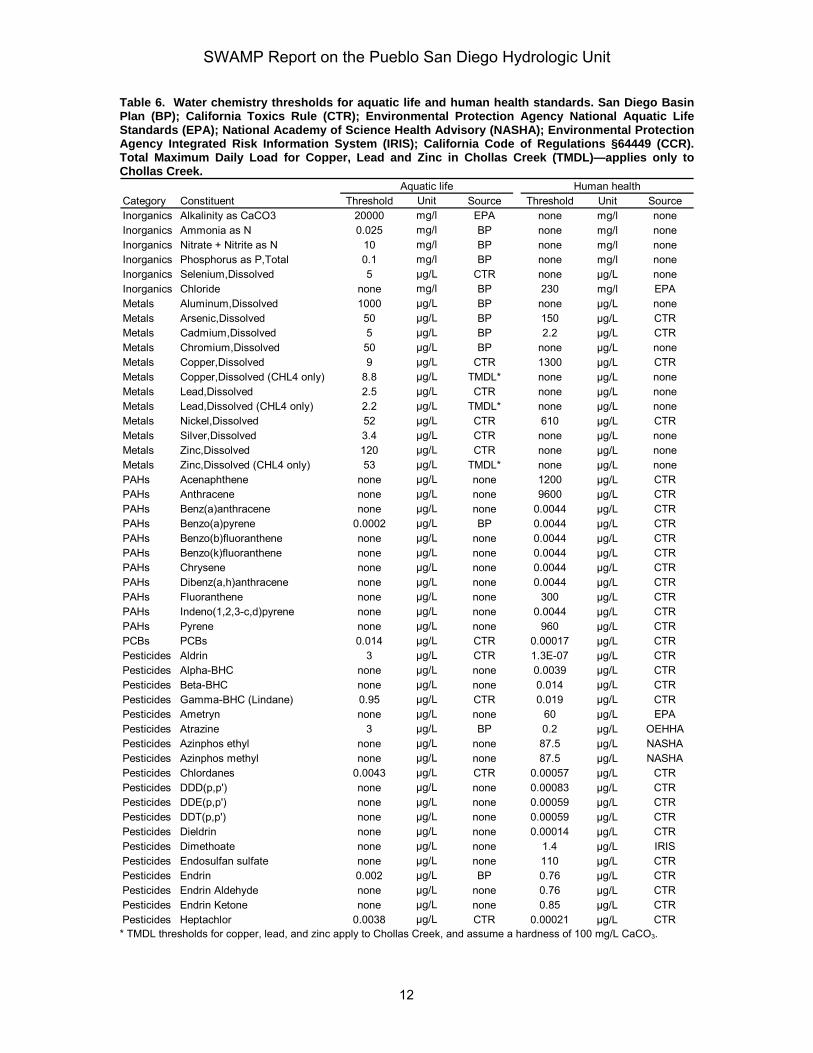
Although human health thresholds (e.g., drinking water standards) were applied to relevant water chemistry data, this report focuses on aquatic life, and does not address the risks to human health in the Pueblo San Diego HU. When multiple thresholds were applicable to a single constituent, the most stringent threshold was used. Water chemistry thresholds for aquatic life and human health standards used in this study are presented in Table 6. Impacts were assessed as the total number of constituents exceeding threshold, as opposed to the fraction of constituents. The fraction of constituents exceeding thresholds is not an ecologically meaningful statistic because the number of constituents below thresholds does not degrade or improve the ecological health of a site.
11
SWAMP Report on the Pueblo San Diego Hydrologic Unit
Table 6. Water chemistry thresholds for aquatic life and human health standards. San Diego Basin Plan (BP); California Toxics Rule (CTR); Environmental Protection Agency National Aquatic Life Standards (EPA); National Academy of Science Health Advisory (NASHA); Environmental Protection Agency Integrated Risk Information System (IRIS); California Code of Regulations §64449 (CCR). Total Maximum Daily Load for Copper, Lead and Zinc in Chollas Creek (TMDL)—applies only to Chollas Creek.
Category Constituent Threshold Unit Source Threshold Unit SourceInorganics Alkalinity as CaCO3 20000 mg/l EPA none mg/l noneInorganics Ammonia as N 0.025 mg/l BP none mg/l noneInorganics Nitrate + Nitrite as N 10 mg/l BP none mg/l noneInorganics Phosphorus as P,Total 0.1 mg/l BP none mg/l noneInorganics Selenium,Dissolved 5 µg/L CTR none µg/L noneInorganics Chloride none mg/l BP 230 mg/l EPAMetals Aluminum,Dissolved 1000 µg/L BP none µg/L noneMetals Arsenic,Dissolved 50 µg/L BP 150 µg/L CTRMetals Cadmium,Dissolved 5 µg/L BP 2.2 µg/L CTRMetals Chromium,Dissolved 50 µg/L BP none µg/L noneMetals Copper,Dissolved 9 µg/L CTR 1300 µg/L CTRMetals Copper,Dissolved (CHL4 only) 8.8 µg/L TMDL* none µg/L noneMetals Lead,Dissolved 2.5 µg/L CTR none µg/L noneMetals Lead,Dissolved (CHL4 only) 2.2 µg/L TMDL* none µg/L noneMetals Nickel,Dissolved 52 µg/L CTR 610 µg/L CTRMetals Silver,Dissolved 3.4 µg/L CTR none µg/L noneMetals Zinc,Dissolved 120 µg/L CTR none µg/L noneMetals Zinc,Dissolved (CHL4 only) 53 µg/L TMDL* none µg/L nonePAHs Acenaphthene none µg/L none 1200 µg/L CTRPAHs Anthracene none µg/L none 9600 µg/L CTRPAHs Benz(a)anthracene none µg/L none 0.0044 µg/L CTRPAHs Benzo(a)pyrene 0.0002 µg/L BP 0.0044 µg/L CTRPAHs Benzo(b)fluoranthene none µg/L none 0.0044 µg/L CTRPAHs Benzo(k)fluoranthene none µg/L none 0.0044 µg/L CTRPAHs Chrysene none µg/L none 0.0044 µg/L CTRPAHs Dibenz(a,h)anthracene none µg/L none 0.0044 µg/L CTRPAHs Fluoranthene none µg/L none 300 µg/L CTRPAHs Indeno(1,2,3-c,d)pyrene none µg/L none 0.0044 µg/L CTRPAHs Pyrene none µg/L none 960 µg/L CTRPCBs PCBs 0.014 µg/L CTR 0.00017 µg/L CTRPesticides Aldrin 3 µg/L CTR 1.3E-07 µg/L CTRPesticides Alpha-BHC none µg/L none 0.0039 µg/L CTRPesticides Beta-BHC none µg/L none 0.014 µg/L CTRPesticides Gamma-BHC (Lindane) 0.95 µg/L CTR 0.019 µg/L CTRPesticides Ametryn none µg/L none 60 µg/L EPAPesticides Atrazine 3 µg/L BP 0.2 µg/L OEHHAPesticides Azinphos ethyl none µg/L none 87.5 µg/L NASHAPesticides Azinphos methyl none µg/L none 87.5 µg/L NASHAPesticides Chlordanes 0.0043 µg/L CTR 0.00057 µg/L CTRPesticides DDD(p,p') none µg/L none 0.00083 µg/L CTRPesticides DDE(p,p') none µg/L none 0.00059 µg/L CTRPesticides DDT(p,p') none µg/L none 0.00059 µg/L CTRPesticides Dieldrin none µg/L none 0.00014 µg/L CTRPesticides Dimethoate none µg/L none 1.4 µg/L IRISPesticides Endosulfan sulfate none µg/L none 110 µg/L CTRPesticides Endrin 0.002 µg/L BP 0.76 µg/L CTRPesticides Endrin Aldehyde none µg/L none 0.76 µg/L CTRPesticides Endrin Ketone none µg/L none 0.85 µg/L CTRPesticides Heptachlor 0.0038 µg/L CTR 0.00021 µg/L CTR
Aquatic life Human health
* TMDL thresholds for copper, lead, and zinc apply to Chollas Creek, and assume a hardness of 100 mg/L CaCO3.
12
SWAMP Report on the Pueblo San Diego Hydrologic Unit
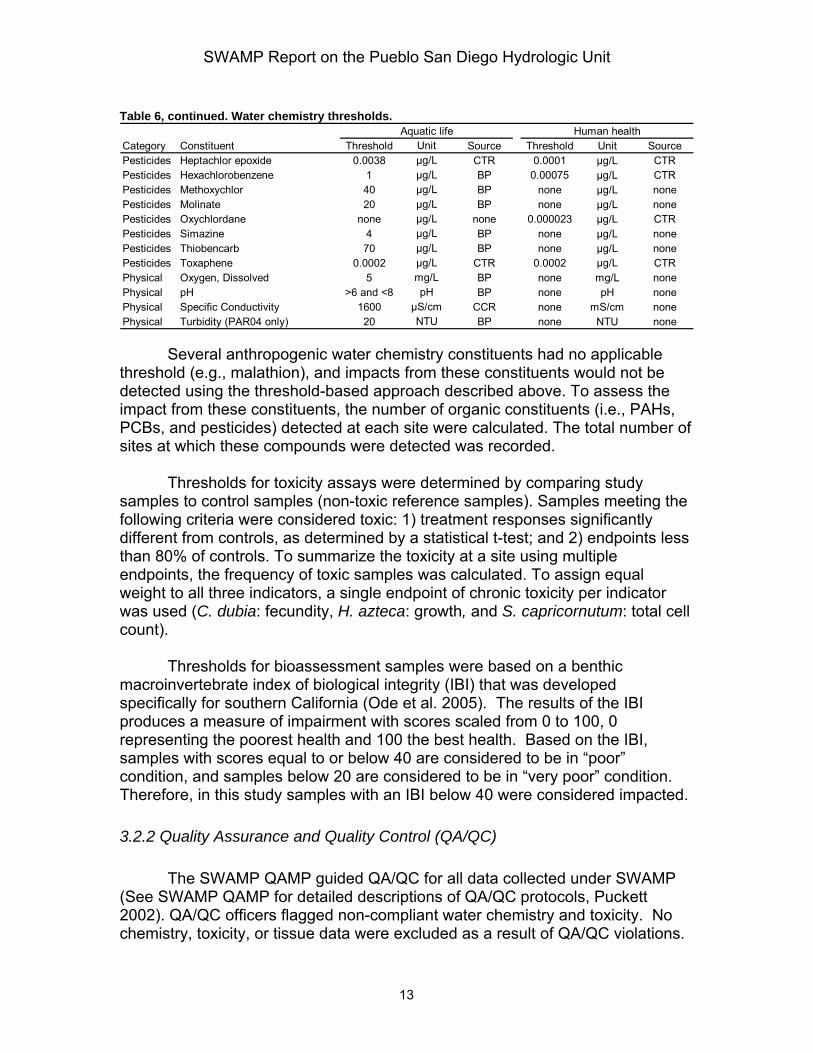
Table 6, continued. Water chemistry thresholds.
Category Constituent Threshold Unit Source Threshold Unit SourcePesticides Heptachlor epoxide 0.0038 µg/L CTR 0.0001 µg/L CTRPesticides Hexachlorobenzene 1 µg/L BP 0.00075 µg/L CTRPesticides Methoxychlor 40 µg/L BP none µg/L nonePesticides Molinate 20 µg/L BP none µg/L nonePesticides Oxychlordane none µg/L none 0.000023 µg/L CTRPesticides Simazine 4 µg/L BP none µg/L nonePesticides Thiobencarb 70 µg/L BP none µg/L nonePesticides Toxaphene 0.0002 µg/L CTR 0.0002 µg/L CTRPhysical Oxygen, Dissolved 5 mg/L BP none mg/L nonePhysical pH >6 and <8 pH BP none pH nonePhysical Specific Conductivity 1600 μS/cm CCR none mS/cm nonePhysical Turbidity (PAR04 only) 20 NTU BP none NTU none
Aquatic life Human health
Several anthropogenic water chemistry constituents had no applicable threshold (e.g., malathion), and impacts from these constituents would not be detected using the threshold-based approach described above. To assess the impact from these constituents, the number of organic constituents (i.e., PAHs, PCBs, and pesticides) detected at each site were calculated. The total number of sites at which these compounds were detected was recorded.
Thresholds for toxicity assays were determined by comparing study
samples to control samples (non-toxic reference samples). Samples meeting the following criteria were considered toxic: 1) treatment responses significantly different from controls, as determined by a statistical t-test; and 2) endpoints less than 80% of controls. To summarize the toxicity at a site using multiple endpoints, the frequency of toxic samples was calculated. To assign equal weight to all three indicators, a single endpoint of chronic toxicity per indicator was used (C. dubia: fecundity, H. azteca: growth, and S. capricornutum: total cell count). Thresholds for bioassessment samples were based on a benthic macroinvertebrate index of biological integrity (IBI) that was developed specifically for southern California (Ode et al. 2005). The results of the IBI produces a measure of impairment with scores scaled from 0 to 100, 0 representing the poorest health and 100 the best health. Based on the IBI, samples with scores equal to or below 40 are considered to be in “poor” condition, and samples below 20 are considered to be in “very poor” condition. Therefore, in this study samples with an IBI below 40 were considered impacted.
3.2.2 Quality Assurance and Quality Control (QA/QC) The SWAMP QAMP guided QA/QC for all data collected under SWAMP (See SWAMP QAMP for detailed descriptions of QA/QC protocols, Puckett 2002). QA/QC officers flagged non-compliant water chemistry and toxicity. No chemistry, toxicity, or tissue data were excluded as a result of QA/QC violations.
13
SWAMP Report on the Pueblo San Diego Hydrologic Unit
QA/QC procedures for NPDES water chemistry data were similar to those used in SWAMP (Weston Solutions Inc. 2007) Non-SWAMP bioassessment samples were screened for samples containing fewer than 450 individuals. No bioassessment sample was excluded from this analysis.
14
SWAMP Report on the Pueblo San Diego Hydrologic Unit
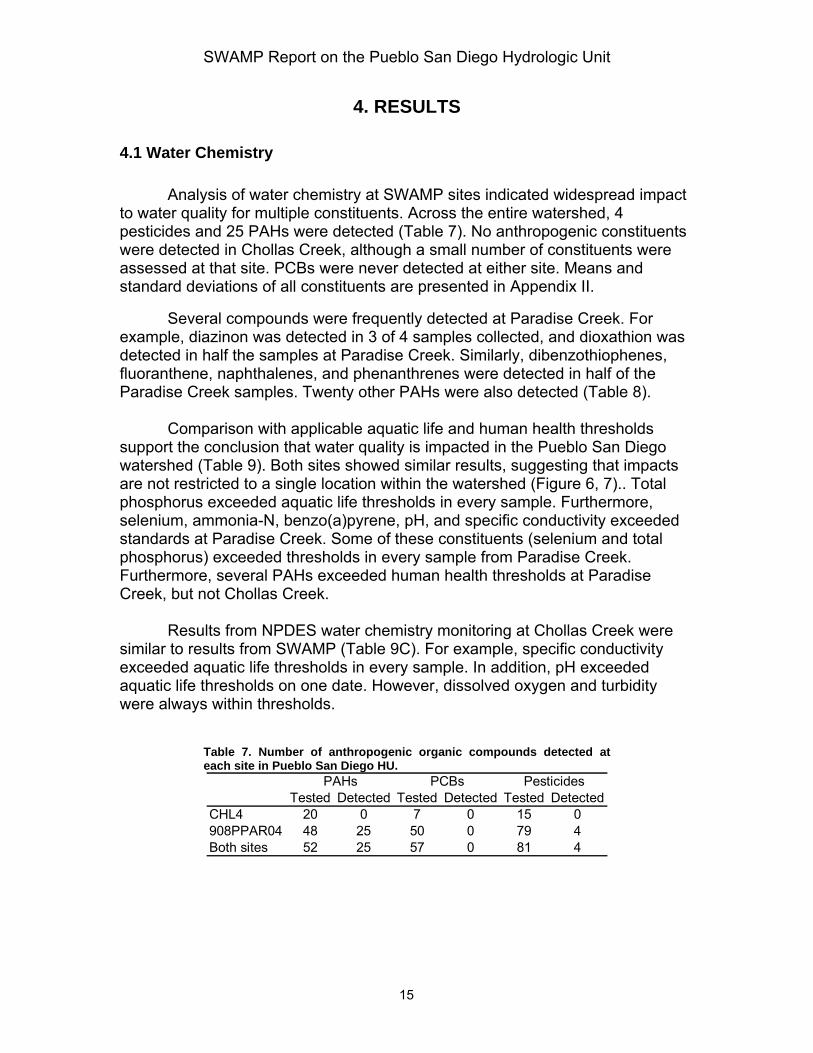
4. RESULTS 4.1 Water Chemistry Analysis of water chemistry at SWAMP sites indicated widespread impact to water quality for multiple constituents. Across the entire watershed, 4 pesticides and 25 PAHs were detected (Table 7). No anthropogenic constituents were detected in Chollas Creek, although a small number of constituents were assessed at that site. PCBs were never detected at either site. Means and standard deviations of all constituents are presented in Appendix II. Several compounds were frequently detected at Paradise Creek. For example, diazinon was detected in 3 of 4 samples collected, and dioxathion was detected in half the samples at Paradise Creek. Similarly, dibenzothiophenes, fluoranthene, naphthalenes, and phenanthrenes were detected in half of the Paradise Creek samples. Twenty other PAHs were also detected (Table 8).
Comparison with applicable aquatic life and human health thresholds support the conclusion that water quality is impacted in the Pueblo San Diego watershed (Table 9). Both sites showed similar results, suggesting that impacts are not restricted to a single location within the watershed (Figure 6, 7).. Total phosphorus exceeded aquatic life thresholds in every sample. Furthermore, selenium, ammonia-N, benzo(a)pyrene, pH, and specific conductivity exceeded standards at Paradise Creek. Some of these constituents (selenium and total phosphorus) exceeded thresholds in every sample from Paradise Creek. Furthermore, several PAHs exceeded human health thresholds at Paradise Creek, but not Chollas Creek.
Results from NPDES water chemistry monitoring at Chollas Creek were similar to results from SWAMP (Table 9C). For example, specific conductivity exceeded aquatic life thresholds in every sample. In addition, pH exceeded aquatic life thresholds on one date. However, dissolved oxygen and turbidity were always within thresholds.
Table 7. Number of anthropogenic organic compounds detected at each site in Pueblo San Diego HU.
PAHs PCBs PesticidesTested Detected Tested Detected Tested Detected
CHL4 20 0 7 0 15 0908PPAR04 48 25 50 0 79 4Both sites 52 25 57 0 81 4
15
SWAMP Report on the Pueblo San Diego Hydrologic Unit
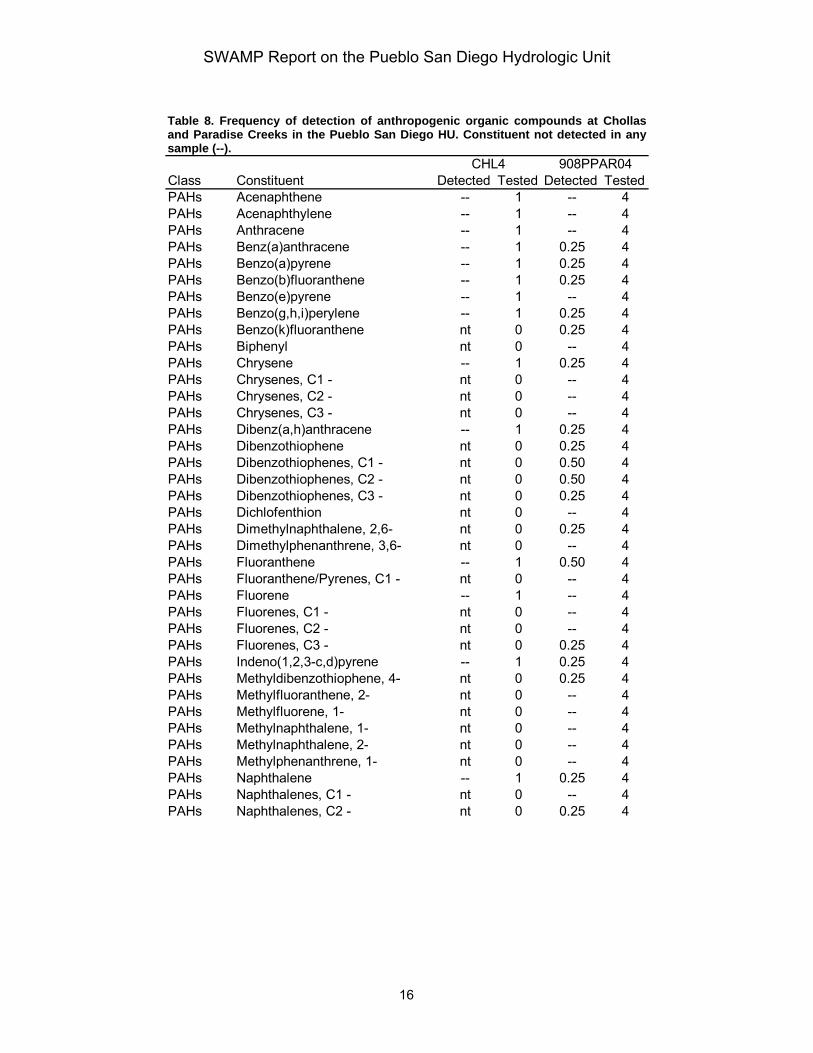
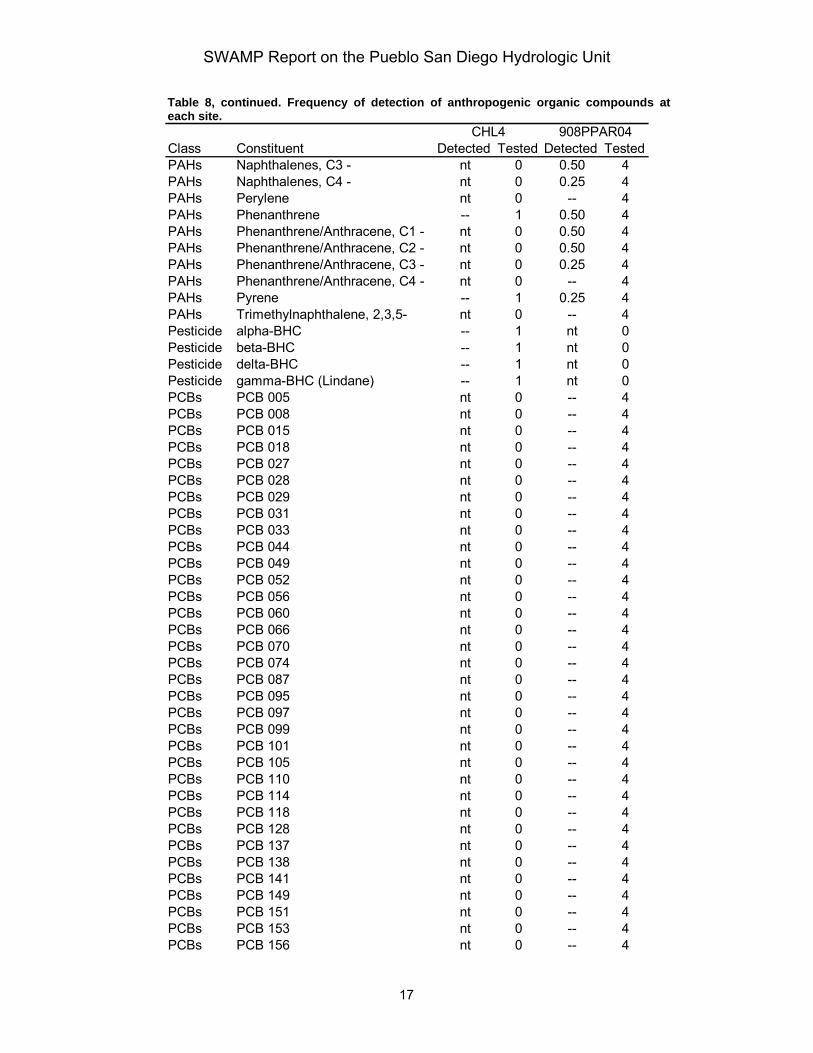
Table 8. Frequency of detection of anthropogenic organic compounds at Chollas and Paradise Creeks in the Pueblo San Diego HU. Constituent not detected in any sample (--).
CHL4 908PPAR04Class Constituent Detected Tested Detected TestedPAHs Acenaphthene -- 1 -- 4PAHs Acenaphthylene -- 1 -- 4PAHs Anthracene -- 1 -- 4PAHs Benz(a)anthracene -- 1 0.25 4PAHs Benzo(a)pyrene -- 1 0.25 4PAHs Benzo(b)fluoranthene -- 1 0.25 4PAHs Benzo(e)pyrene -- 1 -- 4PAHs Benzo(g,h,i)perylene -- 1 0.25 4PAHs Benzo(k)fluoranthene nt 0 0.25 4PAHs Biphenyl nt 0 -- 4PAHs Chrysene -- 1 0.25 4PAHs Chrysenes, C1 - nt 0 -- 4PAHs Chrysenes, C2 - nt 0 -- 4PAHs Chrysenes, C3 - nt 0 -- 4PAHs Dibenz(a,h)anthracene -- 1 0.25 4PAHs Dibenzothiophene nt 0 0.25 4PAHs Dibenzothiophenes, C1 - nt 0 0.50 4PAHs Dibenzothiophenes, C2 - nt 0 0.50 4PAHs Dibenzothiophenes, C3 - nt 0 0.25 4PAHs Dichlofenthion nt 0 -- 4PAHs Dimethylnaphthalene, 2,6- nt 0 0.25 4PAHs Dimethylphenanthrene, 3,6- nt 0 -- 4PAHs Fluoranthene -- 1 0.50 4PAHs Fluoranthene/Pyrenes, C1 - nt 0 -- 4PAHs Fluorene -- 1 -- 4PAHs Fluorenes, C1 - nt 0 -- 4PAHs Fluorenes, C2 - nt 0 -- 4PAHs Fluorenes, C3 - nt 0 0.25 4PAHs Indeno(1,2,3-c,d)pyrene -- 1 0.25 4PAHs Methyldibenzothiophene, 4- nt 0 0.25 4PAHs Methylfluoranthene, 2- nt 0 -- 4PAHs Methylfluorene, 1- nt 0 -- 4PAHs Methylnaphthalene, 1- nt 0 -- 4PAHs Methylnaphthalene, 2- nt 0 -- 4PAHs Methylphenanthrene, 1- nt 0 -- 4PAHs Naphthalene -- 1 0.25 4PAHs Naphthalenes, C1 - nt 0 -- 4PAHs Naphthalenes, C2 - nt 0 0.25 4
16
SWAMP Report on the Pueblo San Diego Hydrologic Unit
Table 8, continued. Frequency of detection of anthropogenic organic compounds at each site.
CHL4 908PPAR04Class Constituent Detected Tested Detected TestedPAHs Naphthalenes, C3 - nt 0 0.50 4PAHs Naphthalenes, C4 - nt 0 0.25 4PAHs Perylene nt 0 -- 4PAHs Phenanthrene -- 1 0.50 4PAHs Phenanthrene/Anthracene, C1 - nt 0 0.50 4PAHs Phenanthrene/Anthracene, C2 - nt 0 0.50 4PAHs Phenanthrene/Anthracene, C3 - nt 0 0.25 4PAHs Phenanthrene/Anthracene, C4 - nt 0 -- 4PAHs Pyrene -- 1 0.25 4PAHs Trimethylnaphthalene, 2,3,5- nt 0 -- 4Pesticide alpha-BHC -- 1 nt 0Pesticide beta-BHC -- 1 nt 0Pesticide delta-BHC -- 1 nt 0Pesticide gamma-BHC (Lindane) -- 1 nt 0PCBs PCB 005 nt 0 -- 4PCBs PCB 008 nt 0 -- 4PCBs PCB 015 nt 0 -- 4PCBs PCB 018 nt 0 -- 4PCBs PCB 027 nt 0 -- 4PCBs PCB 028 nt 0 -- 4PCBs PCB 029 nt 0 -- 4PCBs PCB 031 nt 0 -- 4PCBs PCB 033 nt 0 -- 4PCBs PCB 044 nt 0 -- 4PCBs PCB 049 nt 0 -- 4PCBs PCB 052 nt 0 -- 4PCBs PCB 056 nt 0 -- 4PCBs PCB 060 nt 0 -- 4PCBs PCB 066 nt 0 -- 4PCBs PCB 070 nt 0 -- 4PCBs PCB 074 nt 0 -- 4PCBs PCB 087 nt 0 -- 4PCBs PCB 095 nt 0 -- 4PCBs PCB 097 nt 0 -- 4PCBs PCB 099 nt 0 -- 4PCBs PCB 101 nt 0 -- 4PCBs PCB 105 nt 0 -- 4PCBs PCB 110 nt 0 -- 4PCBs PCB 114 nt 0 -- 4PCBs PCB 118 nt 0 -- 4PCBs PCB 128 nt 0 -- 4PCBs PCB 137 nt 0 -- 4PCBs PCB 138 nt 0 -- 4PCBs PCB 141 nt 0 -- 4PCBs PCB 149 nt 0 -- 4PCBs PCB 151 nt 0 -- 4PCBs PCB 153 nt 0 -- 4PCBs PCB 156 nt 0 -- 4
17
SWAMP Report on the Pueblo San Diego Hydrologic Unit
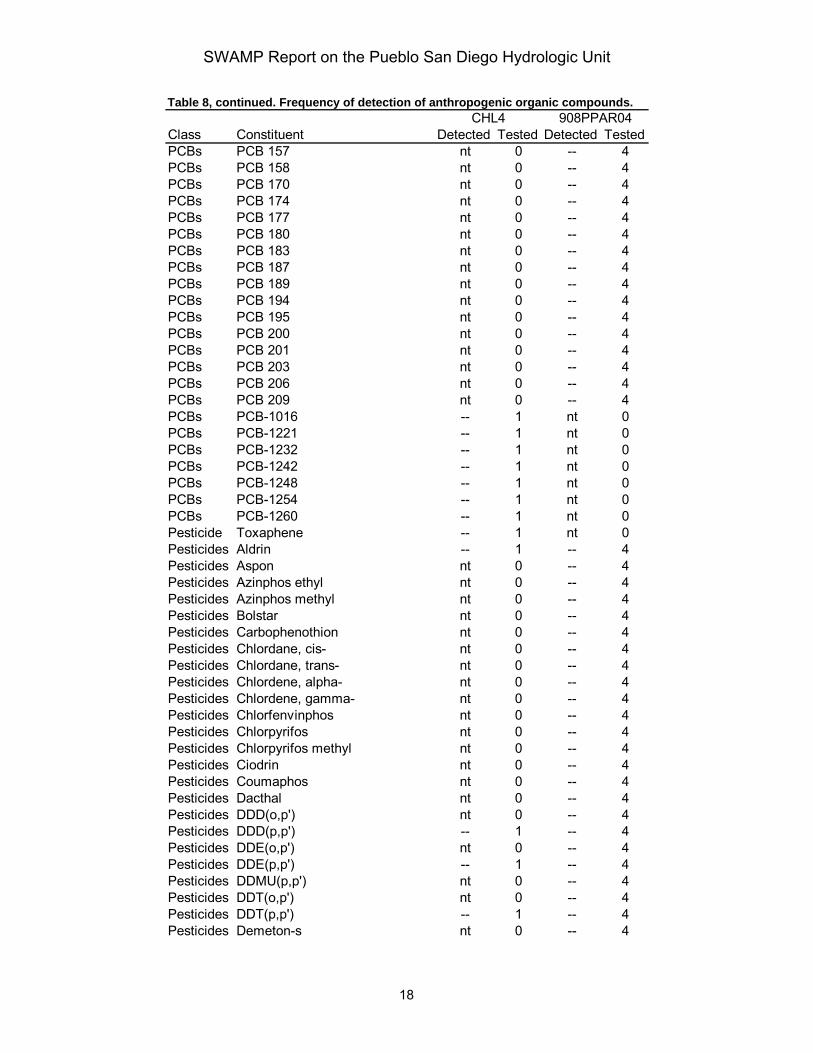
Table 8, continued. Frequency of detection of anthropogenic organic compounds. CHL4 908PPAR04
Class Constituent Detected Tested Detected TestedPCBs PCB 157 nt 0 -- 4PCBs PCB 158 nt 0 -- 4PCBs PCB 170 nt 0 -- 4PCBs PCB 174 nt 0 -- 4PCBs PCB 177 nt 0 -- 4PCBs PCB 180 nt 0 -- 4PCBs PCB 183 nt 0 -- 4PCBs PCB 187 nt 0 -- 4PCBs PCB 189 nt 0 -- 4PCBs PCB 194 nt 0 -- 4PCBs PCB 195 nt 0 -- 4PCBs PCB 200 nt 0 -- 4PCBs PCB 201 nt 0 -- 4PCBs PCB 203 nt 0 -- 4PCBs PCB 206 nt 0 -- 4PCBs PCB 209 nt 0 -- 4PCBs PCB-1016 -- 1 nt 0PCBs PCB-1221 -- 1 nt 0PCBs PCB-1232 -- 1 nt 0PCBs PCB-1242 -- 1 nt 0PCBs PCB-1248 -- 1 nt 0PCBs PCB-1254 -- 1 nt 0PCBs PCB-1260 -- 1 nt 0Pesticide Toxaphene -- 1 nt 0Pesticides Aldrin -- 1 -- 4Pesticides Aspon nt 0 -- 4Pesticides Azinphos ethyl nt 0 -- 4Pesticides Azinphos methyl nt 0 -- 4Pesticides Bolstar nt 0 -- 4Pesticides Carbophenothion nt 0 -- 4Pesticides Chlordane, cis- nt 0 -- 4Pesticides Chlordane, trans- nt 0 -- 4Pesticides Chlordene, alpha- nt 0 -- 4Pesticides Chlordene, gamma- nt 0 -- 4Pesticides Chlorfenvinphos nt 0 -- 4Pesticides Chlorpyrifos nt 0 -- 4Pesticides Chlorpyrifos methyl nt 0 -- 4Pesticides Ciodrin nt 0 -- 4Pesticides Coumaphos nt 0 -- 4Pesticides Dacthal nt 0 -- 4Pesticides DDD(o,p') nt 0 -- 4Pesticides DDD(p,p') -- 1 -- 4Pesticides DDE(o,p') nt 0 -- 4Pesticides DDE(p,p') -- 1 -- 4Pesticides DDMU(p,p') nt 0 -- 4Pesticides DDT(o,p') nt 0 -- 4Pesticides DDT(p,p') -- 1 -- 4Pesticides Demeton-s nt 0 -- 4
18
SWAMP Report on the Pueblo San Diego Hydrologic Unit
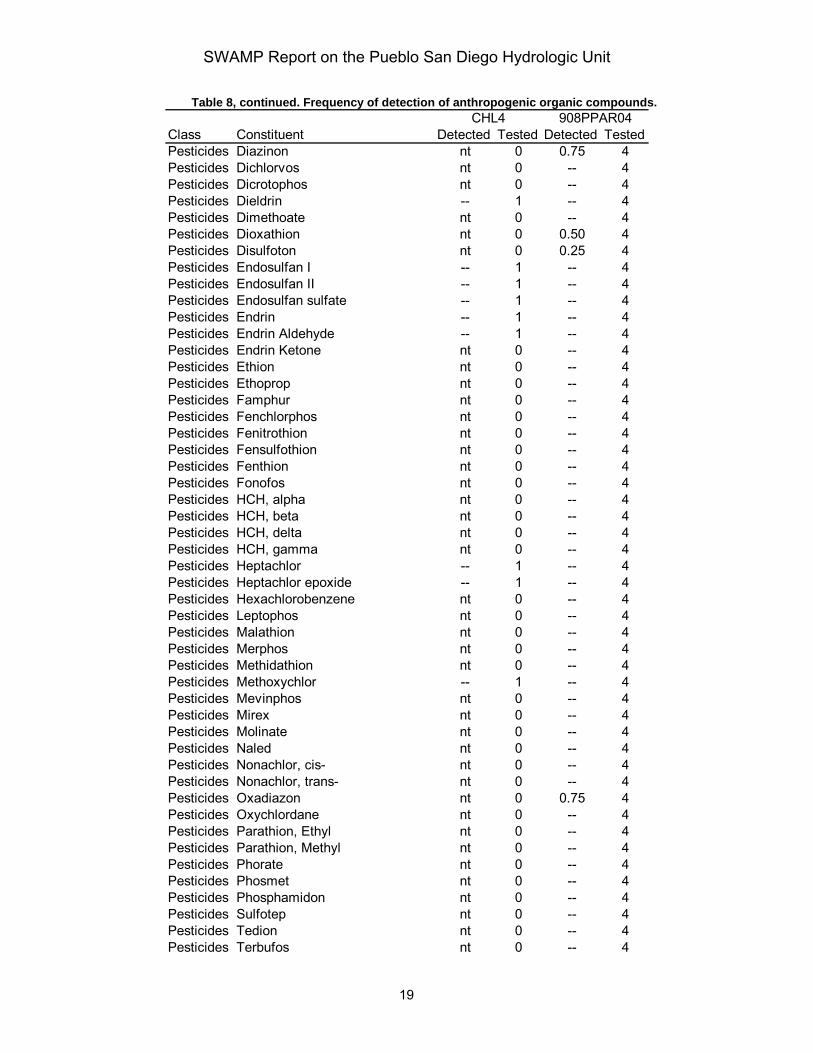
Table 8, continued. Frequency of detection of anthropogenic organic compounds. CHL4 908PPAR04
Class Constituent Detected Tested Detected TestedPesticides Diazinon nt 0 0.75 4Pesticides Dichlorvos nt 0 -- 4Pesticides Dicrotophos nt 0 -- 4Pesticides Dieldrin -- 1 -- 4Pesticides Dimethoate nt 0 -- 4Pesticides Dioxathion nt 0 0.50 4Pesticides Disulfoton nt 0 0.25 4Pesticides Endosulfan I -- 1 -- 4Pesticides Endosulfan II -- 1 -- 4Pesticides Endosulfan sulfate -- 1 -- 4Pesticides Endrin -- 1 -- 4Pesticides Endrin Aldehyde -- 1 -- 4Pesticides Endrin Ketone nt 0 -- 4Pesticides Ethion nt 0 -- 4Pesticides Ethoprop nt 0 -- 4Pesticides Famphur nt 0 -- 4Pesticides Fenchlorphos nt 0 -- 4Pesticides Fenitrothion nt 0 -- 4Pesticides Fensulfothion nt 0 -- 4Pesticides Fenthion nt 0 -- 4Pesticides Fonofos nt 0 -- 4Pesticides HCH, alpha nt 0 -- 4Pesticides HCH, beta nt 0 -- 4Pesticides HCH, delta nt 0 -- 4Pesticides HCH, gamma nt 0 -- 4Pesticides Heptachlor -- 1 -- 4Pesticides Heptachlor epoxide -- 1 -- 4Pesticides Hexachlorobenzene nt 0 -- 4Pesticides Leptophos nt 0 -- 4Pesticides Malathion nt 0 -- 4Pesticides Merphos nt 0 -- 4Pesticides Methidathion nt 0 -- 4Pesticides Methoxychlor -- 1 -- 4Pesticides Mevinphos nt 0 -- 4Pesticides Mirex nt 0 -- 4Pesticides Molinate nt 0 -- 4Pesticides Naled nt 0 -- 4Pesticides Nonachlor, cis- nt 0 -- 4Pesticides Nonachlor, trans- nt 0 -- 4Pesticides Oxadiazon nt 0 0.75 4Pesticides Oxychlordane nt 0 -- 4Pesticides Parathion, Ethyl nt 0 -- 4Pesticides Parathion, Methyl nt 0 -- 4Pesticides Phorate nt 0 -- 4Pesticides Phosmet nt 0 -- 4Pesticides Phosphamidon nt 0 -- 4Pesticides Sulfotep nt 0 -- 4Pesticides Tedion nt 0 -- 4Pesticides Terbufos nt 0 -- 4
19
SWAMP Report on the Pueblo San Diego Hydrologic Unit
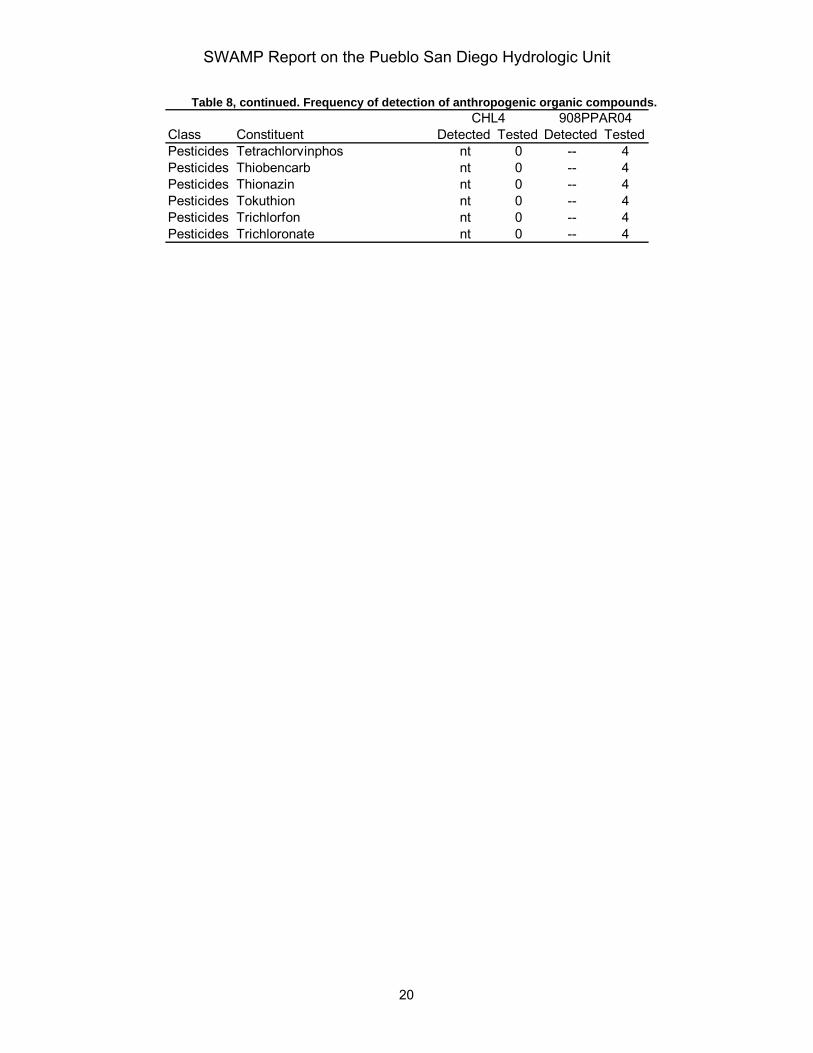
Table 8, continued. Frequency of detection of anthropogenic organic compounds. CHL4 908PPAR04
Class Constituent Detected Tested Detected TestedPesticides Tetrachlorvinphos nt 0 -- 4Pesticides Thiobencarb nt 0 -- 4Pesticides Thionazin nt 0 -- 4Pesticides Tokuthion nt 0 -- 4Pesticides Trichlorfon nt 0 -- 4Pesticides Trichloronate nt 0 -- 4
20
SWAMP Report on the Pueblo San Diego Hydrologic Unit
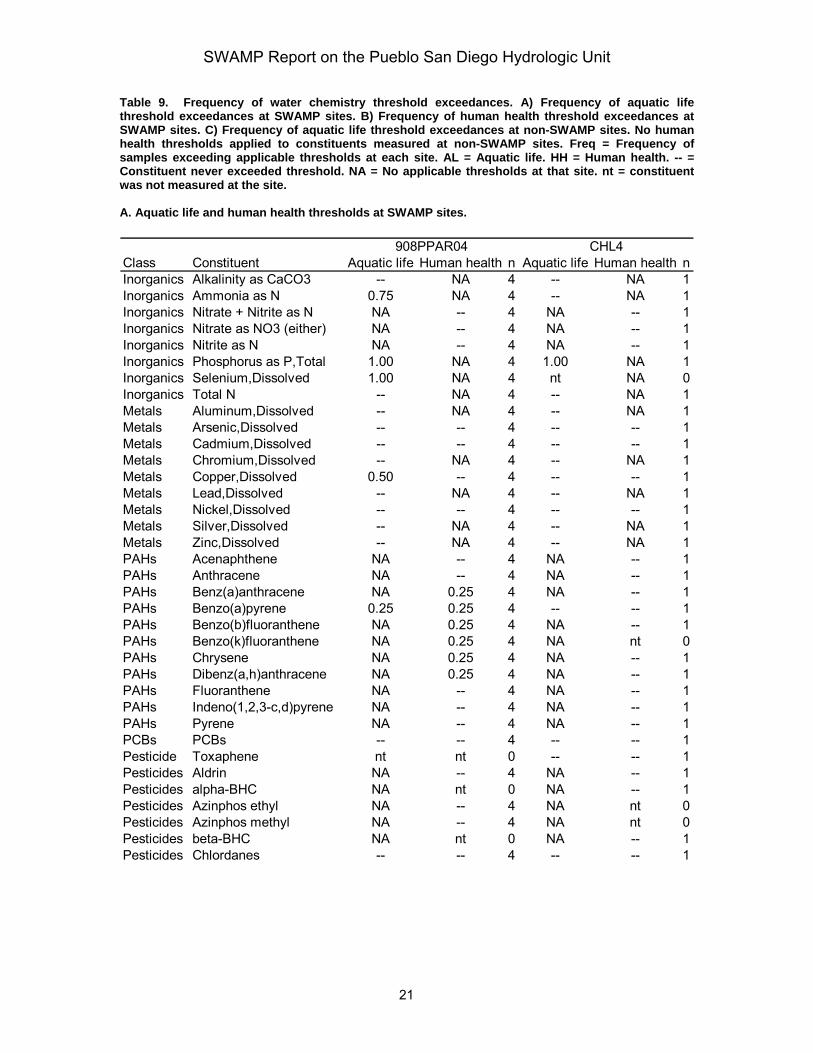
Table 9. Frequency of water chemistry threshold exceedances. A) Frequency of aquatic life threshold exceedances at SWAMP sites. B) Frequency of human health threshold exceedances at SWAMP sites. C) Frequency of aquatic life threshold exceedances at non-SWAMP sites. No human health thresholds applied to constituents measured at non-SWAMP sites. Freq = Frequency of samples exceeding applicable thresholds at each site. AL = Aquatic life. HH = Human health. -- = Constituent never exceeded threshold. NA = No applicable thresholds at that site. nt = constituent was not measured at the site. A. Aquatic life and human health thresholds at SWAMP sites.
908PPAR04 CHL4Class Constituent Aquatic life Human health n Aquatic life Human health nInorganics Alkalinity as CaCO3 -- NA 4 -- NA 1Inorganics Ammonia as N 0.75 NA 4 -- NA 1Inorganics Nitrate + Nitrite as N NA -- 4 NA -- 1Inorganics Nitrate as NO3 (either) NA -- 4 NA -- 1Inorganics Nitrite as N NA -- 4 NA -- 1Inorganics Phosphorus as P,Total 1.00 NA 4 1.00 NA 1Inorganics Selenium,Dissolved 1.00 NA 4 nt NA 0Inorganics Total N -- NA 4 -- NA 1Metals Aluminum,Dissolved -- NA 4 -- NA 1Metals Arsenic,Dissolved -- -- 4 -- -- 1Metals Cadmium,Dissolved -- -- 4 -- -- 1Metals Chromium,Dissolved -- NA 4 -- NA 1Metals Copper,Dissolved 0.50 -- 4 -- -- 1Metals Lead,Dissolved -- NA 4 -- NA 1Metals Nickel,Dissolved -- -- 4 -- -- 1Metals Silver,Dissolved -- NA 4 -- NA 1Metals Zinc,Dissolved -- NA 4 -- NA 1PAHs Acenaphthene NA -- 4 NA -- 1PAHs Anthracene NA -- 4 NA -- 1PAHs Benz(a)anthracene NA 0.25 4 NA -- 1PAHs Benzo(a)pyrene 0.25 0.25 4 -- -- 1PAHs Benzo(b)fluoranthene NA 0.25 4 NA -- 1PAHs Benzo(k)fluoranthene NA 0.25 4 NA nt 0PAHs Chrysene NA 0.25 4 NA -- 1PAHs Dibenz(a,h)anthracene NA 0.25 4 NA -- 1PAHs Fluoranthene NA -- 4 NA -- 1PAHs Indeno(1,2,3-c,d)pyrene NA -- 4 NA -- 1PAHs Pyrene NA -- 4 NA -- 1PCBs PCBs -- -- 4 -- -- 1Pesticide Toxaphene nt nt 0 -- -- 1Pesticides Aldrin NA -- 4 NA -- 1Pesticides alpha-BHC NA nt 0 NA -- 1Pesticides Azinphos ethyl NA -- 4 NA nt 0Pesticides Azinphos methyl NA -- 4 NA nt 0Pesticides beta-BHC NA nt 0 NA -- 1Pesticides Chlordanes -- -- 4 -- -- 1
21
SWAMP Report on the Pueblo San Diego Hydrologic Unit
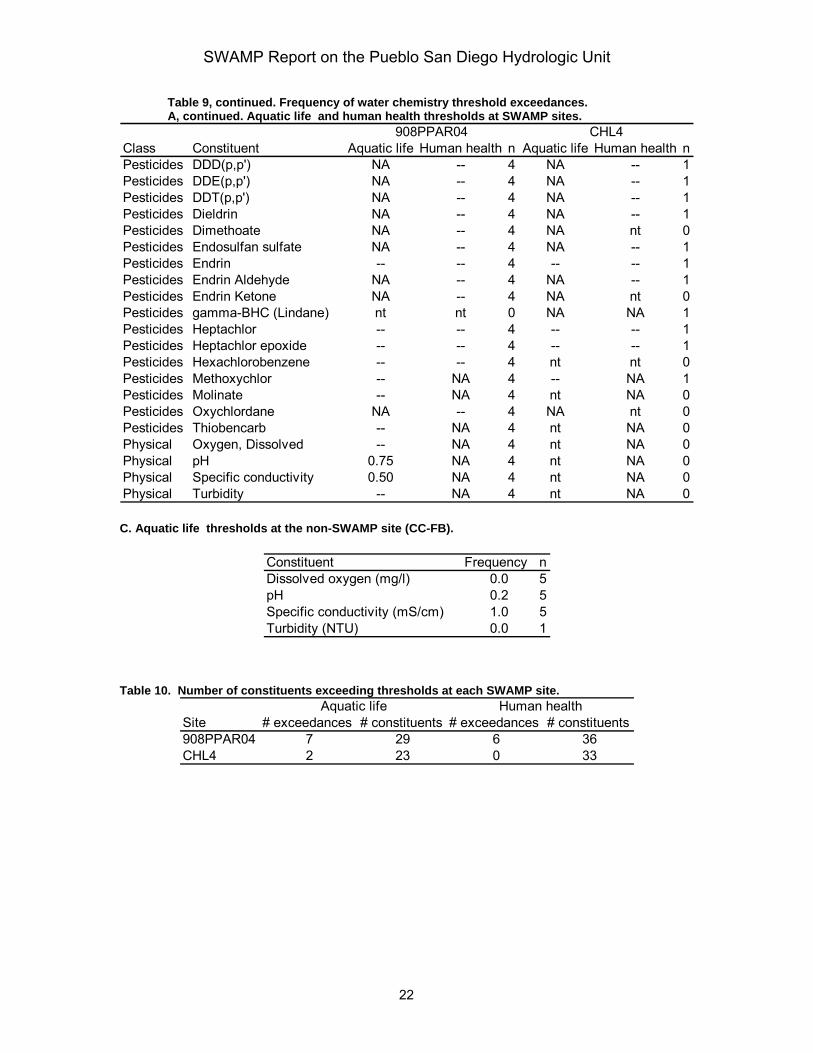
Table 9, continued. Frequency of water chemistry threshold exceedances. A, continued. Aquatic life and human health thresholds at SWAMP sites.
908PPAR04 CHL4Class Constituent Aquatic life Human health n Aquatic life Human health nPesticides DDD(p,p') NA -- 4 NA -- 1Pesticides DDE(p,p') NA -- 4 NA -- 1Pesticides DDT(p,p') NA -- 4 NA -- 1Pesticides Dieldrin NA -- 4 NA -- 1Pesticides Dimethoate NA -- 4 NA nt 0Pesticides Endosulfan sulfate NA -- 4 NA -- 1Pesticides Endrin -- -- 4 -- -- 1Pesticides Endrin Aldehyde NA -- 4 NA -- 1Pesticides Endrin Ketone NA -- 4 NA nt 0Pesticides gamma-BHC (Lindane) nt nt 0 NA NA 1Pesticides Heptachlor -- -- 4 -- -- 1Pesticides Heptachlor epoxide -- -- 4 -- -- 1Pesticides Hexachlorobenzene -- -- 4 nt nt 0Pesticides Methoxychlor -- NA 4 -- NA 1Pesticides Molinate -- NA 4 nt NA 0Pesticides Oxychlordane NA -- 4 NA nt 0Pesticides Thiobencarb -- NA 4 nt NA 0Physical Oxygen, Dissolved -- NA 4 nt NA 0Physical pH 0.75 NA 4 nt NA 0Physical Specific conductivity 0.50 NA 4 nt NA 0Physical Turbidity -- NA 4 nt NA 0 C. Aquatic life thresholds at the non-SWAMP site (CC-FB).
Constituent Frequency nDissolved oxygen (mg/l) 0.0 5pH 0.2 5Specific conductivity (mS/cm) 1.0 5Turbidity (NTU) 0.0 1
Table 10. Number of constituents exceeding thresholds at each SWAMP site.
Aquatic life Human healthSite # exceedances # constituents # exceedances # constituents908PPAR04 7 29 6 36CHL4 2 23 0 33
22
SWAMP Report on the Pueblo San Diego Hydrologic Unit
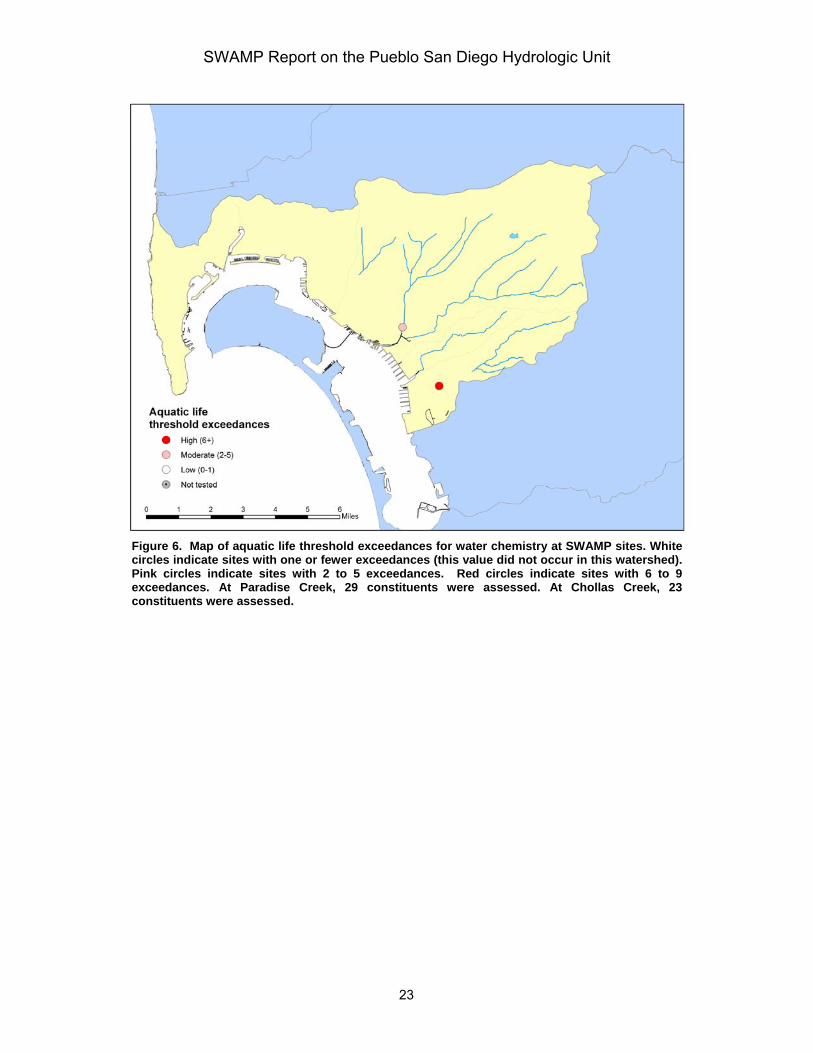
Figure 6. Map of aquatic life threshold exceedances for water chemistry at SWAMP sites. White circles indicate sites with one or fewer exceedances (this value did not occur in this watershed). Pink circles indicate sites with 2 to 5 exceedances. Red circles indicate sites with 6 to 9 exceedances. At Paradise Creek, 29 constituents were assessed. At Chollas Creek, 23 constituents were assessed.
23
SWAMP Report on the Pueblo San Diego Hydrologic Unit
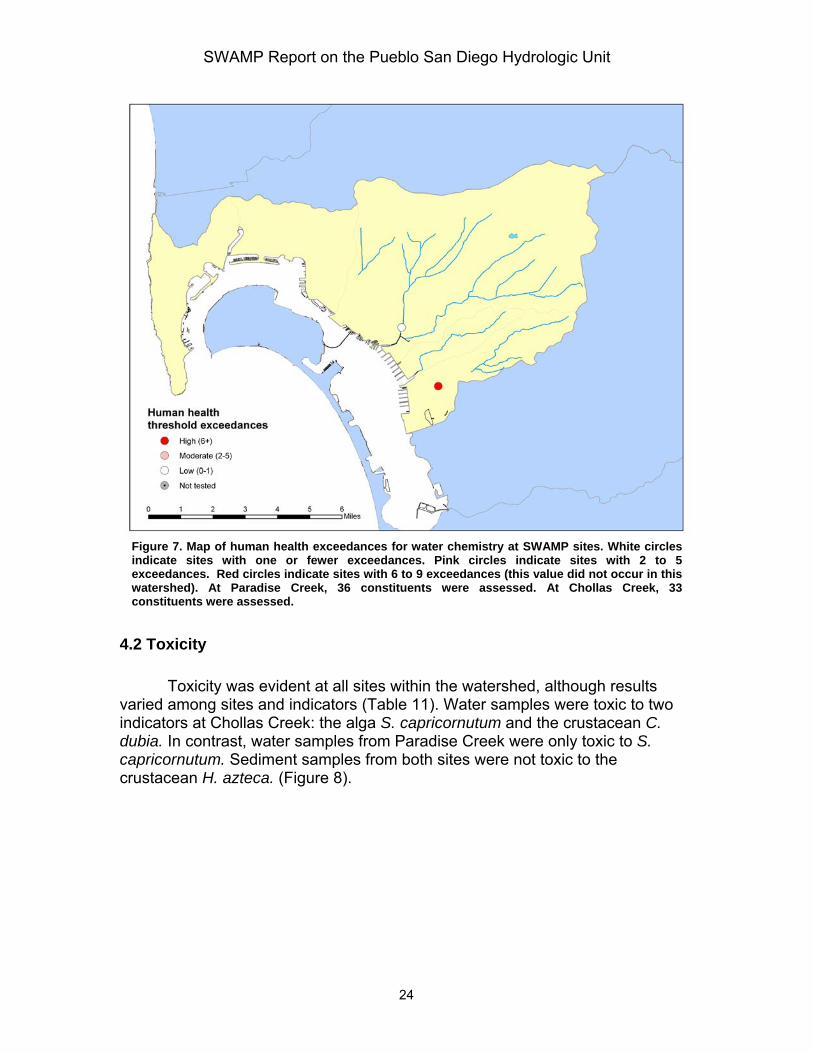
Figure 7. Map of human health exceedances for water chemistry at SWAMP sites. White circles indicate sites with one or fewer exceedances. Pink circles indicate sites with 2 to 5 exceedances. Red circles indicate sites with 6 to 9 exceedances (this value did not occur in this watershed). At Paradise Creek, 36 constituents were assessed. At Chollas Creek, 33 constituents were assessed.
4.2 Toxicity
Toxicity was evident at all sites within the watershed, although results varied among sites and indicators (Table 11). Water samples were toxic to two indicators at Chollas Creek: the alga S. capricornutum and the crustacean C. dubia. In contrast, water samples from Paradise Creek were only toxic to S. capricornutum. Sediment samples from both sites were not toxic to the crustacean H. azteca. (Figure 8).
24
SWAMP Report on the Pueblo San Diego Hydrologic Unit
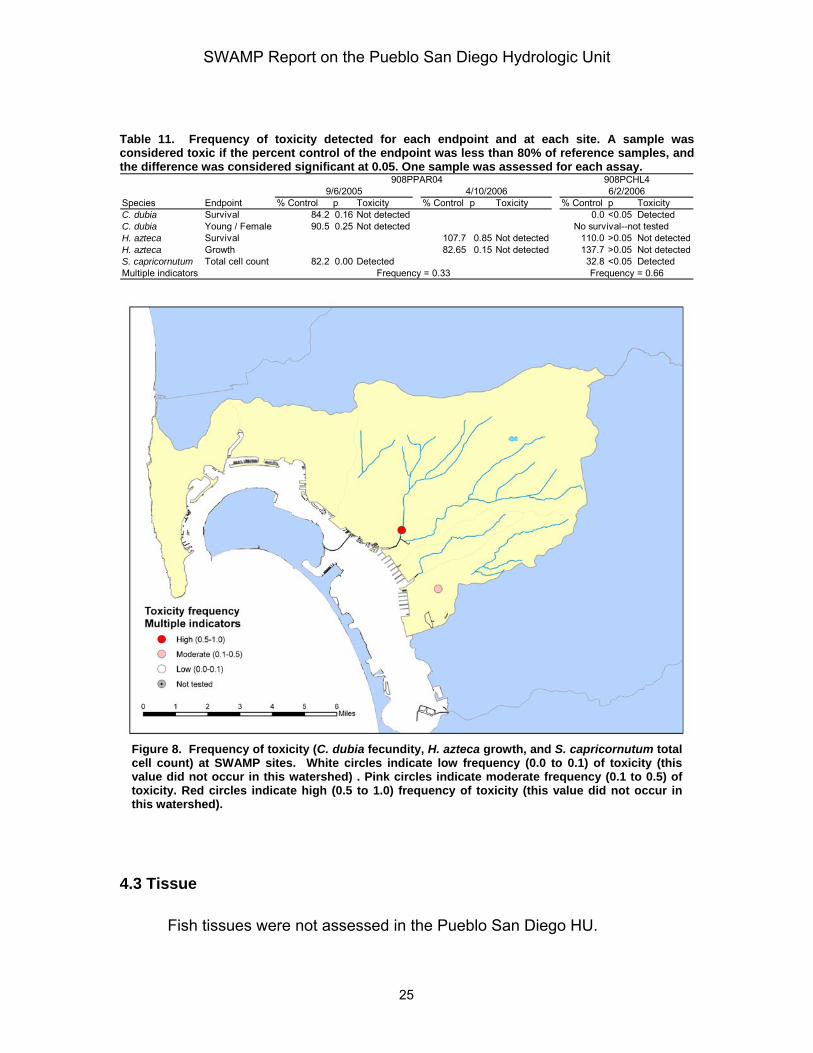
Table 11. Frequency of toxicity detected for each endpoint and at each site. A sample was considered toxic if the percent control of the endpoint was less than 80% of reference samples, and the difference was considered significant at 0.05. One sample was assessed for each assay.
908PPAR04 908PCHL49/6/2005 4/10/2006 6/2/2006
Species Endpoint % Control p Toxicity % Control p Toxicity % Control p ToxicityC. dubia Survival 84.2 0.16 Not detected 0.0 <0.05 DetectedC. dubia Young / Female 90.5 0.25 Not detected No survival--not testedH. azteca Survival 107.7 0.85 Not detected 110.0 >0.05 Not detectedH. azteca Growth 82.65 0.15 Not detected 137.7 >0.05 Not detectedS. capricornutum Total cell count 82.2 0.00 Detected 32.8 <0.05 DetectedMultiple indicators Frequency = 0.33 Frequency = 0.66
Figure 8. Frequency of toxicity (C. dubia fecundity, H. azteca growth, and S. capricornutum total cell count) at SWAMP sites. White circles indicate low frequency (0.0 to 0.1) of toxicity (this value did not occur in this watershed) . Pink circles indicate moderate frequency (0.1 to 0.5) of toxicity. Red circles indicate high (0.5 to 1.0) frequency of toxicity (this value did not occur in this watershed).
4.3 Tissue
Fish tissues were not assessed in the Pueblo San Diego HU.
25
SWAMP Report on the Pueblo San Diego Hydrologic Unit
4.4 Bioassessment
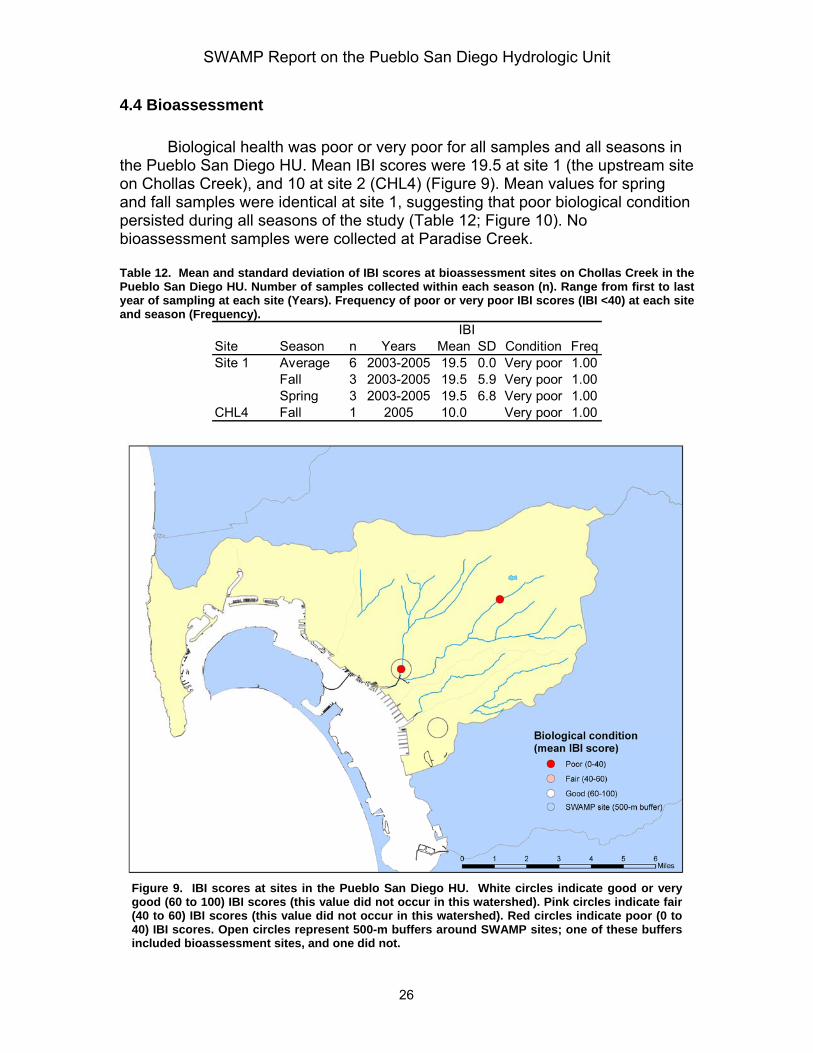
Biological health was poor or very poor for all samples and all seasons in the Pueblo San Diego HU. Mean IBI scores were 19.5 at site 1 (the upstream site on Chollas Creek), and 10 at site 2 (CHL4) (Figure 9). Mean values for spring and fall samples were identical at site 1, suggesting that poor biological condition persisted during all seasons of the study (Table 12; Figure 10). No bioassessment samples were collected at Paradise Creek.
Table 12. Mean and standard deviation of IBI scores at bioassessment sites on Chollas Creek in the Pueblo San Diego HU. Number of samples collected within each season (n). Range from first to last year of sampling at each site (Years). Frequency of poor or very poor IBI scores (IBI <40) at each site and season (Frequency).
IBISite Season n Years Mean SD Condition FreqSite 1 Average 6 2003-2005 19.5 0.0 Very poor 1.00
Fall 3 2003-2005 19.5 5.9 Very poor 1.00Spring 3 2003-2005 19.5 6.8 Very poor 1.00
CHL4 Fall 1 2005 10.0 Very poor 1.00
Figure 9. IBI scores at sites in the Pueblo San Diego HU. White circles indicate good or very good (60 to 100) IBI scores (this value did not occur in this watershed). Pink circles indicate fair (40 to 60) IBI scores (this value did not occur in this watershed). Red circles indicate poor (0 to 40) IBI scores. Open circles represent 500-m buffers around SWAMP sites; one of these buffers included bioassessment sites, and one did not.
26
SWAMP Report on the Pueblo San Diego Hydrologic Unit
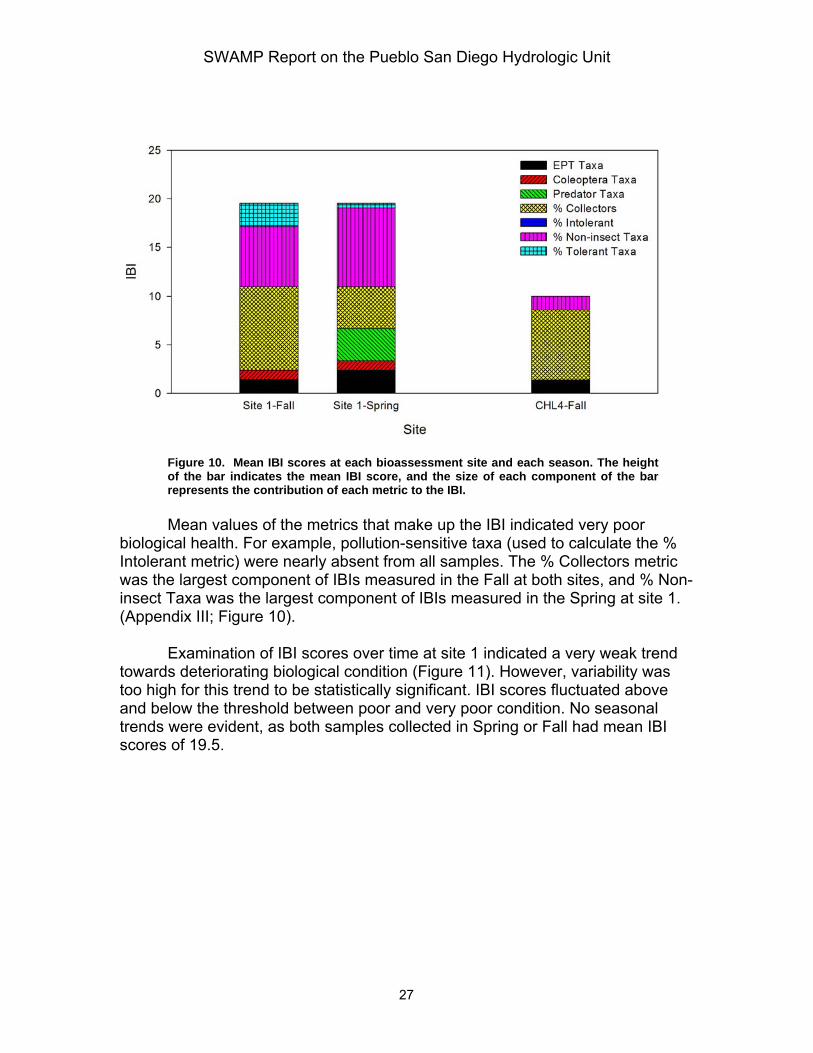
Figure 10. Mean IBI scores at each bioassessment site and each season. The height of the bar indicates the mean IBI score, and the size of each component of the bar represents the contribution of each metric to the IBI. Mean values of the metrics that make up the IBI indicated very poor
biological health. For example, pollution-sensitive taxa (used to calculate the % Intolerant metric) were nearly absent from all samples. The % Collectors metric was the largest component of IBIs measured in the Fall at both sites, and % Non-insect Taxa was the largest component of IBIs measured in the Spring at site 1. (Appendix III; Figure 10).
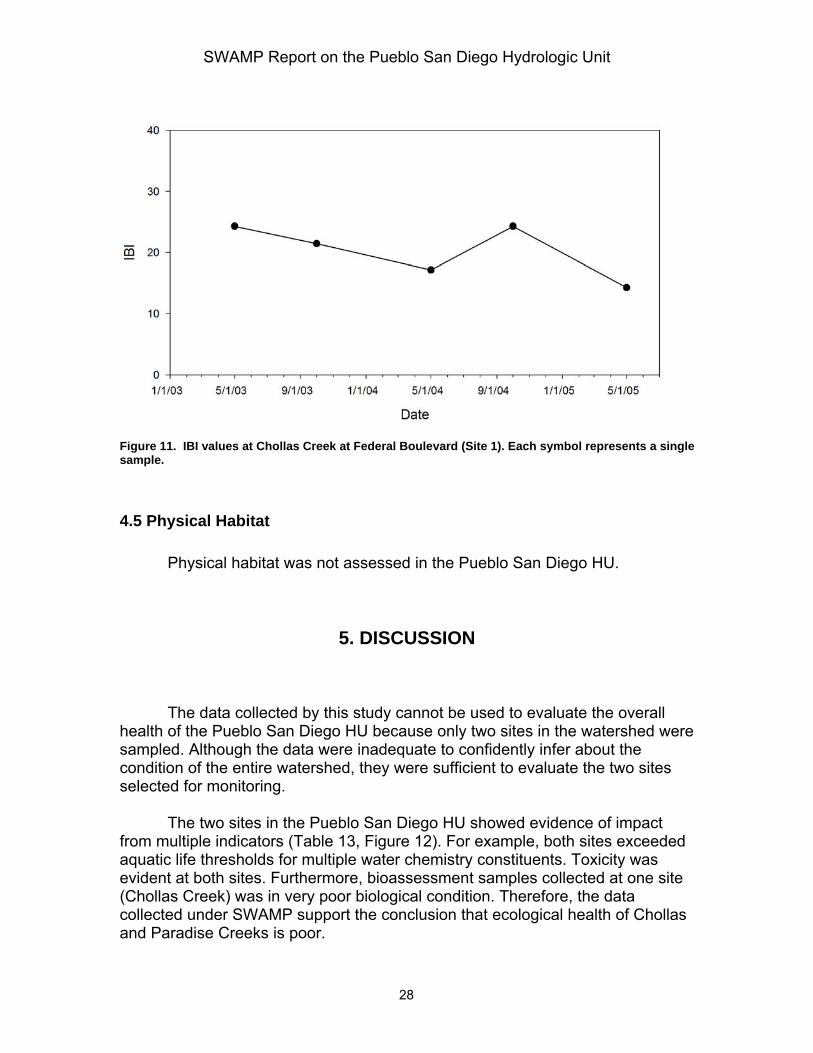
Examination of IBI scores over time at site 1 indicated a very weak trend
towards deteriorating biological condition (Figure 11). However, variability was too high for this trend to be statistically significant. IBI scores fluctuated above and below the threshold between poor and very poor condition. No seasonal trends were evident, as both samples collected in Spring or Fall had mean IBI scores of 19.5.
27
SWAMP Report on the Pueblo San Diego Hydrologic Unit
Figure 11. IBI values at Chollas Creek at Federal Boulevard (Site 1). Each symbol represents a single sample.
4.5 Physical Habitat
Physical habitat was not assessed in the Pueblo San Diego HU.
5. DISCUSSION The data collected by this study cannot be used to evaluate the overall
health of the Pueblo San Diego HU because only two sites in the watershed were sampled. Although the data were inadequate to confidently infer about the condition of the entire watershed, they were sufficient to evaluate the two sites selected for monitoring.
The two sites in the Pueblo San Diego HU showed evidence of impact
from multiple indicators (Table 13, Figure 12). For example, both sites exceeded aquatic life thresholds for multiple water chemistry constituents. Toxicity was evident at both sites. Furthermore, bioassessment samples collected at one site (Chollas Creek) was in very poor biological condition. Therefore, the data collected under SWAMP support the conclusion that ecological health of Chollas and Paradise Creeks is poor.
28
SWAMP Report on the Pueblo San Diego Hydrologic Unit
Different indicators suggested different levels of impairment at the two creeks. For example, toxicity was more severe at Chollas Creek (toxicity to two indicator species) than at Paradise Creek (toxicity to one indicator species). However, more water chemistry constituents exceeded aquatic life thresholds at Paradise Creek (2) than at Chollas Creek. This discrepancy may be explained by the fact that fewer constituents were assessed at Chollas Creek (24 versus 30 at Paradise Creek), and water chemistry was assessed only once at Chollas Creek, versus four times at Paradise Creek. These differences may have caused the underestimation of water chemistry impacts at Chollas Creek. These differences, plus the fact that bioassessment samples were not collected at Paradise Creek, impede comparisons of the two sites.
Despite the fact that Chollas Creek is included on the 303(d) list of
impaired waterbodies for lead, copper, and zinc, these constituents were not found in excess of the thresholds established by the TMDL. However, all SWAMP monitoring occurred during dry weather, and the peak concentrations of these constituents could not be estimated. Monitoring by NPDES permittees in wet weather showed that these metals regularly exceeded TMDL thresholds in Chollas Creek (Woodward-Clyde 1998).
This study’s assessment of the Pueblo San Diego HU suggests that the two sites in the watershed were in poor ecological health. Multiple lines of evidence support this conclusion. For example, several water chemistry constituents exceeded aquatic life thresholds, toxicity was observed at both sites, and bioassessment of macroinvertebrate communities were in poor or very poor condition at every sampling event.
Although these impacts were in some cases severe, this study showed
that, at least for water chemistry indicators, impacts were limited to certain constituents, such as nutrients and physical parameters. In contrast, all metals were below applicable thresholds at both sites, as were all pesticides. However, no water qualities were collected immediately after storm events, and peak concentrations of these constituents may have been inderestimated.
Despite the strength of the evidence, limitations of this study affect the
assessment. These limitations include difficulties integrating data from SWAMP and non-SWAMP sources, the non-randomization of sample sites, small sample size, and the lack of applicable thresholds for several indicators. Although these limitations require that results be interpreted with caution, it is unlikely that they would alter the fundamental finding that these sites in the Pueblo San Diego watershed are in poor health, as explained at the end of this section.
The geographical approach to integrating SWAMP and non-SWAMP data
relies on assumptions about the spatial and temporal variability of the variables measured by these programs. For example, bioassessment data may have been collected up to 500 meters away and up to 2 years before water chemistry and
29
SWAMP Report on the Pueblo San Diego Hydrologic Unit
toxicity data were collected. This study assumes that anthropogenic impacts do not change across these distances or over these spans of time. There is little published research on either of these assumptions, although there may be greater support for the assumptions about spatial variability (e.g., Gebler 2004) than for temporal variability (e.g., Sandin and Johnson 2000, Bêche et al. 2006).In this study, bioassessment data were observed to be highly variable, and the use of data collected before water chemistry data is questionable.
The targeted selection of sites monitored under the SWAMP program
facilitated integration of pre-existing data from non-SWAMP sources, but this non-probabilistic approach severely limits the extrapolation of data from these sites to the rest of the watershed. Non-random sampling violates assumptions underlying most statistical analyses, and the sites selected in this study cannot be assumed to represent the entire watershed (Olsen et al. 1999, Stevens Jr. and Olsen 2004).
The small number of sites monitored under SWAMP also limits the
certainty of this study’s assessment. The low level of replication (i.e., 2) of sites in the Pueblo San Diego HU severely limits the ability to infer about the condition about the watershed as a whole. Although SWAMP has produced a wealth of data about the Pueblo San Diego HU using limited resources, some indicators (especially those with high variability) require more extensive sampling to produce more precise and accurate assessments. A larger number of sites will be necessary to evaluate the health of the Pueblo San Diego HU with greater certainty.
Thresholds are an essential tool for assessing water quality and ecological
health. However, their use is limited to indicators that have been well studied, and they cannot provide a holistic view of watershed health. This limitation is exacerbated by the fact that many constituents and indicators lack applicable thresholds. For example, of the 165 water chemistry constituents, only 59 (36%) had applicable water quality objectives that could be used as thresholds for water quality. Furthermore, thresholds applied to IBI scores and toxicity were based on statistical distributions and professional judgment (respectively), rather than on risks to ecological health. For example, the 80% threshold used to identify toxic samples is based on the assumption that this level is ecologically meaningful, although this assumption has not been verified in the field. The development of biocriteria to establish meaningful thresholds for bioassessment is subject of active interest in California (Bernstein and Schiff 2002).
Despite these limitations, the data gathered under SWAMP and other
programs strongly support the conclusion that the Pueblo San Diego HU is in poor ecological health. Some of these limitations (such as the lack of applicable thresholds and the small sample size) may in fact have caused this assessment to underestimate the severity of degradation in the watershed. All indicators showed signs of human impacts. Multiple stressors, including degraded water
30
SWAMP Report on the Pueblo San Diego Hydrologic Unit
quality, sediment, and physical habitat are the likely cause of the impact. Future research (see final report on the SWAMP monitoring program for further study recommendations) is necessary to determine which stressors are responsible for the impacts seen in the watershed.
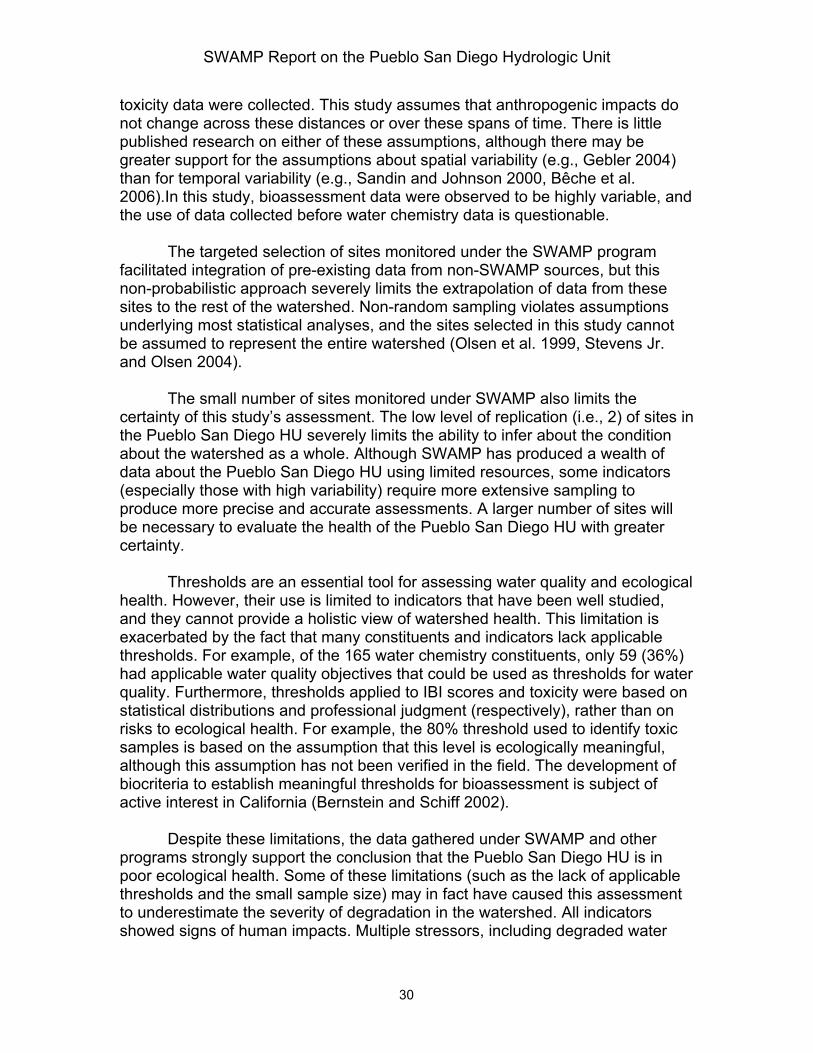
Table 13. Summary of the ecological health for five SWAMP sites in Pueblo San Diego HU. Aquatic life (AL). Human health (HH). Toxicity frequency is frequency of toxicity for three chronic toxicity endpoints: C. dubia (fecundity), H. azteca (growth), and S. capricornutum (total cell count). Biology frequency is the frequency of IBIs below 40. n.t. = Indicator not tested.
Paradise Creek 4 Chollas Creek 4
Indicator Measurement 908PPAR04 CHL4Water chemistry Aquatic life exceedances 7 2
Human health exceedances 6 0Fish tissue OEHHA exceedances n.t. n.t.Toxicity Frequency 0.33 0.66Biology Frequency n.t. 1.00Physical habitat Mean score n.t. n.t.
31
SWAMP Report on the Pueblo San Diego Hydrologic Unit
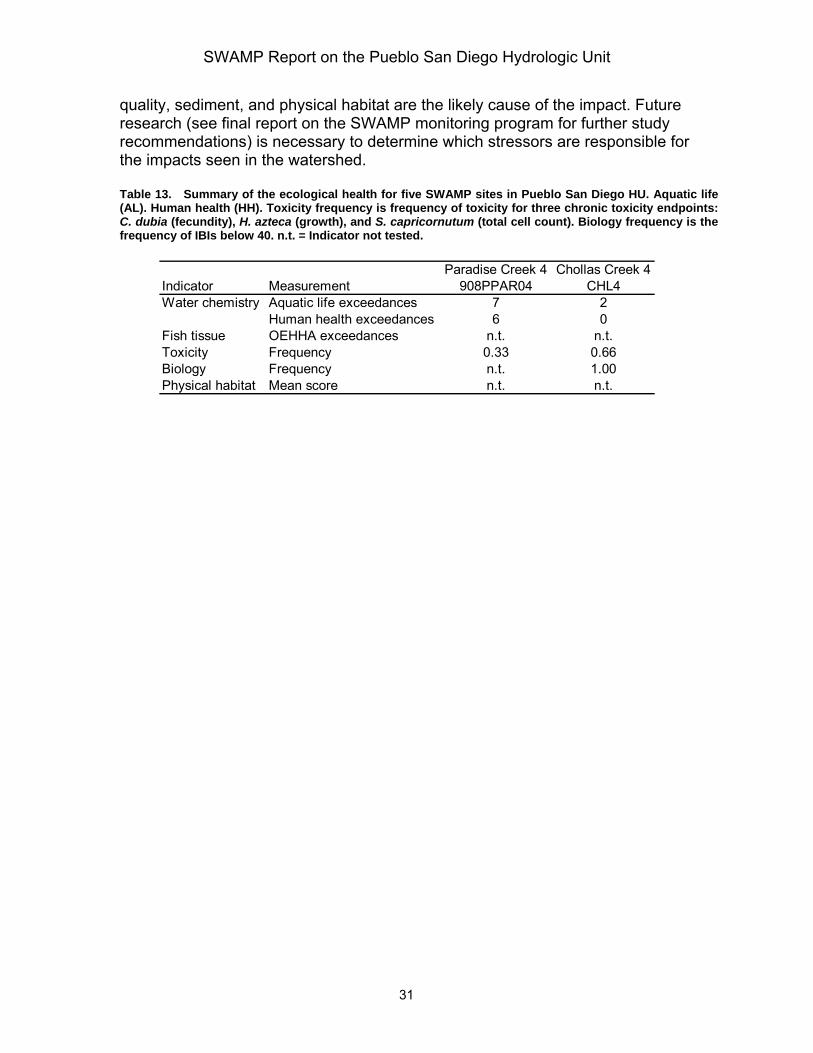
Figure 12. Summary of the ecological health of SWAMP sites in the Pueblo San Diego HU, as determined by water chemistry, toxicity, and bioassessment indicators. Each pie slice corresponds to a specific indicator, as described in the inset, with darker colors corresponding to more degraded conditions (unmeasured indicators are shown in cross-hatched gray). The top-left slice corresponds to the number of water chemistry constituents exceeding aquatic life thresholds. The bottom slice corresponds to the frequency of toxicity among three endpoints: C. dubia (fecundity), H. azteca (growth), and S. capricornutum (total cell count). The top-right slice corresponds to the IBI of bioassessment samples.
32
SWAMP Report on the Pueblo San Diego Hydrologic Unit
6. LITERATURE CITED Bêche, L.A., E.P. McElravy and V.H. Resh. 2005. Long-term seasonal variation in the biological traits of benthic-macroinvertebrates in two Mediterranean climate streams in California, USA. Freshwater Biology 51:56-75. Bernstien, B. and Schiff, K. 2002. Stormwater research needs in Southern California. Technical Report 358. Southern California Coastal Water Research Project. Westminster, CA. California Code of Regulations. 2007. Barclay’s Official California Code of Regulations. Title 22. Social Security Division 4. Environmental Health Chapter 15. Domestic Water Quality and Monitoring Regulations Article 16. Secondary Drinking Water Standards. §64449. California Department of Fish and Game. 2003. California Stream Bioassessment Procedure: Protocol for Biological and Physical/Habitat Assessment in Wadeable Streams. Available from www.dfg.ca.gov/cabw/cabwhome.html. California Department of Water Resources. 2007. http://www.water.ca.gov/. Environmental Protection Agency (EPA). 1993. Methods for measuring acute toxicity of effluents and receiving waters to freshwater and marine organisms, Fourth Edition. EPA 600/4-90/027. US Environmental Protection Agency, Environmental Research Laboratory. Duluth, MN. Environmental Protection Agency (EPA). 1997. Water quality standards: Establishment of numeric criteria for priority toxic pollutants for the state of California: Proposed Rule. Federal Register 62:42159-42208. Environmental Protection Agency (EPA). 2002. National recommended water quality criteria. EPA-822-R-02-047. Environmental Protection Agency Office of Water. Washington, DC. Environmental Protection Agency (EPA). 2007. Integrated Risk Information System. http://www.epa.gov/iris/index.html. Office of Research and Development. Washington, DC. Gebler, J.B. 2004. Mesoscale spatial variability of selected aquatic invertebrate community metrics from a minimally impaired stream segment. Journal of the North American Benthological Society 23:616-633. National Academy of Sciences. 1977. Drinking Water and Health. Volume 1. Washington, DC.
33
SWAMP Report on the Pueblo San Diego Hydrologic Unit
National Oceanic and Atmospheric Administration. 2007. National Weather Service data. Available from http://www.wrh.noaa.gov/sgx/obs/rtp/rtpmap.php?wfo=sgx Ode, P.R., A.C. Rehn and J.T. May. 2005. A quantitative tool for assessing the integrity of southern California coastal streams. Environmental Management 35:493-504. Olsen, A.R., J. Sedransk, D. Edwards, C.A. Gotway, W. Liggett, S. Rathburn, K.H. Reckhow and L.J. Young. 1999. Statistical issues for monitoring ecological and natural resources in the United States. Environmental Management and Assessment 54:1-45. Puckett, M. 2002. Quality Assurance Management Plan for the State of California's Surface Water Ambient Monitoring Program: Version 2. California Department of Fish and Game, Monterey, CA. Prepared for the State Water Resources Control Board. Sacramento, CA. California Regional Water Quality Control Board, San Diego Region. 1994. Water quality control plan for the San Diego Region. San Diego, CA. http://www.waterboards.ca.gov/sandiego/programs/basinplan.html SANDAG. 1998. Watersheds of the San Diego Region. SANDAG INFO. Sandin, L. and R.K. Johnson. 2000. The statistical power of selected indicator metrics using macroinvertebrates for assessing acidification and eutrophication of running waters. Hydrobiologia 422/423:233-243. Stevans, Jr., D.L. and A.R. Olsen. 2004. Spatially balanced sampling of natural resources. Journal of the American Statistical Association: Theory and Methods 99:262-278. Weston Solutions, Inc. 2007. San Diego County Municipal Copermittees 2005-2006 Urban Runoff Monitoring. Final Report. County of San Diego. San Diego, CA. Available at http://www.projectcleanwater.org/html/wg_monitoring_05-06report.html. Woodward-Clyde. 1998. 1997-1998 City of San Diego and Co-Permittees NPDES Stormwater Monitoring Program Report. Prepared for the City of San Diego, Engineering & Development Department. San Diego, CA.
34
SWAMP Report on the Pueblo San Diego Hydrologic Unit
35
7. APPENDICES
SWAMP Report on the Pueblo San Diego Hydrologic Unit
APPENDIX I
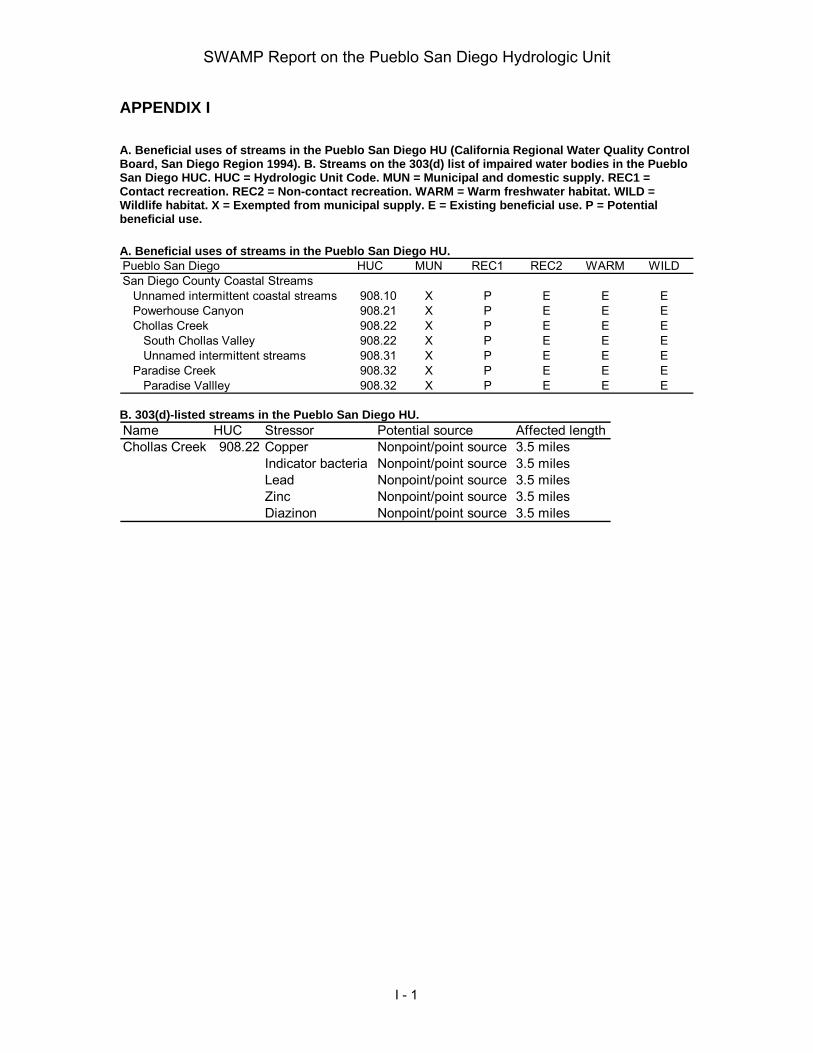
A. Beneficial uses of streams in the Pueblo San Diego HU (California Regional Water Quality Control Board, San Diego Region 1994). B. Streams on the 303(d) list of impaired water bodies in the Pueblo San Diego HUC. HUC = Hydrologic Unit Code. MUN = Municipal and domestic supply. REC1 = Contact recreation. REC2 = Non-contact recreation. WARM = Warm freshwater habitat. WILD = Wildlife habitat. X = Exempted from municipal supply. E = Existing beneficial use. P = Potential beneficial use. A. Beneficial uses of streams in the Pueblo San Diego HU. Pueblo San Diego HUC MUN REC1 REC2 WARM WILDSan Diego County Coastal Streams Unnamed intermittent coastal streams 908.10 X P E E E
Powerhouse Canyon 908.21 X P E E EChollas Creek 908.22 X P E E E South Chollas Valley 908.22 X P E E E
Unnamed intermittent streams 908.31 X P E E EParadise Creek 908.32 X P E E E
Paradise Vallley 908.32 X P E E E B. 303(d)-listed streams in the Pueblo San Diego HU. Name HUC Stressor Potential source Affected lengthChollas Creek 908.22 Copper Nonpoint/point source 3.5 miles
Indicator bacteria Nonpoint/point source 3.5 milesLead Nonpoint/point source 3.5 milesZinc Nonpoint/point source 3.5 milesDiazinon Nonpoint/point source 3.5 miles
I - 1
SWAMP Report on the Pueblo San Diego Hydrologic Unit
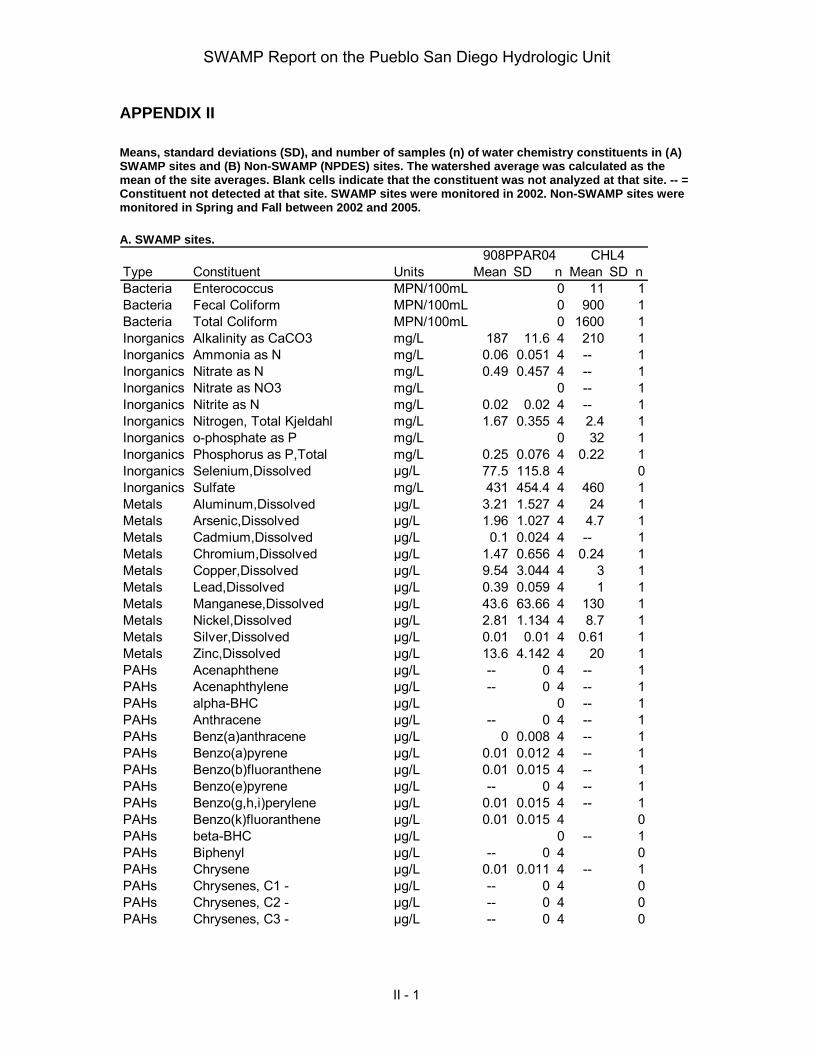
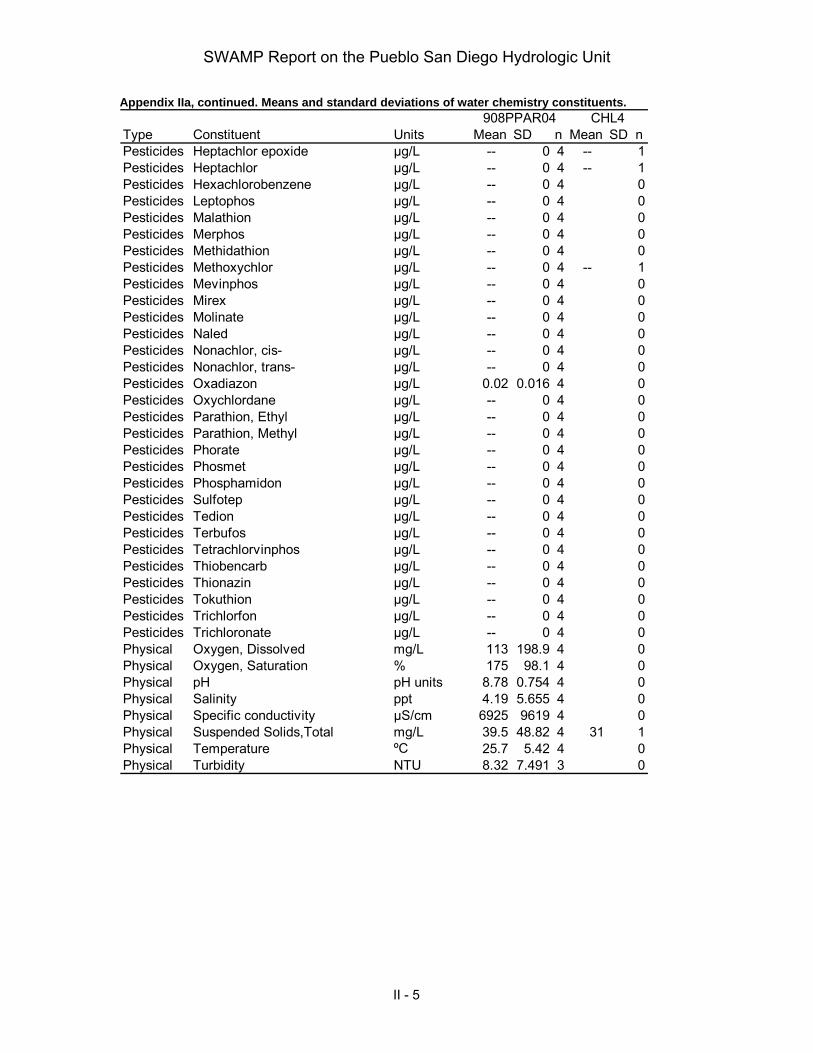
APPENDIX II Means, standard deviations (SD), and number of samples (n) of water chemistry constituents in (A) SWAMP sites and (B) Non-SWAMP (NPDES) sites. The watershed average was calculated as the mean of the site averages. Blank cells indicate that the constituent was not analyzed at that site. -- = Constituent not detected at that site. SWAMP sites were monitored in 2002. Non-SWAMP sites were monitored in Spring and Fall between 2002 and 2005. A. SWAMP sites.
908PPAR04 CHL4Type Constituent Units Mean SD n Mean SD nBacteria Enterococcus MPN/100mL 0 11 1Bacteria Fecal Coliform MPN/100mL 0 900 1Bacteria Total Coliform MPN/100mL 0 1600 1Inorganics Alkalinity as CaCO3 mg/L 187 11.6 4 210 1Inorganics Ammonia as N mg/L 0.06 0.051 4 -- 1Inorganics Nitrate as N mg/L 0.49 0.457 4 -- 1Inorganics Nitrate as NO3 mg/L 0 -- 1Inorganics Nitrite as N mg/L 0.02 0.02 4 -- 1Inorganics Nitrogen, Total Kjeldahl mg/L 1.67 0.355 4 2.4 1Inorganics o-phosphate as P mg/L 0 32 1Inorganics Phosphorus as P,Total mg/L 0.25 0.076 4 0.22 1Inorganics Selenium,Dissolved μg/L 77.5 115.8 4 0Inorganics Sulfate mg/L 431 454.4 4 460 1Metals Aluminum,Dissolved μg/L 3.21 1.527 4 24 1Metals Arsenic,Dissolved μg/L 1.96 1.027 4 4.7 1Metals Cadmium,Dissolved μg/L 0.1 0.024 4 -- 1Metals Chromium,Dissolved μg/L 1.47 0.656 4 0.24 1Metals Copper,Dissolved μg/L 9.54 3.044 4 3 1Metals Lead,Dissolved μg/L 0.39 0.059 4 1 1Metals Manganese,Dissolved μg/L 43.6 63.66 4 130 1Metals Nickel,Dissolved μg/L 2.81 1.134 4 8.7 1Metals Silver,Dissolved μg/L 0.01 0.01 4 0.61 1Metals Zinc,Dissolved μg/L 13.6 4.142 4 20 1PAHs Acenaphthene μg/L -- 0 4 -- 1PAHs Acenaphthylene μg/L -- 0 4 -- 1PAHs alpha-BHC μg/L 0 -- 1PAHs Anthracene μg/L -- 0 4 -- 1PAHs Benz(a)anthracene μg/L 0 0.008 4 -- 1PAHs Benzo(a)pyrene μg/L 0.01 0.012 4 -- 1PAHs Benzo(b)fluoranthene μg/L 0.01 0.015 4 -- 1PAHs Benzo(e)pyrene μg/L -- 0 4 -- 1PAHs Benzo(g,h,i)perylene μg/L 0.01 0.015 4 -- 1PAHs Benzo(k)fluoranthene μg/L 0.01 0.015 4 0PAHs beta-BHC μg/L 0 -- 1PAHs Biphenyl μg/L -- 0 4 0PAHs Chrysene μg/L 0.01 0.011 4 -- 1PAHs Chrysenes, C1 - μg/L -- 0 4 0PAHs Chrysenes, C2 - μg/L -- 0 4 0PAHs Chrysenes, C3 - μg/L -- 0 4 0
II - 1
SWAMP Report on the Pueblo San Diego Hydrologic Unit
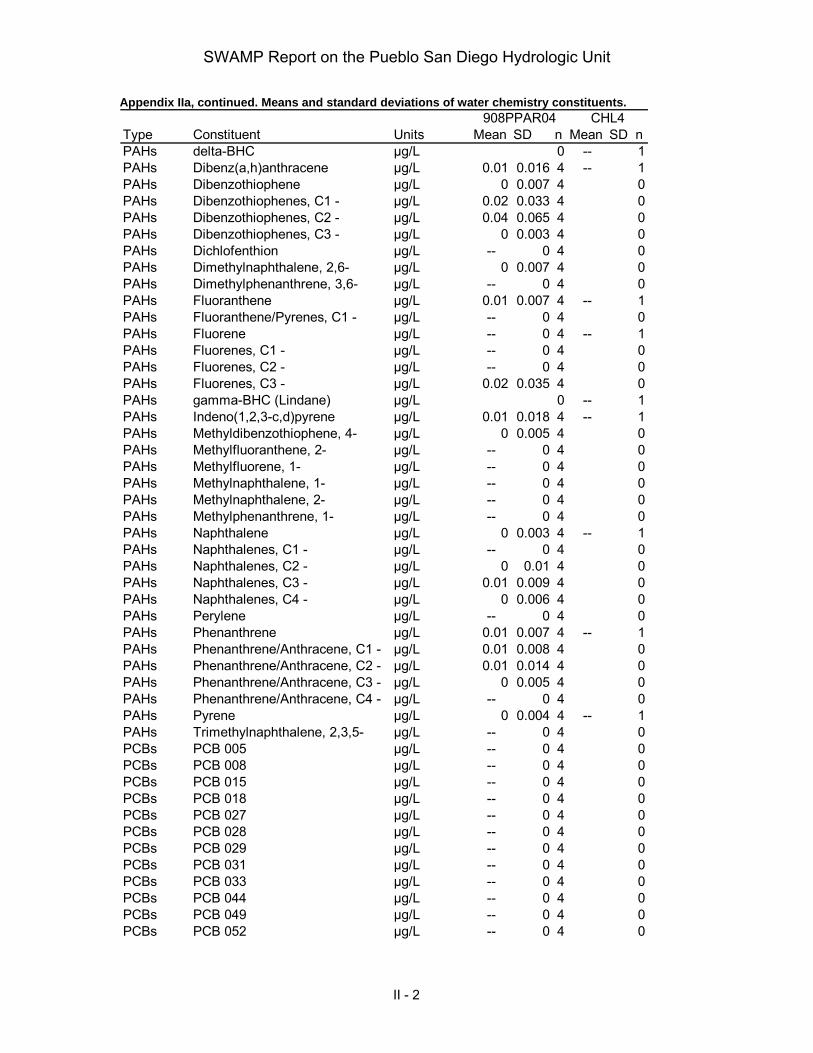
Appendix IIa, continued. Means and standard deviations of water chemistry constituents. 908PPAR04 CHL4
Type Constituent Units Mean SD n Mean SD nPAHs delta-BHC μg/L 0 -- 1PAHs Dibenz(a,h)anthracene μg/L 0.01 0.016 4 -- 1PAHs Dibenzothiophene μg/L 0 0.007 4 0PAHs Dibenzothiophenes, C1 - μg/L 0.02 0.033 4 0PAHs Dibenzothiophenes, C2 - μg/L 0.04 0.065 4 0PAHs Dibenzothiophenes, C3 - μg/L 0 0.003 4 0PAHs Dichlofenthion μg/L -- 0 4 0PAHs Dimethylnaphthalene, 2,6- μg/L 0 0.007 4 0PAHs Dimethylphenanthrene, 3,6- μg/L -- 0 4 0PAHs Fluoranthene μg/L 0.01 0.007 4 -- 1PAHs Fluoranthene/Pyrenes, C1 - μg/L -- 0 4 0PAHs Fluorene μg/L -- 0 4 -- 1PAHs Fluorenes, C1 - μg/L -- 0 4 0PAHs Fluorenes, C2 - μg/L -- 0 4 0PAHs Fluorenes, C3 - μg/L 0.02 0.035 4 0PAHs gamma-BHC (Lindane) μg/L 0 -- 1PAHs Indeno(1,2,3-c,d)pyrene μg/L 0.01 0.018 4 -- 1PAHs Methyldibenzothiophene, 4- μg/L 0 0.005 4 0PAHs Methylfluoranthene, 2- μg/L -- 0 4 0PAHs Methylfluorene, 1- μg/L -- 0 4 0PAHs Methylnaphthalene, 1- μg/L -- 0 4 0PAHs Methylnaphthalene, 2- μg/L -- 0 4 0PAHs Methylphenanthrene, 1- μg/L -- 0 4 0PAHs Naphthalene μg/L 0 0.003 4 -- 1PAHs Naphthalenes, C1 - μg/L -- 0 4 0PAHs Naphthalenes, C2 - μg/L 0 0.01 4 0PAHs Naphthalenes, C3 - μg/L 0.01 0.009 4 0PAHs Naphthalenes, C4 - μg/L 0 0.006 4 0PAHs Perylene μg/L -- 0 4 0PAHs Phenanthrene μg/L 0.01 0.007 4 -- 1PAHs Phenanthrene/Anthracene, C1 - μg/L 0.01 0.008 4 0PAHs Phenanthrene/Anthracene, C2 - μg/L 0.01 0.014 4 0PAHs Phenanthrene/Anthracene, C3 - μg/L 0 0.005 4 0PAHs Phenanthrene/Anthracene, C4 - μg/L -- 0 4 0PAHs Pyrene μg/L 0 0.004 4 -- 1PAHs Trimethylnaphthalene, 2,3,5- μg/L -- 0 4 0PCBs PCB 005 μg/L -- 0 4 0PCBs PCB 008 μg/L -- 0 4 0PCBs PCB 015 μg/L -- 0 4 0PCBs PCB 018 μg/L -- 0 4 0PCBs PCB 027 μg/L -- 0 4 0PCBs PCB 028 μg/L -- 0 4 0PCBs PCB 029 μg/L -- 0 4 0PCBs PCB 031 μg/L -- 0 4 0PCBs PCB 033 μg/L -- 0 4 0PCBs PCB 044 μg/L -- 0 4 0PCBs PCB 049 μg/L -- 0 4 0PCBs PCB 052 μg/L -- 0 4 0
II - 2
SWAMP Report on the Pueblo San Diego Hydrologic Unit
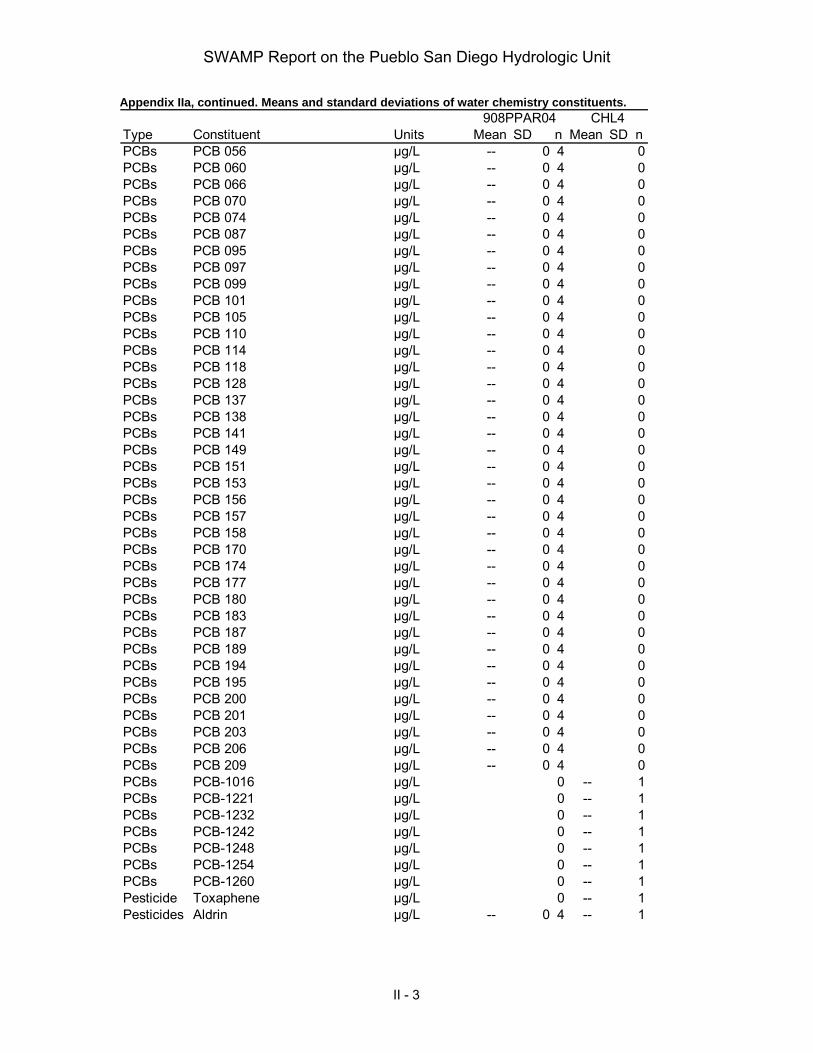
Appendix IIa, continued. Means and standard deviations of water chemistry constituents. 908PPAR04 CHL4
Type Constituent Units Mean SD n Mean SD nPCBs PCB 056 μg/L -- 0 4 0PCBs PCB 060 μg/L -- 0 4 0PCBs PCB 066 μg/L -- 0 4 0PCBs PCB 070 μg/L -- 0 4 0PCBs PCB 074 μg/L -- 0 4 0PCBs PCB 087 μg/L -- 0 4 0PCBs PCB 095 μg/L -- 0 4 0PCBs PCB 097 μg/L -- 0 4 0PCBs PCB 099 μg/L -- 0 4 0PCBs PCB 101 μg/L -- 0 4 0PCBs PCB 105 μg/L -- 0 4 0PCBs PCB 110 μg/L -- 0 4 0PCBs PCB 114 μg/L -- 0 4 0PCBs PCB 118 μg/L -- 0 4 0PCBs PCB 128 μg/L -- 0 4 0PCBs PCB 137 μg/L -- 0 4 0PCBs PCB 138 μg/L -- 0 4 0PCBs PCB 141 μg/L -- 0 4 0PCBs PCB 149 μg/L -- 0 4 0PCBs PCB 151 μg/L -- 0 4 0PCBs PCB 153 μg/L -- 0 4 0PCBs PCB 156 μg/L -- 0 4 0PCBs PCB 157 μg/L -- 0 4 0PCBs PCB 158 μg/L -- 0 4 0PCBs PCB 170 μg/L -- 0 4 0PCBs PCB 174 μg/L -- 0 4 0PCBs PCB 177 μg/L -- 0 4 0PCBs PCB 180 μg/L -- 0 4 0PCBs PCB 183 μg/L -- 0 4 0PCBs PCB 187 μg/L -- 0 4 0PCBs PCB 189 μg/L -- 0 4 0PCBs PCB 194 μg/L -- 0 4 0PCBs PCB 195 μg/L -- 0 4 0PCBs PCB 200 μg/L -- 0 4 0PCBs PCB 201 μg/L -- 0 4 0PCBs PCB 203 μg/L -- 0 4 0PCBs PCB 206 μg/L -- 0 4 0PCBs PCB 209 μg/L -- 0 4 0PCBs PCB-1016 μg/L 0 -- 1PCBs PCB-1221 μg/L 0 -- 1PCBs PCB-1232 μg/L 0 -- 1PCBs PCB-1242 μg/L 0 -- 1PCBs PCB-1248 μg/L 0 -- 1PCBs PCB-1254 μg/L 0 -- 1PCBs PCB-1260 μg/L 0 -- 1Pesticide Toxaphene μg/L 0 -- 1Pesticides Aldrin μg/L -- 0 4 -- 1
II - 3
SWAMP Report on the Pueblo San Diego Hydrologic Unit
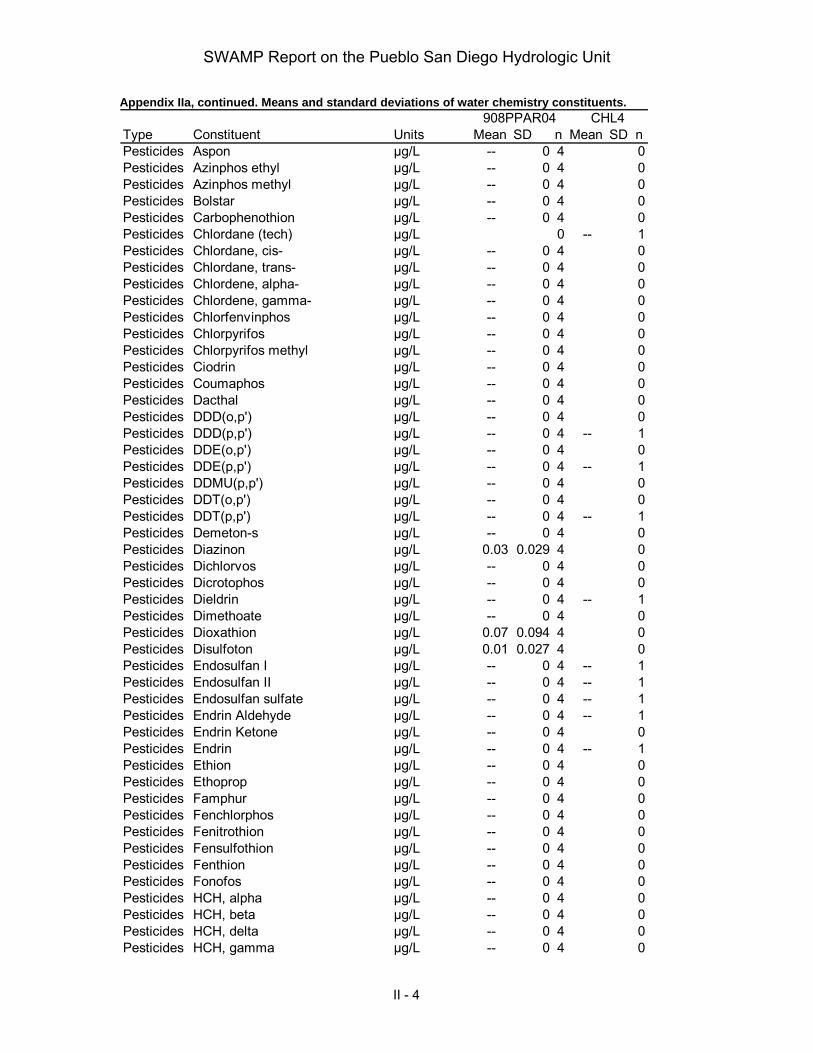
Appendix IIa, continued. Means and standard deviations of water chemistry constituents. 908PPAR04 CHL4
Type Constituent Units Mean SD n Mean SD nPesticides Aspon μg/L -- 0 4 0Pesticides Azinphos ethyl μg/L -- 0 4 0Pesticides Azinphos methyl μg/L -- 0 4 0Pesticides Bolstar μg/L -- 0 4 0Pesticides Carbophenothion μg/L -- 0 4 0Pesticides Chlordane (tech) μg/L 0 -- 1Pesticides Chlordane, cis- μg/L -- 0 4 0Pesticides Chlordane, trans- μg/L -- 0 4 0Pesticides Chlordene, alpha- μg/L -- 0 4 0Pesticides Chlordene, gamma- μg/L -- 0 4 0Pesticides Chlorfenvinphos μg/L -- 0 4 0Pesticides Chlorpyrifos μg/L -- 0 4 0Pesticides Chlorpyrifos methyl μg/L -- 0 4 0Pesticides Ciodrin μg/L -- 0 4 0Pesticides Coumaphos μg/L -- 0 4 0Pesticides Dacthal μg/L -- 0 4 0Pesticides DDD(o,p') μg/L -- 0 4 0Pesticides DDD(p,p') μg/L -- 0 4 -- 1Pesticides DDE(o,p') μg/L -- 0 4 0Pesticides DDE(p,p') μg/L -- 0 4 -- 1Pesticides DDMU(p,p') μg/L -- 0 4 0Pesticides DDT(o,p') μg/L -- 0 4 0Pesticides DDT(p,p') μg/L -- 0 4 -- 1Pesticides Demeton-s μg/L -- 0 4 0Pesticides Diazinon μg/L 0.03 0.029 4 0Pesticides Dichlorvos μg/L -- 0 4 0Pesticides Dicrotophos μg/L -- 0 4 0Pesticides Dieldrin μg/L -- 0 4 -- 1Pesticides Dimethoate μg/L -- 0 4 0Pesticides Dioxathion μg/L 0.07 0.094 4 0Pesticides Disulfoton μg/L 0.01 0.027 4 0Pesticides Endosulfan I μg/L -- 0 4 -- 1Pesticides Endosulfan II μg/L -- 0 4 -- 1Pesticides Endosulfan sulfate μg/L -- 0 4 -- 1Pesticides Endrin Aldehyde μg/L -- 0 4 -- 1Pesticides Endrin Ketone μg/L -- 0 4 0Pesticides Endrin μg/L -- 0 4 -- 1Pesticides Ethion μg/L -- 0 4 0Pesticides Ethoprop μg/L -- 0 4 0Pesticides Famphur μg/L -- 0 4 0Pesticides Fenchlorphos μg/L -- 0 4 0Pesticides Fenitrothion μg/L -- 0 4 0Pesticides Fensulfothion μg/L -- 0 4 0Pesticides Fenthion μg/L -- 0 4 0Pesticides Fonofos μg/L -- 0 4 0Pesticides HCH, alpha μg/L -- 0 4 0Pesticides HCH, beta μg/L -- 0 4 0Pesticides HCH, delta μg/L -- 0 4 0Pesticides HCH, gamma μg/L -- 0 4 0
II - 4
SWAMP Report on the Pueblo San Diego Hydrologic Unit
Appendix IIa, continued. Means and standard deviations of water chemistry constituents. 908PPAR04 CHL4
Type Constituent Units Mean SD n Mean SD nPesticides Heptachlor epoxide μg/L -- 0 4 -- 1Pesticides Heptachlor μg/L -- 0 4 -- 1Pesticides Hexachlorobenzene μg/L -- 0 4 0Pesticides Leptophos μg/L -- 0 4 0Pesticides Malathion μg/L -- 0 4 0Pesticides Merphos μg/L -- 0 4 0Pesticides Methidathion μg/L -- 0 4 0Pesticides Methoxychlor μg/L -- 0 4 -- 1Pesticides Mevinphos μg/L -- 0 4 0Pesticides Mirex μg/L -- 0 4 0Pesticides Molinate μg/L -- 0 4 0Pesticides Naled μg/L -- 0 4 0Pesticides Nonachlor, cis- μg/L -- 0 4 0Pesticides Nonachlor, trans- μg/L -- 0 4 0Pesticides Oxadiazon μg/L 0.02 0.016 4 0Pesticides Oxychlordane μg/L -- 0 4 0Pesticides Parathion, Ethyl μg/L -- 0 4 0Pesticides Parathion, Methyl μg/L -- 0 4 0Pesticides Phorate μg/L -- 0 4 0Pesticides Phosmet μg/L -- 0 4 0Pesticides Phosphamidon μg/L -- 0 4 0Pesticides Sulfotep μg/L -- 0 4 0Pesticides Tedion μg/L -- 0 4 0Pesticides Terbufos μg/L -- 0 4 0Pesticides Tetrachlorvinphos μg/L -- 0 4 0Pesticides Thiobencarb μg/L -- 0 4 0Pesticides Thionazin μg/L -- 0 4 0Pesticides Tokuthion μg/L -- 0 4 0Pesticides Trichlorfon μg/L -- 0 4 0Pesticides Trichloronate μg/L -- 0 4 0Physical Oxygen, Dissolved mg/L 113 198.9 4 0Physical Oxygen, Saturation % 175 98.1 4 0Physical pH pH units 8.78 0.754 4 0Physical Salinity ppt 4.19 5.655 4 0Physical Specific conductivity μS/cm 6925 9619 4 0Physical Suspended Solids,Total mg/L 39.5 48.82 4 31 1Physical Temperature ºC 25.7 5.42 4 0Physical Turbidity NTU 8.32 7.491 3 0
II - 5
SWAMP Report on the Pueblo San Diego Hydrologic Unit
II - 6
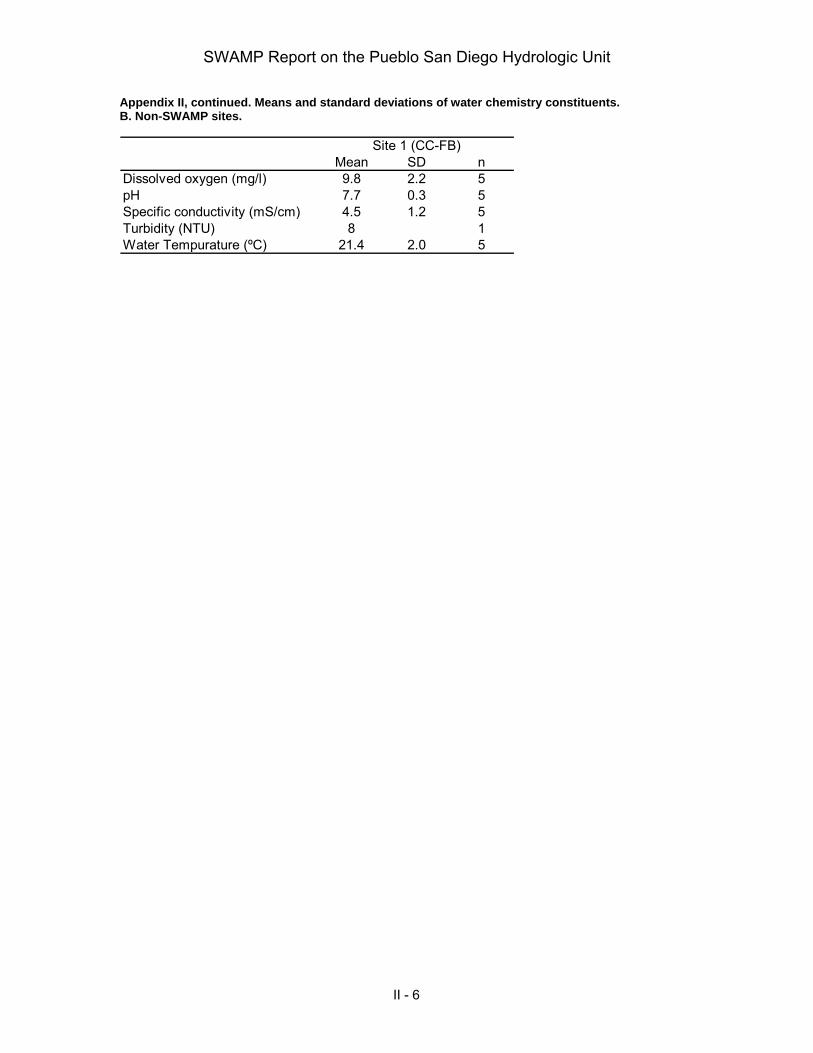
Appendix II, continued. Means and standard deviations of water chemistry constituents. B. Non-SWAMP sites.
Site 1 (CC-FB)Mean SD n
Dissolved oxygen (mg/l) 9.8 2.2 5pH 7.7 0.3 5Specific conductivity (mS/cm) 4.5 1.2 5Turbidity (NTU) 8 1Water Tempurature (ºC) 21.4 2.0 5
SWAMP Report on the Pueblo San Diego Hydrologic Unit
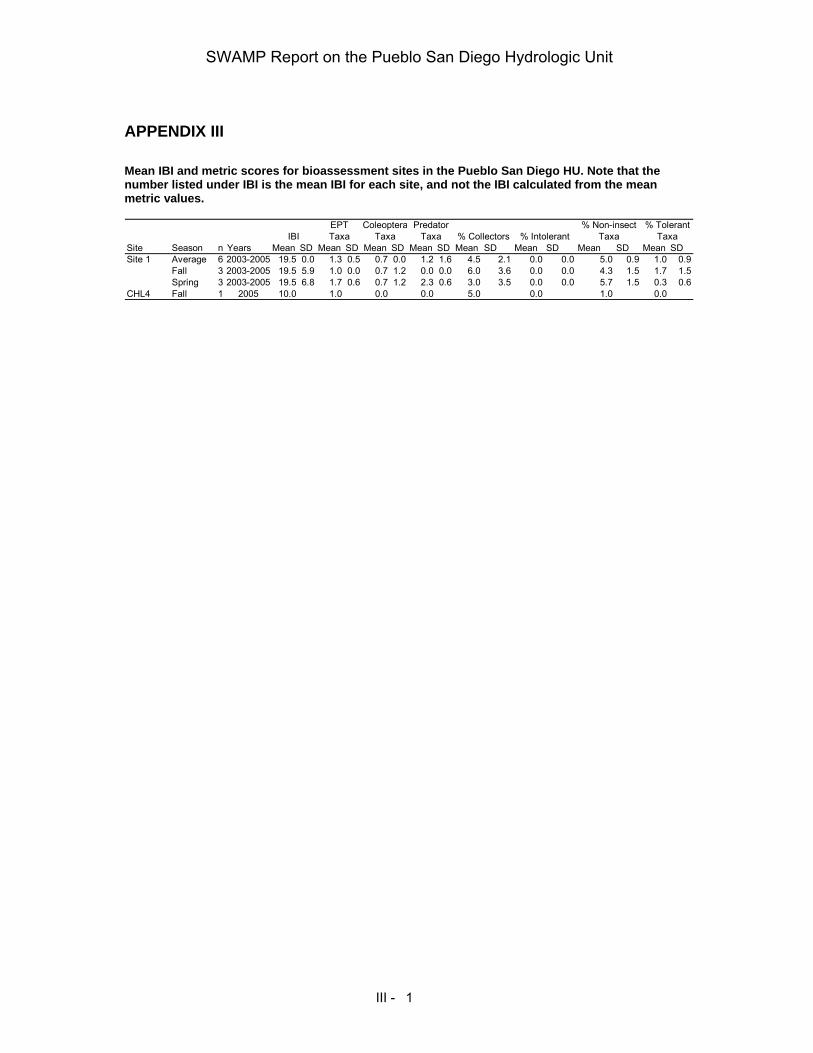
APPENDIX III Mean IBI and metric scores for bioassessment sites in the Pueblo San Diego HU. Note that the number listed under IBI is the mean IBI for each site, and not the IBI calculated from the mean metric values.
EPT Coleoptera Predator % Non-insect % TolerantIBI Taxa Taxa Taxa % Collectors % Intolerant Taxa Taxa
Site Season n Years Mean SD Mean SD Mean SD Mean SD Mean SD Mean SD Mean SD Mean SDSite 1 Average 6 2003-2005 19.5 0.0 1.3 0.5 0.7 0.0 1.2 1.6 4.5 2.1 0.0 0.0 5.0 0.9 1.0 0.9
Fall 3 2003-2005 19.5 5.9 1.0 0.0 0.7 1.2 0.0 0.0 6.0 3.6 0.0 0.0 4.3 1.5 1.7 1.5Spring 3 2003-2005 19.5 6.8 1.7 0.6 0.7 1.2 2.3 0.6 3.0 3.5 0.0 0.0 5.7 1.5 0.3 0.6
CHL4 Fall 1 2005 10.0 1.0 0.0 0.0 5.0 0.0 1.0 0.0
III - 1