Embed Size (px)
Citation preview

1
SURFACE WATER MONITORING OF GOLDSTREAM CREEK FOR THE DEVELOPMENT OF TMDLS FINAL REPORT INE G00006477/ADEC ACWA-11-07
August 2011
Prepared by:
Debasmita Misra University of Alaska Fairbanks Assisted by:
Peter A. Calvin, Catlin A. Stevens, Margaret J. Yngve and Peilin Xu University of Alaska Fairbanks

Surface Water Monitoring of Goldstream Creek for the Development of TMDLs Alaska Department of Environmental Conservation _____________________________________________________________________________________
2
TABLE OF CONTENTS
1. EXECUTIVE SUMMARY 6
2. BACKGROUND 8
3. METHODS 11
4. DATA PRESENTATION 13
5. DATA VALIDATION 21
6. RESULTS AND DISCUSSION 26
7. CONCLUSIONS 34
8. REFERENCES 34
9. APPENDIX 35

Surface Water Monitoring of Goldstream Creek for the Development of TMDLs Alaska Department of Environmental Conservation _____________________________________________________________________________________
3
LIST OF FIGURES
Figure 1. GIS based map of Goldstream Creek with the three sampling stations. ...................................... 9 Figure 2. Goldstream Creek (blue) and tributaries (red) is located just north of Fairbanks, AK (ADEC, 2009a). .......................................................................................................................................................... 9 Figure 3. Examples of bank erosion upstream of GS-1 site. ................................................................. 18 Figure 4. Validation of turbidity data at GS-2 in 2010. ......................................................................... 23 Figure 5. Comparison of Hach turbidity data with daily turbidity data recorded by the datalogger at GS-1 in 2011. ............................................................................................................................................. 24 Figure 6. Validation of turbidity data at GS-2 in 2011. ......................................................................... 24 Figure 7. Comparison of YSI Multimeter water temperature data with daily water temerature data recorded by the datalogger at GS-1 in 2011. ........................................................................................... 25 Figure 8. Comparison of YSI Multimeter water temperature data with daily water temerature data recorded by the datalogger at GS-2 in 2011. ........................................................................................... 26 Figure 9. Daily turbidity of the Goldstream Creek in 2010 field season and its response to precipitation events. .................................................................................................................................. 27 Figure 10. Daily turbidity of the Goldstream Creek in 2011 field season and its response to precipitation events ................................................................................................................................... 28 Figure 11. Response of TSS to Precipitation in Goldstream Creek in 2010 field season. .................. 29 Figure 12. Response of TSS to Precipitation in Goldstream Creek in 2011 field season. .................. 30 Figure 13. Turbidity vs TSS at GS-1 in 2011. ........................................................................................ 31 Figure 14. Turbidity vs TSS at GS-2 in 2010 and 2011. ........................................................................ 32 Figure 15. Turbidity vs TSS at GS-3 in 2011. ........................................................................................ 33
Figure A 1. GIS map showing all sample sites (from ADEC, 2009b) and road access in area. Sampling sites indicated in green, with permitted prospecting sites indicated in blue. All proposed sample sites (from Table A-1) are close to known roads, allowing easy access to stream. ............................................ 40 Figure A 2. Potential sampling location (near CCW-8) on Crooked Creek in the vicinity of the bridge in Circle, Alaska .............................................................................................................................................. 41

Surface Water Monitoring of Goldstream Creek for the Development of TMDLs Alaska Department of Environmental Conservation _____________________________________________________________________________________
4
LIST OF TABLES
Table 1. Identification of measurement devices used at each sample location. ......................................... 11 Table 2. Parameters, units, and intervals of measurement for each device. ............................................... 12 Table 3. Parameter and Levels of Concern ............................................................................................... 14 Table 4. Statistics of different parameters of water quality at GS1 in 2011. ....................................... 15 Table 5. Statistics of different parameters of water quality at GS2 in 2010. ....................................... 16 Table 6. Statistics of different parameters of water quality at GS2 in 2011. ....................................... 17 Table 7. Monthly turbidity based on daily data. ..................................................................................... 19 Table 8. Monthly water temperature based on daily data. ..................................................................... 20 Table 9. Monthly pH and DO for 2011 field season. ............................................................................. 20 Table 10. Results of bench test of the automatic turbidity sensors of GS1 and GS2. ................................ 21 Table 11. Project Completeness ................................................................................................................. 22
Table A 1. Recommended sampling locations in Crooked Creek Watershed for monitoring turbidity. ... 38
Surface Water Monitoring of Goldstream Creek for the Development of TMDLs Alaska Department of Environmental Conservation _____________________________________________________________________________________
5
ACKNOWLEDGMENTS
Funding for this project was provided by the Alaska Department of Environmental Conservation and the Environmental Protection Agency through the ACWA-11-07 community water quality grant of the Clean Water Act. Matching funds were provided by the College of Engineering and Mines of the University of Alaska Fairbanks (UAF). The field data collection and laboratory analyses for the project has been possible due to the assistance of a team of students of UAF; Peter Calvin, Catlin A. Stevens, Margaret J. Yngve and Peilin Xu. Special mention goes to Michelle L. Corrigan of Alaska Department of Environmental Conservation (ADEC), who had initiated the idea of collaboration between ADEC and UAF on water quality projects such as this one, especially to train UAF students for being employed in such projects in the future. Brock N. Tabor of ADEC was instrumental during the initial stage of the project by spending time and advising the students and providing consistent guidance on the progress so far. Chandra J. McGee, the current program officer of the project needs special commendation for being instrumental in steering the project with proper data quality assurance protocols and providing critical recommendations at appropriate times. GW Scientific, LLC (especially Michael Lilly and Austin McHugh) provided critical support in setting up field instrumentation infrastructure, initial bench testing and calibration of sensors and wiring and coding of dataloggers. Special thanks go to Mr. Larry Ledlow, Station Manager, Fairbanks CDA Station of NOAA/NESDIS/OSPO/FCDAS for facilitating our visits to the GS1 site within their premises. Thomas A. Cappiello needs special mention for helping and supporting the discharge measurements and surveying at both the sites. The team of Water Walkers Streamflow Monitoring, LLC from Colorado (especially Brice Bigelow and Brittany Tripp) are duly acknowledged for providing training in discharge measurements and supporting the project. Finally, we thank ADEC for providing us with the field instruments for data collection.

Surface Water Monitoring of Goldstream Creek for the Development of TMDLs Alaska Department of Environmental Conservation _____________________________________________________________________________________
6
1. EXECUTIVE SUMMARY
UAF was awarded with an ACWA grant in July, 2010 to initiate monitoring at three sites of the Goldstream Creek watershed that were identified in the Quality Assurance Project Plan (QAPP) and Sampling and Analysis Plan (SAP), developed by ADEC in December 2009. Goldstream Creek near Fairbanks, AK was listed by ADEC on the Section 303(d) list as impaired for turbidity in 1992 and was evaluated for impairment of water quality by ADEC and the Water Quality Report was completed in 1994. The sources of turbidity were determined to be both point sources, including active placer mines, and nonpoint sources, including abandoned placer mines, stream bank erosion, and re-suspension of deposited sediment, as well as runoff from both abandoned and active mine sites. Monitoring stream data that demonstrate compliance with the water quality standards is required to remove Goldstream Creek from the list of waterbodies impaired for turbidity. Subsequent to the development of the QAPP and SAP of 2009, a major objective to collect steady and near-continuous measurements of turbidity data from both baseflow and stormflow conditions and the stream discharge data at those times at several selected locations from spring to fall of 2010 in order to characterize conditions and potentially locate sources of impairment was established. Additionally, collection of monthly (or more frequently if needed) data of overall water quality, viz., dissolved oxygen (DO), pH, conductivity, temperature, etc. at several selected locations of Goldstream Creek from spring to fall of 2010 in order to characterize the degree of impairment was included in the sampling plan. Using the recommendations provided in the 2009 SAP, two sites (GS-1 and GS-2) were instrumented and one site (GS-3) was used as a control site from which periodic grab samples were collected. Continuous data sampling (hourly and daily) started on August 2, 2010 for GS-1 and July 26, 2010 for GS-2. Additionally, water samples were collected using ISCO samplers on a daily basis for measuring the Total Suspended Solids (TSS) in the stream. Continuous data sampling was discontinued after October 7, 2010 since the stream was freezing and there was a risk to the sensors. Continuous and periodic data sampling was resumed after the spring break up in 2011. Automatic sensors were deployed on May 24, 2011 in GS-1 and GS-2. ISCO samples of 800 mL were procured per schedule. A third ISCO sampler was not available for the field season of 2011, hence only periodic samples using the YSI multimeter, Hach Turbidity meter and grab samples for TSS were procured from GS-3. The turbidity data collected using Hach turbidity meter from GS-3 in 2011 field season was used to establish the Background Natural Turbidity (BNT) of the stream. The BNT was established using the mean of the averages of two replicate data sets at 17.73 NTU. The BNT value of 17.73 NTU being less than 50 NTU, Alaska Water Quality Standards (AK WQS) was used to establish that the stream turbidity should not exceed 42.73 NTU for aquatic life, 27.73 NTU for recreation and 22.73 NTU for water supply. AK WQS specifies standards for other water quality indicators such as water temperature, pH and DO. With respect to compliance to the three AK WQS standards for turbidity, it was observed that GS-1 complied with the standards in May 2011
Surface Water Monitoring of Goldstream Creek for the Development of TMDLs Alaska Department of Environmental Conservation _____________________________________________________________________________________
7
but failed to comply in June 2011. GS-2 failed to comply with all the three standards in 2010 and May of 2011. However, it complied with the three standards in June of 2011. Similarly, applying the AK WQS to the hourly and daily water temperature at both the sites, it was found that the temperatures were within the prescribed standards for aquatic life, recreation and water supply. It was found that the stream met the DO standards at GS-11 for 94% of the times for aquatic life and water supply and met 56% of the time for anadromous fish and 87.5% of the time for non-anadromous fish populations in 2011. The stream met the pH standards at GS-11 for 94% of the times in 2011. At GS-22, the stream met the pH standards for all three Alaska WQS standards, 92% of the time in 2011. However, the DO standards were only met for 86% of the time for aquatic life and water supply and met 42% of the time for anadromous fish and 53% of the time for non-anadromous fish populations in 2011. So, it may be observed that the stream did not meet the recreation WQS standards for approximately 50% of the time. It was found that GS-1 turbidity responds more drastically to storm events than the GS-2 turbidity. It was also evident from the study that there was no correlation between TSS and turbidity at any of the three sites. Turbidity and TSS correlation should be developed with careful removal of outliers and utilizing data transformation in order to assess the actual loading of sediments in the stream. TSS responds similarly to the turbidity during storm events. GS-1 might have bank erosion contributing to the higher turbidity values at the Gilmore Creek. It may be fair to establish a separate BNT standard for that site, since GS-2 receives diluted turbidity values due to the confluence of a turbid Gilmore Creek and a relatively clean Pedro Creek.
Surface Water Monitoring of Goldstream Creek for the Development of TMDLs Alaska Department of Environmental Conservation _____________________________________________________________________________________
8
2. BACKGROUND
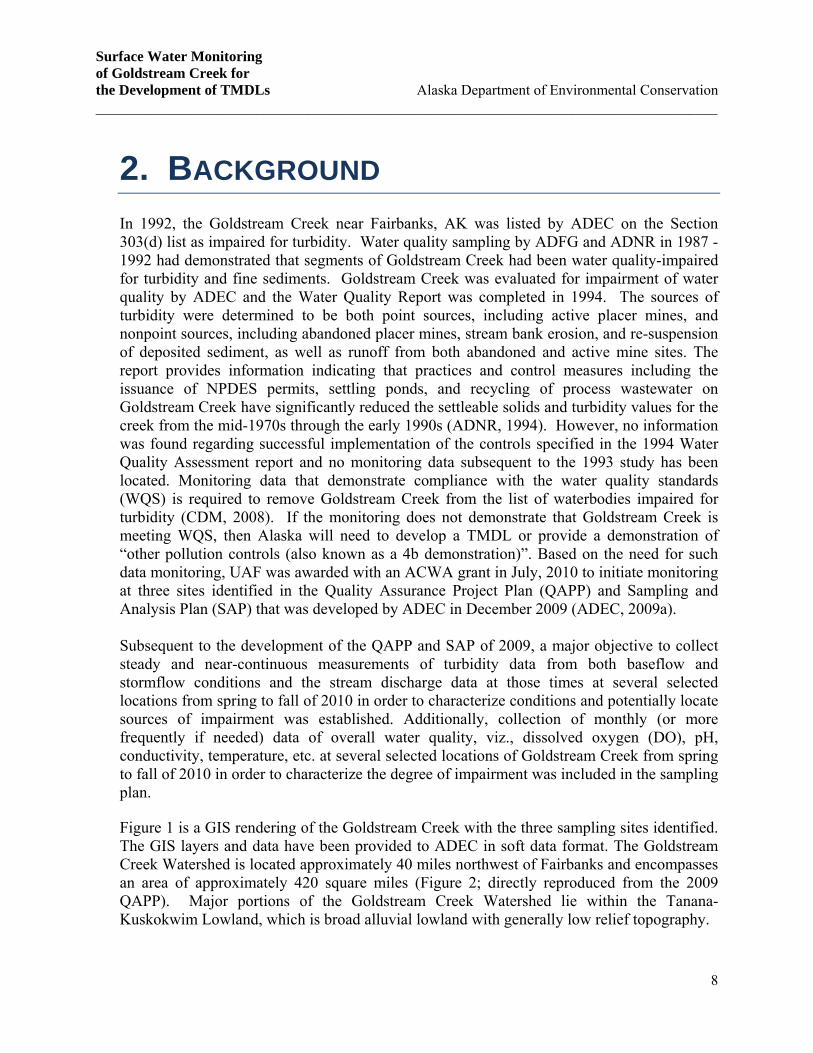
In 1992, the Goldstream Creek near Fairbanks, AK was listed by ADEC on the Section 303(d) list as impaired for turbidity. Water quality sampling by ADFG and ADNR in 1987 - 1992 had demonstrated that segments of Goldstream Creek had been water quality-impaired for turbidity and fine sediments. Goldstream Creek was evaluated for impairment of water quality by ADEC and the Water Quality Report was completed in 1994. The sources of turbidity were determined to be both point sources, including active placer mines, and nonpoint sources, including abandoned placer mines, stream bank erosion, and re-suspension of deposited sediment, as well as runoff from both abandoned and active mine sites. The report provides information indicating that practices and control measures including the issuance of NPDES permits, settling ponds, and recycling of process wastewater on Goldstream Creek have significantly reduced the settleable solids and turbidity values for the creek from the mid-1970s through the early 1990s (ADNR, 1994). However, no information was found regarding successful implementation of the controls specified in the 1994 Water Quality Assessment report and no monitoring data subsequent to the 1993 study has been located. Monitoring data that demonstrate compliance with the water quality standards (WQS) is required to remove Goldstream Creek from the list of waterbodies impaired for turbidity (CDM, 2008). If the monitoring does not demonstrate that Goldstream Creek is meeting WQS, then Alaska will need to develop a TMDL or provide a demonstration of “other pollution controls (also known as a 4b demonstration)”. Based on the need for such data monitoring, UAF was awarded with an ACWA grant in July, 2010 to initiate monitoring at three sites identified in the Quality Assurance Project Plan (QAPP) and Sampling and Analysis Plan (SAP) that was developed by ADEC in December 2009 (ADEC, 2009a). Subsequent to the development of the QAPP and SAP of 2009, a major objective to collect steady and near-continuous measurements of turbidity data from both baseflow and stormflow conditions and the stream discharge data at those times at several selected locations from spring to fall of 2010 in order to characterize conditions and potentially locate sources of impairment was established. Additionally, collection of monthly (or more frequently if needed) data of overall water quality, viz., dissolved oxygen (DO), pH, conductivity, temperature, etc. at several selected locations of Goldstream Creek from spring to fall of 2010 in order to characterize the degree of impairment was included in the sampling plan. Figure 1 is a GIS rendering of the Goldstream Creek with the three sampling sites identified. The GIS layers and data have been provided to ADEC in soft data format. The Goldstream Creek Watershed is located approximately 40 miles northwest of Fairbanks and encompasses an area of approximately 420 square miles (Figure 2; directly reproduced from the 2009 QAPP). Major portions of the Goldstream Creek Watershed lie within the Tanana-Kuskokwim Lowland, which is broad alluvial lowland with generally low relief topography.

Surface Water Monitoring of Goldstream Creek for the Development of TMDLs Alaska Department of Environmental Conservation _____________________________________________________________________________________
9
Figure 1. GIS based map of Goldstream Creek with the three sampling stations.
Figure 2. Goldstream Creek (blue) and tributaries (red) is located just north of Fairbanks, AK (ADEC, 2009a).
GS-1
GS-2
GS-3
Surface Water Monitoring of Goldstream Creek for the Development of TMDLs Alaska Department of Environmental Conservation _____________________________________________________________________________________
10
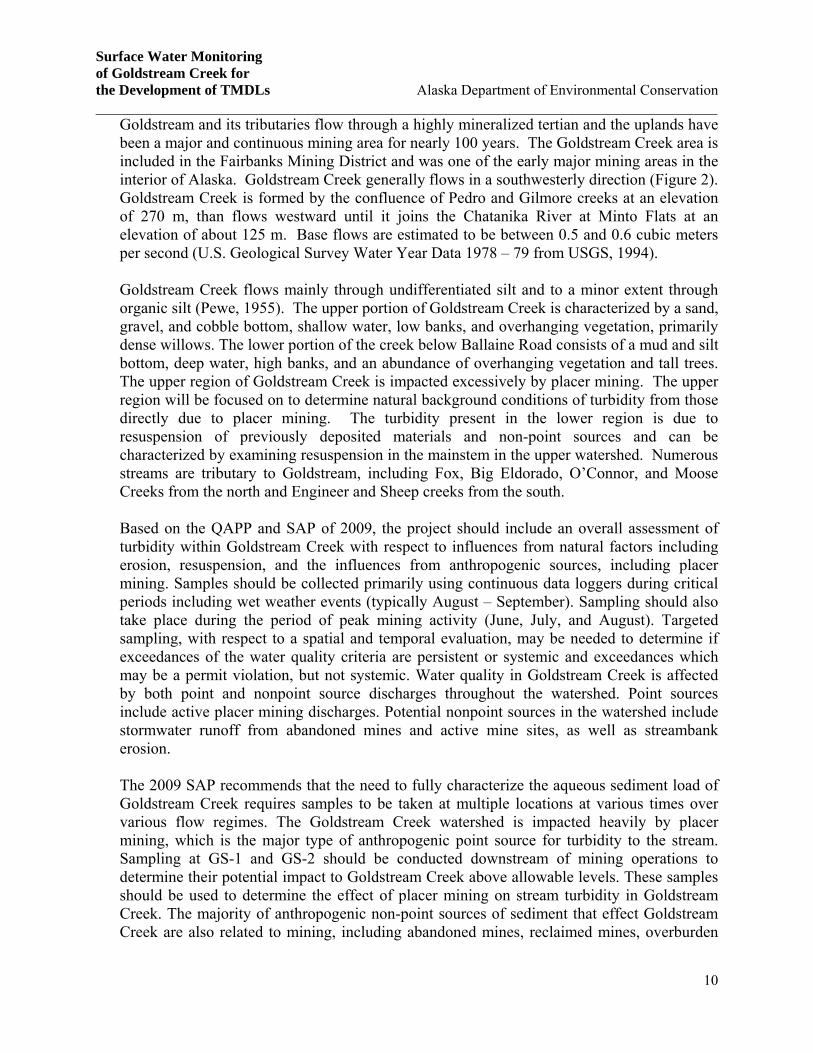
Goldstream and its tributaries flow through a highly mineralized tertian and the uplands have been a major and continuous mining area for nearly 100 years. The Goldstream Creek area is included in the Fairbanks Mining District and was one of the early major mining areas in the interior of Alaska. Goldstream Creek generally flows in a southwesterly direction (Figure 2). Goldstream Creek is formed by the confluence of Pedro and Gilmore creeks at an elevation of 270 m, than flows westward until it joins the Chatanika River at Minto Flats at an elevation of about 125 m. Base flows are estimated to be between 0.5 and 0.6 cubic meters per second (U.S. Geological Survey Water Year Data 1978 – 79 from USGS, 1994). Goldstream Creek flows mainly through undifferentiated silt and to a minor extent through organic silt (Pewe, 1955). The upper portion of Goldstream Creek is characterized by a sand, gravel, and cobble bottom, shallow water, low banks, and overhanging vegetation, primarily dense willows. The lower portion of the creek below Ballaine Road consists of a mud and silt bottom, deep water, high banks, and an abundance of overhanging vegetation and tall trees. The upper region of Goldstream Creek is impacted excessively by placer mining. The upper region will be focused on to determine natural background conditions of turbidity from those directly due to placer mining. The turbidity present in the lower region is due to resuspension of previously deposited materials and non-point sources and can be characterized by examining resuspension in the mainstem in the upper watershed. Numerous streams are tributary to Goldstream, including Fox, Big Eldorado, O’Connor, and Moose Creeks from the north and Engineer and Sheep creeks from the south. Based on the QAPP and SAP of 2009, the project should include an overall assessment of turbidity within Goldstream Creek with respect to influences from natural factors including erosion, resuspension, and the influences from anthropogenic sources, including placer mining. Samples should be collected primarily using continuous data loggers during critical periods including wet weather events (typically August – September). Sampling should also take place during the period of peak mining activity (June, July, and August). Targeted sampling, with respect to a spatial and temporal evaluation, may be needed to determine if exceedances of the water quality criteria are persistent or systemic and exceedances which may be a permit violation, but not systemic. Water quality in Goldstream Creek is affected by both point and nonpoint source discharges throughout the watershed. Point sources include active placer mining discharges. Potential nonpoint sources in the watershed include stormwater runoff from abandoned mines and active mine sites, as well as streambank erosion. The 2009 SAP recommends that the need to fully characterize the aqueous sediment load of Goldstream Creek requires samples to be taken at multiple locations at various times over various flow regimes. The Goldstream Creek watershed is impacted heavily by placer mining, which is the major type of anthropogenic point source for turbidity to the stream. Sampling at GS-1 and GS-2 should be conducted downstream of mining operations to determine their potential impact to Goldstream Creek above allowable levels. These samples should be used to determine the effect of placer mining on stream turbidity in Goldstream Creek. The majority of anthropogenic non-point sources of sediment that effect Goldstream Creek are also related to mining, including abandoned mines, reclaimed mines, overburden
Surface Water Monitoring of Goldstream Creek for the Development of TMDLs Alaska Department of Environmental Conservation _____________________________________________________________________________________
11
piles and other disturbed areas. Overland flow from natural runoff will occur during spring break up and during periods of precipitation. Flow during these times will increase both the amount of sediment entering the stream, but the increased flow will also elevate the amount of sediment re-suspended in the water column. Of all the sources of sediment in Goldstream Creek, the natural non-point sources are the most difficult to characterize due in part to the fact that the whole basin is affected by anthropogenic non-point source sediment loads. Natural non-point source sediment loads will be characterized by establishing the reference location (GS-3) within Goldstream Creek (Figure 1).
3. METHODS
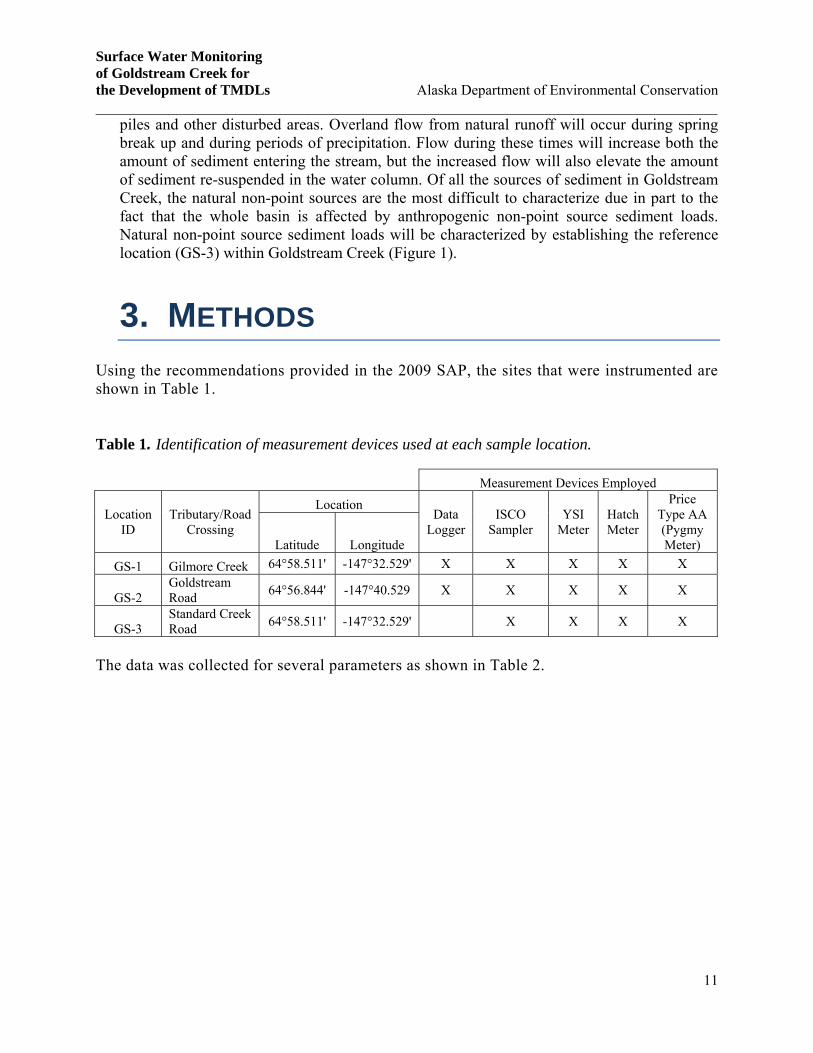
Using the recommendations provided in the 2009 SAP, the sites that were instrumented are shown in Table 1.
Table 1. Identification of measurement devices used at each sample location.
Measurement Devices Employed
Location ID
Tributary/Road Crossing
Location Data
Logger ISCO
Sampler YSI
Meter Hatch Meter
Price Type AA (Pygmy Meter) Latitude Longitude
GS-1 Gilmore Creek 64°58.511' -147°32.529' X X X X X
GS-2 Goldstream Road
64°56.844' -147°40.529 X X X X X
GS-3 Standard Creek Road
64°58.511' -147°32.529'
X X X X
The data was collected for several parameters as shown in Table 2.

Surface Water Monitoring of Goldstream Creek for the Development of TMDLs Alaska Department of Environmental Conservation _____________________________________________________________________________________
12
Table 2. Parameters, units, and intervals of measurement for each device.
Measurement Device
Parameter Units Sensor Precision Sample Interval
Data Logger
Turbidity NTU Campbell OBS-
3+SB 2.5-T1
0-1000 NTU with
+/- 2%
Hourly and Daily
Average
Conductivity S/cm CR 1000
Measurement and Datalogger
0-1000 S/cm +/-
2%
Water Depth cm
Campbell CS450-L45
Pressure Transducer
N/A
Water and Air Temperature °C Campbell
HMPC45C-L 10 -40C - 60C
Relative Humidity % Campbell
HMPC45C-L 10 0 – 100%
ISCO Sampler TSS mg/mL - N/A Daily
YSI Multimeter
DO mg/L Steady State
Polarographic 0 - 50
Bi-Monthly
pH std. units Glass
combination electrode
0 - 14
Conductivity S/cm 4-electrode cell
with autoranging 0 - 200
Temperature °C YSI temperature
precision thermistor
-5C - 45C
Hach 2100 P Turbidity Meter
Turbidity NTU - 0-1000
NTU with +/- 2%
Price Type AA Flowmeter/ Pygmy
Meter Flow ft3/sec - N/A Monthly
Although the SAP recommended a sample interval of ~15 minutes using the dataloggers, it was decided during the first project meeting in July 2010 that hourly and daily background screening of turbidity and other water quality parameters should be sufficient as this will not be used for permitting. Continuous data sampling started on August 2, 2010 for GS-1 and July 26, 2010 for GS-2. Additionally, water samples have been collected using ISCO samplers on a daily basis for measuring the Total Suspended Solids (TSS) in the stream. ISCO samples of 800 mL were procured once every 24 hours and collected from sampling sites every 7-12 days until September 22, 2010 at GS1; September 20, 2010 at GS2; and September 16, 2010 at GS3. The YSI multimeter had some sensor issues and was sent for repair. Hence, no data could be collected

Surface Water Monitoring of Goldstream Creek for the Development of TMDLs Alaska Department of Environmental Conservation _____________________________________________________________________________________
13
periodically using the YSI multimeter. Periodic turbidity data was procured using the Hach Turbidity meter. Also, periodic data has been collected on stream discharge at each location. Continuous data sampling was discontinued after October 7, 2010 since the stream was freezing and there was a risk to the sensors. All sensors were removed from GS-1 and GS-2 and stored for the winter. No data could be collected with the YSI multimeter for the 2010 field season as it was repaired and received after October 2, 2010. Continuous and periodic data sampling was resumed after the spring break up in 2011. Automatic sensors were deployed on May 24, 2011 in GS-1 and GS-2. ISCO samples of 800 mL were procured twice every 24 hours initially and changed to once every 24 hours and collected from sampling sites every 7-12 days. A third ISCO sampler was not available for the field season of 2011, hence only periodic samples using the YSI multimeter, Hach Turbidity meter and grab samples for TSS have been procured from GS-3. Standard Operating Procedures (SOPs) were provided by ADEC for General Field Testing and Measurement. SOPs were provided by ADEC for monitoring and calibrating turbidity, dissolved oxygen, specific conductance and hydrogen ion activity (pH). SOPs were provided by the Department of Fish and Game (DF&G) for monitoring and collecting water flow and velocity.
4. DATA PRESENTATION
In 2010, it was realized that the automatic turbidity data collected at GS-1 were erroneous. To understand what issue could be impacting the turbidity sensor, the following investigations were carried out –
Potential issues with the datalogger code at GS-1. Potential wiring issue in the field, loose wire, or wire that was crimped on insulation thus
not making a good electrical contact. Potential wiring problem that occurred after installation, such as coming loose, resulting
in data being good for a period of time and then suddenly failing. Field issue with sensor, such as getting covered by sediment, working for a period of time
and then not functioning correctly (sensor failure) Checking wiring diagrams
Despite several attempts to correct the issue, it was not resolved by the end of the season. The reason for the issue was not clear at all and is still beyond our perception. Hence, no presentation or validation of the data of GS-1 in 2010 is necessary. In this section, we will provide a discussion on establishment of background natural turbidity using data from GS-3, present the data of GS1 for 2011 and GS-2 for 2010 and 2011 field seasons. Next we will focus on parameters that have been recommended in the 2009 QAPP. These are the water temperature, DO and pH as water quality indicators. The Alaska WQS is reproduced from the 2009 QAPP (ADEC, 2009a) in Table 3.
Surface Water Monitoring of Goldstream Creek for the Development of TMDLs Alaska Department of Environmental Conservation _____________________________________________________________________________________
14
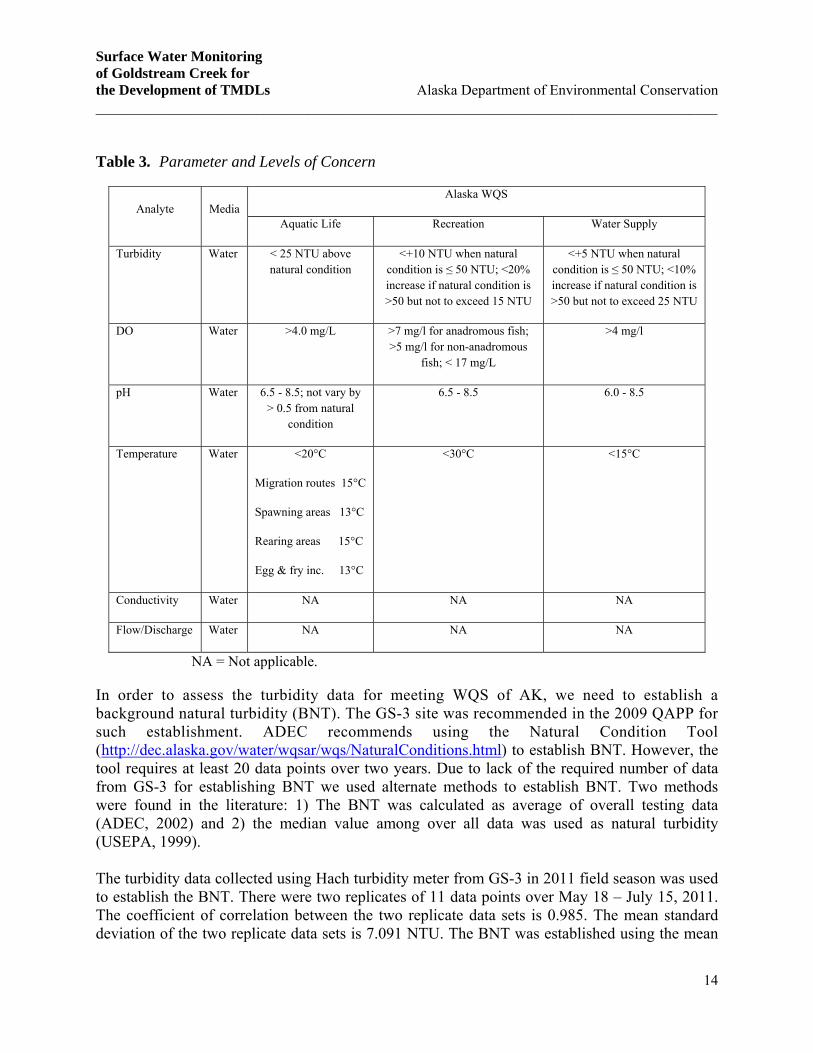
Table 3. Parameter and Levels of Concern
Analyte Media Alaska WQS
Aquatic Life Recreation Water Supply
Turbidity Water < 25 NTU above natural condition
<+10 NTU when natural condition is ≤ 50 NTU; <20% increase if natural condition is >50 but not to exceed 15 NTU
<+5 NTU when natural condition is ≤ 50 NTU; <10% increase if natural condition is >50 but not to exceed 25 NTU
DO Water >4.0 mg/L >7 mg/l for anadromous fish; >5 mg/l for non-anadromous
fish; < 17 mg/L
>4 mg/l
pH Water 6.5 - 8.5; not vary by > 0.5 from natural
condition
6.5 - 8.5 6.0 - 8.5
Temperature Water <20°C
Migration routes 15°C
Spawning areas 13°C
Rearing areas 15°C
Egg & fry inc. 13°C
<30°C
<15°C
Conductivity Water NA NA NA
Flow/Discharge Water NA NA NA
NA = Not applicable.
In order to assess the turbidity data for meeting WQS of AK, we need to establish a background natural turbidity (BNT). The GS-3 site was recommended in the 2009 QAPP for such establishment. ADEC recommends using the Natural Condition Tool (http://dec.alaska.gov/water/wqsar/wqs/NaturalConditions.html) to establish BNT. However, the tool requires at least 20 data points over two years. Due to lack of the required number of data from GS-3 for establishing BNT we used alternate methods to establish BNT. Two methods were found in the literature: 1) The BNT was calculated as average of overall testing data (ADEC, 2002) and 2) the median value among over all data was used as natural turbidity (USEPA, 1999). The turbidity data collected using Hach turbidity meter from GS-3 in 2011 field season was used to establish the BNT. There were two replicates of 11 data points over May 18 – July 15, 2011. The coefficient of correlation between the two replicate data sets is 0.985. The mean standard deviation of the two replicate data sets is 7.091 NTU. The BNT was established using the mean

Surface Water Monitoring of Goldstream Creek for the Development of TMDLs Alaska Department of Environmental Conservation _____________________________________________________________________________________
15
of the averages of the two replicate data sets, which is 17.73 NTU. The mean of the median values of the two replicate data sets is 18.4 NTU suggesting that there is hardly any skewness. The CV is approximately 40%, which suggests that the data has very small spread. The BNT value of 17.73 NTU is less than 50 NTU. According to the AK WQS (Table 3), the stream turbidity may not exceed 42.73 NTU for aquatic life, 27.73 NTU for recreation and 22.73 NTU for water supply. However, with more data collected, the BNT needs to be reestablished using ADEC recommended Natural Condition Tool. The statistics of hourly and daily turbidity, hourly and daily water temperature, pH and DO are presented in Tables 4, 5 and 6.
Table 4. Statistics of different parameters of water quality at GS1 in 2011.
GS-1 in May – June of 2011
Parameter Frequency Mean Median CV (%) Number of Samples
Turbidity (NTU)
Daily 47.83 27.93 83.13 37
Hourly 49.45 27.49 108.03 891
Water T (°C)
Daily 8.68 8.35 14.98 37
Hourly 8.69 8.54 18.87 891
pH
Variable 7.41 7.44 7.04 15
DO (mg/L) Variable 7.83 8.05 35.38 15
From Table 4, it is evident that the both hourly and daily turbidity are positively skewed. The coefficient of variation (CV = Standard deviation Mean) in both daily and hourly turbidities are high reflecting that over the period of monitoring, the data variability has been large. This large variability could be due to a combination of several factors such as periods of stream bank erosion or other non-point source pollution and also periods of enhanced anthropogenic activities. We will discuss this aspect in monthly based data analysis later. Comparing the mean daily and hourly turbidity values to the AK WQS
Surface Water Monitoring of Goldstream Creek for the Development of TMDLs Alaska Department of Environmental Conservation _____________________________________________________________________________________
16
standards, it is evident that the stream turbidity exceeds all three standards on daily and hourly basis. Site visits have also confirmed that the Gilmore Creek is in general more turbid than the Pedro Creek that confluence with the former to flow into the Goldstream Creek. Both the mean daily and the hourly water temperature (Table 4) have a considerably low variability and are hardly skewed. Comparing the mean daily and hourly water temperature values to the AK WQS standards, it is evident that the stream temperature complies with all the three standards on daily and hourly basis. The pH has low variability and skewness while the DO has moderate variability and a small skewness. Both the mean pH and DO comply with all the three AK WQS standards.
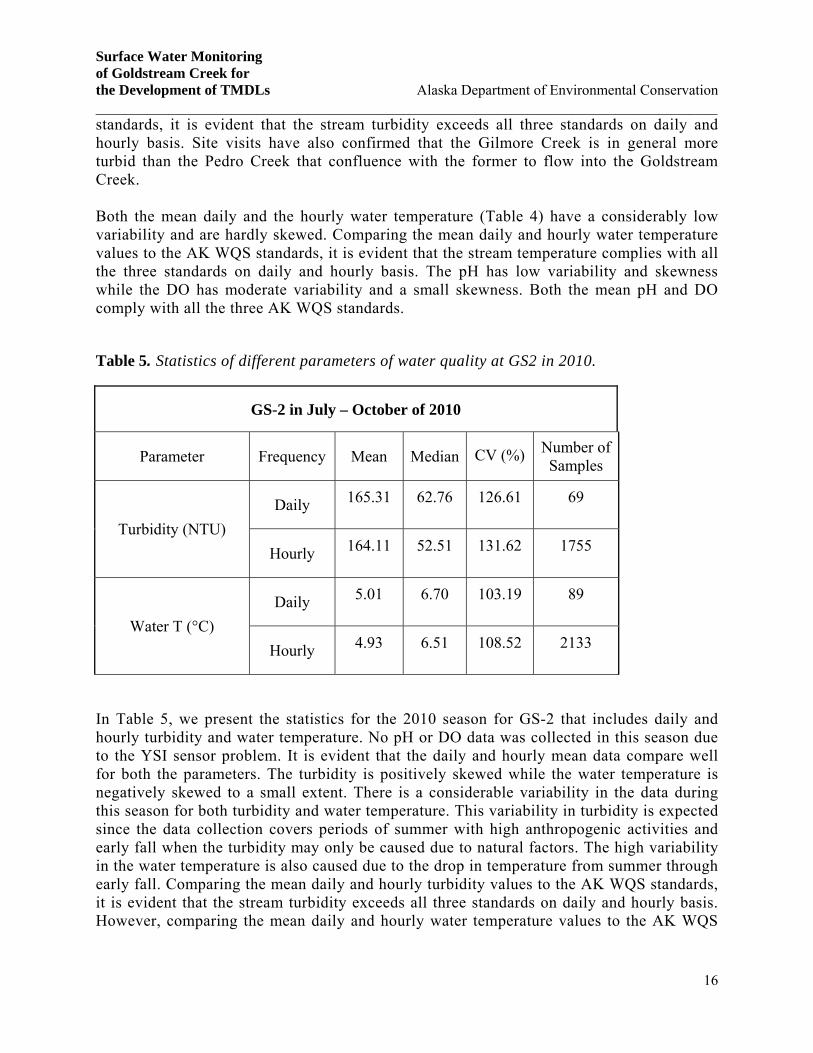
Table 5. Statistics of different parameters of water quality at GS2 in 2010.
GS-2 in July – October of 2010
Parameter Frequency Mean Median CV (%) Number of Samples
Turbidity (NTU)
Daily 165.31 62.76 126.61 69
Hourly 164.11 52.51 131.62 1755
Water T (°C)
Daily 5.01 6.70 103.19 89
Hourly 4.93 6.51 108.52 2133
In Table 5, we present the statistics for the 2010 season for GS-2 that includes daily and hourly turbidity and water temperature. No pH or DO data was collected in this season due to the YSI sensor problem. It is evident that the daily and hourly mean data compare well for both the parameters. The turbidity is positively skewed while the water temperature is negatively skewed to a small extent. There is a considerable variability in the data during this season for both turbidity and water temperature. This variability in turbidity is expected since the data collection covers periods of summer with high anthropogenic activities and early fall when the turbidity may only be caused due to natural factors. The high variability in the water temperature is also caused due to the drop in temperature from summer through early fall. Comparing the mean daily and hourly turbidity values to the AK WQS standards, it is evident that the stream turbidity exceeds all three standards on daily and hourly basis. However, comparing the mean daily and hourly water temperature values to the AK WQS
Surface Water Monitoring of Goldstream Creek for the Development of TMDLs Alaska Department of Environmental Conservation _____________________________________________________________________________________
17
standards, it is evident that the stream temperature complies with all the three standards on daily and hourly basis.
Table 6. Statistics of different parameters of water quality at GS2 in 2011.
GS-2 in May – June of 2011
Parameter Frequency Mean Median CV (%) Number of Samples
Turbidity (NTU)
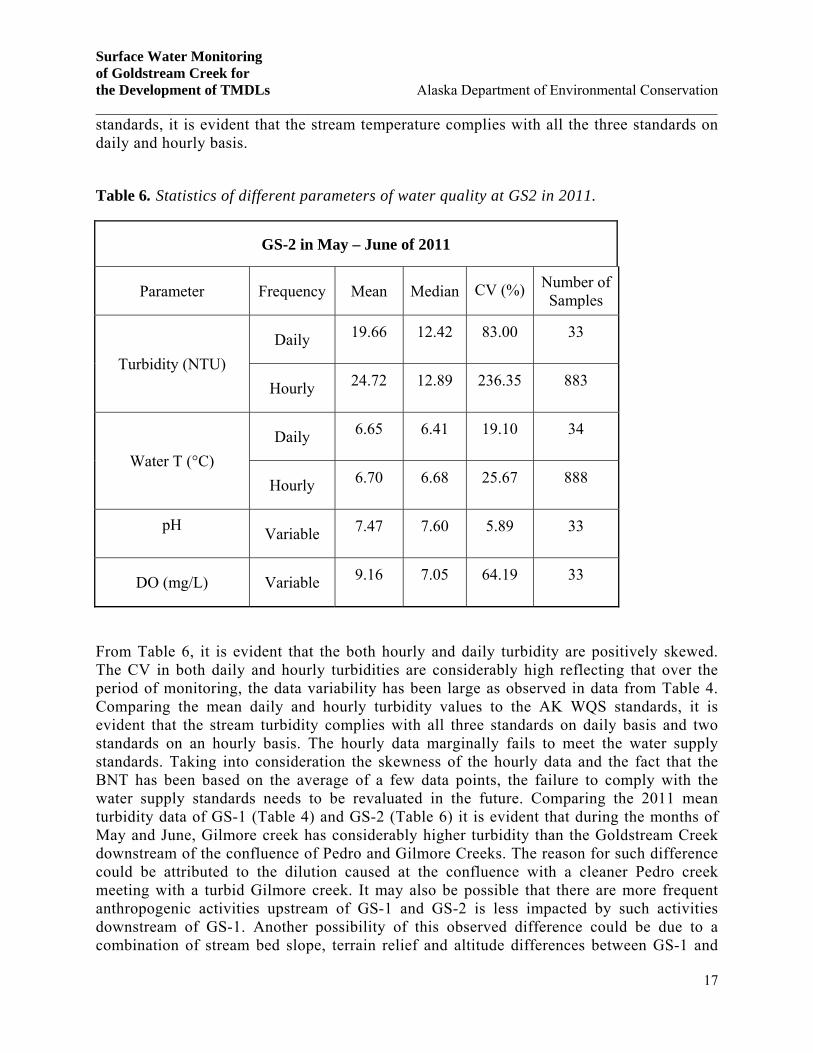
Daily 19.66 12.42 83.00 33
Hourly 24.72 12.89 236.35 883
Water T (°C)
Daily 6.65 6.41 19.10 34
Hourly 6.70 6.68 25.67 888
pH
Variable 7.47 7.60 5.89 33
DO (mg/L) Variable 9.16 7.05 64.19 33
From Table 6, it is evident that the both hourly and daily turbidity are positively skewed. The CV in both daily and hourly turbidities are considerably high reflecting that over the period of monitoring, the data variability has been large as observed in data from Table 4. Comparing the mean daily and hourly turbidity values to the AK WQS standards, it is evident that the stream turbidity complies with all three standards on daily basis and two standards on an hourly basis. The hourly data marginally fails to meet the water supply standards. Taking into consideration the skewness of the hourly data and the fact that the BNT has been based on the average of a few data points, the failure to comply with the water supply standards needs to be revaluated in the future. Comparing the 2011 mean turbidity data of GS-1 (Table 4) and GS-2 (Table 6) it is evident that during the months of May and June, Gilmore creek has considerably higher turbidity than the Goldstream Creek downstream of the confluence of Pedro and Gilmore Creeks. The reason for such difference could be attributed to the dilution caused at the confluence with a cleaner Pedro creek meeting with a turbid Gilmore creek. It may also be possible that there are more frequent anthropogenic activities upstream of GS-1 and GS-2 is less impacted by such activities downstream of GS-1. Another possibility of this observed difference could be due to a combination of stream bed slope, terrain relief and altitude differences between GS-1 and
Surface Water Monitoring of Goldstream Creek for the Development of TMDLs Alaska Department of Environmental Conservation _____________________________________________________________________________________
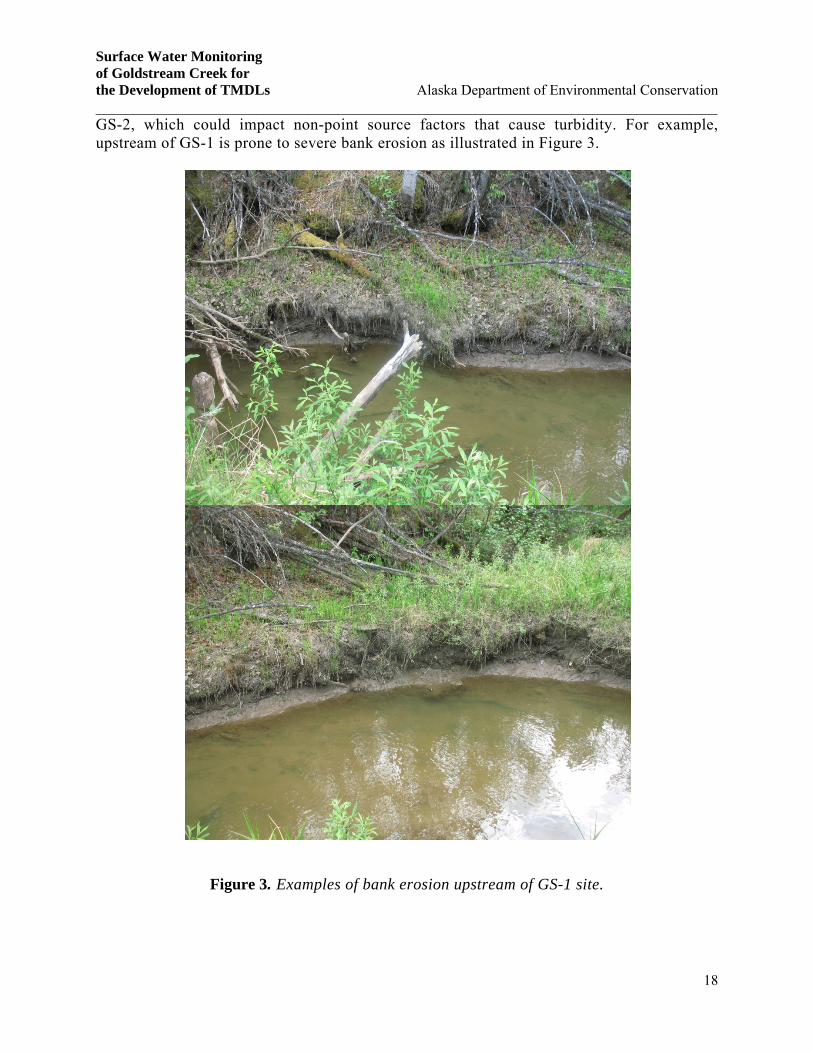
18
GS-2, which could impact non-point source factors that cause turbidity. For example, upstream of GS-1 is prone to severe bank erosion as illustrated in Figure 3.
Figure 3. Examples of bank erosion upstream of GS-1 site.
Surface Water Monitoring of Goldstream Creek for the Development of TMDLs Alaska Department of Environmental Conservation _____________________________________________________________________________________
19
Both the mean daily and the hourly water temperature (Table 6) have a considerably low variability and are hardly skewed. Comparing the mean daily and hourly water temperature values to the AK WQS standards, it is evident that the stream temperature complies with all the three standards on daily and hourly basis. The pH has low variability and skewness while the DO has moderate variability and a small skewness. Both the mean pH and DO comply with all the three AK WQS standards. The monthly statistics of turbidity, water temperature, pH and DO are presented in Tables 7, 8 and 9.
Table 7. Monthly turbidity based on daily data.
Site Month/Year Mean Median CV (%)
Number of Samples
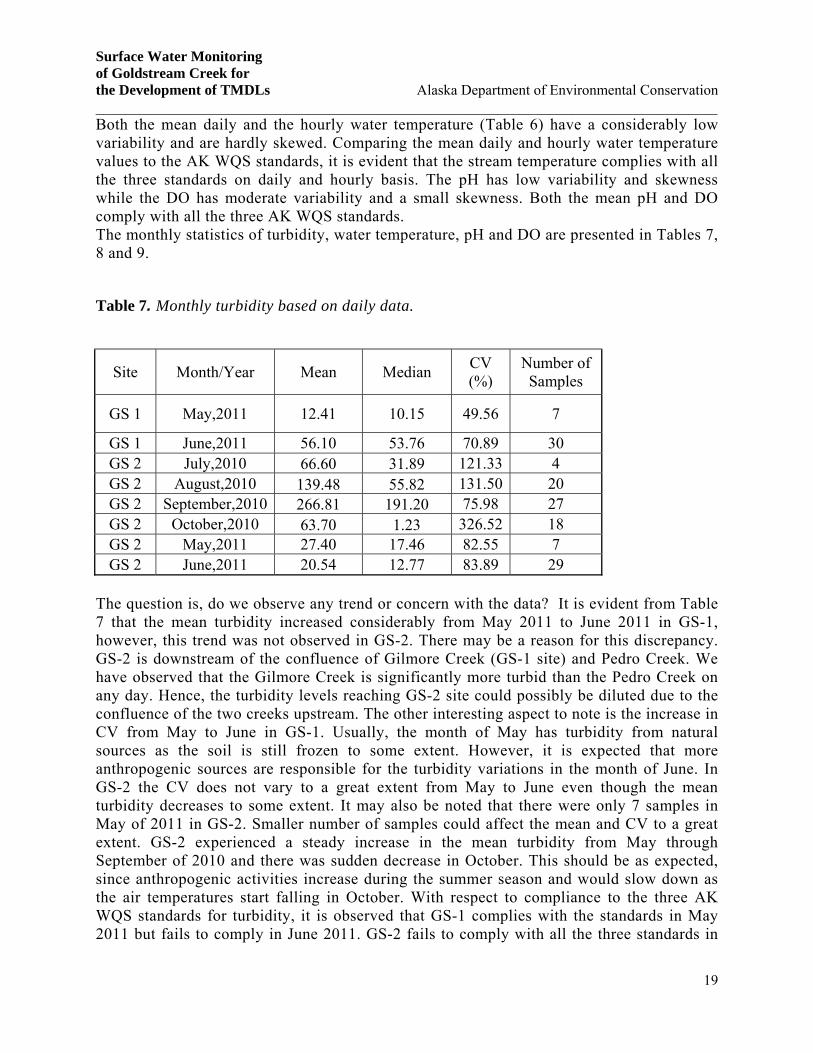
GS 1 May,2011 12.41 10.15 49.56 7
GS 1 June,2011 56.10 53.76 70.89 30 GS 2 July,2010 66.60 31.89 121.33 4 GS 2 August,2010 139.48 55.82 131.50 20 GS 2 September,2010 266.81 191.20 75.98 27 GS 2 October,2010 63.70 1.23 326.52 18 GS 2 May,2011 27.40 17.46 82.55 7 GS 2 June,2011 20.54 12.77 83.89 29
The question is, do we observe any trend or concern with the data? It is evident from Table 7 that the mean turbidity increased considerably from May 2011 to June 2011 in GS-1, however, this trend was not observed in GS-2. There may be a reason for this discrepancy. GS-2 is downstream of the confluence of Gilmore Creek (GS-1 site) and Pedro Creek. We have observed that the Gilmore Creek is significantly more turbid than the Pedro Creek on any day. Hence, the turbidity levels reaching GS-2 site could possibly be diluted due to the confluence of the two creeks upstream. The other interesting aspect to note is the increase in CV from May to June in GS-1. Usually, the month of May has turbidity from natural sources as the soil is still frozen to some extent. However, it is expected that more anthropogenic sources are responsible for the turbidity variations in the month of June. In GS-2 the CV does not vary to a great extent from May to June even though the mean turbidity decreases to some extent. It may also be noted that there were only 7 samples in May of 2011 in GS-2. Smaller number of samples could affect the mean and CV to a great extent. GS-2 experienced a steady increase in the mean turbidity from May through September of 2010 and there was sudden decrease in October. This should be as expected, since anthropogenic activities increase during the summer season and would slow down as the air temperatures start falling in October. With respect to compliance to the three AK WQS standards for turbidity, it is observed that GS-1 complies with the standards in May 2011 but fails to comply in June 2011. GS-2 fails to comply with all the three standards in
Surface Water Monitoring of Goldstream Creek for the Development of TMDLs Alaska Department of Environmental Conservation _____________________________________________________________________________________
20
2010 and May of 2011. However, it complies with the three standards in June of 2011. The 2011 data is surprisingly different in compliance between GS-1 and GS-2. The data needs to be reviewed more closely for possible correlation with discharge in the stream that could cause such anomaly.
Table 8. Monthly water temperature based on daily data.
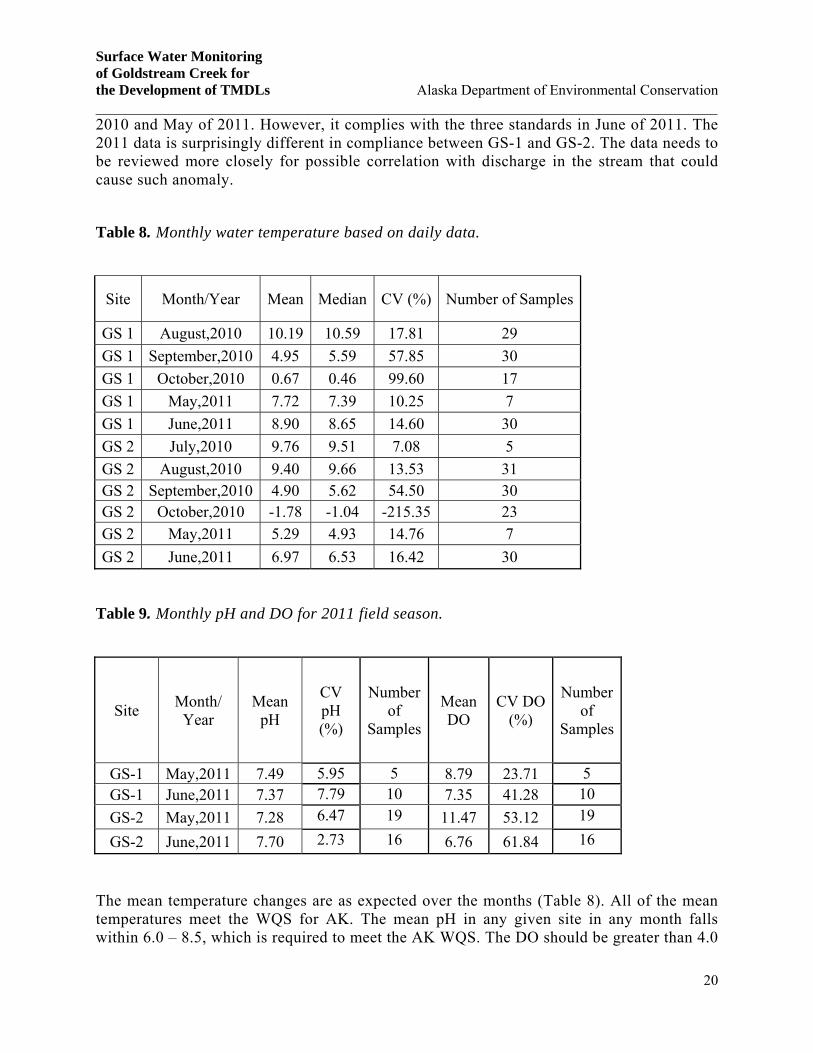
Site Month/Year Mean Median CV (%) Number of Samples
GS 1 August,2010 10.19 10.59 17.81 29
GS 1 September,2010 4.95 5.59 57.85 30
GS 1 October,2010 0.67 0.46 99.60 17
GS 1 May,2011 7.72 7.39 10.25 7
GS 1 June,2011 8.90 8.65 14.60 30
GS 2 July,2010 9.76 9.51 7.08 5
GS 2 August,2010 9.40 9.66 13.53 31 GS 2 September,2010 4.90 5.62 54.50 30 GS 2 October,2010 -1.78 -1.04 -215.35 23
GS 2 May,2011 5.29 4.93 14.76 7
GS 2 June,2011 6.97 6.53 16.42 30
Table 9. Monthly pH and DO for 2011 field season.
Site Month/
Year Mean
pH
CV pH (%)
Number of
Samples
Mean DO
CV DO (%)
Number of
Samples
GS-1 May,2011 7.49 5.95 5 8.79 23.71 5 GS-1 June,2011 7.37 7.79 10 7.35 41.28 10
GS-2 May,2011 7.28 6.47 19 11.47 53.12 19
GS-2 June,2011 7.70 2.73 16 6.76 61.84 16
The mean temperature changes are as expected over the months (Table 8). All of the mean temperatures meet the WQS for AK. The mean pH in any given site in any month falls within 6.0 – 8.5, which is required to meet the AK WQS. The DO should be greater than 4.0

Surface Water Monitoring of Goldstream Creek for the Development of TMDLs Alaska Department of Environmental Conservation _____________________________________________________________________________________
21
mg/l for Aquatic Life and Water Supply. These are easily met by the mean DO in any month. It may also be observed that the DO levels comply with the recreation AK WQS; except for GS-2 in the month of June 2011 for anadromous fish (7 data points out of the 15 do not meet this criterion). It could also be noted that the CV of the DO is considerably high in GS-2 as compared to GS-1 in a given month. The cause of this needs further investigation. Also, the DO levels fall at any given site in June compared to May. This is expected since the turbidity along with other parameters impact the DO level in the stream.
5. DATA VALIDATION
In the subsequent presentation of data, we will provide validation of turbidity data from automatic sampling against data collected using Hach turbidity meter for GS-2 in 2010 and 2011 and GS-1 only in 2011. Hence, both the sensors were brought to a laboratory in UAF and a bench test was conducted in March 2011. The results (Table 10) showed that both the sensors had no errors as compared to independent turbidity measurements using the Hach turbidity meter. All the other sensors were calibrated in the laboratory for the 2011 field season. Turbidity, pressure transducer, and conductivity sensors were tested in the lab and all three were found to be working properly under lab setting.
Table 10. Results of bench test of the automatic turbidity sensors of GS1 and GS2.
Date Time GS1 GS1 % Diff
GS2 GS2 % Diff
Hach Pass/Fa
il?
3/24/2011 16:01 1.731 ‐8.89% 1.981 4.26% 1.9 pass
3/24/2011 16:15 156 ‐5.45% 168 1.82% 165 pass
3/24/2011 16:22 270 4.65% 263 1.94% 258 pass
3/24/2011 16:24 463 0.43% 482 4.56% 461 pass
3/24/2011 16:26 902 1.58% 893 0.56% 888 pass
3/24/2011 16:32 1178 ‐2.48% 1155 ‐4.39% 1208 pass
Acceptance Criteria: 0.1‐10 NTU +/‐ 10%; 11‐40 NTU +/‐ 8%; 41‐100 NTU +/‐6.5%; >100 NTU +/‐ 5%
; Hach used as baseline
In order to assess the turbidity data collected against the Alaska WQS, the automatic data was validated using Hach turbidity measurements (except for GS-1 in 2010). Values that fell above the precision of the sensor were removed from the validation. The negative data and the data out of the precision of the measuring device (sensor) were removed. Table 11 provides a summary of the data removed from the total number of samples collected.

Surface Water Monitoring of Goldstream Creek for the Development of TMDLs Alaska Department of Environmental Conservation _____________________________________________________________________________________
22
Table 11. Project Completeness
GS1 Turbidity DO pH
Hourly Data Daily Data Year 2010 2011 2010 2011 2011 2011# of Total Samples 1825 1461 72 37 15 15
# of Data Used 0 891 0 37 15 15
# of Data Removed 1825 570 72 0 0 0
Project Completeness (%) 0 61 0 100 100 100 GS2 Turbidity
DO PH Hourly Data Daily Data Year 2010 2011 2010 2011 2011 2011# of Total Samples 2133 1456 89 33 35 35
# of Data Used 1565 859 69 33 35 35 # of Data Removed 568 597 19 0 0 0 Project Completeness (%) 74 59 78 100 100 100
The validation plot for GS-2 in 2010 is provided in Figure 4. Even though, the R2 value is 0.9055, yet the actual data differences between the datalogger and the Hach were not close to each other. It is unsure whether the quality of data was compromised due to the GS-2 automatic sensor or the Hach turbidity meter. We will discuss in the results and discussion section as to how the GS-2 data responded appropriately to precipitation events as was also observed in 2011 field season.

Surface Water Monitoring of Goldstream Creek for the Development of TMDLs Alaska Department of Environmental Conservation _____________________________________________________________________________________
23
Figure 4. Validation of turbidity data at GS-2 in 2010.
Figures 5 and 6 shows the validation plots for GS-1 and GS-2 in 2011 field season for turbidity. The R2 value for the regression fit was 0.6465 for GS-1 and 0.9853 for GS-2. A visual observation of the data revealed that most of the measurements fell within acceptable limits in both GS-1 and GS-2 in 2011 season. Hence, the quality of data can be considered to be much better than the 2010 data from GS-2 (Figure 4).
R² = 0.9055
0
100
200
300
400
500
600
700
800
900
1000
0 50 100 150 200 250
Dat
alog
ger
Tu
rbid
ity
(NT
U)
Hach Turbidity (NTU)
GS-2 (2010)
Linear (GS-2 (2010))

Surface Water Monitoring of Goldstream Creek for the Development of TMDLs Alaska Department of Environmental Conservation _____________________________________________________________________________________
24
Figure 5. Comparison of Hach turbidity data with daily turbidity data recorded by the datalogger at GS-1 in 2011.
Figure 6. Validation of turbidity data at GS-2 in 2011.
R² = 0.6465
0
20
40
60
80
100
120
140
160
180
0 100 200 300
Dat
alog
ger
Tu
rbid
ity
(NT
U)
Hach Turbidity (NTU)
GS-1 (2011)
Linear (GS-1 (2011))
R² = 0.9853
0
20
40
60
80
100
120
140
160
180
0 100 200 300
Dat
alog
ger
Tu
rbid
ity
(NT
U)
Hach Turbidity (NTU)
GS-2 (2011)
Linear (GS-2 (2011))
Surface Water Monitoring of Goldstream Creek for the Development of TMDLs Alaska Department of Environmental Conservation _____________________________________________________________________________________
25
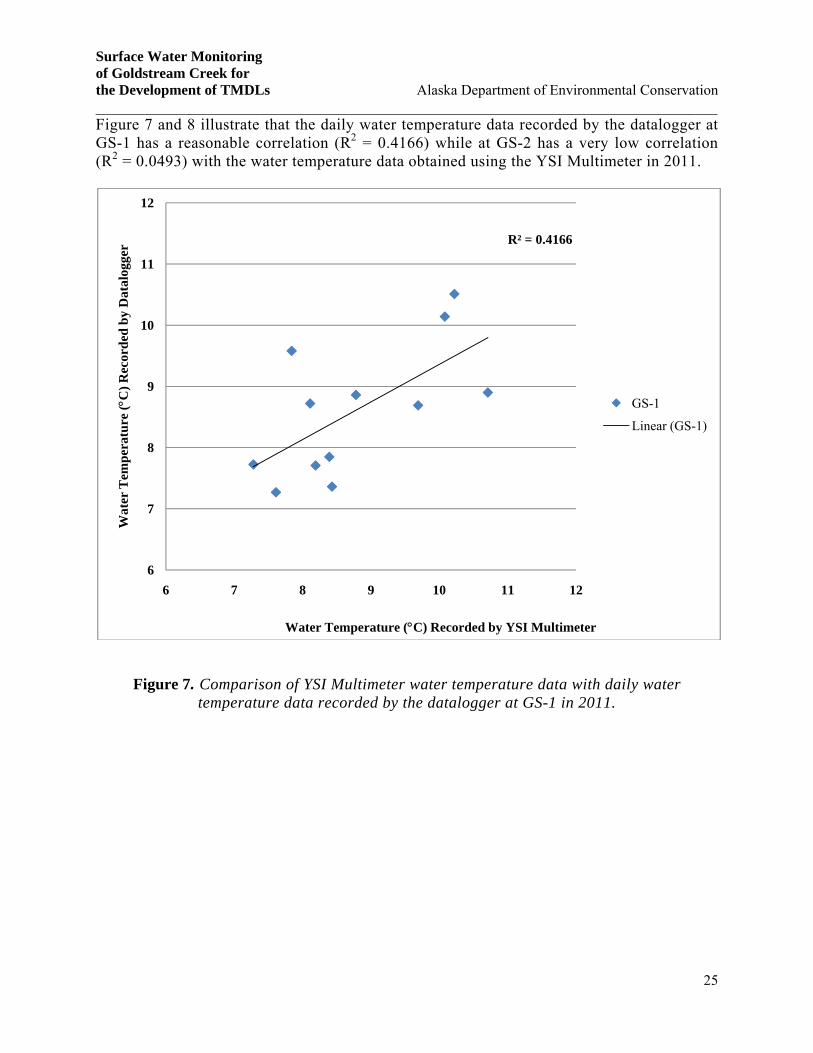
Figure 7 and 8 illustrate that the daily water temperature data recorded by the datalogger at GS-1 has a reasonable correlation (R2 = 0.4166) while at GS-2 has a very low correlation (R2 = 0.0493) with the water temperature data obtained using the YSI Multimeter in 2011.
Figure 7. Comparison of YSI Multimeter water temperature data with daily water temperature data recorded by the datalogger at GS-1 in 2011.
R² = 0.4166
6
7
8
9
10
11
12
6 7 8 9 10 11 12
Wat
er T
emp
erat
ure
(C
) R
ecor
ded
by
Dat
alog
ger
Water Temperature (C) Recorded by YSI Multimeter
GS-1
Linear (GS-1)

Surface Water Monitoring of Goldstream Creek for the Development of TMDLs Alaska Department of Environmental Conservation _____________________________________________________________________________________
26
Figure 8. Comparison of YSI Multimeter water temperature data with daily water temperature data recorded by the datalogger at GS-2 in 2011.
6. RESULTS AND DISCUSSION
Applying the AK WQS to the hourly and daily water temperature at both the sites, it was found that the temperatures were within the prescribed standards for aquatic life, recreation and water supply. Since, we were unable to collect DO and pH data in 2010, the AK WQS was applied to the data collected only in 2011. It was found that the stream met the DO standards at GS1 for 94% of the times for aquatic life and water supply and met 56% of the time for anadromous fish and 87.5% of the time for non-anadromous fish populations. The stream met the pH standards at GS1 for 94% of the times. At GS2, the stream met the pH standards for all three Alaska WQS standards, 92% of the time. However, the DO standards were only met for 86% of the time for aquatic life and water supply and met 42% of the time for anadromous fish and 53% of the time for non-anadromous fish populations. So, it
R² = 0.0493
4
5
6
7
8
9
10
4 5 6 7 8 9 10
Wat
er T
emp
erat
ure
(C
) R
ecor
ded
by
Dat
alog
ger
Water Temperature (C) Recorded by YSI Multimeter
GS-2
Linear (GS-2)

Surface Water Monitoring of Goldstream Creek for the Development of TMDLs Alaska Department of Environmental Conservation _____________________________________________________________________________________
27
may be observed that the stream does not meet the recreation WQS standards for approximately 50% of the time. The reason for such failure needs further interpretation. The turbidity of the stream exceeds an estimated WQS for turbidity using BNT most of the time at both the sites. We have observed that the turbidity responds to precipitation events as illustrated in Figures 9 and 10.
Figure 9. Daily turbidity of the Goldstream Creek in 2010 field season and its response to precipitation events.
0
100
200
300
400
500
600
700
800
900
1000
0
0.1
0.2
0.3
0.4
0.5
0.6
0.7
0.8
0.9
Daily T
urb
idity (N
TU
)D
aily
Pre
cip
itat
ion
(in
)
Precipitation (in) GS1 Turbidity (NTU)
GS2 Turbidity (NTU) Background Turbidity

Surface Water Monitoring of Goldstream Creek for the Development of TMDLs Alaska Department of Environmental Conservation _____________________________________________________________________________________
28
Figure 10. Daily turbidity of the Goldstream Creek in 2011 field season and its response to precipitation events
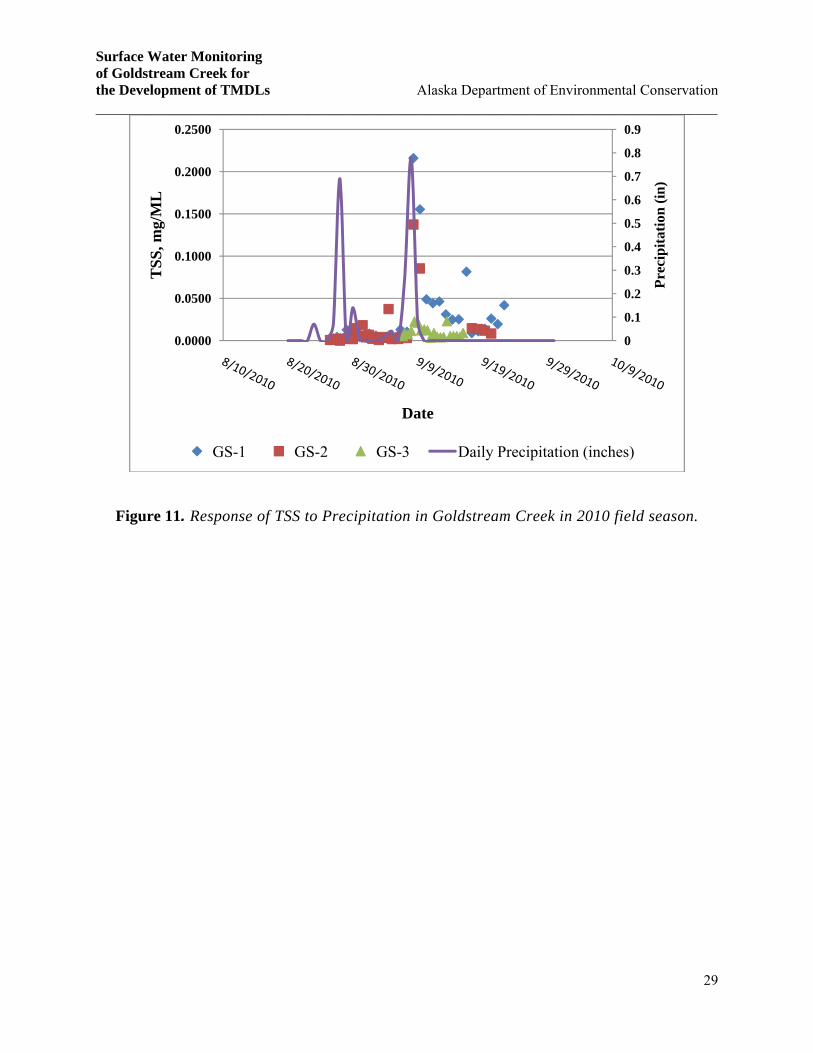
From Figures 9 and 10, it is clearly observed that GS1 turbidity responds more drastically to precipitation events than the GS2 turbidity. However, it is also clear that the turbidity standards are exceeded, more so in GS1, during these storm events. A similar trend has been observed with the TSS data as presented in Figures 11 and 12.
0
0.05
0.1
0.15
0.2
0.25
0.3
0.35
0
20
40
60
80
100
120
140
160
180D
aily Precip
itation (in
)Dai
ly T
urb
idit
y (N
TU
)
GS1 Turbidity (NTU) GS2 Turbidity (NTU)
Background Turbidity Precipitation (in)
Surface Water Monitoring of Goldstream Creek for the Development of TMDLs Alaska Department of Environmental Conservation _____________________________________________________________________________________
29
Figure 11. Response of TSS to Precipitation in Goldstream Creek in 2010 field season.
0
0.1
0.2
0.3
0.4
0.5
0.6
0.7
0.8
0.9
0.0000
0.0500
0.1000
0.1500
0.2000
0.2500
Pre
cip
itat
ion
(in
)
TS
S, m
g/M
L
Date
GS-1 GS-2 GS-3 Daily Precipitation (inches)
Surface Water Monitoring of Goldstream Creek for the Development of TMDLs Alaska Department of Environmental Conservation _____________________________________________________________________________________
30
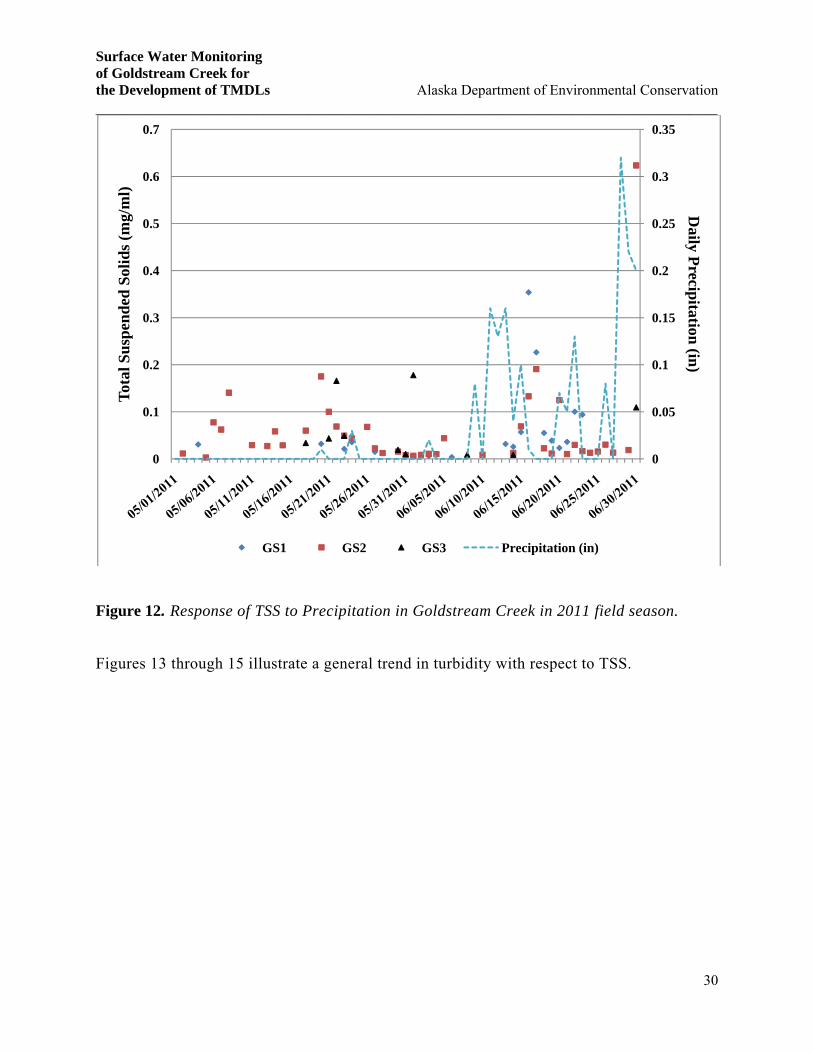
Figure 12. Response of TSS to Precipitation in Goldstream Creek in 2011 field season.
Figures 13 through 15 illustrate a general trend in turbidity with respect to TSS.
0
0.05
0.1
0.15
0.2
0.25
0.3
0.35
0
0.1
0.2
0.3
0.4
0.5
0.6
0.7D
aily Precip
itation (in
)T
otal
Su
spen
ded
Sol
ids
(mg/
ml)
GS1 GS2 GS3 Precipitation (in)

Surface Water Monitoring of Goldstream Creek for the Development of TMDLs Alaska Department of Environmental Conservation _____________________________________________________________________________________
31
Figure 13. Turbidity vs. TSS at GS-1 in 2011.
R² = 0.0154
0
0.05
0.1
0.15
0.2
0.25
0.3
0.35
0.4
0 20 40 60 80 100 120 140 160 180
TS
S (
mg/
ML
)
Turbidity (NTU)
GS-1 (2011) Linear (GS-1 (2011))

Surface Water Monitoring of Goldstream Creek for the Development of TMDLs Alaska Department of Environmental Conservation _____________________________________________________________________________________
32
Figure 14. Turbidity vs. TSS at GS-2 in 2010 and 2011.
R² = 0.0598
-0.0500
0.0000
0.0500
0.1000
0.1500
0.2000
0.2500
0 100 200 300 400 500 600 700 800
TS
S (
mg/
ML
)
Turbidity (NTU)
GS-2 (2010 & 2011) Linear (GS-2 (2010 & 2011))
Surface Water Monitoring of Goldstream Creek for the Development of TMDLs Alaska Department of Environmental Conservation _____________________________________________________________________________________
33
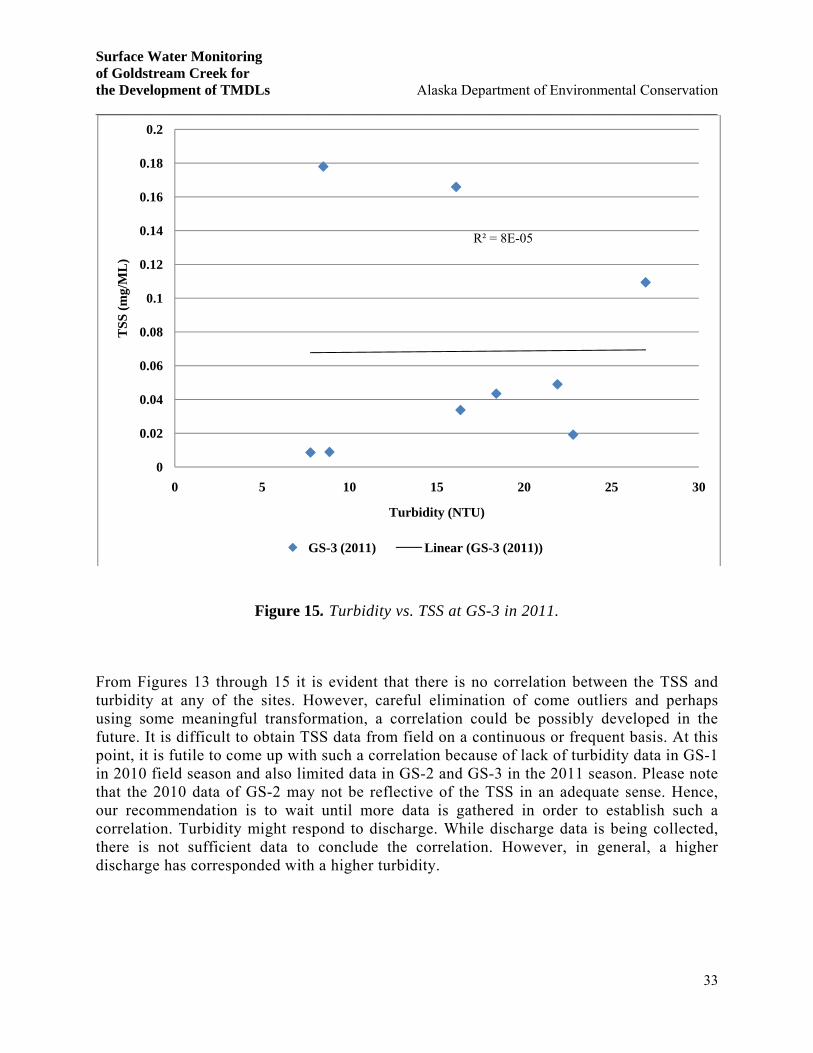
Figure 15. Turbidity vs. TSS at GS-3 in 2011.
From Figures 13 through 15 it is evident that there is no correlation between the TSS and turbidity at any of the sites. However, careful elimination of come outliers and perhaps using some meaningful transformation, a correlation could be possibly developed in the future. It is difficult to obtain TSS data from field on a continuous or frequent basis. At this point, it is futile to come up with such a correlation because of lack of turbidity data in GS-1 in 2010 field season and also limited data in GS-2 and GS-3 in the 2011 season. Please note that the 2010 data of GS-2 may not be reflective of the TSS in an adequate sense. Hence, our recommendation is to wait until more data is gathered in order to establish such a correlation. Turbidity might respond to discharge. While discharge data is being collected, there is not sufficient data to conclude the correlation. However, in general, a higher discharge has corresponded with a higher turbidity.
R² = 8E-05
0
0.02
0.04
0.06
0.08
0.1
0.12
0.14
0.16
0.18
0.2
0 5 10 15 20 25 30
TS
S (
mg/
ML
)
Turbidity (NTU)
GS-3 (2011) Linear (GS-3 (2011))

Surface Water Monitoring of Goldstream Creek for the Development of TMDLs Alaska Department of Environmental Conservation _____________________________________________________________________________________
34
7. CONCLUSIONS
Some of the intermediate conclusions may be the following –
1. Goldstream Creek fails to meet turbidity WQS when compared to an estimated standard from one season approximately 50% of the time. More failure of the standard is observed after storm events.
2. GS1 turbidity responds more drastically to storm events than the GS2 turbidity. 3. Temperature standards are met adequately by the creek. 4. DO and pH standards are met reasonably for aquatic life and water supply but DO
fails approximately 50% of the time for recreation purposes. 5. Turbidity and TSS correlation should be developed in order to assess the actual
loading of sediments in the stream. TSS responds similarly to the turbidity during storm events.
6. GS-1 might have bank erosion contributing to the higher turbidity values at the Gilmore Creek. It may be fair to establish a separate BNT standard for that site, since GS-2 receives diluted turbidity values due to the confluence of a turbid Gilmore Creek and a relatively clean Pedro Creek.
8. REFERENCES ADEC. 2002. Total Maximum Daily Load (TMDL) for Sediment and Turbidity in the Waters of Granite Creek in Sitka, Alaska. Alaska Department of Environmental Conservation Division of Air and Water Quality, Anchorage. AK. 16pp.
ADEC. 2009a. Surface Water Monitoring of Goldstream Creek for the Development of TMDLs. Quality Assurance Project Plan and Sampling and Analysis Plan. Alaska Department of Environmental Conservation, 48pp.
ADEC. 2009b. Surface Water Monitoring of Crooked Creek for the Development of TMDLs. Quality Assurance Project Plan and Sampling and Analysis Plan. Alaska Department of Environmental Conservation, 39pp.
ADNR (Alaska Department of Natural Resources). 1994. Investigation of Stream Sediment Loads Related to Placer Mining in the Goldstream Creek Basin, Alaska. Public Data File 94-44.
CDM. 2008. Draft report on updated assessment of Northern Alaskan waters impaired by past and current mining practices. Prepared for U.S. Environmental Protection Agency, Region 10, Alaska

Surface Water Monitoring of Goldstream Creek for the Development of TMDLs Alaska Department of Environmental Conservation _____________________________________________________________________________________
35
Department of Environmental Conservation. Prepared by The Cadmus Group, Inc. and CDM. CDM Project No. 51027.63907.3117.001.201. ALASKA.
Pewe, TL. 1955. Origin of the upland silt near Fairbanks, Alaska. Bulletin of the Geological Society of America. Vol. 67: 699 – 724.
USGS (United States Geological Survey). 1994. Water Quality Assessment of Goldstream Creek.
USEPA. 1999. Total Maximum Daily Load (TMDL) for Turbidity in the Waters of Duck Creek in Mendenhall Valley, Alaska. U.S. Environmental Protection Agency, Washington, DC. 5pp.
9. APPENDIX: CROOKED CREEK SITE
RECONNAISSANCE
The second task of the ACWA-11-07 project was to complete a site reconnaissance (with photographs, locations, and mapping) that will provide information on site access and condition and identification of alternate sampling locations (if any) to initiate a database of turbidity and other water quality information for the Crooked Creek Watershed. The results of previous ambient water quality data have demonstrated that seven segments of Crooked Creek have been water quality-impaired for turbidity: Bonanza Creek, Crooked Creek, Deadwood Creek, Ketchem Creek, Mammoth Creek, Mastodon Creek, and Porcupine Creek. The sources of turbidity in Crooked Creek have been determined to be both point sources, including active placer mines, and nonpoint sources, including abandoned placer mines, stream bank erosion, and re-suspension of deposited sediment, as well as runoff from both abandoned and active mine sites. Information is needed on actual water quality for Crooked Creek. This work will support the development of a Quality Assurance Project and Sampling Plan. On August 3, 2010 a site visit was made to Crooked Creek watershed with representatives from the Fairbanks office of the Department of Natural Resources. Three different sites along the Crooked Creek were visited. Two of the sites visited were in the active mining areas. The third site was downstream of the mining areas in the city of Circle. There is a bridge in downtown Circle that crosses Crooked Creek and this could potentially work as a site to install any monitoring equipment and sensors due to its ease of access. Also, this location would be in an area frequented by people, which would reduce the chances of tampering with the installed equipment. Our discussion with several local residents who are involved in active mining along the creek revealed that they were open to the idea of installing the equipment on the creek to monitor turbidity. A conversation conducted with some miners about the clarity of the stream revealed that usually the stream runs clear except when there are high precipitation events or runoff from the mountains to the south or the area. Several years back a fire burned most of the mountain side. This was also noted by us during our visit. In order to assess turbidity and sediment yield due to placer mining operations as opposed to storm runoff we considered placing
Surface Water Monitoring of Goldstream Creek for the Development of TMDLs Alaska Department of Environmental Conservation _____________________________________________________________________________________
36
a monitoring station upstream in close proximity to the placer mining operations and a monitoring station below the operations. Our preliminary observations during the visit includes the following –
There is extensive mining activity both active and inactive with large concentration of such activity around inflow of Sawpit Creek (approximate GPS Coordinates of 65°34’19” N, 145°01’45”W.)
From visual analysis of Crooked Creek, turbidity appeared low. It appears that mining
activity in the area that employs settling ponds have no apparent direct run off during the low flow conditions, as observed.
Conversations with local residents indicated that sediment and turbidity levels increase significantly during storm events.
A significant fire in the area in recent years appears to decreased slope stability due to the
removal of vegetative cover potentially contributing to an increase in sediment levels during storm events.
Areas of active mining pose potential of contributing to river sediment loads in storm flow events in the various areas of disturbance.
Due to significant amount of development activity, ongoing collaboration with DNR
needs to be established in selecting appropriate location to establish base conditions of monitoring.
Upstream sampling locations will require additional information to establish primary source of turbidity and sediment leaching.
Potential sampling locations include but not limited to
o Upstream locations depend largely on what creeks are determined to be the
primary sources of turbidity and may include: Porcupine Creek upstream of confluence with Bonanza Creek. Confluence of Mammoth and Porcupine Creek.
o Potential downstream locations Downstream of last major area of active development below confluence of
Crooked and Sawpit Creek. Bridge Crossing in Circle (DNR has a field office located on river that
could work as a sampling location).
Due to logistical and resource constraints, the number of sites able to be accessed may be less than originally thought. Thus the number of sites and their locations must be re-evaluated and finalized. In Table A-1 we provide the recommended locations for the

Surface Water Monitoring of Goldstream Creek for the Development of TMDLs Alaska Department of Environmental Conservation _____________________________________________________________________________________
37
sampling sites. Most sampling locations are along the road so access should not be an issue. Land access to the background reference location at Bedrock Creek (CCW-5) is the only issue.

Surface Water Monitoring of Goldstream Creek for the Development of TMDLs Alaska Department of Environmental Conservation _____________________________________________________________________________________
38
Table A 1. Recommended sampling locations in Crooked Creek Watershed for monitoring turbidity.
Sample ID Sample Location Sampling Method
Approximate Rationale
Latitude Longitude
CCW-5 Bedrock Creek Data Logger 65.558527 -145.087713 Reference for the naturally occurring suspended
sediment concentrations of the region
CCW-8 Crooked Creek at Central
Data Logger 65.573262 -144.801883 Below area of one area of significant activity
CCW-14 Crooked Creek Below Quartz Creek
Data Logger 65.623045 -144.445622 Below all areas of significant activity
CCW-1 Porcupine Creek Grab Sample 65.552944 -145.199075 Reference for sediment contribution from the
Porcupine Creek mining operations
CCW-3 Mammoth Creek Grab Sample 65.549221 -145.181751 Reference for the sediment contribution from the
Mammoth Creek mining operations
CCW-4 Crooked Creek Above Bedrock Creek
Grab Sample 65.558527 -145.120535 Reference for sediment contribution from the Crooked Creek mining operations
CCW-7 Boulder Creek Grab Sample 65.561201 -144.890545 Reference for the sediment contribution from the
Boulder Creek mining operations
CCW-12 Albert Creek Grab Sample 65.5922 -144.7022 Reference for the sediment contributions from the
abandoned mines on Albert Creek
39
A GIS map has been prepared (Figure A-1) showing an aerial photo of the proposed sample location, with QAPP designated (ADEC, 2009b) sample sites indicated on the map. Crooked Creek site reconnaissance that will provide information on site access and condition and identification of alternate sampling locations was conducted remotely. Sampling locations along the Crooked Creek Watershed were examined by means of GIS and LANDSAT images. The GIS contains layer files including: Aerial Photo of the Site Land Ownership Map by Parcel (BLM) Proposed Sampling Locations Major Roads in the Area

Surface Water Monitoring of Goldstream Creek for the Development of TMDLs Alaska Department of Environmental Conservation _____________________________________________________________________________________
40
Figure A 1. GIS map showing all sample sites (from ADEC, 2009b) and road access in area. Sampling sites indicated in green, with permitted prospecting sites indicated in blue. All
proposed sample sites (from Table A-1) are close to known roads, allowing easy access to stream.

Surface Water Monitoring of Goldstream Creek for the Development of TMDLs Alaska Department of Environmental Conservation _____________________________________________________________________________________
41
Layer files for the GPS component were collected from the Alaska Geospatial Data Clearinghouse. Names for sampling locations can be found on the GIS map, as also the land ownership designations that could be found in the accompanying topology of the area. Sampling locations were found to be easily accessible by road, with major roads virtually paralleling each sampling location. We chose the 8 sites (Table A-1) because of the ease of access as well as location. We did not visit any historical sites listed in the QAPP (ADEC, 2009b). On the visit to Crooked Creek in 2010, DNR escorted us to possible locations. These sites were chosen by both ground and remote reconnaissance. DNR flew over the area initially and then escorted us out to the sites that they thought would be easily accessible. The bridge location (Figure A-2) was a site that we believe would be best for a monitoring site as it would be downstream from mining activity. BLM is the primary landowner/manager in the area. In order to establish future sampling points, partnership with BLM is crucial.
Figure A 2. Potential sampling location (near CCW-8) on Crooked Creek in the vicinity of the bridge in Circle, Alaska